Millville borough, PA Map & Demographics
Millville borough Overview
$27,933
PER CAPITA INCOME
$83,359
AVG FAMILY INCOME
$45,764
AVG HOUSEHOLD INCOME
22.1%
WAGE / INCOME GAP [ % ]
77.9¢/ $1
WAGE / INCOME GAP [ $ ]
0.47
INEQUALITY / GINI INDEX
1,000
TOTAL POPULATION
474
MALE POPULATION
526
FEMALE POPULATION
90.11
MALES / 100 FEMALES
110.97
FEMALES / 100 MALES
42.3
MEDIAN AGE
3.2
AVG FAMILY SIZE
2.4
AVG HOUSEHOLD SIZE
497
LABOR FORCE [ PEOPLE ]
56.3%
PERCENT IN LABOR FORCE
3.4%
UNEMPLOYMENT RATE
Income in Millville borough
Income Overview in Millville borough
Per Capita Income in Millville borough is $27,933, while median incomes of families and households are $83,359 and $45,764 respectively.
| Characteristic | Number | Measure |
| Per Capita Income | 1,000 | $27,933 |
| Median Family Income | 201 | $83,359 |
| Mean Family Income | 201 | $96,198 |
| Median Household Income | 372 | $45,764 |
| Mean Household Income | 372 | $68,801 |
| Income Deficit | 201 | $0 |
| Wage / Income Gap (%) | 1,000 | 22.14% |
| Wage / Income Gap ($) | 1,000 | 77.86¢ per $1 |
| Gini / Inequality Index | 1,000 | 0.47 |
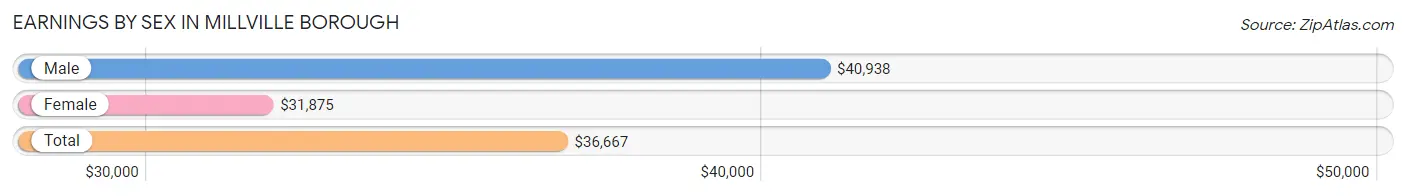
Earnings by Sex in Millville borough
Average Earnings in Millville borough are $36,667, $40,938 for men and $31,875 for women, a difference of 22.1%.
| Sex | Number | Average Earnings |
| Male | 237 (48.6%) | $40,938 |
| Female | 251 (51.4%) | $31,875 |
| Total | 488 (100.0%) | $36,667 |
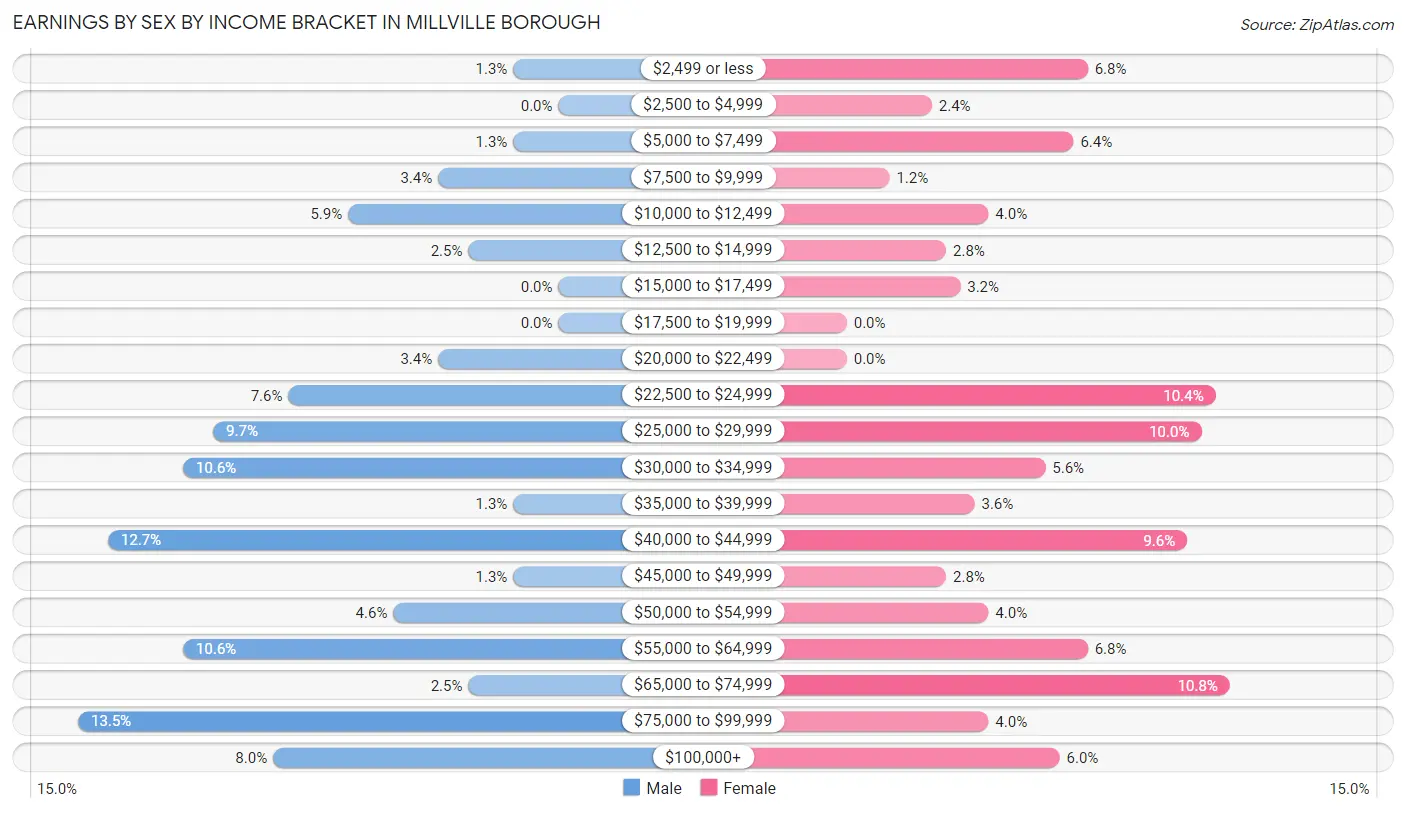
Earnings by Sex by Income Bracket in Millville borough
The most common earnings brackets in Millville borough are $75,000 to $99,999 for men (32 | 13.5%) and $65,000 to $74,999 for women (27 | 10.8%).
| Income | Male | Female |
| $2,499 or less | 3 (1.3%) | 17 (6.8%) |
| $2,500 to $4,999 | 0 (0.0%) | 6 (2.4%) |
| $5,000 to $7,499 | 3 (1.3%) | 16 (6.4%) |
| $7,500 to $9,999 | 8 (3.4%) | 3 (1.2%) |
| $10,000 to $12,499 | 14 (5.9%) | 10 (4.0%) |
| $12,500 to $14,999 | 6 (2.5%) | 7 (2.8%) |
| $15,000 to $17,499 | 0 (0.0%) | 8 (3.2%) |
| $17,500 to $19,999 | 0 (0.0%) | 0 (0.0%) |
| $20,000 to $22,499 | 8 (3.4%) | 0 (0.0%) |
| $22,500 to $24,999 | 18 (7.6%) | 26 (10.4%) |
| $25,000 to $29,999 | 23 (9.7%) | 25 (10.0%) |
| $30,000 to $34,999 | 25 (10.5%) | 14 (5.6%) |
| $35,000 to $39,999 | 3 (1.3%) | 9 (3.6%) |
| $40,000 to $44,999 | 30 (12.7%) | 24 (9.6%) |
| $45,000 to $49,999 | 3 (1.3%) | 7 (2.8%) |
| $50,000 to $54,999 | 11 (4.6%) | 10 (4.0%) |
| $55,000 to $64,999 | 25 (10.5%) | 17 (6.8%) |
| $65,000 to $74,999 | 6 (2.5%) | 27 (10.8%) |
| $75,000 to $99,999 | 32 (13.5%) | 10 (4.0%) |
| $100,000+ | 19 (8.0%) | 15 (6.0%) |
| Total | 237 (100.0%) | 251 (100.0%) |
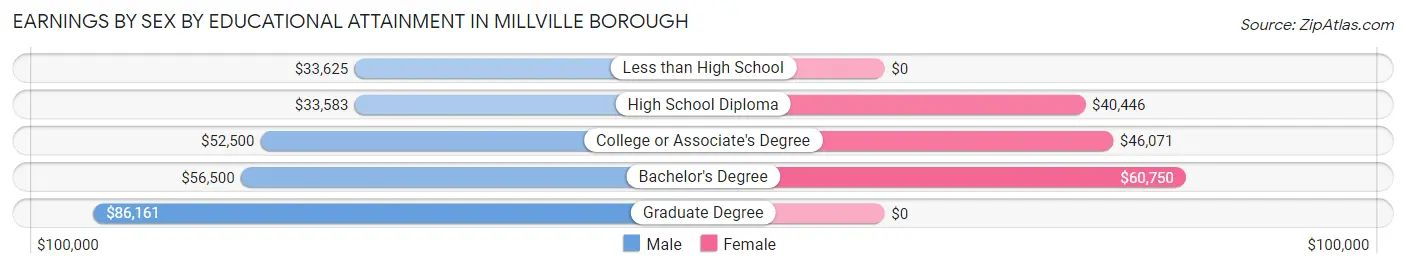
Earnings by Sex by Educational Attainment in Millville borough
Average earnings in Millville borough are $41,813 for men and $41,184 for women, a difference of 1.5%. Men with an educational attainment of graduate degree enjoy the highest average annual earnings of $86,161, while those with high school diploma education earn the least with $33,583. Women with an educational attainment of bachelor's degree earn the most with the average annual earnings of $60,750, while those with high school diploma education have the smallest earnings of $40,446.
| Educational Attainment | Male Income | Female Income |
| Less than High School | $33,625 | $0 |
| High School Diploma | $33,583 | $40,446 |
| College or Associate's Degree | $52,500 | $46,071 |
| Bachelor's Degree | $56,500 | $60,750 |
| Graduate Degree | $86,161 | $0 |
| Total | $41,813 | $41,184 |
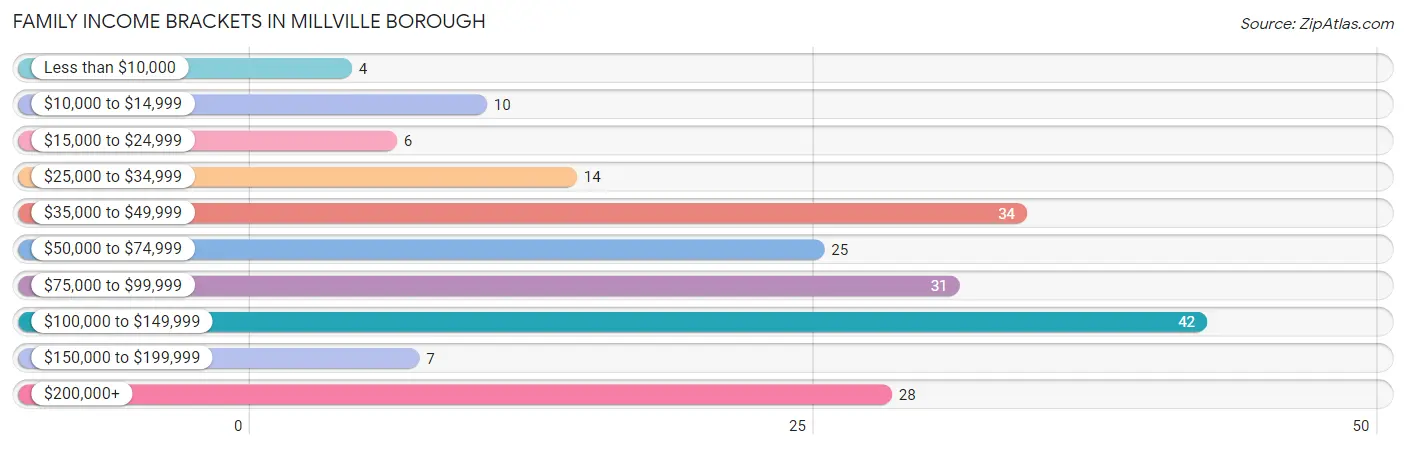
Family Income in Millville borough
Family Income Brackets in Millville borough
According to the Millville borough family income data, there are 42 families falling into the $100,000 to $149,999 income range, which is the most common income bracket and makes up 20.9% of all families. Conversely, the less than $10,000 income bracket is the least frequent group with only 4 families (2.0%) belonging to this category.
| Income Bracket | # Families | % Families |
| Less than $10,000 | 4 | 2.0% |
| $10,000 to $14,999 | 10 | 5.0% |
| $15,000 to $24,999 | 6 | 3.0% |
| $25,000 to $34,999 | 14 | 7.0% |
| $35,000 to $49,999 | 34 | 16.9% |
| $50,000 to $74,999 | 25 | 12.4% |
| $75,000 to $99,999 | 31 | 15.4% |
| $100,000 to $149,999 | 42 | 20.9% |
| $150,000 to $199,999 | 7 | 3.5% |
| $200,000+ | 28 | 13.9% |
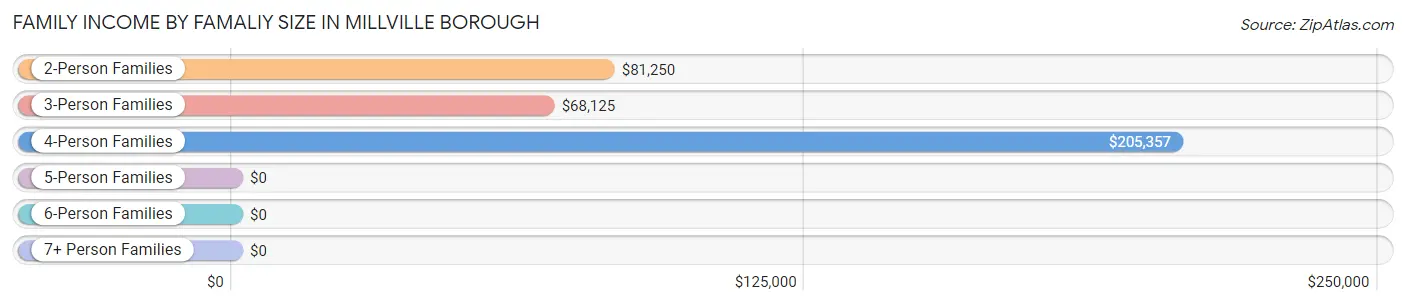
Family Income by Famaliy Size in Millville borough
4-person families (42 | 20.9%) account for the highest median family income in Millville borough with $205,357 per family, while 4-person families (42 | 20.9%) have the highest median income of $51,339 per family member.
| Income Bracket | # Families | Median Income |
| 2-Person Families | 66 (32.8%) | $81,250 |
| 3-Person Families | 78 (38.8%) | $68,125 |
| 4-Person Families | 42 (20.9%) | $205,357 |
| 5-Person Families | 15 (7.5%) | $0 |
| 6-Person Families | 0 (0.0%) | $0 |
| 7+ Person Families | 0 (0.0%) | $0 |
| Total | 201 (100.0%) | $83,359 |
Family Income by Number of Earners in Millville borough
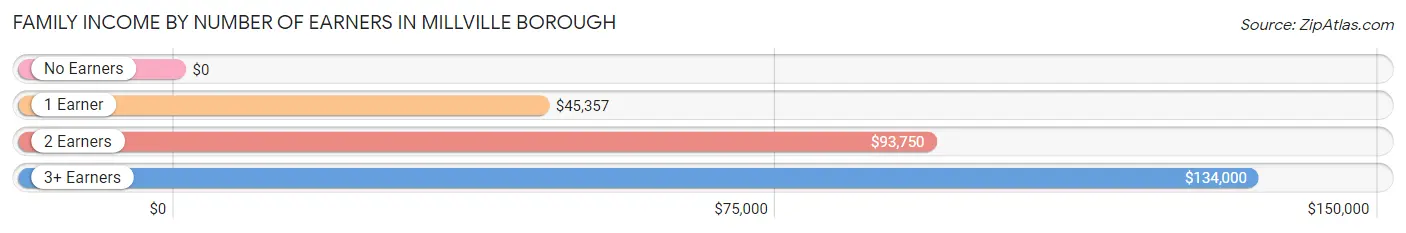
| Number of Earners | # Families | Median Income |
| No Earners | 23 (11.4%) | $0 |
| 1 Earner | 60 (29.8%) | $45,357 |
| 2 Earners | 76 (37.8%) | $93,750 |
| 3+ Earners | 42 (20.9%) | $134,000 |
| Total | 201 (100.0%) | $83,359 |
Household Income in Millville borough
Household Income Brackets in Millville borough
With 71 households falling in the category, the $15,000 to $24,999 income range is the most frequent in Millville borough, accounting for 19.1% of all households. In contrast, only 7 households (1.9%) fall into the $150,000 to $199,999 income bracket, making it the least populous group.
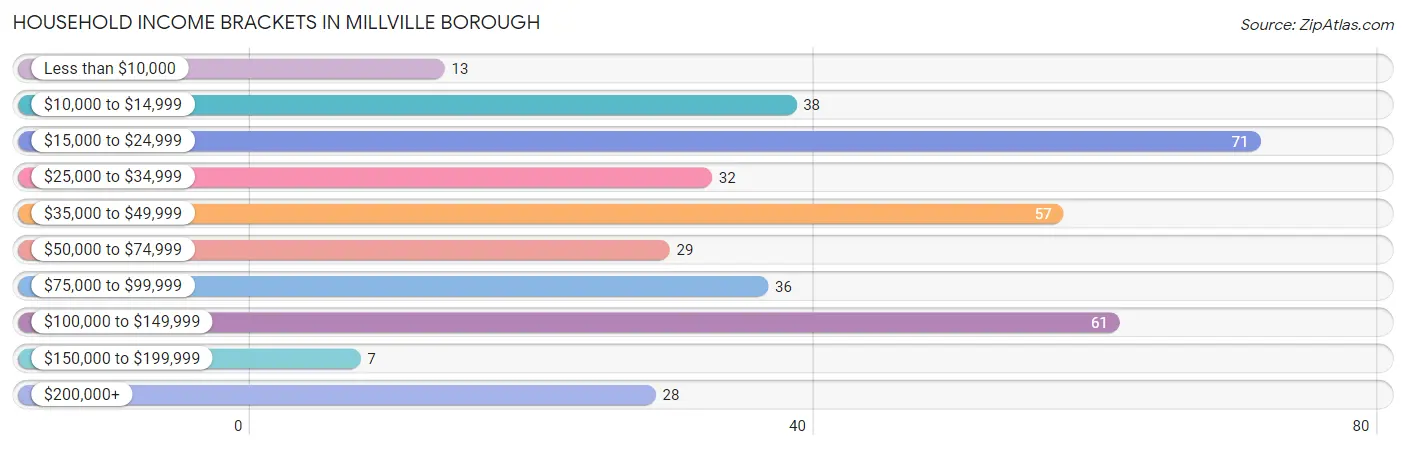
| Income Bracket | # Households | % Households |
| Less than $10,000 | 13 | 3.5% |
| $10,000 to $14,999 | 38 | 10.2% |
| $15,000 to $24,999 | 71 | 19.1% |
| $25,000 to $34,999 | 32 | 8.6% |
| $35,000 to $49,999 | 57 | 15.3% |
| $50,000 to $74,999 | 29 | 7.8% |
| $75,000 to $99,999 | 36 | 9.7% |
| $100,000 to $149,999 | 61 | 16.4% |
| $150,000 to $199,999 | 7 | 1.9% |
| $200,000+ | 28 | 7.5% |
Household Income by Householder Age in Millville borough
The median household income in Millville borough is $45,764, with the highest median household income of $110,313 found in the 45 to 64 years age bracket for the primary householder. A total of 129 households (34.7%) fall into this category. Meanwhile, the 15 to 24 years age bracket for the primary householder has the lowest median household income of $0, with 13 households (3.5%) in this group.
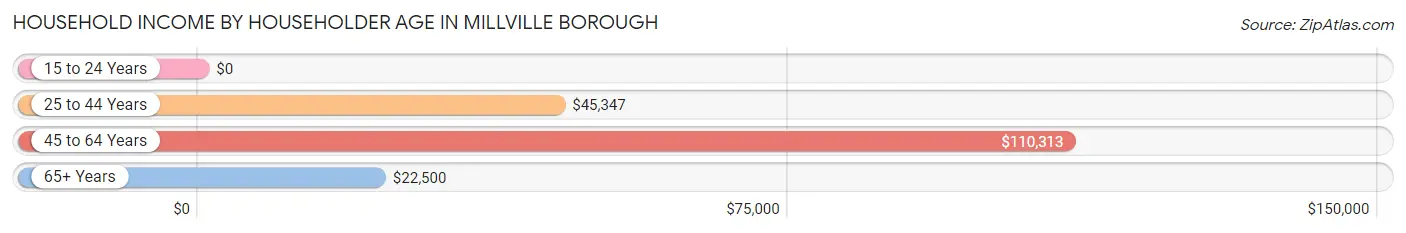
| Income Bracket | # Households | Median Income |
| 15 to 24 Years | 13 (3.5%) | $0 |
| 25 to 44 Years | 138 (37.1%) | $45,347 |
| 45 to 64 Years | 129 (34.7%) | $110,313 |
| 65+ Years | 92 (24.7%) | $22,500 |
| Total | 372 (100.0%) | $45,764 |
Poverty in Millville borough
Income Below Poverty by Sex and Age in Millville borough
With 19.0% poverty level for males and 27.0% for females among the residents of Millville borough, under 5 year old males and 5 year old females are the most vulnerable to poverty, with 15 males (88.2%) and 8 females (100.0%) in their respective age groups living below the poverty level.
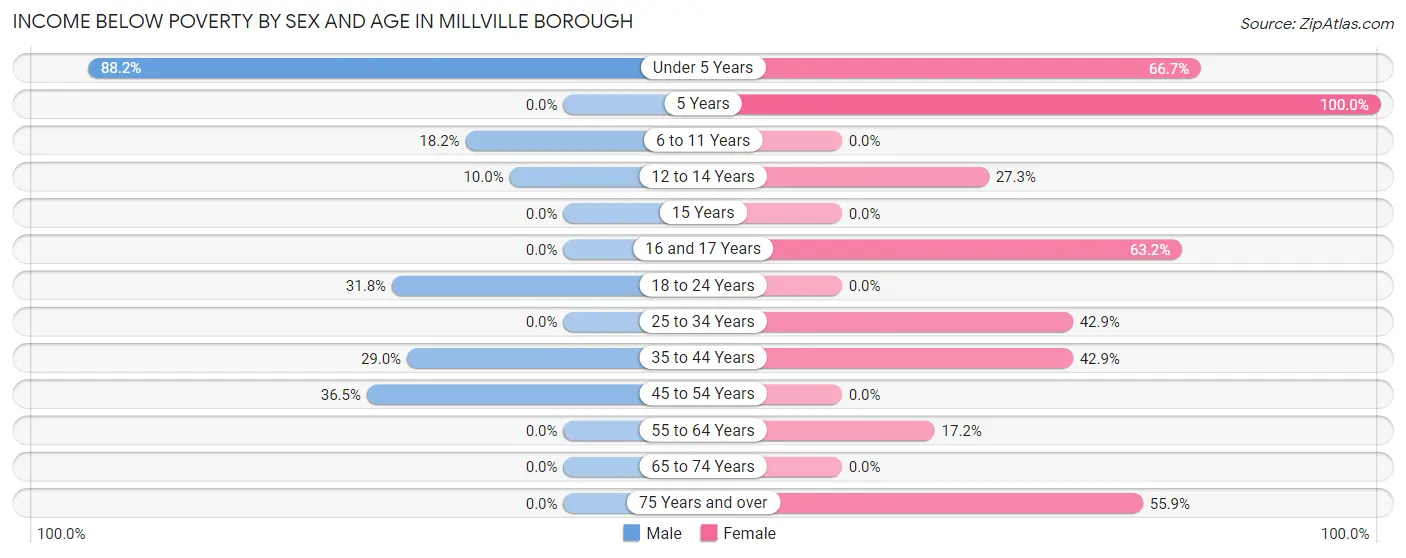
| Age Bracket | Male | Female |
| Under 5 Years | 15 (88.2%) | 4 (66.7%) |
| 5 Years | 0 (0.0%) | 8 (100.0%) |
| 6 to 11 Years | 4 (18.2%) | 0 (0.0%) |
| 12 to 14 Years | 3 (10.0%) | 3 (27.3%) |
| 15 Years | 0 (0.0%) | 0 (0.0%) |
| 16 and 17 Years | 0 (0.0%) | 12 (63.2%) |
| 18 to 24 Years | 14 (31.8%) | 0 (0.0%) |
| 25 to 34 Years | 0 (0.0%) | 27 (42.9%) |
| 35 to 44 Years | 18 (29.0%) | 42 (42.9%) |
| 45 to 54 Years | 27 (36.5%) | 0 (0.0%) |
| 55 to 64 Years | 0 (0.0%) | 10 (17.2%) |
| 65 to 74 Years | 0 (0.0%) | 0 (0.0%) |
| 75 Years and over | 0 (0.0%) | 19 (55.9%) |
| Total | 81 (19.0%) | 125 (27.0%) |
Income Above Poverty by Sex and Age in Millville borough
According to the poverty statistics in Millville borough, males aged 5 years and females aged 6 to 11 years are the age groups that are most secure financially, with 100.0% of males and 100.0% of females in these age groups living above the poverty line.
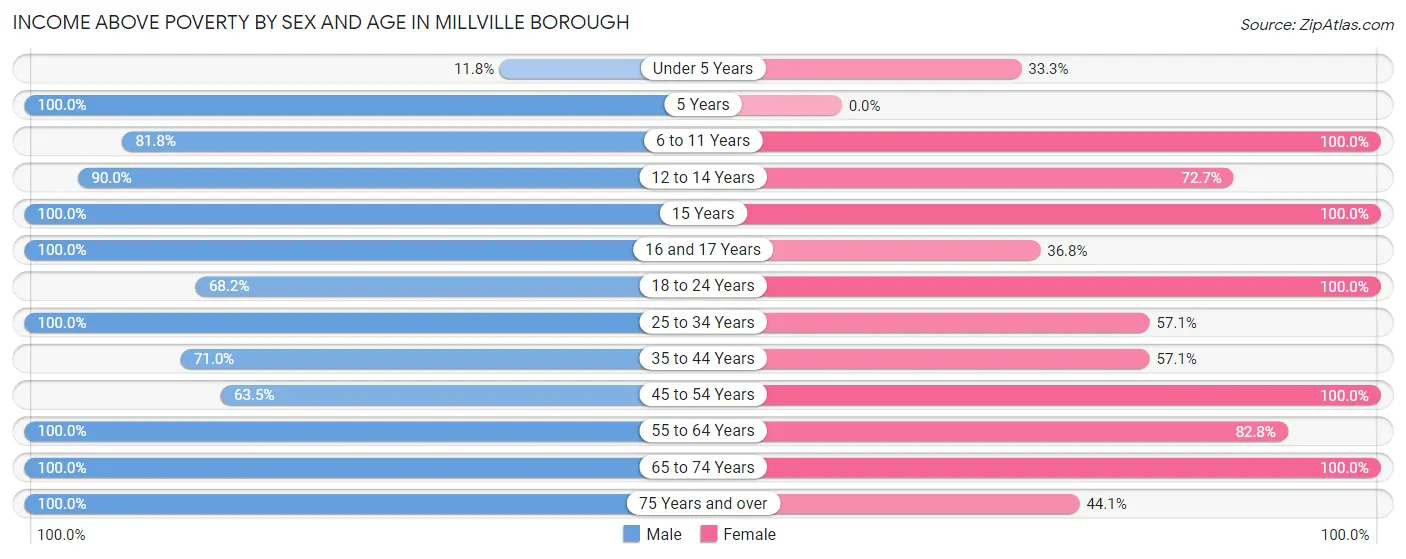
| Age Bracket | Male | Female |
| Under 5 Years | 2 (11.8%) | 2 (33.3%) |
| 5 Years | 10 (100.0%) | 0 (0.0%) |
| 6 to 11 Years | 18 (81.8%) | 3 (100.0%) |
| 12 to 14 Years | 27 (90.0%) | 8 (72.7%) |
| 15 Years | 8 (100.0%) | 3 (100.0%) |
| 16 and 17 Years | 3 (100.0%) | 7 (36.8%) |
| 18 to 24 Years | 30 (68.2%) | 90 (100.0%) |
| 25 to 34 Years | 40 (100.0%) | 36 (57.1%) |
| 35 to 44 Years | 44 (71.0%) | 56 (57.1%) |
| 45 to 54 Years | 47 (63.5%) | 39 (100.0%) |
| 55 to 64 Years | 59 (100.0%) | 48 (82.8%) |
| 65 to 74 Years | 23 (100.0%) | 31 (100.0%) |
| 75 Years and over | 34 (100.0%) | 15 (44.1%) |
| Total | 345 (81.0%) | 338 (73.0%) |
Income Below Poverty Among Married-Couple Families in Millville borough
The poverty statistics for married-couple families in Millville borough show that 10.6% or 17 of the total 160 families live below the poverty line. Families with 3 or 4 children have the highest poverty rate of 83.3%, comprising of 10 families. On the other hand, families with no children have the lowest poverty rate of 0.0%, which includes 0 families.
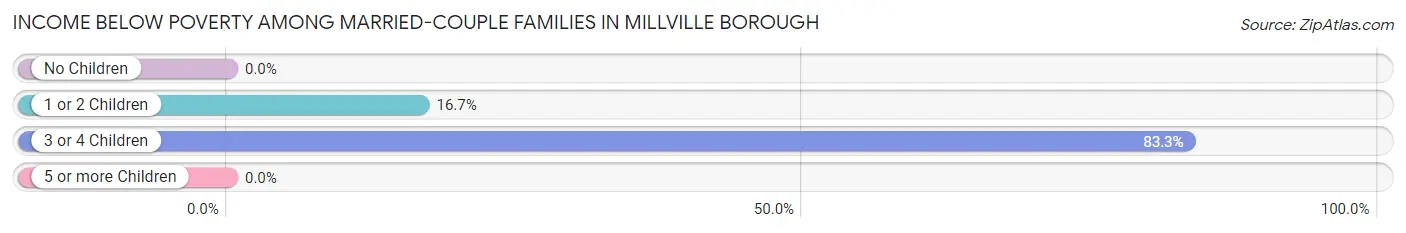
| Children | Above Poverty | Below Poverty |
| No Children | 106 (100.0%) | 0 (0.0%) |
| 1 or 2 Children | 35 (83.3%) | 7 (16.7%) |
| 3 or 4 Children | 2 (16.7%) | 10 (83.3%) |
| 5 or more Children | 0 (0.0%) | 0 (0.0%) |
| Total | 143 (89.4%) | 17 (10.6%) |
Income Below Poverty Among Single-Parent Households in Millville borough
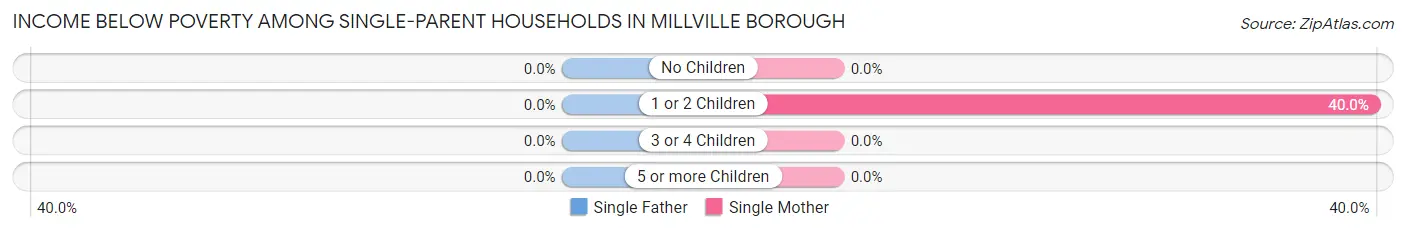
| Children | Single Father | Single Mother |
| No Children | 0 (0.0%) | 0 (0.0%) |
| 1 or 2 Children | 0 (0.0%) | 10 (40.0%) |
| 3 or 4 Children | 0 (0.0%) | 0 (0.0%) |
| 5 or more Children | 0 (0.0%) | 0 (0.0%) |
| Total | 0 (0.0%) | 10 (27.8%) |
Income Below Poverty Among Married-Couple vs Single-Parent Households in Millville borough
The poverty data for Millville borough shows that 17 of the married-couple family households (10.6%) and 10 of the single-parent households (24.4%) are living below the poverty level. Within the married-couple family households, those with 3 or 4 children have the highest poverty rate, with 10 households (83.3%) falling below the poverty line. Among the single-parent households, those with 1 or 2 children have the highest poverty rate, with 10 household (37.0%) living below poverty.
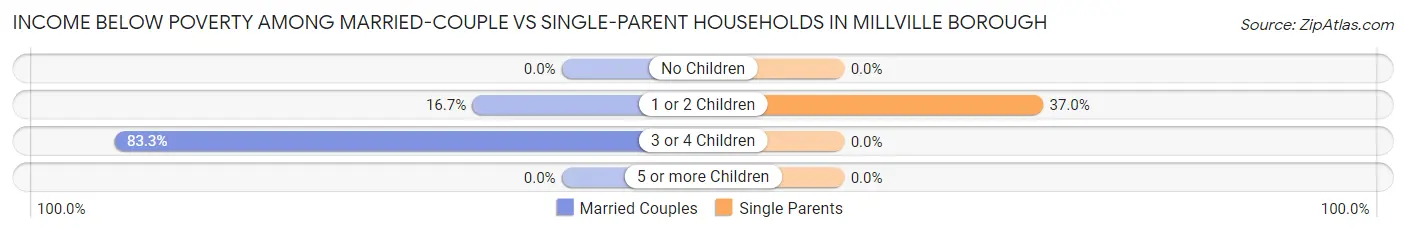
| Children | Married-Couple Families | Single-Parent Households |
| No Children | 0 (0.0%) | 0 (0.0%) |
| 1 or 2 Children | 7 (16.7%) | 10 (37.0%) |
| 3 or 4 Children | 10 (83.3%) | 0 (0.0%) |
| 5 or more Children | 0 (0.0%) | 0 (0.0%) |
| Total | 17 (10.6%) | 10 (24.4%) |
Race in Millville borough
The most populous races in Millville borough are White / Caucasian (898 | 89.8%), Asian (64 | 6.4%), and Black / African American (19 | 1.9%).
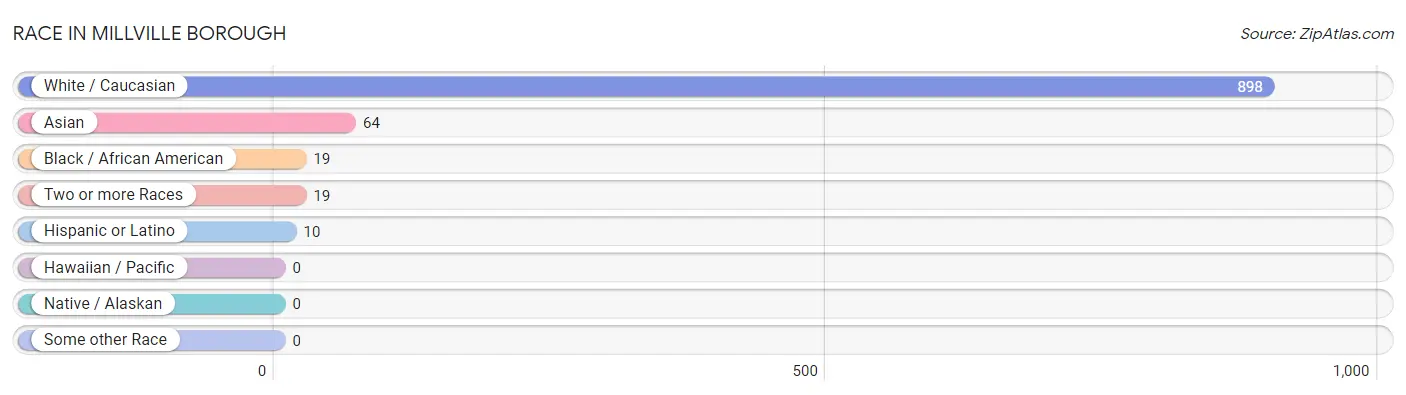
| Race | # Population | % Population |
| Asian | 64 | 6.4% |
| Black / African American | 19 | 1.9% |
| Hawaiian / Pacific | 0 | 0.0% |
| Hispanic or Latino | 10 | 1.0% |
| Native / Alaskan | 0 | 0.0% |
| White / Caucasian | 898 | 89.8% |
| Two or more Races | 19 | 1.9% |
| Some other Race | 0 | 0.0% |
| Total | 1,000 | 100.0% |
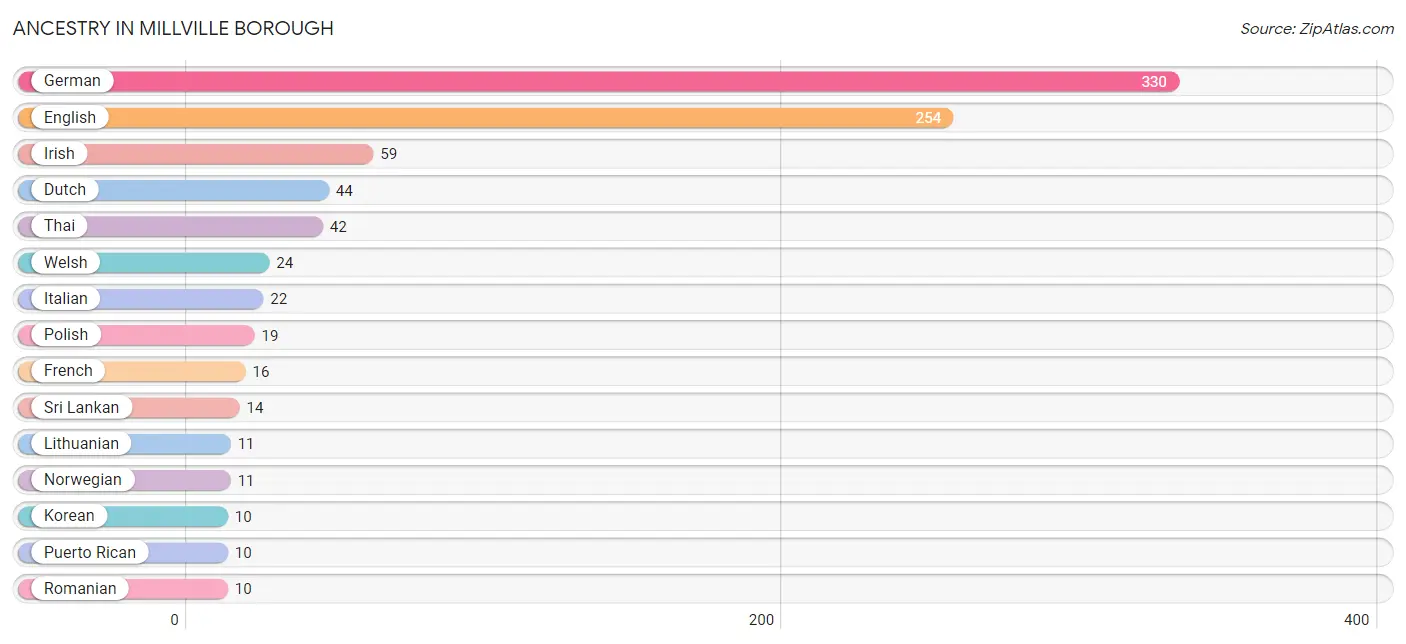
Ancestry in Millville borough
The most populous ancestries reported in Millville borough are German (330 | 33.0%), English (254 | 25.4%), Irish (59 | 5.9%), Dutch (44 | 4.4%), and Thai (42 | 4.2%), together accounting for 72.9% of all Millville borough residents.
| Ancestry | # Population | % Population |
| American | 9 | 0.9% |
| Arab | 3 | 0.3% |
| Austrian | 6 | 0.6% |
| Bhutanese | 3 | 0.3% |
| British | 5 | 0.5% |
| Dutch | 44 | 4.4% |
| Eastern European | 2 | 0.2% |
| English | 254 | 25.4% |
| European | 4 | 0.4% |
| Finnish | 4 | 0.4% |
| French | 16 | 1.6% |
| German | 330 | 33.0% |
| Hungarian | 5 | 0.5% |
| Irish | 59 | 5.9% |
| Italian | 22 | 2.2% |
| Korean | 10 | 1.0% |
| Lebanese | 3 | 0.3% |
| Lithuanian | 11 | 1.1% |
| Norwegian | 11 | 1.1% |
| Pennsylvania German | 7 | 0.7% |
| Polish | 19 | 1.9% |
| Puerto Rican | 10 | 1.0% |
| Romanian | 10 | 1.0% |
| Scottish | 2 | 0.2% |
| Slovak | 2 | 0.2% |
| Sri Lankan | 14 | 1.4% |
| Subsaharan African | 8 | 0.8% |
| Thai | 42 | 4.2% |
| Trinidadian and Tobagonian | 4 | 0.4% |
| Ukrainian | 6 | 0.6% |
| Welsh | 24 | 2.4% | View All 31 Rows |
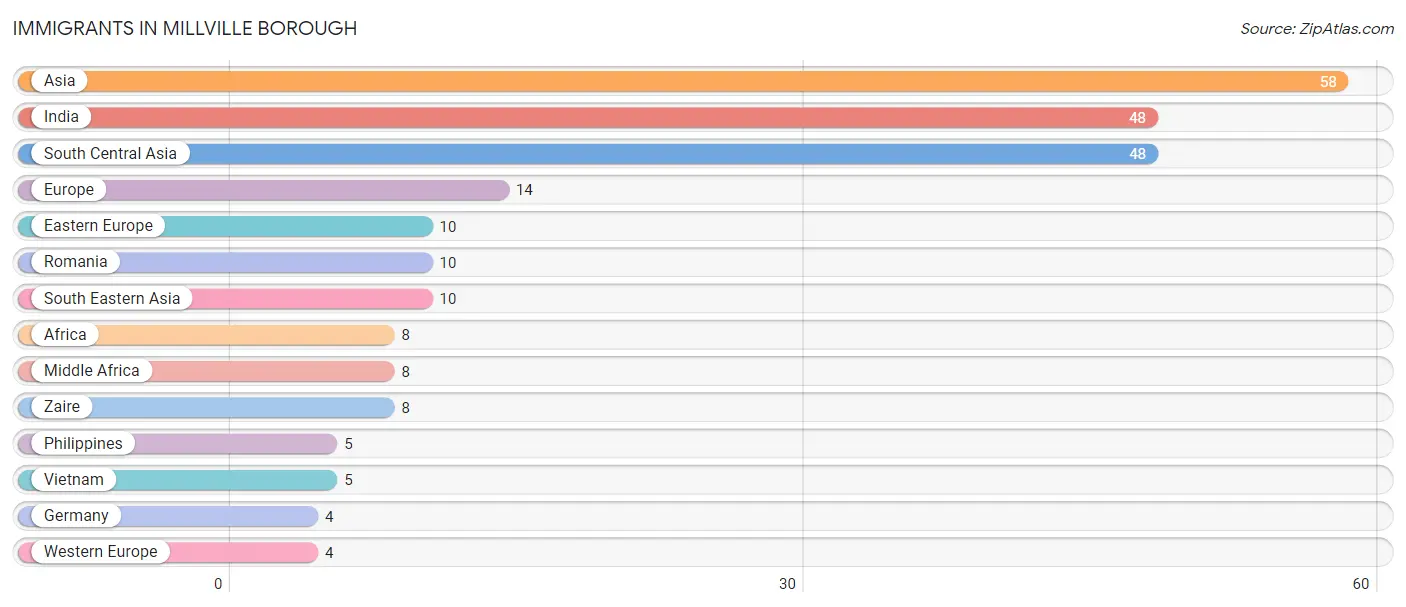
Immigrants in Millville borough
The most numerous immigrant groups reported in Millville borough came from Asia (58 | 5.8%), India (48 | 4.8%), South Central Asia (48 | 4.8%), Europe (14 | 1.4%), and Eastern Europe (10 | 1.0%), together accounting for 17.8% of all Millville borough residents.
| Immigration Origin | # Population | % Population |
| Africa | 8 | 0.8% |
| Asia | 58 | 5.8% |
| Eastern Europe | 10 | 1.0% |
| Europe | 14 | 1.4% |
| Germany | 4 | 0.4% |
| India | 48 | 4.8% |
| Middle Africa | 8 | 0.8% |
| Philippines | 5 | 0.5% |
| Romania | 10 | 1.0% |
| South Central Asia | 48 | 4.8% |
| South Eastern Asia | 10 | 1.0% |
| Vietnam | 5 | 0.5% |
| Western Europe | 4 | 0.4% |
| Zaire | 8 | 0.8% | View All 14 Rows |
Sex and Age in Millville borough
Sex and Age in Millville borough
The most populous age groups in Millville borough are 45 to 49 Years (48 | 10.1%) for men and 20 to 24 Years (74 | 14.1%) for women.
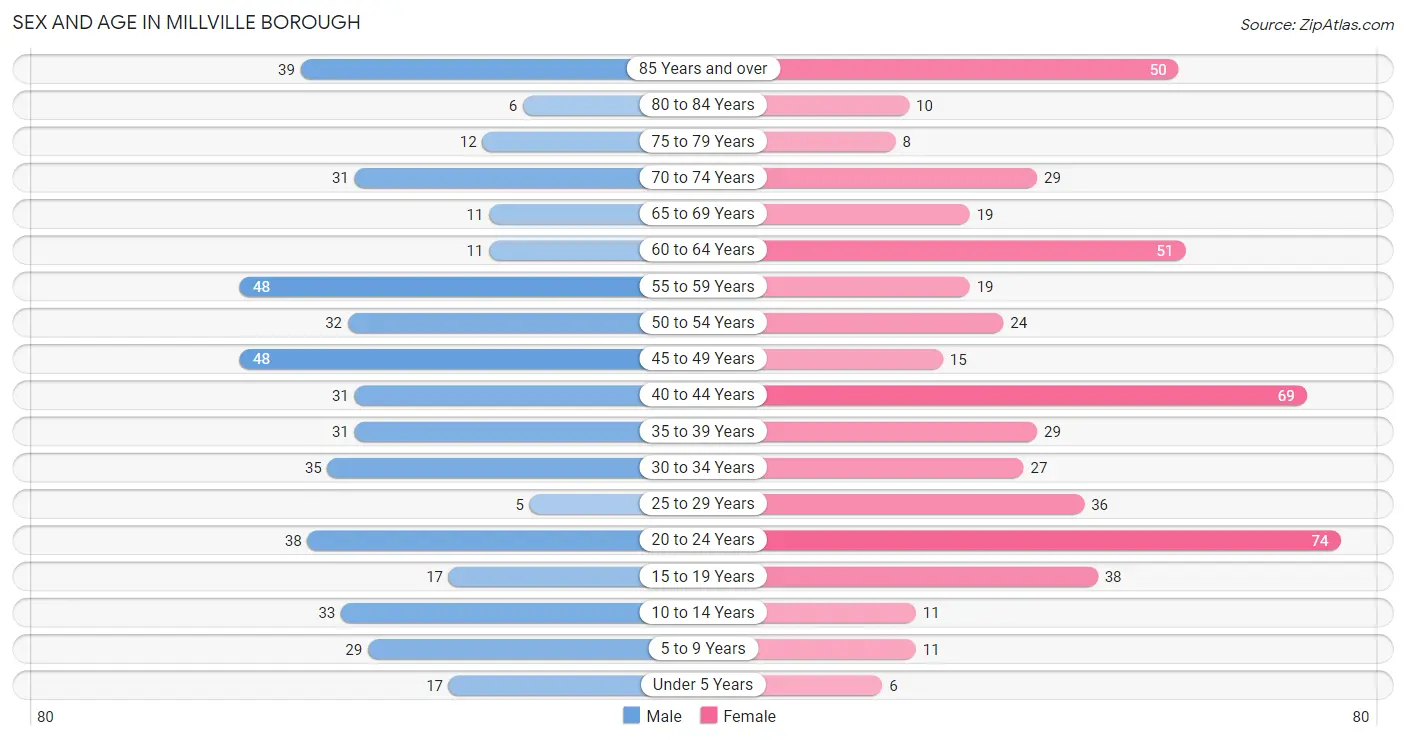
| Age Bracket | Male | Female |
| Under 5 Years | 17 (3.6%) | 6 (1.1%) |
| 5 to 9 Years | 29 (6.1%) | 11 (2.1%) |
| 10 to 14 Years | 33 (7.0%) | 11 (2.1%) |
| 15 to 19 Years | 17 (3.6%) | 38 (7.2%) |
| 20 to 24 Years | 38 (8.0%) | 74 (14.1%) |
| 25 to 29 Years | 5 (1.1%) | 36 (6.8%) |
| 30 to 34 Years | 35 (7.4%) | 27 (5.1%) |
| 35 to 39 Years | 31 (6.5%) | 29 (5.5%) |
| 40 to 44 Years | 31 (6.5%) | 69 (13.1%) |
| 45 to 49 Years | 48 (10.1%) | 15 (2.9%) |
| 50 to 54 Years | 32 (6.8%) | 24 (4.6%) |
| 55 to 59 Years | 48 (10.1%) | 19 (3.6%) |
| 60 to 64 Years | 11 (2.3%) | 51 (9.7%) |
| 65 to 69 Years | 11 (2.3%) | 19 (3.6%) |
| 70 to 74 Years | 31 (6.5%) | 29 (5.5%) |
| 75 to 79 Years | 12 (2.5%) | 8 (1.5%) |
| 80 to 84 Years | 6 (1.3%) | 10 (1.9%) |
| 85 Years and over | 39 (8.2%) | 50 (9.5%) |
| Total | 474 (100.0%) | 526 (100.0%) |
Families and Households in Millville borough
Median Family Size in Millville borough
The median family size in Millville borough is 3.17 persons per family, with married-couple families (160 | 79.6%) accounting for the largest median family size of 3.21 persons per family. On the other hand, single male/father families (5 | 2.5%) represent the smallest median family size with 1.80 persons per family.
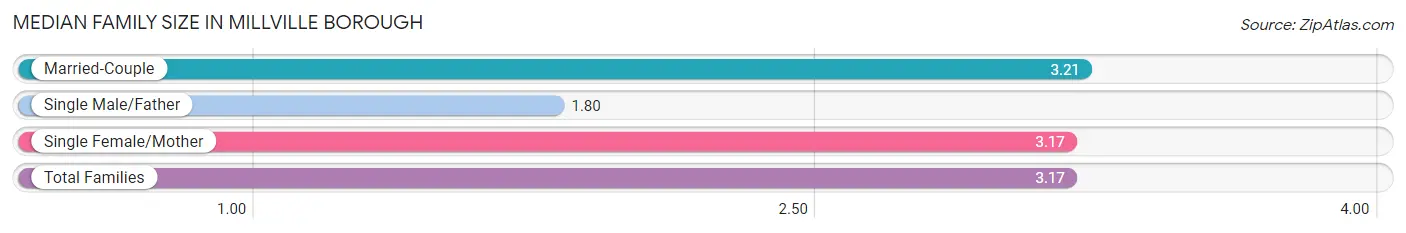
| Family Type | # Families | Family Size |
| Married-Couple | 160 (79.6%) | 3.21 |
| Single Male/Father | 5 (2.5%) | 1.80 |
| Single Female/Mother | 36 (17.9%) | 3.17 |
| Total Families | 201 (100.0%) | 3.17 |
Median Household Size in Millville borough
The median household size in Millville borough is 2.39 persons per household, with single female/mother households (36 | 9.7%) accounting for the largest median household size of 3.53 persons per household. non-family households (171 | 46.0%) represent the smallest median household size with 1.30 persons per household.
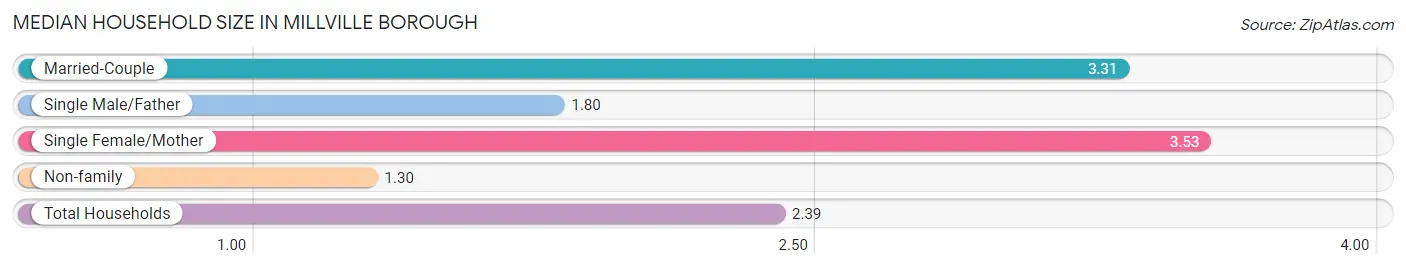
| Household Type | # Households | Household Size |
| Married-Couple | 160 (43.0%) | 3.31 |
| Single Male/Father | 5 (1.3%) | 1.80 |
| Single Female/Mother | 36 (9.7%) | 3.53 |
| Non-family | 171 (46.0%) | 1.30 |
| Total Households | 372 (100.0%) | 2.39 |
Household Size by Marriage Status in Millville borough
Out of a total of 372 households in Millville borough, 201 (54.0%) are family households, while 171 (46.0%) are nonfamily households. The most numerous type of family households are 3-person households, comprising 67, and the most common type of nonfamily households are 1-person households, comprising 123.
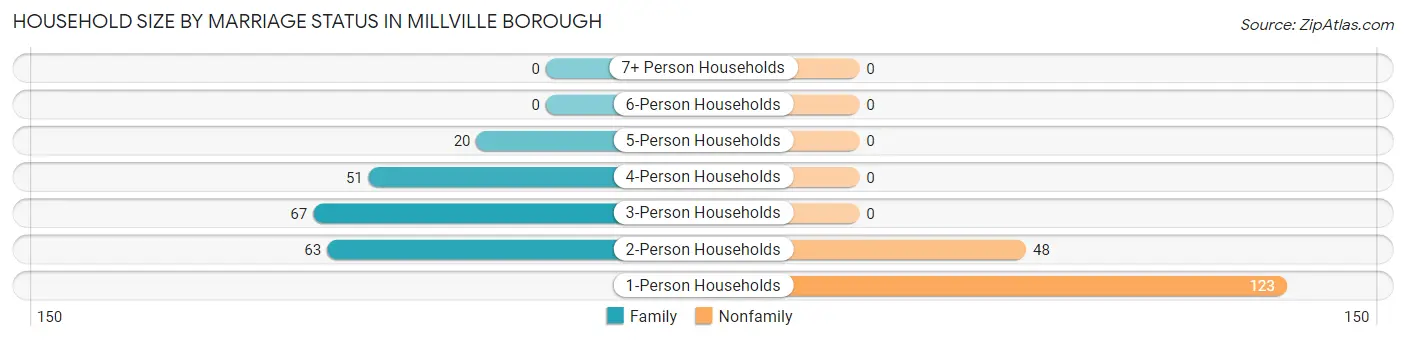
| Household Size | Family Households | Nonfamily Households |
| 1-Person Households | - | 123 (33.1%) |
| 2-Person Households | 63 (16.9%) | 48 (12.9%) |
| 3-Person Households | 67 (18.0%) | 0 (0.0%) |
| 4-Person Households | 51 (13.7%) | 0 (0.0%) |
| 5-Person Households | 20 (5.4%) | 0 (0.0%) |
| 6-Person Households | 0 (0.0%) | 0 (0.0%) |
| 7+ Person Households | 0 (0.0%) | 0 (0.0%) |
| Total | 201 (54.0%) | 171 (46.0%) |
Female Fertility in Millville borough
Fertility by Age in Millville borough
Average fertility rate in Millville borough is 31.0 births per 1,000 women. Women in the age bracket of 20 to 34 years have the highest fertility rate with 66.0 births per 1,000 women. Women in the age bracket of 20 to 34 years acount for 100.0% of all women with births.
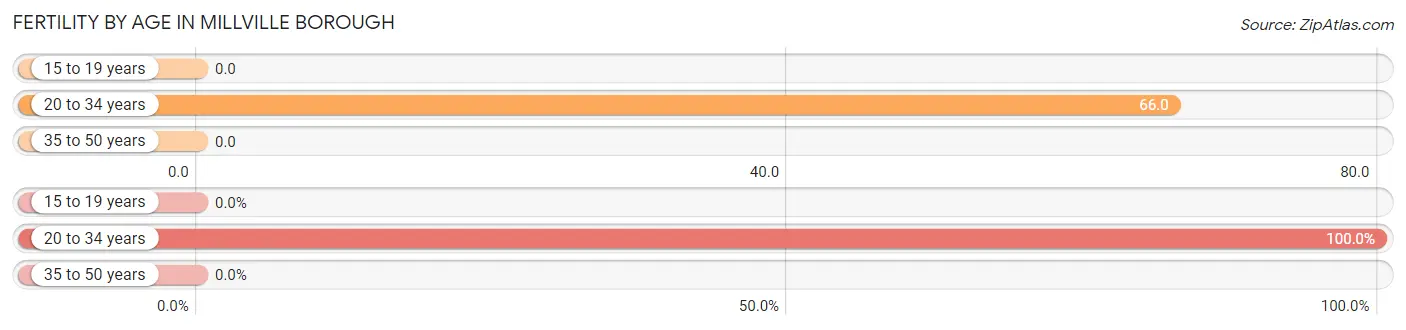
| Age Bracket | Women with Births | Births / 1,000 Women |
| 15 to 19 years | 0 (0.0%) | 0.0 |
| 20 to 34 years | 9 (100.0%) | 66.0 |
| 35 to 50 years | 0 (0.0%) | 0.0 |
| Total | 9 (100.0%) | 31.0 |
Fertility by Age by Marriage Status in Millville borough
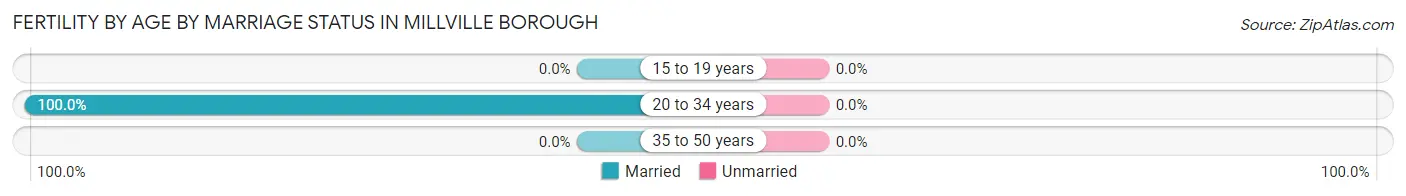
| Age Bracket | Married | Unmarried |
| 15 to 19 years | 0 (0.0%) | 0 (0.0%) |
| 20 to 34 years | 9 (100.0%) | 0 (0.0%) |
| 35 to 50 years | 0 (0.0%) | 0 (0.0%) |
| Total | 9 (100.0%) | 0 (0.0%) |
Fertility by Education in Millville borough
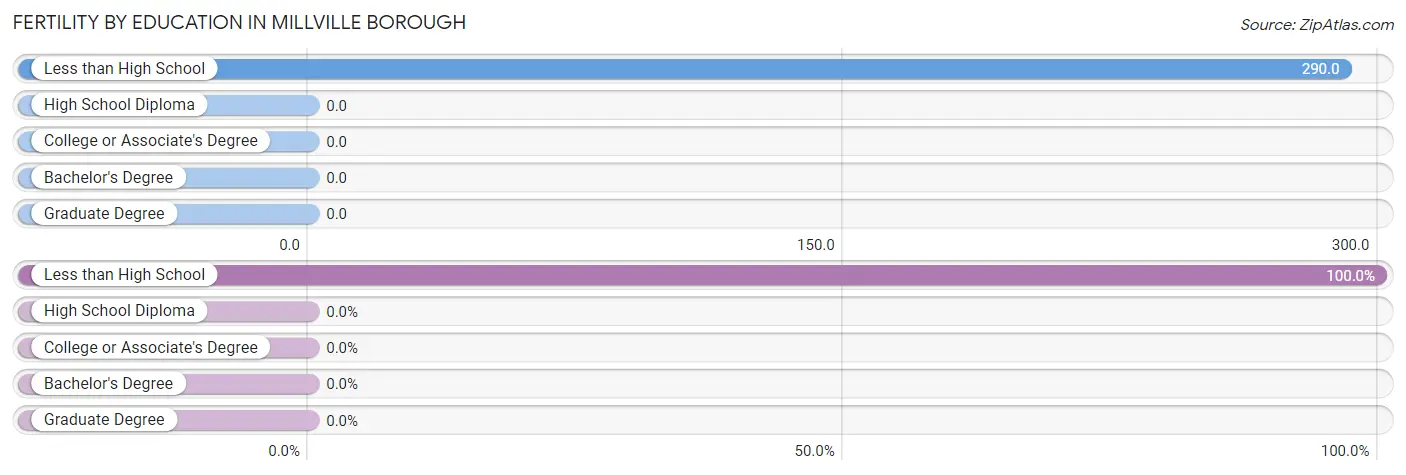
| Educational Attainment | Women with Births | Births / 1,000 Women |
| Less than High School | 9 (100.0%) | 290.0 |
| High School Diploma | 0 (0.0%) | 0.0 |
| College or Associate's Degree | 0 (0.0%) | 0.0 |
| Bachelor's Degree | 0 (0.0%) | 0.0 |
| Graduate Degree | 0 (0.0%) | 0.0 |
| Total | 9 (100.0%) | 31.0 |
Fertility by Education by Marriage Status in Millville borough
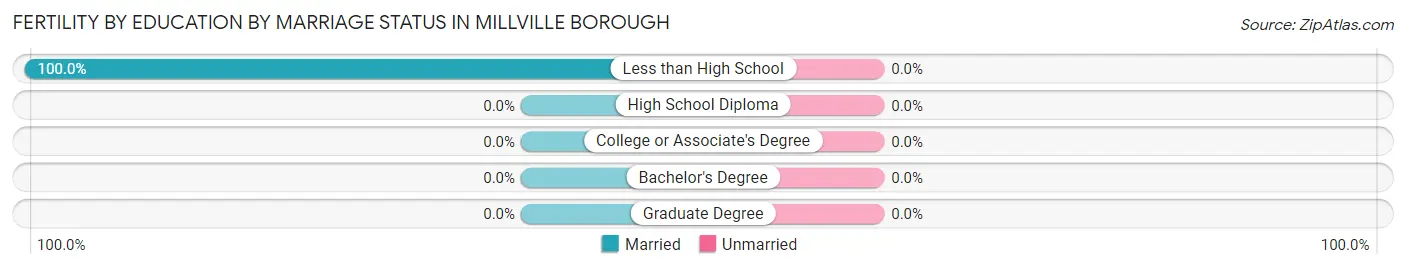
| Educational Attainment | Married | Unmarried |
| Less than High School | 9 (100.0%) | 0 (0.0%) |
| High School Diploma | 0 (0.0%) | 0 (0.0%) |
| College or Associate's Degree | 0 (0.0%) | 0 (0.0%) |
| Bachelor's Degree | 0 (0.0%) | 0 (0.0%) |
| Graduate Degree | 0 (0.0%) | 0 (0.0%) |
| Total | 9 (100.0%) | 0 (0.0%) |
Employment Characteristics in Millville borough
Employment by Class of Employer in Millville borough
Among the 477 employed individuals in Millville borough, private company employees (332 | 69.6%), local government employees (62 | 13.0%), and not-for-profit organizations (42 | 8.8%) make up the most common classes of employment.
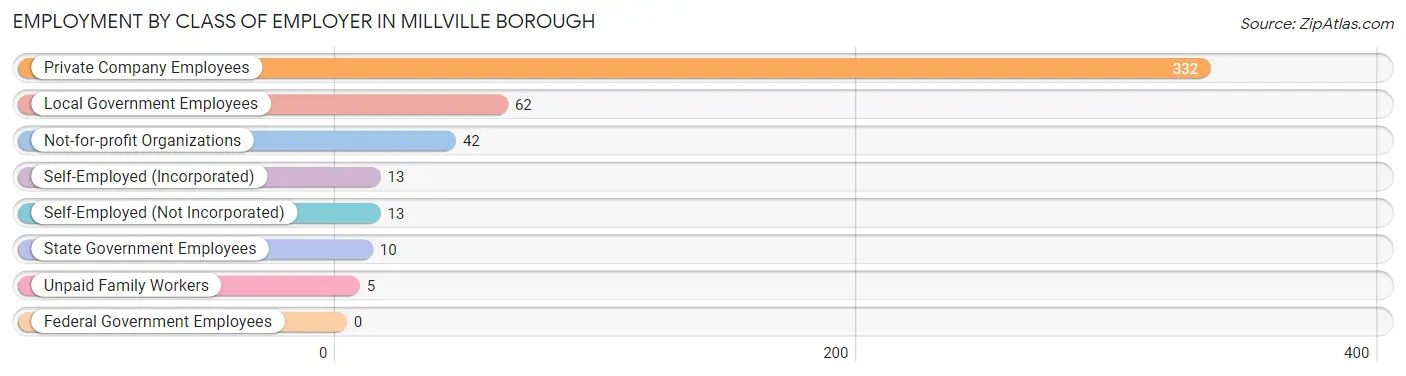
| Employer Class | # Employees | % Employees |
| Private Company Employees | 332 | 69.6% |
| Self-Employed (Incorporated) | 13 | 2.7% |
| Self-Employed (Not Incorporated) | 13 | 2.7% |
| Not-for-profit Organizations | 42 | 8.8% |
| Local Government Employees | 62 | 13.0% |
| State Government Employees | 10 | 2.1% |
| Federal Government Employees | 0 | 0.0% |
| Unpaid Family Workers | 5 | 1.1% |
| Total | 477 | 100.0% |
Employment Status by Age in Millville borough
According to the labor force statistics for Millville borough, out of the total population over 16 years of age (882), 56.3% or 497 individuals are in the labor force, with 3.4% or 17 of them unemployed. The age group with the highest labor force participation rate is 30 to 34 years, with 100.0% or 62 individuals in the labor force. Within the labor force, the 35 to 44 years age range has the highest percentage of unemployed individuals, with 9.5% or 12 of them being unemployed.
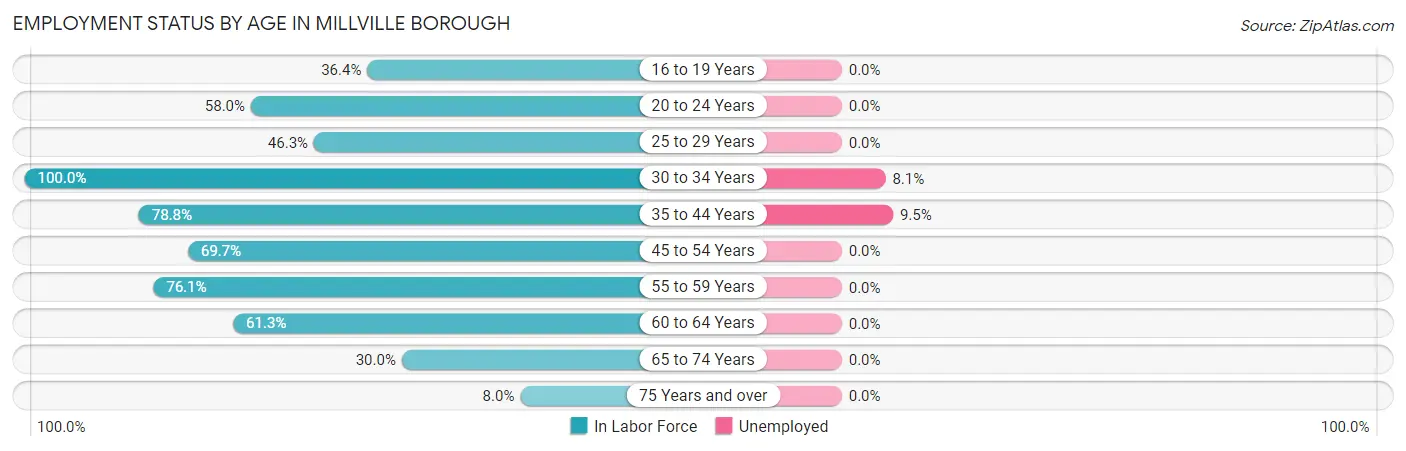
| Age Bracket | In Labor Force | Unemployed |
| 16 to 19 Years | 16 (36.4%) | 0 (0.0%) |
| 20 to 24 Years | 65 (58.0%) | 0 (0.0%) |
| 25 to 29 Years | 19 (46.3%) | 0 (0.0%) |
| 30 to 34 Years | 62 (100.0%) | 5 (8.1%) |
| 35 to 44 Years | 126 (78.8%) | 12 (9.5%) |
| 45 to 54 Years | 83 (69.7%) | 0 (0.0%) |
| 55 to 59 Years | 51 (76.1%) | 0 (0.0%) |
| 60 to 64 Years | 38 (61.3%) | 0 (0.0%) |
| 65 to 74 Years | 27 (30.0%) | 0 (0.0%) |
| 75 Years and over | 10 (8.0%) | 0 (0.0%) |
| Total | 497 (56.3%) | 17 (3.4%) |
Employment Status by Educational Attainment in Millville borough
According to labor force statistics for Millville borough, 74.2% of individuals (379) out of the total population between 25 and 64 years of age (511) are in the labor force, with 4.5% or 17 of them being unemployed. The group with the highest labor force participation rate are those with the educational attainment of bachelor's degree or higher, with 95.3% or 122 individuals in the labor force. Within the labor force, individuals with high school diploma education have the highest percentage of unemployment, with 7.3% or 13 of them being unemployed.
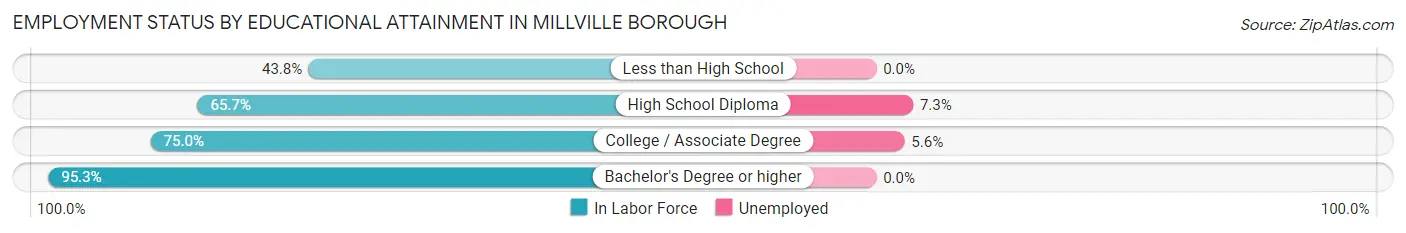
| Educational Attainment | In Labor Force | Unemployed |
| Less than High School | 7 (43.8%) | 0 (0.0%) |
| High School Diploma | 178 (65.7%) | 20 (7.3%) |
| College / Associate Degree | 72 (75.0%) | 5 (5.6%) |
| Bachelor's Degree or higher | 122 (95.3%) | 0 (0.0%) |
| Total | 379 (74.2%) | 23 (4.5%) |
Employment Occupations by Sex in Millville borough
Management, Business, Science and Arts Occupations
The most common Management, Business, Science and Arts occupations in Millville borough are Health Diagnosing & Treating (64 | 13.3%), Management (58 | 12.1%), Community & Social Service (46 | 9.6%), Health Technologists (37 | 7.7%), and Education Instruction & Library (31 | 6.5%).
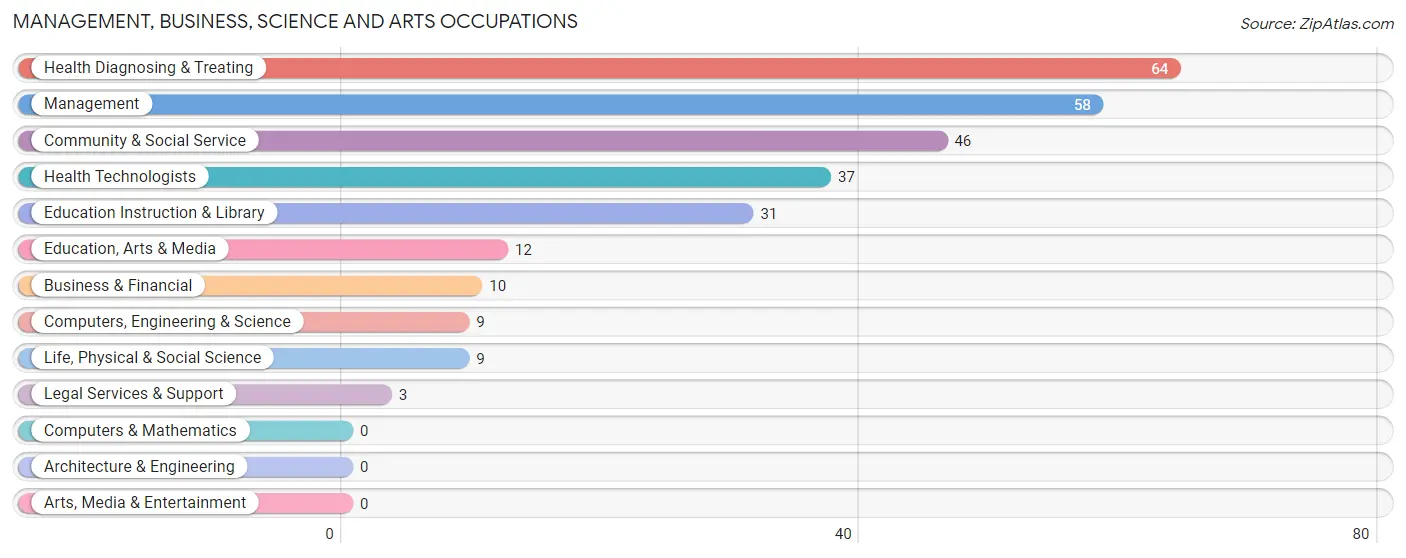
Management, Business, Science and Arts Occupations by Sex
Within the Management, Business, Science and Arts occupations in Millville borough, the most male-oriented occupations are Computers, Engineering & Science (100.0%), Life, Physical & Social Science (100.0%), and Education, Arts & Media (100.0%), while the most female-oriented occupations are Health Technologists (94.6%), Health Diagnosing & Treating (79.7%), and Business & Financial (50.0%).
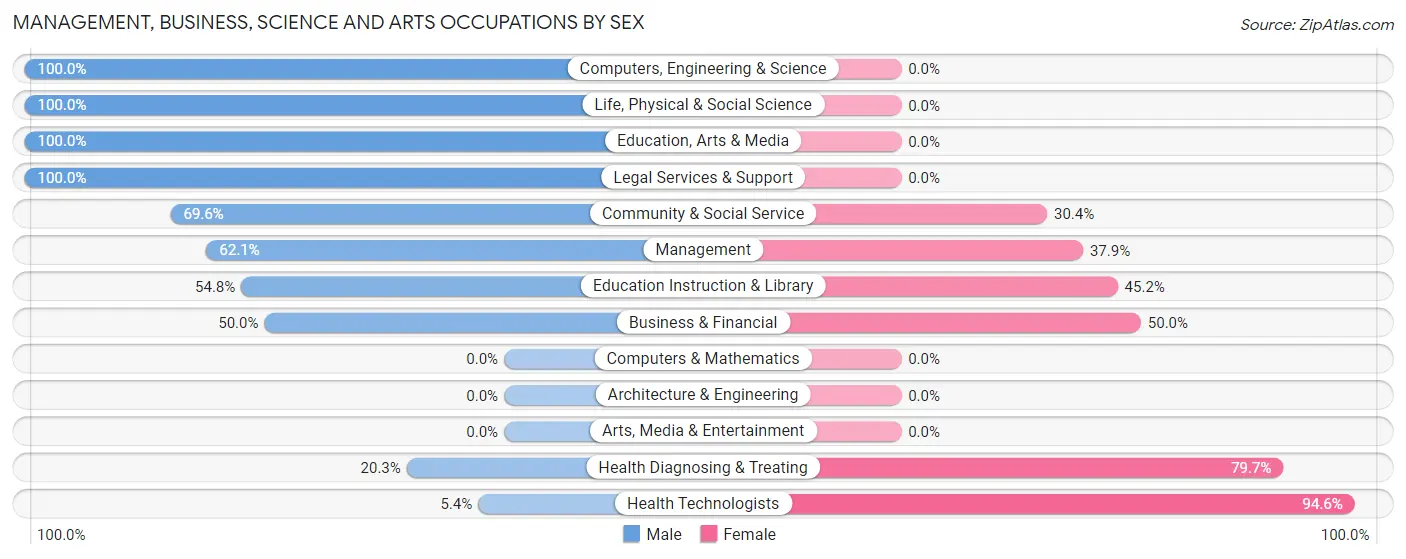
| Occupation | Male | Female |
| Management | 36 (62.1%) | 22 (37.9%) |
| Business & Financial | 5 (50.0%) | 5 (50.0%) |
| Computers, Engineering & Science | 9 (100.0%) | 0 (0.0%) |
| Computers & Mathematics | 0 (0.0%) | 0 (0.0%) |
| Architecture & Engineering | 0 (0.0%) | 0 (0.0%) |
| Life, Physical & Social Science | 9 (100.0%) | 0 (0.0%) |
| Community & Social Service | 32 (69.6%) | 14 (30.4%) |
| Education, Arts & Media | 12 (100.0%) | 0 (0.0%) |
| Legal Services & Support | 3 (100.0%) | 0 (0.0%) |
| Education Instruction & Library | 17 (54.8%) | 14 (45.2%) |
| Arts, Media & Entertainment | 0 (0.0%) | 0 (0.0%) |
| Health Diagnosing & Treating | 13 (20.3%) | 51 (79.7%) |
| Health Technologists | 2 (5.4%) | 35 (94.6%) |
| Total (Category) | 95 (50.8%) | 92 (49.2%) |
| Total (Overall) | 232 (48.3%) | 248 (51.7%) |
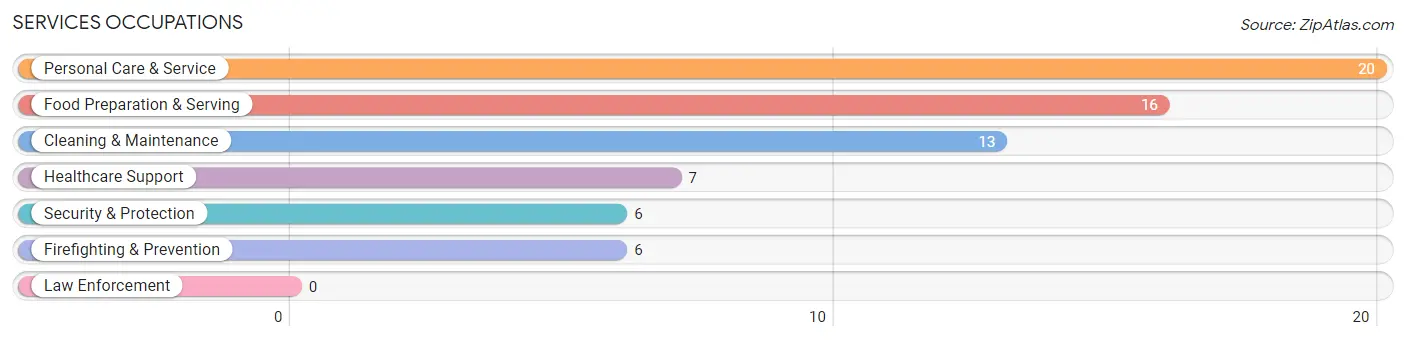
Services Occupations
The most common Services occupations in Millville borough are Personal Care & Service (20 | 4.2%), Food Preparation & Serving (16 | 3.3%), Cleaning & Maintenance (13 | 2.7%), Healthcare Support (7 | 1.5%), and Security & Protection (6 | 1.3%).
Services Occupations by Sex
Within the Services occupations in Millville borough, the most male-oriented occupations are Security & Protection (66.7%), Firefighting & Prevention (66.7%), and Personal Care & Service (55.0%), while the most female-oriented occupations are Healthcare Support (100.0%), Food Preparation & Serving (100.0%), and Cleaning & Maintenance (46.2%).
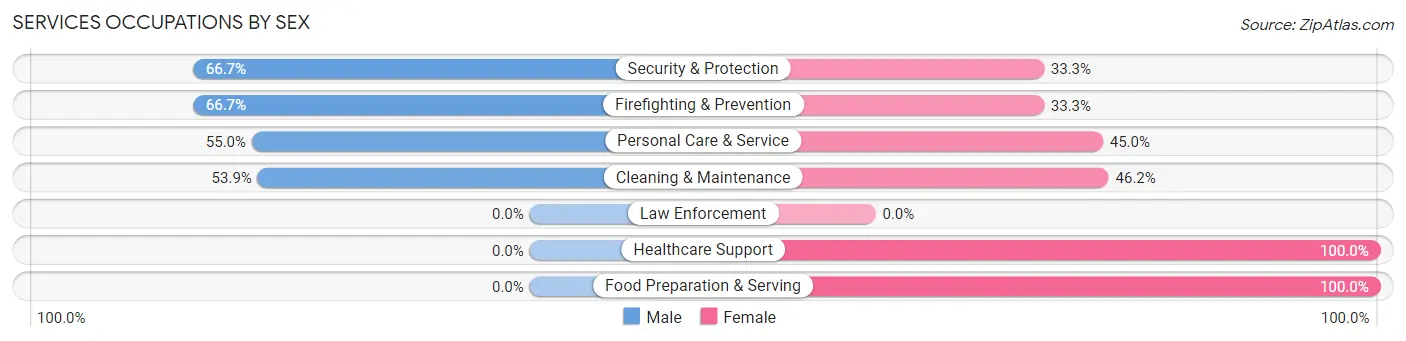
| Occupation | Male | Female |
| Healthcare Support | 0 (0.0%) | 7 (100.0%) |
| Security & Protection | 4 (66.7%) | 2 (33.3%) |
| Firefighting & Prevention | 4 (66.7%) | 2 (33.3%) |
| Law Enforcement | 0 (0.0%) | 0 (0.0%) |
| Food Preparation & Serving | 0 (0.0%) | 16 (100.0%) |
| Cleaning & Maintenance | 7 (53.8%) | 6 (46.2%) |
| Personal Care & Service | 11 (55.0%) | 9 (45.0%) |
| Total (Category) | 22 (35.5%) | 40 (64.5%) |
| Total (Overall) | 232 (48.3%) | 248 (51.7%) |
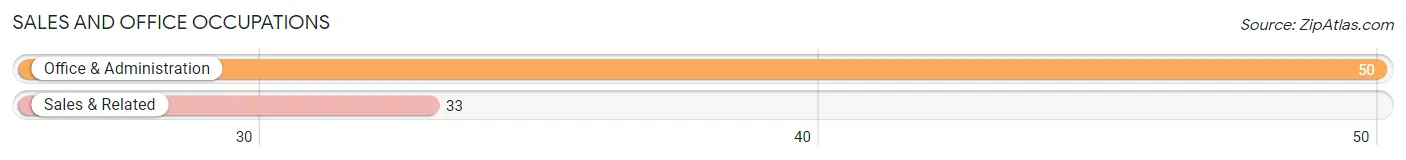
Sales and Office Occupations
The most common Sales and Office occupations in Millville borough are Office & Administration (50 | 10.4%), and Sales & Related (33 | 6.9%).
Sales and Office Occupations by Sex
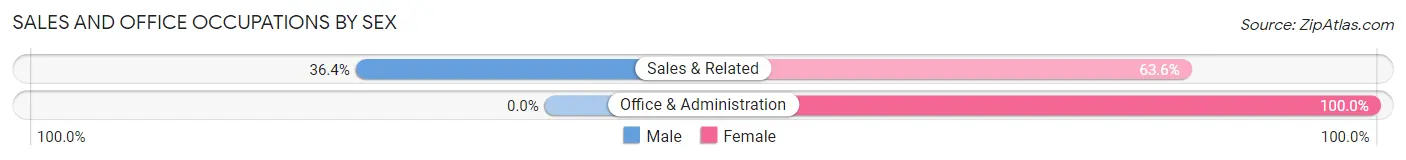
| Occupation | Male | Female |
| Sales & Related | 12 (36.4%) | 21 (63.6%) |
| Office & Administration | 0 (0.0%) | 50 (100.0%) |
| Total (Category) | 12 (14.5%) | 71 (85.5%) |
| Total (Overall) | 232 (48.3%) | 248 (51.7%) |
Natural Resources, Construction and Maintenance Occupations
The most common Natural Resources, Construction and Maintenance occupations in Millville borough are Construction & Extraction (25 | 5.2%), and Installation, Maintenance & Repair (7 | 1.5%).
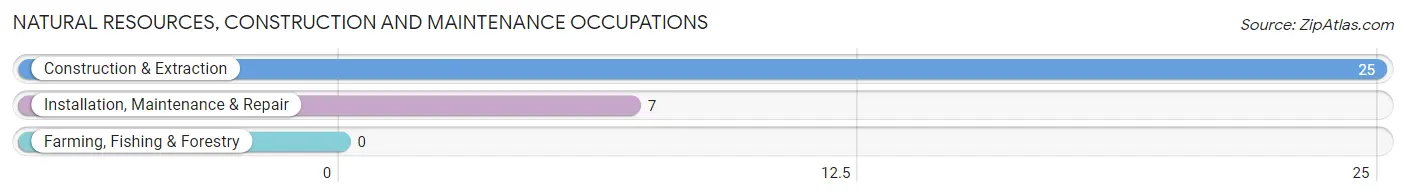
Natural Resources, Construction and Maintenance Occupations by Sex

| Occupation | Male | Female |
| Farming, Fishing & Forestry | 0 (0.0%) | 0 (0.0%) |
| Construction & Extraction | 25 (100.0%) | 0 (0.0%) |
| Installation, Maintenance & Repair | 7 (100.0%) | 0 (0.0%) |
| Total (Category) | 32 (100.0%) | 0 (0.0%) |
| Total (Overall) | 232 (48.3%) | 248 (51.7%) |
Production, Transportation and Moving Occupations
The most common Production, Transportation and Moving occupations in Millville borough are Material Moving (59 | 12.3%), Production (49 | 10.2%), and Transportation (8 | 1.7%).
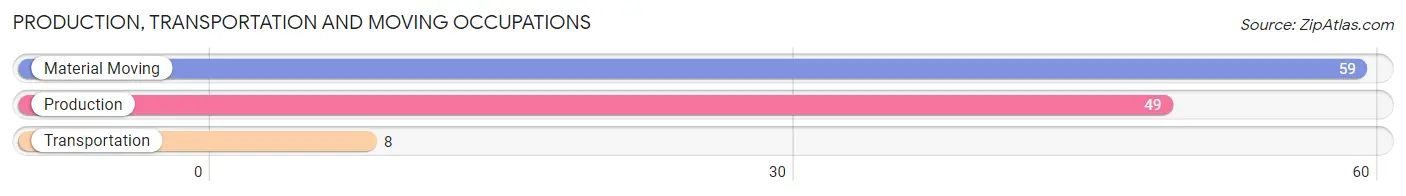
Production, Transportation and Moving Occupations by Sex
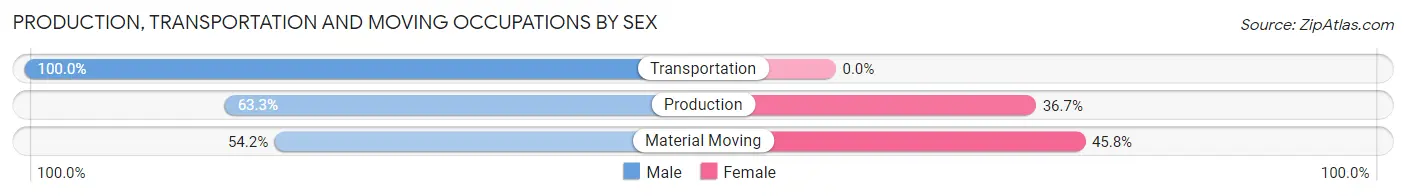
| Occupation | Male | Female |
| Production | 31 (63.3%) | 18 (36.7%) |
| Transportation | 8 (100.0%) | 0 (0.0%) |
| Material Moving | 32 (54.2%) | 27 (45.8%) |
| Total (Category) | 71 (61.2%) | 45 (38.8%) |
| Total (Overall) | 232 (48.3%) | 248 (51.7%) |
Employment Industries by Sex in Millville borough
Employment Industries in Millville borough
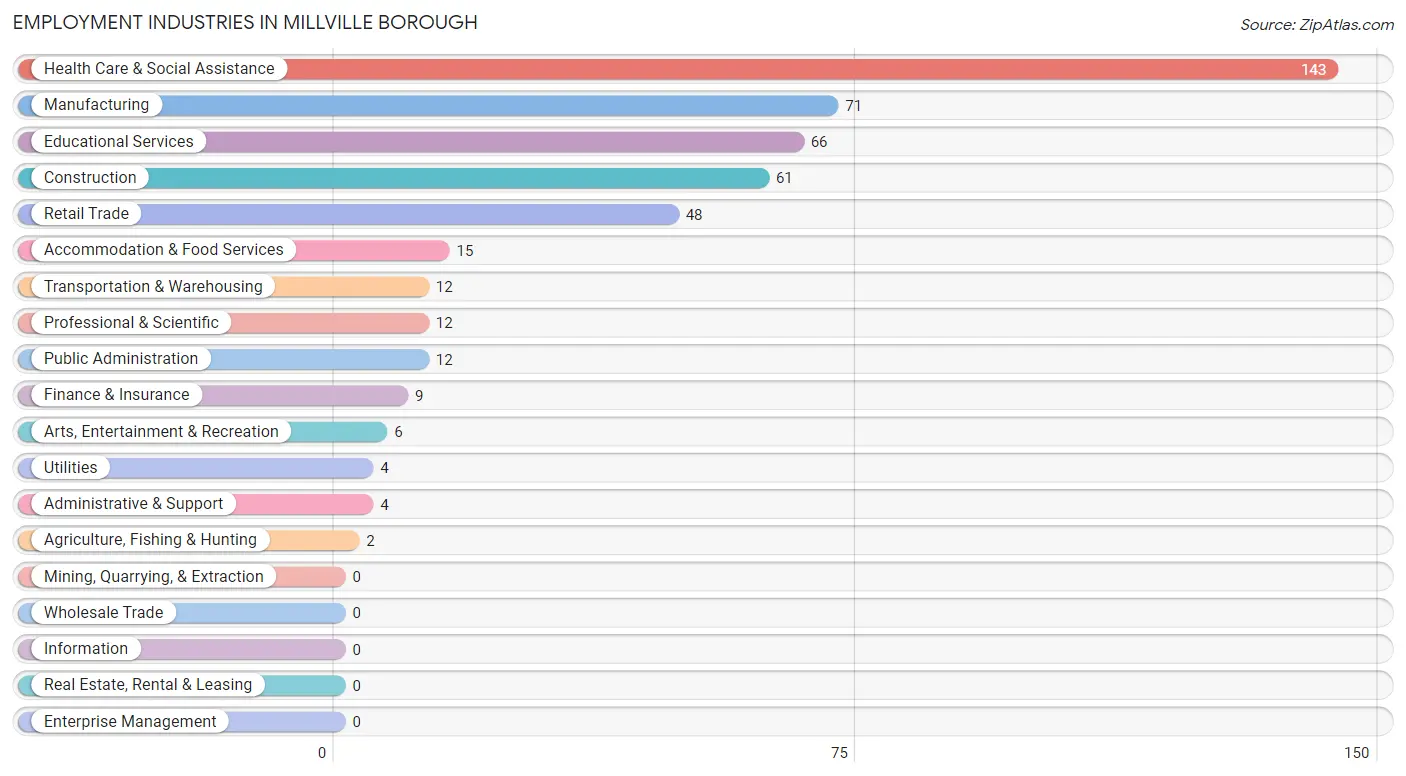
The major employment industries in Millville borough include Health Care & Social Assistance (143 | 29.8%), Manufacturing (71 | 14.8%), Educational Services (66 | 13.8%), Construction (61 | 12.7%), and Retail Trade (48 | 10.0%).
Employment Industries by Sex in Millville borough
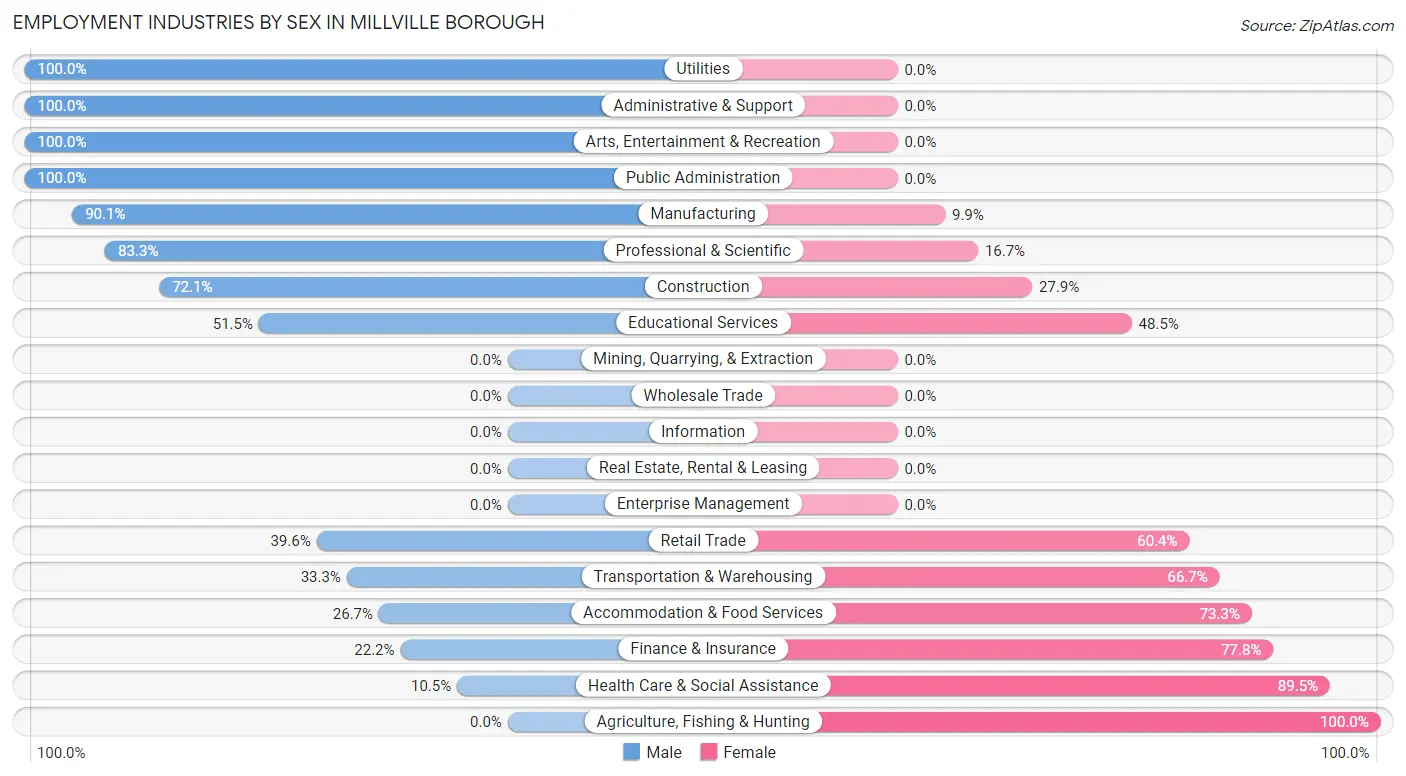
The Millville borough industries that see more men than women are Utilities (100.0%), Administrative & Support (100.0%), and Arts, Entertainment & Recreation (100.0%), whereas the industries that tend to have a higher number of women are Agriculture, Fishing & Hunting (100.0%), Health Care & Social Assistance (89.5%), and Finance & Insurance (77.8%).
| Industry | Male | Female |
| Agriculture, Fishing & Hunting | 0 (0.0%) | 2 (100.0%) |
| Mining, Quarrying, & Extraction | 0 (0.0%) | 0 (0.0%) |
| Construction | 44 (72.1%) | 17 (27.9%) |
| Manufacturing | 64 (90.1%) | 7 (9.9%) |
| Wholesale Trade | 0 (0.0%) | 0 (0.0%) |
| Retail Trade | 19 (39.6%) | 29 (60.4%) |
| Transportation & Warehousing | 4 (33.3%) | 8 (66.7%) |
| Utilities | 4 (100.0%) | 0 (0.0%) |
| Information | 0 (0.0%) | 0 (0.0%) |
| Finance & Insurance | 2 (22.2%) | 7 (77.8%) |
| Real Estate, Rental & Leasing | 0 (0.0%) | 0 (0.0%) |
| Professional & Scientific | 10 (83.3%) | 2 (16.7%) |
| Enterprise Management | 0 (0.0%) | 0 (0.0%) |
| Administrative & Support | 4 (100.0%) | 0 (0.0%) |
| Educational Services | 34 (51.5%) | 32 (48.5%) |
| Health Care & Social Assistance | 15 (10.5%) | 128 (89.5%) |
| Arts, Entertainment & Recreation | 6 (100.0%) | 0 (0.0%) |
| Accommodation & Food Services | 4 (26.7%) | 11 (73.3%) |
| Public Administration | 12 (100.0%) | 0 (0.0%) |
| Total | 232 (48.3%) | 248 (51.7%) |
Education in Millville borough
School Enrollment in Millville borough
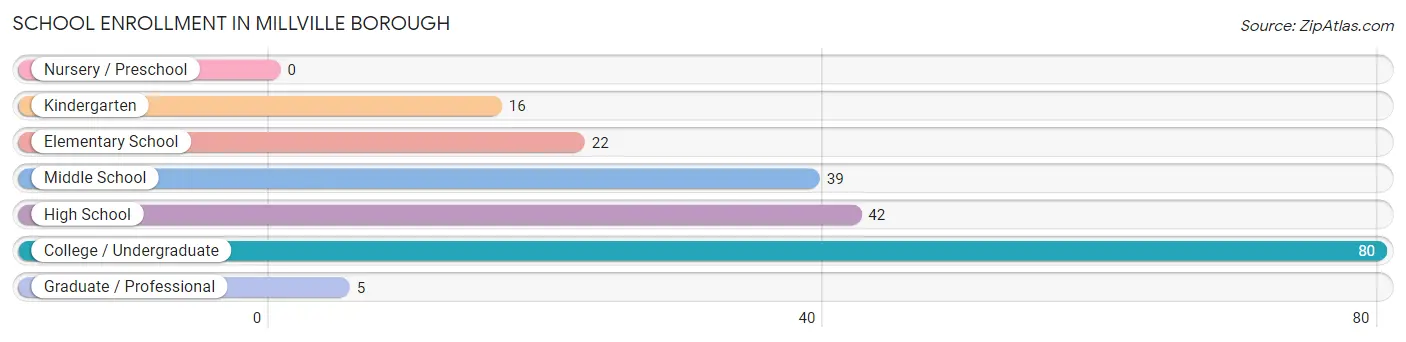
The most common levels of schooling among the 204 students in Millville borough are college / undergraduate (80 | 39.2%), high school (42 | 20.6%), and middle school (39 | 19.1%).
| School Level | # Students | % Students |
| Nursery / Preschool | 0 | 0.0% |
| Kindergarten | 16 | 7.8% |
| Elementary School | 22 | 10.8% |
| Middle School | 39 | 19.1% |
| High School | 42 | 20.6% |
| College / Undergraduate | 80 | 39.2% |
| Graduate / Professional | 5 | 2.5% |
| Total | 204 | 100.0% |
School Enrollment by Age by Funding Source in Millville borough
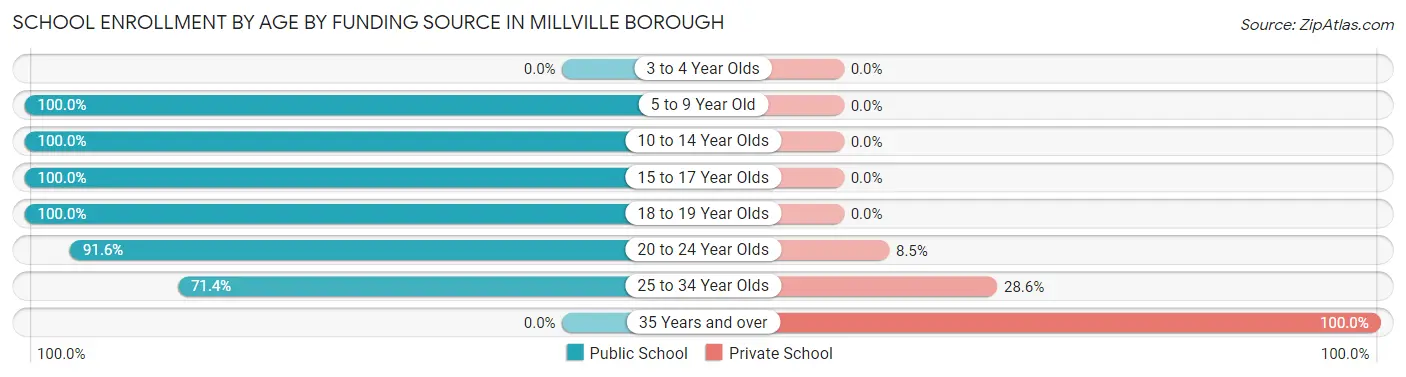
Out of a total of 204 students who are enrolled in schools in Millville borough, 15 (7.4%) attend a private institution, while the remaining 189 (92.6%) are enrolled in public schools. The age group of 35 years and over has the highest likelihood of being enrolled in private schools, with 7 (100.0% in the age bracket) enrolled. Conversely, the age group of 5 to 9 year old has the lowest likelihood of being enrolled in a private school, with 38 (100.0% in the age bracket) attending a public institution.
| Age Bracket | Public School | Private School |
| 3 to 4 Year Olds | 0 (0.0%) | 0 (0.0%) |
| 5 to 9 Year Old | 38 (100.0%) | 0 (0.0%) |
| 10 to 14 Year Olds | 42 (100.0%) | 0 (0.0%) |
| 15 to 17 Year Olds | 33 (100.0%) | 0 (0.0%) |
| 18 to 19 Year Olds | 6 (100.0%) | 0 (0.0%) |
| 20 to 24 Year Olds | 65 (91.5%) | 6 (8.5%) |
| 25 to 34 Year Olds | 5 (71.4%) | 2 (28.6%) |
| 35 Years and over | 0 (0.0%) | 7 (100.0%) |
| Total | 189 (92.6%) | 15 (7.4%) |
Educational Attainment by Field of Study in Millville borough
Education (39 | 23.5%), engineering (21 | 12.7%), science & technology (21 | 12.7%), bio, nature & agricultural (19 | 11.5%), and business (15 | 9.0%) are the most common fields of study among 166 individuals in Millville borough who have obtained a bachelor's degree or higher.
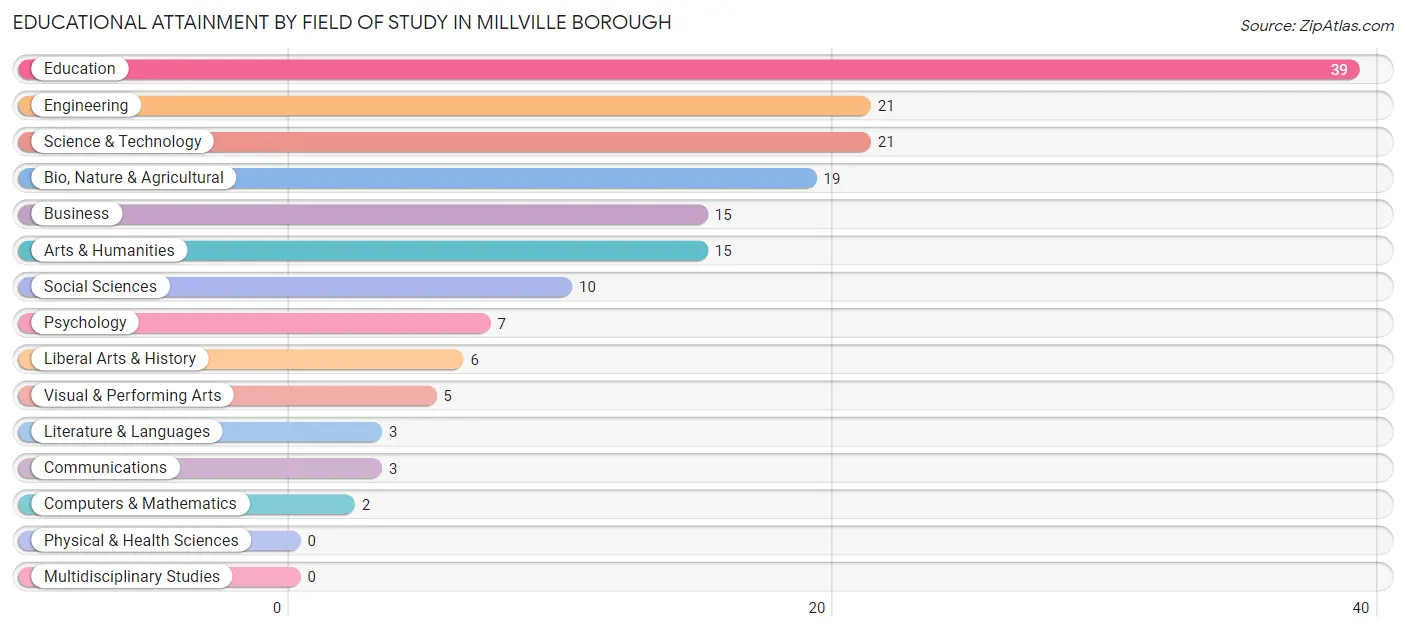
| Field of Study | # Graduates | % Graduates |
| Computers & Mathematics | 2 | 1.2% |
| Bio, Nature & Agricultural | 19 | 11.5% |
| Physical & Health Sciences | 0 | 0.0% |
| Psychology | 7 | 4.2% |
| Social Sciences | 10 | 6.0% |
| Engineering | 21 | 12.7% |
| Multidisciplinary Studies | 0 | 0.0% |
| Science & Technology | 21 | 12.7% |
| Business | 15 | 9.0% |
| Education | 39 | 23.5% |
| Literature & Languages | 3 | 1.8% |
| Liberal Arts & History | 6 | 3.6% |
| Visual & Performing Arts | 5 | 3.0% |
| Communications | 3 | 1.8% |
| Arts & Humanities | 15 | 9.0% |
| Total | 166 | 100.0% |
Transportation & Commute in Millville borough
Vehicle Availability by Sex in Millville borough
The most prevalent vehicle ownership categories in Millville borough are males with 2 vehicles (86, accounting for 37.6%) and females with 2 vehicles (82, making up 34.7%).
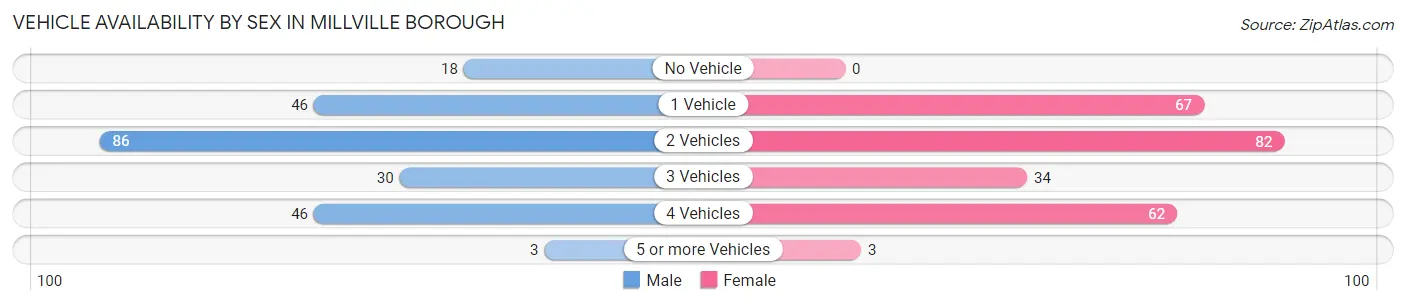
| Vehicles Available | Male | Female |
| No Vehicle | 18 (7.9%) | 0 (0.0%) |
| 1 Vehicle | 46 (20.1%) | 67 (27.0%) |
| 2 Vehicles | 86 (37.6%) | 82 (33.1%) |
| 3 Vehicles | 30 (13.1%) | 34 (13.7%) |
| 4 Vehicles | 46 (20.1%) | 62 (25.0%) |
| 5 or more Vehicles | 3 (1.3%) | 3 (1.2%) |
| Total | 229 (100.0%) | 248 (100.0%) |
Commute Time in Millville borough
The most frequently occuring commute durations in Millville borough are 20 to 24 minutes (138 commuters, 31.4%), 5 to 9 minutes (109 commuters, 24.8%), and 30 to 34 minutes (50 commuters, 11.4%).
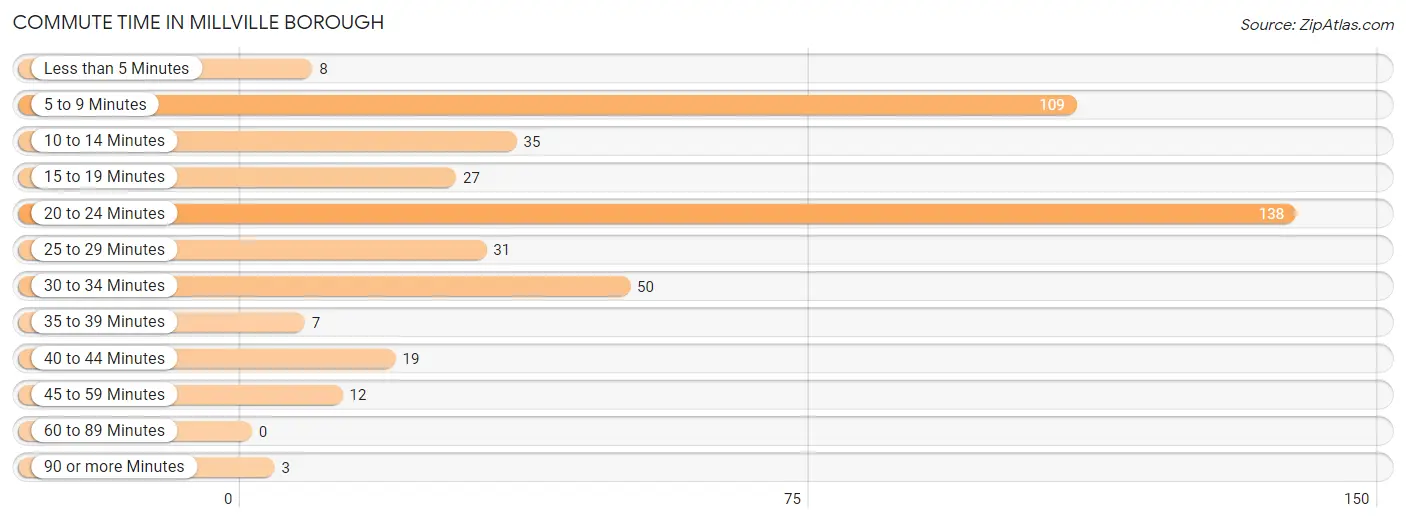
| Commute Time | # Commuters | % Commuters |
| Less than 5 Minutes | 8 | 1.8% |
| 5 to 9 Minutes | 109 | 24.8% |
| 10 to 14 Minutes | 35 | 8.0% |
| 15 to 19 Minutes | 27 | 6.1% |
| 20 to 24 Minutes | 138 | 31.4% |
| 25 to 29 Minutes | 31 | 7.1% |
| 30 to 34 Minutes | 50 | 11.4% |
| 35 to 39 Minutes | 7 | 1.6% |
| 40 to 44 Minutes | 19 | 4.3% |
| 45 to 59 Minutes | 12 | 2.7% |
| 60 to 89 Minutes | 0 | 0.0% |
| 90 or more Minutes | 3 | 0.7% |
Commute Time by Sex in Millville borough
The most common commute times in Millville borough are 20 to 24 minutes (71 commuters, 35.3%) for males and 5 to 9 minutes (76 commuters, 31.9%) for females.
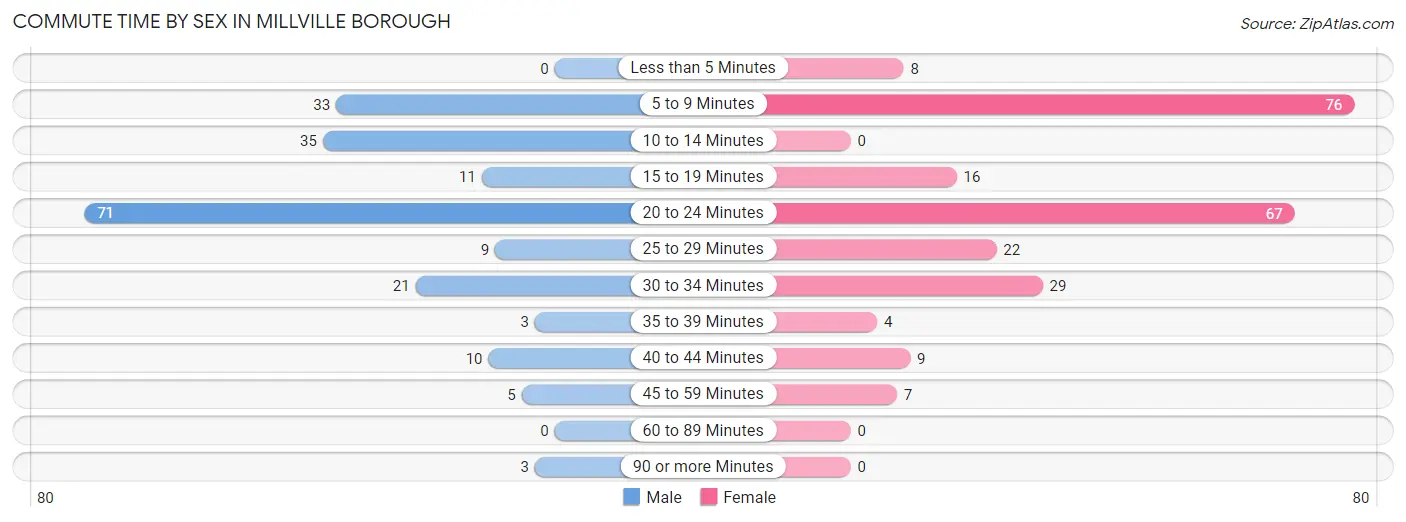
| Commute Time | Male | Female |
| Less than 5 Minutes | 0 (0.0%) | 8 (3.4%) |
| 5 to 9 Minutes | 33 (16.4%) | 76 (31.9%) |
| 10 to 14 Minutes | 35 (17.4%) | 0 (0.0%) |
| 15 to 19 Minutes | 11 (5.5%) | 16 (6.7%) |
| 20 to 24 Minutes | 71 (35.3%) | 67 (28.1%) |
| 25 to 29 Minutes | 9 (4.5%) | 22 (9.2%) |
| 30 to 34 Minutes | 21 (10.4%) | 29 (12.2%) |
| 35 to 39 Minutes | 3 (1.5%) | 4 (1.7%) |
| 40 to 44 Minutes | 10 (5.0%) | 9 (3.8%) |
| 45 to 59 Minutes | 5 (2.5%) | 7 (2.9%) |
| 60 to 89 Minutes | 0 (0.0%) | 0 (0.0%) |
| 90 or more Minutes | 3 (1.5%) | 0 (0.0%) |
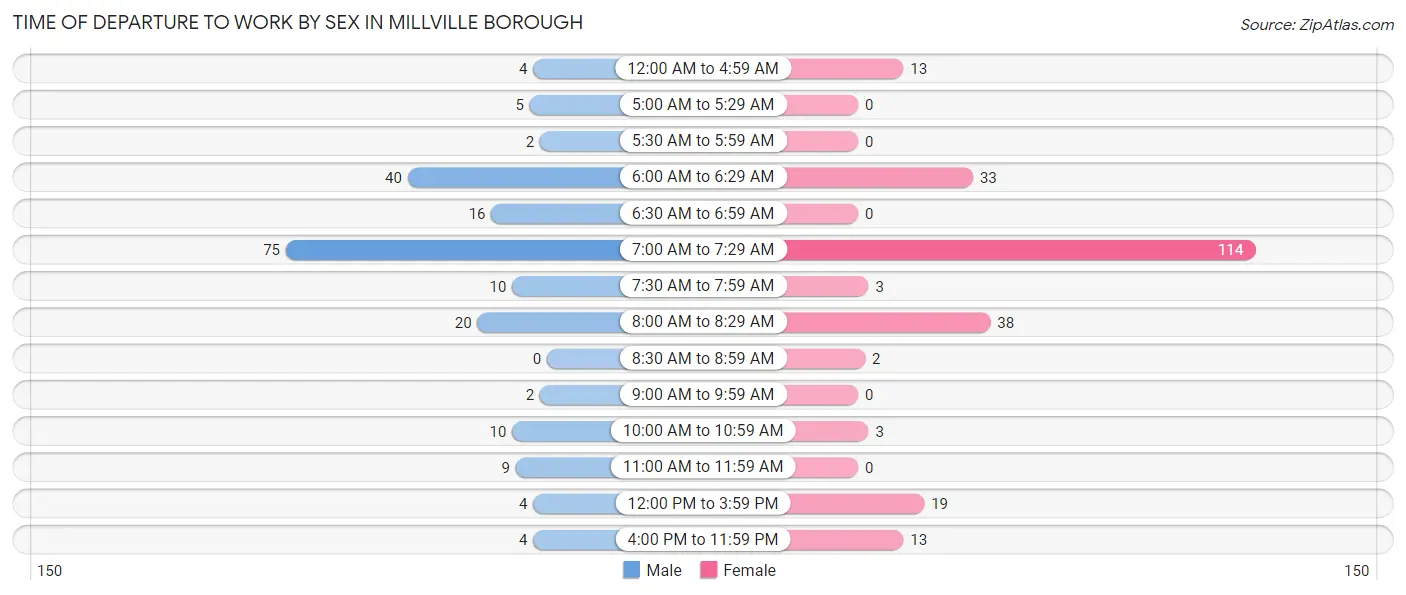
Time of Departure to Work by Sex in Millville borough
The most frequent times of departure to work in Millville borough are 7:00 AM to 7:29 AM (75, 37.3%) for males and 7:00 AM to 7:29 AM (114, 47.9%) for females.
| Time of Departure | Male | Female |
| 12:00 AM to 4:59 AM | 4 (2.0%) | 13 (5.5%) |
| 5:00 AM to 5:29 AM | 5 (2.5%) | 0 (0.0%) |
| 5:30 AM to 5:59 AM | 2 (1.0%) | 0 (0.0%) |
| 6:00 AM to 6:29 AM | 40 (19.9%) | 33 (13.9%) |
| 6:30 AM to 6:59 AM | 16 (8.0%) | 0 (0.0%) |
| 7:00 AM to 7:29 AM | 75 (37.3%) | 114 (47.9%) |
| 7:30 AM to 7:59 AM | 10 (5.0%) | 3 (1.3%) |
| 8:00 AM to 8:29 AM | 20 (10.0%) | 38 (16.0%) |
| 8:30 AM to 8:59 AM | 0 (0.0%) | 2 (0.8%) |
| 9:00 AM to 9:59 AM | 2 (1.0%) | 0 (0.0%) |
| 10:00 AM to 10:59 AM | 10 (5.0%) | 3 (1.3%) |
| 11:00 AM to 11:59 AM | 9 (4.5%) | 0 (0.0%) |
| 12:00 PM to 3:59 PM | 4 (2.0%) | 19 (8.0%) |
| 4:00 PM to 11:59 PM | 4 (2.0%) | 13 (5.5%) |
| Total | 201 (100.0%) | 238 (100.0%) |
Housing Occupancy in Millville borough
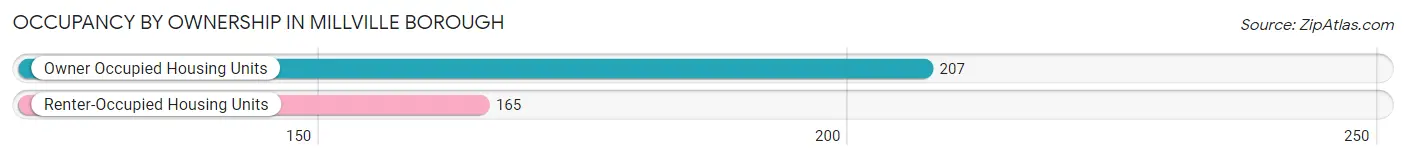
Occupancy by Ownership in Millville borough
Of the total 372 dwellings in Millville borough, owner-occupied units account for 207 (55.6%), while renter-occupied units make up 165 (44.4%).
| Occupancy | # Housing Units | % Housing Units |
| Owner Occupied Housing Units | 207 | 55.6% |
| Renter-Occupied Housing Units | 165 | 44.4% |
| Total Occupied Housing Units | 372 | 100.0% |
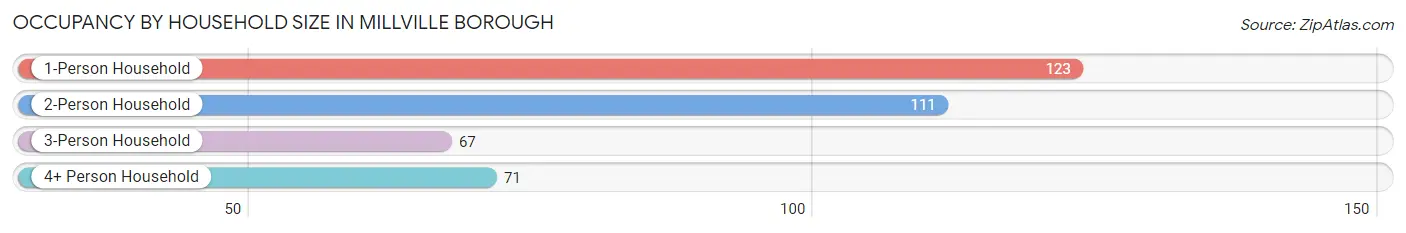
Occupancy by Household Size in Millville borough
| Household Size | # Housing Units | % Housing Units |
| 1-Person Household | 123 | 33.1% |
| 2-Person Household | 111 | 29.8% |
| 3-Person Household | 67 | 18.0% |
| 4+ Person Household | 71 | 19.1% |
| Total Housing Units | 372 | 100.0% |
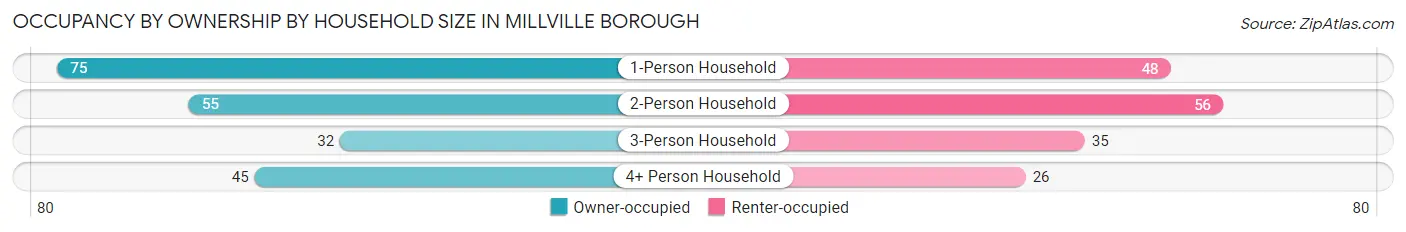
Occupancy by Ownership by Household Size in Millville borough
| Household Size | Owner-occupied | Renter-occupied |
| 1-Person Household | 75 (61.0%) | 48 (39.0%) |
| 2-Person Household | 55 (49.5%) | 56 (50.4%) |
| 3-Person Household | 32 (47.8%) | 35 (52.2%) |
| 4+ Person Household | 45 (63.4%) | 26 (36.6%) |
| Total Housing Units | 207 (55.6%) | 165 (44.4%) |
Occupancy by Educational Attainment in Millville borough
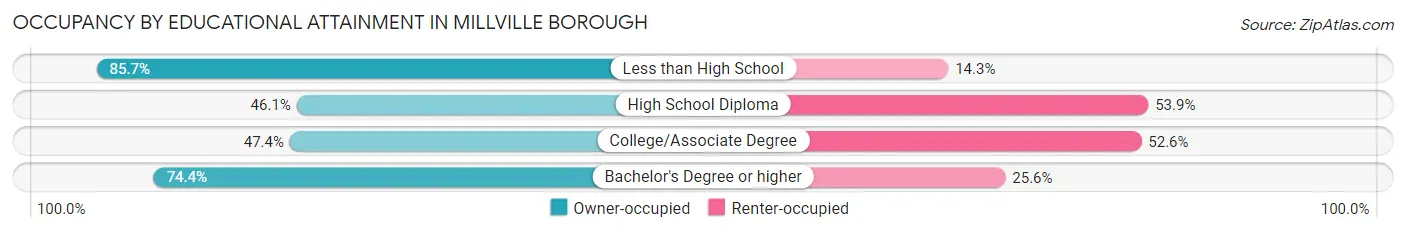
| Household Size | Owner-occupied | Renter-occupied |
| Less than High School | 24 (85.7%) | 4 (14.3%) |
| High School Diploma | 76 (46.1%) | 89 (53.9%) |
| College/Associate Degree | 46 (47.4%) | 51 (52.6%) |
| Bachelor's Degree or higher | 61 (74.4%) | 21 (25.6%) |
Occupancy by Age of Householder in Millville borough
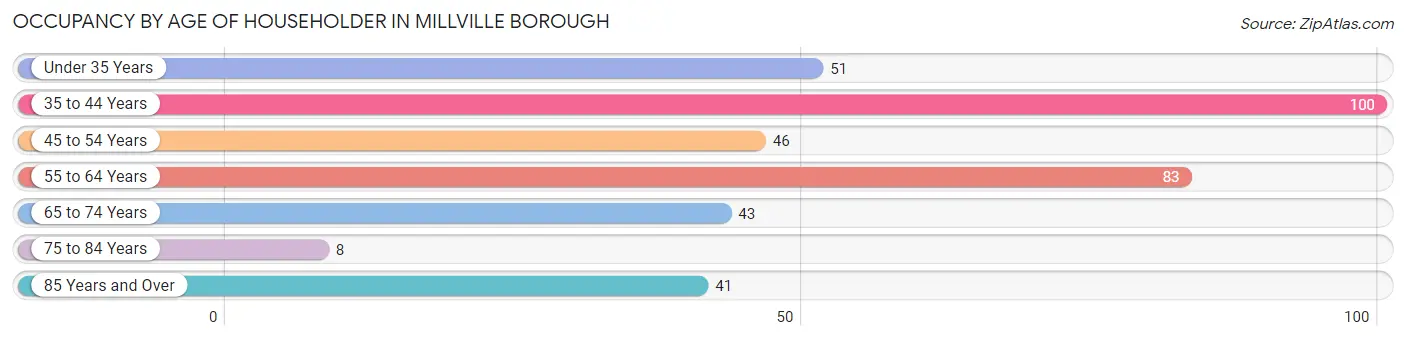
| Age Bracket | # Households | % Households |
| Under 35 Years | 51 | 13.7% |
| 35 to 44 Years | 100 | 26.9% |
| 45 to 54 Years | 46 | 12.4% |
| 55 to 64 Years | 83 | 22.3% |
| 65 to 74 Years | 43 | 11.6% |
| 75 to 84 Years | 8 | 2.1% |
| 85 Years and Over | 41 | 11.0% |
| Total | 372 | 100.0% |
Housing Finances in Millville borough
Median Income by Occupancy in Millville borough
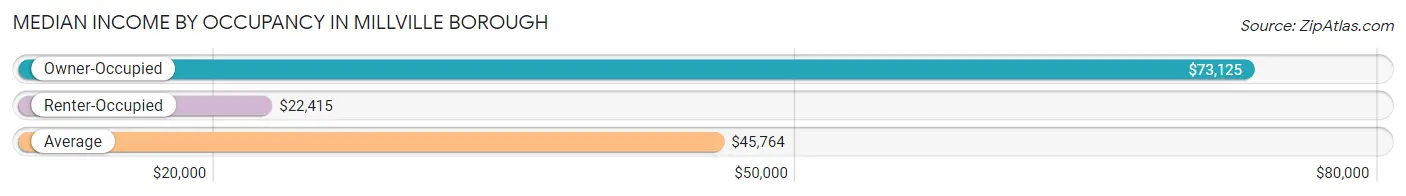
| Occupancy Type | # Households | Median Income |
| Owner-Occupied | 207 (55.6%) | $73,125 |
| Renter-Occupied | 165 (44.4%) | $22,415 |
| Average | 372 (100.0%) | $45,764 |
Occupancy by Householder Income Bracket in Millville borough
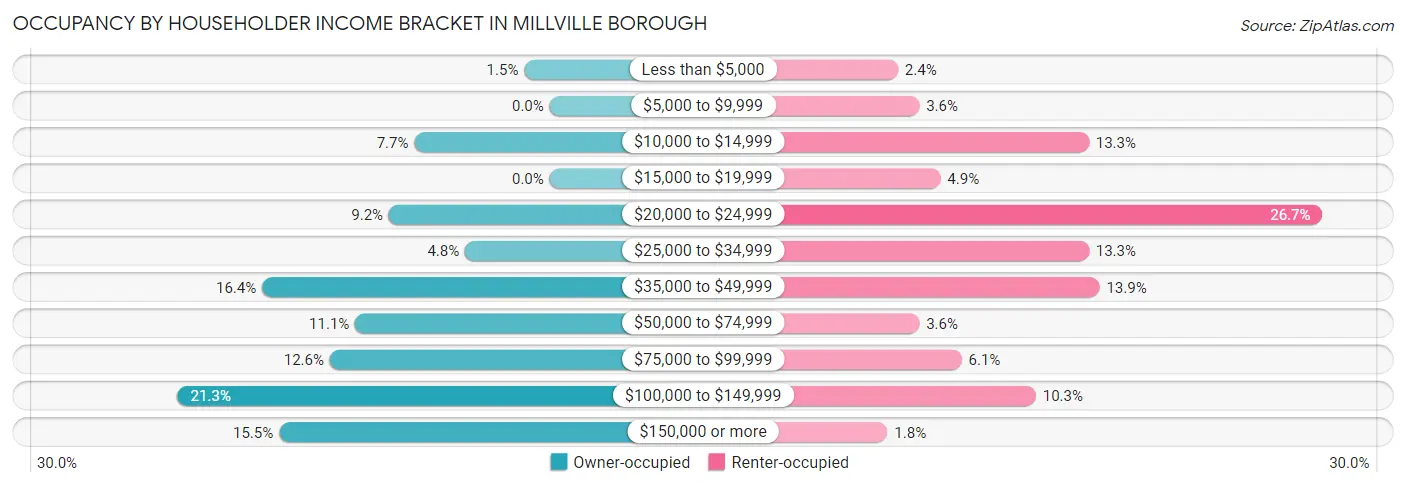
| Income Bracket | Owner-occupied | Renter-occupied |
| Less than $5,000 | 3 (1.5%) | 4 (2.4%) |
| $5,000 to $9,999 | 0 (0.0%) | 6 (3.6%) |
| $10,000 to $14,999 | 16 (7.7%) | 22 (13.3%) |
| $15,000 to $19,999 | 0 (0.0%) | 8 (4.9%) |
| $20,000 to $24,999 | 19 (9.2%) | 44 (26.7%) |
| $25,000 to $34,999 | 10 (4.8%) | 22 (13.3%) |
| $35,000 to $49,999 | 34 (16.4%) | 23 (13.9%) |
| $50,000 to $74,999 | 23 (11.1%) | 6 (3.6%) |
| $75,000 to $99,999 | 26 (12.6%) | 10 (6.1%) |
| $100,000 to $149,999 | 44 (21.3%) | 17 (10.3%) |
| $150,000 or more | 32 (15.5%) | 3 (1.8%) |
| Total | 207 (100.0%) | 165 (100.0%) |
Monthly Housing Cost Tiers in Millville borough
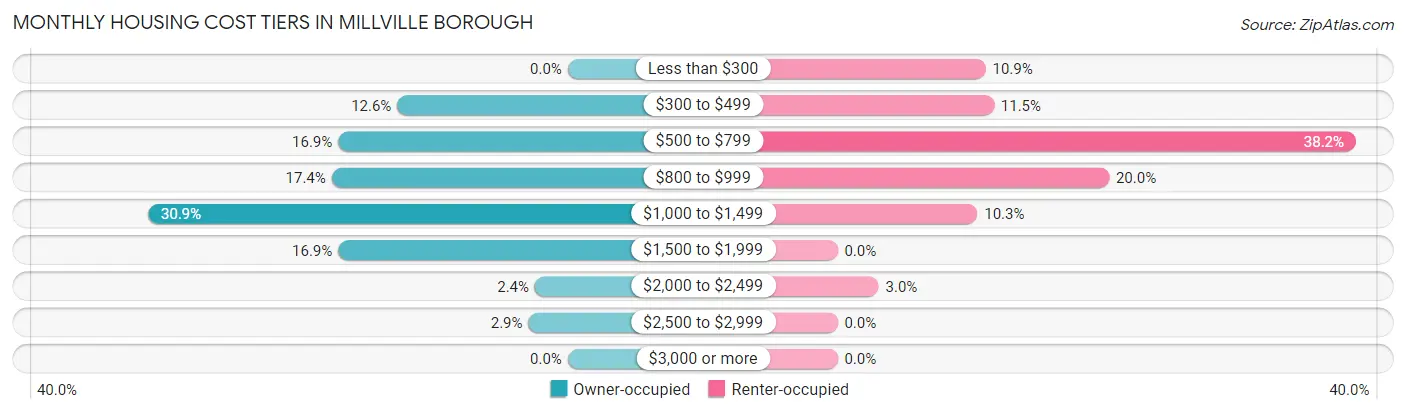
| Monthly Cost | Owner-occupied | Renter-occupied |
| Less than $300 | 0 (0.0%) | 18 (10.9%) |
| $300 to $499 | 26 (12.6%) | 19 (11.5%) |
| $500 to $799 | 35 (16.9%) | 63 (38.2%) |
| $800 to $999 | 36 (17.4%) | 33 (20.0%) |
| $1,000 to $1,499 | 64 (30.9%) | 17 (10.3%) |
| $1,500 to $1,999 | 35 (16.9%) | 0 (0.0%) |
| $2,000 to $2,499 | 5 (2.4%) | 5 (3.0%) |
| $2,500 to $2,999 | 6 (2.9%) | 0 (0.0%) |
| $3,000 or more | 0 (0.0%) | 0 (0.0%) |
| Total | 207 (100.0%) | 165 (100.0%) |
Physical Housing Characteristics in Millville borough
Housing Structures in Millville borough
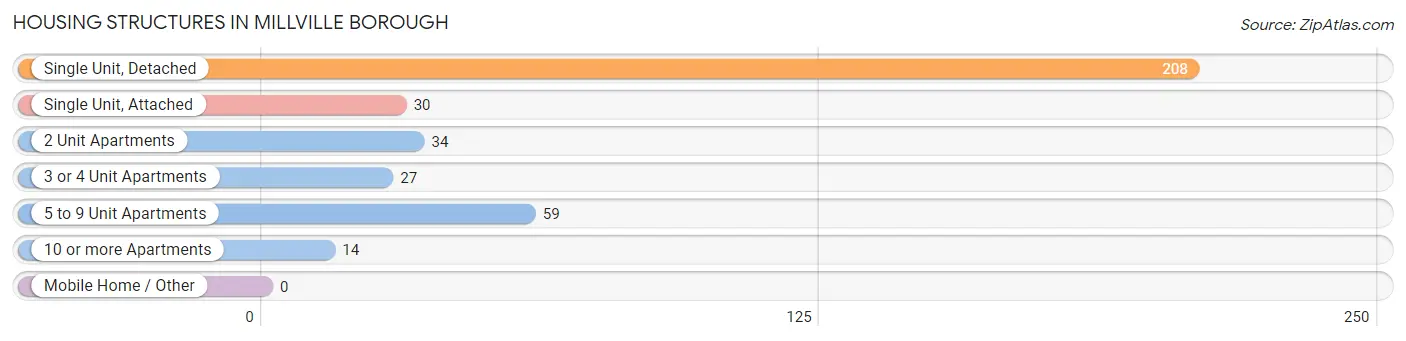
| Structure Type | # Housing Units | % Housing Units |
| Single Unit, Detached | 208 | 55.9% |
| Single Unit, Attached | 30 | 8.1% |
| 2 Unit Apartments | 34 | 9.1% |
| 3 or 4 Unit Apartments | 27 | 7.3% |
| 5 to 9 Unit Apartments | 59 | 15.9% |
| 10 or more Apartments | 14 | 3.8% |
| Mobile Home / Other | 0 | 0.0% |
| Total | 372 | 100.0% |
Housing Structures by Occupancy in Millville borough
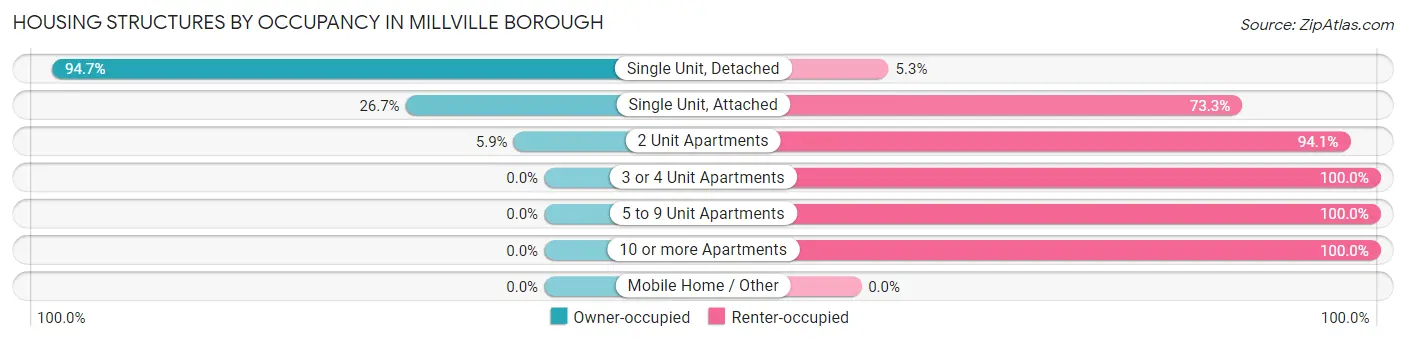
| Structure Type | Owner-occupied | Renter-occupied |
| Single Unit, Detached | 197 (94.7%) | 11 (5.3%) |
| Single Unit, Attached | 8 (26.7%) | 22 (73.3%) |
| 2 Unit Apartments | 2 (5.9%) | 32 (94.1%) |
| 3 or 4 Unit Apartments | 0 (0.0%) | 27 (100.0%) |
| 5 to 9 Unit Apartments | 0 (0.0%) | 59 (100.0%) |
| 10 or more Apartments | 0 (0.0%) | 14 (100.0%) |
| Mobile Home / Other | 0 (0.0%) | 0 (0.0%) |
| Total | 207 (55.6%) | 165 (44.4%) |
Housing Structures by Number of Rooms in Millville borough
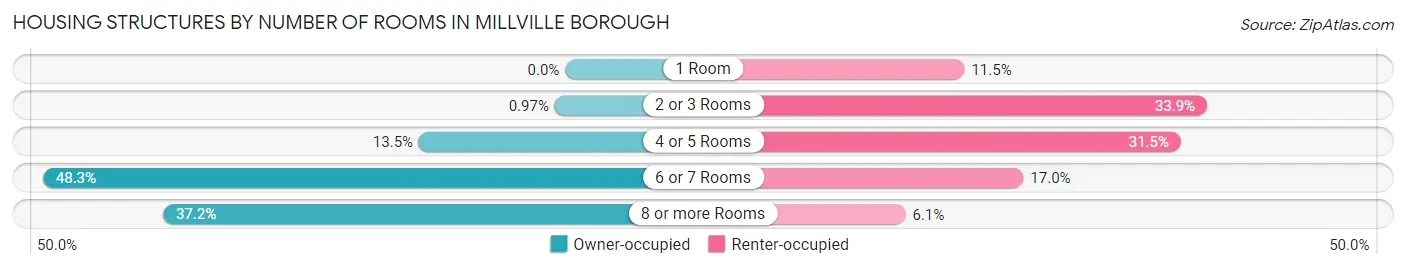
| Number of Rooms | Owner-occupied | Renter-occupied |
| 1 Room | 0 (0.0%) | 19 (11.5%) |
| 2 or 3 Rooms | 2 (1.0%) | 56 (33.9%) |
| 4 or 5 Rooms | 28 (13.5%) | 52 (31.5%) |
| 6 or 7 Rooms | 100 (48.3%) | 28 (17.0%) |
| 8 or more Rooms | 77 (37.2%) | 10 (6.1%) |
| Total | 207 (100.0%) | 165 (100.0%) |
Housing Structure by Heating Type in Millville borough
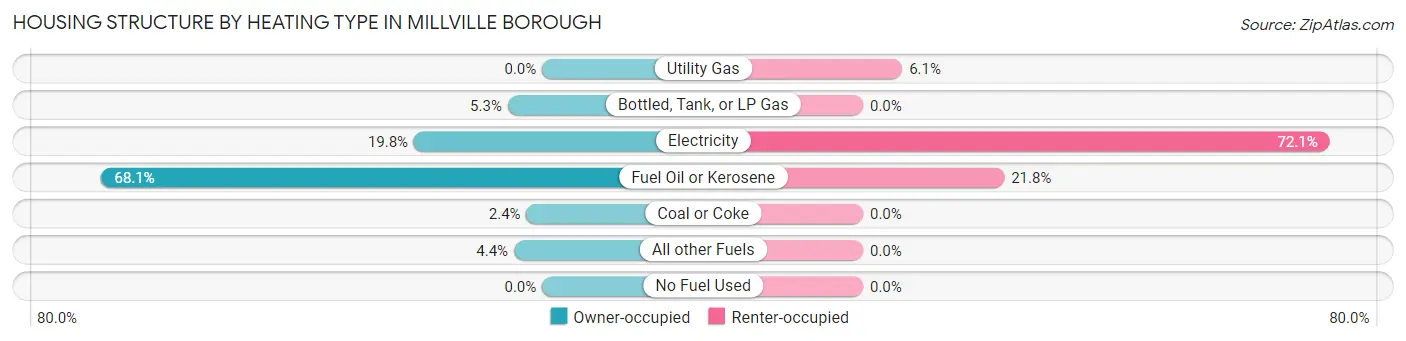
| Heating Type | Owner-occupied | Renter-occupied |
| Utility Gas | 0 (0.0%) | 10 (6.1%) |
| Bottled, Tank, or LP Gas | 11 (5.3%) | 0 (0.0%) |
| Electricity | 41 (19.8%) | 119 (72.1%) |
| Fuel Oil or Kerosene | 141 (68.1%) | 36 (21.8%) |
| Coal or Coke | 5 (2.4%) | 0 (0.0%) |
| All other Fuels | 9 (4.3%) | 0 (0.0%) |
| No Fuel Used | 0 (0.0%) | 0 (0.0%) |
| Total | 207 (100.0%) | 165 (100.0%) |
Household Vehicle Usage in Millville borough
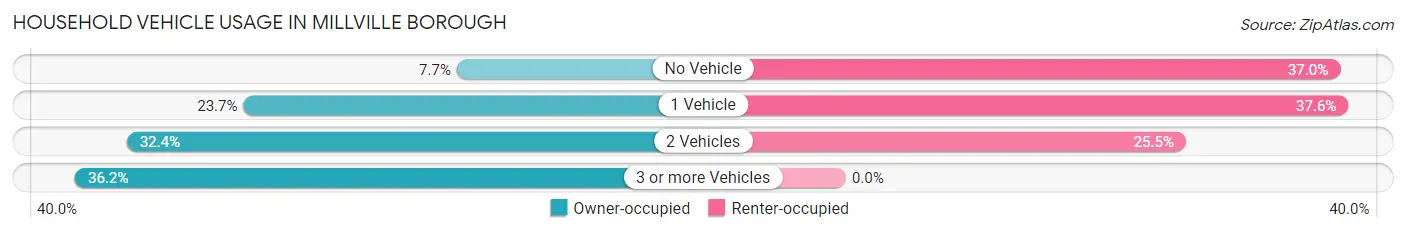
| Vehicles per Household | Owner-occupied | Renter-occupied |
| No Vehicle | 16 (7.7%) | 61 (37.0%) |
| 1 Vehicle | 49 (23.7%) | 62 (37.6%) |
| 2 Vehicles | 67 (32.4%) | 42 (25.5%) |
| 3 or more Vehicles | 75 (36.2%) | 0 (0.0%) |
| Total | 207 (100.0%) | 165 (100.0%) |
Real Estate & Mortgages in Millville borough
Real Estate and Mortgage Overview in Millville borough
| Characteristic | Without Mortgage | With Mortgage |
| Housing Units | 72 | 135 |
| Median Property Value | $217,900 | $181,500 |
| Median Household Income | - | - |
| Monthly Housing Costs | $534 | $0 |
| Real Estate Taxes | $2,250 | $0 |
Property Value by Mortgage Status in Millville borough
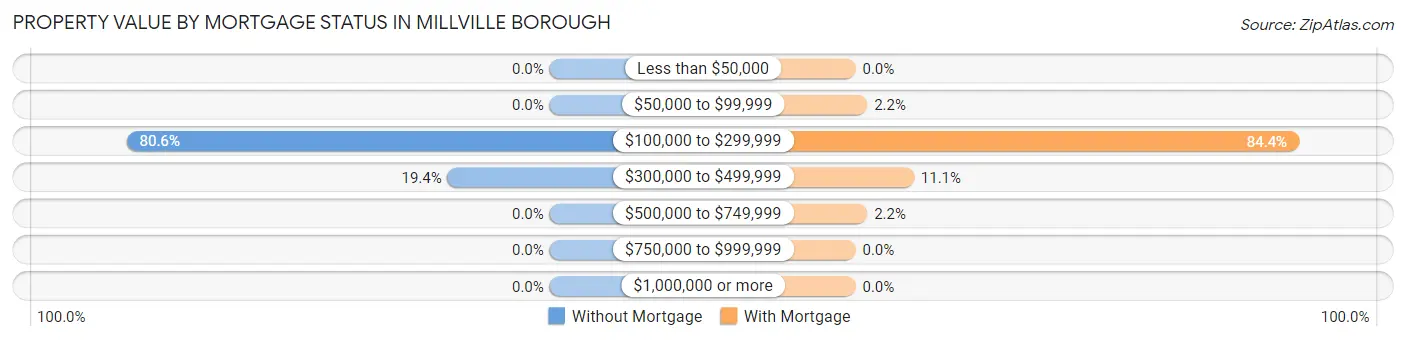
| Property Value | Without Mortgage | With Mortgage |
| Less than $50,000 | 0 (0.0%) | 0 (0.0%) |
| $50,000 to $99,999 | 0 (0.0%) | 3 (2.2%) |
| $100,000 to $299,999 | 58 (80.6%) | 114 (84.4%) |
| $300,000 to $499,999 | 14 (19.4%) | 15 (11.1%) |
| $500,000 to $749,999 | 0 (0.0%) | 3 (2.2%) |
| $750,000 to $999,999 | 0 (0.0%) | 0 (0.0%) |
| $1,000,000 or more | 0 (0.0%) | 0 (0.0%) |
| Total | 72 (100.0%) | 135 (100.0%) |
Household Income by Mortgage Status in Millville borough
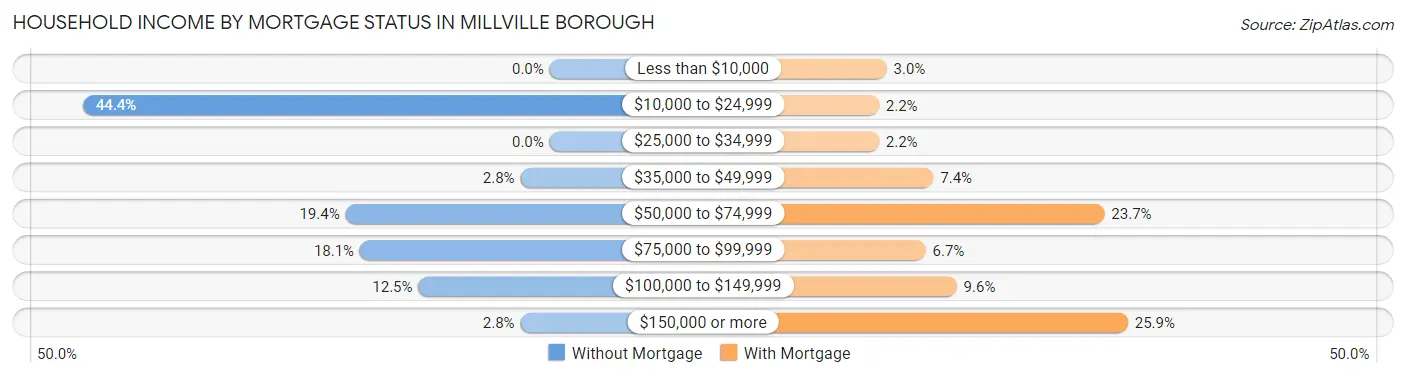
| Household Income | Without Mortgage | With Mortgage |
| Less than $10,000 | 0 (0.0%) | 4 (3.0%) |
| $10,000 to $24,999 | 32 (44.4%) | 3 (2.2%) |
| $25,000 to $34,999 | 0 (0.0%) | 3 (2.2%) |
| $35,000 to $49,999 | 2 (2.8%) | 10 (7.4%) |
| $50,000 to $74,999 | 14 (19.4%) | 32 (23.7%) |
| $75,000 to $99,999 | 13 (18.1%) | 9 (6.7%) |
| $100,000 to $149,999 | 9 (12.5%) | 13 (9.6%) |
| $150,000 or more | 2 (2.8%) | 35 (25.9%) |
| Total | 72 (100.0%) | 135 (100.0%) |
Property Value to Household Income Ratio in Millville borough
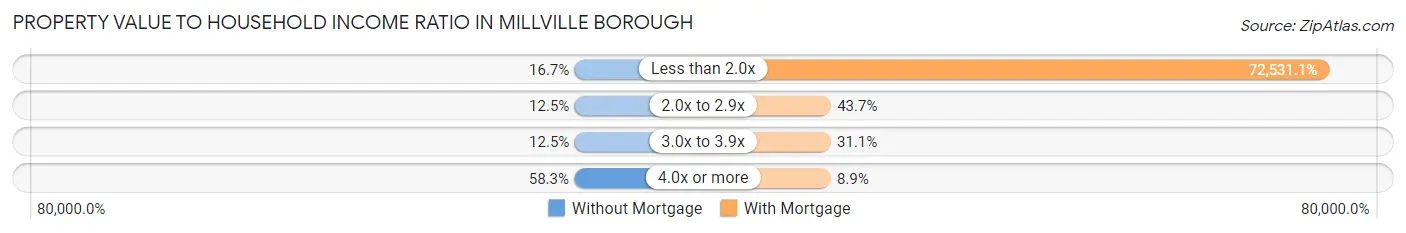
| Value-to-Income Ratio | Without Mortgage | With Mortgage |
| Less than 2.0x | 12 (16.7%) | 97,917 (72,531.1%) |
| 2.0x to 2.9x | 9 (12.5%) | 59 (43.7%) |
| 3.0x to 3.9x | 9 (12.5%) | 42 (31.1%) |
| 4.0x or more | 42 (58.3%) | 12 (8.9%) |
| Total | 72 (100.0%) | 135 (100.0%) |
Real Estate Taxes by Mortgage Status in Millville borough
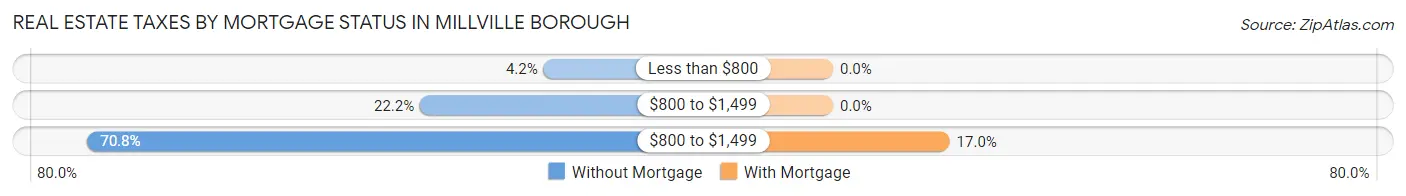
| Property Taxes | Without Mortgage | With Mortgage |
| Less than $800 | 3 (4.2%) | 0 (0.0%) |
| $800 to $1,499 | 16 (22.2%) | 0 (0.0%) |
| $800 to $1,499 | 51 (70.8%) | 23 (17.0%) |
| Total | 72 (100.0%) | 135 (100.0%) |
Health & Disability in Millville borough
Health Insurance Coverage by Age in Millville borough
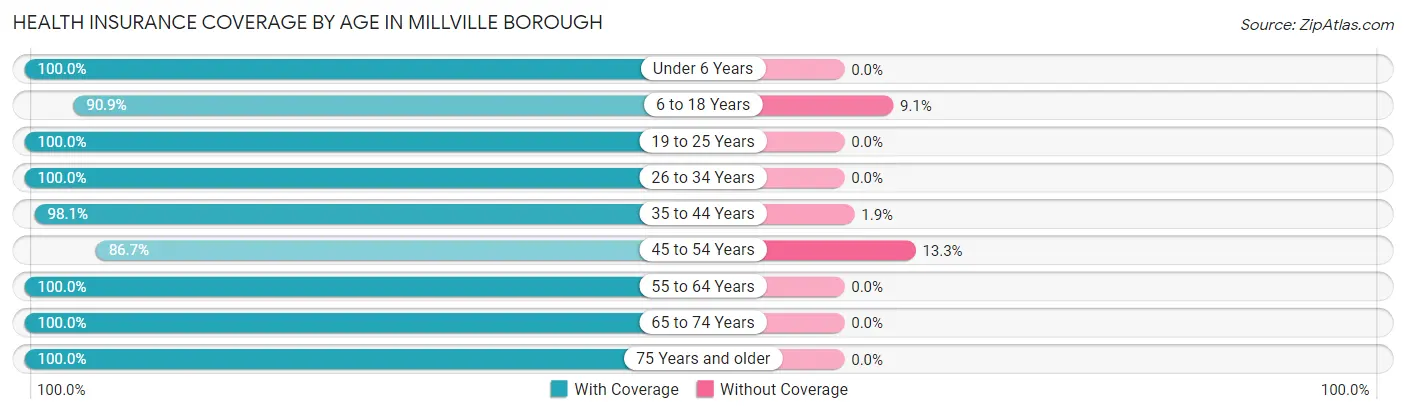
| Age Bracket | With Coverage | Without Coverage |
| Under 6 Years | 41 (100.0%) | 0 (0.0%) |
| 6 to 18 Years | 110 (90.9%) | 11 (9.1%) |
| 19 to 25 Years | 131 (100.0%) | 0 (0.0%) |
| 26 to 34 Years | 84 (100.0%) | 0 (0.0%) |
| 35 to 44 Years | 157 (98.1%) | 3 (1.9%) |
| 45 to 54 Years | 98 (86.7%) | 15 (13.3%) |
| 55 to 64 Years | 117 (100.0%) | 0 (0.0%) |
| 65 to 74 Years | 54 (100.0%) | 0 (0.0%) |
| 75 Years and older | 68 (100.0%) | 0 (0.0%) |
| Total | 860 (96.7%) | 29 (3.3%) |
Health Insurance Coverage by Citizenship Status in Millville borough
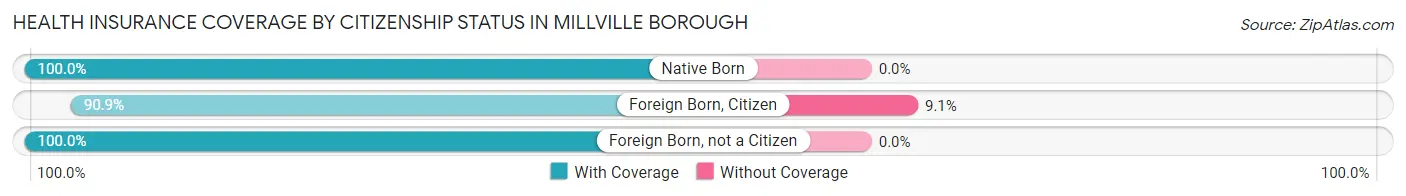
| Citizenship Status | With Coverage | Without Coverage |
| Native Born | 41 (100.0%) | 0 (0.0%) |
| Foreign Born, Citizen | 110 (90.9%) | 11 (9.1%) |
| Foreign Born, not a Citizen | 131 (100.0%) | 0 (0.0%) |
Health Insurance Coverage by Household Income in Millville borough
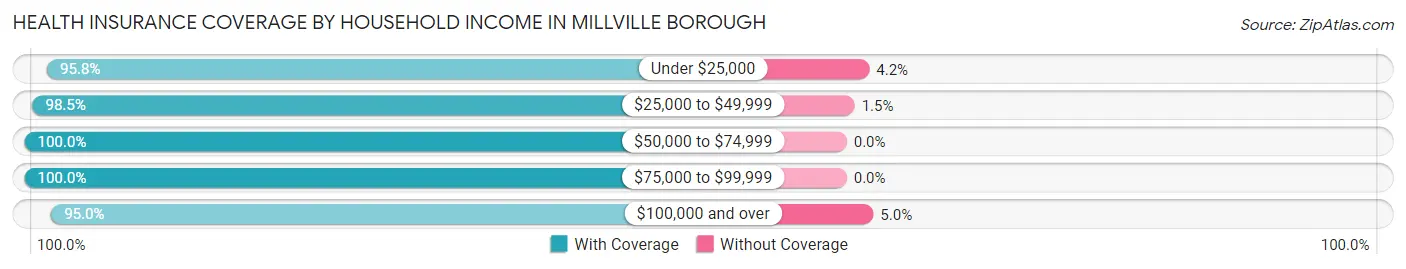
| Household Income | With Coverage | Without Coverage |
| Under $25,000 | 181 (95.8%) | 8 (4.2%) |
| $25,000 to $49,999 | 199 (98.5%) | 3 (1.5%) |
| $50,000 to $74,999 | 53 (100.0%) | 0 (0.0%) |
| $75,000 to $99,999 | 84 (100.0%) | 0 (0.0%) |
| $100,000 and over | 343 (95.0%) | 18 (5.0%) |
Public vs Private Health Insurance Coverage by Age in Millville borough
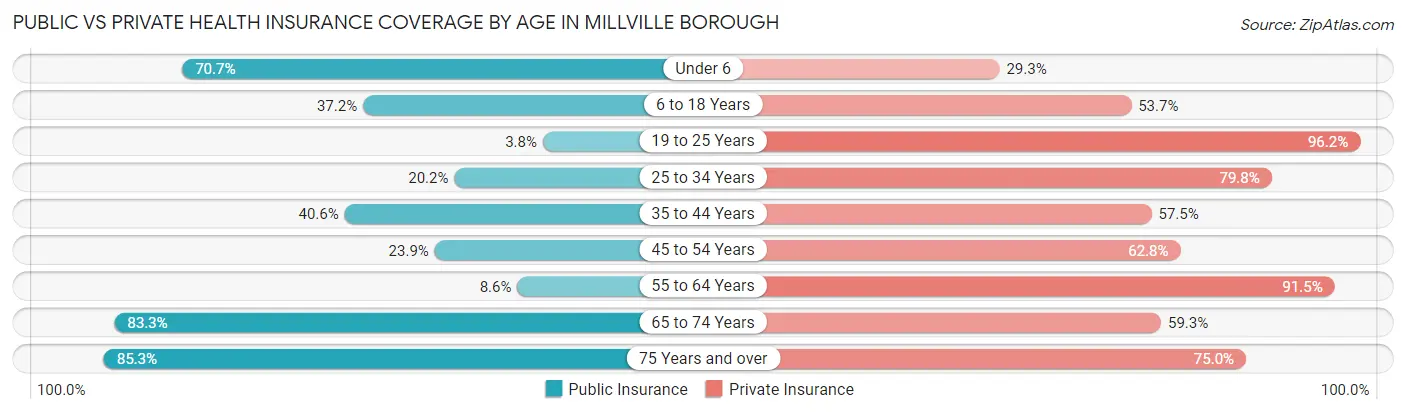
| Age Bracket | Public Insurance | Private Insurance |
| Under 6 | 29 (70.7%) | 12 (29.3%) |
| 6 to 18 Years | 45 (37.2%) | 65 (53.7%) |
| 19 to 25 Years | 5 (3.8%) | 126 (96.2%) |
| 25 to 34 Years | 17 (20.2%) | 67 (79.8%) |
| 35 to 44 Years | 65 (40.6%) | 92 (57.5%) |
| 45 to 54 Years | 27 (23.9%) | 71 (62.8%) |
| 55 to 64 Years | 10 (8.6%) | 107 (91.4%) |
| 65 to 74 Years | 45 (83.3%) | 32 (59.3%) |
| 75 Years and over | 58 (85.3%) | 51 (75.0%) |
| Total | 301 (33.9%) | 623 (70.1%) |
Disability Status by Sex by Age in Millville borough
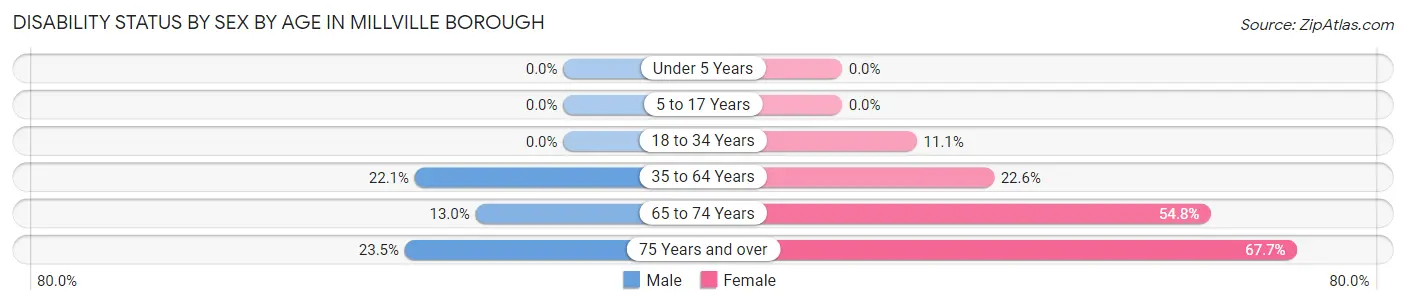
| Age Bracket | Male | Female |
| Under 5 Years | 0 (0.0%) | 0 (0.0%) |
| 5 to 17 Years | 0 (0.0%) | 0 (0.0%) |
| 18 to 34 Years | 0 (0.0%) | 17 (11.1%) |
| 35 to 64 Years | 43 (22.1%) | 44 (22.6%) |
| 65 to 74 Years | 3 (13.0%) | 17 (54.8%) |
| 75 Years and over | 8 (23.5%) | 23 (67.6%) |
Disability Class by Sex by Age in Millville borough
Disability Class: Hearing Difficulty
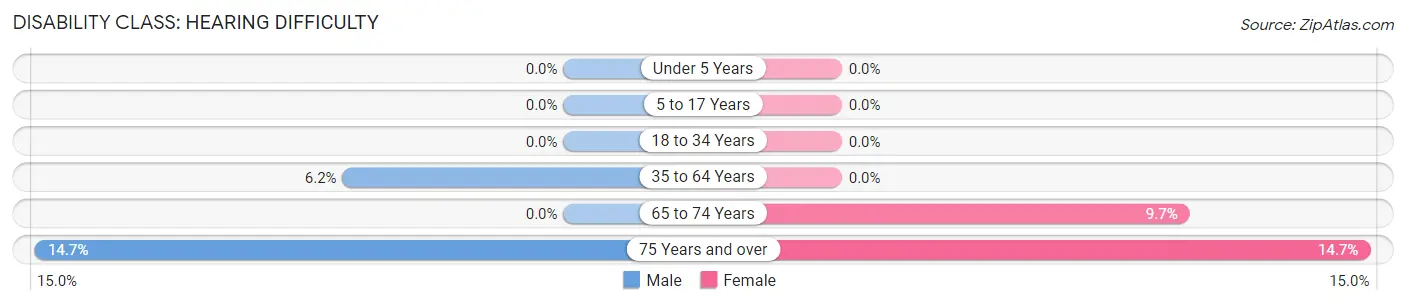
| Age Bracket | Male | Female |
| Under 5 Years | 0 (0.0%) | 0 (0.0%) |
| 5 to 17 Years | 0 (0.0%) | 0 (0.0%) |
| 18 to 34 Years | 0 (0.0%) | 0 (0.0%) |
| 35 to 64 Years | 12 (6.1%) | 0 (0.0%) |
| 65 to 74 Years | 0 (0.0%) | 3 (9.7%) |
| 75 Years and over | 5 (14.7%) | 5 (14.7%) |
Disability Class: Vision Difficulty
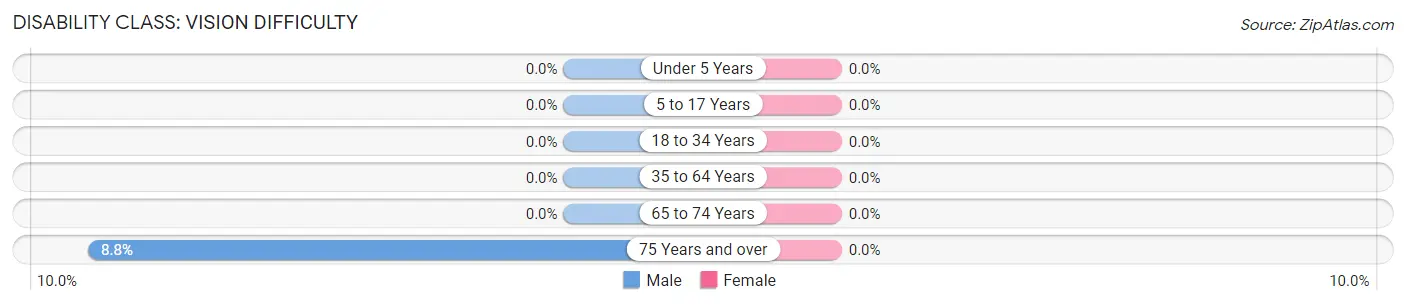
| Age Bracket | Male | Female |
| Under 5 Years | 0 (0.0%) | 0 (0.0%) |
| 5 to 17 Years | 0 (0.0%) | 0 (0.0%) |
| 18 to 34 Years | 0 (0.0%) | 0 (0.0%) |
| 35 to 64 Years | 0 (0.0%) | 0 (0.0%) |
| 65 to 74 Years | 0 (0.0%) | 0 (0.0%) |
| 75 Years and over | 3 (8.8%) | 0 (0.0%) |
Disability Class: Cognitive Difficulty
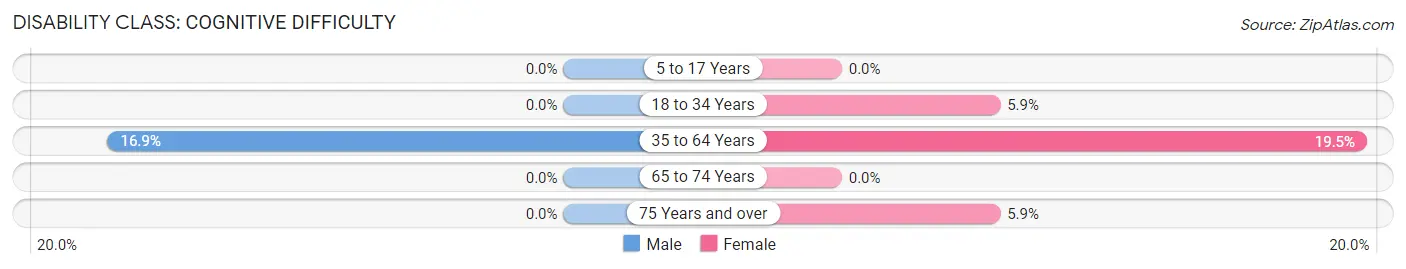
| Age Bracket | Male | Female |
| 5 to 17 Years | 0 (0.0%) | 0 (0.0%) |
| 18 to 34 Years | 0 (0.0%) | 9 (5.9%) |
| 35 to 64 Years | 33 (16.9%) | 38 (19.5%) |
| 65 to 74 Years | 0 (0.0%) | 0 (0.0%) |
| 75 Years and over | 0 (0.0%) | 2 (5.9%) |
Disability Class: Ambulatory Difficulty
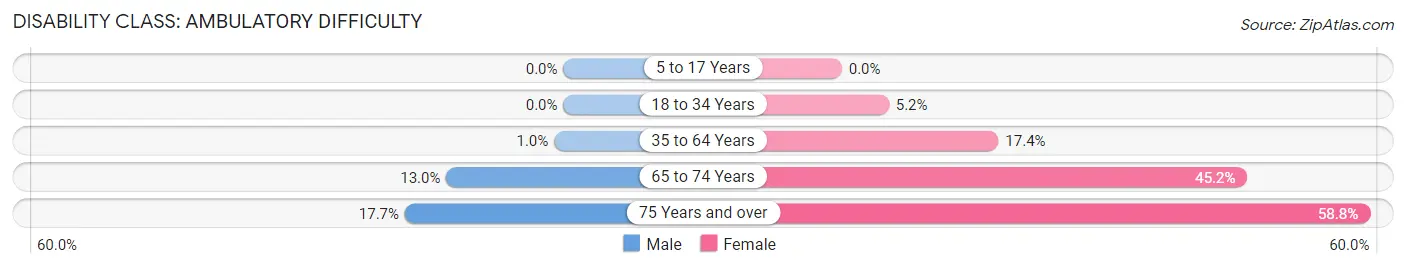
| Age Bracket | Male | Female |
| 5 to 17 Years | 0 (0.0%) | 0 (0.0%) |
| 18 to 34 Years | 0 (0.0%) | 8 (5.2%) |
| 35 to 64 Years | 2 (1.0%) | 34 (17.4%) |
| 65 to 74 Years | 3 (13.0%) | 14 (45.2%) |
| 75 Years and over | 6 (17.6%) | 20 (58.8%) |
Disability Class: Self-Care Difficulty
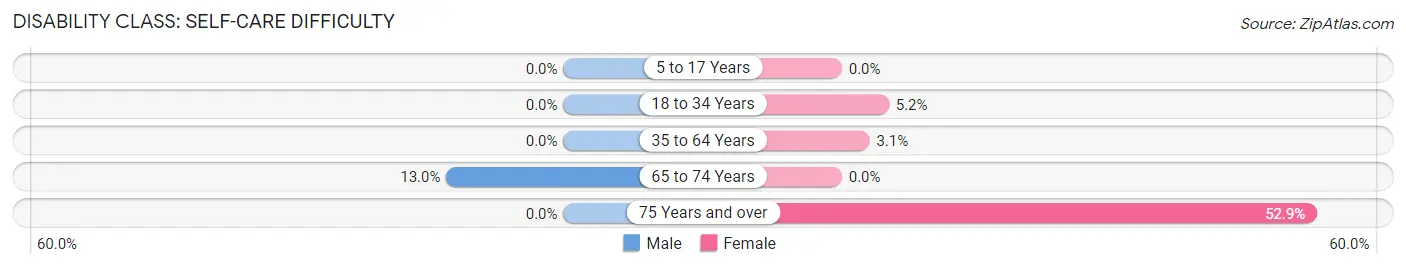
| Age Bracket | Male | Female |
| 5 to 17 Years | 0 (0.0%) | 0 (0.0%) |
| 18 to 34 Years | 0 (0.0%) | 8 (5.2%) |
| 35 to 64 Years | 0 (0.0%) | 6 (3.1%) |
| 65 to 74 Years | 3 (13.0%) | 0 (0.0%) |
| 75 Years and over | 0 (0.0%) | 18 (52.9%) |
Technology Access in Millville borough
Computing Device Access in Millville borough
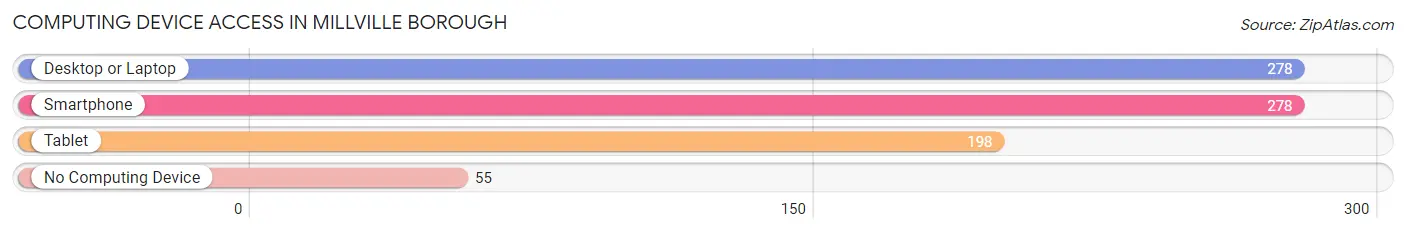
| Device Type | # Households | % Households |
| Desktop or Laptop | 278 | 74.7% |
| Smartphone | 278 | 74.7% |
| Tablet | 198 | 53.2% |
| No Computing Device | 55 | 14.8% |
| Total | 372 | 100.0% |
Internet Access in Millville borough
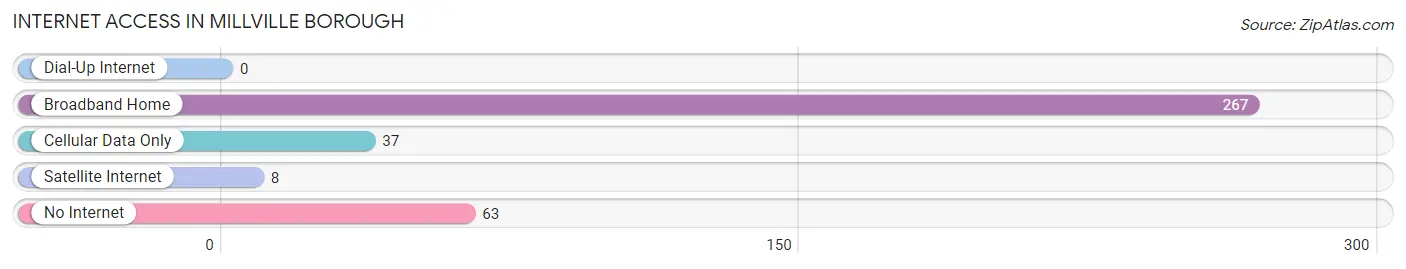
| Internet Type | # Households | % Households |
| Dial-Up Internet | 0 | 0.0% |
| Broadband Home | 267 | 71.8% |
| Cellular Data Only | 37 | 10.0% |
| Satellite Internet | 8 | 2.1% |
| No Internet | 63 | 16.9% |
| Total | 372 | 100.0% |
Millville borough Summary
Millville Borough is a small borough located in Columbia County, Pennsylvania. It is situated in the western part of the county, approximately 10 miles south of Bloomsburg. The population of Millville Borough was 1,093 at the 2010 census.
History
Millville Borough was first settled in 1790 by a group of German immigrants. The town was originally known as “Millersburg”, but the name was changed to Millville in 1820. The town was incorporated in 1845.
Millville was an important stop on the Bloomsburg and Sullivan Railroad, which ran from Bloomsburg to Millville and then on to Sullivan County. The railroad was built in 1871 and was an important part of the local economy. The railroad was eventually abandoned in the 1950s.
Geography
Millville Borough is located at 40°59'N 76°25'W (40.983, -76.417). It is situated in the western part of Columbia County, approximately 10 miles south of Bloomsburg. The borough is bordered by Fishing Creek Township to the north, Catawissa Township to the east, and Roaring Creek Township to the south and west.
The borough has a total area of 0.6 square miles, all of which is land. The terrain is mostly flat, with some rolling hills. The borough is located in the Appalachian Mountains and is part of the Ridge and Valley physiographic province.
Economy
The economy of Millville Borough is largely based on agriculture and tourism. The borough is home to several small farms, which produce a variety of crops, including corn, soybeans, hay, and wheat. The borough also has several small businesses, including a grocery store, a hardware store, and a restaurant.
Tourism is an important part of the local economy. The borough is home to several attractions, including the Millville Historic District, which is listed on the National Register of Historic Places. The district includes several historic buildings, including the Millville Hotel, which was built in 1845. The borough also has several parks, including the Millville Community Park, which features a playground, picnic areas, and a walking trail.
Demographics
As of the 2010 census, there were 1,093 people, 441 households, and 294 families residing in the borough. The population density was 1,817.5 people per square mile (700.3/km2). There were 471 housing units at an average density of 781.7 per square mile (301.7/km2). The racial makeup of the borough was 97.7% White, 0.5% African American, 0.2% Native American, 0.2% Asian, 0.2% from other races, and 1.2% from two or more races. Hispanic or Latino of any race were 0.7% of the population.
There were 441 households, out of which 28.2% had children under the age of 18 living with them, 48.2% were married couples living together, 11.3% had a female householder with no husband present, and 34.7% were non-families. 29.2% of all households were made up of individuals, and 14.3% had someone living alone who was 65 years of age or older. The average household size was 2.47 and the average family size was 3.04.
In the borough, the population was spread out, with 24.2% under the age of 18, 7.2% from 18 to 24, 27.2% from 25 to 44, 24.2% from 45 to 64, and 17.2% who were 65 years of age or older. The median age was 39 years. For every 100 females, there were 94.2 males. For every 100 females age 18 and over, there were 91.2 males.
The median income for a household in the borough was $35,000, and the median income for a family was $41,250. Males had a median income of $30,000 versus $21,250 for females. The per capita income for the borough was $17,845. About 8.2% of families and 10.2% of the population were below the poverty line, including 14.3% of those under age 18 and 8.3% of those age 65 or over.
Common Questions
What is Per Capita Income in Millville borough?
Per Capita income in Millville borough is $27,933.
What is the Median Family Income in Millville borough?
Median Family Income in Millville borough is $83,359.
What is the Median Household income in Millville borough?
Median Household Income in Millville borough is $45,764.
What is Income or Wage Gap in Millville borough?
Income or Wage Gap in Millville borough is 22.1%.
Women in Millville borough earn 77.9 cents for every dollar earned by a man.
What is Inequality or Gini Index in Millville borough?
Inequality or Gini Index in Millville borough is 0.47.
What is the Total Population of Millville borough?
Total Population of Millville borough is 1,000.
What is the Total Male Population of Millville borough?
Total Male Population of Millville borough is 474.
What is the Total Female Population of Millville borough?
Total Female Population of Millville borough is 526.
What is the Ratio of Males per 100 Females in Millville borough?
There are 90.11 Males per 100 Females in Millville borough.
What is the Ratio of Females per 100 Males in Millville borough?
There are 110.97 Females per 100 Males in Millville borough.
What is the Median Population Age in Millville borough?
Median Population Age in Millville borough is 42.3 Years.
What is the Average Family Size in Millville borough
Average Family Size in Millville borough is 3.2 People.
What is the Average Household Size in Millville borough
Average Household Size in Millville borough is 2.4 People.
How Large is the Labor Force in Millville borough?
There are 497 People in the Labor Forcein in Millville borough.
What is the Percentage of People in the Labor Force in Millville borough?
56.3% of People are in the Labor Force in Millville borough.
What is the Unemployment Rate in Millville borough?
Unemployment Rate in Millville borough is 3.4%.