Williamsburg borough, PA Map & Demographics
Williamsburg borough Overview
$27,389
PER CAPITA INCOME
$61,042
AVG FAMILY INCOME
$49,444
AVG HOUSEHOLD INCOME
17.2%
WAGE / INCOME GAP [ % ]
82.8¢/ $1
WAGE / INCOME GAP [ $ ]
0.46
INEQUALITY / GINI INDEX
1,202
TOTAL POPULATION
610
MALE POPULATION
592
FEMALE POPULATION
103.04
MALES / 100 FEMALES
97.05
FEMALES / 100 MALES
37.2
MEDIAN AGE
3.0
AVG FAMILY SIZE
2.4
AVG HOUSEHOLD SIZE
532
LABOR FORCE [ PEOPLE ]
55.9%
PERCENT IN LABOR FORCE
4.3%
UNEMPLOYMENT RATE
Income in Williamsburg borough
Income Overview in Williamsburg borough
Per Capita Income in Williamsburg borough is $27,389, while median incomes of families and households are $61,042 and $49,444 respectively.
| Characteristic | Number | Measure |
| Per Capita Income | 1,202 | $27,389 |
| Median Family Income | 306 | $61,042 |
| Mean Family Income | 306 | $78,798 |
| Median Household Income | 506 | $49,444 |
| Mean Household Income | 506 | $64,290 |
| Income Deficit | 306 | $0 |
| Wage / Income Gap (%) | 1,202 | 17.19% |
| Wage / Income Gap ($) | 1,202 | 82.81¢ per $1 |
| Gini / Inequality Index | 1,202 | 0.46 |
Earnings by Sex in Williamsburg borough
Average Earnings in Williamsburg borough are $33,897, $39,306 for men and $32,550 for women, a difference of 17.2%.
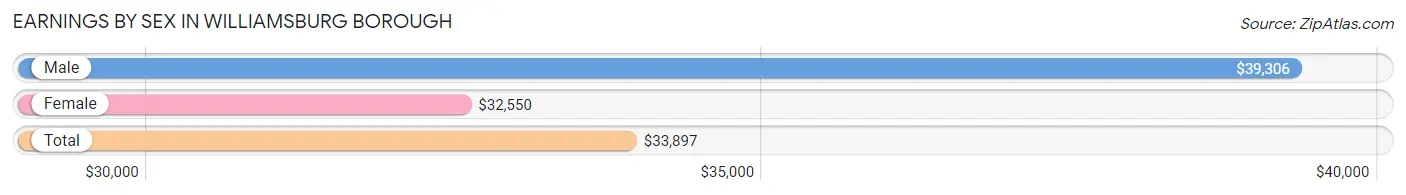
| Sex | Number | Average Earnings |
| Male | 327 (57.8%) | $39,306 |
| Female | 239 (42.2%) | $32,550 |
| Total | 566 (100.0%) | $33,897 |
Earnings by Sex by Income Bracket in Williamsburg borough
The most common earnings brackets in Williamsburg borough are $30,000 to $34,999 for men (31 | 9.5%) and $30,000 to $34,999 for women (25 | 10.5%).
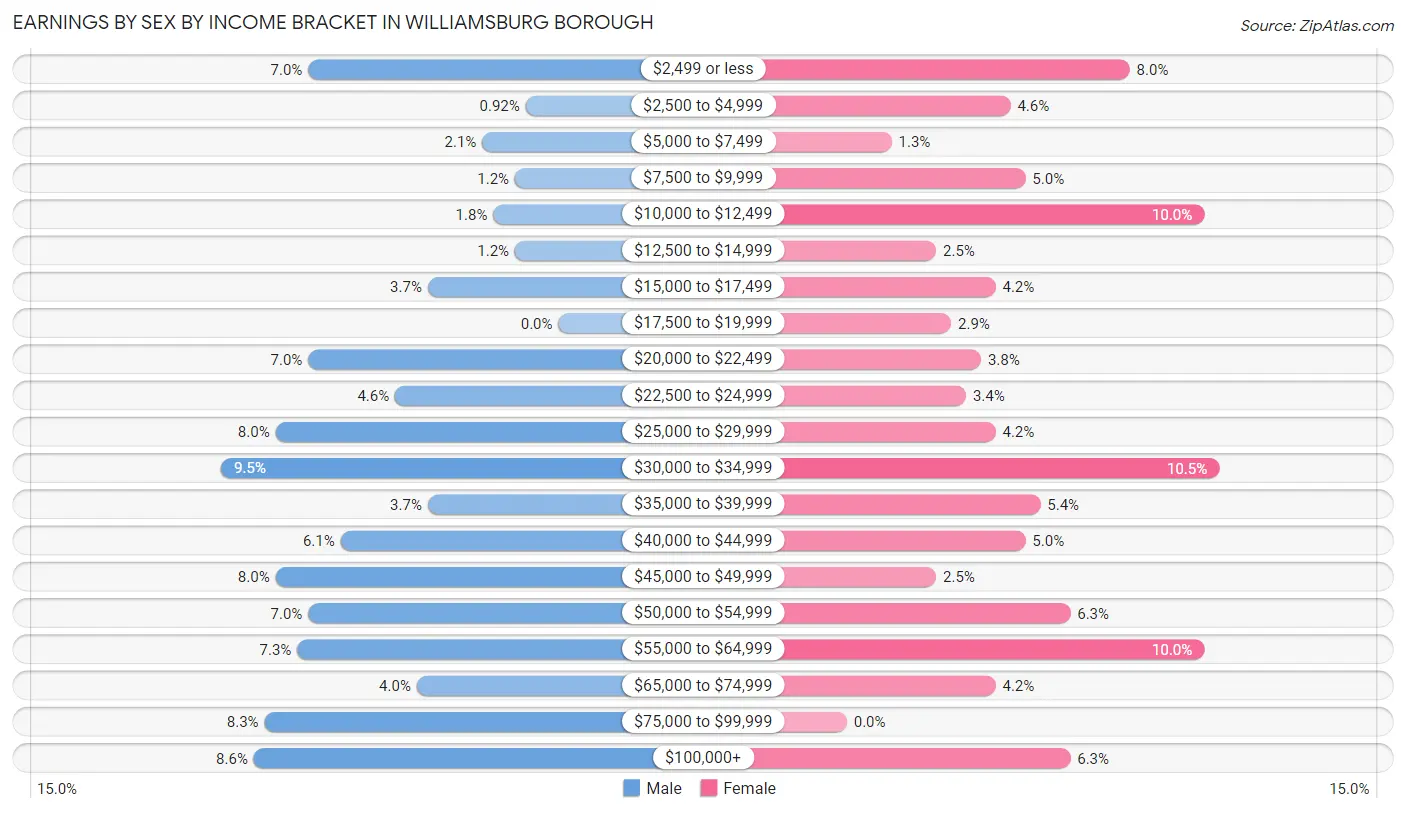
| Income | Male | Female |
| $2,499 or less | 23 (7.0%) | 19 (8.0%) |
| $2,500 to $4,999 | 3 (0.9%) | 11 (4.6%) |
| $5,000 to $7,499 | 7 (2.1%) | 3 (1.3%) |
| $7,500 to $9,999 | 4 (1.2%) | 12 (5.0%) |
| $10,000 to $12,499 | 6 (1.8%) | 24 (10.0%) |
| $12,500 to $14,999 | 4 (1.2%) | 6 (2.5%) |
| $15,000 to $17,499 | 12 (3.7%) | 10 (4.2%) |
| $17,500 to $19,999 | 0 (0.0%) | 7 (2.9%) |
| $20,000 to $22,499 | 23 (7.0%) | 9 (3.8%) |
| $22,500 to $24,999 | 15 (4.6%) | 8 (3.4%) |
| $25,000 to $29,999 | 26 (8.0%) | 10 (4.2%) |
| $30,000 to $34,999 | 31 (9.5%) | 25 (10.5%) |
| $35,000 to $39,999 | 12 (3.7%) | 13 (5.4%) |
| $40,000 to $44,999 | 20 (6.1%) | 12 (5.0%) |
| $45,000 to $49,999 | 26 (8.0%) | 6 (2.5%) |
| $50,000 to $54,999 | 23 (7.0%) | 15 (6.3%) |
| $55,000 to $64,999 | 24 (7.3%) | 24 (10.0%) |
| $65,000 to $74,999 | 13 (4.0%) | 10 (4.2%) |
| $75,000 to $99,999 | 27 (8.3%) | 0 (0.0%) |
| $100,000+ | 28 (8.6%) | 15 (6.3%) |
| Total | 327 (100.0%) | 239 (100.0%) |
Earnings by Sex by Educational Attainment in Williamsburg borough
Average earnings in Williamsburg borough are $43,456 for men and $34,926 for women, a difference of 19.6%. Men with an educational attainment of college or associate's degree enjoy the highest average annual earnings of $61,667, while those with high school diploma education earn the least with $38,333. Women with an educational attainment of bachelor's degree earn the most with the average annual earnings of $102,969, while those with high school diploma education have the smallest earnings of $31,250.
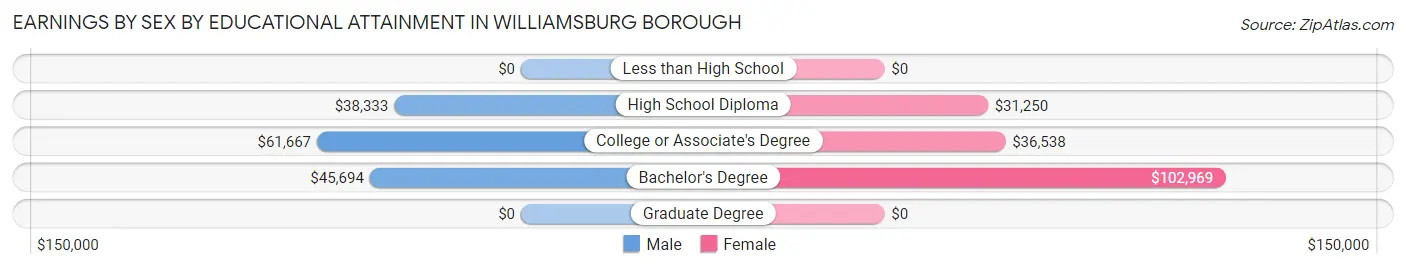
| Educational Attainment | Male Income | Female Income |
| Less than High School | - | - |
| High School Diploma | $38,333 | $31,250 |
| College or Associate's Degree | $61,667 | $36,538 |
| Bachelor's Degree | $45,694 | $102,969 |
| Graduate Degree | - | - |
| Total | $43,456 | $34,926 |
Family Income in Williamsburg borough
Family Income Brackets in Williamsburg borough
According to the Williamsburg borough family income data, there are 69 families falling into the $100,000 to $149,999 income range, which is the most common income bracket and makes up 22.6% of all families. Conversely, the $10,000 to $14,999 income bracket is the least frequent group with only 5 families (1.6%) belonging to this category.
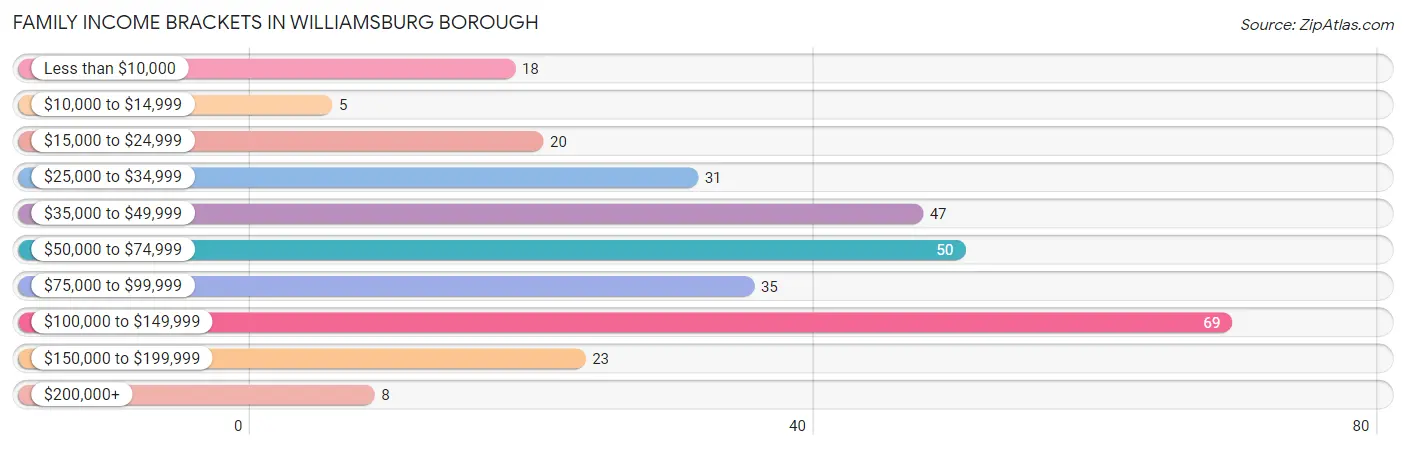
| Income Bracket | # Families | % Families |
| Less than $10,000 | 18 | 5.9% |
| $10,000 to $14,999 | 5 | 1.6% |
| $15,000 to $24,999 | 20 | 6.5% |
| $25,000 to $34,999 | 31 | 10.1% |
| $35,000 to $49,999 | 47 | 15.4% |
| $50,000 to $74,999 | 50 | 16.3% |
| $75,000 to $99,999 | 35 | 11.4% |
| $100,000 to $149,999 | 69 | 22.5% |
| $150,000 to $199,999 | 23 | 7.5% |
| $200,000+ | 8 | 2.6% |
Family Income by Famaliy Size in Williamsburg borough
3-person families (76 | 24.8%) account for the highest median family income in Williamsburg borough with $109,375 per family, while 3-person families (76 | 24.8%) have the highest median income of $36,458 per family member.
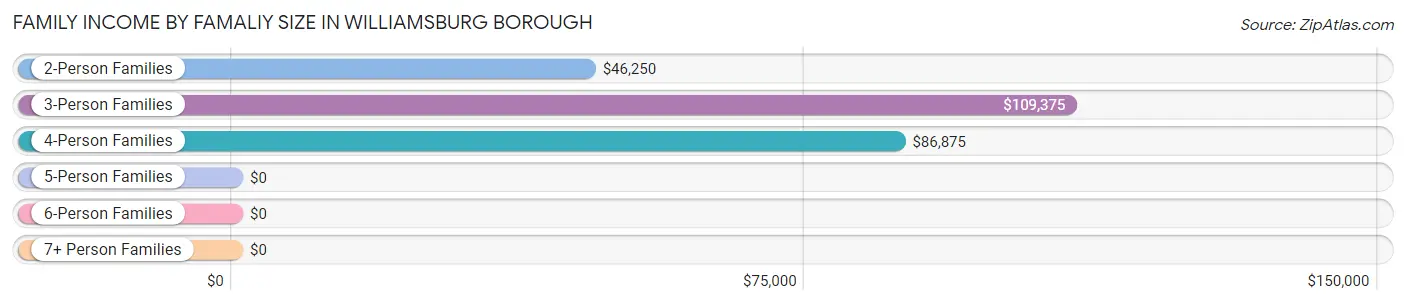
| Income Bracket | # Families | Median Income |
| 2-Person Families | 140 (45.8%) | $46,250 |
| 3-Person Families | 76 (24.8%) | $109,375 |
| 4-Person Families | 56 (18.3%) | $86,875 |
| 5-Person Families | 26 (8.5%) | $0 |
| 6-Person Families | 0 (0.0%) | $0 |
| 7+ Person Families | 8 (2.6%) | $0 |
| Total | 306 (100.0%) | $61,042 |
Family Income by Number of Earners in Williamsburg borough
The median family income in Williamsburg borough is $61,042, with families comprising 3+ earners (30) having the highest median family income of $147,000, while families with no earners (73) have the lowest median family income of $26,250, accounting for 9.8% and 23.9% of families, respectively.
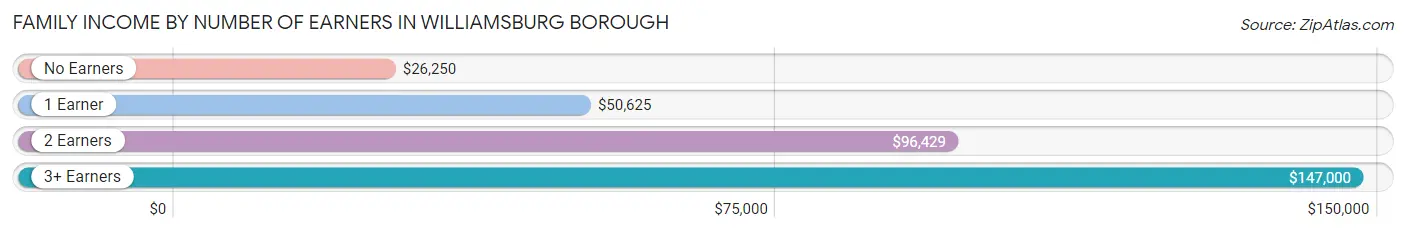
| Number of Earners | # Families | Median Income |
| No Earners | 73 (23.9%) | $26,250 |
| 1 Earner | 91 (29.7%) | $50,625 |
| 2 Earners | 112 (36.6%) | $96,429 |
| 3+ Earners | 30 (9.8%) | $147,000 |
| Total | 306 (100.0%) | $61,042 |
Household Income in Williamsburg borough
Household Income Brackets in Williamsburg borough
With 97 households falling in the category, the $50,000 to $74,999 income range is the most frequent in Williamsburg borough, accounting for 19.2% of all households. In contrast, only 13 households (2.6%) fall into the $200,000+ income bracket, making it the least populous group.
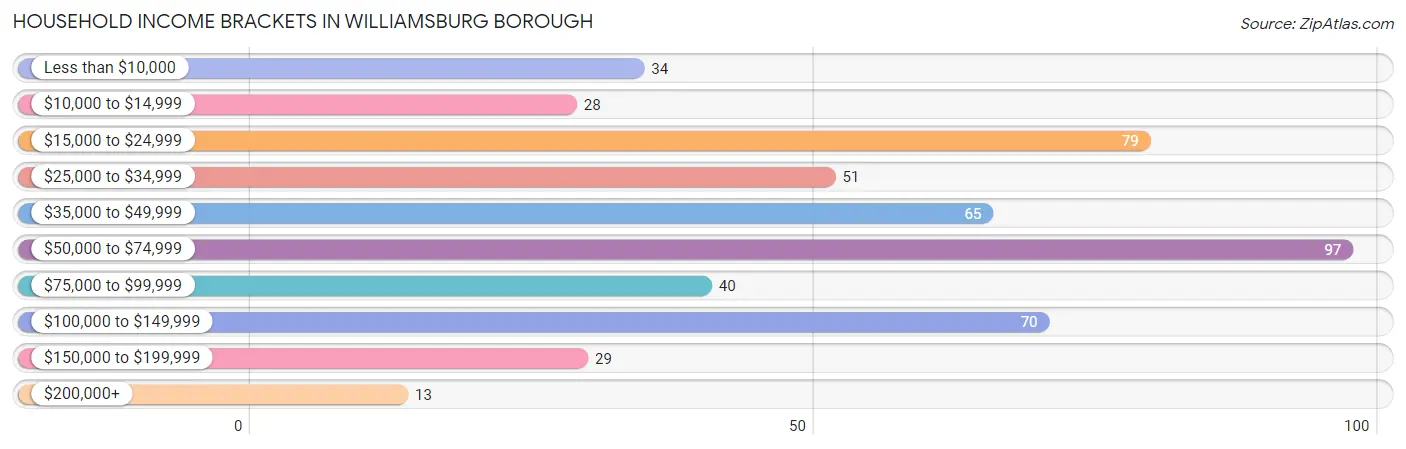
| Income Bracket | # Households | % Households |
| Less than $10,000 | 34 | 6.7% |
| $10,000 to $14,999 | 28 | 5.5% |
| $15,000 to $24,999 | 79 | 15.6% |
| $25,000 to $34,999 | 51 | 10.1% |
| $35,000 to $49,999 | 65 | 12.8% |
| $50,000 to $74,999 | 97 | 19.2% |
| $75,000 to $99,999 | 40 | 7.9% |
| $100,000 to $149,999 | 70 | 13.8% |
| $150,000 to $199,999 | 29 | 5.7% |
| $200,000+ | 13 | 2.6% |
Household Income by Householder Age in Williamsburg borough
The median household income in Williamsburg borough is $49,444, with the highest median household income of $85,417 found in the 15 to 24 years age bracket for the primary householder. A total of 23 households (4.5%) fall into this category. Meanwhile, the 65+ years age bracket for the primary householder has the lowest median household income of $27,054, with 157 households (31.0%) in this group.
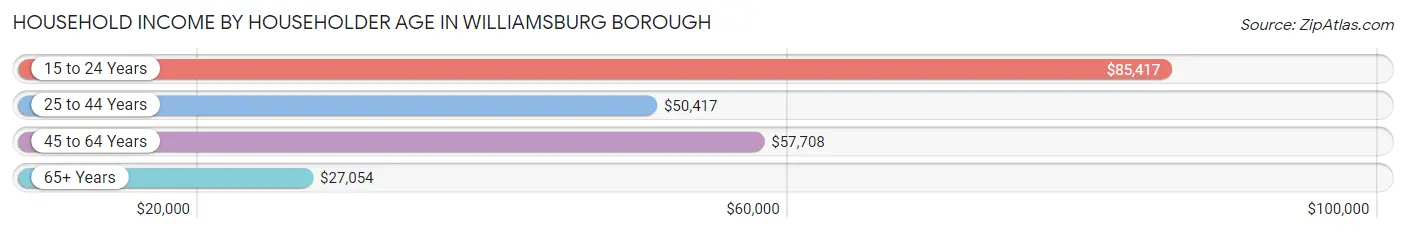
| Income Bracket | # Households | Median Income |
| 15 to 24 Years | 23 (4.5%) | $85,417 |
| 25 to 44 Years | 153 (30.2%) | $50,417 |
| 45 to 64 Years | 173 (34.2%) | $57,708 |
| 65+ Years | 157 (31.0%) | $27,054 |
| Total | 506 (100.0%) | $49,444 |
Poverty in Williamsburg borough
Income Below Poverty by Sex and Age in Williamsburg borough
With 14.6% poverty level for males and 18.6% for females among the residents of Williamsburg borough, 12 to 14 year old males and 5 year old females are the most vulnerable to poverty, with 3 males (100.0%) and 3 females (42.9%) in their respective age groups living below the poverty level.
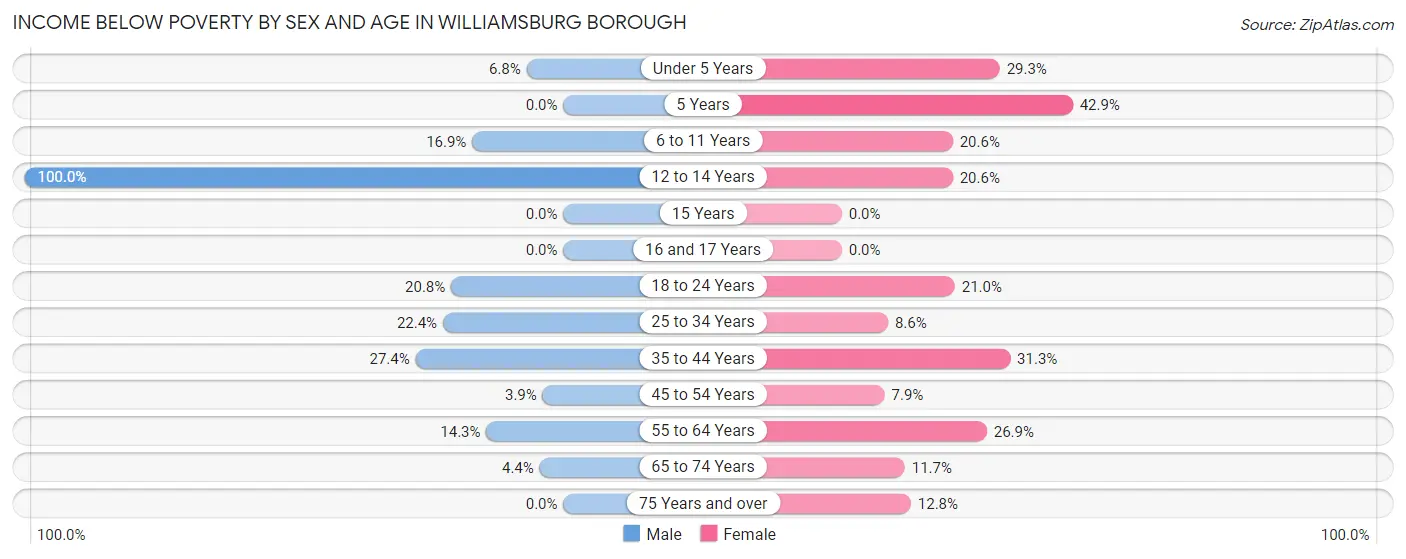
| Age Bracket | Male | Female |
| Under 5 Years | 3 (6.8%) | 17 (29.3%) |
| 5 Years | 0 (0.0%) | 3 (42.9%) |
| 6 to 11 Years | 11 (16.9%) | 7 (20.6%) |
| 12 to 14 Years | 3 (100.0%) | 7 (20.6%) |
| 15 Years | 0 (0.0%) | 0 (0.0%) |
| 16 and 17 Years | 0 (0.0%) | 0 (0.0%) |
| 18 to 24 Years | 10 (20.8%) | 13 (21.0%) |
| 25 to 34 Years | 19 (22.4%) | 6 (8.6%) |
| 35 to 44 Years | 31 (27.4%) | 15 (31.2%) |
| 45 to 54 Years | 3 (3.8%) | 5 (7.9%) |
| 55 to 64 Years | 6 (14.3%) | 21 (26.9%) |
| 65 to 74 Years | 3 (4.4%) | 11 (11.7%) |
| 75 Years and over | 0 (0.0%) | 5 (12.8%) |
| Total | 89 (14.6%) | 110 (18.6%) |
Income Above Poverty by Sex and Age in Williamsburg borough
According to the poverty statistics in Williamsburg borough, males aged 16 and 17 years and females aged 15 years are the age groups that are most secure financially, with 100.0% of males and 100.0% of females in these age groups living above the poverty line.
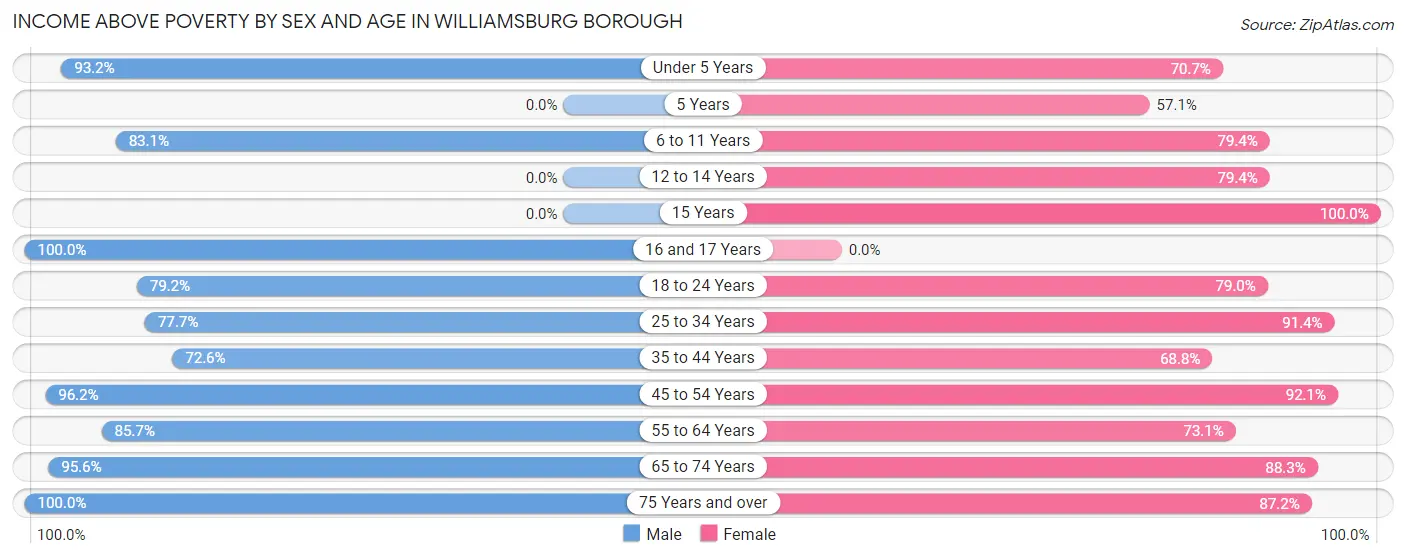
| Age Bracket | Male | Female |
| Under 5 Years | 41 (93.2%) | 41 (70.7%) |
| 5 Years | 0 (0.0%) | 4 (57.1%) |
| 6 to 11 Years | 54 (83.1%) | 27 (79.4%) |
| 12 to 14 Years | 0 (0.0%) | 27 (79.4%) |
| 15 Years | 0 (0.0%) | 5 (100.0%) |
| 16 and 17 Years | 24 (100.0%) | 0 (0.0%) |
| 18 to 24 Years | 38 (79.2%) | 49 (79.0%) |
| 25 to 34 Years | 66 (77.6%) | 64 (91.4%) |
| 35 to 44 Years | 82 (72.6%) | 33 (68.8%) |
| 45 to 54 Years | 75 (96.2%) | 58 (92.1%) |
| 55 to 64 Years | 36 (85.7%) | 57 (73.1%) |
| 65 to 74 Years | 65 (95.6%) | 83 (88.3%) |
| 75 Years and over | 40 (100.0%) | 34 (87.2%) |
| Total | 521 (85.4%) | 482 (81.4%) |
Income Below Poverty Among Married-Couple Families in Williamsburg borough
The poverty statistics for married-couple families in Williamsburg borough show that 10.8% or 23 of the total 213 families live below the poverty line. Families with 5 or more children have the highest poverty rate of 100.0%, comprising of 4 families. On the other hand, families with 3 or 4 children have the lowest poverty rate of 0.0%, which includes 0 families.
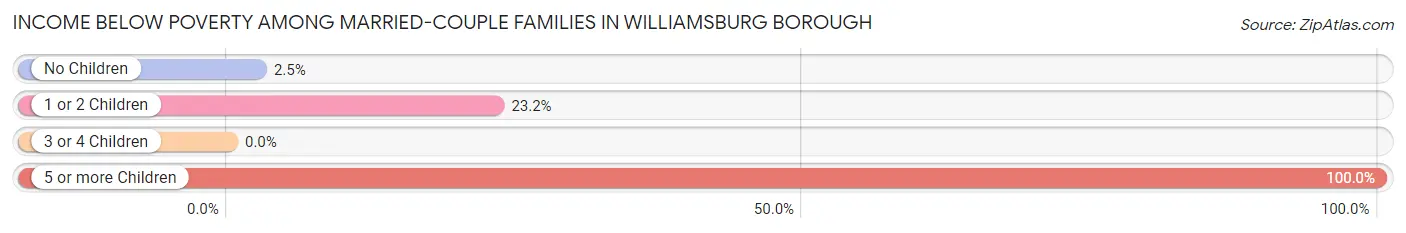
| Children | Above Poverty | Below Poverty |
| No Children | 116 (97.5%) | 3 (2.5%) |
| 1 or 2 Children | 53 (76.8%) | 16 (23.2%) |
| 3 or 4 Children | 21 (100.0%) | 0 (0.0%) |
| 5 or more Children | 0 (0.0%) | 4 (100.0%) |
| Total | 190 (89.2%) | 23 (10.8%) |
Income Below Poverty Among Single-Parent Households in Williamsburg borough
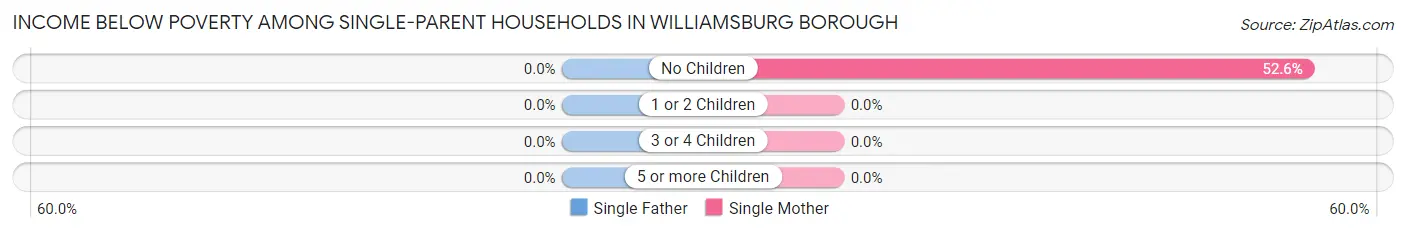
| Children | Single Father | Single Mother |
| No Children | 0 (0.0%) | 20 (52.6%) |
| 1 or 2 Children | 0 (0.0%) | 0 (0.0%) |
| 3 or 4 Children | 0 (0.0%) | 0 (0.0%) |
| 5 or more Children | 0 (0.0%) | 0 (0.0%) |
| Total | 0 (0.0%) | 20 (25.3%) |
Income Below Poverty Among Married-Couple vs Single-Parent Households in Williamsburg borough
The poverty data for Williamsburg borough shows that 23 of the married-couple family households (10.8%) and 20 of the single-parent households (21.5%) are living below the poverty level. Within the married-couple family households, those with 5 or more children have the highest poverty rate, with 4 households (100.0%) falling below the poverty line. Among the single-parent households, those with no children have the highest poverty rate, with 20 household (45.5%) living below poverty.
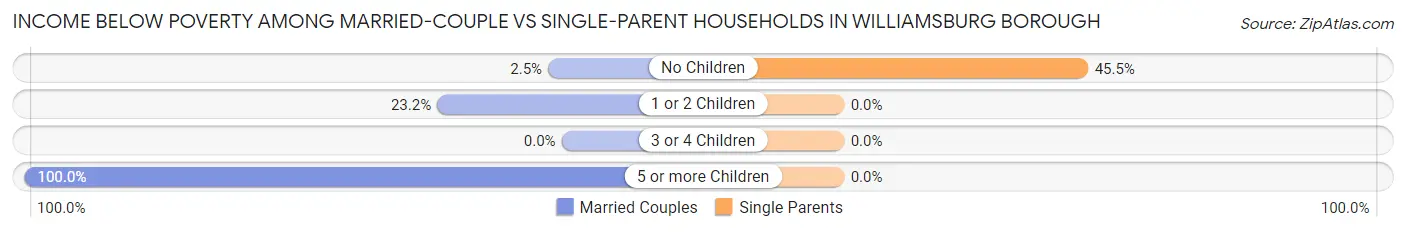
| Children | Married-Couple Families | Single-Parent Households |
| No Children | 3 (2.5%) | 20 (45.5%) |
| 1 or 2 Children | 16 (23.2%) | 0 (0.0%) |
| 3 or 4 Children | 0 (0.0%) | 0 (0.0%) |
| 5 or more Children | 4 (100.0%) | 0 (0.0%) |
| Total | 23 (10.8%) | 20 (21.5%) |
Race in Williamsburg borough
The most populous races in Williamsburg borough are White / Caucasian (1,129 | 93.9%), Two or more Races (66 | 5.5%), and Hispanic or Latino (12 | 1.0%).
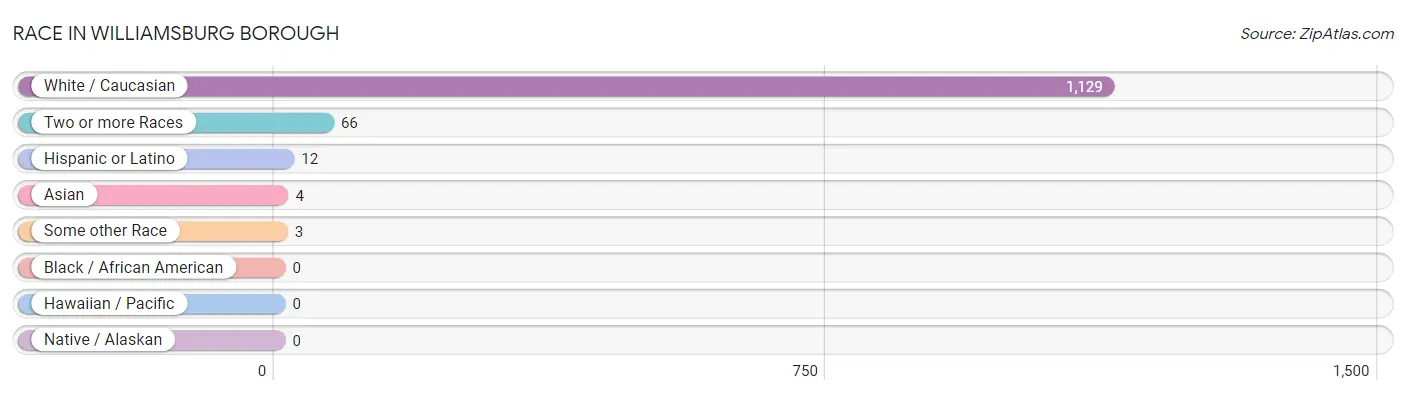
| Race | # Population | % Population |
| Asian | 4 | 0.3% |
| Black / African American | 0 | 0.0% |
| Hawaiian / Pacific | 0 | 0.0% |
| Hispanic or Latino | 12 | 1.0% |
| Native / Alaskan | 0 | 0.0% |
| White / Caucasian | 1,129 | 93.9% |
| Two or more Races | 66 | 5.5% |
| Some other Race | 3 | 0.3% |
| Total | 1,202 | 100.0% |
Ancestry in Williamsburg borough
The most populous ancestries reported in Williamsburg borough are German (397 | 33.0%), Irish (182 | 15.1%), English (88 | 7.3%), Italian (65 | 5.4%), and American (46 | 3.8%), together accounting for 64.7% of all Williamsburg borough residents.
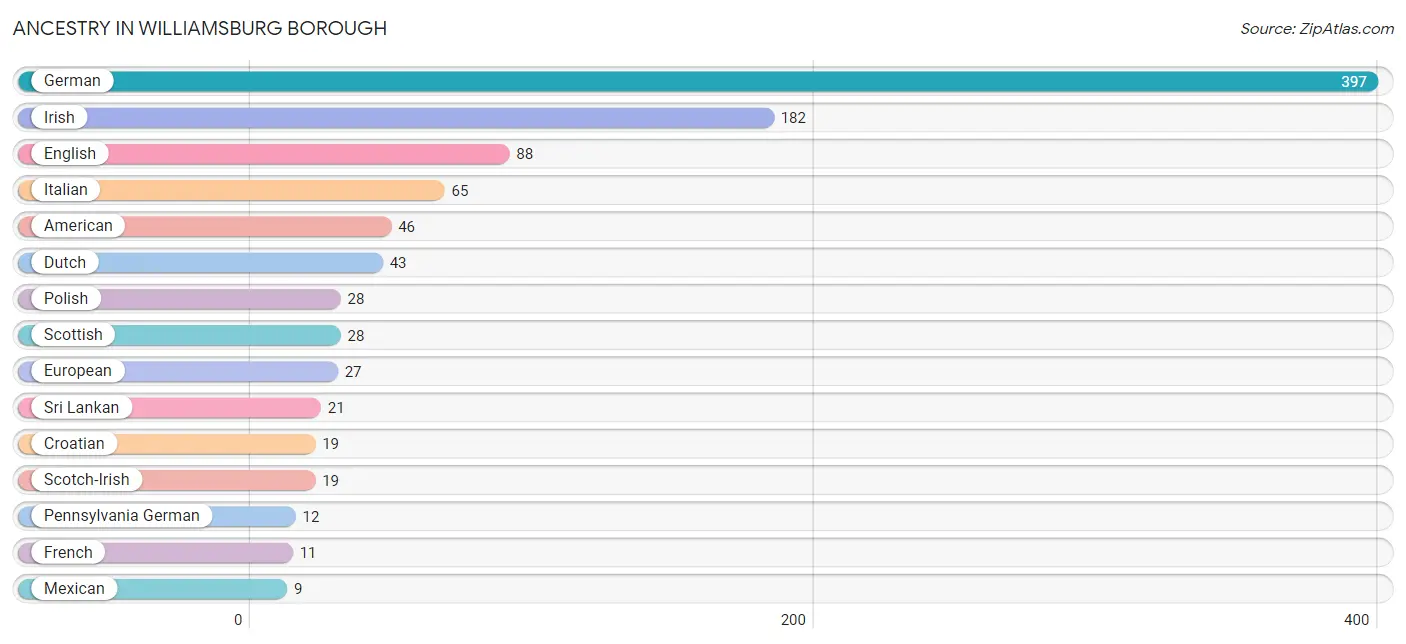
| Ancestry | # Population | % Population |
| American | 46 | 3.8% |
| Blackfeet | 2 | 0.2% |
| British | 3 | 0.3% |
| Cherokee | 2 | 0.2% |
| Croatian | 19 | 1.6% |
| Dutch | 43 | 3.6% |
| English | 88 | 7.3% |
| European | 27 | 2.2% |
| French | 11 | 0.9% |
| German | 397 | 33.0% |
| Irish | 182 | 15.1% |
| Italian | 65 | 5.4% |
| Mexican | 9 | 0.7% |
| Norwegian | 3 | 0.3% |
| Pennsylvania German | 12 | 1.0% |
| Polish | 28 | 2.3% |
| Scotch-Irish | 19 | 1.6% |
| Scottish | 28 | 2.3% |
| Spanish | 3 | 0.3% |
| Sri Lankan | 21 | 1.8% |
| Swedish | 2 | 0.2% | View All 21 Rows |
Immigrants in Williamsburg borough
The most numerous immigrant groups reported in Williamsburg borough came from Asia (4 | 0.3%), South Eastern Asia (4 | 0.3%), Vietnam (4 | 0.3%), and Canada (3 | 0.3%), together accounting for 1.2% of all Williamsburg borough residents.
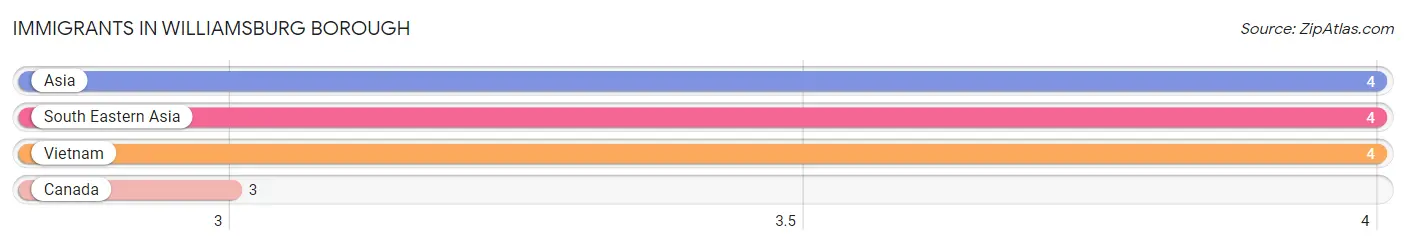
| Immigration Origin | # Population | % Population |
| Asia | 4 | 0.3% |
| Canada | 3 | 0.3% |
| South Eastern Asia | 4 | 0.3% |
| Vietnam | 4 | 0.3% | View All 4 Rows |
Sex and Age in Williamsburg borough
Sex and Age in Williamsburg borough
The most populous age groups in Williamsburg borough are 35 to 39 Years (85 | 13.9%) for men and Under 5 Years (58 | 9.8%) for women.
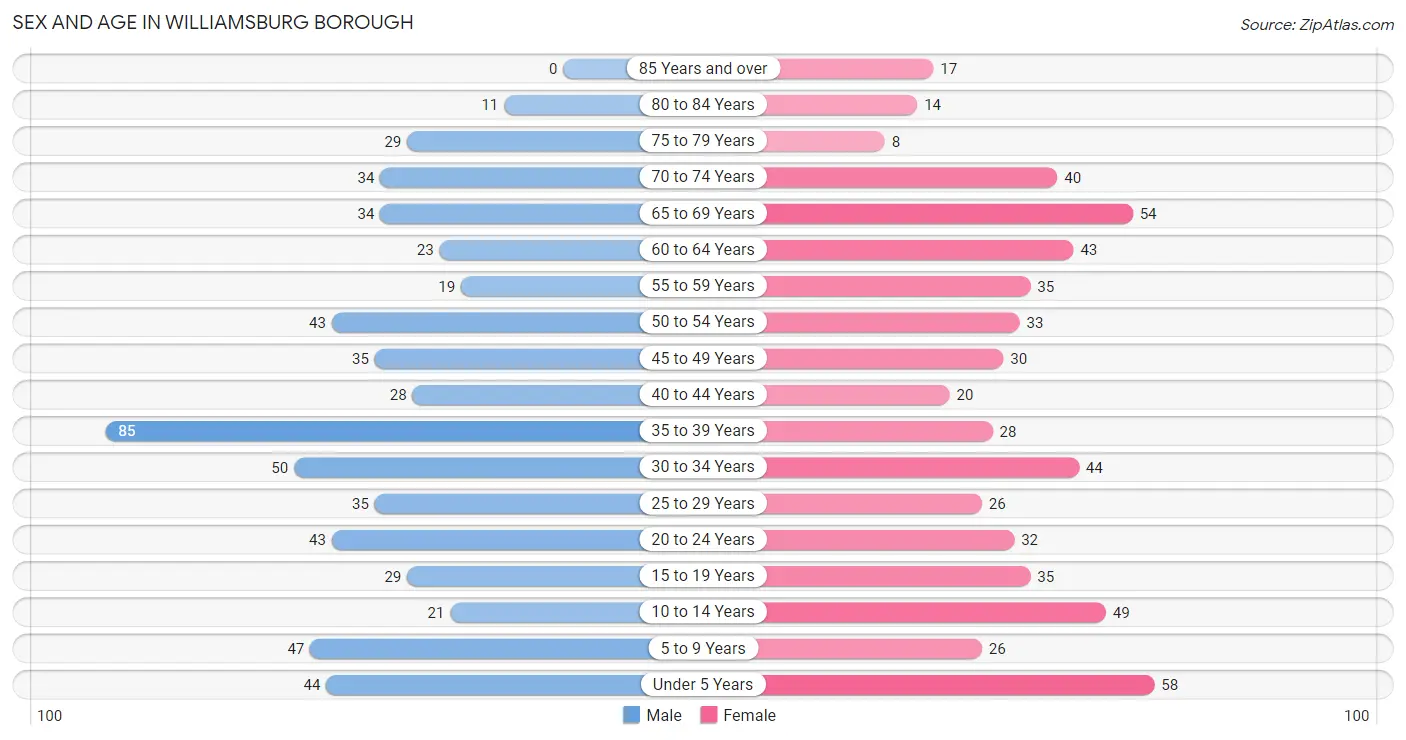
| Age Bracket | Male | Female |
| Under 5 Years | 44 (7.2%) | 58 (9.8%) |
| 5 to 9 Years | 47 (7.7%) | 26 (4.4%) |
| 10 to 14 Years | 21 (3.4%) | 49 (8.3%) |
| 15 to 19 Years | 29 (4.8%) | 35 (5.9%) |
| 20 to 24 Years | 43 (7.0%) | 32 (5.4%) |
| 25 to 29 Years | 35 (5.7%) | 26 (4.4%) |
| 30 to 34 Years | 50 (8.2%) | 44 (7.4%) |
| 35 to 39 Years | 85 (13.9%) | 28 (4.7%) |
| 40 to 44 Years | 28 (4.6%) | 20 (3.4%) |
| 45 to 49 Years | 35 (5.7%) | 30 (5.1%) |
| 50 to 54 Years | 43 (7.0%) | 33 (5.6%) |
| 55 to 59 Years | 19 (3.1%) | 35 (5.9%) |
| 60 to 64 Years | 23 (3.8%) | 43 (7.3%) |
| 65 to 69 Years | 34 (5.6%) | 54 (9.1%) |
| 70 to 74 Years | 34 (5.6%) | 40 (6.8%) |
| 75 to 79 Years | 29 (4.8%) | 8 (1.3%) |
| 80 to 84 Years | 11 (1.8%) | 14 (2.4%) |
| 85 Years and over | 0 (0.0%) | 17 (2.9%) |
| Total | 610 (100.0%) | 592 (100.0%) |
Families and Households in Williamsburg borough
Median Family Size in Williamsburg borough
The median family size in Williamsburg borough is 3.04 persons per family, with married-couple families (213 | 69.6%) accounting for the largest median family size of 3.15 persons per family. On the other hand, single male/father families (14 | 4.6%) represent the smallest median family size with 2.36 persons per family.
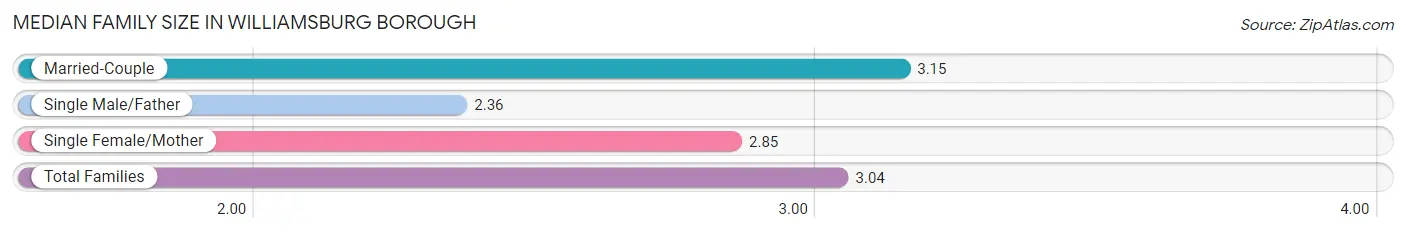
| Family Type | # Families | Family Size |
| Married-Couple | 213 (69.6%) | 3.15 |
| Single Male/Father | 14 (4.6%) | 2.36 |
| Single Female/Mother | 79 (25.8%) | 2.85 |
| Total Families | 306 (100.0%) | 3.04 |
Median Household Size in Williamsburg borough
The median household size in Williamsburg borough is 2.38 persons per household, with single female/mother households (79 | 15.6%) accounting for the largest median household size of 3.25 persons per household. non-family households (200 | 39.5%) represent the smallest median household size with 1.14 persons per household.
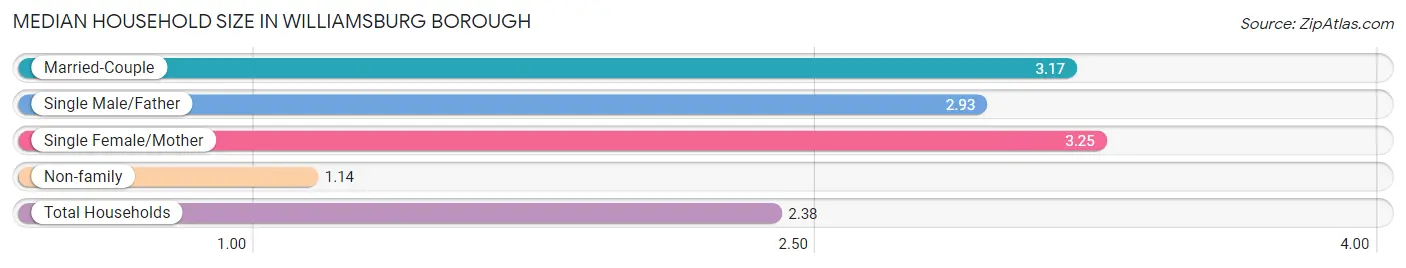
| Household Type | # Households | Household Size |
| Married-Couple | 213 (42.1%) | 3.17 |
| Single Male/Father | 14 (2.8%) | 2.93 |
| Single Female/Mother | 79 (15.6%) | 3.25 |
| Non-family | 200 (39.5%) | 1.14 |
| Total Households | 506 (100.0%) | 2.38 |
Household Size by Marriage Status in Williamsburg borough
Out of a total of 506 households in Williamsburg borough, 306 (60.5%) are family households, while 200 (39.5%) are nonfamily households. The most numerous type of family households are 2-person households, comprising 132, and the most common type of nonfamily households are 1-person households, comprising 172.
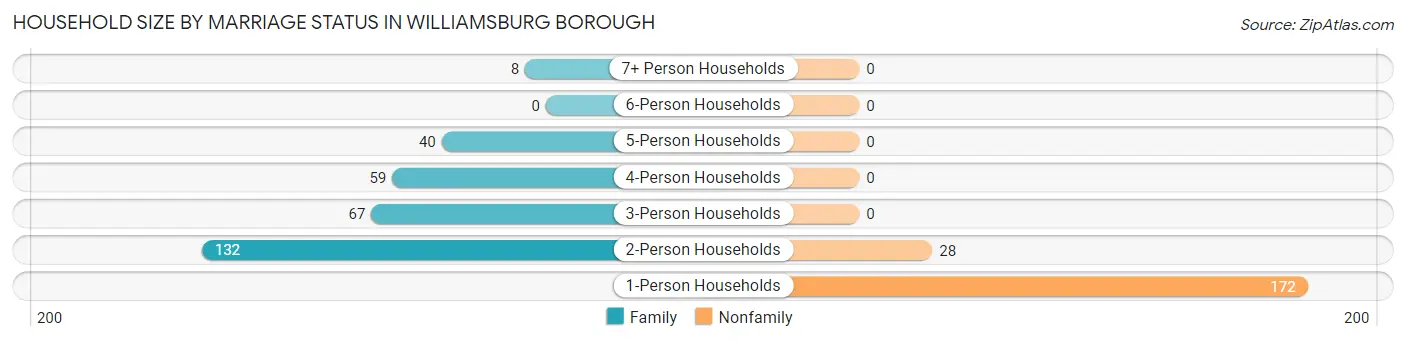
| Household Size | Family Households | Nonfamily Households |
| 1-Person Households | - | 172 (34.0%) |
| 2-Person Households | 132 (26.1%) | 28 (5.5%) |
| 3-Person Households | 67 (13.2%) | 0 (0.0%) |
| 4-Person Households | 59 (11.7%) | 0 (0.0%) |
| 5-Person Households | 40 (7.9%) | 0 (0.0%) |
| 6-Person Households | 0 (0.0%) | 0 (0.0%) |
| 7+ Person Households | 8 (1.6%) | 0 (0.0%) |
| Total | 306 (60.5%) | 200 (39.5%) |
Female Fertility in Williamsburg borough
Fertility by Age in Williamsburg borough
Average fertility rate in Williamsburg borough is 78.0 births per 1,000 women. Women in the age bracket of 20 to 34 years have the highest fertility rate with 137.0 births per 1,000 women. Women in the age bracket of 20 to 34 years acount for 82.4% of all women with births.
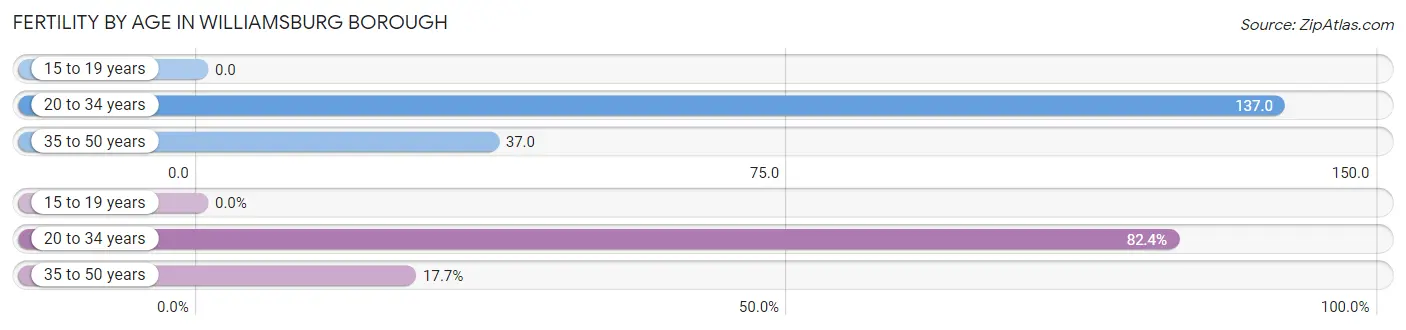
| Age Bracket | Women with Births | Births / 1,000 Women |
| 15 to 19 years | 0 (0.0%) | 0.0 |
| 20 to 34 years | 14 (82.4%) | 137.0 |
| 35 to 50 years | 3 (17.6%) | 37.0 |
| Total | 17 (100.0%) | 78.0 |
Fertility by Age by Marriage Status in Williamsburg borough
17.6% of women with births (17) in Williamsburg borough are married. The highest percentage of unmarried women with births falls into 20 to 34 years age bracket with 100.0% of them unmarried at the time of birth, while the lowest percentage of unmarried women with births belong to 35 to 50 years age bracket with 0.0% of them unmarried.
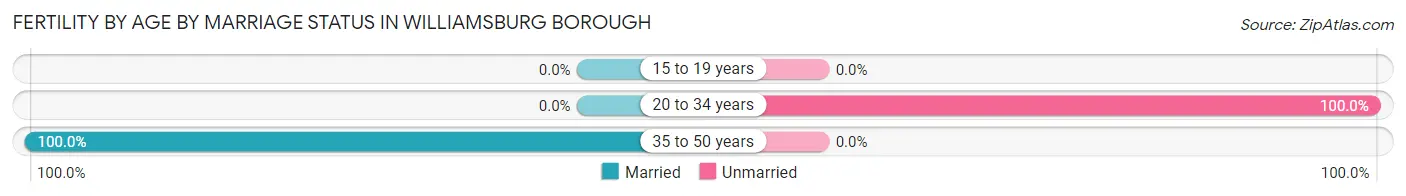
| Age Bracket | Married | Unmarried |
| 15 to 19 years | 0 (0.0%) | 0 (0.0%) |
| 20 to 34 years | 0 (0.0%) | 14 (100.0%) |
| 35 to 50 years | 3 (100.0%) | 0 (0.0%) |
| Total | 3 (17.6%) | 14 (82.4%) |
Fertility by Education in Williamsburg borough
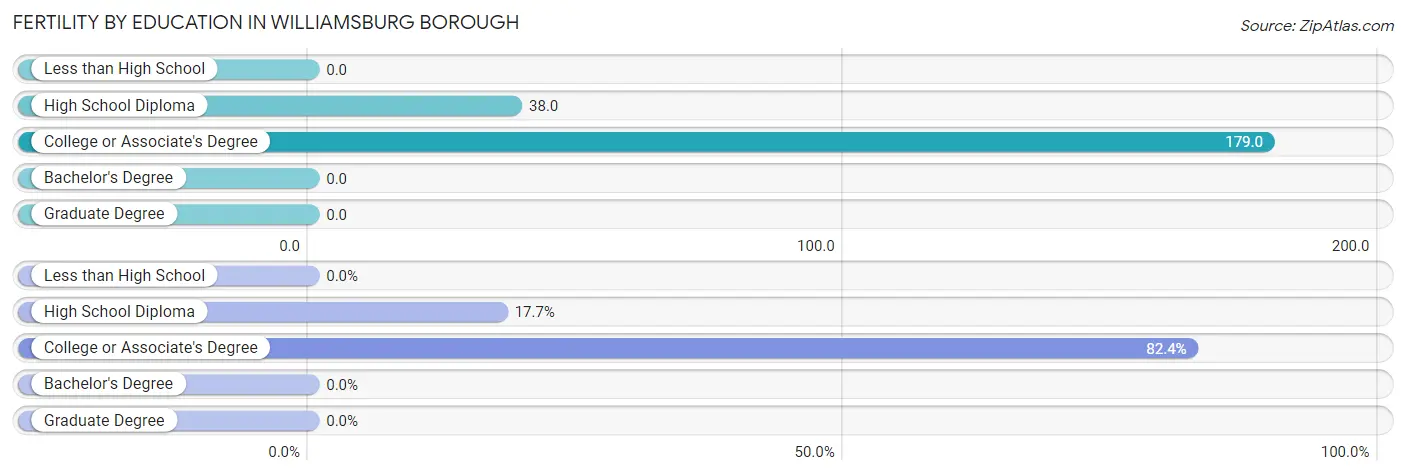
| Educational Attainment | Women with Births | Births / 1,000 Women |
| Less than High School | 0 (0.0%) | 0.0 |
| High School Diploma | 3 (17.6%) | 38.0 |
| College or Associate's Degree | 14 (82.4%) | 179.0 |
| Bachelor's Degree | 0 (0.0%) | 0.0 |
| Graduate Degree | 0 (0.0%) | 0.0 |
| Total | 17 (100.0%) | 78.0 |
Fertility by Education by Marriage Status in Williamsburg borough
82.4% of women with births in Williamsburg borough are unmarried. Women with the educational attainment of high school diploma are most likely to be married with 100.0% of them married at childbirth, while women with the educational attainment of college or associate's degree are least likely to be married with 100.0% of them unmarried at childbirth.
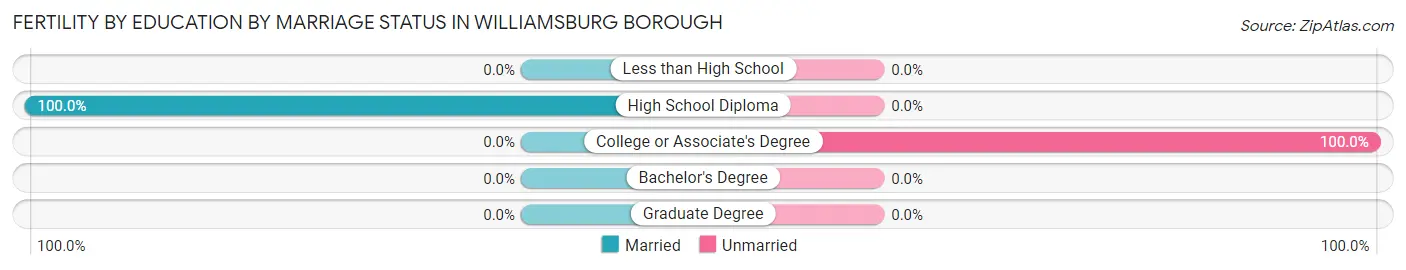
| Educational Attainment | Married | Unmarried |
| Less than High School | 0 (0.0%) | 0 (0.0%) |
| High School Diploma | 3 (100.0%) | 0 (0.0%) |
| College or Associate's Degree | 0 (0.0%) | 14 (100.0%) |
| Bachelor's Degree | 0 (0.0%) | 0 (0.0%) |
| Graduate Degree | 0 (0.0%) | 0 (0.0%) |
| Total | 3 (17.6%) | 14 (82.4%) |
Employment Characteristics in Williamsburg borough
Employment by Class of Employer in Williamsburg borough
Among the 509 employed individuals in Williamsburg borough, private company employees (380 | 74.7%), not-for-profit organizations (38 | 7.5%), and state government employees (38 | 7.5%) make up the most common classes of employment.
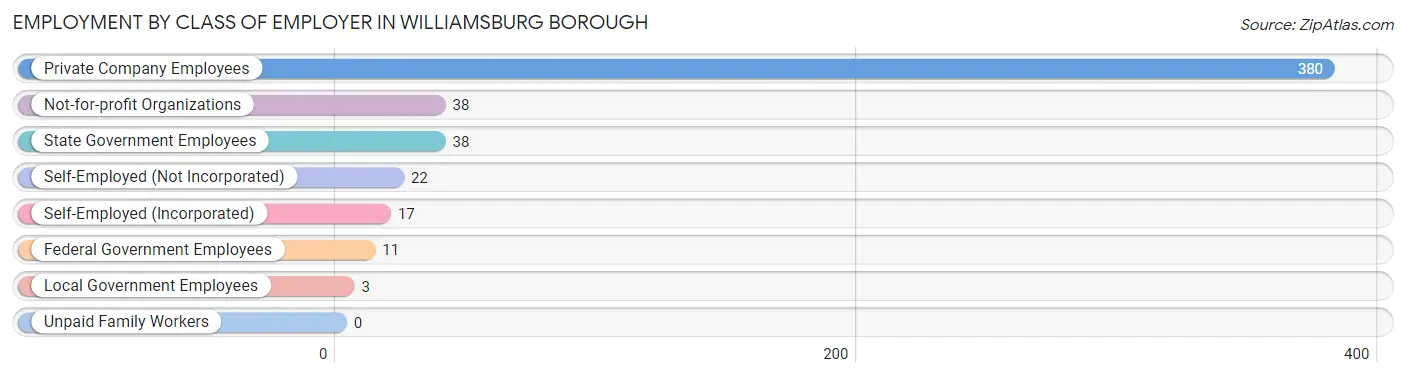
| Employer Class | # Employees | % Employees |
| Private Company Employees | 380 | 74.7% |
| Self-Employed (Incorporated) | 17 | 3.3% |
| Self-Employed (Not Incorporated) | 22 | 4.3% |
| Not-for-profit Organizations | 38 | 7.5% |
| Local Government Employees | 3 | 0.6% |
| State Government Employees | 38 | 7.5% |
| Federal Government Employees | 11 | 2.2% |
| Unpaid Family Workers | 0 | 0.0% |
| Total | 509 | 100.0% |
Employment Status by Age in Williamsburg borough
According to the labor force statistics for Williamsburg borough, out of the total population over 16 years of age (952), 55.9% or 532 individuals are in the labor force, with 4.3% or 23 of them unemployed. The age group with the highest labor force participation rate is 25 to 29 years, with 95.1% or 58 individuals in the labor force. Within the labor force, the 20 to 24 years age range has the highest percentage of unemployed individuals, with 22.4% or 15 of them being unemployed.
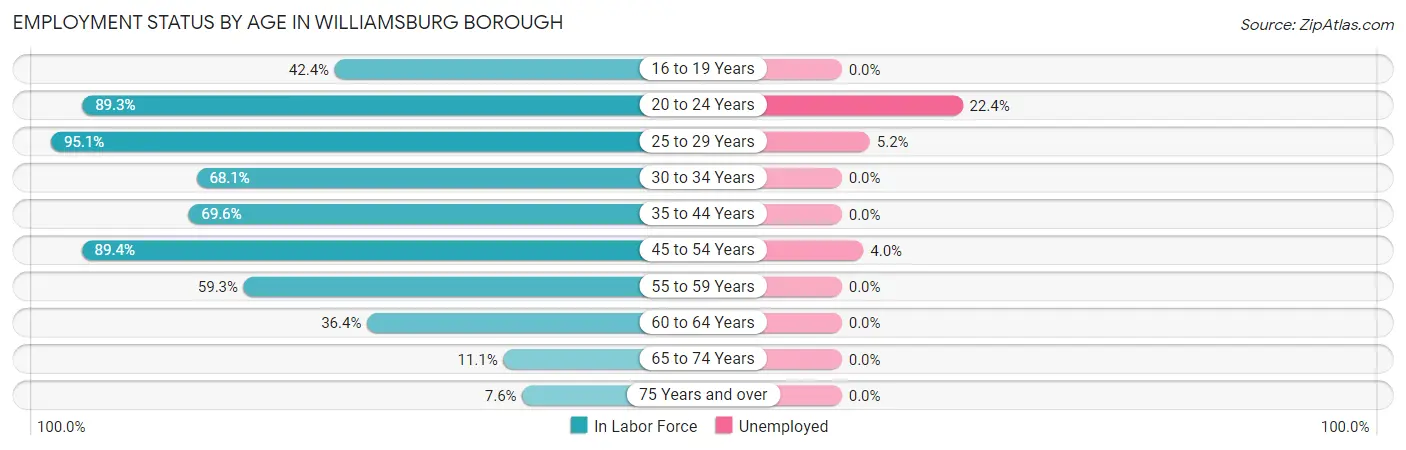
| Age Bracket | In Labor Force | Unemployed |
| 16 to 19 Years | 25 (42.4%) | 0 (0.0%) |
| 20 to 24 Years | 67 (89.3%) | 15 (22.4%) |
| 25 to 29 Years | 58 (95.1%) | 3 (5.2%) |
| 30 to 34 Years | 64 (68.1%) | 0 (0.0%) |
| 35 to 44 Years | 112 (69.6%) | 0 (0.0%) |
| 45 to 54 Years | 126 (89.4%) | 5 (4.0%) |
| 55 to 59 Years | 32 (59.3%) | 0 (0.0%) |
| 60 to 64 Years | 24 (36.4%) | 0 (0.0%) |
| 65 to 74 Years | 18 (11.1%) | 0 (0.0%) |
| 75 Years and over | 6 (7.6%) | 0 (0.0%) |
| Total | 532 (55.9%) | 23 (4.3%) |
Employment Status by Educational Attainment in Williamsburg borough
According to labor force statistics for Williamsburg borough, 72.1% of individuals (416) out of the total population between 25 and 64 years of age (577) are in the labor force, with 1.9% or 8 of them being unemployed. The group with the highest labor force participation rate are those with the educational attainment of bachelor's degree or higher, with 94.8% or 55 individuals in the labor force. Within the labor force, individuals with high school diploma education have the highest percentage of unemployment, with 3.7% or 8 of them being unemployed.
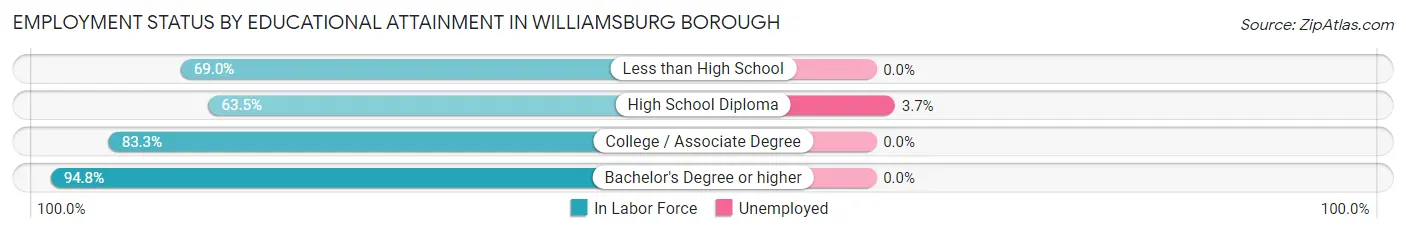
| Educational Attainment | In Labor Force | Unemployed |
| Less than High School | 20 (69.0%) | 0 (0.0%) |
| High School Diploma | 216 (63.5%) | 13 (3.7%) |
| College / Associate Degree | 125 (83.3%) | 0 (0.0%) |
| Bachelor's Degree or higher | 55 (94.8%) | 0 (0.0%) |
| Total | 416 (72.1%) | 11 (1.9%) |
Employment Occupations by Sex in Williamsburg borough
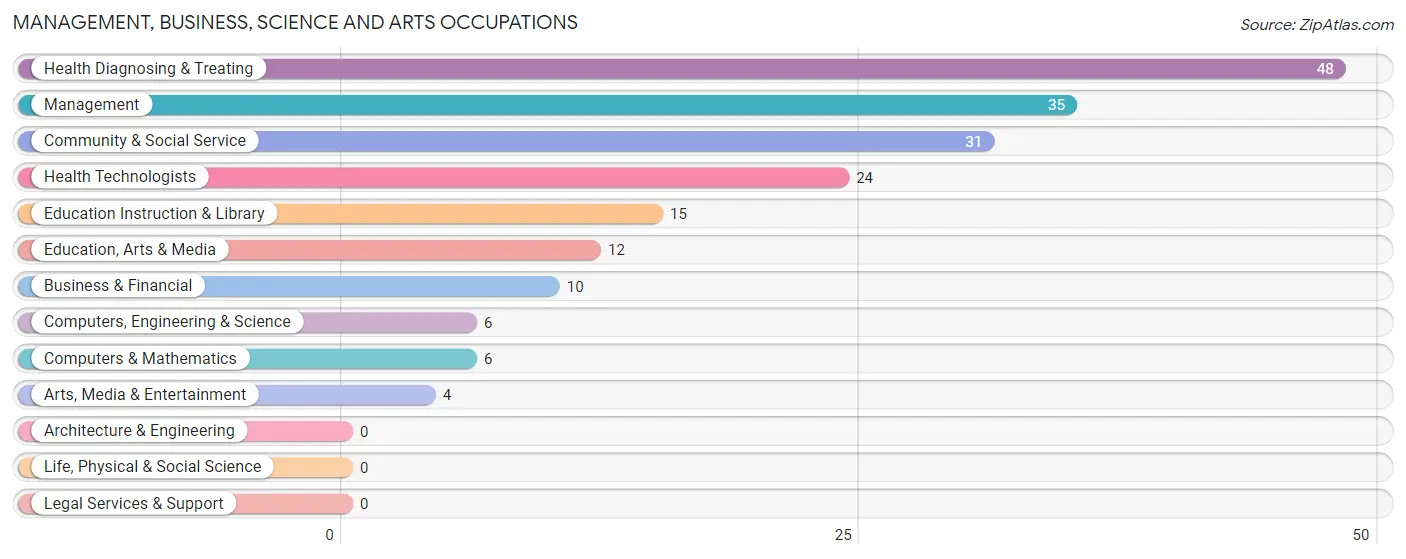
Management, Business, Science and Arts Occupations
The most common Management, Business, Science and Arts occupations in Williamsburg borough are Health Diagnosing & Treating (48 | 9.4%), Management (35 | 6.9%), Community & Social Service (31 | 6.1%), Health Technologists (24 | 4.7%), and Education Instruction & Library (15 | 2.9%).
Management, Business, Science and Arts Occupations by Sex
Within the Management, Business, Science and Arts occupations in Williamsburg borough, the most male-oriented occupations are Education, Arts & Media (75.0%), Management (48.6%), and Community & Social Service (38.7%), while the most female-oriented occupations are Computers, Engineering & Science (100.0%), Computers & Mathematics (100.0%), and Arts, Media & Entertainment (100.0%).
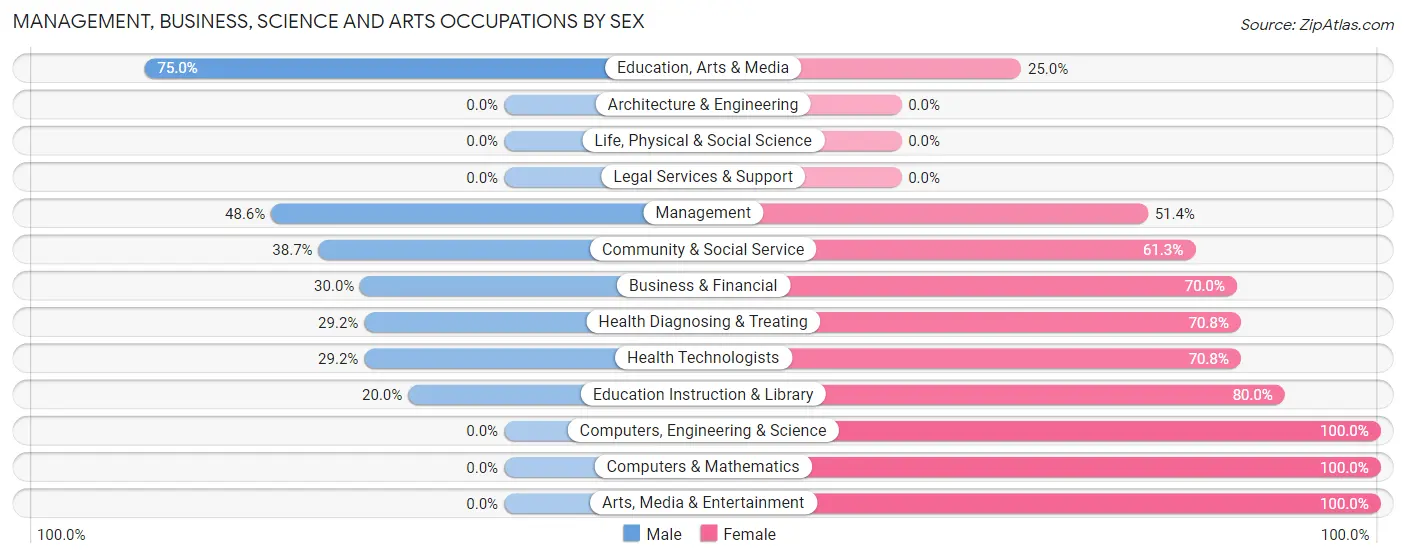
| Occupation | Male | Female |
| Management | 17 (48.6%) | 18 (51.4%) |
| Business & Financial | 3 (30.0%) | 7 (70.0%) |
| Computers, Engineering & Science | 0 (0.0%) | 6 (100.0%) |
| Computers & Mathematics | 0 (0.0%) | 6 (100.0%) |
| Architecture & Engineering | 0 (0.0%) | 0 (0.0%) |
| Life, Physical & Social Science | 0 (0.0%) | 0 (0.0%) |
| Community & Social Service | 12 (38.7%) | 19 (61.3%) |
| Education, Arts & Media | 9 (75.0%) | 3 (25.0%) |
| Legal Services & Support | 0 (0.0%) | 0 (0.0%) |
| Education Instruction & Library | 3 (20.0%) | 12 (80.0%) |
| Arts, Media & Entertainment | 0 (0.0%) | 4 (100.0%) |
| Health Diagnosing & Treating | 14 (29.2%) | 34 (70.8%) |
| Health Technologists | 7 (29.2%) | 17 (70.8%) |
| Total (Category) | 46 (35.4%) | 84 (64.6%) |
| Total (Overall) | 303 (59.5%) | 206 (40.5%) |
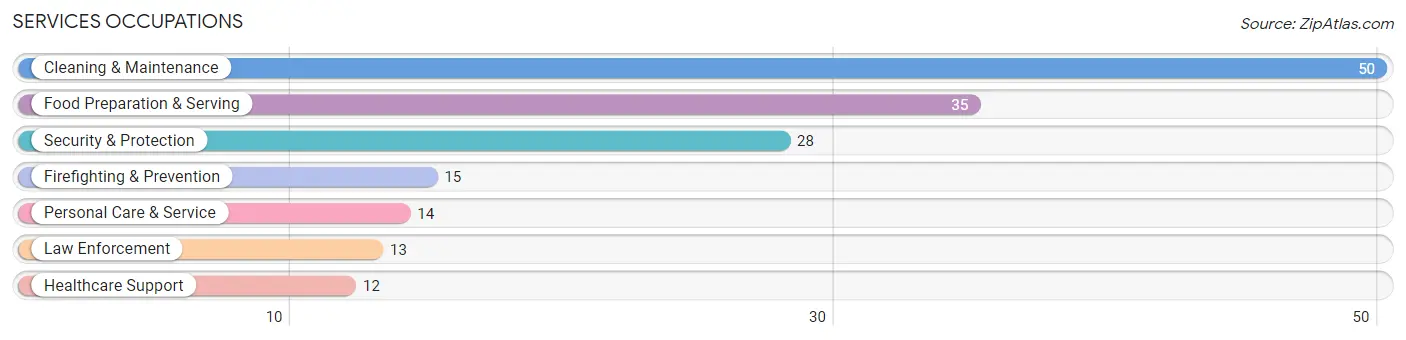
Services Occupations
The most common Services occupations in Williamsburg borough are Cleaning & Maintenance (50 | 9.8%), Food Preparation & Serving (35 | 6.9%), Security & Protection (28 | 5.5%), Firefighting & Prevention (15 | 2.9%), and Personal Care & Service (14 | 2.8%).
Services Occupations by Sex
Within the Services occupations in Williamsburg borough, the most male-oriented occupations are Firefighting & Prevention (100.0%), Security & Protection (85.7%), and Cleaning & Maintenance (80.0%), while the most female-oriented occupations are Healthcare Support (100.0%), Food Preparation & Serving (60.0%), and Law Enforcement (30.8%).
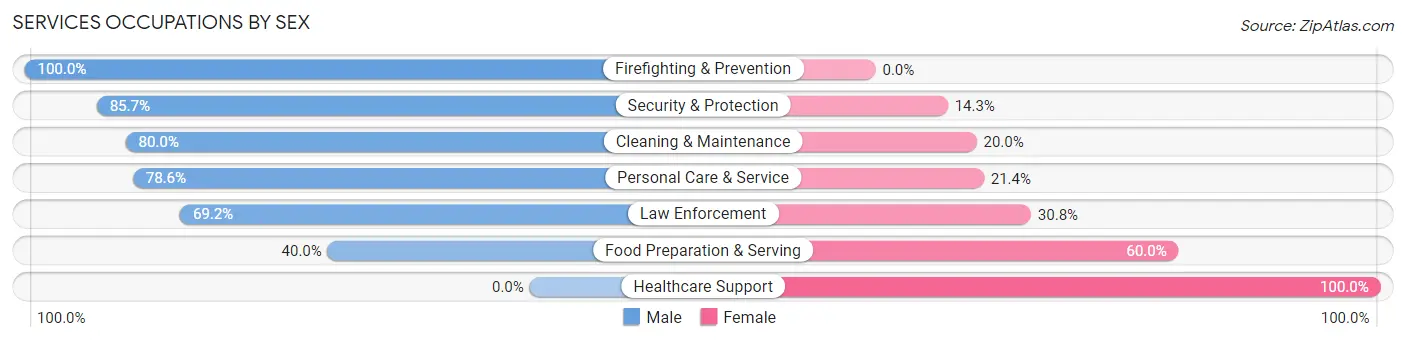
| Occupation | Male | Female |
| Healthcare Support | 0 (0.0%) | 12 (100.0%) |
| Security & Protection | 24 (85.7%) | 4 (14.3%) |
| Firefighting & Prevention | 15 (100.0%) | 0 (0.0%) |
| Law Enforcement | 9 (69.2%) | 4 (30.8%) |
| Food Preparation & Serving | 14 (40.0%) | 21 (60.0%) |
| Cleaning & Maintenance | 40 (80.0%) | 10 (20.0%) |
| Personal Care & Service | 11 (78.6%) | 3 (21.4%) |
| Total (Category) | 89 (64.0%) | 50 (36.0%) |
| Total (Overall) | 303 (59.5%) | 206 (40.5%) |
Sales and Office Occupations
The most common Sales and Office occupations in Williamsburg borough are Office & Administration (53 | 10.4%), and Sales & Related (29 | 5.7%).

Sales and Office Occupations by Sex
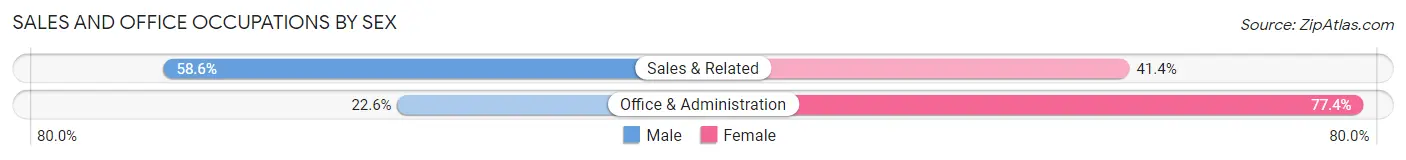
| Occupation | Male | Female |
| Sales & Related | 17 (58.6%) | 12 (41.4%) |
| Office & Administration | 12 (22.6%) | 41 (77.4%) |
| Total (Category) | 29 (35.4%) | 53 (64.6%) |
| Total (Overall) | 303 (59.5%) | 206 (40.5%) |
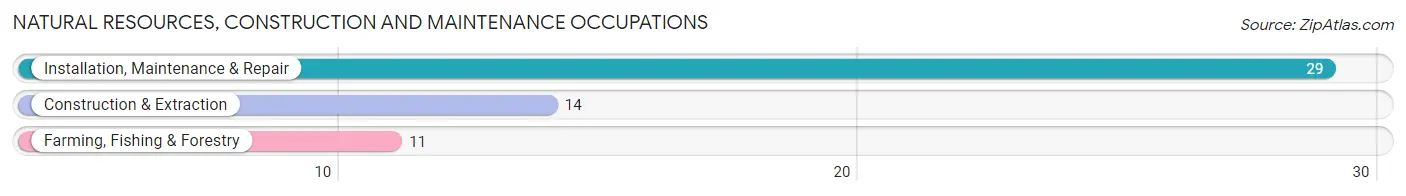
Natural Resources, Construction and Maintenance Occupations
The most common Natural Resources, Construction and Maintenance occupations in Williamsburg borough are Installation, Maintenance & Repair (29 | 5.7%), Construction & Extraction (14 | 2.8%), and Farming, Fishing & Forestry (11 | 2.2%).
Natural Resources, Construction and Maintenance Occupations by Sex
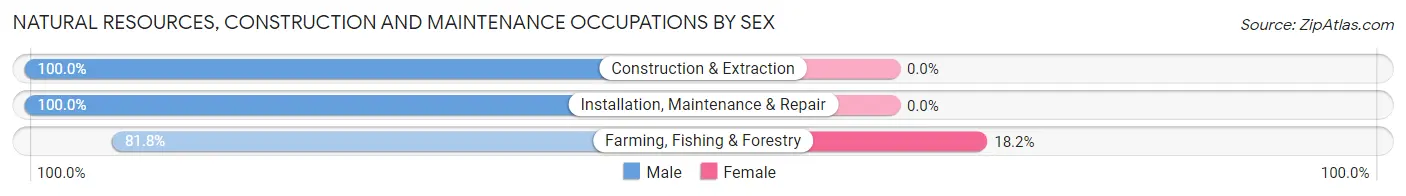
| Occupation | Male | Female |
| Farming, Fishing & Forestry | 9 (81.8%) | 2 (18.2%) |
| Construction & Extraction | 14 (100.0%) | 0 (0.0%) |
| Installation, Maintenance & Repair | 29 (100.0%) | 0 (0.0%) |
| Total (Category) | 52 (96.3%) | 2 (3.7%) |
| Total (Overall) | 303 (59.5%) | 206 (40.5%) |
Production, Transportation and Moving Occupations
The most common Production, Transportation and Moving occupations in Williamsburg borough are Production (47 | 9.2%), Material Moving (44 | 8.6%), and Transportation (13 | 2.5%).
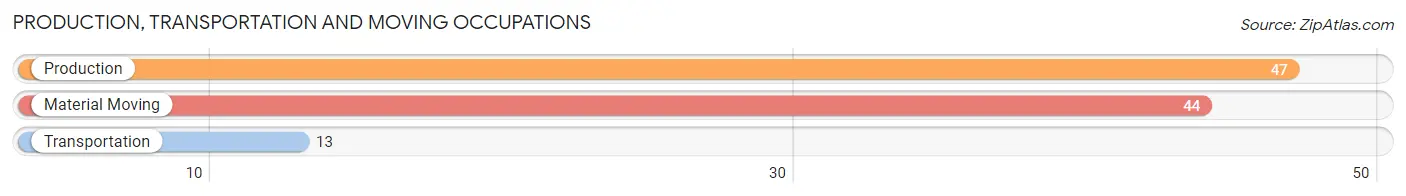
Production, Transportation and Moving Occupations by Sex
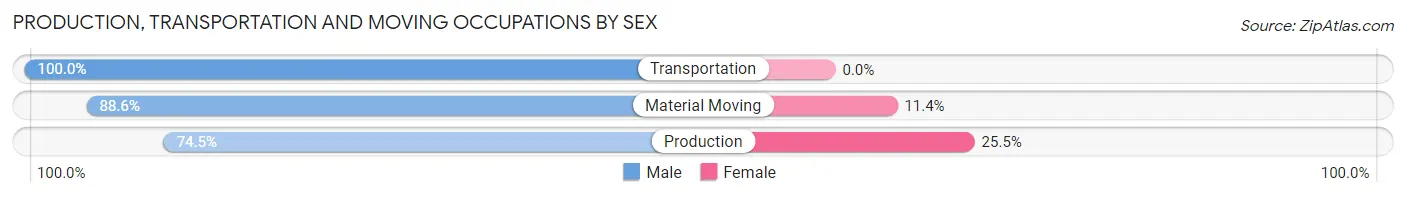
| Occupation | Male | Female |
| Production | 35 (74.5%) | 12 (25.5%) |
| Transportation | 13 (100.0%) | 0 (0.0%) |
| Material Moving | 39 (88.6%) | 5 (11.4%) |
| Total (Category) | 87 (83.7%) | 17 (16.4%) |
| Total (Overall) | 303 (59.5%) | 206 (40.5%) |
Employment Industries by Sex in Williamsburg borough
Employment Industries in Williamsburg borough
The major employment industries in Williamsburg borough include Health Care & Social Assistance (126 | 24.7%), Retail Trade (69 | 13.6%), Manufacturing (67 | 13.2%), Administrative & Support (43 | 8.5%), and Accommodation & Food Services (35 | 6.9%).
Employment Industries by Sex in Williamsburg borough
The Williamsburg borough industries that see more men than women are Construction (100.0%), Wholesale Trade (100.0%), and Arts, Entertainment & Recreation (100.0%), whereas the industries that tend to have a higher number of women are Finance & Insurance (100.0%), Professional & Scientific (82.4%), and Health Care & Social Assistance (68.2%).
| Industry | Male | Female |
| Agriculture, Fishing & Hunting | 12 (85.7%) | 2 (14.3%) |
| Mining, Quarrying, & Extraction | 0 (0.0%) | 0 (0.0%) |
| Construction | 18 (100.0%) | 0 (0.0%) |
| Manufacturing | 52 (77.6%) | 15 (22.4%) |
| Wholesale Trade | 21 (100.0%) | 0 (0.0%) |
| Retail Trade | 40 (58.0%) | 29 (42.0%) |
| Transportation & Warehousing | 19 (86.4%) | 3 (13.6%) |
| Utilities | 0 (0.0%) | 0 (0.0%) |
| Information | 0 (0.0%) | 0 (0.0%) |
| Finance & Insurance | 0 (0.0%) | 6 (100.0%) |
| Real Estate, Rental & Leasing | 0 (0.0%) | 0 (0.0%) |
| Professional & Scientific | 3 (17.6%) | 14 (82.4%) |
| Enterprise Management | 0 (0.0%) | 0 (0.0%) |
| Administrative & Support | 37 (86.1%) | 6 (14.0%) |
| Educational Services | 14 (63.6%) | 8 (36.4%) |
| Health Care & Social Assistance | 40 (31.8%) | 86 (68.2%) |
| Arts, Entertainment & Recreation | 4 (100.0%) | 0 (0.0%) |
| Accommodation & Food Services | 12 (34.3%) | 23 (65.7%) |
| Public Administration | 9 (52.9%) | 8 (47.1%) |
| Total | 303 (59.5%) | 206 (40.5%) |
Education in Williamsburg borough
School Enrollment in Williamsburg borough
The most common levels of schooling among the 225 students in Williamsburg borough are elementary school (61 | 27.1%), middle school (50 | 22.2%), and high school (46 | 20.4%).
| School Level | # Students | % Students |
| Nursery / Preschool | 23 | 10.2% |
| Kindergarten | 3 | 1.3% |
| Elementary School | 61 | 27.1% |
| Middle School | 50 | 22.2% |
| High School | 46 | 20.4% |
| College / Undergraduate | 38 | 16.9% |
| Graduate / Professional | 4 | 1.8% |
| Total | 225 | 100.0% |
School Enrollment by Age by Funding Source in Williamsburg borough
Out of a total of 225 students who are enrolled in schools in Williamsburg borough, 16 (7.1%) attend a private institution, while the remaining 209 (92.9%) are enrolled in public schools. The age group of 35 years and over has the highest likelihood of being enrolled in private schools, with 11 (61.1% in the age bracket) enrolled. Conversely, the age group of 3 to 4 year olds has the lowest likelihood of being enrolled in a private school, with 19 (100.0% in the age bracket) attending a public institution.
| Age Bracket | Public School | Private School |
| 3 to 4 Year Olds | 19 (100.0%) | 0 (0.0%) |
| 5 to 9 Year Old | 60 (100.0%) | 0 (0.0%) |
| 10 to 14 Year Olds | 70 (100.0%) | 0 (0.0%) |
| 15 to 17 Year Olds | 29 (100.0%) | 0 (0.0%) |
| 18 to 19 Year Olds | 17 (100.0%) | 0 (0.0%) |
| 20 to 24 Year Olds | 0 (0.0%) | 0 (0.0%) |
| 25 to 34 Year Olds | 7 (58.3%) | 5 (41.7%) |
| 35 Years and over | 7 (38.9%) | 11 (61.1%) |
| Total | 209 (92.9%) | 16 (7.1%) |
Educational Attainment by Field of Study in Williamsburg borough
Science & technology (18 | 22.2%), psychology (14 | 17.3%), education (14 | 17.3%), arts & humanities (11 | 13.6%), and bio, nature & agricultural (6 | 7.4%) are the most common fields of study among 81 individuals in Williamsburg borough who have obtained a bachelor's degree or higher.
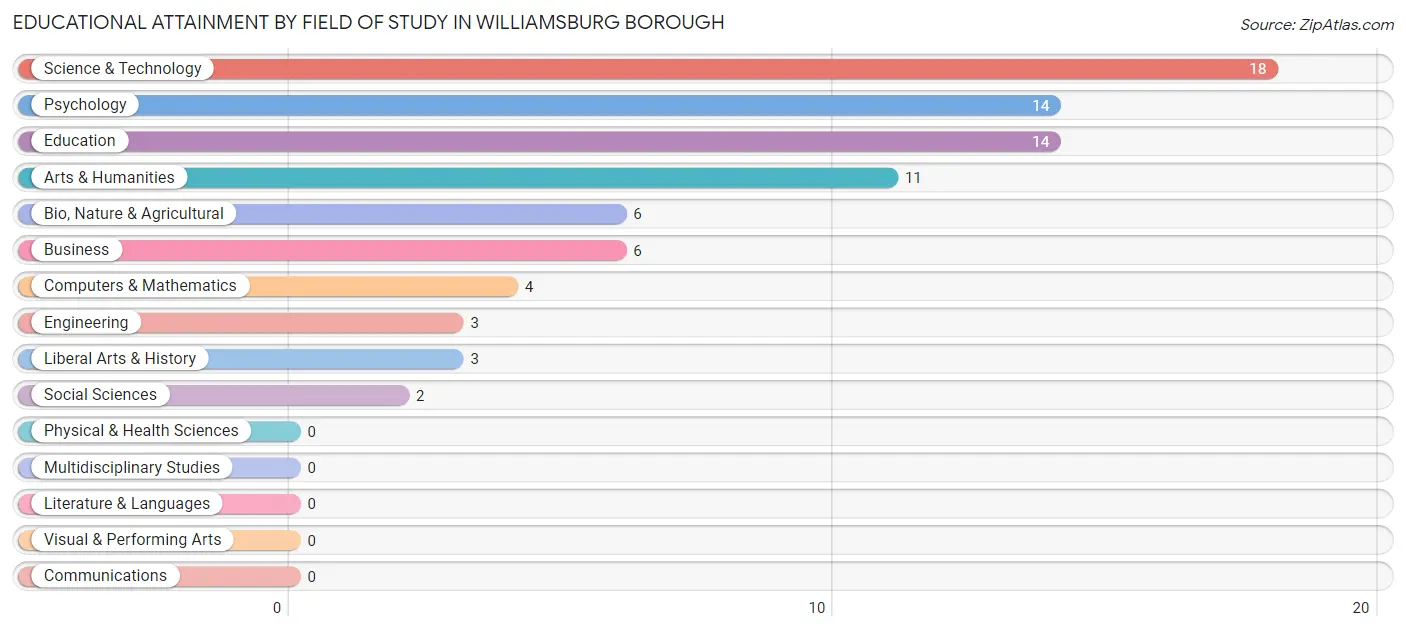
| Field of Study | # Graduates | % Graduates |
| Computers & Mathematics | 4 | 4.9% |
| Bio, Nature & Agricultural | 6 | 7.4% |
| Physical & Health Sciences | 0 | 0.0% |
| Psychology | 14 | 17.3% |
| Social Sciences | 2 | 2.5% |
| Engineering | 3 | 3.7% |
| Multidisciplinary Studies | 0 | 0.0% |
| Science & Technology | 18 | 22.2% |
| Business | 6 | 7.4% |
| Education | 14 | 17.3% |
| Literature & Languages | 0 | 0.0% |
| Liberal Arts & History | 3 | 3.7% |
| Visual & Performing Arts | 0 | 0.0% |
| Communications | 0 | 0.0% |
| Arts & Humanities | 11 | 13.6% |
| Total | 81 | 100.0% |
Transportation & Commute in Williamsburg borough
Vehicle Availability by Sex in Williamsburg borough
The most prevalent vehicle ownership categories in Williamsburg borough are males with 2 vehicles (133, accounting for 43.9%) and females with 2 vehicles (93, making up 64.6%).
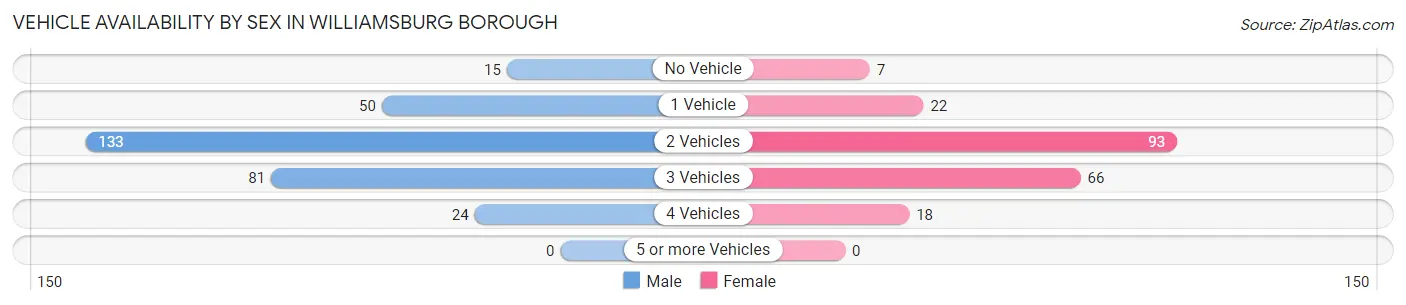
| Vehicles Available | Male | Female |
| No Vehicle | 15 (5.0%) | 7 (3.4%) |
| 1 Vehicle | 50 (16.5%) | 22 (10.7%) |
| 2 Vehicles | 133 (43.9%) | 93 (45.2%) |
| 3 Vehicles | 81 (26.7%) | 66 (32.0%) |
| 4 Vehicles | 24 (7.9%) | 18 (8.7%) |
| 5 or more Vehicles | 0 (0.0%) | 0 (0.0%) |
| Total | 303 (100.0%) | 206 (100.0%) |
Commute Time in Williamsburg borough
The most frequently occuring commute durations in Williamsburg borough are 20 to 24 minutes (92 commuters, 18.8%), less than 5 minutes (74 commuters, 15.1%), and 30 to 34 minutes (69 commuters, 14.1%).
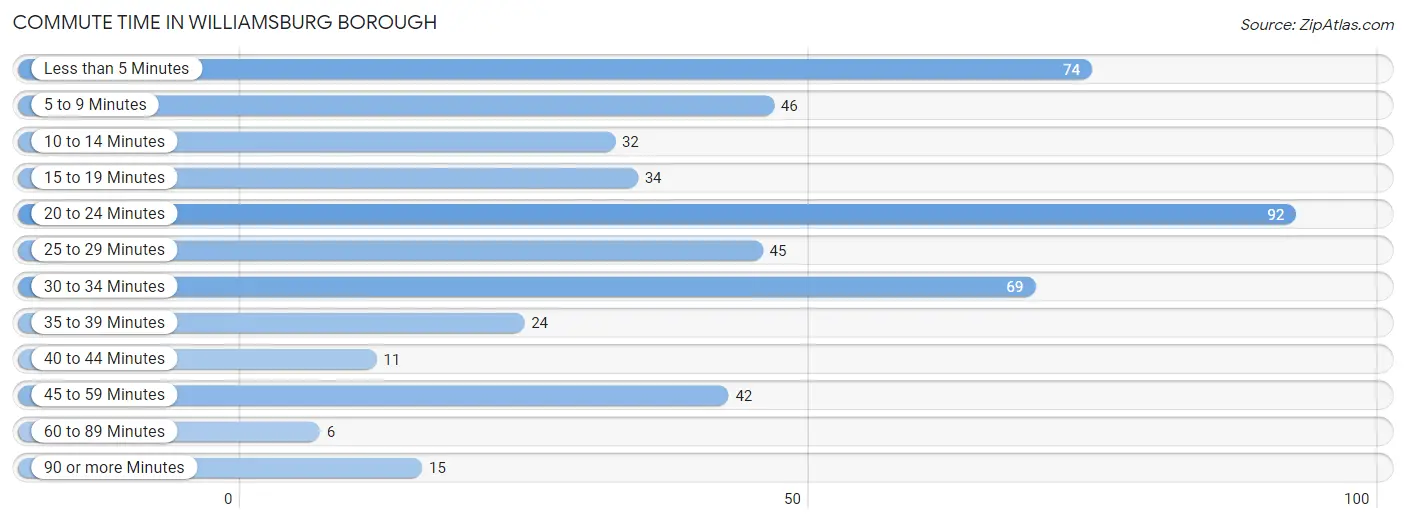
| Commute Time | # Commuters | % Commuters |
| Less than 5 Minutes | 74 | 15.1% |
| 5 to 9 Minutes | 46 | 9.4% |
| 10 to 14 Minutes | 32 | 6.5% |
| 15 to 19 Minutes | 34 | 6.9% |
| 20 to 24 Minutes | 92 | 18.8% |
| 25 to 29 Minutes | 45 | 9.2% |
| 30 to 34 Minutes | 69 | 14.1% |
| 35 to 39 Minutes | 24 | 4.9% |
| 40 to 44 Minutes | 11 | 2.2% |
| 45 to 59 Minutes | 42 | 8.6% |
| 60 to 89 Minutes | 6 | 1.2% |
| 90 or more Minutes | 15 | 3.1% |
Commute Time by Sex in Williamsburg borough
The most common commute times in Williamsburg borough are 30 to 34 minutes (46 commuters, 15.8%) for males and 20 to 24 minutes (48 commuters, 24.2%) for females.
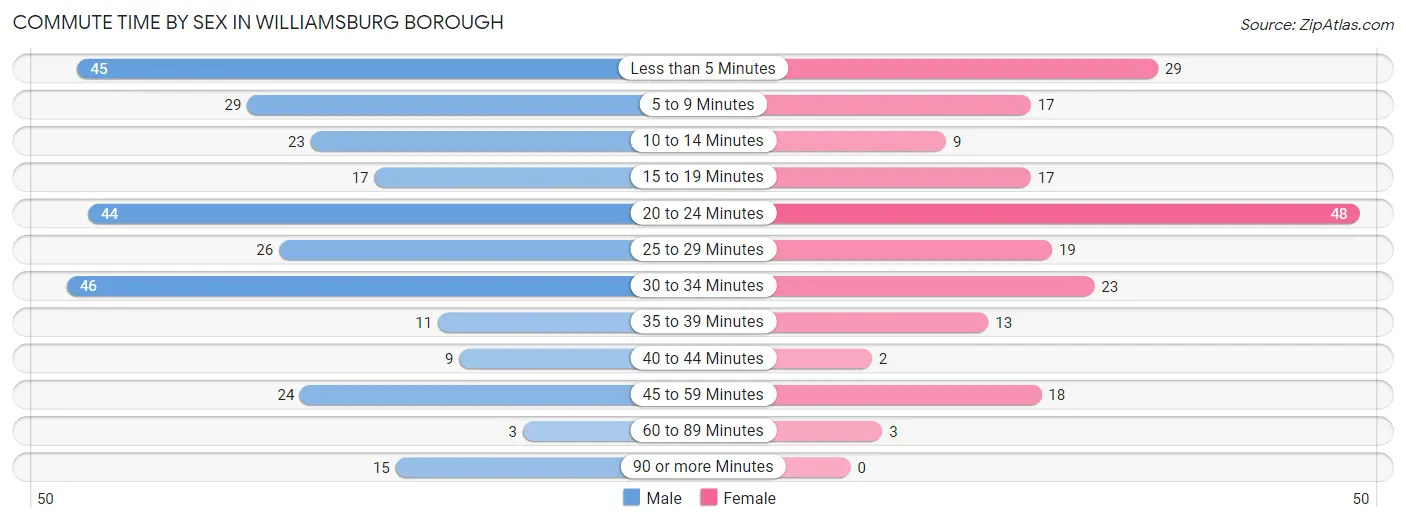
| Commute Time | Male | Female |
| Less than 5 Minutes | 45 (15.4%) | 29 (14.6%) |
| 5 to 9 Minutes | 29 (9.9%) | 17 (8.6%) |
| 10 to 14 Minutes | 23 (7.9%) | 9 (4.5%) |
| 15 to 19 Minutes | 17 (5.8%) | 17 (8.6%) |
| 20 to 24 Minutes | 44 (15.1%) | 48 (24.2%) |
| 25 to 29 Minutes | 26 (8.9%) | 19 (9.6%) |
| 30 to 34 Minutes | 46 (15.8%) | 23 (11.6%) |
| 35 to 39 Minutes | 11 (3.8%) | 13 (6.6%) |
| 40 to 44 Minutes | 9 (3.1%) | 2 (1.0%) |
| 45 to 59 Minutes | 24 (8.2%) | 18 (9.1%) |
| 60 to 89 Minutes | 3 (1.0%) | 3 (1.5%) |
| 90 or more Minutes | 15 (5.1%) | 0 (0.0%) |
Time of Departure to Work by Sex in Williamsburg borough
The most frequent times of departure to work in Williamsburg borough are 6:30 AM to 6:59 AM (56, 19.2%) for males and 7:00 AM to 7:29 AM (31, 15.7%) for females.
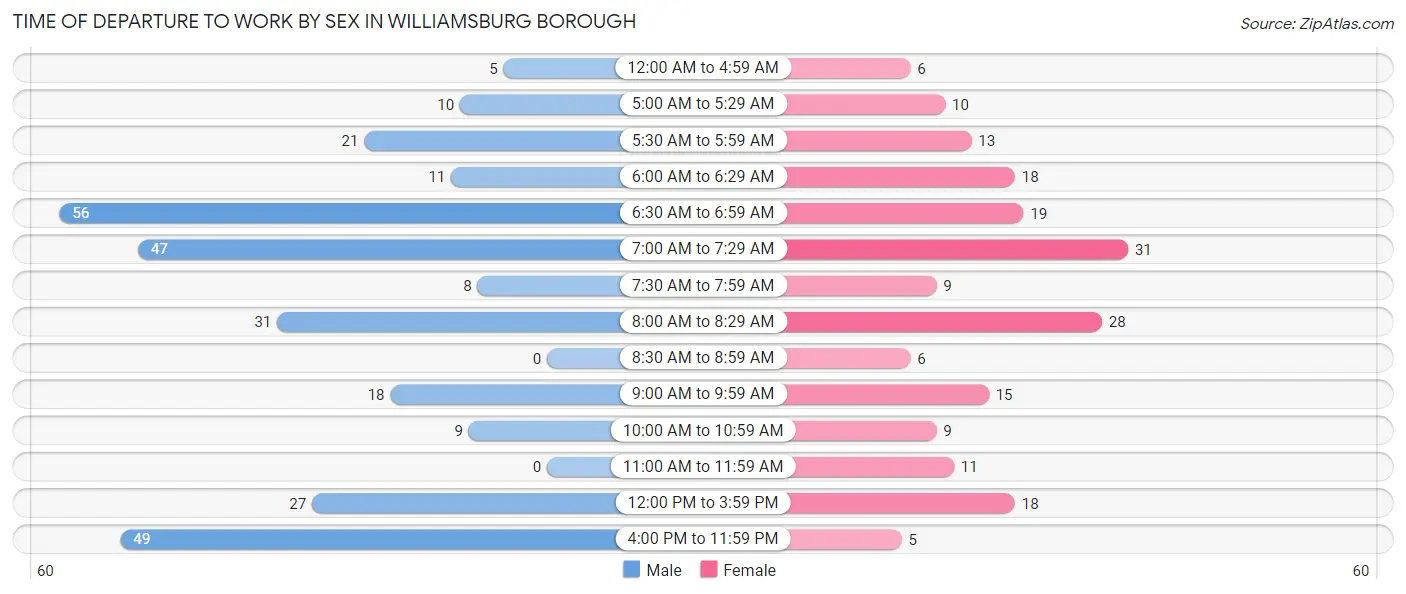
| Time of Departure | Male | Female |
| 12:00 AM to 4:59 AM | 5 (1.7%) | 6 (3.0%) |
| 5:00 AM to 5:29 AM | 10 (3.4%) | 10 (5.1%) |
| 5:30 AM to 5:59 AM | 21 (7.2%) | 13 (6.6%) |
| 6:00 AM to 6:29 AM | 11 (3.8%) | 18 (9.1%) |
| 6:30 AM to 6:59 AM | 56 (19.2%) | 19 (9.6%) |
| 7:00 AM to 7:29 AM | 47 (16.1%) | 31 (15.7%) |
| 7:30 AM to 7:59 AM | 8 (2.7%) | 9 (4.5%) |
| 8:00 AM to 8:29 AM | 31 (10.6%) | 28 (14.1%) |
| 8:30 AM to 8:59 AM | 0 (0.0%) | 6 (3.0%) |
| 9:00 AM to 9:59 AM | 18 (6.2%) | 15 (7.6%) |
| 10:00 AM to 10:59 AM | 9 (3.1%) | 9 (4.5%) |
| 11:00 AM to 11:59 AM | 0 (0.0%) | 11 (5.6%) |
| 12:00 PM to 3:59 PM | 27 (9.2%) | 18 (9.1%) |
| 4:00 PM to 11:59 PM | 49 (16.8%) | 5 (2.5%) |
| Total | 292 (100.0%) | 198 (100.0%) |
Housing Occupancy in Williamsburg borough
Occupancy by Ownership in Williamsburg borough
Of the total 506 dwellings in Williamsburg borough, owner-occupied units account for 342 (67.6%), while renter-occupied units make up 164 (32.4%).
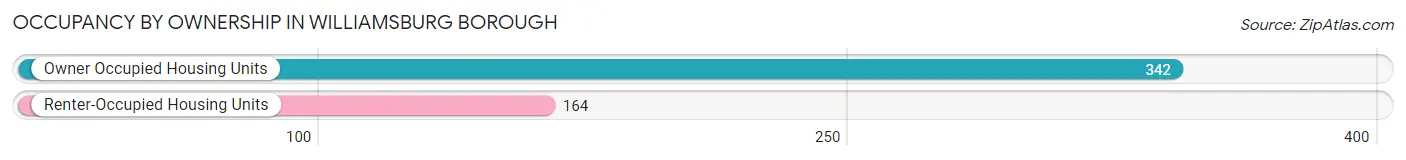
| Occupancy | # Housing Units | % Housing Units |
| Owner Occupied Housing Units | 342 | 67.6% |
| Renter-Occupied Housing Units | 164 | 32.4% |
| Total Occupied Housing Units | 506 | 100.0% |
Occupancy by Household Size in Williamsburg borough
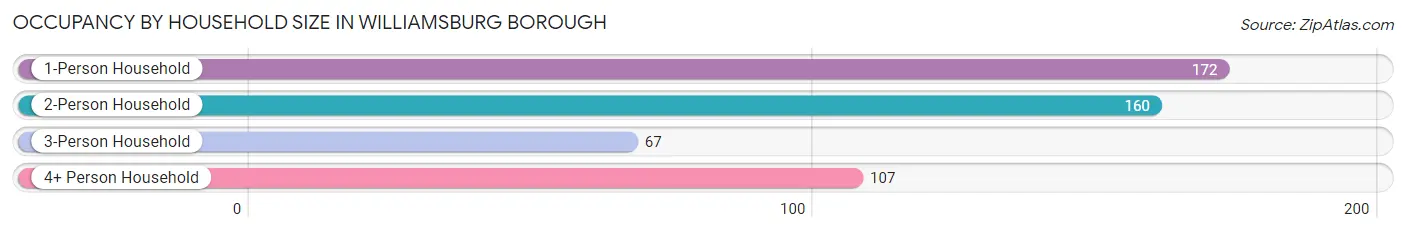
| Household Size | # Housing Units | % Housing Units |
| 1-Person Household | 172 | 34.0% |
| 2-Person Household | 160 | 31.6% |
| 3-Person Household | 67 | 13.2% |
| 4+ Person Household | 107 | 21.1% |
| Total Housing Units | 506 | 100.0% |
Occupancy by Ownership by Household Size in Williamsburg borough
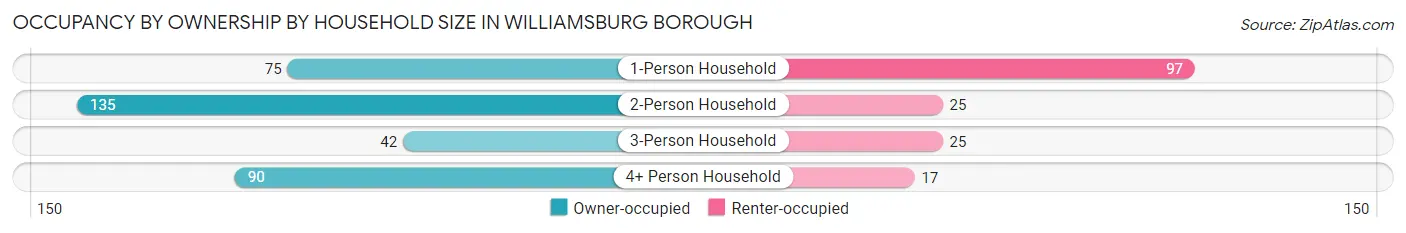
| Household Size | Owner-occupied | Renter-occupied |
| 1-Person Household | 75 (43.6%) | 97 (56.4%) |
| 2-Person Household | 135 (84.4%) | 25 (15.6%) |
| 3-Person Household | 42 (62.7%) | 25 (37.3%) |
| 4+ Person Household | 90 (84.1%) | 17 (15.9%) |
| Total Housing Units | 342 (67.6%) | 164 (32.4%) |
Occupancy by Educational Attainment in Williamsburg borough
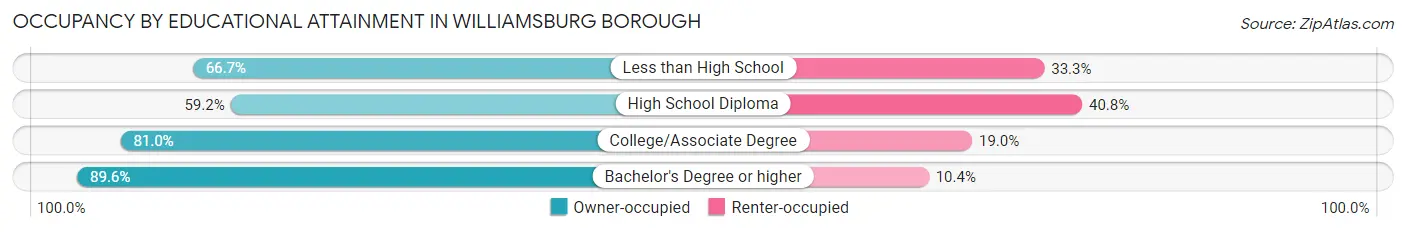
| Household Size | Owner-occupied | Renter-occupied |
| Less than High School | 14 (66.7%) | 7 (33.3%) |
| High School Diploma | 187 (59.2%) | 129 (40.8%) |
| College/Associate Degree | 98 (81.0%) | 23 (19.0%) |
| Bachelor's Degree or higher | 43 (89.6%) | 5 (10.4%) |
Occupancy by Age of Householder in Williamsburg borough
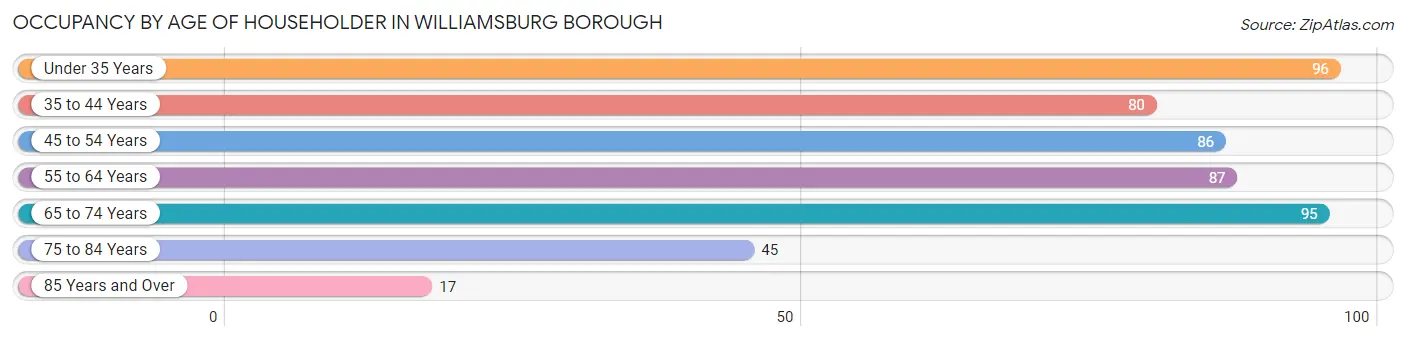
| Age Bracket | # Households | % Households |
| Under 35 Years | 96 | 19.0% |
| 35 to 44 Years | 80 | 15.8% |
| 45 to 54 Years | 86 | 17.0% |
| 55 to 64 Years | 87 | 17.2% |
| 65 to 74 Years | 95 | 18.8% |
| 75 to 84 Years | 45 | 8.9% |
| 85 Years and Over | 17 | 3.4% |
| Total | 506 | 100.0% |
Housing Finances in Williamsburg borough
Median Income by Occupancy in Williamsburg borough
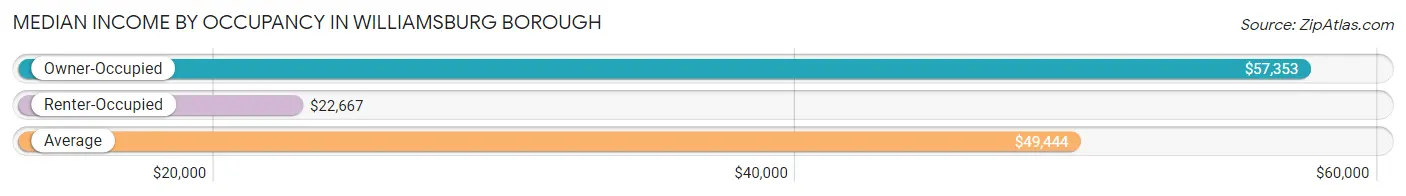
| Occupancy Type | # Households | Median Income |
| Owner-Occupied | 342 (67.6%) | $57,353 |
| Renter-Occupied | 164 (32.4%) | $22,667 |
| Average | 506 (100.0%) | $49,444 |
Occupancy by Householder Income Bracket in Williamsburg borough
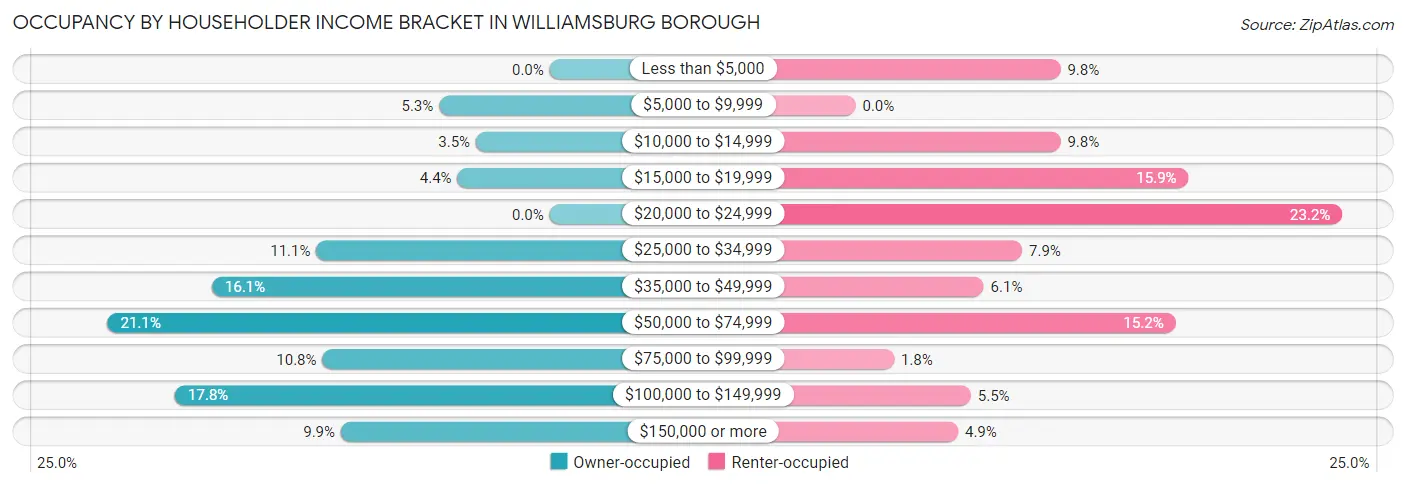
| Income Bracket | Owner-occupied | Renter-occupied |
| Less than $5,000 | 0 (0.0%) | 16 (9.8%) |
| $5,000 to $9,999 | 18 (5.3%) | 0 (0.0%) |
| $10,000 to $14,999 | 12 (3.5%) | 16 (9.8%) |
| $15,000 to $19,999 | 15 (4.4%) | 26 (15.9%) |
| $20,000 to $24,999 | 0 (0.0%) | 38 (23.2%) |
| $25,000 to $34,999 | 38 (11.1%) | 13 (7.9%) |
| $35,000 to $49,999 | 55 (16.1%) | 10 (6.1%) |
| $50,000 to $74,999 | 72 (21.0%) | 25 (15.2%) |
| $75,000 to $99,999 | 37 (10.8%) | 3 (1.8%) |
| $100,000 to $149,999 | 61 (17.8%) | 9 (5.5%) |
| $150,000 or more | 34 (9.9%) | 8 (4.9%) |
| Total | 342 (100.0%) | 164 (100.0%) |
Monthly Housing Cost Tiers in Williamsburg borough
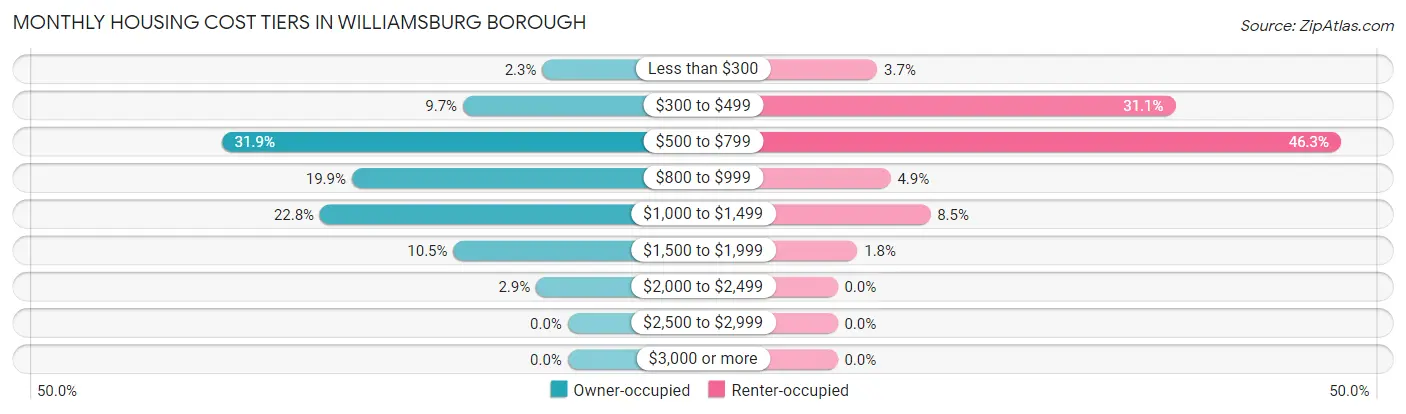
| Monthly Cost | Owner-occupied | Renter-occupied |
| Less than $300 | 8 (2.3%) | 6 (3.7%) |
| $300 to $499 | 33 (9.7%) | 51 (31.1%) |
| $500 to $799 | 109 (31.9%) | 76 (46.3%) |
| $800 to $999 | 68 (19.9%) | 8 (4.9%) |
| $1,000 to $1,499 | 78 (22.8%) | 14 (8.5%) |
| $1,500 to $1,999 | 36 (10.5%) | 3 (1.8%) |
| $2,000 to $2,499 | 10 (2.9%) | 0 (0.0%) |
| $2,500 to $2,999 | 0 (0.0%) | 0 (0.0%) |
| $3,000 or more | 0 (0.0%) | 0 (0.0%) |
| Total | 342 (100.0%) | 164 (100.0%) |
Physical Housing Characteristics in Williamsburg borough
Housing Structures in Williamsburg borough
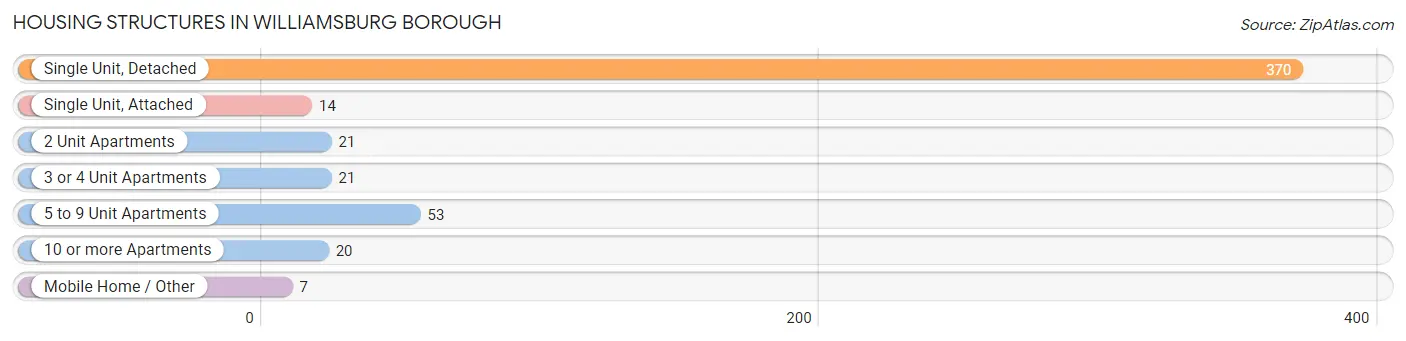
| Structure Type | # Housing Units | % Housing Units |
| Single Unit, Detached | 370 | 73.1% |
| Single Unit, Attached | 14 | 2.8% |
| 2 Unit Apartments | 21 | 4.2% |
| 3 or 4 Unit Apartments | 21 | 4.2% |
| 5 to 9 Unit Apartments | 53 | 10.5% |
| 10 or more Apartments | 20 | 4.0% |
| Mobile Home / Other | 7 | 1.4% |
| Total | 506 | 100.0% |
Housing Structures by Occupancy in Williamsburg borough
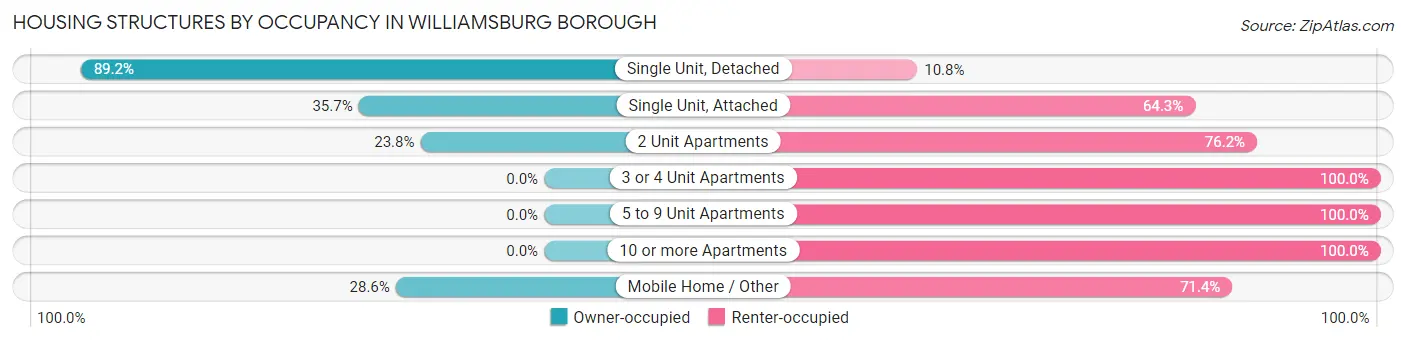
| Structure Type | Owner-occupied | Renter-occupied |
| Single Unit, Detached | 330 (89.2%) | 40 (10.8%) |
| Single Unit, Attached | 5 (35.7%) | 9 (64.3%) |
| 2 Unit Apartments | 5 (23.8%) | 16 (76.2%) |
| 3 or 4 Unit Apartments | 0 (0.0%) | 21 (100.0%) |
| 5 to 9 Unit Apartments | 0 (0.0%) | 53 (100.0%) |
| 10 or more Apartments | 0 (0.0%) | 20 (100.0%) |
| Mobile Home / Other | 2 (28.6%) | 5 (71.4%) |
| Total | 342 (67.6%) | 164 (32.4%) |
Housing Structures by Number of Rooms in Williamsburg borough
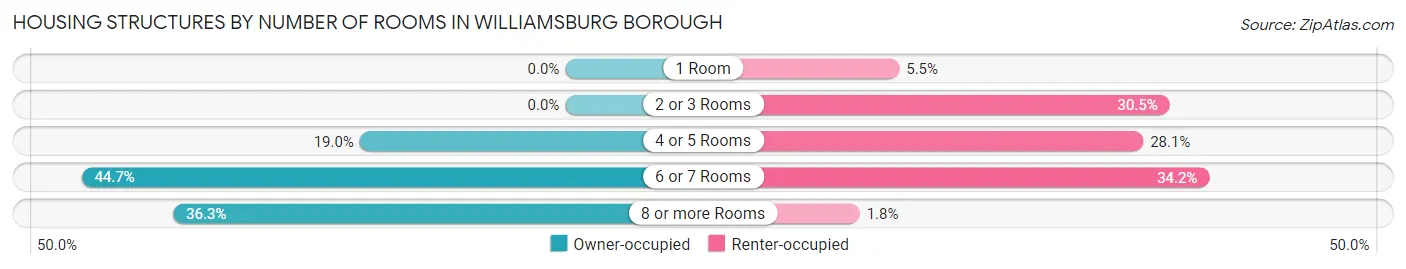
| Number of Rooms | Owner-occupied | Renter-occupied |
| 1 Room | 0 (0.0%) | 9 (5.5%) |
| 2 or 3 Rooms | 0 (0.0%) | 50 (30.5%) |
| 4 or 5 Rooms | 65 (19.0%) | 46 (28.1%) |
| 6 or 7 Rooms | 153 (44.7%) | 56 (34.2%) |
| 8 or more Rooms | 124 (36.3%) | 3 (1.8%) |
| Total | 342 (100.0%) | 164 (100.0%) |
Housing Structure by Heating Type in Williamsburg borough
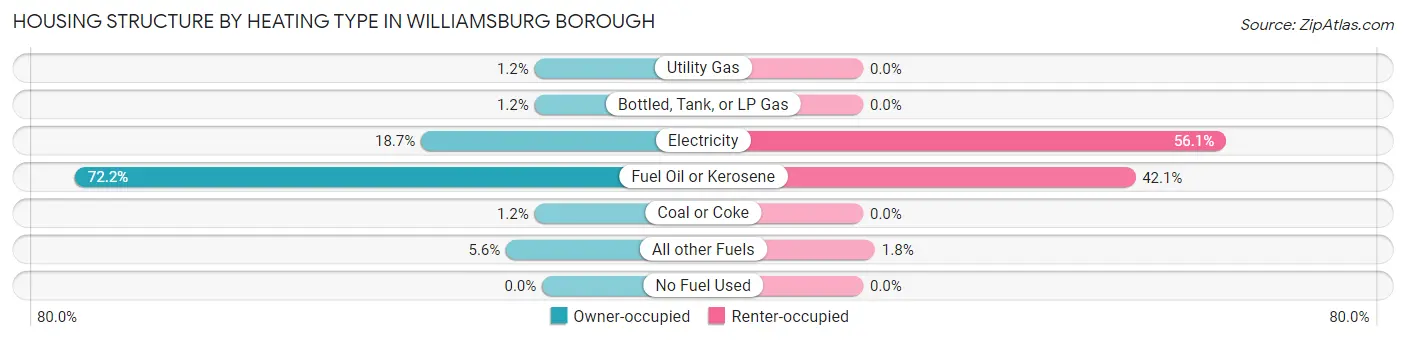
| Heating Type | Owner-occupied | Renter-occupied |
| Utility Gas | 4 (1.2%) | 0 (0.0%) |
| Bottled, Tank, or LP Gas | 4 (1.2%) | 0 (0.0%) |
| Electricity | 64 (18.7%) | 92 (56.1%) |
| Fuel Oil or Kerosene | 247 (72.2%) | 69 (42.1%) |
| Coal or Coke | 4 (1.2%) | 0 (0.0%) |
| All other Fuels | 19 (5.6%) | 3 (1.8%) |
| No Fuel Used | 0 (0.0%) | 0 (0.0%) |
| Total | 342 (100.0%) | 164 (100.0%) |
Household Vehicle Usage in Williamsburg borough
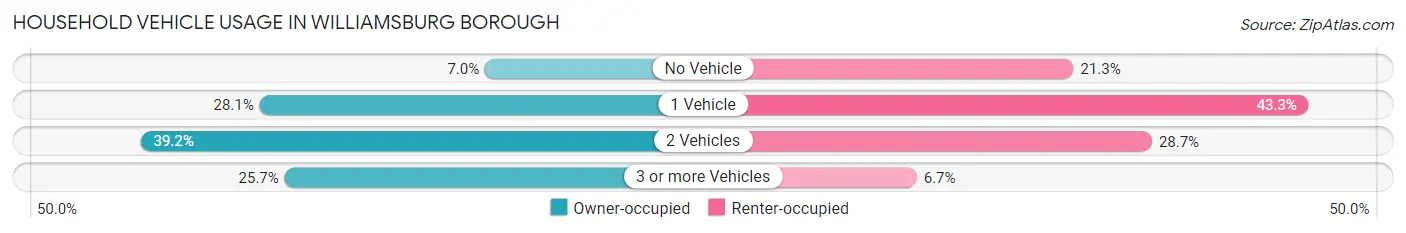
| Vehicles per Household | Owner-occupied | Renter-occupied |
| No Vehicle | 24 (7.0%) | 35 (21.3%) |
| 1 Vehicle | 96 (28.1%) | 71 (43.3%) |
| 2 Vehicles | 134 (39.2%) | 47 (28.7%) |
| 3 or more Vehicles | 88 (25.7%) | 11 (6.7%) |
| Total | 342 (100.0%) | 164 (100.0%) |
Real Estate & Mortgages in Williamsburg borough
Real Estate and Mortgage Overview in Williamsburg borough
| Characteristic | Without Mortgage | With Mortgage |
| Housing Units | 124 | 218 |
| Median Property Value | $98,700 | $116,400 |
| Median Household Income | $48,889 | $15 |
| Monthly Housing Costs | $553 | $0 |
| Real Estate Taxes | $1,394 | $0 |
Property Value by Mortgage Status in Williamsburg borough
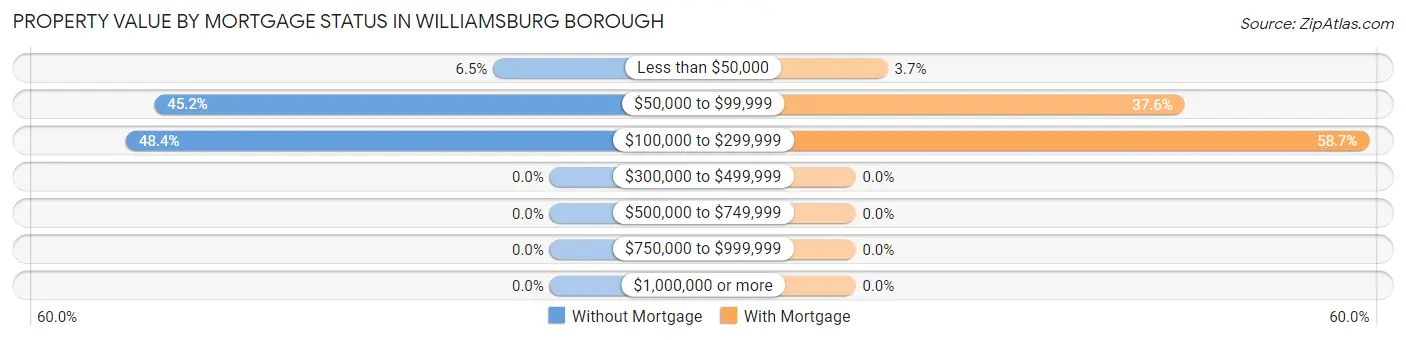
| Property Value | Without Mortgage | With Mortgage |
| Less than $50,000 | 8 (6.5%) | 8 (3.7%) |
| $50,000 to $99,999 | 56 (45.2%) | 82 (37.6%) |
| $100,000 to $299,999 | 60 (48.4%) | 128 (58.7%) |
| $300,000 to $499,999 | 0 (0.0%) | 0 (0.0%) |
| $500,000 to $749,999 | 0 (0.0%) | 0 (0.0%) |
| $750,000 to $999,999 | 0 (0.0%) | 0 (0.0%) |
| $1,000,000 or more | 0 (0.0%) | 0 (0.0%) |
| Total | 124 (100.0%) | 218 (100.0%) |
Household Income by Mortgage Status in Williamsburg borough
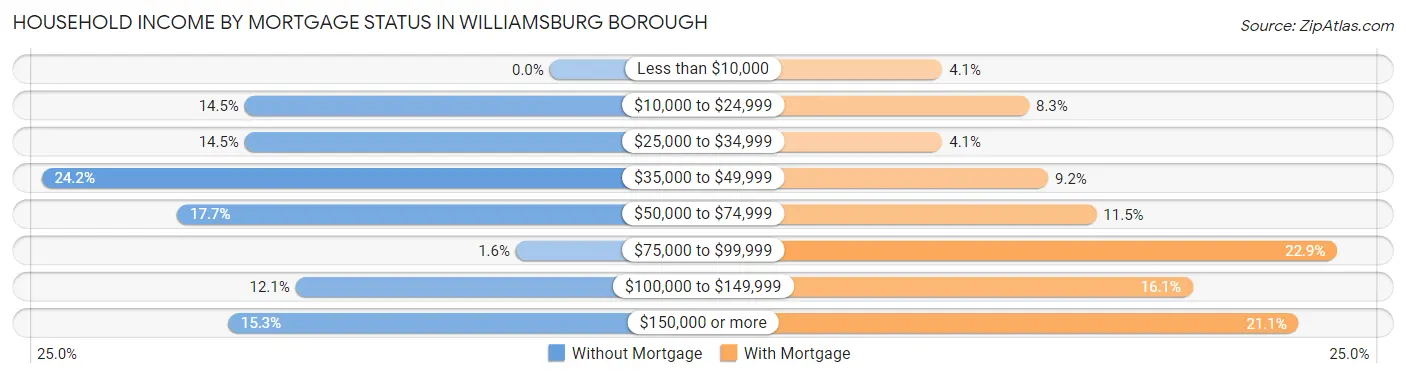
| Household Income | Without Mortgage | With Mortgage |
| Less than $10,000 | 0 (0.0%) | 9 (4.1%) |
| $10,000 to $24,999 | 18 (14.5%) | 18 (8.3%) |
| $25,000 to $34,999 | 18 (14.5%) | 9 (4.1%) |
| $35,000 to $49,999 | 30 (24.2%) | 20 (9.2%) |
| $50,000 to $74,999 | 22 (17.7%) | 25 (11.5%) |
| $75,000 to $99,999 | 2 (1.6%) | 50 (22.9%) |
| $100,000 to $149,999 | 15 (12.1%) | 35 (16.1%) |
| $150,000 or more | 19 (15.3%) | 46 (21.1%) |
| Total | 124 (100.0%) | 218 (100.0%) |
Property Value to Household Income Ratio in Williamsburg borough
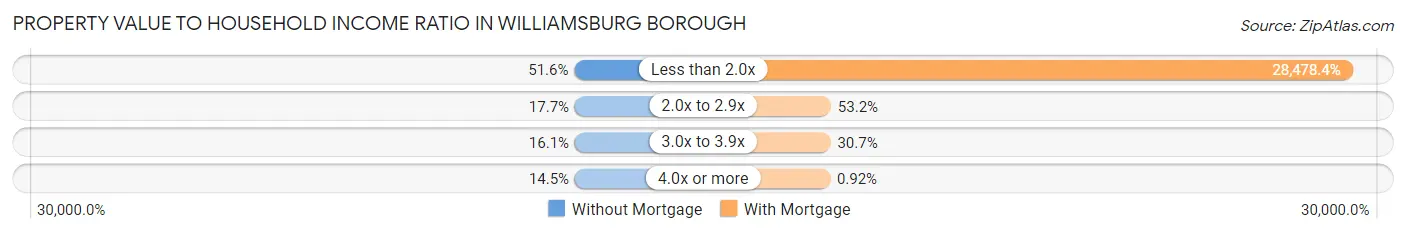
| Value-to-Income Ratio | Without Mortgage | With Mortgage |
| Less than 2.0x | 64 (51.6%) | 62,083 (28,478.4%) |
| 2.0x to 2.9x | 22 (17.7%) | 116 (53.2%) |
| 3.0x to 3.9x | 20 (16.1%) | 67 (30.7%) |
| 4.0x or more | 18 (14.5%) | 2 (0.9%) |
| Total | 124 (100.0%) | 218 (100.0%) |
Real Estate Taxes by Mortgage Status in Williamsburg borough
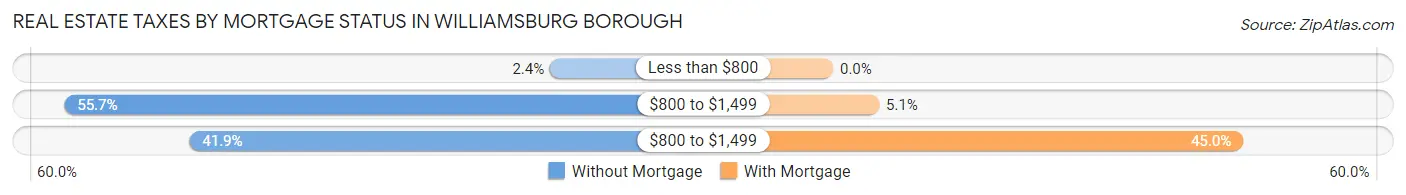
| Property Taxes | Without Mortgage | With Mortgage |
| Less than $800 | 3 (2.4%) | 0 (0.0%) |
| $800 to $1,499 | 69 (55.6%) | 11 (5.1%) |
| $800 to $1,499 | 52 (41.9%) | 98 (45.0%) |
| Total | 124 (100.0%) | 218 (100.0%) |
Health & Disability in Williamsburg borough
Health Insurance Coverage by Age in Williamsburg borough
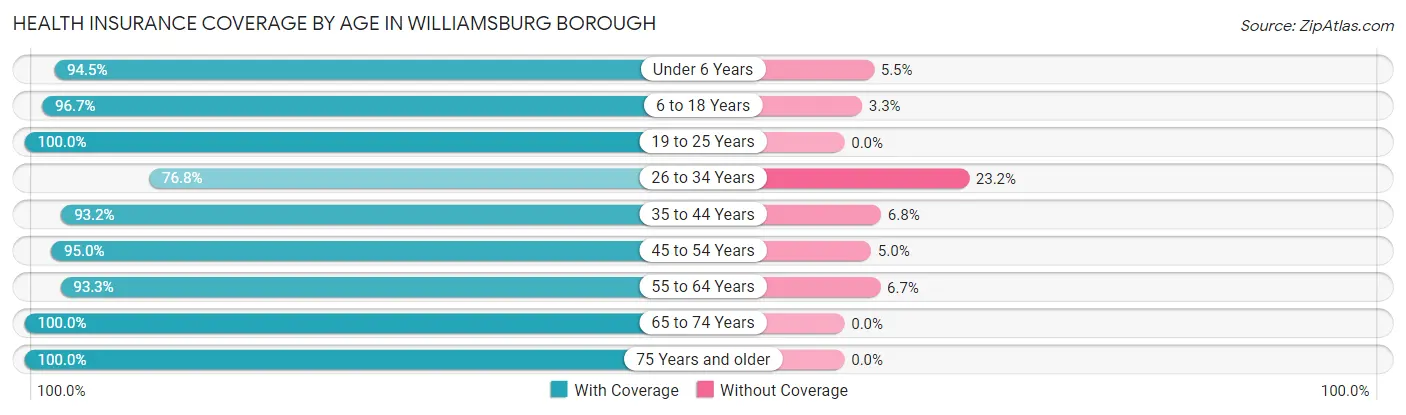
| Age Bracket | With Coverage | Without Coverage |
| Under 6 Years | 103 (94.5%) | 6 (5.5%) |
| 6 to 18 Years | 177 (96.7%) | 6 (3.3%) |
| 19 to 25 Years | 92 (100.0%) | 0 (0.0%) |
| 26 to 34 Years | 119 (76.8%) | 36 (23.2%) |
| 35 to 44 Years | 150 (93.2%) | 11 (6.8%) |
| 45 to 54 Years | 134 (95.0%) | 7 (5.0%) |
| 55 to 64 Years | 112 (93.3%) | 8 (6.7%) |
| 65 to 74 Years | 162 (100.0%) | 0 (0.0%) |
| 75 Years and older | 79 (100.0%) | 0 (0.0%) |
| Total | 1,128 (93.8%) | 74 (6.2%) |
Health Insurance Coverage by Citizenship Status in Williamsburg borough
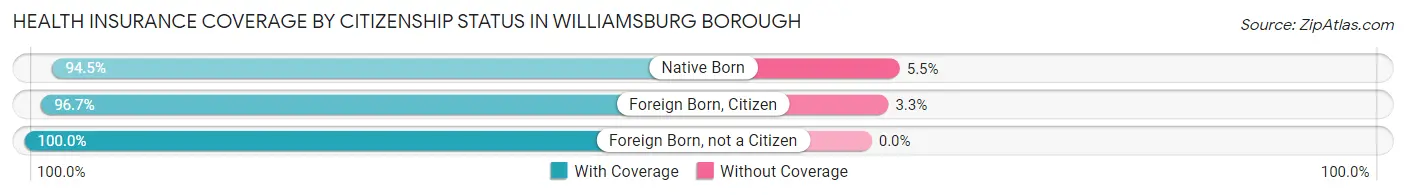
| Citizenship Status | With Coverage | Without Coverage |
| Native Born | 103 (94.5%) | 6 (5.5%) |
| Foreign Born, Citizen | 177 (96.7%) | 6 (3.3%) |
| Foreign Born, not a Citizen | 92 (100.0%) | 0 (0.0%) |
Health Insurance Coverage by Household Income in Williamsburg borough
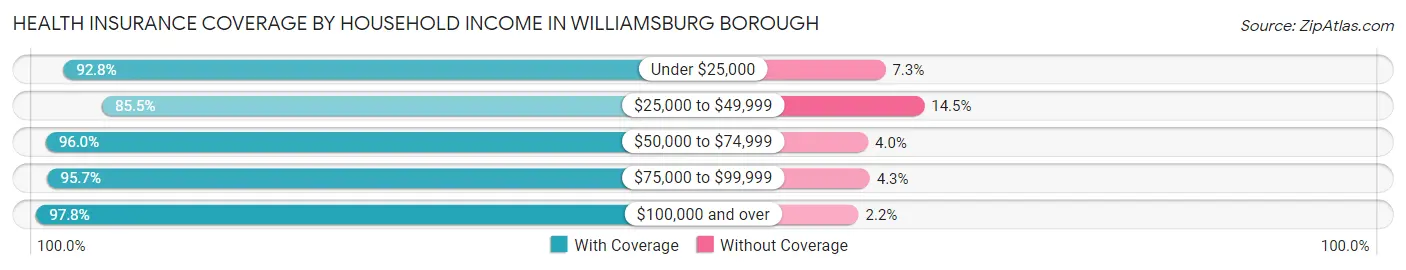
| Household Income | With Coverage | Without Coverage |
| Under $25,000 | 192 (92.7%) | 15 (7.2%) |
| $25,000 to $49,999 | 206 (85.5%) | 35 (14.5%) |
| $50,000 to $74,999 | 265 (96.0%) | 11 (4.0%) |
| $75,000 to $99,999 | 111 (95.7%) | 5 (4.3%) |
| $100,000 and over | 354 (97.8%) | 8 (2.2%) |
Public vs Private Health Insurance Coverage by Age in Williamsburg borough
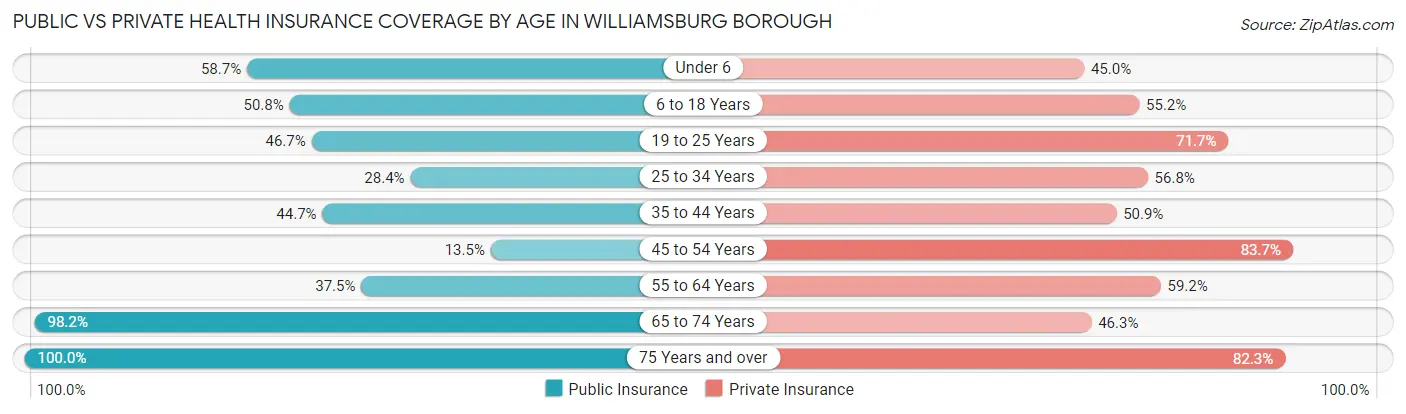
| Age Bracket | Public Insurance | Private Insurance |
| Under 6 | 64 (58.7%) | 49 (45.0%) |
| 6 to 18 Years | 93 (50.8%) | 101 (55.2%) |
| 19 to 25 Years | 43 (46.7%) | 66 (71.7%) |
| 25 to 34 Years | 44 (28.4%) | 88 (56.8%) |
| 35 to 44 Years | 72 (44.7%) | 82 (50.9%) |
| 45 to 54 Years | 19 (13.5%) | 118 (83.7%) |
| 55 to 64 Years | 45 (37.5%) | 71 (59.2%) |
| 65 to 74 Years | 159 (98.2%) | 75 (46.3%) |
| 75 Years and over | 79 (100.0%) | 65 (82.3%) |
| Total | 618 (51.4%) | 715 (59.5%) |
Disability Status by Sex by Age in Williamsburg borough
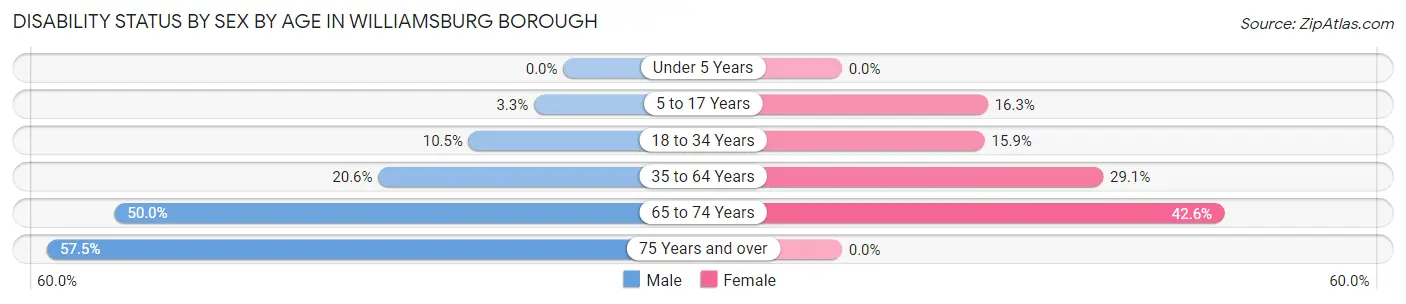
| Age Bracket | Male | Female |
| Under 5 Years | 0 (0.0%) | 0 (0.0%) |
| 5 to 17 Years | 3 (3.3%) | 13 (16.3%) |
| 18 to 34 Years | 14 (10.5%) | 21 (15.9%) |
| 35 to 64 Years | 48 (20.6%) | 55 (29.1%) |
| 65 to 74 Years | 34 (50.0%) | 40 (42.5%) |
| 75 Years and over | 23 (57.5%) | 0 (0.0%) |
Disability Class by Sex by Age in Williamsburg borough
Disability Class: Hearing Difficulty
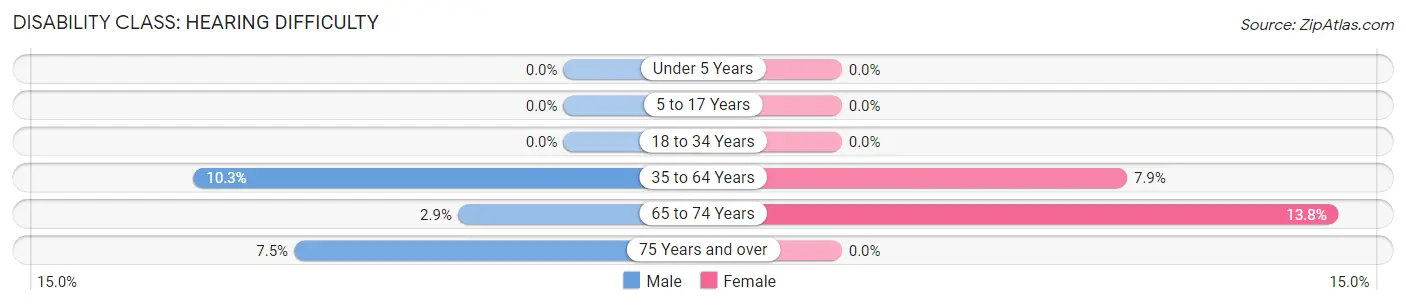
| Age Bracket | Male | Female |
| Under 5 Years | 0 (0.0%) | 0 (0.0%) |
| 5 to 17 Years | 0 (0.0%) | 0 (0.0%) |
| 18 to 34 Years | 0 (0.0%) | 0 (0.0%) |
| 35 to 64 Years | 24 (10.3%) | 15 (7.9%) |
| 65 to 74 Years | 2 (2.9%) | 13 (13.8%) |
| 75 Years and over | 3 (7.5%) | 0 (0.0%) |
Disability Class: Vision Difficulty
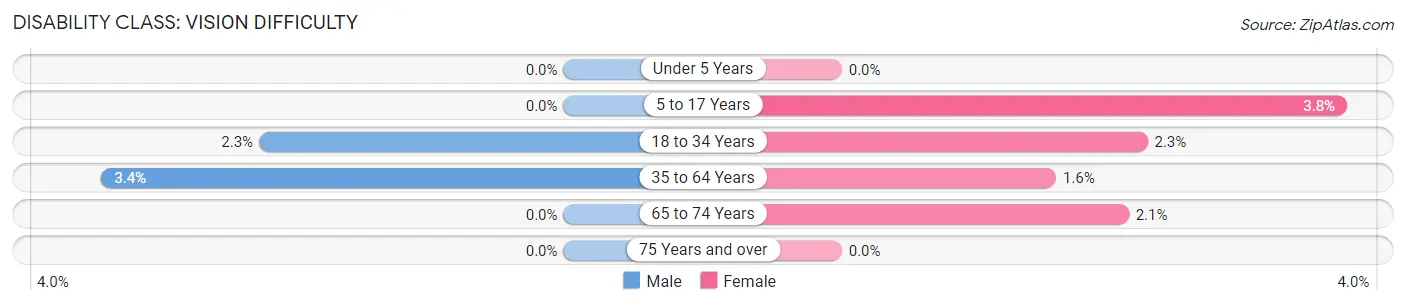
| Age Bracket | Male | Female |
| Under 5 Years | 0 (0.0%) | 0 (0.0%) |
| 5 to 17 Years | 0 (0.0%) | 3 (3.7%) |
| 18 to 34 Years | 3 (2.3%) | 3 (2.3%) |
| 35 to 64 Years | 8 (3.4%) | 3 (1.6%) |
| 65 to 74 Years | 0 (0.0%) | 2 (2.1%) |
| 75 Years and over | 0 (0.0%) | 0 (0.0%) |
Disability Class: Cognitive Difficulty
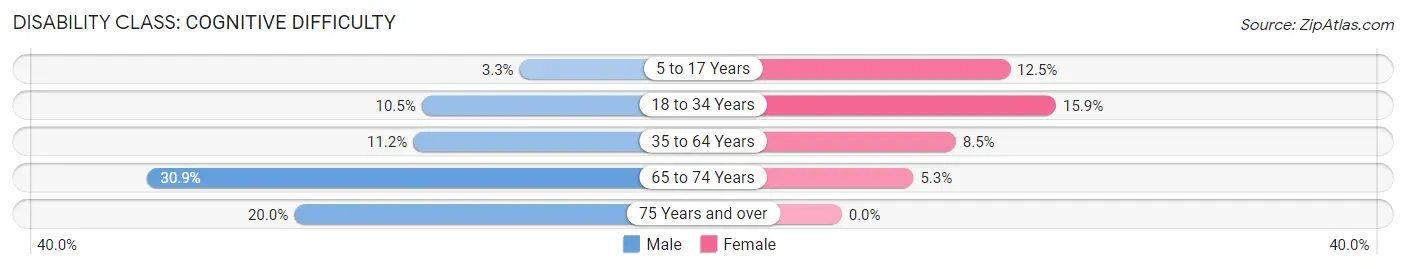
| Age Bracket | Male | Female |
| 5 to 17 Years | 3 (3.3%) | 10 (12.5%) |
| 18 to 34 Years | 14 (10.5%) | 21 (15.9%) |
| 35 to 64 Years | 26 (11.2%) | 16 (8.5%) |
| 65 to 74 Years | 21 (30.9%) | 5 (5.3%) |
| 75 Years and over | 8 (20.0%) | 0 (0.0%) |
Disability Class: Ambulatory Difficulty
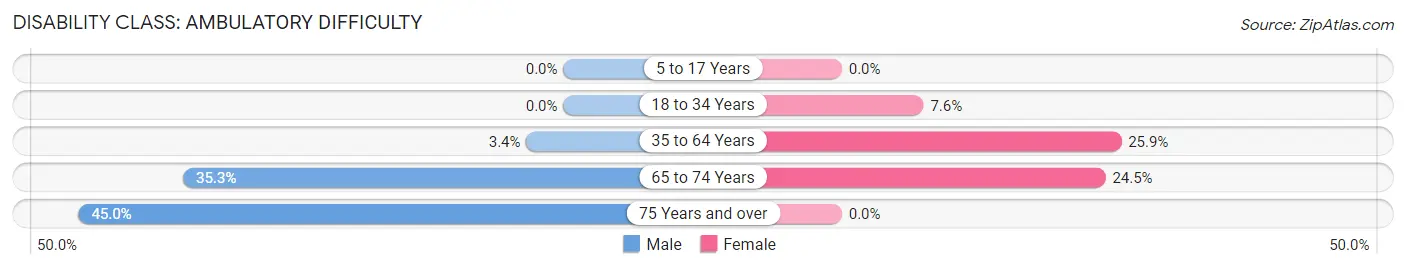
| Age Bracket | Male | Female |
| 5 to 17 Years | 0 (0.0%) | 0 (0.0%) |
| 18 to 34 Years | 0 (0.0%) | 10 (7.6%) |
| 35 to 64 Years | 8 (3.4%) | 49 (25.9%) |
| 65 to 74 Years | 24 (35.3%) | 23 (24.5%) |
| 75 Years and over | 18 (45.0%) | 0 (0.0%) |
Disability Class: Self-Care Difficulty
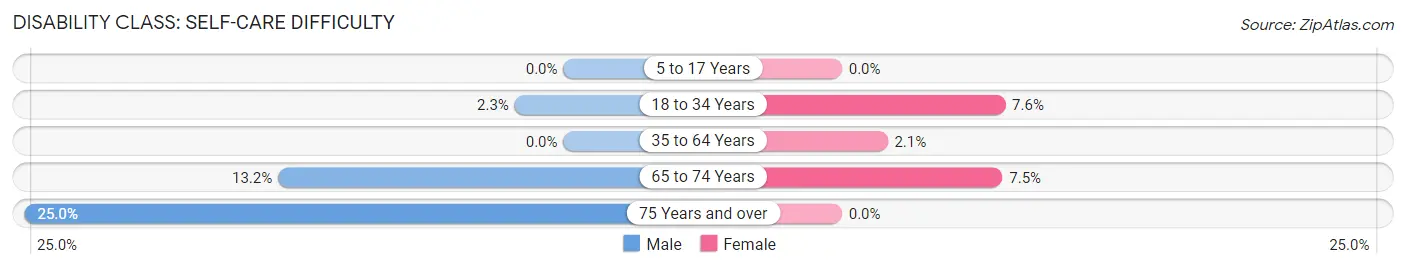
| Age Bracket | Male | Female |
| 5 to 17 Years | 0 (0.0%) | 0 (0.0%) |
| 18 to 34 Years | 3 (2.3%) | 10 (7.6%) |
| 35 to 64 Years | 0 (0.0%) | 4 (2.1%) |
| 65 to 74 Years | 9 (13.2%) | 7 (7.4%) |
| 75 Years and over | 10 (25.0%) | 0 (0.0%) |
Technology Access in Williamsburg borough
Computing Device Access in Williamsburg borough
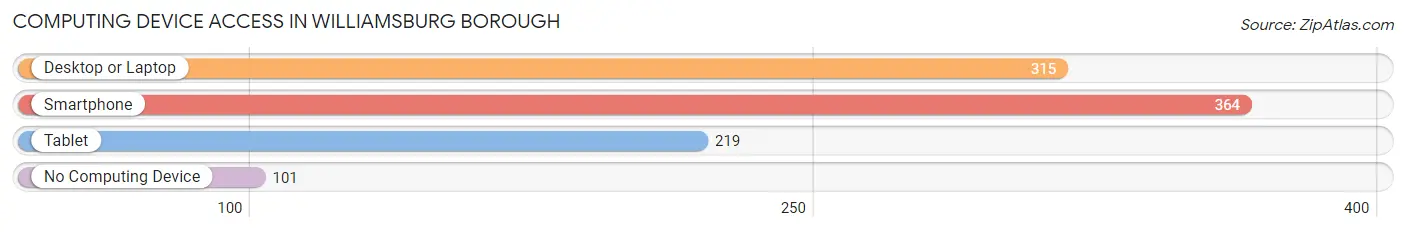
| Device Type | # Households | % Households |
| Desktop or Laptop | 315 | 62.3% |
| Smartphone | 364 | 71.9% |
| Tablet | 219 | 43.3% |
| No Computing Device | 101 | 20.0% |
| Total | 506 | 100.0% |
Internet Access in Williamsburg borough
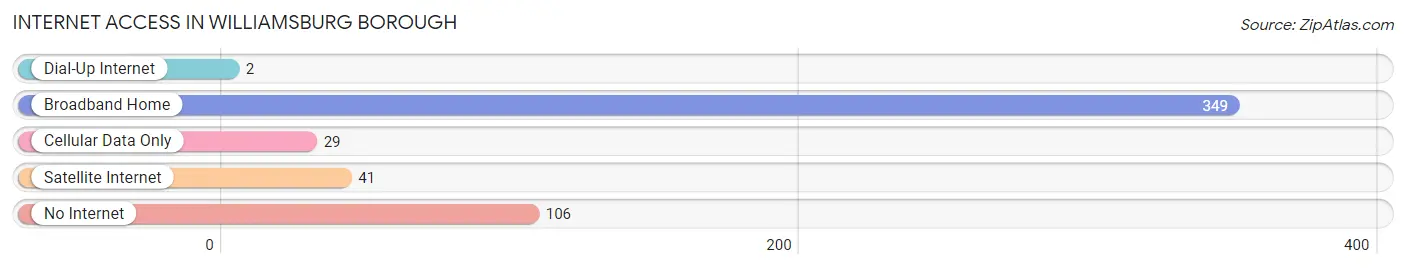
| Internet Type | # Households | % Households |
| Dial-Up Internet | 2 | 0.4% |
| Broadband Home | 349 | 69.0% |
| Cellular Data Only | 29 | 5.7% |
| Satellite Internet | 41 | 8.1% |
| No Internet | 106 | 20.9% |
| Total | 506 | 100.0% |
Williamsburg borough Summary
Williamsburg Borough is a small borough located in Blair County, Pennsylvania. It is situated in the foothills of the Allegheny Mountains, approximately 10 miles east of Altoona. The borough was founded in 1876 and is home to a population of approximately 1,400 people.
History
The area that is now Williamsburg Borough was first settled in the late 1700s by German immigrants. The first settlers were Jacob and Mary (Miller) Williams, who established a homestead in the area in 1790. The Williams family was one of the first to settle in the area and their homestead was the first to be established in what is now Williamsburg Borough.
The area was originally known as Williamsburg Township, and was part of Blair County. In 1876, the township was incorporated as a borough, and the name was changed to Williamsburg Borough. The borough was named after the Williams family, who were the first settlers in the area.
Geography
Williamsburg Borough is located in the foothills of the Allegheny Mountains, approximately 10 miles east of Altoona. The borough is situated in a valley, surrounded by hills and mountains. The borough is located in a rural area, and is home to a variety of wildlife, including deer, bear, and wild turkey.
The borough is located in a humid continental climate zone, with cold winters and hot summers. The average annual temperature is around 50 degrees Fahrenheit, and the average annual precipitation is around 40 inches.
Economy
The economy of Williamsburg Borough is largely based on agriculture and tourism. The borough is home to several farms, which produce a variety of crops, including corn, soybeans, hay, and wheat. The borough is also home to several tourist attractions, including the Williamsburg Historical Museum, the Williamsburg Railroad Museum, and the Williamsburg Winery.
The borough is also home to several small businesses, including restaurants, retail stores, and service providers. The borough is home to several manufacturing companies, including a furniture manufacturer, a plastics manufacturer, and a metal fabrication company.
Demographics
As of the 2010 census, the population of Williamsburg Borough was 1,400. The racial makeup of the borough was 97.3% White, 0.7% African American, 0.3% Native American, 0.3% Asian, and 1.3% from other races. The median household income was $41,250, and the median family income was $50,000.
The borough is home to a variety of religious denominations, including Catholic, Lutheran, Methodist, and Presbyterian. The borough is also home to a variety of educational institutions, including a public elementary school, a public middle school, and a public high school.
Conclusion
Williamsburg Borough is a small borough located in Blair County, Pennsylvania. It is situated in the foothills of the Allegheny Mountains, approximately 10 miles east of Altoona. The borough was founded in 1876 and is home to a population of approximately 1,400 people. The economy of Williamsburg Borough is largely based on agriculture and tourism, and the borough is home to several small businesses, manufacturing companies, and educational institutions. The racial makeup of the borough is 97.3% White, 0.7% African American, 0.3% Native American, 0.3% Asian, and 1.3% from other races.
Common Questions
What is Per Capita Income in Williamsburg borough?
Per Capita income in Williamsburg borough is $27,389.
What is the Median Family Income in Williamsburg borough?
Median Family Income in Williamsburg borough is $61,042.
What is the Median Household income in Williamsburg borough?
Median Household Income in Williamsburg borough is $49,444.
What is Income or Wage Gap in Williamsburg borough?
Income or Wage Gap in Williamsburg borough is 17.2%.
Women in Williamsburg borough earn 82.8 cents for every dollar earned by a man.
What is Inequality or Gini Index in Williamsburg borough?
Inequality or Gini Index in Williamsburg borough is 0.46.
What is the Total Population of Williamsburg borough?
Total Population of Williamsburg borough is 1,202.
What is the Total Male Population of Williamsburg borough?
Total Male Population of Williamsburg borough is 610.
What is the Total Female Population of Williamsburg borough?
Total Female Population of Williamsburg borough is 592.
What is the Ratio of Males per 100 Females in Williamsburg borough?
There are 103.04 Males per 100 Females in Williamsburg borough.
What is the Ratio of Females per 100 Males in Williamsburg borough?
There are 97.05 Females per 100 Males in Williamsburg borough.
What is the Median Population Age in Williamsburg borough?
Median Population Age in Williamsburg borough is 37.2 Years.
What is the Average Family Size in Williamsburg borough
Average Family Size in Williamsburg borough is 3.0 People.
What is the Average Household Size in Williamsburg borough
Average Household Size in Williamsburg borough is 2.4 People.
How Large is the Labor Force in Williamsburg borough?
There are 532 People in the Labor Forcein in Williamsburg borough.
What is the Percentage of People in the Labor Force in Williamsburg borough?
55.9% of People are in the Labor Force in Williamsburg borough.
What is the Unemployment Rate in Williamsburg borough?
Unemployment Rate in Williamsburg borough is 4.3%.