Cities with the Highest Percentage of Sri Lankan Population in Maryland
RELATED REPORTS & OPTIONS
Sri Lankan
Maryland
Compare Cities
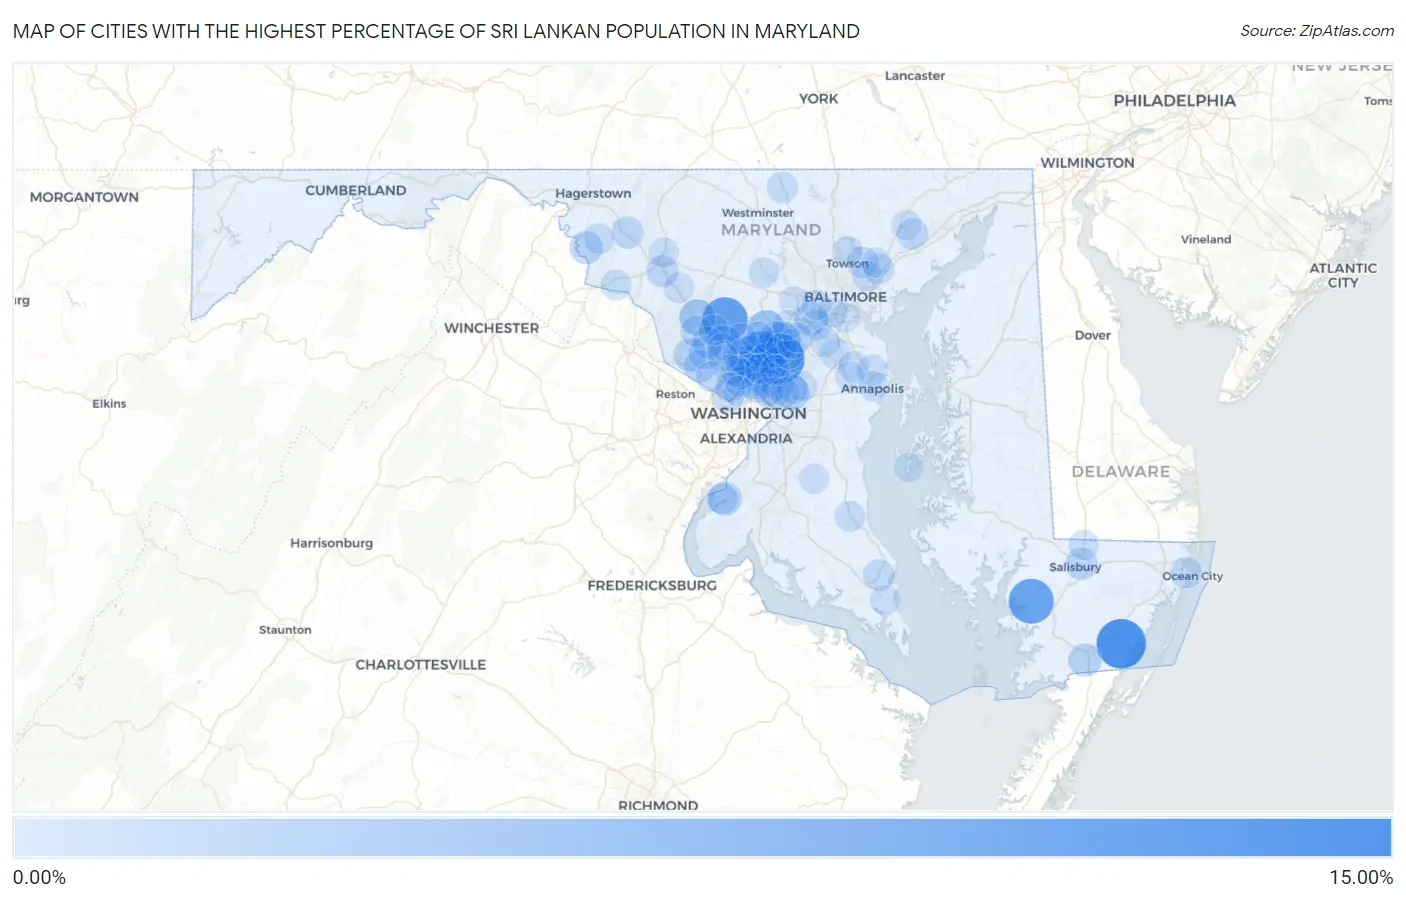
Map of Cities with the Highest Percentage of Sri Lankan Population in Maryland
0.00%
15.00%
Cities with the Highest Percentage of Sri Lankan Population in Maryland
| City | Sri Lankan | vs State | vs National | |
| 1. | Girdletree | 10.66% | 0.55%(+10.1)#1 | 0.68%(+9.98)#48 |
| 2. | Konterra | 10.47% | 0.55%(+9.93)#2 | 0.68%(+9.79)#50 |
| 3. | Laytonsville | 8.56% | 0.55%(+8.01)#3 | 0.68%(+7.88)#67 |
| 4. | Mount Vernon | 8.25% | 0.55%(+7.71)#4 | 0.68%(+7.57)#73 |
| 5. | Burnt Mills | 6.69% | 0.55%(+6.14)#5 | 0.68%(+6.01)#93 |
| 6. | Layhill | 5.18% | 0.55%(+4.63)#6 | 0.68%(+4.50)#150 |
| 7. | Calverton | 4.43% | 0.55%(+3.89)#7 | 0.68%(+3.75)#200 |
| 8. | Burtonsville | 4.27% | 0.55%(+3.73)#8 | 0.68%(+3.60)#211 |
| 9. | Highland | 4.10% | 0.55%(+3.55)#9 | 0.68%(+3.42)#228 |
| 10. | Cloverly | 4.06% | 0.55%(+3.52)#10 | 0.68%(+3.39)#233 |
| 11. | Colesville | 3.69% | 0.55%(+3.15)#11 | 0.68%(+3.01)#269 |
| 12. | Scaggsville | 3.68% | 0.55%(+3.13)#12 | 0.68%(+3.00)#271 |
| 13. | Clarksburg | 3.68% | 0.55%(+3.13)#13 | 0.68%(+3.00)#272 |
| 14. | Spencerville | 2.82% | 0.55%(+2.27)#14 | 0.68%(+2.14)#427 |
| 15. | Fairland | 2.80% | 0.55%(+2.26)#15 | 0.68%(+2.12)#433 |
| 16. | Redland | 2.80% | 0.55%(+2.25)#16 | 0.68%(+2.12)#435 |
| 17. | Lanham | 2.70% | 0.55%(+2.16)#17 | 0.68%(+2.02)#458 |
| 18. | Potomac Heights | 2.49% | 0.55%(+1.94)#18 | 0.68%(+1.81)#503 |
| 19. | Ilchester | 2.44% | 0.55%(+1.89)#19 | 0.68%(+1.76)#515 |
| 20. | Brown Station | 2.28% | 0.55%(+1.73)#20 | 0.68%(+1.60)#583 |
| 21. | Sharpsburg | 2.08% | 0.55%(+1.53)#21 | 0.68%(+1.40)#647 |
| 22. | Pocomoke City | 2.06% | 0.55%(+1.52)#22 | 0.68%(+1.38)#654 |
| 23. | Four Corners | 2.06% | 0.55%(+1.52)#23 | 0.68%(+1.38)#656 |
| 24. | Darnestown | 2.05% | 0.55%(+1.51)#24 | 0.68%(+1.37)#658 |
| 25. | Fulton | 1.97% | 0.55%(+1.42)#25 | 0.68%(+1.29)#689 |
| 26. | North Potomac | 1.94% | 0.55%(+1.39)#26 | 0.68%(+1.26)#709 |
| 27. | Wheaton | 1.83% | 0.55%(+1.29)#27 | 0.68%(+1.16)#766 |
| 28. | Brookmont | 1.80% | 0.55%(+1.25)#28 | 0.68%(+1.12)#788 |
| 29. | Travilah | 1.77% | 0.55%(+1.23)#29 | 0.68%(+1.09)#801 |
| 30. | Salisbury | 1.77% | 0.55%(+1.22)#30 | 0.68%(+1.09)#803 |
| 31. | Silver Spring | 1.65% | 0.55%(+1.10)#31 | 0.68%(+0.967)#887 |
| 32. | Myersville | 1.64% | 0.55%(+1.10)#32 | 0.68%(+0.966)#889 |
| 33. | Berwyn Heights | 1.63% | 0.55%(+1.09)#33 | 0.68%(+0.952)#898 |
| 34. | Ballenger Creek | 1.57% | 0.55%(+1.02)#34 | 0.68%(+0.888)#960 |
| 35. | Flower Hill | 1.50% | 0.55%(+0.959)#35 | 0.68%(+0.825)#1,001 |
| 36. | Carney | 1.46% | 0.55%(+0.920)#36 | 0.68%(+0.786)#1,036 |
| 37. | Glenmont | 1.45% | 0.55%(+0.904)#37 | 0.68%(+0.771)#1,050 |
| 38. | Kemp Mill | 1.43% | 0.55%(+0.888)#38 | 0.68%(+0.754)#1,061 |
| 39. | Aspen Hill | 1.43% | 0.55%(+0.883)#39 | 0.68%(+0.750)#1,069 |
| 40. | Germantown | 1.42% | 0.55%(+0.873)#40 | 0.68%(+0.739)#1,078 |
| 41. | Ashton Sandy Spring | 1.42% | 0.55%(+0.871)#41 | 0.68%(+0.738)#1,083 |
| 42. | Solomons | 1.38% | 0.55%(+0.838)#42 | 0.68%(+0.704)#1,111 |
| 43. | Bel Air South | 1.38% | 0.55%(+0.835)#43 | 0.68%(+0.701)#1,113 |
| 44. | Gaithersburg | 1.36% | 0.55%(+0.820)#44 | 0.68%(+0.686)#1,130 |
| 45. | West Ocean City | 1.30% | 0.55%(+0.751)#45 | 0.68%(+0.618)#1,198 |
| 46. | Manchester | 1.26% | 0.55%(+0.713)#46 | 0.68%(+0.580)#1,246 |
| 47. | Elkridge | 1.24% | 0.55%(+0.694)#47 | 0.68%(+0.561)#1,270 |
| 48. | Derwood | 1.19% | 0.55%(+0.644)#48 | 0.68%(+0.511)#1,327 |
| 49. | North Chevy Chase | 1.17% | 0.55%(+0.630)#49 | 0.68%(+0.496)#1,342 |
| 50. | Gambrills | 1.13% | 0.55%(+0.580)#50 | 0.68%(+0.447)#1,397 |
| 51. | Kensington | 1.12% | 0.55%(+0.570)#51 | 0.68%(+0.437)#1,412 |
| 52. | University Park | 1.11% | 0.55%(+0.566)#52 | 0.68%(+0.433)#1,418 |
| 53. | Arnold | 1.06% | 0.55%(+0.510)#53 | 0.68%(+0.377)#1,494 |
| 54. | Olney | 1.03% | 0.55%(+0.485)#54 | 0.68%(+0.352)#1,521 |
| 55. | Keedysville | 1.02% | 0.55%(+0.479)#55 | 0.68%(+0.345)#1,536 |
| 56. | North Bethesda | 1.02% | 0.55%(+0.478)#56 | 0.68%(+0.344)#1,537 |
| 57. | Rosemont | 1.01% | 0.55%(+0.462)#57 | 0.68%(+0.328)#1,554 |
| 58. | Indian Head | 0.99% | 0.55%(+0.447)#58 | 0.68%(+0.314)#1,572 |
| 59. | Garrett Park | 0.98% | 0.55%(+0.435)#59 | 0.68%(+0.302)#1,593 |
| 60. | Prince Frederick | 0.96% | 0.55%(+0.418)#60 | 0.68%(+0.285)#1,620 |
| 61. | Rockville | 0.95% | 0.55%(+0.401)#61 | 0.68%(+0.267)#1,643 |
| 62. | Sykesville | 0.93% | 0.55%(+0.384)#62 | 0.68%(+0.251)#1,690 |
| 63. | Adelphi | 0.91% | 0.55%(+0.370)#63 | 0.68%(+0.236)#1,717 |
| 64. | Timonium | 0.91% | 0.55%(+0.363)#64 | 0.68%(+0.230)#1,734 |
| 65. | Chevy Chase Village | 0.90% | 0.55%(+0.357)#65 | 0.68%(+0.223)#1,743 |
| 66. | Herald Harbor | 0.89% | 0.55%(+0.347)#66 | 0.68%(+0.214)#1,753 |
| 67. | White Marsh | 0.89% | 0.55%(+0.345)#67 | 0.68%(+0.212)#1,758 |
| 68. | Urbana | 0.85% | 0.55%(+0.307)#68 | 0.68%(+0.174)#1,818 |
| 69. | Naval Academy | 0.84% | 0.55%(+0.298)#69 | 0.68%(+0.165)#1,832 |
| 70. | Delmar | 0.82% | 0.55%(+0.276)#70 | 0.68%(+0.143)#1,883 |
| 71. | Potomac | 0.81% | 0.55%(+0.268)#71 | 0.68%(+0.134)#1,901 |
| 72. | Montgomery Village | 0.81% | 0.55%(+0.266)#72 | 0.68%(+0.133)#1,904 |
| 73. | Overlea | 0.80% | 0.55%(+0.252)#73 | 0.68%(+0.119)#1,928 |
| 74. | Baden | 0.79% | 0.55%(+0.244)#74 | 0.68%(+0.110)#1,944 |
| 75. | Laurel | 0.79% | 0.55%(+0.243)#75 | 0.68%(+0.109)#1,947 |
| 76. | Frederick | 0.78% | 0.55%(+0.234)#76 | 0.68%(+0.101)#1,972 |
| 77. | Severn | 0.78% | 0.55%(+0.231)#77 | 0.68%(+0.098)#1,984 |
| 78. | Takoma Park | 0.76% | 0.55%(+0.213)#78 | 0.68%(+0.080)#2,017 |
| 79. | Bethesda | 0.76% | 0.55%(+0.212)#79 | 0.68%(+0.078)#2,018 |
| 80. | Woodlawn Cdp Baltimore County | 0.76% | 0.55%(+0.210)#80 | 0.68%(+0.077)#2,020 |
| 81. | White Oak | 0.74% | 0.55%(+0.197)#81 | 0.68%(+0.064)#2,049 |
| 82. | West Laurel | 0.74% | 0.55%(+0.194)#82 | 0.68%(+0.060)#2,060 |
| 83. | Riverdale Park | 0.71% | 0.55%(+0.169)#83 | 0.68%(+0.035)#2,110 |
| 84. | Glenn Dale | 0.71% | 0.55%(+0.163)#84 | 0.68%(+0.030)#2,126 |
| 85. | Hyattsville | 0.70% | 0.55%(+0.150)#85 | 0.68%(+0.017)#2,174 |
| 86. | Lansdowne | 0.68% | 0.55%(+0.136)#86 | 0.68%(+0.002)#2,214 |
| 87. | Seabrook | 0.67% | 0.55%(+0.121)#87 | 0.68%(-0.012)#2,260 |
| 88. | Beltsville | 0.66% | 0.55%(+0.120)#88 | 0.68%(-0.014)#2,263 |
| 89. | Bel Air | 0.66% | 0.55%(+0.113)#89 | 0.68%(-0.020)#2,276 |
| 90. | Perry Hall | 0.64% | 0.55%(+0.098)#90 | 0.68%(-0.036)#2,318 |
| 91. | North Laurel | 0.63% | 0.55%(+0.086)#91 | 0.68%(-0.048)#2,356 |
| 92. | Brooklyn Park | 0.63% | 0.55%(+0.084)#92 | 0.68%(-0.050)#2,363 |
| 93. | Catonsville | 0.62% | 0.55%(+0.075)#93 | 0.68%(-0.059)#2,383 |
| 94. | Ellicott City | 0.62% | 0.55%(+0.072)#94 | 0.68%(-0.062)#2,391 |
| 95. | Tilghman Island | 0.61% | 0.55%(+0.060)#95 | 0.68%(-0.073)#2,419 |
| 96. | Columbia | 0.61% | 0.55%(+0.060)#96 | 0.68%(-0.073)#2,420 |
| 97. | Crownsville | 0.59% | 0.55%(+0.042)#97 | 0.68%(-0.092)#2,466 |
| 98. | Savage | 0.58% | 0.55%(+0.039)#98 | 0.68%(-0.094)#2,476 |
| 99. | New Carrollton | 0.58% | 0.55%(+0.037)#99 | 0.68%(-0.097)#2,486 |
| 100. | Lexington Park | 0.58% | 0.55%(+0.031)#100 | 0.68%(-0.102)#2,498 |
Common Questions
What are the Top 10 Cities with the Highest Percentage of Sri Lankan Population in Maryland?
Top 10 Cities with the Highest Percentage of Sri Lankan Population in Maryland are:
#1
10.66%
#2
10.47%
#3
8.56%
#4
8.25%
#5
5.18%
#6
4.43%
#7
4.27%
#8
4.10%
#9
4.06%
#10
3.69%
What city has the Highest Percentage of Sri Lankan Population in Maryland?
Girdletree has the Highest Percentage of Sri Lankan Population in Maryland with 10.66%.
What is the Percentage of Sri Lankan Population in the State of Maryland?
Percentage of Sri Lankan Population in Maryland is 0.55%.
What is the Percentage of Sri Lankan Population in the United States?
Percentage of Sri Lankan Population in the United States is 0.68%.