Cities with the Highest Percentage of Sri Lankan Population in Texas
RELATED REPORTS & OPTIONS
Sri Lankan
Texas
Compare Cities
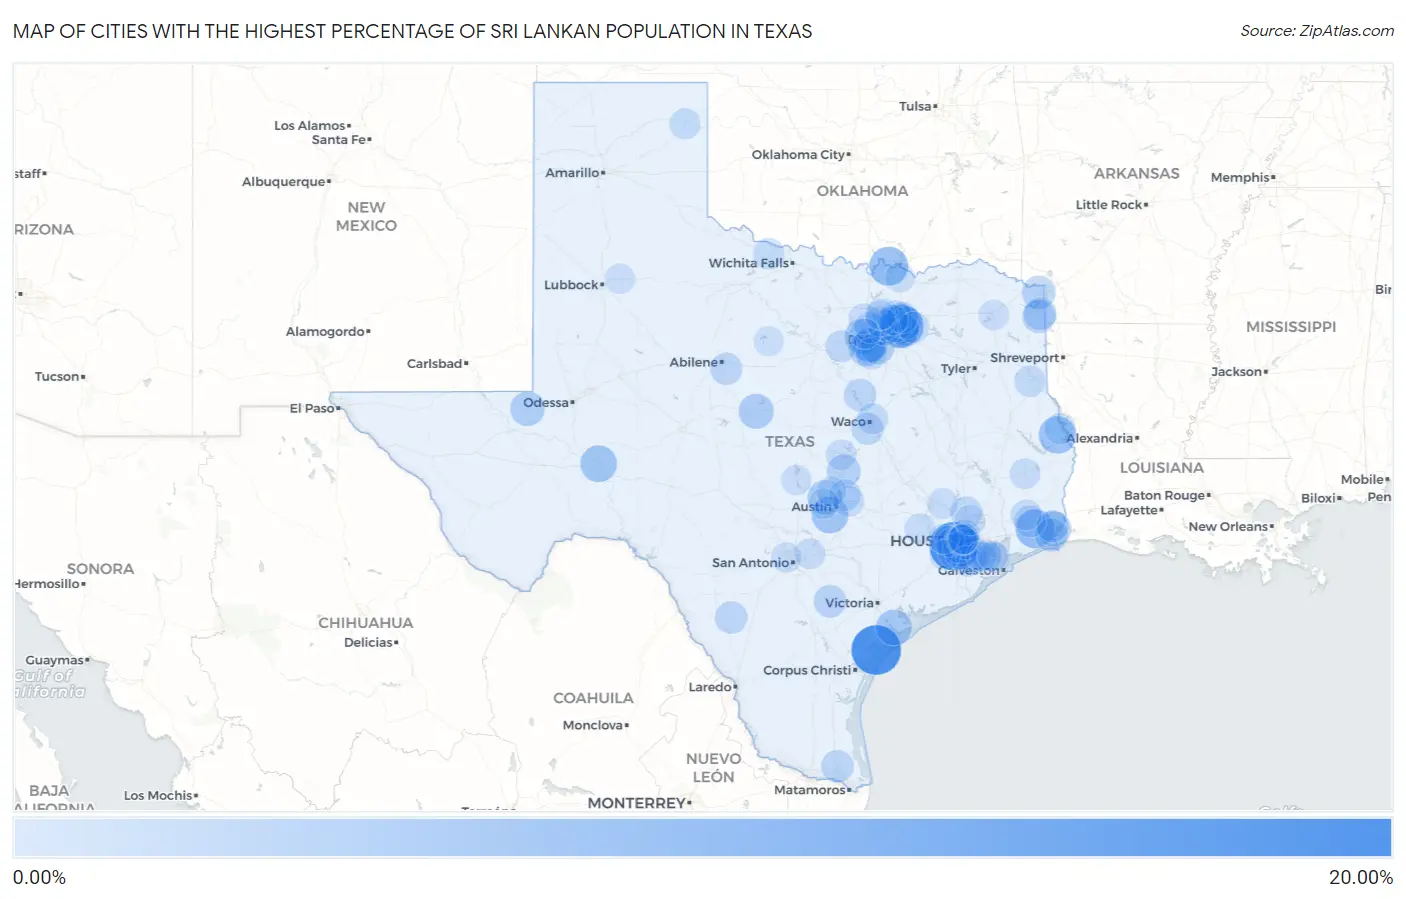
Map of Cities with the Highest Percentage of Sri Lankan Population in Texas
0.00%
20.00%
Cities with the Highest Percentage of Sri Lankan Population in Texas
| City | Sri Lankan | vs State | vs National | |
| 1. | Fulton | 15.95% | 1.08%(+14.9)#1 | 0.68%(+15.3)#25 |
| 2. | Four Corners | 15.04% | 1.08%(+14.0)#2 | 0.68%(+14.4)#27 |
| 3. | Sachse | 10.28% | 1.08%(+9.20)#3 | 0.68%(+9.61)#53 |
| 4. | Murphy | 8.39% | 1.08%(+7.31)#4 | 0.68%(+7.71)#69 |
| 5. | Sherwood Shores | 7.84% | 1.08%(+6.76)#5 | 0.68%(+7.16)#77 |
| 6. | Fannett | 7.68% | 1.08%(+6.60)#6 | 0.68%(+7.00)#79 |
| 7. | Hemphill | 6.67% | 1.08%(+5.59)#7 | 0.68%(+5.99)#95 |
| 8. | Garland | 6.28% | 1.08%(+5.20)#8 | 0.68%(+5.60)#101 |
| 9. | Manchaca | 6.12% | 1.08%(+5.04)#9 | 0.68%(+5.45)#104 |
| 10. | Iraan | 6.06% | 1.08%(+4.97)#10 | 0.68%(+5.38)#108 |
| 11. | Seadrift | 5.39% | 1.08%(+4.31)#11 | 0.68%(+4.71)#142 |
| 12. | Mission Bend | 5.11% | 1.08%(+4.03)#12 | 0.68%(+4.44)#156 |
| 13. | Haltom City | 5.10% | 1.08%(+4.02)#13 | 0.68%(+4.43)#157 |
| 14. | Stafford | 5.08% | 1.08%(+3.99)#14 | 0.68%(+4.40)#160 |
| 15. | Dalworthington Gardens | 4.92% | 1.08%(+3.84)#15 | 0.68%(+4.25)#169 |
| 16. | Bangs | 4.83% | 1.08%(+3.75)#16 | 0.68%(+4.15)#177 |
| 17. | Kennedale | 4.71% | 1.08%(+3.63)#17 | 0.68%(+4.04)#178 |
| 18. | Hudson Bend | 4.71% | 1.08%(+3.63)#18 | 0.68%(+4.03)#179 |
| 19. | Groves | 4.68% | 1.08%(+3.60)#19 | 0.68%(+4.00)#181 |
| 20. | Sugar Land | 4.66% | 1.08%(+3.57)#20 | 0.68%(+3.98)#185 |
| 21. | Wink | 4.40% | 1.08%(+3.31)#21 | 0.68%(+3.72)#201 |
| 22. | Pearland | 4.34% | 1.08%(+3.25)#22 | 0.68%(+3.66)#207 |
| 23. | Arlington | 4.20% | 1.08%(+3.12)#23 | 0.68%(+3.52)#218 |
| 24. | Grand Prairie | 3.86% | 1.08%(+2.78)#24 | 0.68%(+3.19)#249 |
| 25. | Red Lick | 3.85% | 1.08%(+2.76)#25 | 0.68%(+3.17)#252 |
| 26. | Hedwig Village | 3.84% | 1.08%(+2.75)#26 | 0.68%(+3.16)#254 |
| 27. | Sonterra | 3.79% | 1.08%(+2.70)#27 | 0.68%(+3.11)#260 |
| 28. | Atlanta | 3.59% | 1.08%(+2.51)#28 | 0.68%(+2.92)#284 |
| 29. | Port Arthur | 3.59% | 1.08%(+2.51)#29 | 0.68%(+2.91)#285 |
| 30. | Kenedy | 3.14% | 1.08%(+2.06)#30 | 0.68%(+2.47)#358 |
| 31. | Queen City | 3.14% | 1.08%(+2.06)#31 | 0.68%(+2.46)#360 |
| 32. | Whitney | 3.04% | 1.08%(+1.96)#32 | 0.68%(+2.36)#378 |
| 33. | Combes | 3.02% | 1.08%(+1.94)#33 | 0.68%(+2.35)#380 |
| 34. | Big Wells | 3.01% | 1.08%(+1.93)#34 | 0.68%(+2.33)#385 |
| 35. | Parker | 2.89% | 1.08%(+1.81)#35 | 0.68%(+2.21)#412 |
| 36. | Richardson | 2.85% | 1.08%(+1.76)#36 | 0.68%(+2.17)#420 |
| 37. | Potosi | 2.80% | 1.08%(+1.72)#37 | 0.68%(+2.13)#430 |
| 38. | Wylie | 2.75% | 1.08%(+1.67)#38 | 0.68%(+2.07)#449 |
| 39. | Port Neches | 2.70% | 1.08%(+1.62)#39 | 0.68%(+2.02)#459 |
| 40. | Hewitt | 2.66% | 1.08%(+1.58)#40 | 0.68%(+1.98)#464 |
| 41. | Missouri City | 2.65% | 1.08%(+1.57)#41 | 0.68%(+1.97)#465 |
| 42. | Shenandoah | 2.64% | 1.08%(+1.56)#42 | 0.68%(+1.96)#467 |
| 43. | Annetta South | 2.56% | 1.08%(+1.48)#43 | 0.68%(+1.89)#482 |
| 44. | China | 2.54% | 1.08%(+1.46)#44 | 0.68%(+1.87)#490 |
| 45. | Pflugerville | 2.44% | 1.08%(+1.36)#45 | 0.68%(+1.76)#514 |
| 46. | Rowlett | 2.43% | 1.08%(+1.35)#46 | 0.68%(+1.76)#517 |
| 47. | Allen | 2.42% | 1.08%(+1.34)#47 | 0.68%(+1.74)#520 |
| 48. | Carrollton | 2.38% | 1.08%(+1.30)#48 | 0.68%(+1.70)#539 |
| 49. | Mansfield | 2.30% | 1.08%(+1.22)#49 | 0.68%(+1.62)#569 |
| 50. | Bellaire | 2.28% | 1.08%(+1.20)#50 | 0.68%(+1.61)#578 |
| 51. | Milam | 2.21% | 1.08%(+1.13)#51 | 0.68%(+1.54)#598 |
| 52. | Farmers Branch | 2.20% | 1.08%(+1.12)#52 | 0.68%(+1.52)#606 |
| 53. | Carthage | 2.18% | 1.08%(+1.10)#53 | 0.68%(+1.51)#611 |
| 54. | Lucas | 2.17% | 1.08%(+1.09)#54 | 0.68%(+1.49)#618 |
| 55. | Electra | 2.15% | 1.08%(+1.07)#55 | 0.68%(+1.47)#622 |
| 56. | Hackberry | 2.10% | 1.08%(+1.01)#56 | 0.68%(+1.42)#642 |
| 57. | Fate | 2.09% | 1.08%(+1.01)#57 | 0.68%(+1.42)#645 |
| 58. | Bunker Hill Village | 2.02% | 1.08%(+0.934)#58 | 0.68%(+1.34)#664 |
| 59. | Manvel | 2.01% | 1.08%(+0.924)#59 | 0.68%(+1.33)#669 |
| 60. | Bellmead | 1.98% | 1.08%(+0.893)#60 | 0.68%(+1.30)#685 |
| 61. | Southlake | 1.96% | 1.08%(+0.874)#61 | 0.68%(+1.28)#698 |
| 62. | Canadian | 1.93% | 1.08%(+0.849)#62 | 0.68%(+1.25)#715 |
| 63. | Cibolo | 1.91% | 1.08%(+0.827)#63 | 0.68%(+1.23)#720 |
| 64. | Bellville | 1.90% | 1.08%(+0.823)#64 | 0.68%(+1.23)#723 |
| 65. | Plantersville | 1.89% | 1.08%(+0.809)#65 | 0.68%(+1.21)#730 |
| 66. | Manor | 1.86% | 1.08%(+0.776)#66 | 0.68%(+1.18)#751 |
| 67. | Houston | 1.85% | 1.08%(+0.764)#67 | 0.68%(+1.17)#761 |
| 68. | Sour Lake | 1.82% | 1.08%(+0.742)#68 | 0.68%(+1.15)#773 |
| 69. | Southside Place | 1.82% | 1.08%(+0.742)#69 | 0.68%(+1.15)#774 |
| 70. | Harker Heights | 1.82% | 1.08%(+0.737)#70 | 0.68%(+1.14)#775 |
| 71. | Meadows Place | 1.80% | 1.08%(+0.719)#71 | 0.68%(+1.12)#786 |
| 72. | League City | 1.78% | 1.08%(+0.703)#72 | 0.68%(+1.11)#794 |
| 73. | Cinco Ranch | 1.77% | 1.08%(+0.689)#73 | 0.68%(+1.09)#799 |
| 74. | San Leon | 1.77% | 1.08%(+0.687)#74 | 0.68%(+1.09)#802 |
| 75. | Northlake | 1.76% | 1.08%(+0.676)#75 | 0.68%(+1.08)#806 |
| 76. | Bee Cave | 1.76% | 1.08%(+0.674)#76 | 0.68%(+1.08)#810 |
| 77. | Woodville | 1.75% | 1.08%(+0.671)#77 | 0.68%(+1.07)#813 |
| 78. | Lewisville | 1.74% | 1.08%(+0.661)#78 | 0.68%(+1.06)#819 |
| 79. | Iowa Colony | 1.74% | 1.08%(+0.655)#79 | 0.68%(+1.06)#822 |
| 80. | Rosenberg | 1.65% | 1.08%(+0.563)#80 | 0.68%(+0.967)#888 |
| 81. | Plano | 1.64% | 1.08%(+0.560)#81 | 0.68%(+0.964)#892 |
| 82. | Hilshire Village | 1.64% | 1.08%(+0.556)#82 | 0.68%(+0.959)#896 |
| 83. | Mount Pleasant | 1.61% | 1.08%(+0.524)#83 | 0.68%(+0.927)#919 |
| 84. | Leon Valley | 1.59% | 1.08%(+0.512)#84 | 0.68%(+0.915)#929 |
| 85. | Nassau Bay | 1.59% | 1.08%(+0.510)#85 | 0.68%(+0.913)#931 |
| 86. | Spring Valley Village | 1.59% | 1.08%(+0.505)#86 | 0.68%(+0.908)#934 |
| 87. | Kingsland | 1.57% | 1.08%(+0.487)#87 | 0.68%(+0.890)#956 |
| 88. | Spring | 1.50% | 1.08%(+0.418)#88 | 0.68%(+0.822)#1,004 |
| 89. | Katy | 1.50% | 1.08%(+0.416)#89 | 0.68%(+0.820)#1,008 |
| 90. | Friendswood | 1.49% | 1.08%(+0.408)#90 | 0.68%(+0.811)#1,012 |
| 91. | Lorenzo | 1.48% | 1.08%(+0.399)#91 | 0.68%(+0.802)#1,024 |
| 92. | Bacliff | 1.46% | 1.08%(+0.382)#92 | 0.68%(+0.786)#1,039 |
| 93. | Reno City Lamar County | 1.45% | 1.08%(+0.368)#93 | 0.68%(+0.771)#1,049 |
| 94. | North Richland Hills | 1.44% | 1.08%(+0.359)#94 | 0.68%(+0.762)#1,055 |
| 95. | Willow Grove | 1.44% | 1.08%(+0.357)#95 | 0.68%(+0.760)#1,056 |
| 96. | Knollwood | 1.42% | 1.08%(+0.335)#96 | 0.68%(+0.739)#1,081 |
| 97. | Breckenridge | 1.38% | 1.08%(+0.295)#97 | 0.68%(+0.698)#1,118 |
| 98. | Lakewood Village | 1.34% | 1.08%(+0.257)#98 | 0.68%(+0.660)#1,145 |
| 99. | Piney Point Village | 1.32% | 1.08%(+0.235)#99 | 0.68%(+0.638)#1,168 |
| 100. | Cedar Park | 1.31% | 1.08%(+0.231)#100 | 0.68%(+0.634)#1,173 |
Common Questions
What are the Top 10 Cities with the Highest Percentage of Sri Lankan Population in Texas?
Top 10 Cities with the Highest Percentage of Sri Lankan Population in Texas are:
#1
15.95%
#2
15.04%
#3
10.28%
#4
8.39%
#5
7.84%
#6
7.68%
#7
6.67%
#8
6.28%
#9
6.12%
#10
6.06%
What city has the Highest Percentage of Sri Lankan Population in Texas?
Fulton has the Highest Percentage of Sri Lankan Population in Texas with 15.95%.
What is the Percentage of Sri Lankan Population in the State of Texas?
Percentage of Sri Lankan Population in Texas is 1.08%.
What is the Percentage of Sri Lankan Population in the United States?
Percentage of Sri Lankan Population in the United States is 0.68%.