Cities with the Highest Percentage of Sri Lankan Population in North Carolina
RELATED REPORTS & OPTIONS
Sri Lankan
North Carolina
Compare Cities
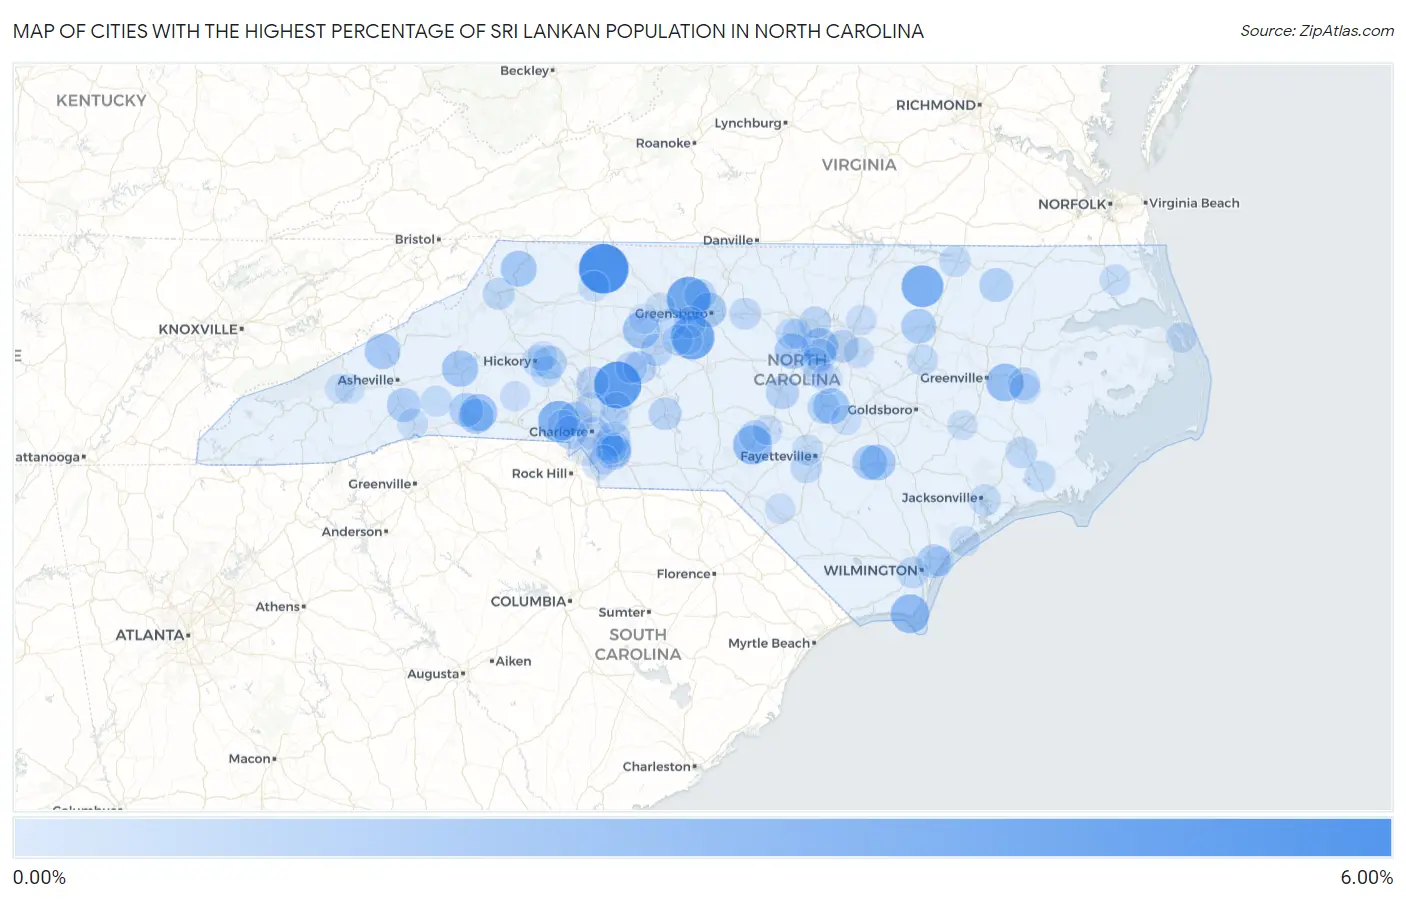
Map of Cities with the Highest Percentage of Sri Lankan Population in North Carolina
0.00%
6.00%
Cities with the Highest Percentage of Sri Lankan Population in North Carolina
| City | Sri Lankan | vs State | vs National | |
| 1. | Dobson | 5.41% | 0.40%(+5.01)#1 | 0.68%(+4.73)#141 |
| 2. | Landis | 4.67% | 0.40%(+4.27)#2 | 0.68%(+3.99)#183 |
| 3. | Oak Ridge | 3.84% | 0.40%(+3.44)#3 | 0.68%(+3.16)#253 |
| 4. | Archdale | 3.83% | 0.40%(+3.43)#4 | 0.68%(+3.15)#255 |
| 5. | Hollister | 3.31% | 0.40%(+2.91)#5 | 0.68%(+2.63)#329 |
| 6. | Ranlo | 3.10% | 0.40%(+2.70)#6 | 0.68%(+2.42)#367 |
| 7. | Aberdeen | 2.51% | 0.40%(+2.12)#7 | 0.68%(+1.83)#500 |
| 8. | Caswell Beach | 2.45% | 0.40%(+2.06)#8 | 0.68%(+1.78)#511 |
| 9. | Cherry Branch | 2.42% | 0.40%(+2.02)#9 | 0.68%(+1.74)#521 |
| 10. | Grimesland | 2.17% | 0.40%(+1.78)#10 | 0.68%(+1.50)#613 |
| 11. | Advance | 1.99% | 0.40%(+1.60)#11 | 0.68%(+1.32)#674 |
| 12. | Bostic | 1.97% | 0.40%(+1.58)#12 | 0.68%(+1.30)#686 |
| 13. | Morrisville | 1.85% | 0.40%(+1.45)#13 | 0.68%(+1.17)#759 |
| 14. | Marion | 1.82% | 0.40%(+1.42)#14 | 0.68%(+1.14)#777 |
| 15. | Buies Creek | 1.76% | 0.40%(+1.36)#15 | 0.68%(+1.08)#811 |
| 16. | West Jefferson | 1.72% | 0.40%(+1.33)#16 | 0.68%(+1.05)#833 |
| 17. | Clinton | 1.67% | 0.40%(+1.28)#17 | 0.68%(+0.996)#863 |
| 18. | Brandywine Bay | 1.64% | 0.40%(+1.24)#18 | 0.68%(+0.965)#890 |
| 19. | Fearrington Village | 1.63% | 0.40%(+1.23)#19 | 0.68%(+0.948)#902 |
| 20. | Marshall | 1.62% | 0.40%(+1.23)#20 | 0.68%(+0.945)#903 |
| 21. | Greensboro | 1.54% | 0.40%(+1.14)#21 | 0.68%(+0.859)#975 |
| 22. | Forest City | 1.51% | 0.40%(+1.11)#22 | 0.68%(+0.830)#997 |
| 23. | Bonnetsville | 1.46% | 0.40%(+1.07)#23 | 0.68%(+0.786)#1,037 |
| 24. | Nashville | 1.42% | 0.40%(+1.02)#24 | 0.68%(+0.744)#1,075 |
| 25. | Indian Trail | 1.34% | 0.40%(+0.939)#25 | 0.68%(+0.658)#1,152 |
| 26. | Ruth | 1.29% | 0.40%(+0.890)#26 | 0.68%(+0.610)#1,212 |
| 27. | Mount Holly | 1.27% | 0.40%(+0.872)#27 | 0.68%(+0.591)#1,236 |
| 28. | Fletcher | 1.24% | 0.40%(+0.839)#28 | 0.68%(+0.559)#1,273 |
| 29. | Murraysville | 1.21% | 0.40%(+0.814)#29 | 0.68%(+0.533)#1,299 |
| 30. | Rich Square | 1.21% | 0.40%(+0.808)#30 | 0.68%(+0.528)#1,307 |
| 31. | Mint Hill | 1.20% | 0.40%(+0.804)#31 | 0.68%(+0.524)#1,311 |
| 32. | Conover | 1.09% | 0.40%(+0.690)#32 | 0.68%(+0.409)#1,446 |
| 33. | Sanford | 1.04% | 0.40%(+0.639)#33 | 0.68%(+0.359)#1,514 |
| 34. | Charlotte | 0.99% | 0.40%(+0.596)#34 | 0.68%(+0.316)#1,570 |
| 35. | Belmont | 0.97% | 0.40%(+0.572)#35 | 0.68%(+0.292)#1,606 |
| 36. | Raleigh | 0.94% | 0.40%(+0.542)#36 | 0.68%(+0.261)#1,663 |
| 37. | Albemarle | 0.92% | 0.40%(+0.520)#37 | 0.68%(+0.240)#1,709 |
| 38. | Cary | 0.91% | 0.40%(+0.515)#38 | 0.68%(+0.235)#1,723 |
| 39. | East Spencer | 0.90% | 0.40%(+0.507)#39 | 0.68%(+0.226)#1,738 |
| 40. | Washington | 0.87% | 0.40%(+0.473)#40 | 0.68%(+0.193)#1,786 |
| 41. | Lillington | 0.83% | 0.40%(+0.434)#41 | 0.68%(+0.154)#1,861 |
| 42. | Lexington | 0.81% | 0.40%(+0.408)#42 | 0.68%(+0.128)#1,911 |
| 43. | Lake Park | 0.78% | 0.40%(+0.380)#43 | 0.68%(+0.099)#1,979 |
| 44. | Mooresville | 0.77% | 0.40%(+0.368)#44 | 0.68%(+0.087)#2,004 |
| 45. | Boone | 0.73% | 0.40%(+0.335)#45 | 0.68%(+0.055)#2,078 |
| 46. | Southern Pines | 0.73% | 0.40%(+0.334)#46 | 0.68%(+0.054)#2,080 |
| 47. | Durham | 0.71% | 0.40%(+0.309)#47 | 0.68%(+0.029)#2,132 |
| 48. | Summerfield | 0.70% | 0.40%(+0.303)#48 | 0.68%(+0.022)#2,160 |
| 49. | Burlington | 0.67% | 0.40%(+0.269)#49 | 0.68%(-0.011)#2,259 |
| 50. | High Point | 0.64% | 0.40%(+0.244)#50 | 0.68%(-0.036)#2,319 |
| 51. | Salisbury | 0.64% | 0.40%(+0.243)#51 | 0.68%(-0.038)#2,324 |
| 52. | Hope Mills | 0.63% | 0.40%(+0.236)#52 | 0.68%(-0.045)#2,344 |
| 53. | New Bern | 0.63% | 0.40%(+0.233)#53 | 0.68%(-0.047)#2,355 |
| 54. | Belville | 0.62% | 0.40%(+0.223)#54 | 0.68%(-0.057)#2,378 |
| 55. | Roanoke Rapids | 0.60% | 0.40%(+0.203)#55 | 0.68%(-0.078)#2,431 |
| 56. | Jacksonville | 0.59% | 0.40%(+0.189)#56 | 0.68%(-0.092)#2,467 |
| 57. | Hickory | 0.59% | 0.40%(+0.188)#57 | 0.68%(-0.093)#2,470 |
| 58. | Matthews | 0.57% | 0.40%(+0.176)#58 | 0.68%(-0.104)#2,505 |
| 59. | Spout Springs | 0.56% | 0.40%(+0.160)#59 | 0.68%(-0.120)#2,554 |
| 60. | Newton | 0.55% | 0.40%(+0.149)#60 | 0.68%(-0.132)#2,592 |
| 61. | Carrboro | 0.53% | 0.40%(+0.134)#61 | 0.68%(-0.147)#2,630 |
| 62. | Havelock | 0.53% | 0.40%(+0.133)#62 | 0.68%(-0.147)#2,635 |
| 63. | Lake Lure | 0.51% | 0.40%(+0.110)#63 | 0.68%(-0.171)#2,724 |
| 64. | Fayetteville | 0.49% | 0.40%(+0.090)#64 | 0.68%(-0.190)#2,802 |
| 65. | Wilson | 0.49% | 0.40%(+0.088)#65 | 0.68%(-0.193)#2,808 |
| 66. | Elizabeth City | 0.46% | 0.40%(+0.065)#66 | 0.68%(-0.215)#2,890 |
| 67. | Wallburg | 0.45% | 0.40%(+0.056)#67 | 0.68%(-0.224)#2,918 |
| 68. | Thomasville | 0.44% | 0.40%(+0.044)#68 | 0.68%(-0.236)#2,963 |
| 69. | Concord | 0.42% | 0.40%(+0.026)#69 | 0.68%(-0.254)#3,042 |
| 70. | Elkin | 0.42% | 0.40%(+0.024)#70 | 0.68%(-0.256)#3,051 |
| 71. | Washington Park | 0.42% | 0.40%(+0.023)#71 | 0.68%(-0.257)#3,058 |
| 72. | Knightdale | 0.41% | 0.40%(+0.010)#72 | 0.68%(-0.271)#3,116 |
| 73. | Manteo | 0.39% | 0.40%(-0.011)#73 | 0.68%(-0.291)#3,220 |
| 74. | Huntersville | 0.38% | 0.40%(-0.016)#74 | 0.68%(-0.296)#3,251 |
| 75. | East Flat Rock | 0.37% | 0.40%(-0.027)#75 | 0.68%(-0.308)#3,297 |
| 76. | Marvin | 0.34% | 0.40%(-0.055)#76 | 0.68%(-0.336)#3,438 |
| 77. | Dunn | 0.34% | 0.40%(-0.059)#77 | 0.68%(-0.339)#3,461 |
| 78. | Surf City | 0.33% | 0.40%(-0.064)#78 | 0.68%(-0.344)#3,484 |
| 79. | Youngsville | 0.33% | 0.40%(-0.068)#79 | 0.68%(-0.348)#3,505 |
| 80. | Pembroke | 0.32% | 0.40%(-0.080)#80 | 0.68%(-0.361)#3,556 |
| 81. | Chapel Hill | 0.32% | 0.40%(-0.081)#81 | 0.68%(-0.361)#3,562 |
| 82. | Vass | 0.31% | 0.40%(-0.085)#82 | 0.68%(-0.365)#3,582 |
| 83. | Hemby Bridge | 0.31% | 0.40%(-0.086)#83 | 0.68%(-0.367)#3,591 |
| 84. | Lowell | 0.30% | 0.40%(-0.100)#84 | 0.68%(-0.381)#3,661 |
| 85. | Holly Springs | 0.30% | 0.40%(-0.103)#85 | 0.68%(-0.383)#3,678 |
| 86. | Kinston | 0.29% | 0.40%(-0.104)#86 | 0.68%(-0.384)#3,684 |
| 87. | Stallings | 0.28% | 0.40%(-0.114)#87 | 0.68%(-0.394)#3,728 |
| 88. | Harrisburg | 0.28% | 0.40%(-0.118)#88 | 0.68%(-0.399)#3,753 |
| 89. | Belwood | 0.27% | 0.40%(-0.126)#89 | 0.68%(-0.407)#3,795 |
| 90. | St Stephens | 0.27% | 0.40%(-0.128)#90 | 0.68%(-0.408)#3,807 |
| 91. | Lake Junaluska | 0.27% | 0.40%(-0.129)#91 | 0.68%(-0.410)#3,815 |
| 92. | Apex | 0.27% | 0.40%(-0.131)#92 | 0.68%(-0.411)#3,825 |
| 93. | Clemmons | 0.26% | 0.40%(-0.140)#93 | 0.68%(-0.420)#3,873 |
| 94. | Trinity | 0.26% | 0.40%(-0.141)#94 | 0.68%(-0.422)#3,885 |
| 95. | Winston Salem | 0.25% | 0.40%(-0.148)#95 | 0.68%(-0.429)#3,930 |
| 96. | Pineville | 0.24% | 0.40%(-0.161)#96 | 0.68%(-0.441)#4,002 |
| 97. | Bayshore | 0.23% | 0.40%(-0.170)#97 | 0.68%(-0.450)#4,053 |
| 98. | Maggie Valley | 0.23% | 0.40%(-0.170)#98 | 0.68%(-0.451)#4,060 |
| 99. | Weddington | 0.23% | 0.40%(-0.170)#99 | 0.68%(-0.451)#4,062 |
| 100. | Fuquay Varina | 0.23% | 0.40%(-0.172)#100 | 0.68%(-0.453)#4,073 |
Common Questions
What are the Top 10 Cities with the Highest Percentage of Sri Lankan Population in North Carolina?
Top 10 Cities with the Highest Percentage of Sri Lankan Population in North Carolina are:
#1
5.41%
#2
4.67%
#3
3.84%
#4
3.83%
#5
3.31%
#6
3.10%
#7
2.51%
#8
2.45%
#9
2.17%
#10
1.99%
What city has the Highest Percentage of Sri Lankan Population in North Carolina?
Dobson has the Highest Percentage of Sri Lankan Population in North Carolina with 5.41%.
What is the Percentage of Sri Lankan Population in the State of North Carolina?
Percentage of Sri Lankan Population in North Carolina is 0.40%.
What is the Percentage of Sri Lankan Population in the United States?
Percentage of Sri Lankan Population in the United States is 0.68%.