Cities with the Highest Percentage of Sri Lankan Population in Iowa
RELATED REPORTS & OPTIONS
Sri Lankan
Iowa
Compare Cities
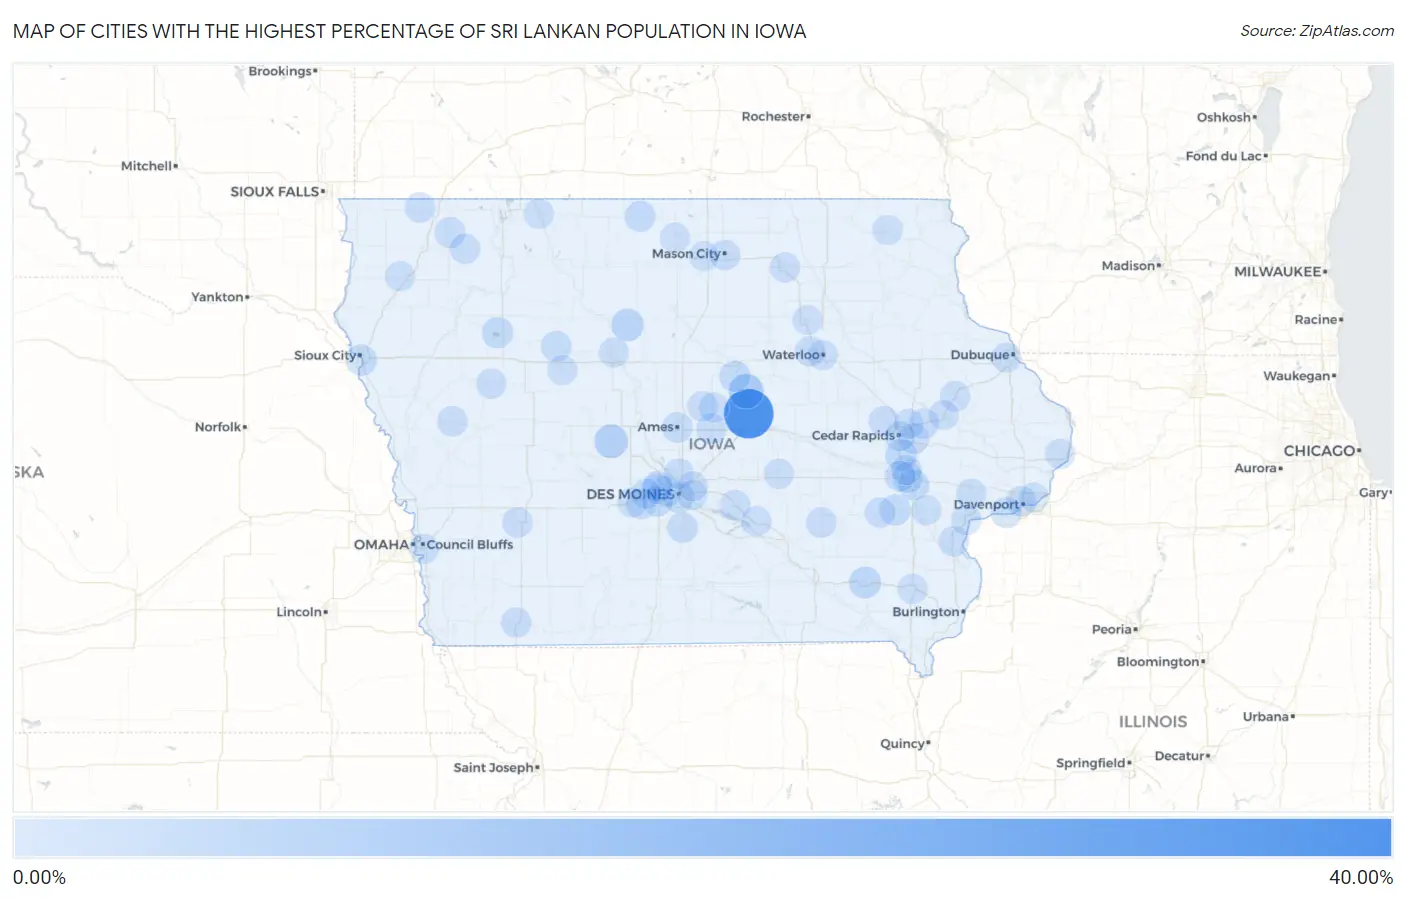
Map of Cities with the Highest Percentage of Sri Lankan Population in Iowa
0.00%
40.00%
Cities with the Highest Percentage of Sri Lankan Population in Iowa
| City | Sri Lankan | vs State | vs National | |
| 1. | Albion | 33.39% | 0.37%(+33.0)#1 | 0.68%(+32.7)#7 |
| 2. | Whitten | 7.52% | 0.37%(+7.15)#2 | 0.68%(+6.84)#81 |
| 3. | Rippey | 5.85% | 0.37%(+5.49)#3 | 0.68%(+5.17)#124 |
| 4. | Thor | 3.63% | 0.37%(+3.26)#4 | 0.68%(+2.95)#276 |
| 5. | Fairfield | 3.05% | 0.37%(+2.69)#5 | 0.68%(+2.37)#374 |
| 6. | Shueyville | 2.58% | 0.37%(+2.22)#6 | 0.68%(+1.90)#478 |
| 7. | Kalona | 1.90% | 0.37%(+1.53)#7 | 0.68%(+1.22)#728 |
| 8. | Storm Lake | 1.79% | 0.37%(+1.42)#8 | 0.68%(+1.11)#792 |
| 9. | Eldora | 1.66% | 0.37%(+1.30)#9 | 0.68%(+0.985)#871 |
| 10. | Sioux City | 1.56% | 0.37%(+1.20)#10 | 0.68%(+0.882)#964 |
| 11. | Windsor Heights | 1.46% | 0.37%(+1.10)#11 | 0.68%(+0.783)#1,040 |
| 12. | Iowa City | 1.42% | 0.37%(+1.06)#12 | 0.68%(+0.745)#1,073 |
| 13. | Buffalo Center | 1.41% | 0.37%(+1.04)#13 | 0.68%(+0.727)#1,095 |
| 14. | Melvin | 1.24% | 0.37%(+0.877)#14 | 0.68%(+0.564)#1,269 |
| 15. | Des Moines | 1.23% | 0.37%(+0.860)#15 | 0.68%(+0.547)#1,284 |
| 16. | Buffalo | 1.21% | 0.37%(+0.841)#16 | 0.68%(+0.528)#1,308 |
| 17. | Van Meter | 1.09% | 0.37%(+0.725)#17 | 0.68%(+0.411)#1,443 |
| 18. | Ames | 1.00% | 0.37%(+0.635)#18 | 0.68%(+0.322)#1,563 |
| 19. | Coralville | 0.99% | 0.37%(+0.622)#19 | 0.68%(+0.308)#1,584 |
| 20. | Pomeroy | 0.95% | 0.37%(+0.583)#20 | 0.68%(+0.270)#1,639 |
| 21. | Indianola | 0.95% | 0.37%(+0.581)#21 | 0.68%(+0.268)#1,641 |
| 22. | West Des Moines | 0.94% | 0.37%(+0.579)#22 | 0.68%(+0.266)#1,649 |
| 23. | Tiffin | 0.87% | 0.37%(+0.502)#23 | 0.68%(+0.188)#1,793 |
| 24. | Davenport | 0.83% | 0.37%(+0.461)#24 | 0.68%(+0.148)#1,871 |
| 25. | Bertram | 0.80% | 0.37%(+0.431)#25 | 0.68%(+0.118)#1,932 |
| 26. | Palo | 0.77% | 0.37%(+0.409)#26 | 0.68%(+0.096)#1,988 |
| 27. | Urbandale | 0.74% | 0.37%(+0.374)#27 | 0.68%(+0.061)#2,057 |
| 28. | Little Rock | 0.70% | 0.37%(+0.332)#28 | 0.68%(+0.019)#2,170 |
| 29. | Grandview | 0.69% | 0.37%(+0.326)#29 | 0.68%(+0.013)#2,186 |
| 30. | What Cheer | 0.69% | 0.37%(+0.325)#30 | 0.68%(+0.012)#2,188 |
| 31. | Ankeny | 0.66% | 0.37%(+0.294)#31 | 0.68%(-0.019)#2,275 |
| 32. | Charter Oak | 0.64% | 0.37%(+0.276)#32 | 0.68%(-0.037)#2,323 |
| 33. | Springville | 0.60% | 0.37%(+0.238)#33 | 0.68%(-0.075)#2,425 |
| 34. | Mason City | 0.59% | 0.37%(+0.229)#34 | 0.68%(-0.084)#2,453 |
| 35. | Monroe | 0.58% | 0.37%(+0.217)#35 | 0.68%(-0.096)#2,483 |
| 36. | Clive | 0.55% | 0.37%(+0.189)#36 | 0.68%(-0.124)#2,570 |
| 37. | Monticello | 0.52% | 0.37%(+0.155)#37 | 0.68%(-0.158)#2,680 |
| 38. | Atlantic | 0.50% | 0.37%(+0.137)#38 | 0.68%(-0.176)#2,743 |
| 39. | Colo | 0.48% | 0.37%(+0.112)#39 | 0.68%(-0.201)#2,839 |
| 40. | North Liberty | 0.48% | 0.37%(+0.110)#40 | 0.68%(-0.203)#2,846 |
| 41. | Odebolt | 0.46% | 0.37%(+0.093)#41 | 0.68%(-0.220)#2,903 |
| 42. | Mccallsburg | 0.41% | 0.37%(+0.048)#42 | 0.68%(-0.265)#3,088 |
| 43. | Clarinda | 0.41% | 0.37%(+0.044)#43 | 0.68%(-0.269)#3,107 |
| 44. | Wellman | 0.41% | 0.37%(+0.042)#44 | 0.68%(-0.271)#3,120 |
| 45. | Waukee | 0.40% | 0.37%(+0.034)#45 | 0.68%(-0.279)#3,161 |
| 46. | Hartley | 0.39% | 0.37%(+0.025)#46 | 0.68%(-0.288)#3,203 |
| 47. | Wilton | 0.37% | 0.37%(+0.009)#47 | 0.68%(-0.304)#3,279 |
| 48. | Cedar Rapids | 0.36% | 0.37%(-0.002)#48 | 0.68%(-0.315)#3,327 |
| 49. | Charles City | 0.33% | 0.37%(-0.039)#49 | 0.68%(-0.353)#3,526 |
| 50. | Cedar Falls | 0.29% | 0.37%(-0.070)#50 | 0.68%(-0.384)#3,681 |
| 51. | Muscatine | 0.29% | 0.37%(-0.078)#51 | 0.68%(-0.391)#3,711 |
| 52. | Orange City | 0.29% | 0.37%(-0.079)#52 | 0.68%(-0.392)#3,716 |
| 53. | Forest City | 0.24% | 0.37%(-0.130)#53 | 0.68%(-0.443)#4,011 |
| 54. | Waterloo | 0.23% | 0.37%(-0.133)#54 | 0.68%(-0.447)#4,028 |
| 55. | De Soto | 0.22% | 0.37%(-0.149)#55 | 0.68%(-0.462)#4,140 |
| 56. | Decorah | 0.20% | 0.37%(-0.168)#56 | 0.68%(-0.481)#4,270 |
| 57. | Mount Pleasant | 0.18% | 0.37%(-0.181)#57 | 0.68%(-0.494)#4,348 |
| 58. | Bettendorf | 0.18% | 0.37%(-0.186)#58 | 0.68%(-0.499)#4,393 |
| 59. | Grinnell | 0.18% | 0.37%(-0.187)#59 | 0.68%(-0.500)#4,401 |
| 60. | Lone Tree | 0.16% | 0.37%(-0.207)#60 | 0.68%(-0.520)#4,567 |
| 61. | Zearing | 0.15% | 0.37%(-0.213)#61 | 0.68%(-0.526)#4,605 |
| 62. | Council Bluffs | 0.13% | 0.37%(-0.233)#62 | 0.68%(-0.546)#4,743 |
| 63. | Fort Dodge | 0.12% | 0.37%(-0.241)#63 | 0.68%(-0.554)#4,807 |
| 64. | Marion | 0.12% | 0.37%(-0.249)#64 | 0.68%(-0.563)#4,871 |
| 65. | Pella | 0.11% | 0.37%(-0.252)#65 | 0.68%(-0.565)#4,888 |
| 66. | Clear Lake | 0.10% | 0.37%(-0.261)#66 | 0.68%(-0.574)#4,955 |
| 67. | Dubuque | 0.099% | 0.37%(-0.266)#67 | 0.68%(-0.579)#4,997 |
| 68. | Pleasant Hill | 0.096% | 0.37%(-0.270)#68 | 0.68%(-0.583)#5,031 |
| 69. | Altoona | 0.095% | 0.37%(-0.270)#69 | 0.68%(-0.584)#5,038 |
| 70. | Anamosa | 0.091% | 0.37%(-0.274)#70 | 0.68%(-0.587)#5,071 |
| 71. | Estherville | 0.085% | 0.37%(-0.280)#71 | 0.68%(-0.593)#5,125 |
| 72. | Rockwell City | 0.042% | 0.37%(-0.323)#72 | 0.68%(-0.637)#5,453 |
| 73. | Waverly | 0.019% | 0.37%(-0.346)#73 | 0.68%(-0.659)#5,583 |
| 74. | Clinton | 0.0082% | 0.37%(-0.357)#74 | 0.68%(-0.670)#5,634 |
Common Questions
What are the Top 10 Cities with the Highest Percentage of Sri Lankan Population in Iowa?
Top 10 Cities with the Highest Percentage of Sri Lankan Population in Iowa are:
#1
33.39%
#2
7.52%
#3
5.85%
#4
3.63%
#5
3.05%
#6
2.58%
#7
1.90%
#8
1.79%
#9
1.66%
#10
1.56%
What city has the Highest Percentage of Sri Lankan Population in Iowa?
Albion has the Highest Percentage of Sri Lankan Population in Iowa with 33.39%.
What is the Percentage of Sri Lankan Population in the State of Iowa?
Percentage of Sri Lankan Population in Iowa is 0.37%.
What is the Percentage of Sri Lankan Population in the United States?
Percentage of Sri Lankan Population in the United States is 0.68%.