Renningers, PA Map & Demographics
Renningers Map
Renningers Overview
$33,297
PER CAPITA INCOME
$84,000
AVG FAMILY INCOME
$84,000
AVG HOUSEHOLD INCOME
54.9%
WAGE / INCOME GAP [ % ]
45.1¢/ $1
WAGE / INCOME GAP [ $ ]
0.32
INEQUALITY / GINI INDEX
551
TOTAL POPULATION
320
MALE POPULATION
231
FEMALE POPULATION
138.53
MALES / 100 FEMALES
72.19
FEMALES / 100 MALES
31.3
MEDIAN AGE
3.3
AVG FAMILY SIZE
3.3
AVG HOUSEHOLD SIZE
248
LABOR FORCE [ PEOPLE ]
66.5%
PERCENT IN LABOR FORCE
Income in Renningers
Income Overview in Renningers
Per Capita Income in Renningers is $33,297, while median incomes of families and households are $84,000 and $84,000 respectively.
| Characteristic | Number | Measure |
| Per Capita Income | 551 | $33,297 |
| Median Family Income | 166 | $84,000 |
| Mean Family Income | 166 | $109,378 |
| Median Household Income | 166 | $84,000 |
| Mean Household Income | 166 | $110,408 |
| Income Deficit | 166 | $0 |
| Wage / Income Gap (%) | 551 | 54.92% |
| Wage / Income Gap ($) | 551 | 45.08¢ per $1 |
| Gini / Inequality Index | 551 | 0.32 |
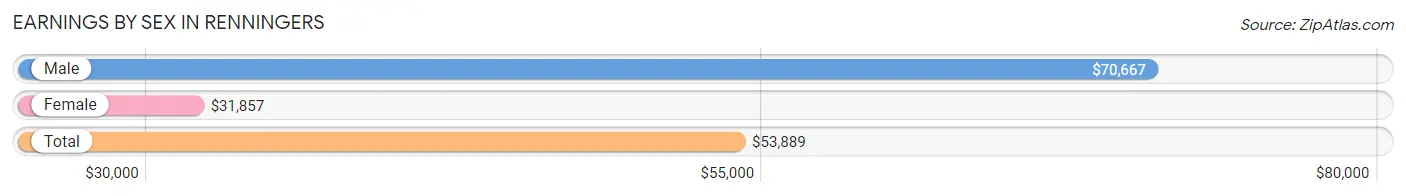
Earnings by Sex in Renningers
Average Earnings in Renningers are $53,889, $70,667 for men and $31,857 for women, a difference of 54.9%.
| Sex | Number | Average Earnings |
| Male | 152 (53.1%) | $70,667 |
| Female | 134 (46.9%) | $31,857 |
| Total | 286 (100.0%) | $53,889 |
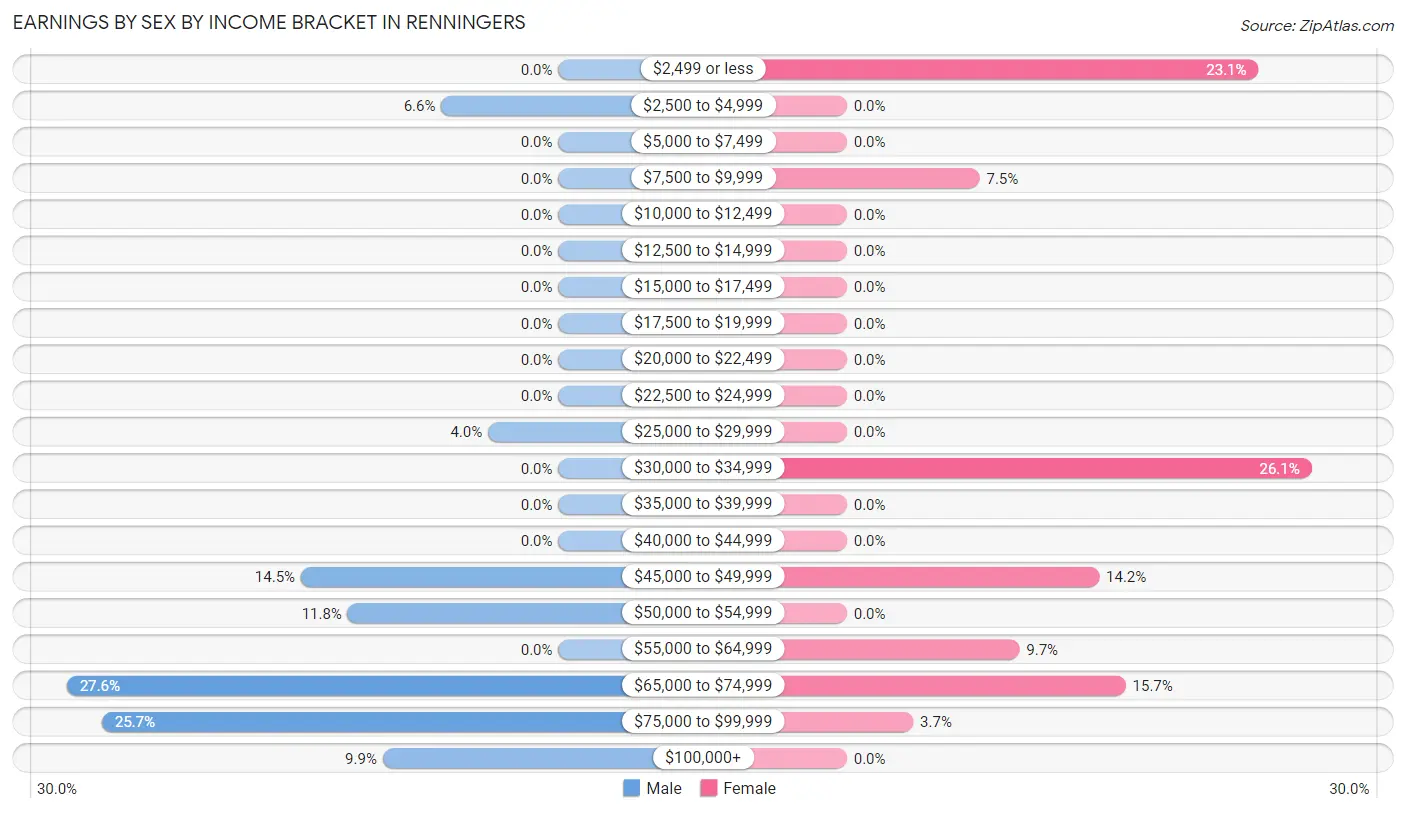
Earnings by Sex by Income Bracket in Renningers
The most common earnings brackets in Renningers are $65,000 to $74,999 for men (42 | 27.6%) and $30,000 to $34,999 for women (35 | 26.1%).
| Income | Male | Female |
| $2,499 or less | 0 (0.0%) | 31 (23.1%) |
| $2,500 to $4,999 | 10 (6.6%) | 0 (0.0%) |
| $5,000 to $7,499 | 0 (0.0%) | 0 (0.0%) |
| $7,500 to $9,999 | 0 (0.0%) | 10 (7.5%) |
| $10,000 to $12,499 | 0 (0.0%) | 0 (0.0%) |
| $12,500 to $14,999 | 0 (0.0%) | 0 (0.0%) |
| $15,000 to $17,499 | 0 (0.0%) | 0 (0.0%) |
| $17,500 to $19,999 | 0 (0.0%) | 0 (0.0%) |
| $20,000 to $22,499 | 0 (0.0%) | 0 (0.0%) |
| $22,500 to $24,999 | 0 (0.0%) | 0 (0.0%) |
| $25,000 to $29,999 | 6 (4.0%) | 0 (0.0%) |
| $30,000 to $34,999 | 0 (0.0%) | 35 (26.1%) |
| $35,000 to $39,999 | 0 (0.0%) | 0 (0.0%) |
| $40,000 to $44,999 | 0 (0.0%) | 0 (0.0%) |
| $45,000 to $49,999 | 22 (14.5%) | 19 (14.2%) |
| $50,000 to $54,999 | 18 (11.8%) | 0 (0.0%) |
| $55,000 to $64,999 | 0 (0.0%) | 13 (9.7%) |
| $65,000 to $74,999 | 42 (27.6%) | 21 (15.7%) |
| $75,000 to $99,999 | 39 (25.7%) | 5 (3.7%) |
| $100,000+ | 15 (9.9%) | 0 (0.0%) |
| Total | 152 (100.0%) | 134 (100.0%) |
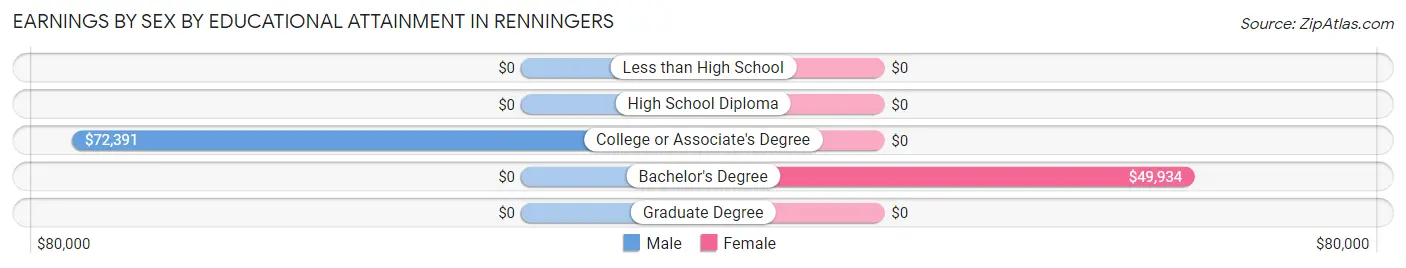
Earnings by Sex by Educational Attainment in Renningers
Average earnings in Renningers are $70,917 for men and $40,000 for women, a difference of 43.6%. Men with an educational attainment of college or associate's degree enjoy the highest average annual earnings of $72,391, while those with college or associate's degree education earn the least with $72,391. Women with an educational attainment of bachelor's degree earn the most with the average annual earnings of $49,934, while those with bachelor's degree education have the smallest earnings of $49,934.
| Educational Attainment | Male Income | Female Income |
| Less than High School | - | - |
| High School Diploma | - | - |
| College or Associate's Degree | $72,391 | $0 |
| Bachelor's Degree | - | - |
| Graduate Degree | - | - |
| Total | $70,917 | $40,000 |
Family Income in Renningers
Family Income Brackets in Renningers
According to the Renningers family income data, there are 44 families falling into the $75,000 to $99,999 income range, which is the most common income bracket and makes up 26.5% of all families.
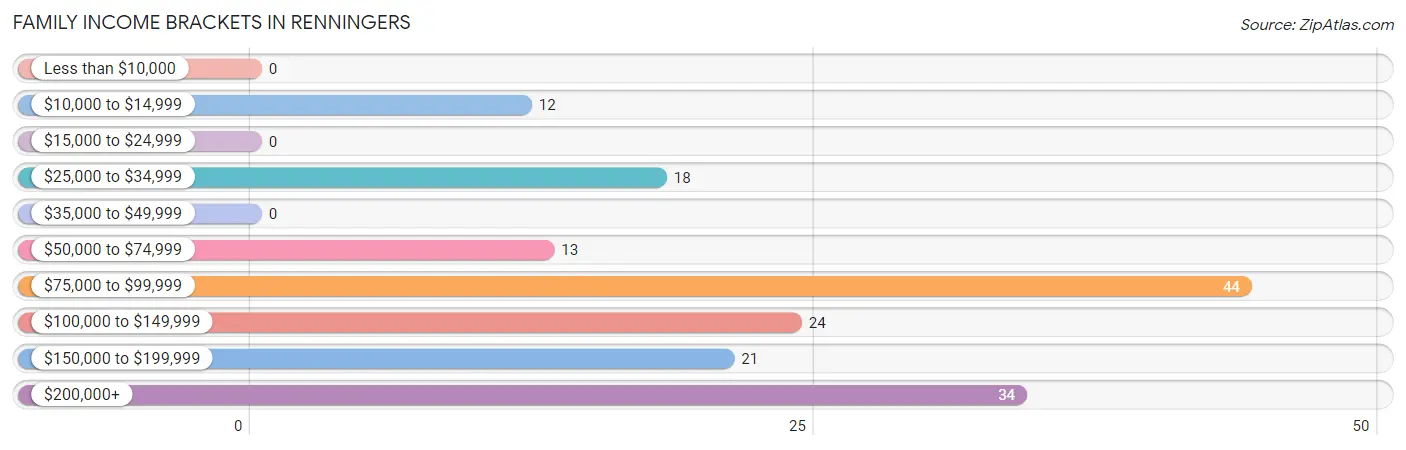
| Income Bracket | # Families | % Families |
| Less than $10,000 | 0 | 0.0% |
| $10,000 to $14,999 | 12 | 7.2% |
| $15,000 to $24,999 | 0 | 0.0% |
| $25,000 to $34,999 | 18 | 10.8% |
| $35,000 to $49,999 | 0 | 0.0% |
| $50,000 to $74,999 | 13 | 7.8% |
| $75,000 to $99,999 | 44 | 26.5% |
| $100,000 to $149,999 | 24 | 14.5% |
| $150,000 to $199,999 | 21 | 12.7% |
| $200,000+ | 34 | 20.5% |
Family Income by Famaliy Size in Renningers
3-person families (77 | 46.4%) account for the highest median family income in Renningers with $162,679 per family, while 3-person families (77 | 46.4%) have the highest median income of $54,226 per family member.
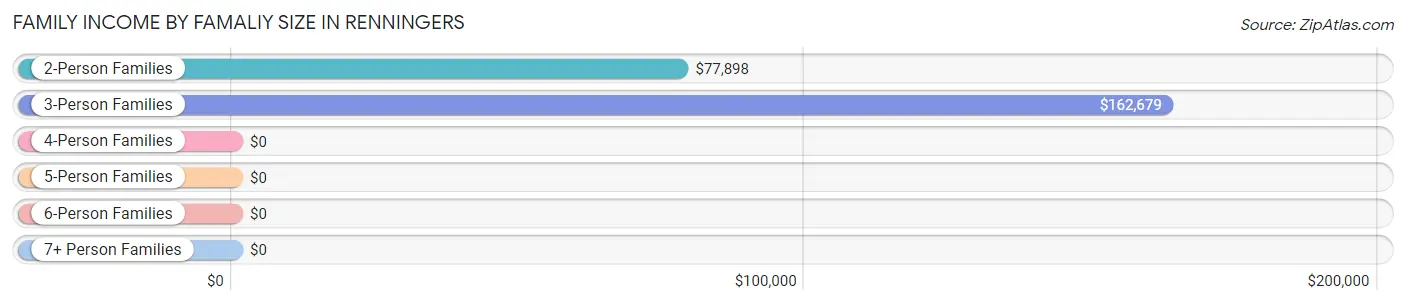
| Income Bracket | # Families | Median Income |
| 2-Person Families | 57 (34.3%) | $77,898 |
| 3-Person Families | 77 (46.4%) | $162,679 |
| 4-Person Families | 32 (19.3%) | $0 |
| 5-Person Families | 0 (0.0%) | $0 |
| 6-Person Families | 0 (0.0%) | $0 |
| 7+ Person Families | 0 (0.0%) | $0 |
| Total | 166 (100.0%) | $84,000 |
Family Income by Number of Earners in Renningers
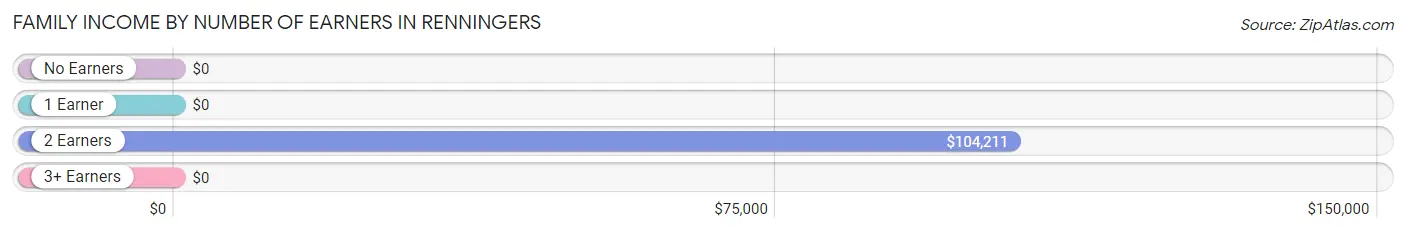
| Number of Earners | # Families | Median Income |
| No Earners | 25 (15.1%) | $0 |
| 1 Earner | 28 (16.9%) | $0 |
| 2 Earners | 94 (56.6%) | $104,211 |
| 3+ Earners | 19 (11.5%) | $0 |
| Total | 166 (100.0%) | $84,000 |
Household Income in Renningers
Household Income Brackets in Renningers
With 44 households falling in the category, the $75,000 to $99,999 income range is the most frequent in Renningers, accounting for 26.5% of all households.
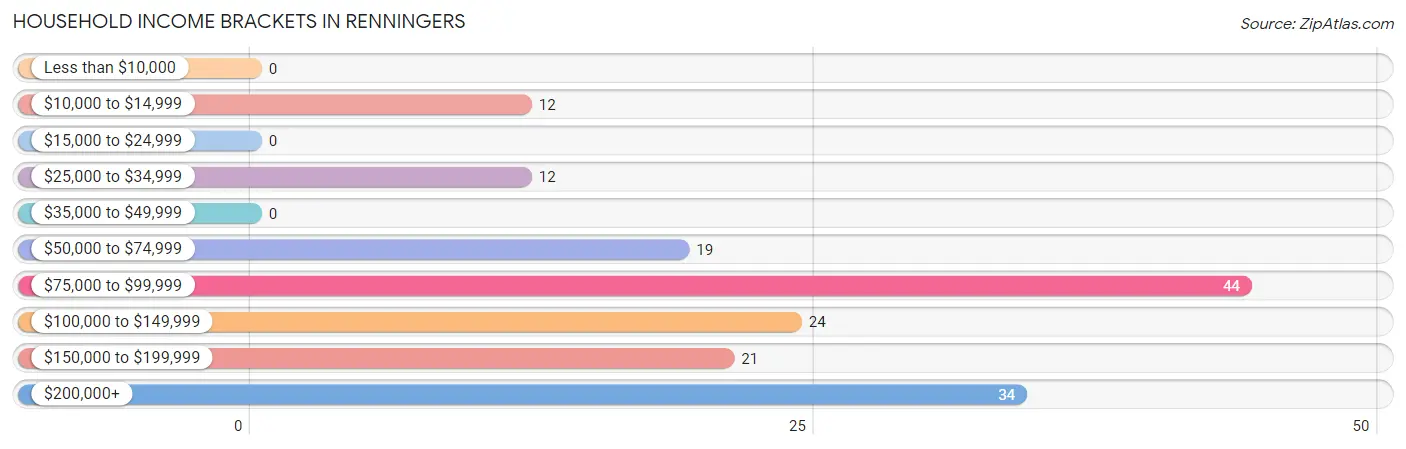
| Income Bracket | # Households | % Households |
| Less than $10,000 | 0 | 0.0% |
| $10,000 to $14,999 | 12 | 7.2% |
| $15,000 to $24,999 | 0 | 0.0% |
| $25,000 to $34,999 | 12 | 7.2% |
| $35,000 to $49,999 | 0 | 0.0% |
| $50,000 to $74,999 | 19 | 11.4% |
| $75,000 to $99,999 | 44 | 26.5% |
| $100,000 to $149,999 | 24 | 14.5% |
| $150,000 to $199,999 | 21 | 12.7% |
| $200,000+ | 34 | 20.5% |
Household Income by Householder Age in Renningers
The median household income in Renningers is $84,000, with the highest median household income of $201,053 found in the 45 to 64 years age bracket for the primary householder. A total of 52 households (31.3%) fall into this category.
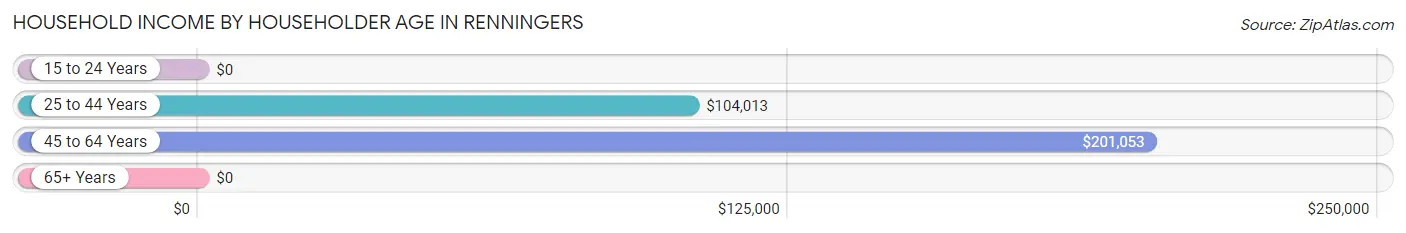
| Income Bracket | # Households | Median Income |
| 15 to 24 Years | 0 (0.0%) | $0 |
| 25 to 44 Years | 67 (40.4%) | $104,013 |
| 45 to 64 Years | 52 (31.3%) | $201,053 |
| 65+ Years | 47 (28.3%) | $0 |
| Total | 166 (100.0%) | $84,000 |
Poverty in Renningers
Income Below Poverty by Sex and Age in Renningers
With 11.9% poverty level for males and 5.6% for females among the residents of Renningers, 6 to 11 year old males and 35 to 44 year old females are the most vulnerable to poverty, with 13 males (100.0%) and 13 females (30.9%) in their respective age groups living below the poverty level.
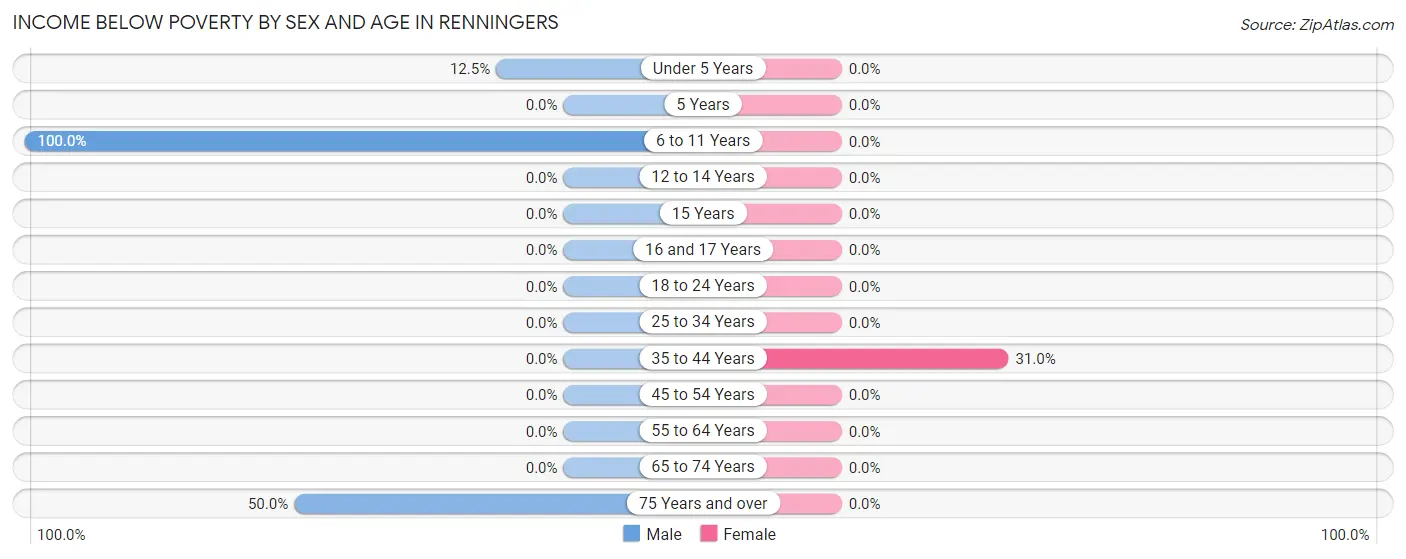
| Age Bracket | Male | Female |
| Under 5 Years | 13 (12.5%) | 0 (0.0%) |
| 5 Years | 0 (0.0%) | 0 (0.0%) |
| 6 to 11 Years | 13 (100.0%) | 0 (0.0%) |
| 12 to 14 Years | 0 (0.0%) | 0 (0.0%) |
| 15 Years | 0 (0.0%) | 0 (0.0%) |
| 16 and 17 Years | 0 (0.0%) | 0 (0.0%) |
| 18 to 24 Years | 0 (0.0%) | 0 (0.0%) |
| 25 to 34 Years | 0 (0.0%) | 0 (0.0%) |
| 35 to 44 Years | 0 (0.0%) | 13 (30.9%) |
| 45 to 54 Years | 0 (0.0%) | 0 (0.0%) |
| 55 to 64 Years | 0 (0.0%) | 0 (0.0%) |
| 65 to 74 Years | 0 (0.0%) | 0 (0.0%) |
| 75 Years and over | 12 (50.0%) | 0 (0.0%) |
| Total | 38 (11.9%) | 13 (5.6%) |
Income Above Poverty by Sex and Age in Renningers
According to the poverty statistics in Renningers, males aged 12 to 14 years and females aged under 5 years are the age groups that are most secure financially, with 100.0% of males and 100.0% of females in these age groups living above the poverty line.
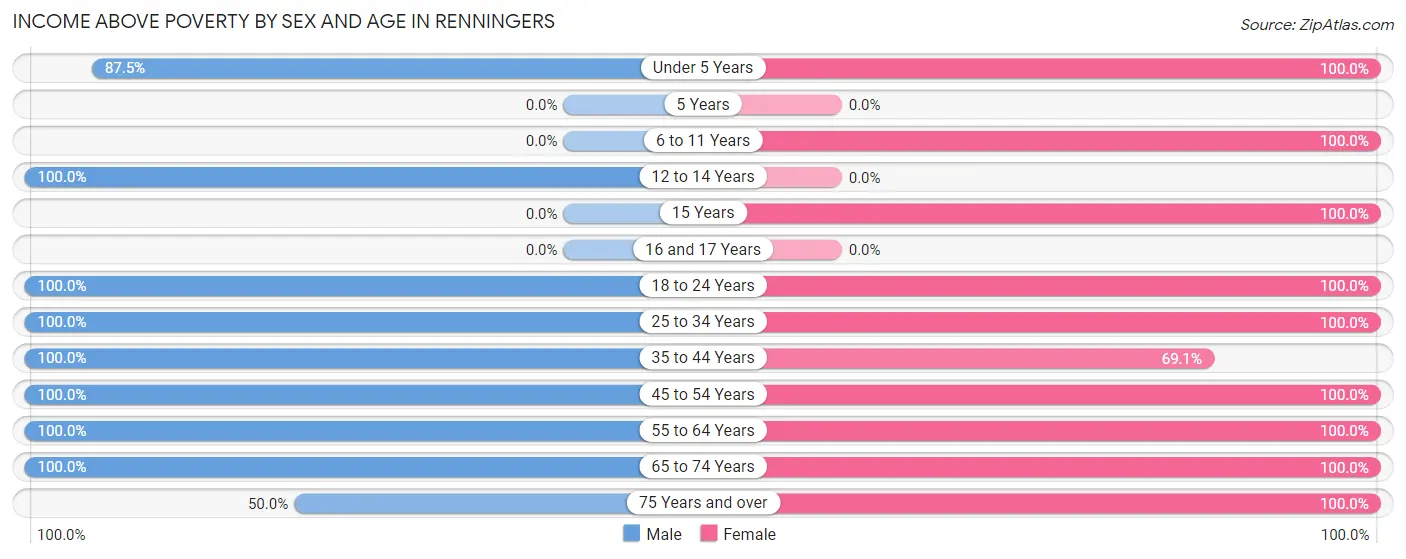
| Age Bracket | Male | Female |
| Under 5 Years | 91 (87.5%) | 17 (100.0%) |
| 5 Years | 0 (0.0%) | 0 (0.0%) |
| 6 to 11 Years | 0 (0.0%) | 13 (100.0%) |
| 12 to 14 Years | 14 (100.0%) | 0 (0.0%) |
| 15 Years | 0 (0.0%) | 17 (100.0%) |
| 16 and 17 Years | 0 (0.0%) | 0 (0.0%) |
| 18 to 24 Years | 6 (100.0%) | 18 (100.0%) |
| 25 to 34 Years | 84 (100.0%) | 52 (100.0%) |
| 35 to 44 Years | 7 (100.0%) | 29 (69.1%) |
| 45 to 54 Years | 15 (100.0%) | 10 (100.0%) |
| 55 to 64 Years | 30 (100.0%) | 25 (100.0%) |
| 65 to 74 Years | 23 (100.0%) | 24 (100.0%) |
| 75 Years and over | 12 (50.0%) | 13 (100.0%) |
| Total | 282 (88.1%) | 218 (94.4%) |
Income Below Poverty Among Married-Couple Families in Renningers
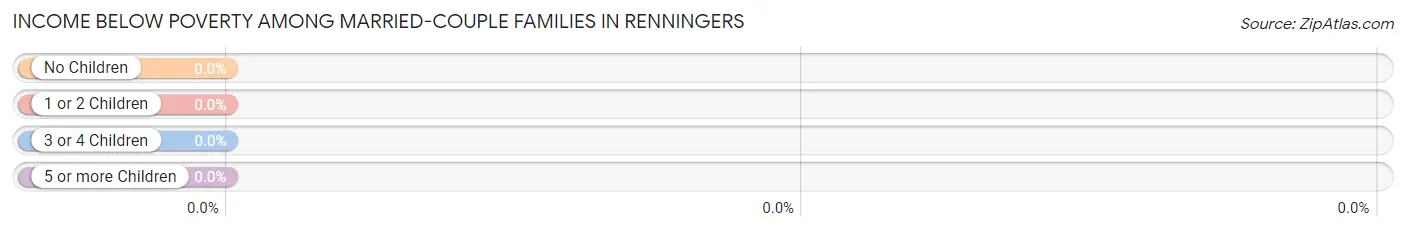
| Children | Above Poverty | Below Poverty |
| No Children | 76 (100.0%) | 0 (0.0%) |
| 1 or 2 Children | 72 (100.0%) | 0 (0.0%) |
| 3 or 4 Children | 0 (0.0%) | 0 (0.0%) |
| 5 or more Children | 0 (0.0%) | 0 (0.0%) |
| Total | 148 (100.0%) | 0 (0.0%) |
Income Below Poverty Among Single-Parent Households in Renningers
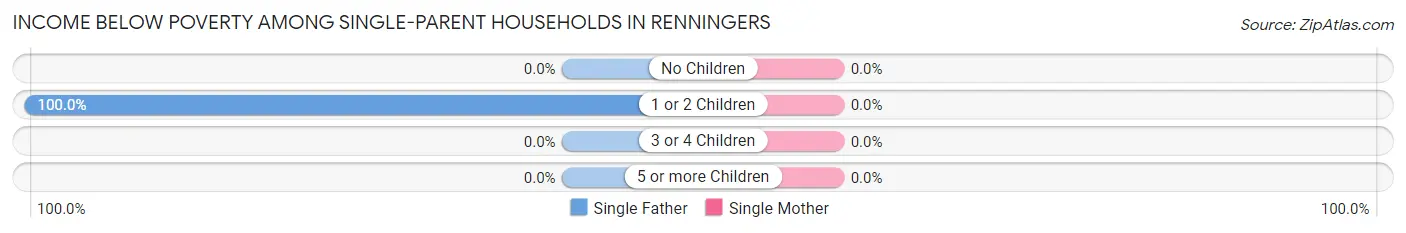
| Children | Single Father | Single Mother |
| No Children | 0 (0.0%) | 0 (0.0%) |
| 1 or 2 Children | 12 (100.0%) | 0 (0.0%) |
| 3 or 4 Children | 0 (0.0%) | 0 (0.0%) |
| 5 or more Children | 0 (0.0%) | 0 (0.0%) |
| Total | 12 (100.0%) | 0 (0.0%) |
Income Below Poverty Among Married-Couple vs Single-Parent Households in Renningers
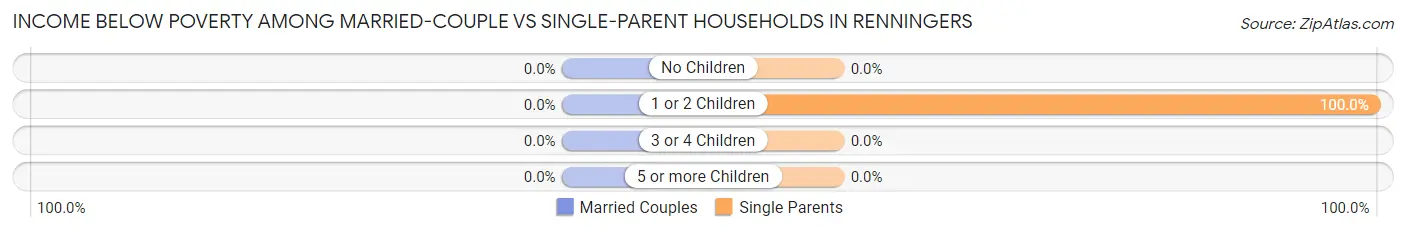
| Children | Married-Couple Families | Single-Parent Households |
| No Children | 0 (0.0%) | 0 (0.0%) |
| 1 or 2 Children | 0 (0.0%) | 12 (100.0%) |
| 3 or 4 Children | 0 (0.0%) | 0 (0.0%) |
| 5 or more Children | 0 (0.0%) | 0 (0.0%) |
| Total | 0 (0.0%) | 12 (66.7%) |
Race in Renningers
The most populous races in Renningers are White / Caucasian (488 | 88.6%), and Two or more Races (63 | 11.4%).
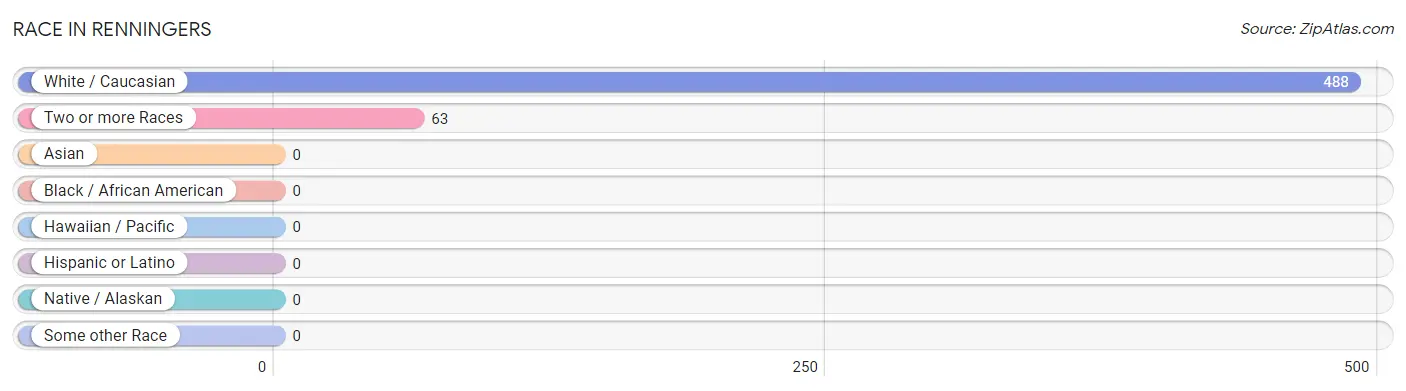
| Race | # Population | % Population |
| Asian | 0 | 0.0% |
| Black / African American | 0 | 0.0% |
| Hawaiian / Pacific | 0 | 0.0% |
| Hispanic or Latino | 0 | 0.0% |
| Native / Alaskan | 0 | 0.0% |
| White / Caucasian | 488 | 88.6% |
| Two or more Races | 63 | 11.4% |
| Some other Race | 0 | 0.0% |
| Total | 551 | 100.0% |
Ancestry in Renningers
The most populous ancestries reported in Renningers are German (157 | 28.5%), Irish (122 | 22.1%), Polish (96 | 17.4%), Italian (79 | 14.3%), and Sri Lankan (63 | 11.4%), together accounting for 93.8% of all Renningers residents.
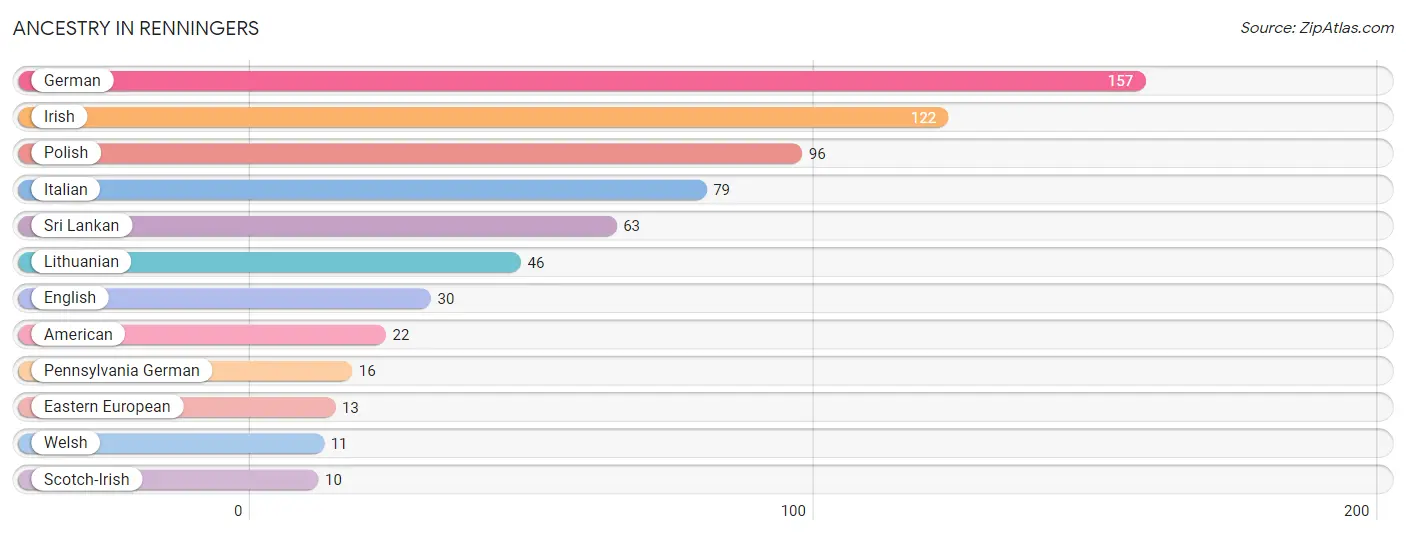
| Ancestry | # Population | % Population |
| American | 22 | 4.0% |
| Eastern European | 13 | 2.4% |
| English | 30 | 5.4% |
| German | 157 | 28.5% |
| Irish | 122 | 22.1% |
| Italian | 79 | 14.3% |
| Lithuanian | 46 | 8.4% |
| Pennsylvania German | 16 | 2.9% |
| Polish | 96 | 17.4% |
| Scotch-Irish | 10 | 1.8% |
| Sri Lankan | 63 | 11.4% |
| Welsh | 11 | 2.0% | View All 12 Rows |
Immigrants in Renningers

| Immigration Origin | # Population | % Population | View All 0 Rows |
Sex and Age in Renningers
Sex and Age in Renningers
The most populous age groups in Renningers are Under 5 Years (104 | 32.5%) for men and 35 to 39 Years (29 | 12.6%) for women.
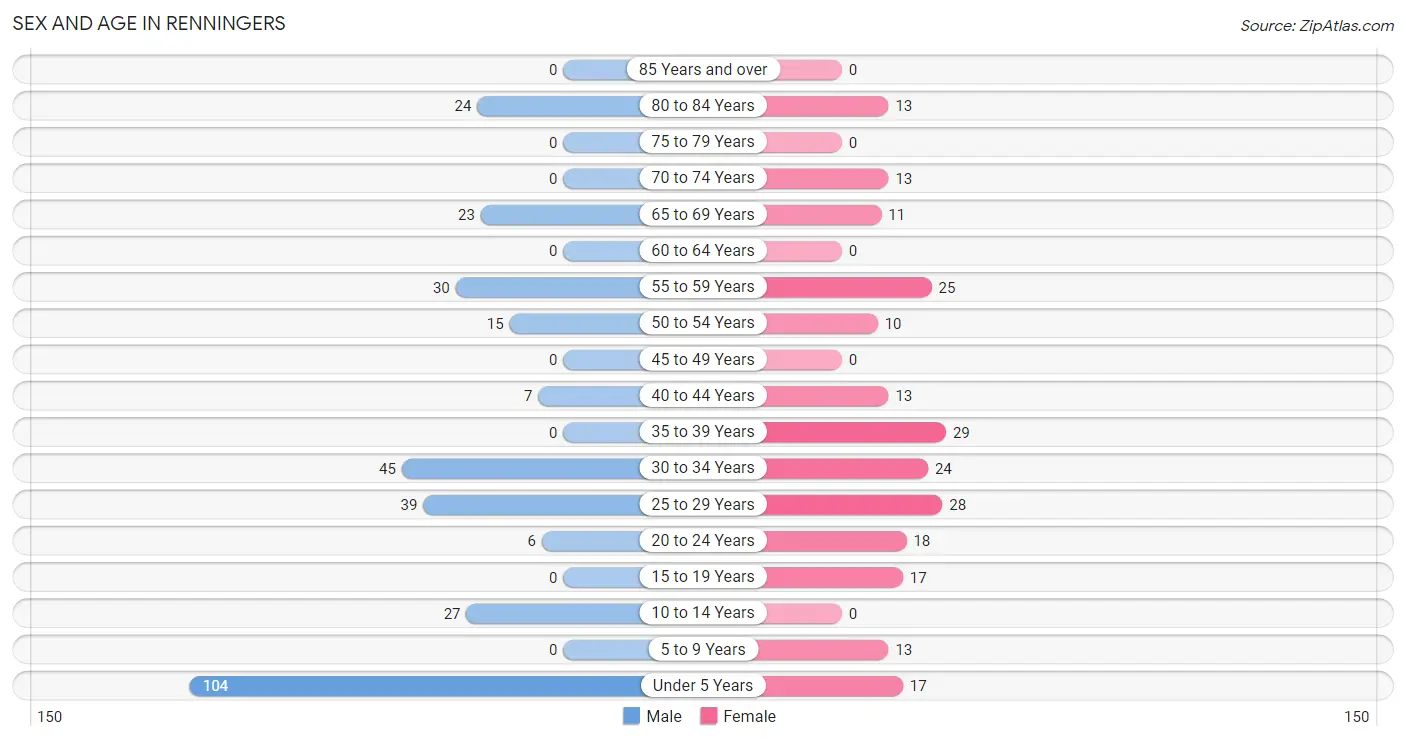
| Age Bracket | Male | Female |
| Under 5 Years | 104 (32.5%) | 17 (7.4%) |
| 5 to 9 Years | 0 (0.0%) | 13 (5.6%) |
| 10 to 14 Years | 27 (8.4%) | 0 (0.0%) |
| 15 to 19 Years | 0 (0.0%) | 17 (7.4%) |
| 20 to 24 Years | 6 (1.9%) | 18 (7.8%) |
| 25 to 29 Years | 39 (12.2%) | 28 (12.1%) |
| 30 to 34 Years | 45 (14.1%) | 24 (10.4%) |
| 35 to 39 Years | 0 (0.0%) | 29 (12.6%) |
| 40 to 44 Years | 7 (2.2%) | 13 (5.6%) |
| 45 to 49 Years | 0 (0.0%) | 0 (0.0%) |
| 50 to 54 Years | 15 (4.7%) | 10 (4.3%) |
| 55 to 59 Years | 30 (9.4%) | 25 (10.8%) |
| 60 to 64 Years | 0 (0.0%) | 0 (0.0%) |
| 65 to 69 Years | 23 (7.2%) | 11 (4.8%) |
| 70 to 74 Years | 0 (0.0%) | 13 (5.6%) |
| 75 to 79 Years | 0 (0.0%) | 0 (0.0%) |
| 80 to 84 Years | 24 (7.5%) | 13 (5.6%) |
| 85 Years and over | 0 (0.0%) | 0 (0.0%) |
| Total | 320 (100.0%) | 231 (100.0%) |
Families and Households in Renningers
Median Family Size in Renningers
The median family size in Renningers is 3.28 persons per family, with single female/mother families (6 | 3.6%) accounting for the largest median family size of 5.17 persons per family. On the other hand, married-couple families (148 | 89.2%) represent the smallest median family size with 3.13 persons per family.
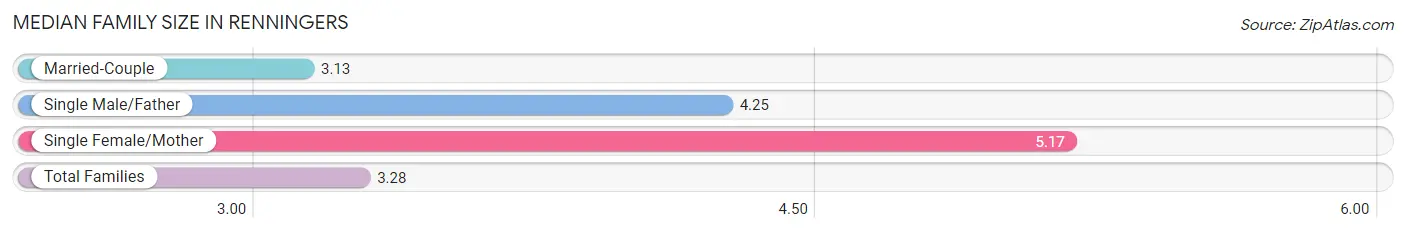
| Family Type | # Families | Family Size |
| Married-Couple | 148 (89.2%) | 3.13 |
| Single Male/Father | 12 (7.2%) | 4.25 |
| Single Female/Mother | 6 (3.6%) | 5.17 |
| Total Families | 166 (100.0%) | 3.28 |
Median Household Size in Renningers
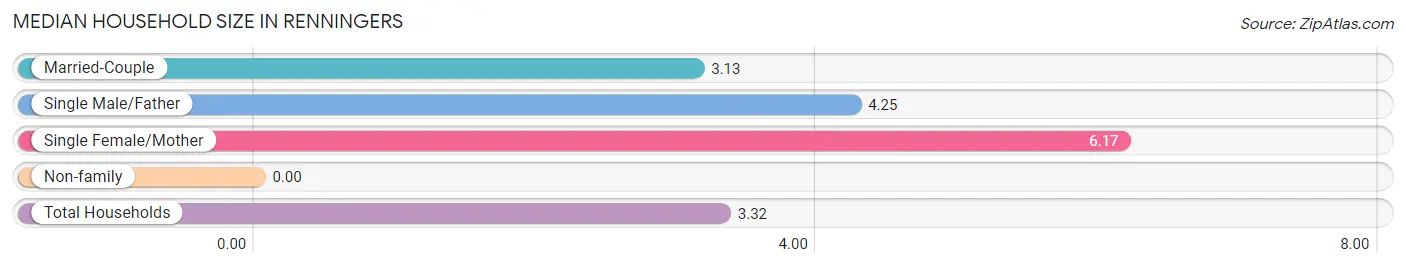
| Household Type | # Households | Household Size |
| Married-Couple | 148 (89.2%) | 3.13 |
| Single Male/Father | 12 (7.2%) | 4.25 |
| Single Female/Mother | 6 (3.6%) | 6.17 |
| Non-family | 0 (0.0%) | - |
| Total Households | 166 (100.0%) | 3.32 |
Household Size by Marriage Status in Renningers
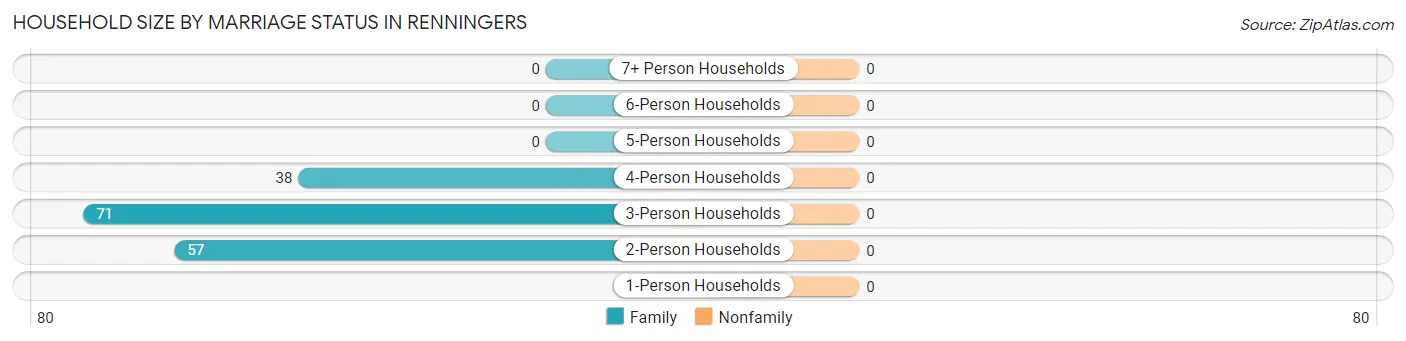
| Household Size | Family Households | Nonfamily Households |
| 1-Person Households | - | 0 (0.0%) |
| 2-Person Households | 57 (34.3%) | 0 (0.0%) |
| 3-Person Households | 71 (42.8%) | 0 (0.0%) |
| 4-Person Households | 38 (22.9%) | 0 (0.0%) |
| 5-Person Households | 0 (0.0%) | 0 (0.0%) |
| 6-Person Households | 0 (0.0%) | 0 (0.0%) |
| 7+ Person Households | 0 (0.0%) | 0 (0.0%) |
| Total | 166 (100.0%) | 0 (0.0%) |
Female Fertility in Renningers
Fertility by Age in Renningers
Average fertility rate in Renningers is 310.0 births per 1,000 women. Women in the age bracket of 20 to 34 years have the highest fertility rate with 571.0 births per 1,000 women. Women in the age bracket of 20 to 34 years acount for 100.0% of all women with births.
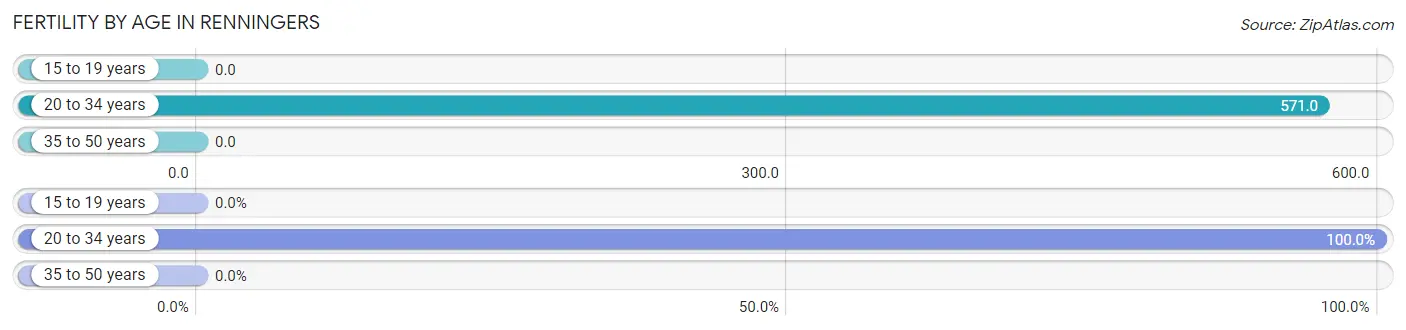
| Age Bracket | Women with Births | Births / 1,000 Women |
| 15 to 19 years | 0 (0.0%) | 0.0 |
| 20 to 34 years | 40 (100.0%) | 571.0 |
| 35 to 50 years | 0 (0.0%) | 0.0 |
| Total | 40 (100.0%) | 310.0 |
Fertility by Age by Marriage Status in Renningers
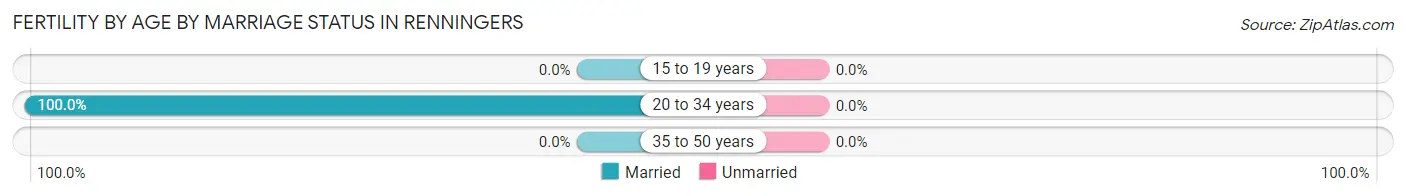
| Age Bracket | Married | Unmarried |
| 15 to 19 years | 0 (0.0%) | 0 (0.0%) |
| 20 to 34 years | 40 (100.0%) | 0 (0.0%) |
| 35 to 50 years | 0 (0.0%) | 0 (0.0%) |
| Total | 40 (100.0%) | 0 (0.0%) |
Fertility by Education in Renningers
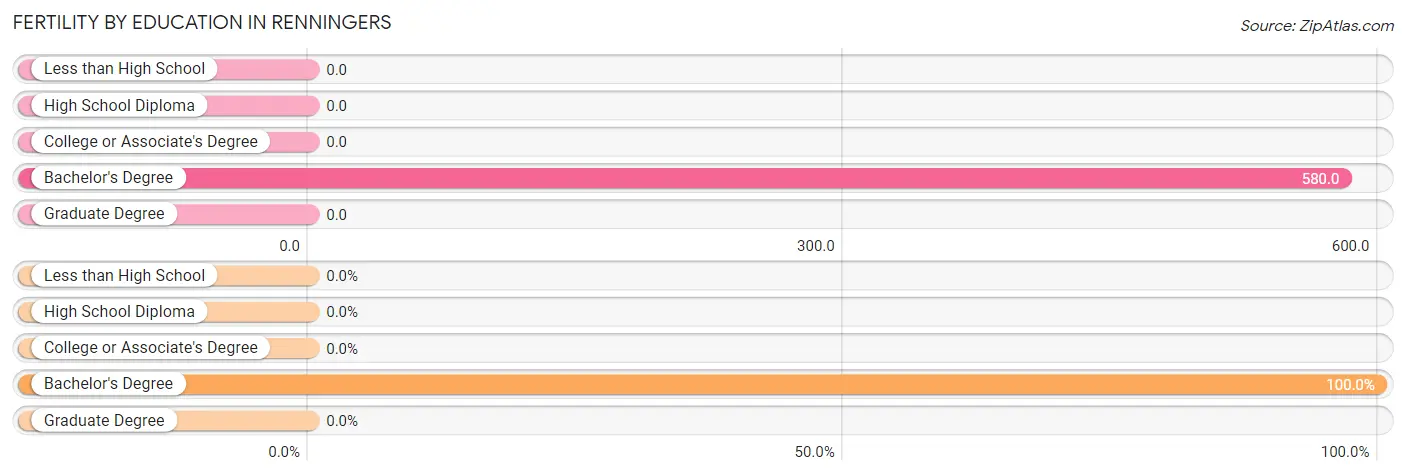
| Educational Attainment | Women with Births | Births / 1,000 Women |
| Less than High School | 0 (0.0%) | 0.0 |
| High School Diploma | 0 (0.0%) | 0.0 |
| College or Associate's Degree | 0 (0.0%) | 0.0 |
| Bachelor's Degree | 40 (100.0%) | 580.0 |
| Graduate Degree | 0 (0.0%) | 0.0 |
| Total | 40 (100.0%) | 310.0 |
Fertility by Education by Marriage Status in Renningers
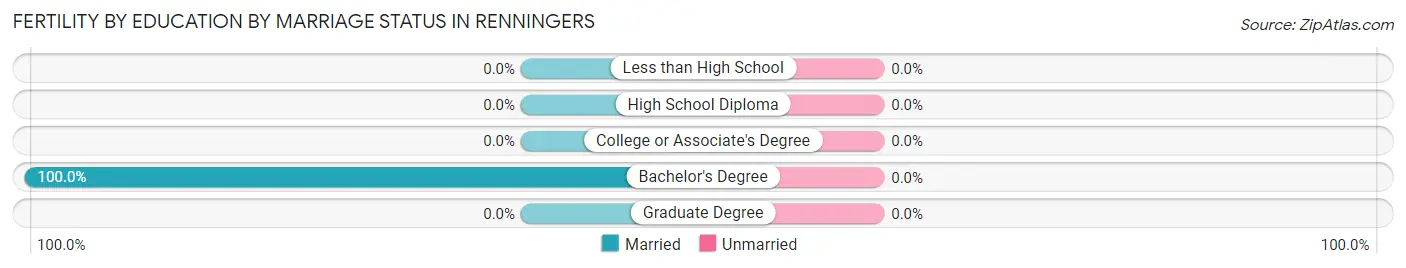
| Educational Attainment | Married | Unmarried |
| Less than High School | 0 (0.0%) | 0 (0.0%) |
| High School Diploma | 0 (0.0%) | 0 (0.0%) |
| College or Associate's Degree | 0 (0.0%) | 0 (0.0%) |
| Bachelor's Degree | 40 (100.0%) | 0 (0.0%) |
| Graduate Degree | 0 (0.0%) | 0 (0.0%) |
| Total | 40 (100.0%) | 0 (0.0%) |
Employment Characteristics in Renningers
Employment by Class of Employer in Renningers
Among the 248 employed individuals in Renningers, private company employees (169 | 68.1%), local government employees (42 | 16.9%), and state government employees (37 | 14.9%) make up the most common classes of employment.
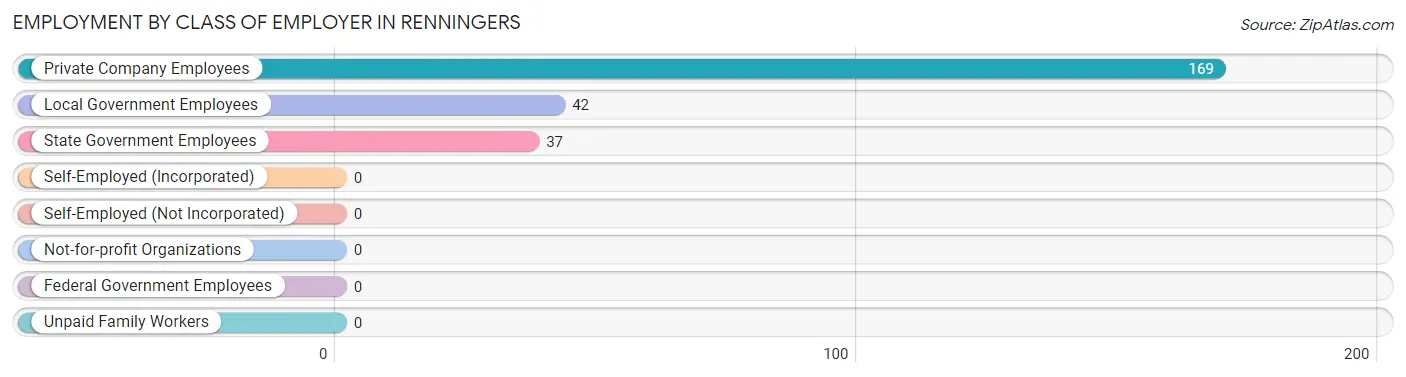
| Employer Class | # Employees | % Employees |
| Private Company Employees | 169 | 68.1% |
| Self-Employed (Incorporated) | 0 | 0.0% |
| Self-Employed (Not Incorporated) | 0 | 0.0% |
| Not-for-profit Organizations | 0 | 0.0% |
| Local Government Employees | 42 | 16.9% |
| State Government Employees | 37 | 14.9% |
| Federal Government Employees | 0 | 0.0% |
| Unpaid Family Workers | 0 | 0.0% |
| Total | 248 | 100.0% |
Employment Status by Age in Renningers
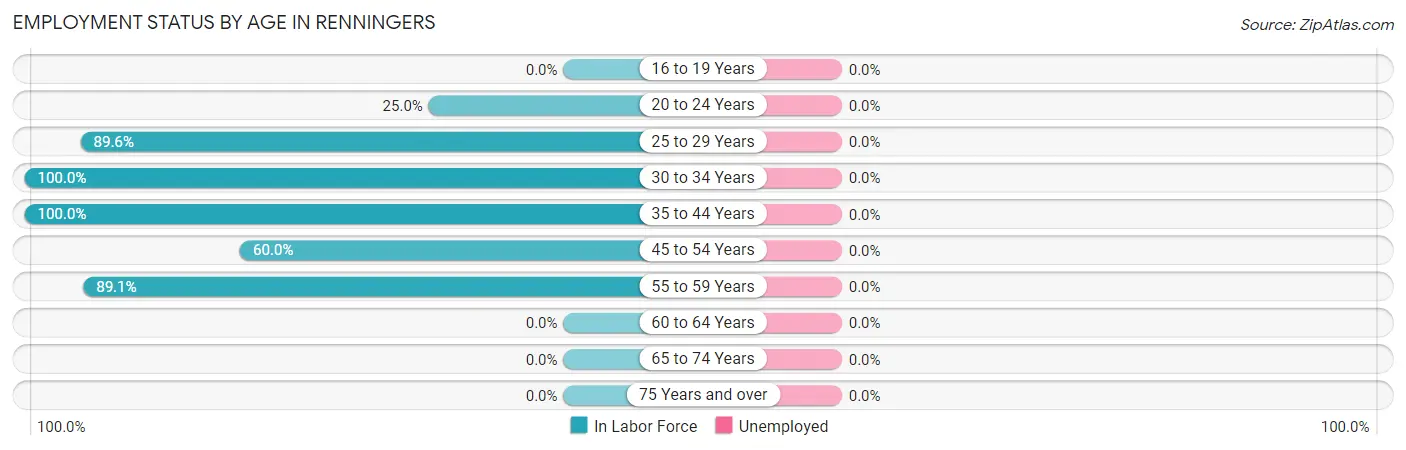
| Age Bracket | In Labor Force | Unemployed |
| 16 to 19 Years | 0 (0.0%) | 0 (0.0%) |
| 20 to 24 Years | 6 (25.0%) | 0 (0.0%) |
| 25 to 29 Years | 60 (89.6%) | 0 (0.0%) |
| 30 to 34 Years | 69 (100.0%) | 0 (0.0%) |
| 35 to 44 Years | 49 (100.0%) | 0 (0.0%) |
| 45 to 54 Years | 15 (60.0%) | 0 (0.0%) |
| 55 to 59 Years | 49 (89.1%) | 0 (0.0%) |
| 60 to 64 Years | 0 (0.0%) | 0 (0.0%) |
| 65 to 74 Years | 0 (0.0%) | 0 (0.0%) |
| 75 Years and over | 0 (0.0%) | 0 (0.0%) |
| Total | 248 (66.5%) | 0 (0.0%) |
Employment Status by Educational Attainment in Renningers
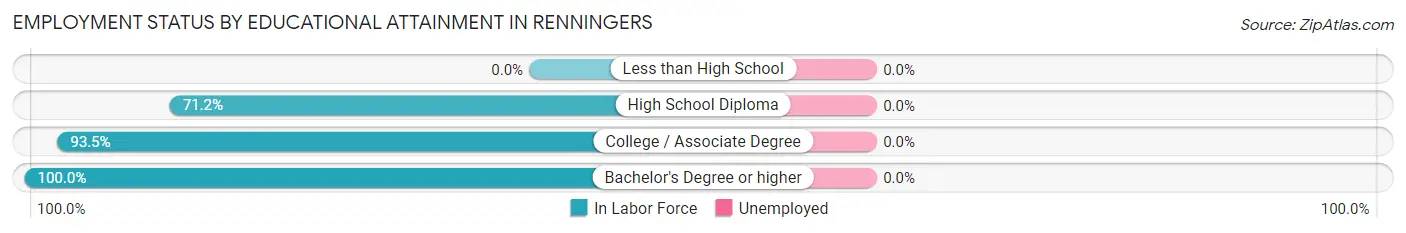
| Educational Attainment | In Labor Force | Unemployed |
| Less than High School | 0 (0.0%) | 0 (0.0%) |
| High School Diploma | 42 (71.2%) | 0 (0.0%) |
| College / Associate Degree | 87 (93.5%) | 0 (0.0%) |
| Bachelor's Degree or higher | 113 (100.0%) | 0 (0.0%) |
| Total | 242 (91.3%) | 0 (0.0%) |
Employment Occupations by Sex in Renningers
Management, Business, Science and Arts Occupations
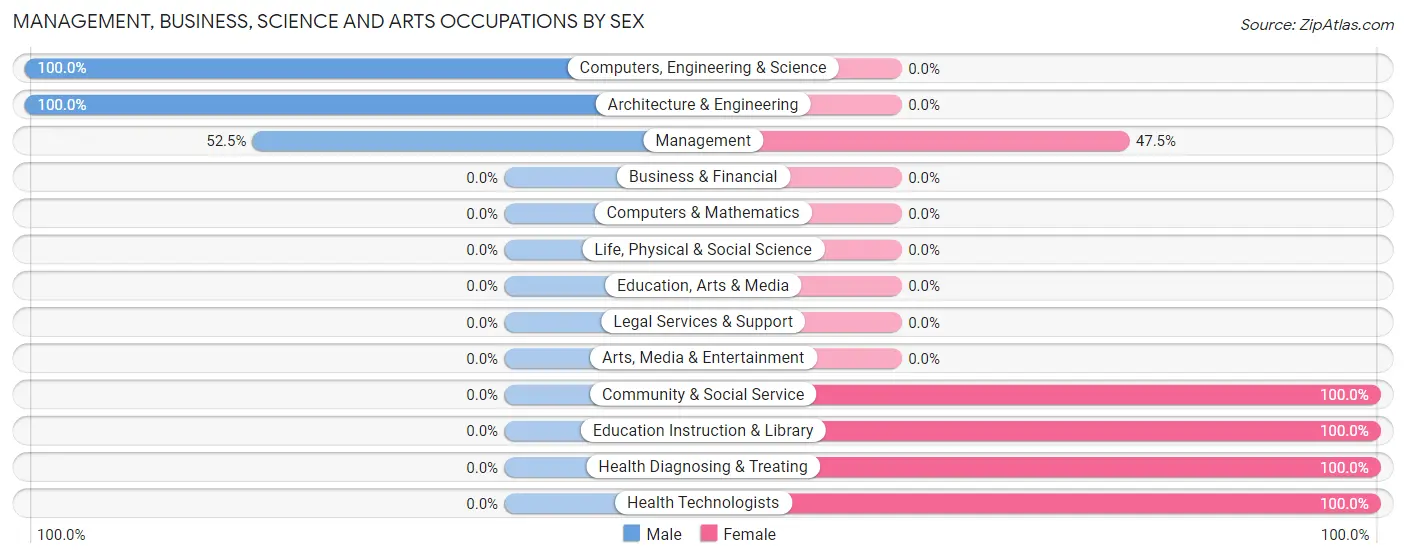
The most common Management, Business, Science and Arts occupations in Renningers are Management (40 | 16.1%), Health Diagnosing & Treating (21 | 8.5%), Health Technologists (21 | 8.5%), Computers, Engineering & Science (12 | 4.8%), and Architecture & Engineering (12 | 4.8%).
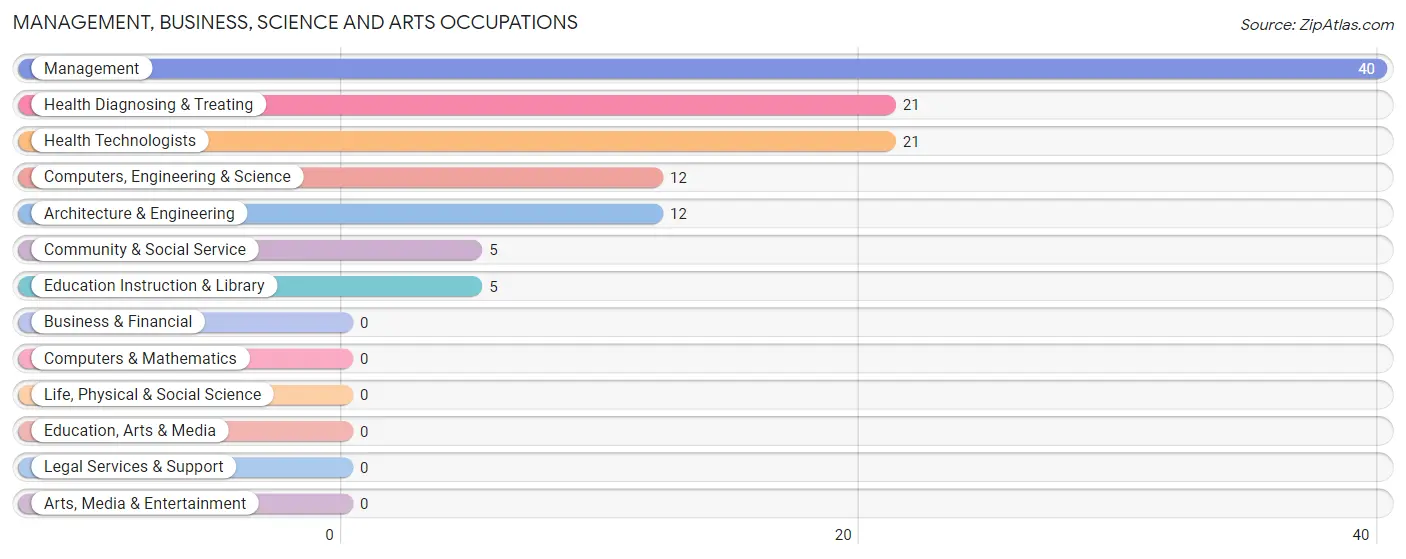
Management, Business, Science and Arts Occupations by Sex
Within the Management, Business, Science and Arts occupations in Renningers, the most male-oriented occupations are Computers, Engineering & Science (100.0%), Architecture & Engineering (100.0%), and Management (52.5%), while the most female-oriented occupations are Community & Social Service (100.0%), Education Instruction & Library (100.0%), and Health Diagnosing & Treating (100.0%).
| Occupation | Male | Female |
| Management | 21 (52.5%) | 19 (47.5%) |
| Business & Financial | 0 (0.0%) | 0 (0.0%) |
| Computers, Engineering & Science | 12 (100.0%) | 0 (0.0%) |
| Computers & Mathematics | 0 (0.0%) | 0 (0.0%) |
| Architecture & Engineering | 12 (100.0%) | 0 (0.0%) |
| Life, Physical & Social Science | 0 (0.0%) | 0 (0.0%) |
| Community & Social Service | 0 (0.0%) | 5 (100.0%) |
| Education, Arts & Media | 0 (0.0%) | 0 (0.0%) |
| Legal Services & Support | 0 (0.0%) | 0 (0.0%) |
| Education Instruction & Library | 0 (0.0%) | 5 (100.0%) |
| Arts, Media & Entertainment | 0 (0.0%) | 0 (0.0%) |
| Health Diagnosing & Treating | 0 (0.0%) | 21 (100.0%) |
| Health Technologists | 0 (0.0%) | 21 (100.0%) |
| Total (Category) | 33 (42.3%) | 45 (57.7%) |
| Total (Overall) | 142 (57.3%) | 106 (42.7%) |
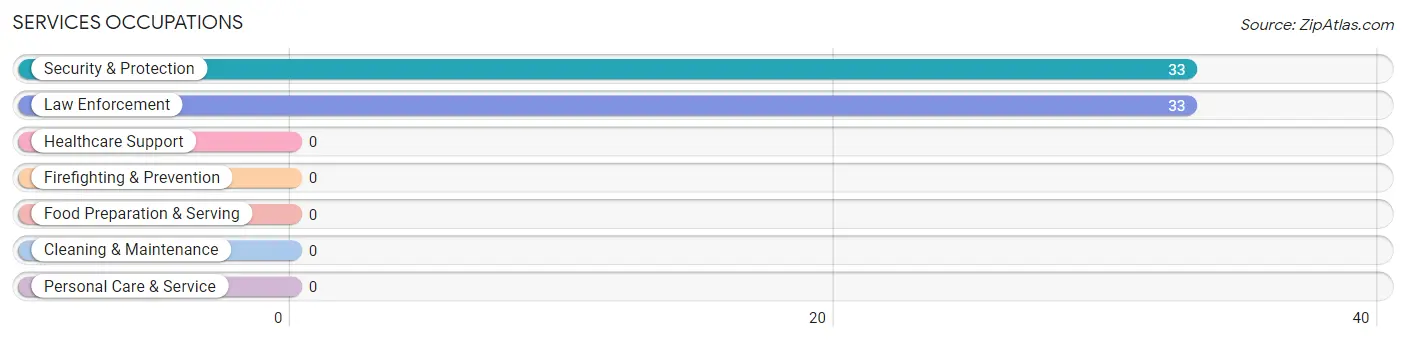
Services Occupations
The most common Services occupations in Renningers are Security & Protection (33 | 13.3%), and Law Enforcement (33 | 13.3%).
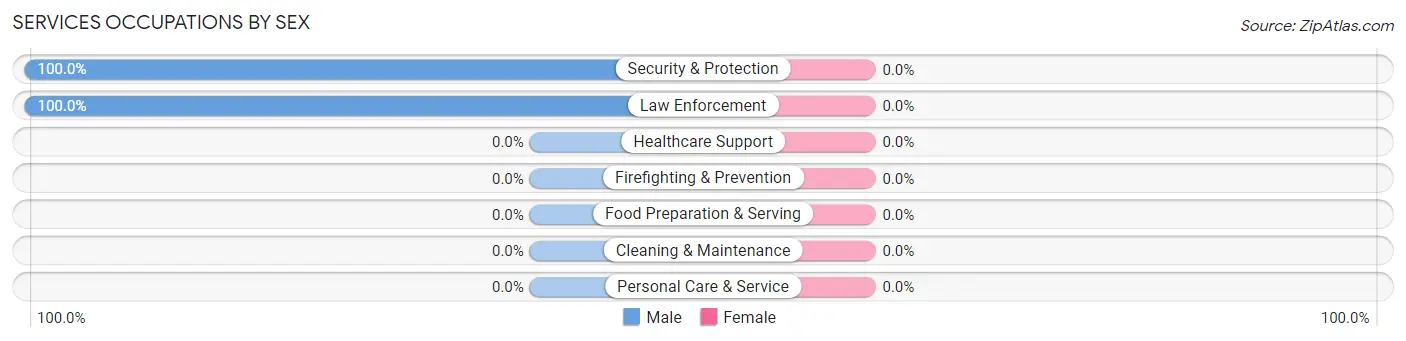
Services Occupations by Sex
| Occupation | Male | Female |
| Healthcare Support | 0 (0.0%) | 0 (0.0%) |
| Security & Protection | 33 (100.0%) | 0 (0.0%) |
| Firefighting & Prevention | 0 (0.0%) | 0 (0.0%) |
| Law Enforcement | 33 (100.0%) | 0 (0.0%) |
| Food Preparation & Serving | 0 (0.0%) | 0 (0.0%) |
| Cleaning & Maintenance | 0 (0.0%) | 0 (0.0%) |
| Personal Care & Service | 0 (0.0%) | 0 (0.0%) |
| Total (Category) | 33 (100.0%) | 0 (0.0%) |
| Total (Overall) | 142 (57.3%) | 106 (42.7%) |
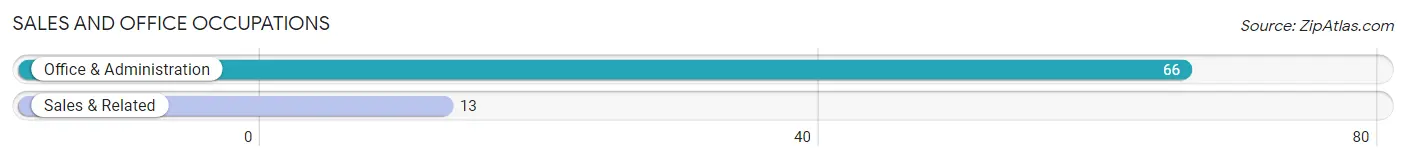
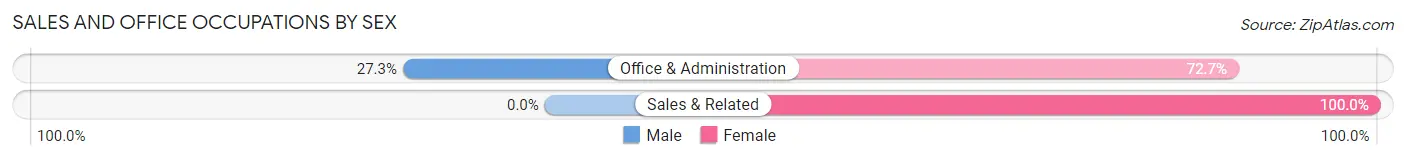
Sales and Office Occupations
The most common Sales and Office occupations in Renningers are Office & Administration (66 | 26.6%), and Sales & Related (13 | 5.2%).
Sales and Office Occupations by Sex
| Occupation | Male | Female |
| Sales & Related | 0 (0.0%) | 13 (100.0%) |
| Office & Administration | 18 (27.3%) | 48 (72.7%) |
| Total (Category) | 18 (22.8%) | 61 (77.2%) |
| Total (Overall) | 142 (57.3%) | 106 (42.7%) |
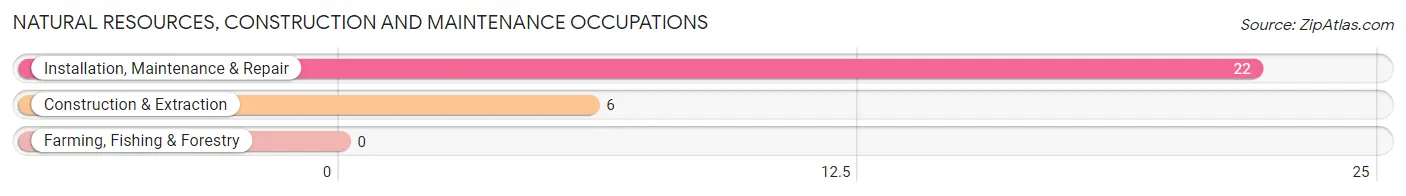
Natural Resources, Construction and Maintenance Occupations
The most common Natural Resources, Construction and Maintenance occupations in Renningers are Installation, Maintenance & Repair (22 | 8.9%), and Construction & Extraction (6 | 2.4%).
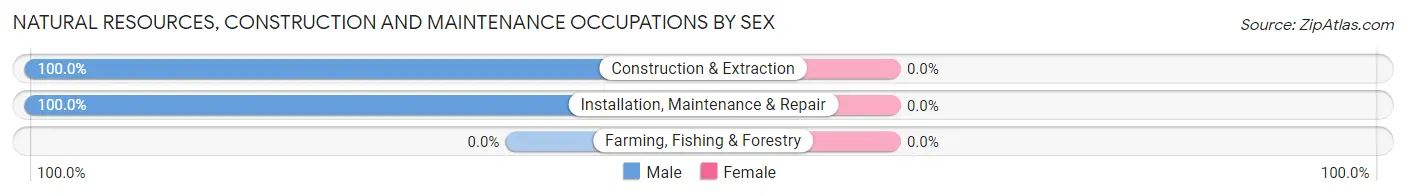
Natural Resources, Construction and Maintenance Occupations by Sex
| Occupation | Male | Female |
| Farming, Fishing & Forestry | 0 (0.0%) | 0 (0.0%) |
| Construction & Extraction | 6 (100.0%) | 0 (0.0%) |
| Installation, Maintenance & Repair | 22 (100.0%) | 0 (0.0%) |
| Total (Category) | 28 (100.0%) | 0 (0.0%) |
| Total (Overall) | 142 (57.3%) | 106 (42.7%) |
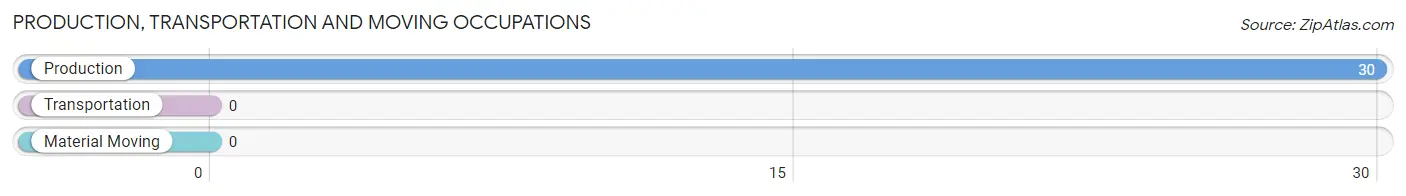
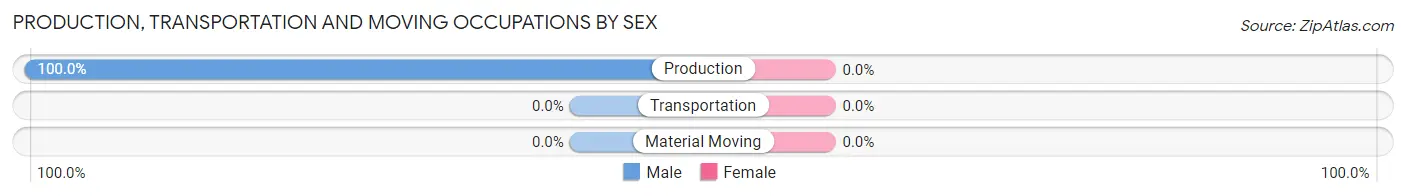
Production, Transportation and Moving Occupations
The most common Production, Transportation and Moving occupations in Renningers are , and Production (30 | 12.1%).
Production, Transportation and Moving Occupations by Sex
| Occupation | Male | Female |
| Production | 30 (100.0%) | 0 (0.0%) |
| Transportation | 0 (0.0%) | 0 (0.0%) |
| Material Moving | 0 (0.0%) | 0 (0.0%) |
| Total (Category) | 30 (100.0%) | 0 (0.0%) |
| Total (Overall) | 142 (57.3%) | 106 (42.7%) |
Employment Industries by Sex in Renningers
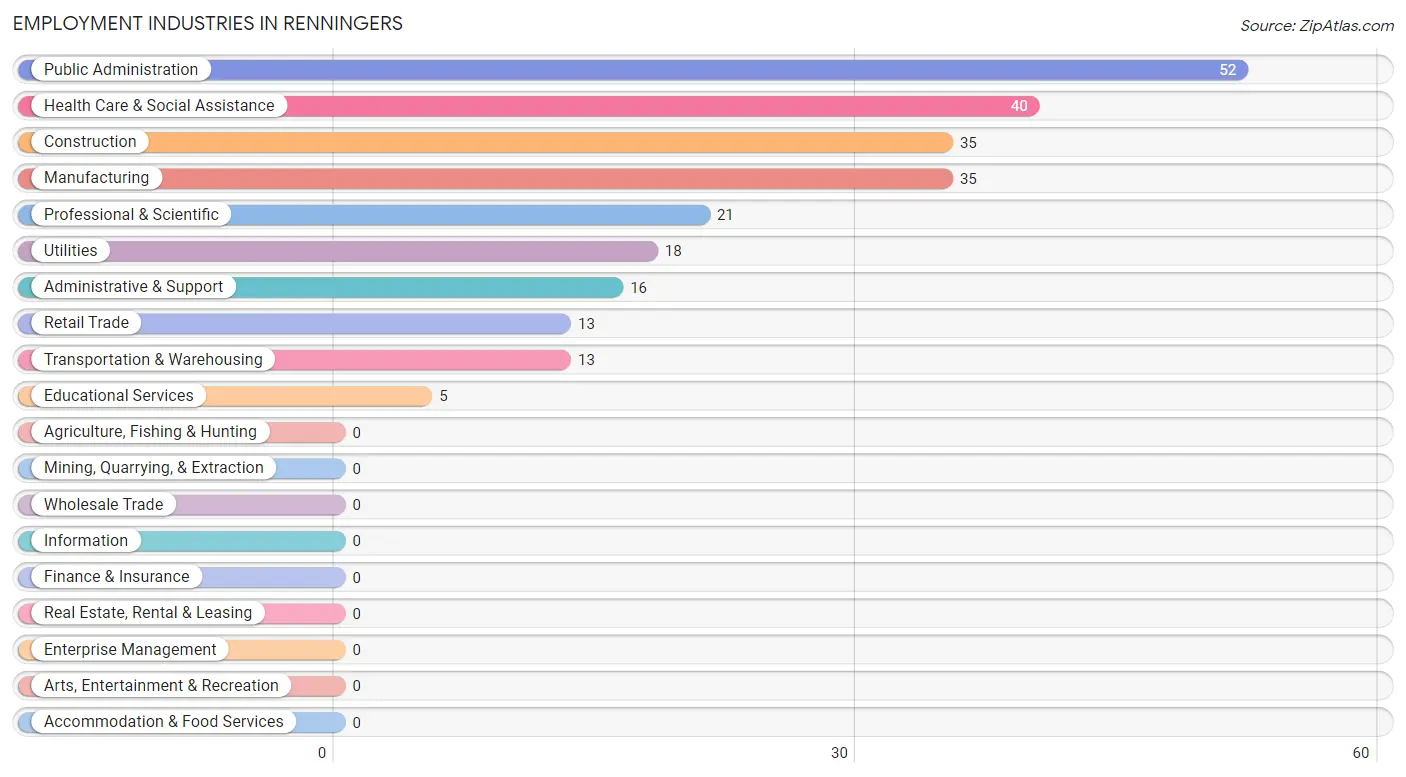
Employment Industries in Renningers
The major employment industries in Renningers include Public Administration (52 | 21.0%), Health Care & Social Assistance (40 | 16.1%), Construction (35 | 14.1%), Manufacturing (35 | 14.1%), and Professional & Scientific (21 | 8.5%).
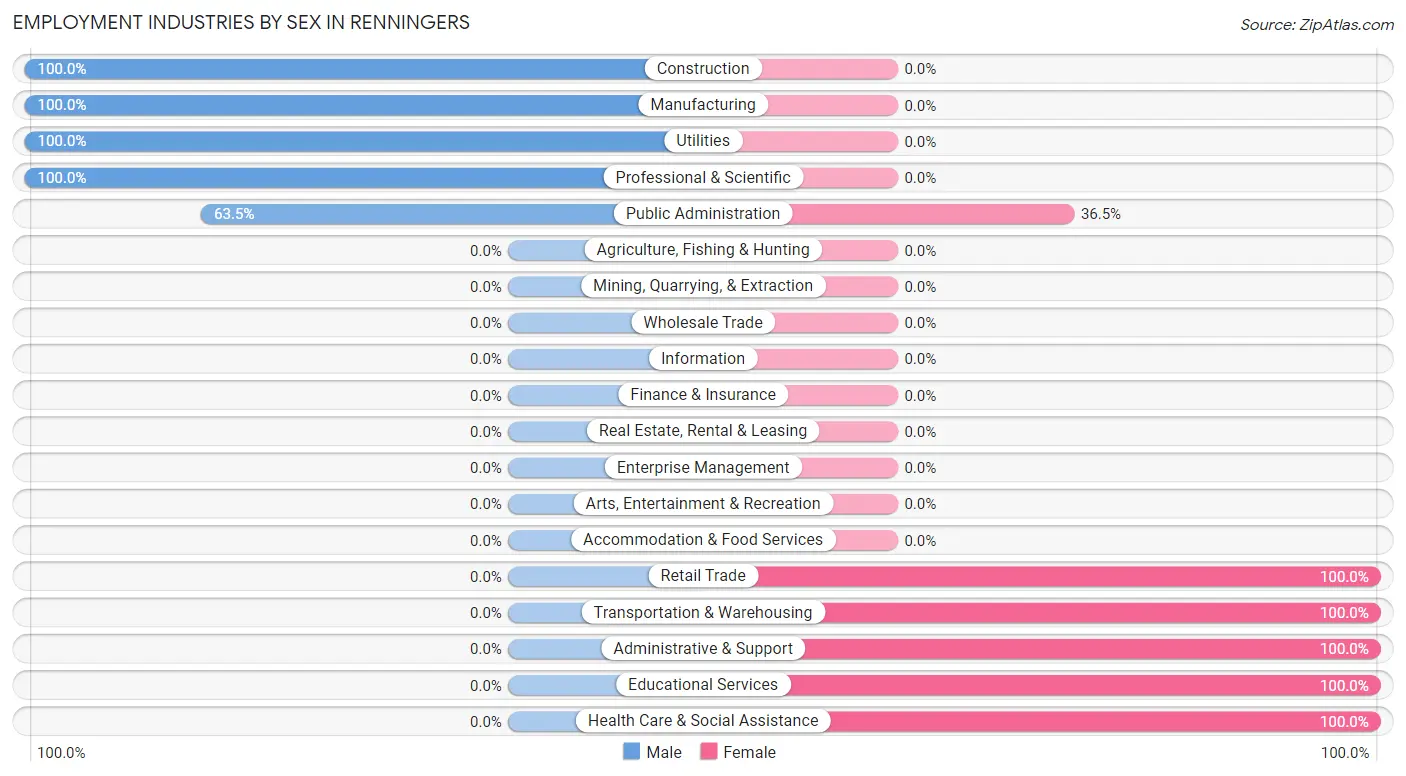
Employment Industries by Sex in Renningers
The Renningers industries that see more men than women are Construction (100.0%), Manufacturing (100.0%), and Utilities (100.0%), whereas the industries that tend to have a higher number of women are Retail Trade (100.0%), Transportation & Warehousing (100.0%), and Administrative & Support (100.0%).
| Industry | Male | Female |
| Agriculture, Fishing & Hunting | 0 (0.0%) | 0 (0.0%) |
| Mining, Quarrying, & Extraction | 0 (0.0%) | 0 (0.0%) |
| Construction | 35 (100.0%) | 0 (0.0%) |
| Manufacturing | 35 (100.0%) | 0 (0.0%) |
| Wholesale Trade | 0 (0.0%) | 0 (0.0%) |
| Retail Trade | 0 (0.0%) | 13 (100.0%) |
| Transportation & Warehousing | 0 (0.0%) | 13 (100.0%) |
| Utilities | 18 (100.0%) | 0 (0.0%) |
| Information | 0 (0.0%) | 0 (0.0%) |
| Finance & Insurance | 0 (0.0%) | 0 (0.0%) |
| Real Estate, Rental & Leasing | 0 (0.0%) | 0 (0.0%) |
| Professional & Scientific | 21 (100.0%) | 0 (0.0%) |
| Enterprise Management | 0 (0.0%) | 0 (0.0%) |
| Administrative & Support | 0 (0.0%) | 16 (100.0%) |
| Educational Services | 0 (0.0%) | 5 (100.0%) |
| Health Care & Social Assistance | 0 (0.0%) | 40 (100.0%) |
| Arts, Entertainment & Recreation | 0 (0.0%) | 0 (0.0%) |
| Accommodation & Food Services | 0 (0.0%) | 0 (0.0%) |
| Public Administration | 33 (63.5%) | 19 (36.5%) |
| Total | 142 (57.3%) | 106 (42.7%) |
Education in Renningers
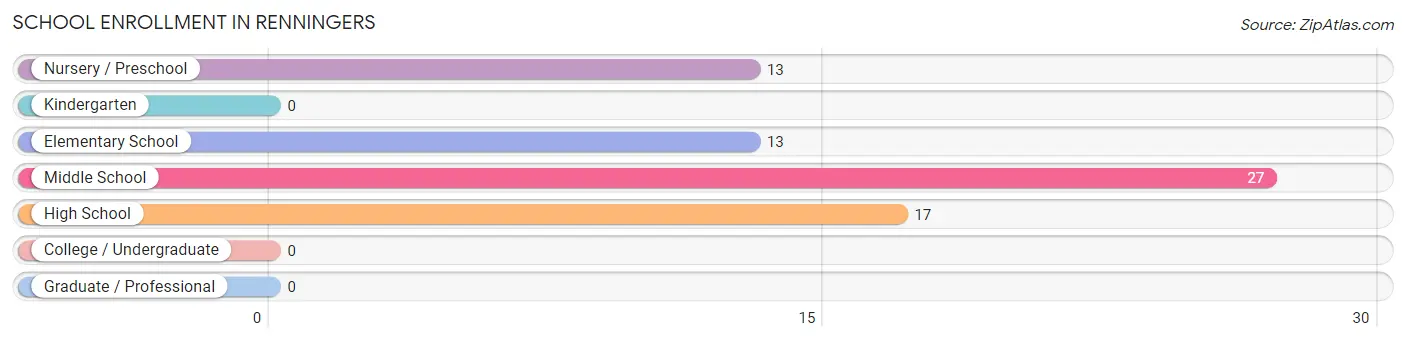
School Enrollment in Renningers
The most common levels of schooling among the 70 students in Renningers are middle school (27 | 38.6%), high school (17 | 24.3%), and nursery / preschool (13 | 18.6%).
| School Level | # Students | % Students |
| Nursery / Preschool | 13 | 18.6% |
| Kindergarten | 0 | 0.0% |
| Elementary School | 13 | 18.6% |
| Middle School | 27 | 38.6% |
| High School | 17 | 24.3% |
| College / Undergraduate | 0 | 0.0% |
| Graduate / Professional | 0 | 0.0% |
| Total | 70 | 100.0% |
School Enrollment by Age by Funding Source in Renningers
Out of a total of 70 students who are enrolled in schools in Renningers, 13 (18.6%) attend a private institution, while the remaining 57 (81.4%) are enrolled in public schools. The age group of 5 to 9 year old has the highest likelihood of being enrolled in private schools, with 13 (100.0% in the age bracket) enrolled. Conversely, the age group of 3 to 4 year olds has the lowest likelihood of being enrolled in a private school, with 13 (100.0% in the age bracket) attending a public institution.
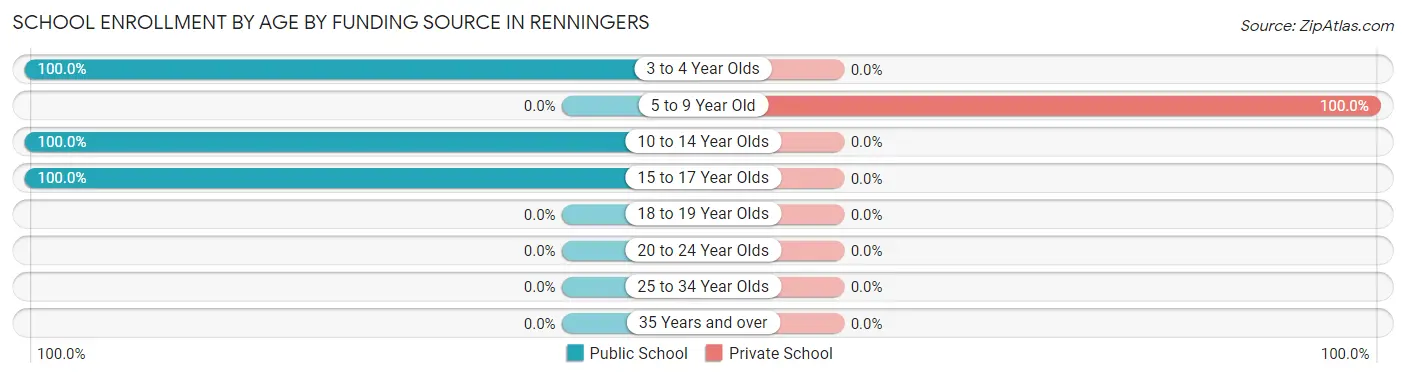
| Age Bracket | Public School | Private School |
| 3 to 4 Year Olds | 13 (100.0%) | 0 (0.0%) |
| 5 to 9 Year Old | 0 (0.0%) | 13 (100.0%) |
| 10 to 14 Year Olds | 27 (100.0%) | 0 (0.0%) |
| 15 to 17 Year Olds | 17 (100.0%) | 0 (0.0%) |
| 18 to 19 Year Olds | 0 (0.0%) | 0 (0.0%) |
| 20 to 24 Year Olds | 0 (0.0%) | 0 (0.0%) |
| 25 to 34 Year Olds | 0 (0.0%) | 0 (0.0%) |
| 35 Years and over | 0 (0.0%) | 0 (0.0%) |
| Total | 57 (81.4%) | 13 (18.6%) |
Educational Attainment by Field of Study in Renningers
Arts & humanities (49 | 39.8%), science & technology (21 | 17.1%), education (21 | 17.1%), psychology (19 | 15.4%), and literature & languages (13 | 10.6%) are the most common fields of study among 123 individuals in Renningers who have obtained a bachelor's degree or higher.
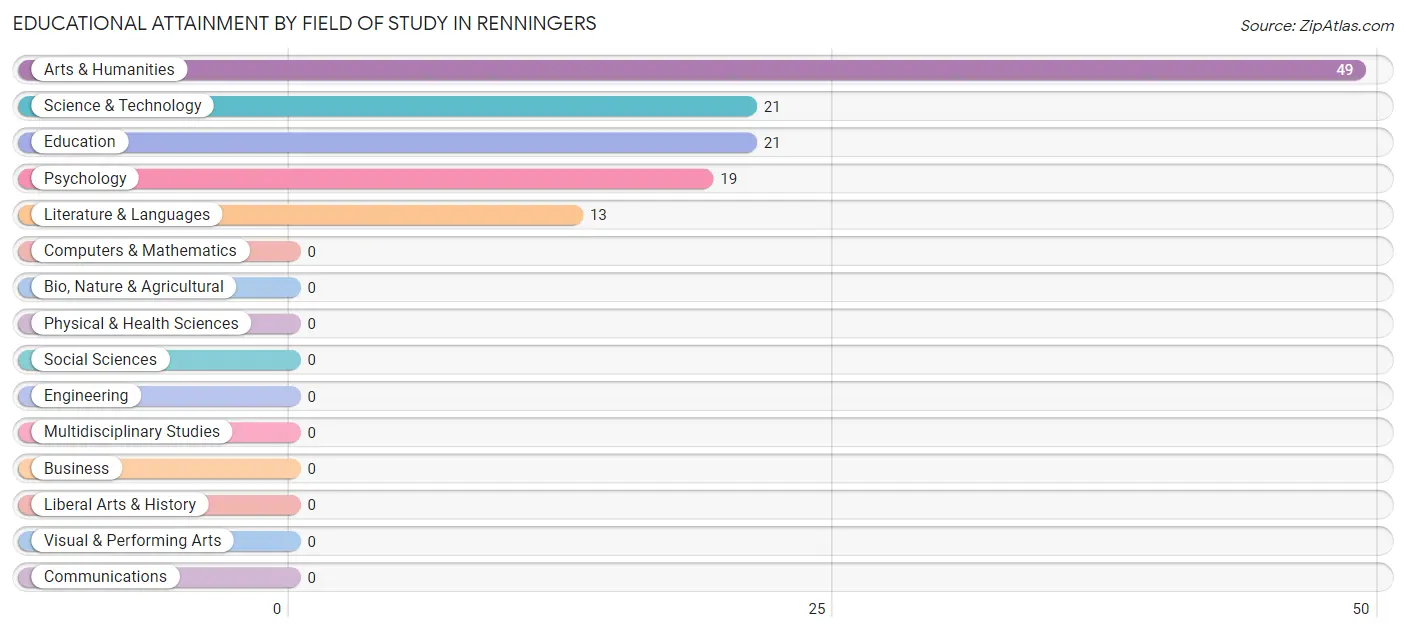
| Field of Study | # Graduates | % Graduates |
| Computers & Mathematics | 0 | 0.0% |
| Bio, Nature & Agricultural | 0 | 0.0% |
| Physical & Health Sciences | 0 | 0.0% |
| Psychology | 19 | 15.4% |
| Social Sciences | 0 | 0.0% |
| Engineering | 0 | 0.0% |
| Multidisciplinary Studies | 0 | 0.0% |
| Science & Technology | 21 | 17.1% |
| Business | 0 | 0.0% |
| Education | 21 | 17.1% |
| Literature & Languages | 13 | 10.6% |
| Liberal Arts & History | 0 | 0.0% |
| Visual & Performing Arts | 0 | 0.0% |
| Communications | 0 | 0.0% |
| Arts & Humanities | 49 | 39.8% |
| Total | 123 | 100.0% |
Transportation & Commute in Renningers
Vehicle Availability by Sex in Renningers
The most prevalent vehicle ownership categories in Renningers are males with 2 vehicles (61, accounting for 43.0%) and females with 2 vehicles (58, making up 57.6%).
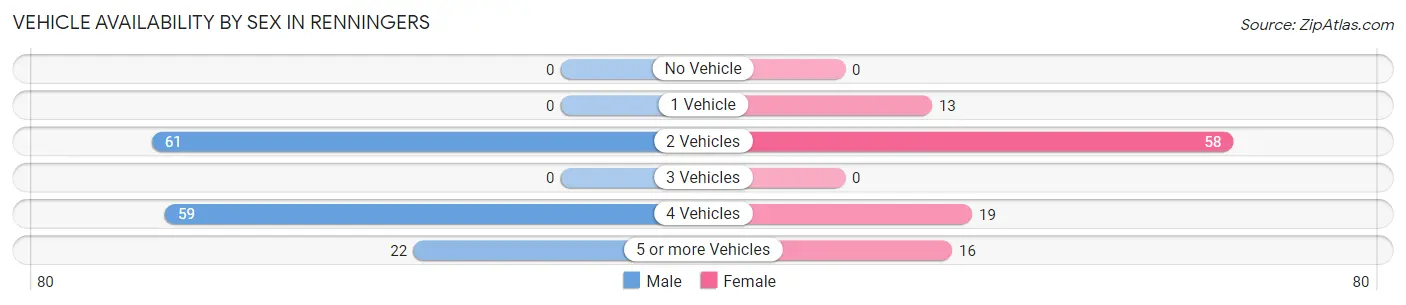
| Vehicles Available | Male | Female |
| No Vehicle | 0 (0.0%) | 0 (0.0%) |
| 1 Vehicle | 0 (0.0%) | 13 (12.3%) |
| 2 Vehicles | 61 (43.0%) | 58 (54.7%) |
| 3 Vehicles | 0 (0.0%) | 0 (0.0%) |
| 4 Vehicles | 59 (41.5%) | 19 (17.9%) |
| 5 or more Vehicles | 22 (15.5%) | 16 (15.1%) |
| Total | 142 (100.0%) | 106 (100.0%) |
Commute Time in Renningers
The most frequently occuring commute durations in Renningers are 10 to 14 minutes (70 commuters, 28.2%), 30 to 34 minutes (43 commuters, 17.3%), and 60 to 89 minutes (39 commuters, 15.7%).
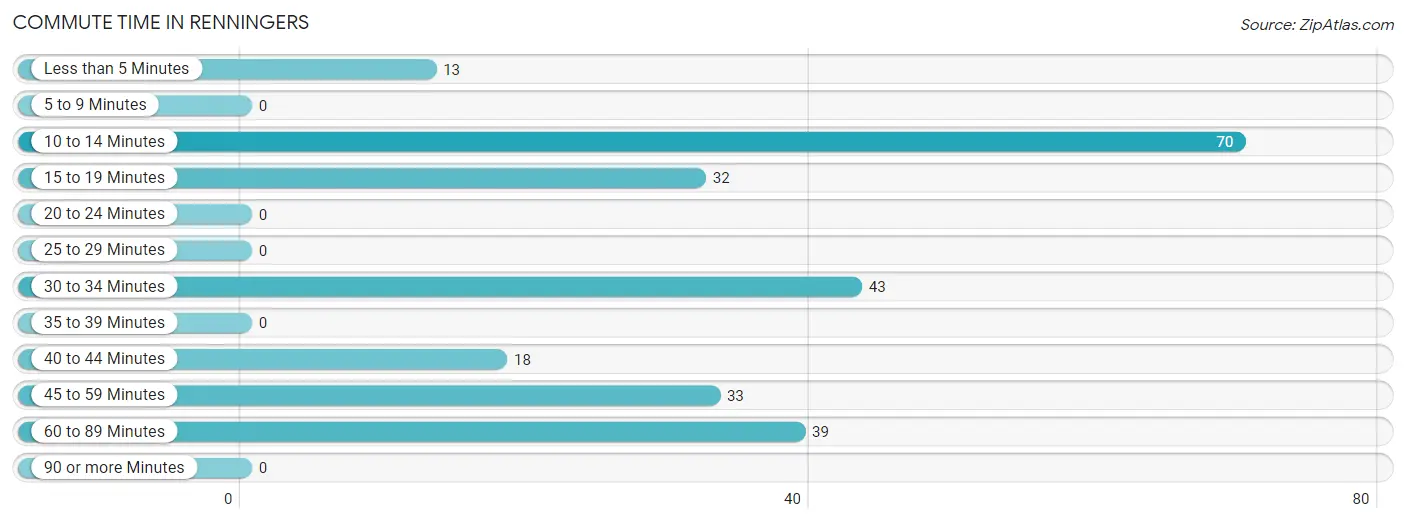
| Commute Time | # Commuters | % Commuters |
| Less than 5 Minutes | 13 | 5.2% |
| 5 to 9 Minutes | 0 | 0.0% |
| 10 to 14 Minutes | 70 | 28.2% |
| 15 to 19 Minutes | 32 | 12.9% |
| 20 to 24 Minutes | 0 | 0.0% |
| 25 to 29 Minutes | 0 | 0.0% |
| 30 to 34 Minutes | 43 | 17.3% |
| 35 to 39 Minutes | 0 | 0.0% |
| 40 to 44 Minutes | 18 | 7.3% |
| 45 to 59 Minutes | 33 | 13.3% |
| 60 to 89 Minutes | 39 | 15.7% |
| 90 or more Minutes | 0 | 0.0% |
Commute Time by Sex in Renningers
The most common commute times in Renningers are 60 to 89 minutes (39 commuters, 27.5%) for males and 10 to 14 minutes (32 commuters, 30.2%) for females.
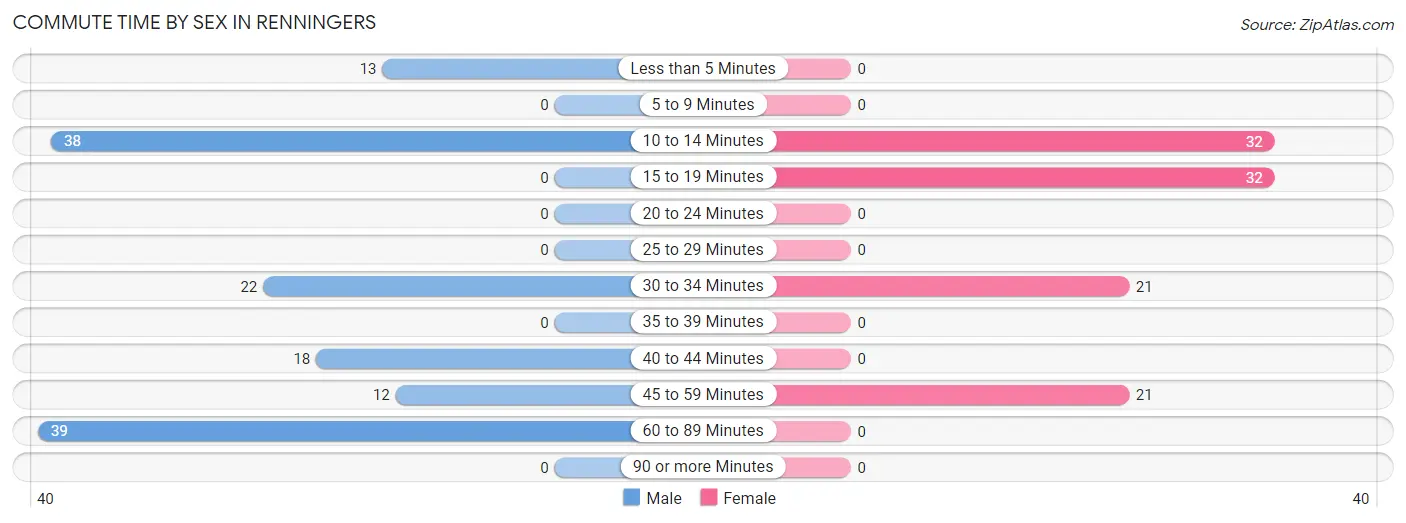
| Commute Time | Male | Female |
| Less than 5 Minutes | 13 (9.1%) | 0 (0.0%) |
| 5 to 9 Minutes | 0 (0.0%) | 0 (0.0%) |
| 10 to 14 Minutes | 38 (26.8%) | 32 (30.2%) |
| 15 to 19 Minutes | 0 (0.0%) | 32 (30.2%) |
| 20 to 24 Minutes | 0 (0.0%) | 0 (0.0%) |
| 25 to 29 Minutes | 0 (0.0%) | 0 (0.0%) |
| 30 to 34 Minutes | 22 (15.5%) | 21 (19.8%) |
| 35 to 39 Minutes | 0 (0.0%) | 0 (0.0%) |
| 40 to 44 Minutes | 18 (12.7%) | 0 (0.0%) |
| 45 to 59 Minutes | 12 (8.5%) | 21 (19.8%) |
| 60 to 89 Minutes | 39 (27.5%) | 0 (0.0%) |
| 90 or more Minutes | 0 (0.0%) | 0 (0.0%) |
Time of Departure to Work by Sex in Renningers
The most frequent times of departure to work in Renningers are 5:30 AM to 5:59 AM (63, 44.4%) for males and 8:30 AM to 8:59 AM (42, 39.6%) for females.
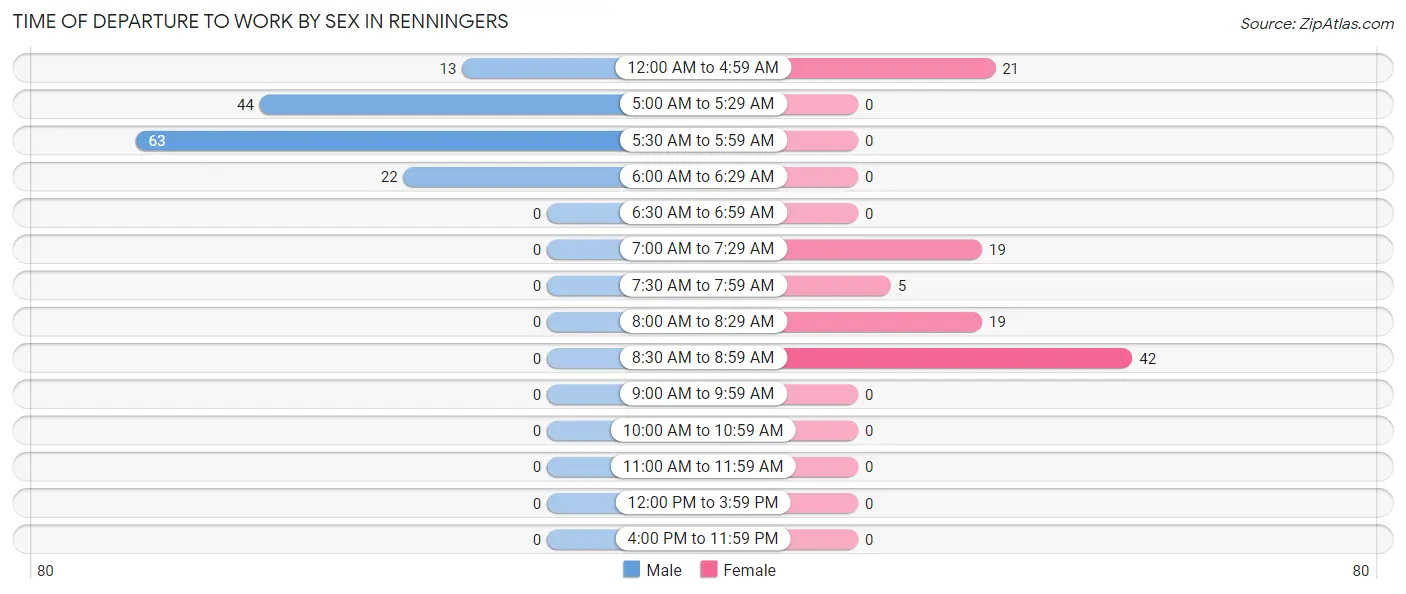
| Time of Departure | Male | Female |
| 12:00 AM to 4:59 AM | 13 (9.1%) | 21 (19.8%) |
| 5:00 AM to 5:29 AM | 44 (31.0%) | 0 (0.0%) |
| 5:30 AM to 5:59 AM | 63 (44.4%) | 0 (0.0%) |
| 6:00 AM to 6:29 AM | 22 (15.5%) | 0 (0.0%) |
| 6:30 AM to 6:59 AM | 0 (0.0%) | 0 (0.0%) |
| 7:00 AM to 7:29 AM | 0 (0.0%) | 19 (17.9%) |
| 7:30 AM to 7:59 AM | 0 (0.0%) | 5 (4.7%) |
| 8:00 AM to 8:29 AM | 0 (0.0%) | 19 (17.9%) |
| 8:30 AM to 8:59 AM | 0 (0.0%) | 42 (39.6%) |
| 9:00 AM to 9:59 AM | 0 (0.0%) | 0 (0.0%) |
| 10:00 AM to 10:59 AM | 0 (0.0%) | 0 (0.0%) |
| 11:00 AM to 11:59 AM | 0 (0.0%) | 0 (0.0%) |
| 12:00 PM to 3:59 PM | 0 (0.0%) | 0 (0.0%) |
| 4:00 PM to 11:59 PM | 0 (0.0%) | 0 (0.0%) |
| Total | 142 (100.0%) | 106 (100.0%) |
Housing Occupancy in Renningers
Occupancy by Ownership in Renningers
Of the total 166 dwellings in Renningers, owner-occupied units account for 166 (100.0%), while renter-occupied units make up 0 (0.0%).
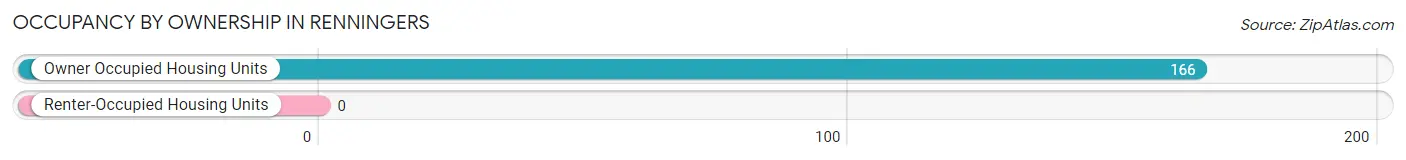
| Occupancy | # Housing Units | % Housing Units |
| Owner Occupied Housing Units | 166 | 100.0% |
| Renter-Occupied Housing Units | 0 | 0.0% |
| Total Occupied Housing Units | 166 | 100.0% |
Occupancy by Household Size in Renningers
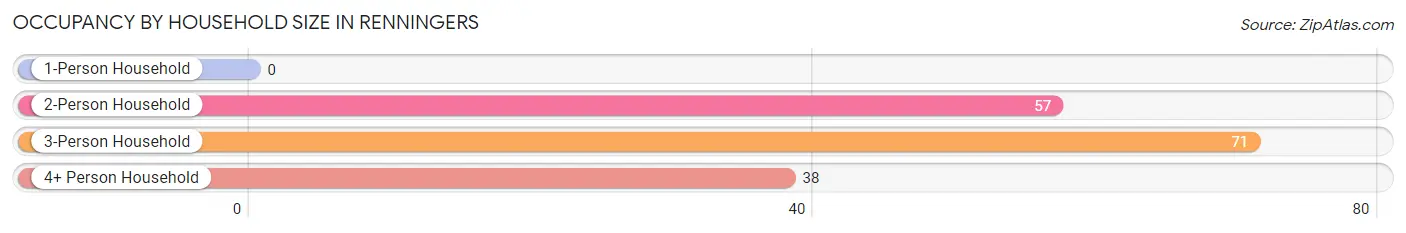
| Household Size | # Housing Units | % Housing Units |
| 1-Person Household | 0 | 0.0% |
| 2-Person Household | 57 | 34.3% |
| 3-Person Household | 71 | 42.8% |
| 4+ Person Household | 38 | 22.9% |
| Total Housing Units | 166 | 100.0% |
Occupancy by Ownership by Household Size in Renningers
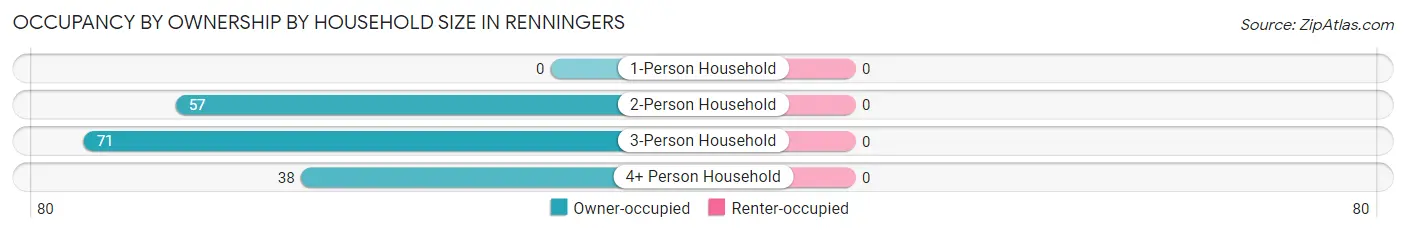
| Household Size | Owner-occupied | Renter-occupied |
| 1-Person Household | 0 (0.0%) | 0 (0.0%) |
| 2-Person Household | 57 (100.0%) | 0 (0.0%) |
| 3-Person Household | 71 (100.0%) | 0 (0.0%) |
| 4+ Person Household | 38 (100.0%) | 0 (0.0%) |
| Total Housing Units | 166 (100.0%) | 0 (0.0%) |
Occupancy by Educational Attainment in Renningers
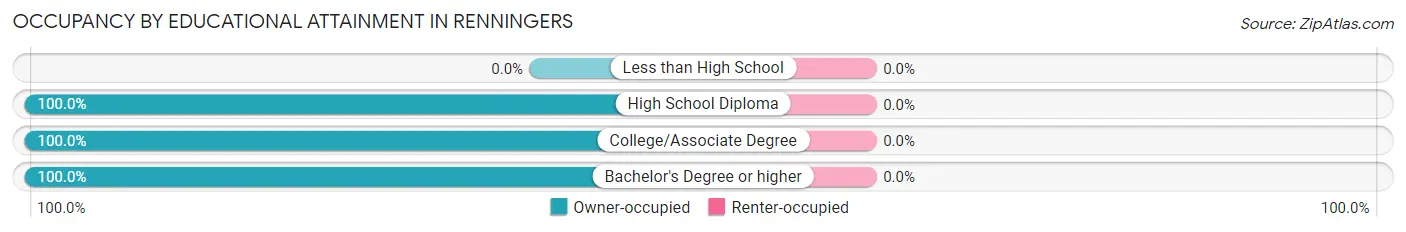
| Household Size | Owner-occupied | Renter-occupied |
| Less than High School | 0 (0.0%) | 0 (0.0%) |
| High School Diploma | 59 (100.0%) | 0 (0.0%) |
| College/Associate Degree | 52 (100.0%) | 0 (0.0%) |
| Bachelor's Degree or higher | 55 (100.0%) | 0 (0.0%) |
Occupancy by Age of Householder in Renningers
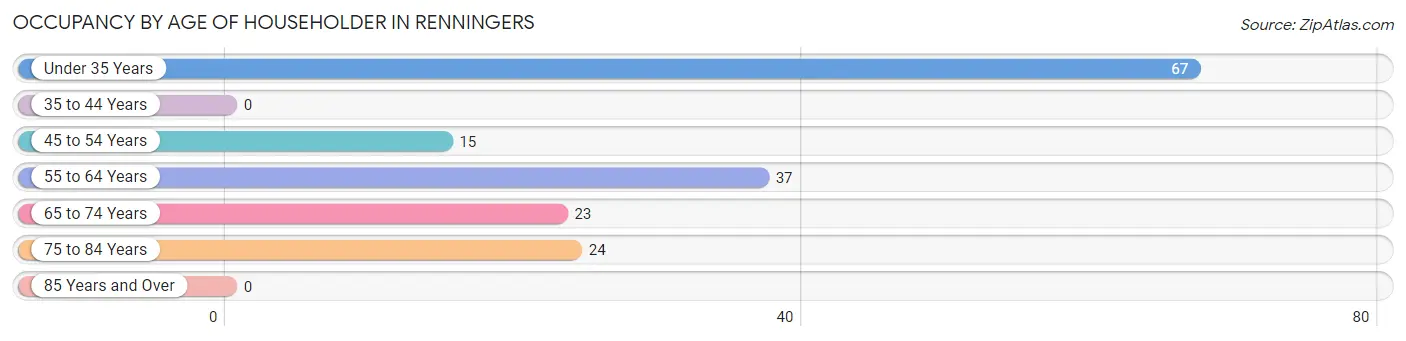
| Age Bracket | # Households | % Households |
| Under 35 Years | 67 | 40.4% |
| 35 to 44 Years | 0 | 0.0% |
| 45 to 54 Years | 15 | 9.0% |
| 55 to 64 Years | 37 | 22.3% |
| 65 to 74 Years | 23 | 13.9% |
| 75 to 84 Years | 24 | 14.5% |
| 85 Years and Over | 0 | 0.0% |
| Total | 166 | 100.0% |
Housing Finances in Renningers
Median Income by Occupancy in Renningers
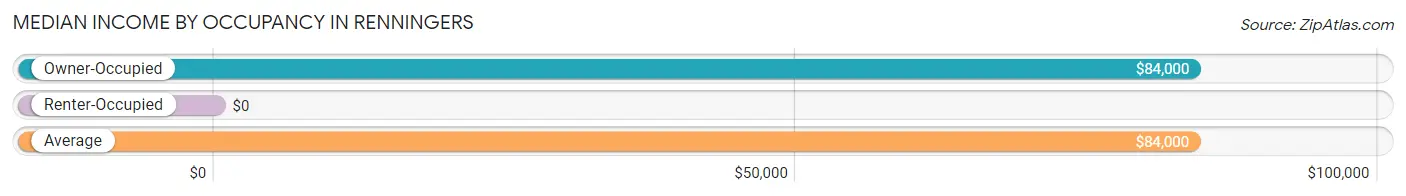
| Occupancy Type | # Households | Median Income |
| Owner-Occupied | 166 (100.0%) | $84,000 |
| Renter-Occupied | 0 (0.0%) | $0 |
| Average | 166 (100.0%) | $84,000 |
Occupancy by Householder Income Bracket in Renningers
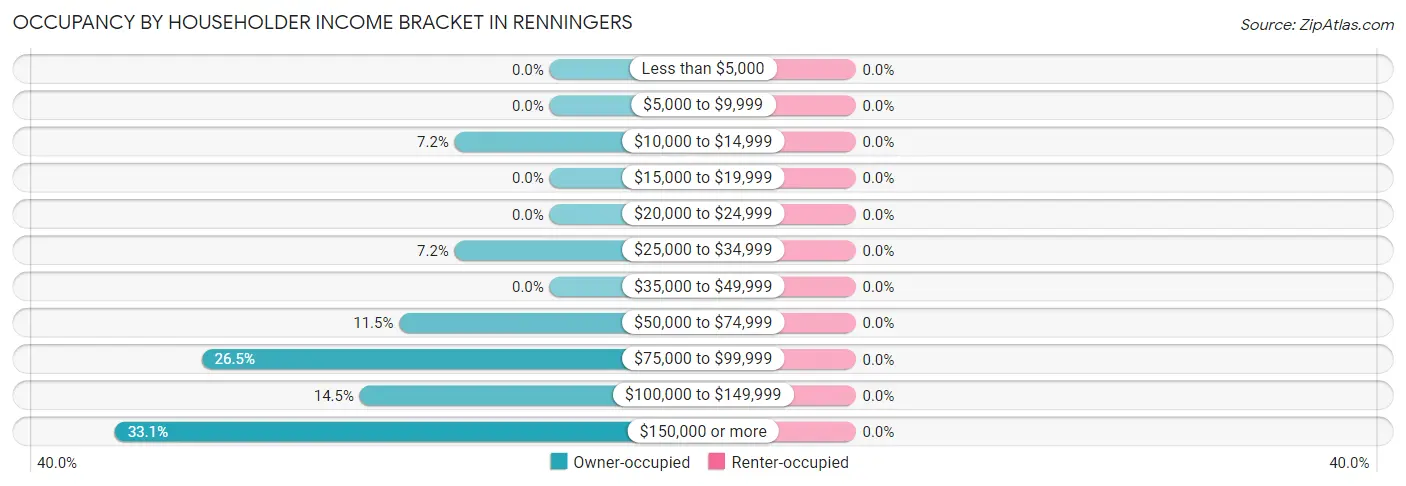
| Income Bracket | Owner-occupied | Renter-occupied |
| Less than $5,000 | 0 (0.0%) | 0 (0.0%) |
| $5,000 to $9,999 | 0 (0.0%) | 0 (0.0%) |
| $10,000 to $14,999 | 12 (7.2%) | 0 (0.0%) |
| $15,000 to $19,999 | 0 (0.0%) | 0 (0.0%) |
| $20,000 to $24,999 | 0 (0.0%) | 0 (0.0%) |
| $25,000 to $34,999 | 12 (7.2%) | 0 (0.0%) |
| $35,000 to $49,999 | 0 (0.0%) | 0 (0.0%) |
| $50,000 to $74,999 | 19 (11.5%) | 0 (0.0%) |
| $75,000 to $99,999 | 44 (26.5%) | 0 (0.0%) |
| $100,000 to $149,999 | 24 (14.5%) | 0 (0.0%) |
| $150,000 or more | 55 (33.1%) | 0 (0.0%) |
| Total | 166 (100.0%) | 0 (0.0%) |
Monthly Housing Cost Tiers in Renningers
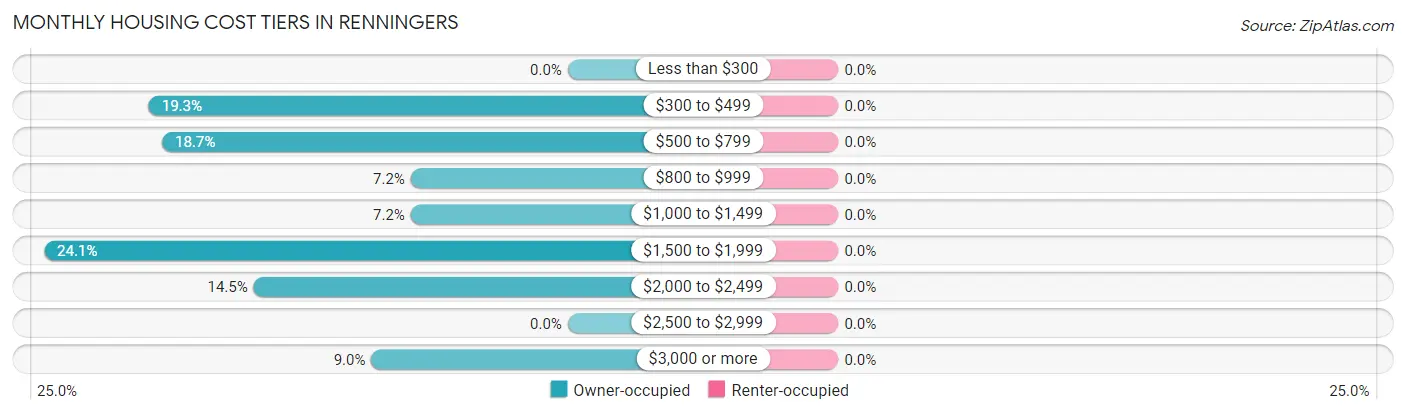
| Monthly Cost | Owner-occupied | Renter-occupied |
| Less than $300 | 0 (0.0%) | 0 (0.0%) |
| $300 to $499 | 32 (19.3%) | 0 (0.0%) |
| $500 to $799 | 31 (18.7%) | 0 (0.0%) |
| $800 to $999 | 12 (7.2%) | 0 (0.0%) |
| $1,000 to $1,499 | 12 (7.2%) | 0 (0.0%) |
| $1,500 to $1,999 | 40 (24.1%) | 0 (0.0%) |
| $2,000 to $2,499 | 24 (14.5%) | 0 (0.0%) |
| $2,500 to $2,999 | 0 (0.0%) | 0 (0.0%) |
| $3,000 or more | 15 (9.0%) | 0 (0.0%) |
| Total | 166 (100.0%) | 0 (0.0%) |
Physical Housing Characteristics in Renningers
Housing Structures in Renningers
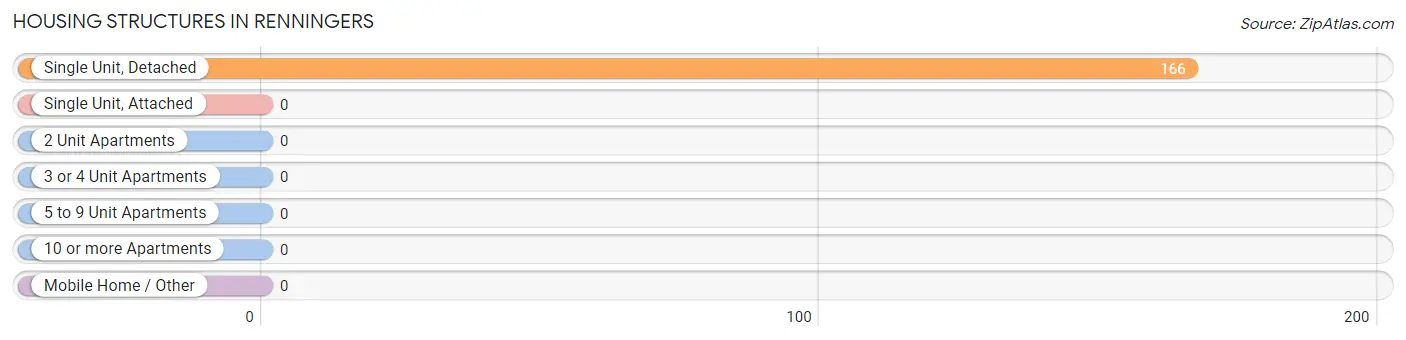
| Structure Type | # Housing Units | % Housing Units |
| Single Unit, Detached | 166 | 100.0% |
| Single Unit, Attached | 0 | 0.0% |
| 2 Unit Apartments | 0 | 0.0% |
| 3 or 4 Unit Apartments | 0 | 0.0% |
| 5 to 9 Unit Apartments | 0 | 0.0% |
| 10 or more Apartments | 0 | 0.0% |
| Mobile Home / Other | 0 | 0.0% |
| Total | 166 | 100.0% |
Housing Structures by Occupancy in Renningers
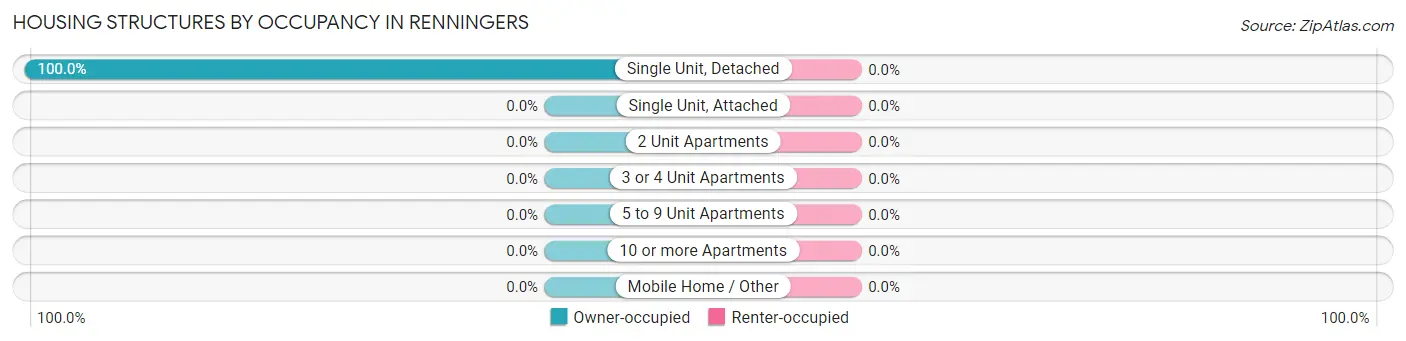
| Structure Type | Owner-occupied | Renter-occupied |
| Single Unit, Detached | 166 (100.0%) | 0 (0.0%) |
| Single Unit, Attached | 0 (0.0%) | 0 (0.0%) |
| 2 Unit Apartments | 0 (0.0%) | 0 (0.0%) |
| 3 or 4 Unit Apartments | 0 (0.0%) | 0 (0.0%) |
| 5 to 9 Unit Apartments | 0 (0.0%) | 0 (0.0%) |
| 10 or more Apartments | 0 (0.0%) | 0 (0.0%) |
| Mobile Home / Other | 0 (0.0%) | 0 (0.0%) |
| Total | 166 (100.0%) | 0 (0.0%) |
Housing Structures by Number of Rooms in Renningers
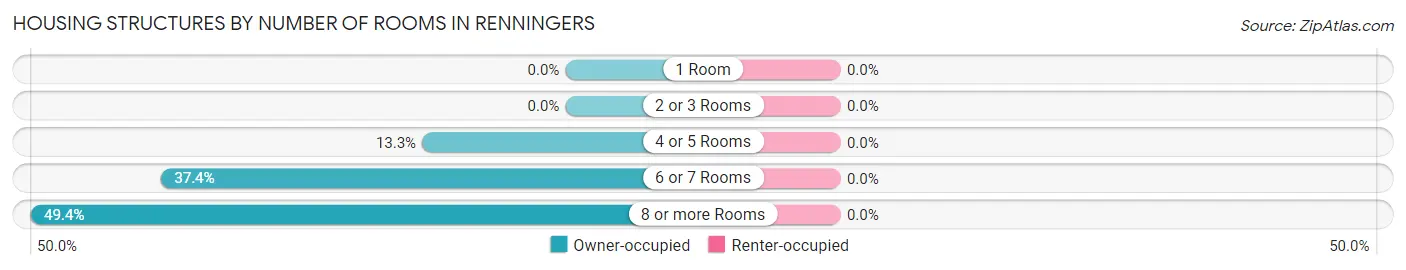
| Number of Rooms | Owner-occupied | Renter-occupied |
| 1 Room | 0 (0.0%) | 0 (0.0%) |
| 2 or 3 Rooms | 0 (0.0%) | 0 (0.0%) |
| 4 or 5 Rooms | 22 (13.3%) | 0 (0.0%) |
| 6 or 7 Rooms | 62 (37.3%) | 0 (0.0%) |
| 8 or more Rooms | 82 (49.4%) | 0 (0.0%) |
| Total | 166 (100.0%) | 0 (0.0%) |
Housing Structure by Heating Type in Renningers
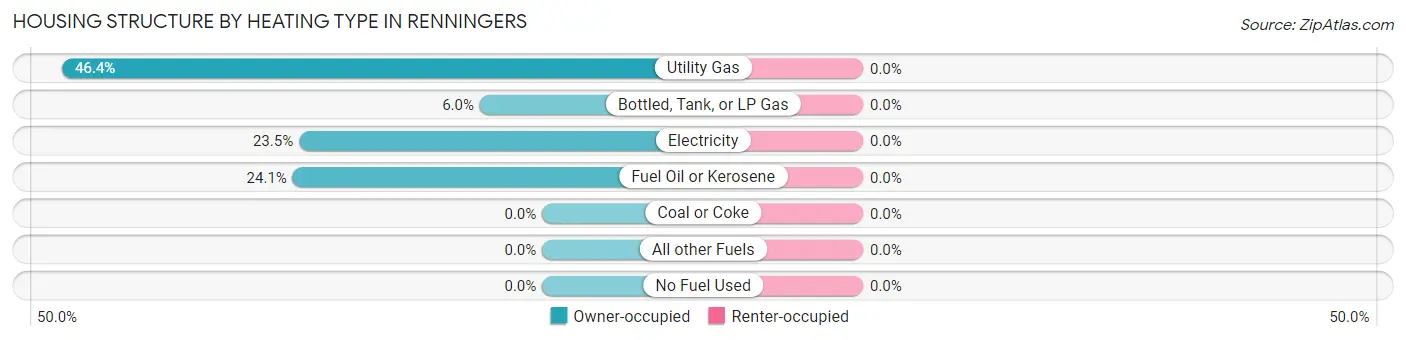
| Heating Type | Owner-occupied | Renter-occupied |
| Utility Gas | 77 (46.4%) | 0 (0.0%) |
| Bottled, Tank, or LP Gas | 10 (6.0%) | 0 (0.0%) |
| Electricity | 39 (23.5%) | 0 (0.0%) |
| Fuel Oil or Kerosene | 40 (24.1%) | 0 (0.0%) |
| Coal or Coke | 0 (0.0%) | 0 (0.0%) |
| All other Fuels | 0 (0.0%) | 0 (0.0%) |
| No Fuel Used | 0 (0.0%) | 0 (0.0%) |
| Total | 166 (100.0%) | 0 (0.0%) |
Household Vehicle Usage in Renningers
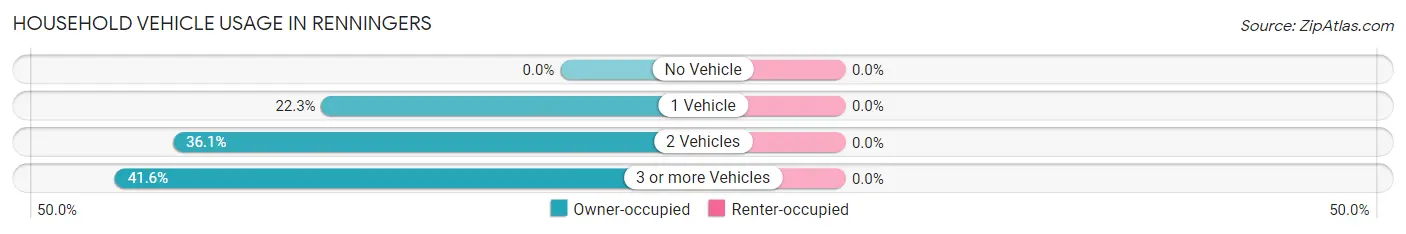
| Vehicles per Household | Owner-occupied | Renter-occupied |
| No Vehicle | 0 (0.0%) | 0 (0.0%) |
| 1 Vehicle | 37 (22.3%) | 0 (0.0%) |
| 2 Vehicles | 60 (36.1%) | 0 (0.0%) |
| 3 or more Vehicles | 69 (41.6%) | 0 (0.0%) |
| Total | 166 (100.0%) | 0 (0.0%) |
Real Estate & Mortgages in Renningers
Real Estate and Mortgage Overview in Renningers
| Characteristic | Without Mortgage | With Mortgage |
| Housing Units | 75 | 91 |
| Median Property Value | $132,300 | $277,900 |
| Median Household Income | $66,442 | $55 |
| Monthly Housing Costs | $592 | $15 |
| Real Estate Taxes | $2,306 | $0 |
Property Value by Mortgage Status in Renningers
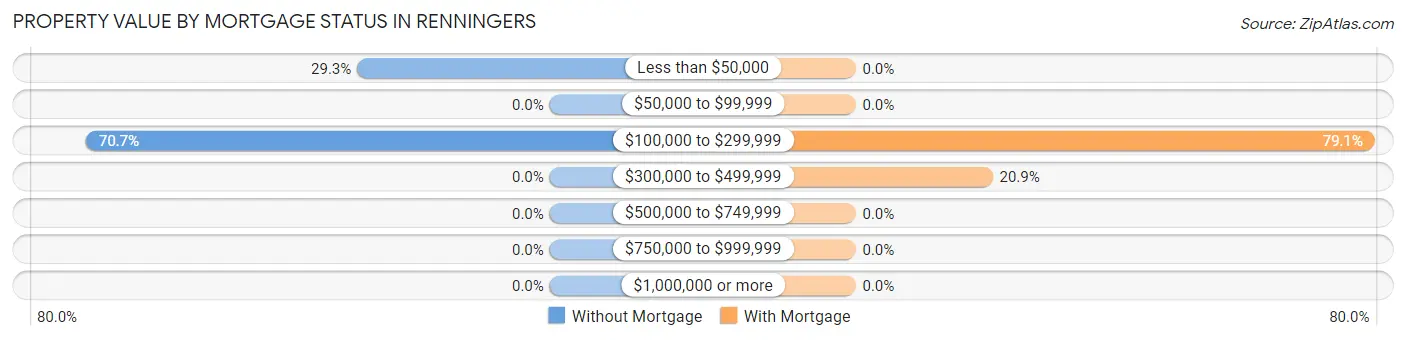
| Property Value | Without Mortgage | With Mortgage |
| Less than $50,000 | 22 (29.3%) | 0 (0.0%) |
| $50,000 to $99,999 | 0 (0.0%) | 0 (0.0%) |
| $100,000 to $299,999 | 53 (70.7%) | 72 (79.1%) |
| $300,000 to $499,999 | 0 (0.0%) | 19 (20.9%) |
| $500,000 to $749,999 | 0 (0.0%) | 0 (0.0%) |
| $750,000 to $999,999 | 0 (0.0%) | 0 (0.0%) |
| $1,000,000 or more | 0 (0.0%) | 0 (0.0%) |
| Total | 75 (100.0%) | 91 (100.0%) |
Household Income by Mortgage Status in Renningers
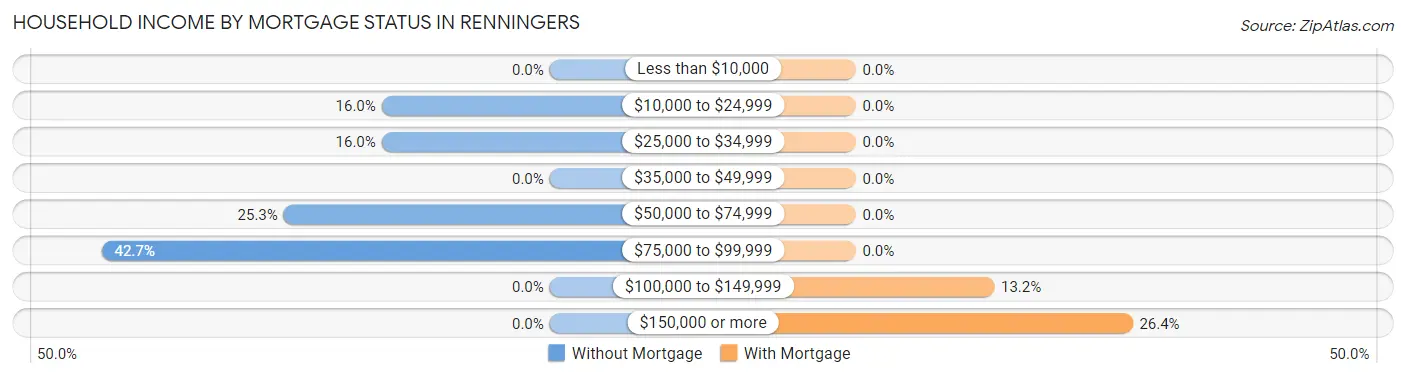
| Household Income | Without Mortgage | With Mortgage |
| Less than $10,000 | 0 (0.0%) | 0 (0.0%) |
| $10,000 to $24,999 | 12 (16.0%) | 0 (0.0%) |
| $25,000 to $34,999 | 12 (16.0%) | 0 (0.0%) |
| $35,000 to $49,999 | 0 (0.0%) | 0 (0.0%) |
| $50,000 to $74,999 | 19 (25.3%) | 0 (0.0%) |
| $75,000 to $99,999 | 32 (42.7%) | 0 (0.0%) |
| $100,000 to $149,999 | 0 (0.0%) | 12 (13.2%) |
| $150,000 or more | 0 (0.0%) | 24 (26.4%) |
| Total | 75 (100.0%) | 91 (100.0%) |
Property Value to Household Income Ratio in Renningers
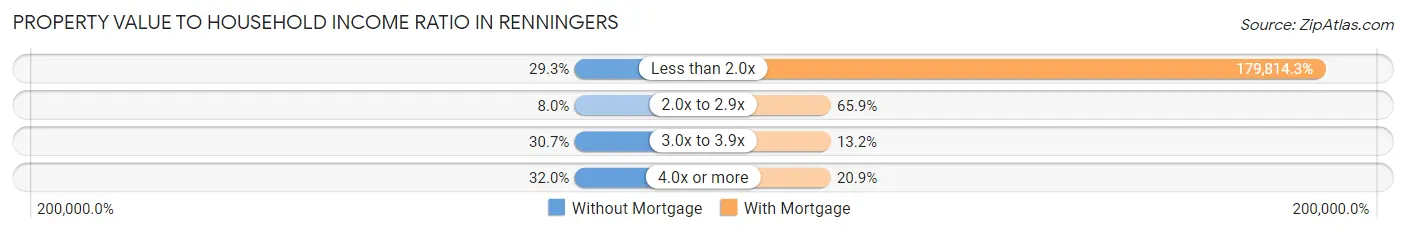
| Value-to-Income Ratio | Without Mortgage | With Mortgage |
| Less than 2.0x | 22 (29.3%) | 163,631 (179,814.3%) |
| 2.0x to 2.9x | 6 (8.0%) | 60 (65.9%) |
| 3.0x to 3.9x | 23 (30.7%) | 12 (13.2%) |
| 4.0x or more | 24 (32.0%) | 19 (20.9%) |
| Total | 75 (100.0%) | 91 (100.0%) |
Real Estate Taxes by Mortgage Status in Renningers
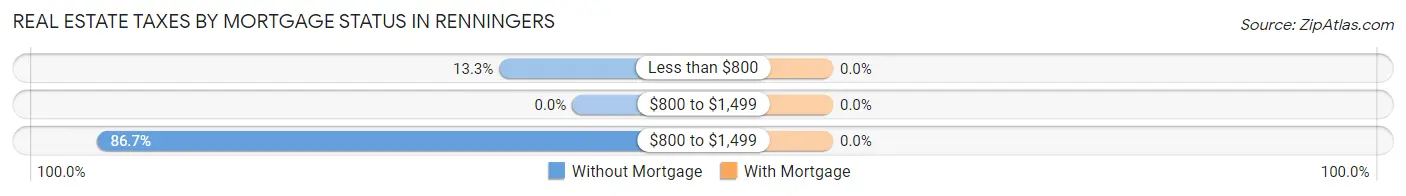
| Property Taxes | Without Mortgage | With Mortgage |
| Less than $800 | 10 (13.3%) | 0 (0.0%) |
| $800 to $1,499 | 0 (0.0%) | 0 (0.0%) |
| $800 to $1,499 | 65 (86.7%) | 0 (0.0%) |
| Total | 75 (100.0%) | 91 (100.0%) |
Health & Disability in Renningers
Health Insurance Coverage by Age in Renningers
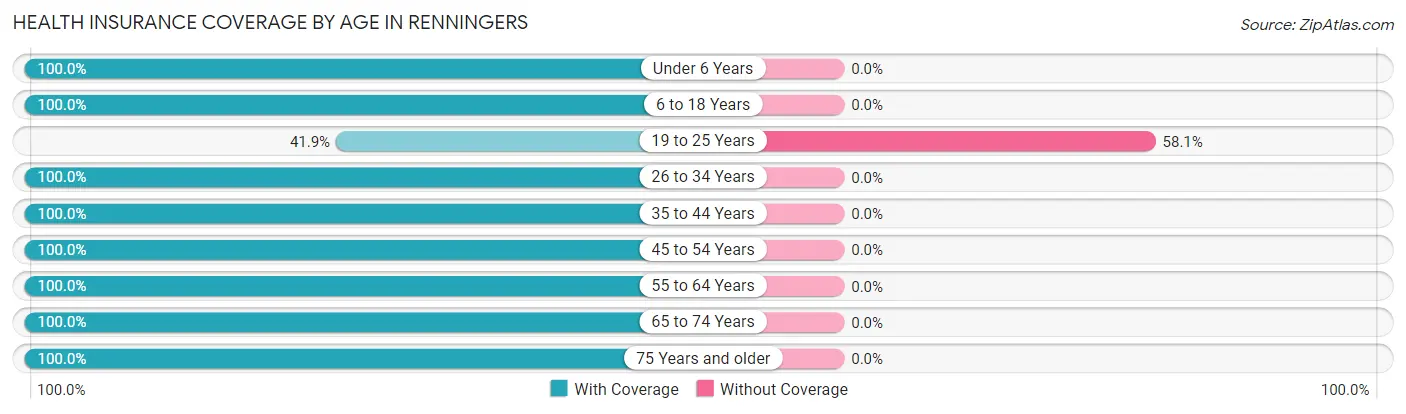
| Age Bracket | With Coverage | Without Coverage |
| Under 6 Years | 121 (100.0%) | 0 (0.0%) |
| 6 to 18 Years | 57 (100.0%) | 0 (0.0%) |
| 19 to 25 Years | 13 (41.9%) | 18 (58.1%) |
| 26 to 34 Years | 129 (100.0%) | 0 (0.0%) |
| 35 to 44 Years | 49 (100.0%) | 0 (0.0%) |
| 45 to 54 Years | 25 (100.0%) | 0 (0.0%) |
| 55 to 64 Years | 55 (100.0%) | 0 (0.0%) |
| 65 to 74 Years | 47 (100.0%) | 0 (0.0%) |
| 75 Years and older | 37 (100.0%) | 0 (0.0%) |
| Total | 533 (96.7%) | 18 (3.3%) |
Health Insurance Coverage by Citizenship Status in Renningers
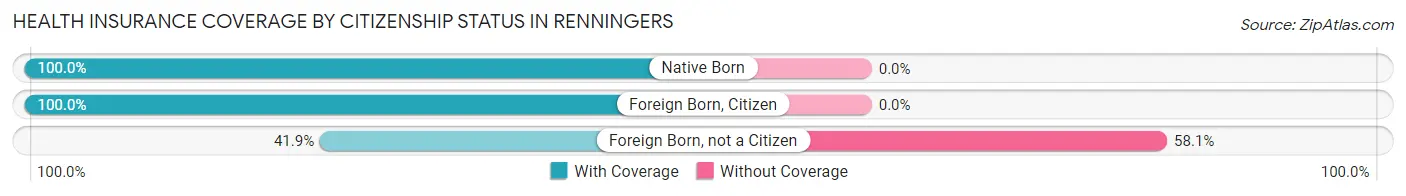
| Citizenship Status | With Coverage | Without Coverage |
| Native Born | 121 (100.0%) | 0 (0.0%) |
| Foreign Born, Citizen | 57 (100.0%) | 0 (0.0%) |
| Foreign Born, not a Citizen | 13 (41.9%) | 18 (58.1%) |
Health Insurance Coverage by Household Income in Renningers
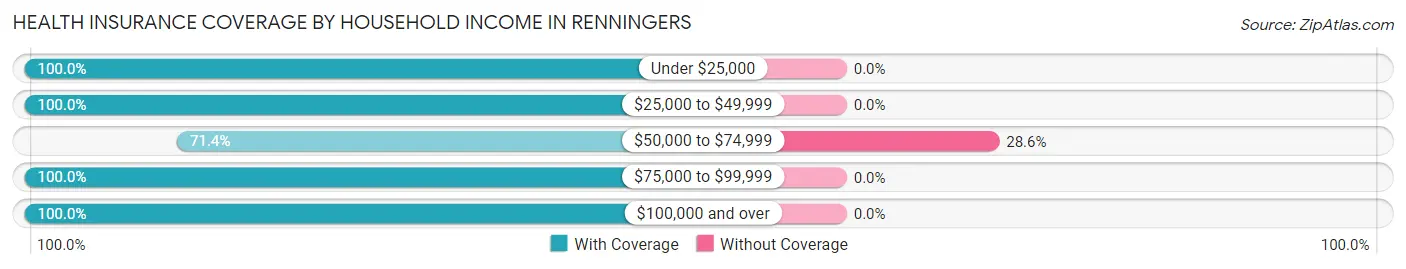
| Household Income | With Coverage | Without Coverage |
| Under $25,000 | 51 (100.0%) | 0 (0.0%) |
| $25,000 to $49,999 | 25 (100.0%) | 0 (0.0%) |
| $50,000 to $74,999 | 45 (71.4%) | 18 (28.6%) |
| $75,000 to $99,999 | 94 (100.0%) | 0 (0.0%) |
| $100,000 and over | 318 (100.0%) | 0 (0.0%) |
Public vs Private Health Insurance Coverage by Age in Renningers
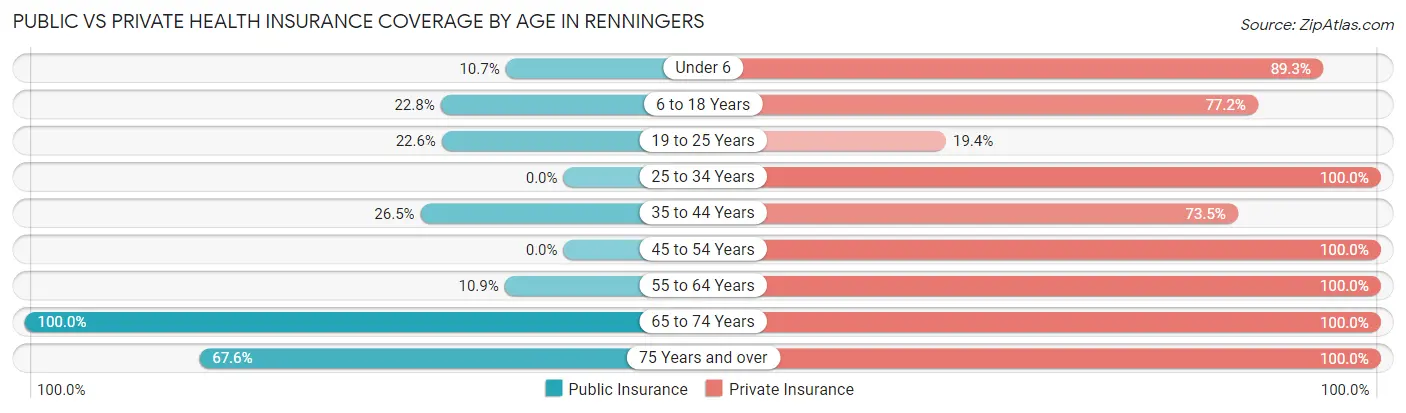
| Age Bracket | Public Insurance | Private Insurance |
| Under 6 | 13 (10.7%) | 108 (89.3%) |
| 6 to 18 Years | 13 (22.8%) | 44 (77.2%) |
| 19 to 25 Years | 7 (22.6%) | 6 (19.4%) |
| 25 to 34 Years | 0 (0.0%) | 129 (100.0%) |
| 35 to 44 Years | 13 (26.5%) | 36 (73.5%) |
| 45 to 54 Years | 0 (0.0%) | 25 (100.0%) |
| 55 to 64 Years | 6 (10.9%) | 55 (100.0%) |
| 65 to 74 Years | 47 (100.0%) | 47 (100.0%) |
| 75 Years and over | 25 (67.6%) | 37 (100.0%) |
| Total | 124 (22.5%) | 487 (88.4%) |
Disability Status by Sex by Age in Renningers
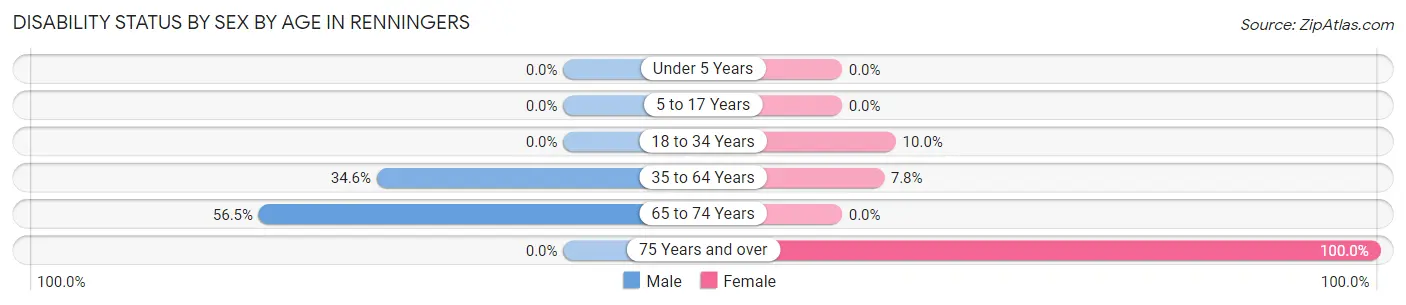
| Age Bracket | Male | Female |
| Under 5 Years | 0 (0.0%) | 0 (0.0%) |
| 5 to 17 Years | 0 (0.0%) | 0 (0.0%) |
| 18 to 34 Years | 0 (0.0%) | 7 (10.0%) |
| 35 to 64 Years | 18 (34.6%) | 6 (7.8%) |
| 65 to 74 Years | 13 (56.5%) | 0 (0.0%) |
| 75 Years and over | 0 (0.0%) | 13 (100.0%) |
Disability Class by Sex by Age in Renningers
Disability Class: Hearing Difficulty
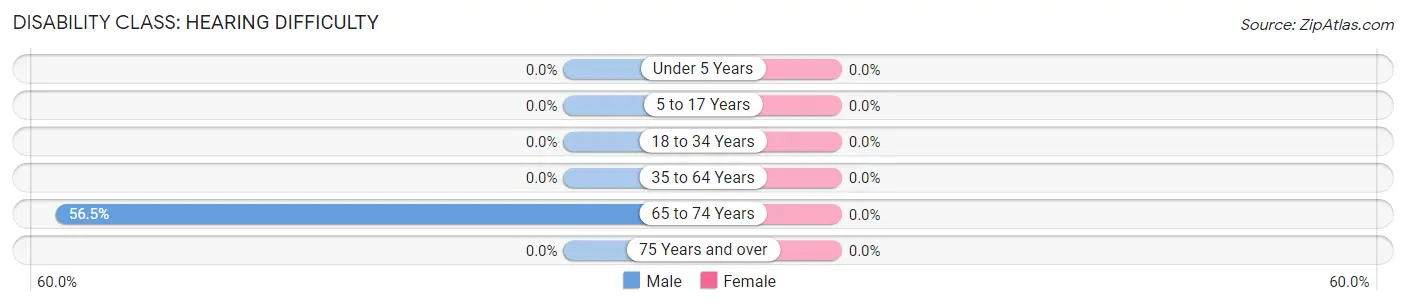
| Age Bracket | Male | Female |
| Under 5 Years | 0 (0.0%) | 0 (0.0%) |
| 5 to 17 Years | 0 (0.0%) | 0 (0.0%) |
| 18 to 34 Years | 0 (0.0%) | 0 (0.0%) |
| 35 to 64 Years | 0 (0.0%) | 0 (0.0%) |
| 65 to 74 Years | 13 (56.5%) | 0 (0.0%) |
| 75 Years and over | 0 (0.0%) | 0 (0.0%) |
Disability Class: Vision Difficulty
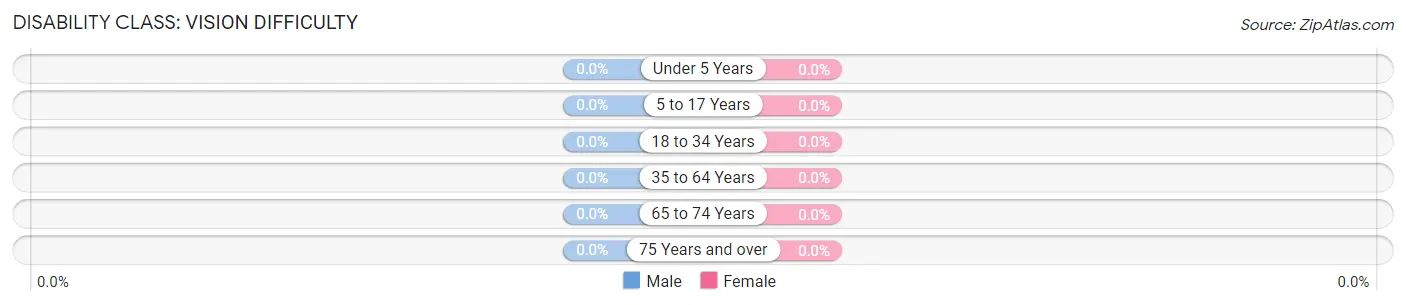
| Age Bracket | Male | Female |
| Under 5 Years | 0 (0.0%) | 0 (0.0%) |
| 5 to 17 Years | 0 (0.0%) | 0 (0.0%) |
| 18 to 34 Years | 0 (0.0%) | 0 (0.0%) |
| 35 to 64 Years | 0 (0.0%) | 0 (0.0%) |
| 65 to 74 Years | 0 (0.0%) | 0 (0.0%) |
| 75 Years and over | 0 (0.0%) | 0 (0.0%) |
Disability Class: Cognitive Difficulty
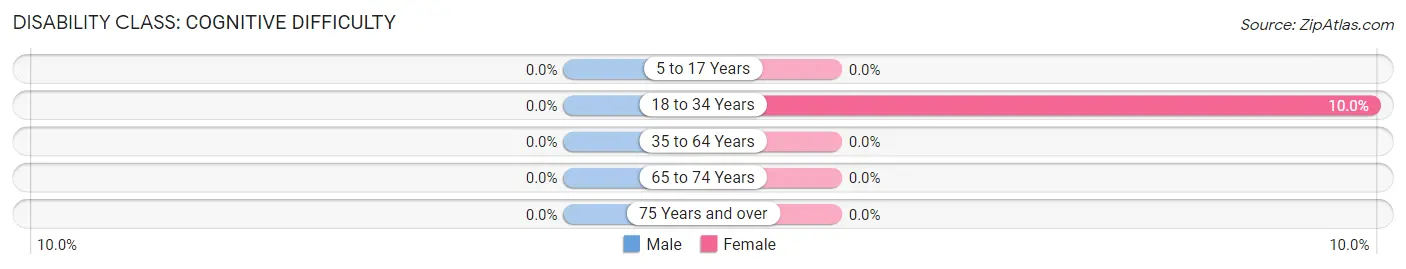
| Age Bracket | Male | Female |
| 5 to 17 Years | 0 (0.0%) | 0 (0.0%) |
| 18 to 34 Years | 0 (0.0%) | 7 (10.0%) |
| 35 to 64 Years | 0 (0.0%) | 0 (0.0%) |
| 65 to 74 Years | 0 (0.0%) | 0 (0.0%) |
| 75 Years and over | 0 (0.0%) | 0 (0.0%) |
Disability Class: Ambulatory Difficulty
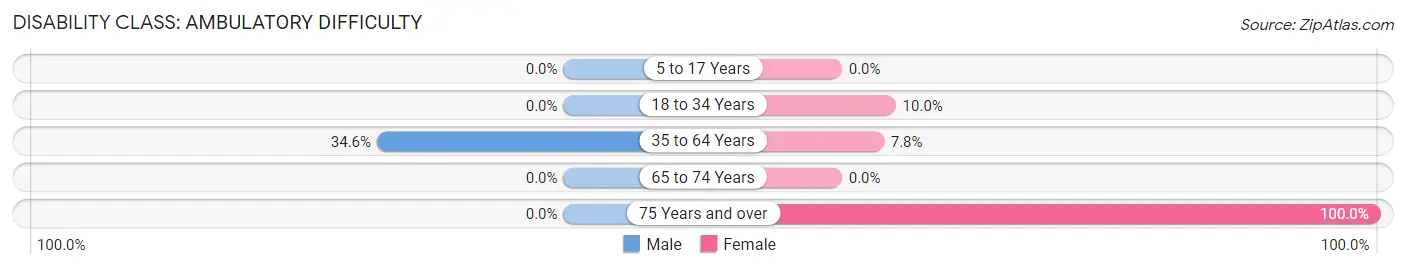
| Age Bracket | Male | Female |
| 5 to 17 Years | 0 (0.0%) | 0 (0.0%) |
| 18 to 34 Years | 0 (0.0%) | 7 (10.0%) |
| 35 to 64 Years | 18 (34.6%) | 6 (7.8%) |
| 65 to 74 Years | 0 (0.0%) | 0 (0.0%) |
| 75 Years and over | 0 (0.0%) | 13 (100.0%) |
Disability Class: Self-Care Difficulty
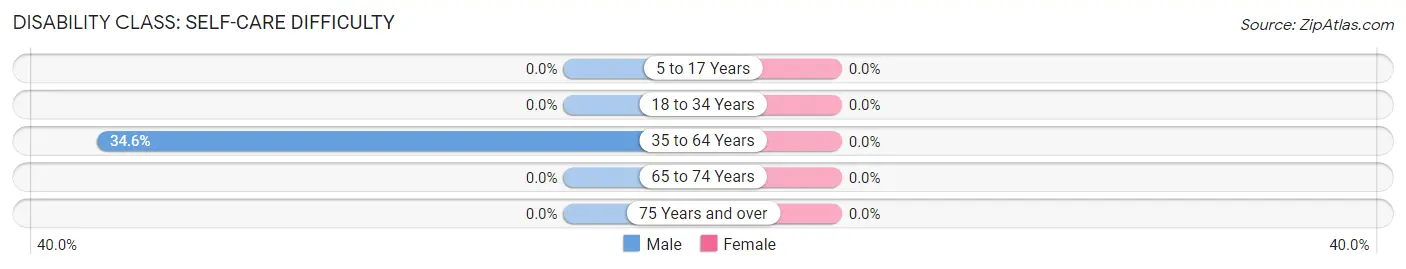
| Age Bracket | Male | Female |
| 5 to 17 Years | 0 (0.0%) | 0 (0.0%) |
| 18 to 34 Years | 0 (0.0%) | 0 (0.0%) |
| 35 to 64 Years | 18 (34.6%) | 0 (0.0%) |
| 65 to 74 Years | 0 (0.0%) | 0 (0.0%) |
| 75 Years and over | 0 (0.0%) | 0 (0.0%) |
Technology Access in Renningers
Computing Device Access in Renningers
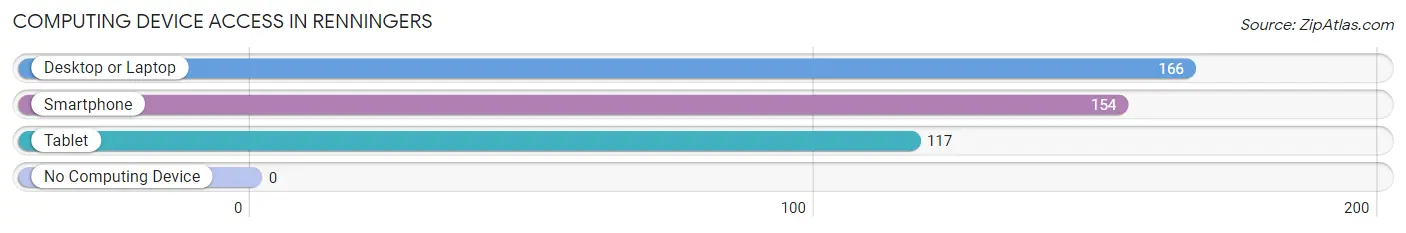
| Device Type | # Households | % Households |
| Desktop or Laptop | 166 | 100.0% |
| Smartphone | 154 | 92.8% |
| Tablet | 117 | 70.5% |
| No Computing Device | 0 | 0.0% |
| Total | 166 | 100.0% |
Internet Access in Renningers
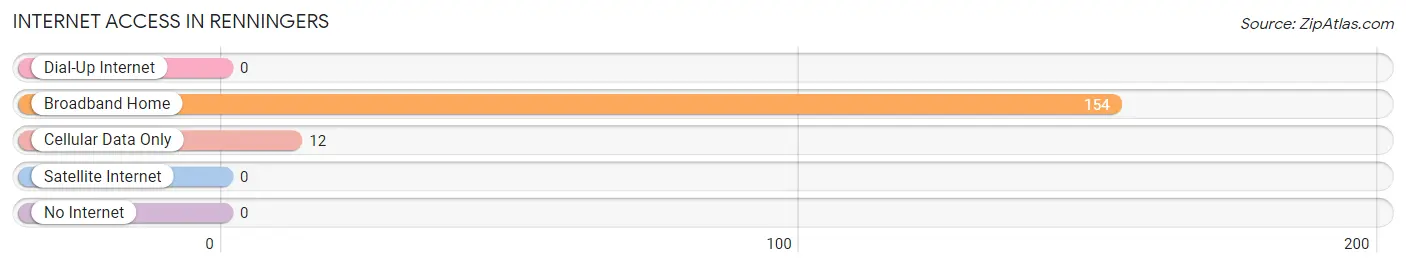
| Internet Type | # Households | % Households |
| Dial-Up Internet | 0 | 0.0% |
| Broadband Home | 154 | 92.8% |
| Cellular Data Only | 12 | 7.2% |
| Satellite Internet | 0 | 0.0% |
| No Internet | 0 | 0.0% |
| Total | 166 | 100.0% |
Renningers Summary
Renningers is a small unincorporated community located in Lancaster County, Pennsylvania. It is situated in the southeastern corner of the county, near the border with Chester County. The community is named after the Renninger family, who were among the first settlers in the area.
History
The Renninger family first settled in the area in the late 1700s. The family was of German descent and had come to the area from the Palatinate region of Germany. The family established a farm and a small store in the area, which became the center of the community. The store was a popular gathering place for the local residents, and it was here that the first post office was established in 1845.
The community grew slowly over the years, and by the early 1900s, it had become a small village with a population of around 200 people. The village was home to a variety of businesses, including a blacksmith, a general store, a grist mill, and a sawmill. The village also had a school, a church, and a post office.
Geography
Renningers is located in southeastern Lancaster County, near the border with Chester County. It is situated in a rural area, with rolling hills and farmland. The community is located along the Conestoga River, which flows through the area. The nearest major city is Lancaster, which is about 15 miles to the northwest.
Economy
The economy of Renningers is largely based on agriculture. The area is home to several farms, which produce a variety of crops, including corn, soybeans, and hay. The community also has a few small businesses, including a general store, a gas station, and a restaurant.
Demographics
As of the 2010 census, the population of Renningers was 545. The racial makeup of the community was 97.3% White, 0.7% African American, 0.2% Native American, 0.2% Asian, and 1.6% from other races. The median household income was $50,000, and the median home value was $170,000.
Conclusion
Renningers is a small unincorporated community located in southeastern Lancaster County, Pennsylvania. It is a rural area with a population of around 500 people, and the economy is largely based on agriculture. The community has a long history, and it is home to a variety of businesses, including a general store, a gas station, and a restaurant.
Common Questions
What is Per Capita Income in Renningers?
Per Capita income in Renningers is $33,297.
What is the Median Family Income in Renningers?
Median Family Income in Renningers is $84,000.
What is the Median Household income in Renningers?
Median Household Income in Renningers is $84,000.
What is Income or Wage Gap in Renningers?
Income or Wage Gap in Renningers is 54.9%.
Women in Renningers earn 45.1 cents for every dollar earned by a man.
What is Inequality or Gini Index in Renningers?
Inequality or Gini Index in Renningers is 0.32.
What is the Total Population of Renningers?
Total Population of Renningers is 551.
What is the Total Male Population of Renningers?
Total Male Population of Renningers is 320.
What is the Total Female Population of Renningers?
Total Female Population of Renningers is 231.
What is the Ratio of Males per 100 Females in Renningers?
There are 138.53 Males per 100 Females in Renningers.
What is the Ratio of Females per 100 Males in Renningers?
There are 72.19 Females per 100 Males in Renningers.
What is the Median Population Age in Renningers?
Median Population Age in Renningers is 31.3 Years.
What is the Average Family Size in Renningers
Average Family Size in Renningers is 3.3 People.
What is the Average Household Size in Renningers
Average Household Size in Renningers is 3.3 People.
How Large is the Labor Force in Renningers?
There are 248 People in the Labor Forcein in Renningers.
What is the Percentage of People in the Labor Force in Renningers?
66.5% of People are in the Labor Force in Renningers.