Wyoming borough, PA Map & Demographics
Wyoming borough Overview
$43,335
PER CAPITA INCOME
$88,893
AVG FAMILY INCOME
$71,406
AVG HOUSEHOLD INCOME
21.8%
WAGE / INCOME GAP [ % ]
78.2¢/ $1
WAGE / INCOME GAP [ $ ]
0.41
INEQUALITY / GINI INDEX
3,107
TOTAL POPULATION
1,559
MALE POPULATION
1,548
FEMALE POPULATION
100.71
MALES / 100 FEMALES
99.29
FEMALES / 100 MALES
47.5
MEDIAN AGE
2.9
AVG FAMILY SIZE
2.1
AVG HOUSEHOLD SIZE
1,805
LABOR FORCE [ PEOPLE ]
66.7%
PERCENT IN LABOR FORCE
3.4%
UNEMPLOYMENT RATE
Income in Wyoming borough
Income Overview in Wyoming borough
Per Capita Income in Wyoming borough is $43,335, while median incomes of families and households are $88,893 and $71,406 respectively.
| Characteristic | Number | Measure |
| Per Capita Income | 3,107 | $43,335 |
| Median Family Income | 785 | $88,893 |
| Mean Family Income | 785 | $112,784 |
| Median Household Income | 1,475 | $71,406 |
| Mean Household Income | 1,475 | $87,083 |
| Income Deficit | 785 | $0 |
| Wage / Income Gap (%) | 3,107 | 21.81% |
| Wage / Income Gap ($) | 3,107 | 78.19¢ per $1 |
| Gini / Inequality Index | 3,107 | 0.41 |
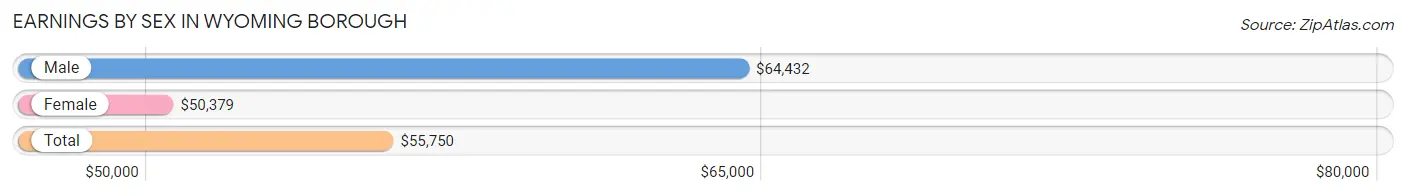
Earnings by Sex in Wyoming borough
Average Earnings in Wyoming borough are $55,750, $64,432 for men and $50,379 for women, a difference of 21.8%.
| Sex | Number | Average Earnings |
| Male | 935 (50.8%) | $64,432 |
| Female | 904 (49.2%) | $50,379 |
| Total | 1,839 (100.0%) | $55,750 |
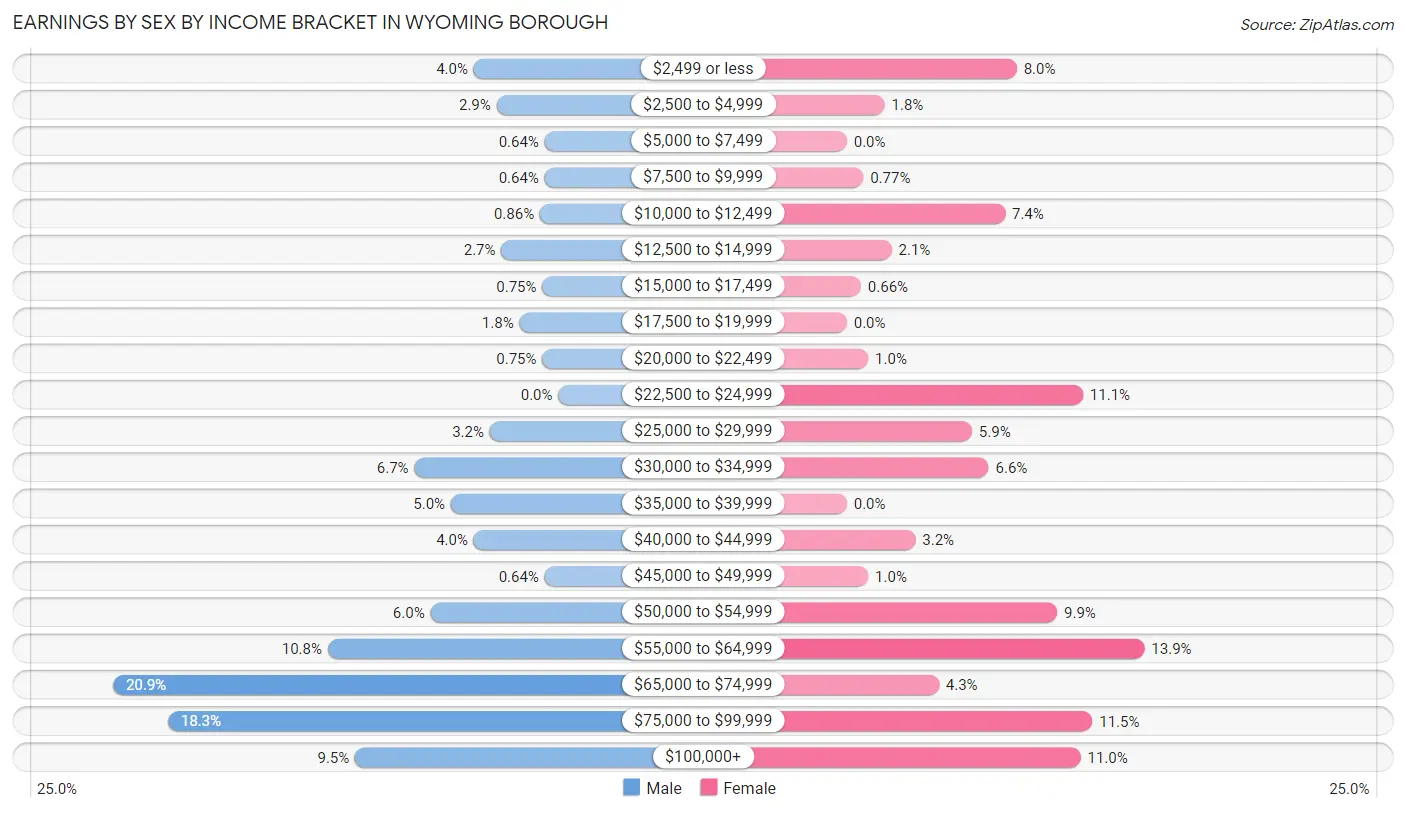
Earnings by Sex by Income Bracket in Wyoming borough
The most common earnings brackets in Wyoming borough are $65,000 to $74,999 for men (195 | 20.9%) and $55,000 to $64,999 for women (126 | 13.9%).
| Income | Male | Female |
| $2,499 or less | 37 (4.0%) | 72 (8.0%) |
| $2,500 to $4,999 | 27 (2.9%) | 16 (1.8%) |
| $5,000 to $7,499 | 6 (0.6%) | 0 (0.0%) |
| $7,500 to $9,999 | 6 (0.6%) | 7 (0.8%) |
| $10,000 to $12,499 | 8 (0.9%) | 67 (7.4%) |
| $12,500 to $14,999 | 25 (2.7%) | 19 (2.1%) |
| $15,000 to $17,499 | 7 (0.7%) | 6 (0.7%) |
| $17,500 to $19,999 | 17 (1.8%) | 0 (0.0%) |
| $20,000 to $22,499 | 7 (0.7%) | 9 (1.0%) |
| $22,500 to $24,999 | 0 (0.0%) | 100 (11.1%) |
| $25,000 to $29,999 | 30 (3.2%) | 53 (5.9%) |
| $30,000 to $34,999 | 63 (6.7%) | 60 (6.6%) |
| $35,000 to $39,999 | 47 (5.0%) | 0 (0.0%) |
| $40,000 to $44,999 | 37 (4.0%) | 29 (3.2%) |
| $45,000 to $49,999 | 6 (0.6%) | 9 (1.0%) |
| $50,000 to $54,999 | 56 (6.0%) | 89 (9.9%) |
| $55,000 to $64,999 | 101 (10.8%) | 126 (13.9%) |
| $65,000 to $74,999 | 195 (20.9%) | 39 (4.3%) |
| $75,000 to $99,999 | 171 (18.3%) | 104 (11.5%) |
| $100,000+ | 89 (9.5%) | 99 (11.0%) |
| Total | 935 (100.0%) | 904 (100.0%) |
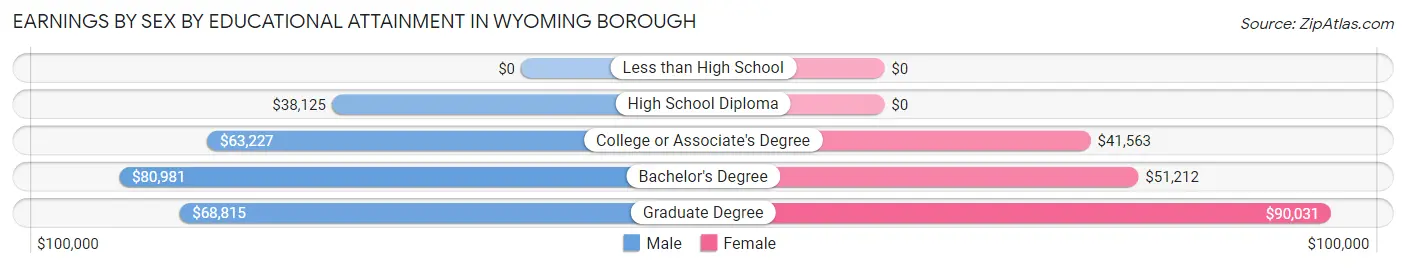
Earnings by Sex by Educational Attainment in Wyoming borough
Average earnings in Wyoming borough are $65,291 for men and $53,862 for women, a difference of 17.5%. Men with an educational attainment of bachelor's degree enjoy the highest average annual earnings of $80,981, while those with high school diploma education earn the least with $38,125. Women with an educational attainment of graduate degree earn the most with the average annual earnings of $90,031, while those with college or associate's degree education have the smallest earnings of $41,563.
| Educational Attainment | Male Income | Female Income |
| Less than High School | - | - |
| High School Diploma | $38,125 | $0 |
| College or Associate's Degree | $63,227 | $41,563 |
| Bachelor's Degree | $80,981 | $51,212 |
| Graduate Degree | $68,815 | $90,031 |
| Total | $65,291 | $53,862 |
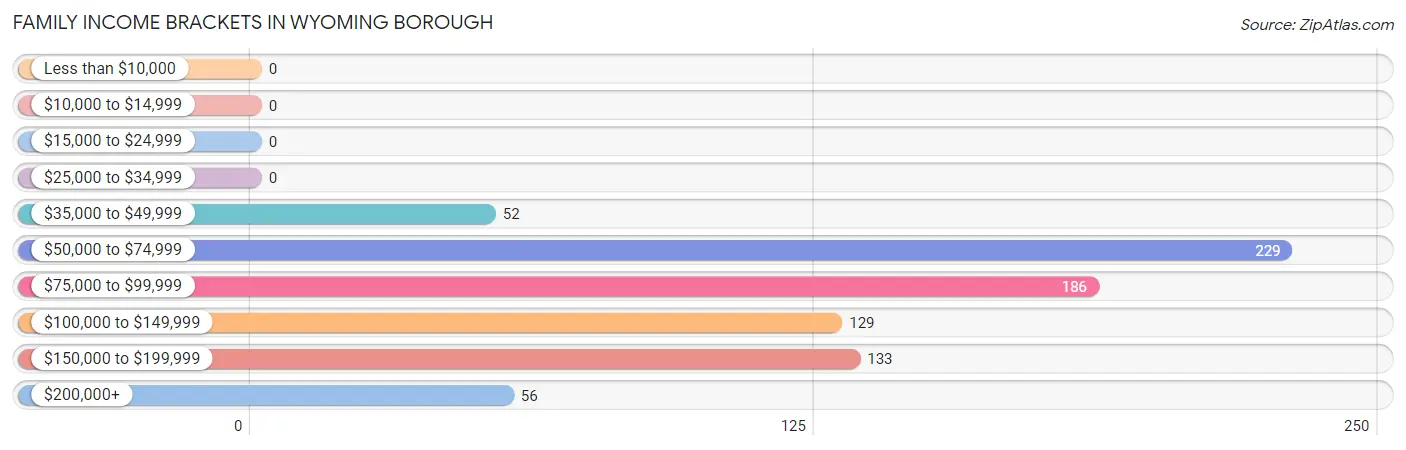
Family Income in Wyoming borough
Family Income Brackets in Wyoming borough
According to the Wyoming borough family income data, there are 229 families falling into the $50,000 to $74,999 income range, which is the most common income bracket and makes up 29.2% of all families.
| Income Bracket | # Families | % Families |
| Less than $10,000 | 0 | 0.0% |
| $10,000 to $14,999 | 0 | 0.0% |
| $15,000 to $24,999 | 0 | 0.0% |
| $25,000 to $34,999 | 0 | 0.0% |
| $35,000 to $49,999 | 52 | 6.6% |
| $50,000 to $74,999 | 229 | 29.2% |
| $75,000 to $99,999 | 186 | 23.7% |
| $100,000 to $149,999 | 129 | 16.4% |
| $150,000 to $199,999 | 133 | 16.9% |
| $200,000+ | 56 | 7.1% |
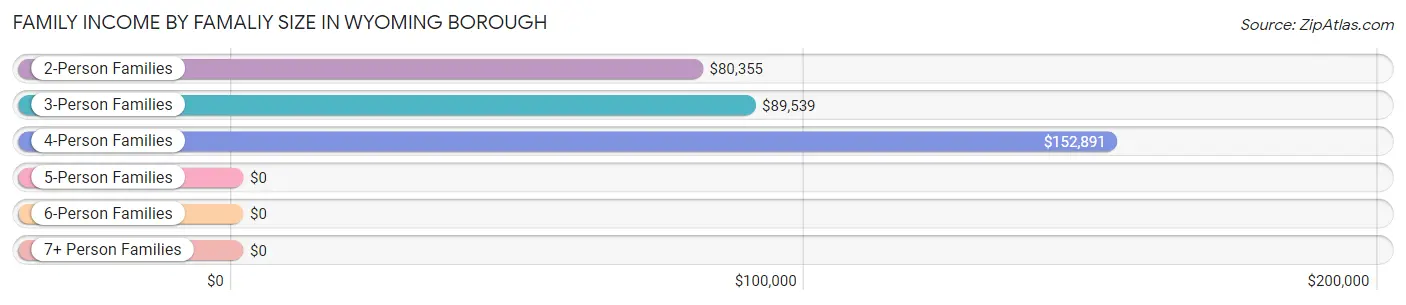
Family Income by Famaliy Size in Wyoming borough
4-person families (137 | 17.4%) account for the highest median family income in Wyoming borough with $152,891 per family, while 2-person families (487 | 62.0%) have the highest median income of $40,178 per family member.
| Income Bracket | # Families | Median Income |
| 2-Person Families | 487 (62.0%) | $80,355 |
| 3-Person Families | 125 (15.9%) | $89,539 |
| 4-Person Families | 137 (17.4%) | $152,891 |
| 5-Person Families | 36 (4.6%) | $0 |
| 6-Person Families | 0 (0.0%) | $0 |
| 7+ Person Families | 0 (0.0%) | $0 |
| Total | 785 (100.0%) | $88,893 |
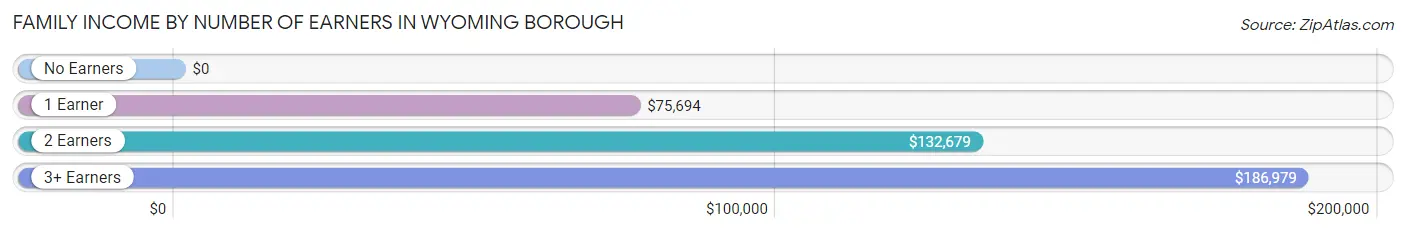
Family Income by Number of Earners in Wyoming borough
| Number of Earners | # Families | Median Income |
| No Earners | 69 (8.8%) | $0 |
| 1 Earner | 364 (46.4%) | $75,694 |
| 2 Earners | 244 (31.1%) | $132,679 |
| 3+ Earners | 108 (13.8%) | $186,979 |
| Total | 785 (100.0%) | $88,893 |
Household Income in Wyoming borough
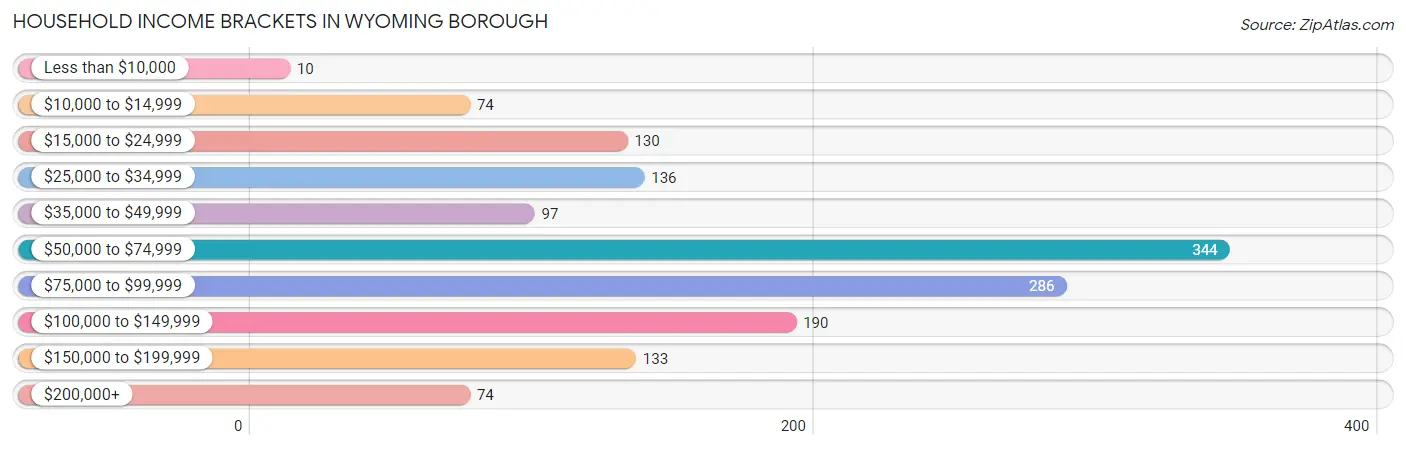
Household Income Brackets in Wyoming borough
With 344 households falling in the category, the $50,000 to $74,999 income range is the most frequent in Wyoming borough, accounting for 23.3% of all households. In contrast, only 10 households (0.7%) fall into the less than $10,000 income bracket, making it the least populous group.
| Income Bracket | # Households | % Households |
| Less than $10,000 | 10 | 0.7% |
| $10,000 to $14,999 | 74 | 5.0% |
| $15,000 to $24,999 | 130 | 8.8% |
| $25,000 to $34,999 | 136 | 9.2% |
| $35,000 to $49,999 | 97 | 6.6% |
| $50,000 to $74,999 | 344 | 23.3% |
| $75,000 to $99,999 | 286 | 19.4% |
| $100,000 to $149,999 | 190 | 12.9% |
| $150,000 to $199,999 | 133 | 9.0% |
| $200,000+ | 74 | 5.0% |
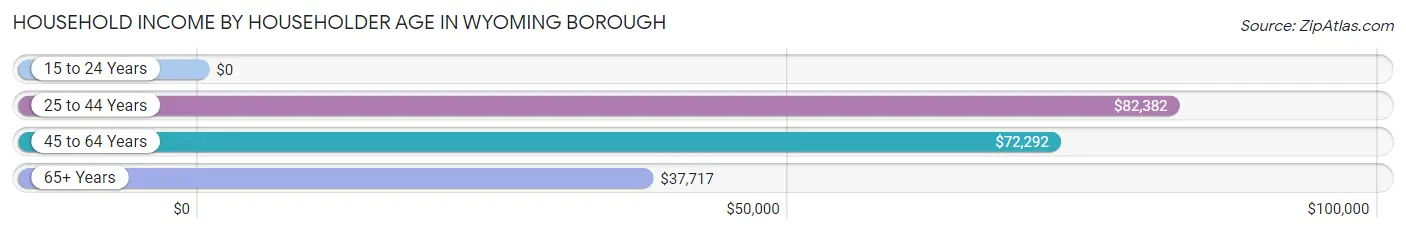
Household Income by Householder Age in Wyoming borough
The median household income in Wyoming borough is $71,406, with the highest median household income of $82,382 found in the 25 to 44 years age bracket for the primary householder. A total of 377 households (25.6%) fall into this category. Meanwhile, the 15 to 24 years age bracket for the primary householder has the lowest median household income of $0, with 11 households (0.7%) in this group.
| Income Bracket | # Households | Median Income |
| 15 to 24 Years | 11 (0.7%) | $0 |
| 25 to 44 Years | 377 (25.6%) | $82,382 |
| 45 to 64 Years | 597 (40.5%) | $72,292 |
| 65+ Years | 490 (33.2%) | $37,717 |
| Total | 1,475 (100.0%) | $71,406 |
Poverty in Wyoming borough
Income Below Poverty by Sex and Age in Wyoming borough
With 3.2% poverty level for males and 4.3% for females among the residents of Wyoming borough, 55 to 64 year old males and 75 year old and over females are the most vulnerable to poverty, with 45 males (18.8%) and 45 females (16.6%) in their respective age groups living below the poverty level.
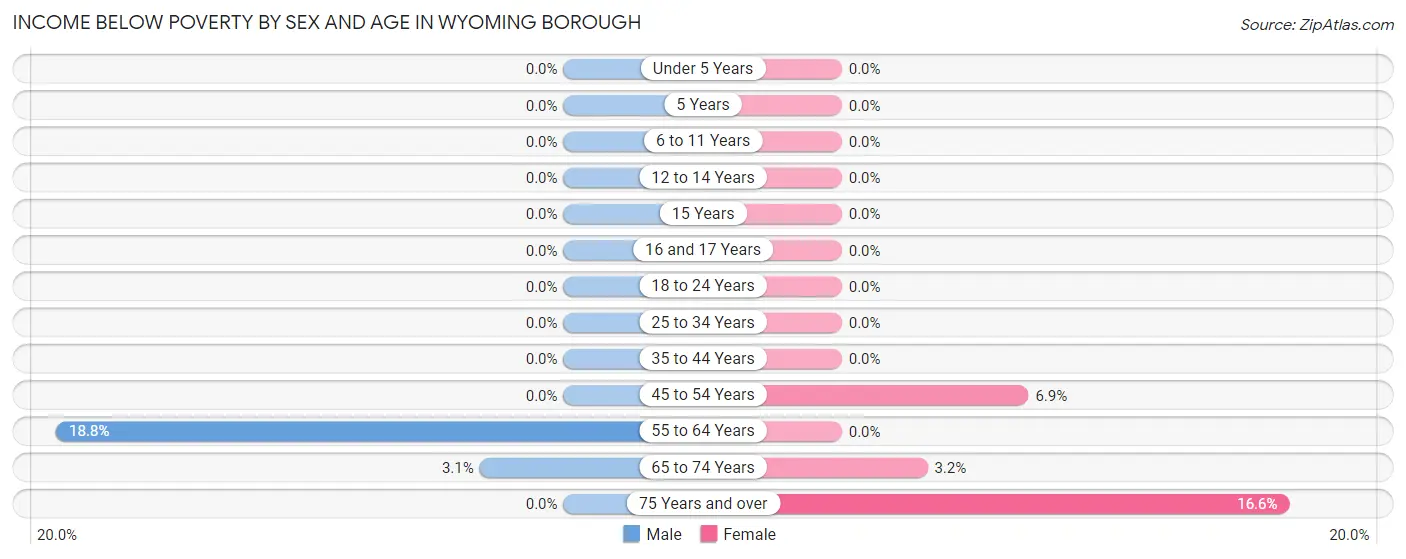
| Age Bracket | Male | Female |
| Under 5 Years | 0 (0.0%) | 0 (0.0%) |
| 5 Years | 0 (0.0%) | 0 (0.0%) |
| 6 to 11 Years | 0 (0.0%) | 0 (0.0%) |
| 12 to 14 Years | 0 (0.0%) | 0 (0.0%) |
| 15 Years | 0 (0.0%) | 0 (0.0%) |
| 16 and 17 Years | 0 (0.0%) | 0 (0.0%) |
| 18 to 24 Years | 0 (0.0%) | 0 (0.0%) |
| 25 to 34 Years | 0 (0.0%) | 0 (0.0%) |
| 35 to 44 Years | 0 (0.0%) | 0 (0.0%) |
| 45 to 54 Years | 0 (0.0%) | 16 (6.9%) |
| 55 to 64 Years | 45 (18.8%) | 0 (0.0%) |
| 65 to 74 Years | 5 (3.1%) | 5 (3.2%) |
| 75 Years and over | 0 (0.0%) | 45 (16.6%) |
| Total | 50 (3.2%) | 66 (4.3%) |
Income Above Poverty by Sex and Age in Wyoming borough
According to the poverty statistics in Wyoming borough, males aged under 5 years and females aged under 5 years are the age groups that are most secure financially, with 100.0% of males and 100.0% of females in these age groups living above the poverty line.
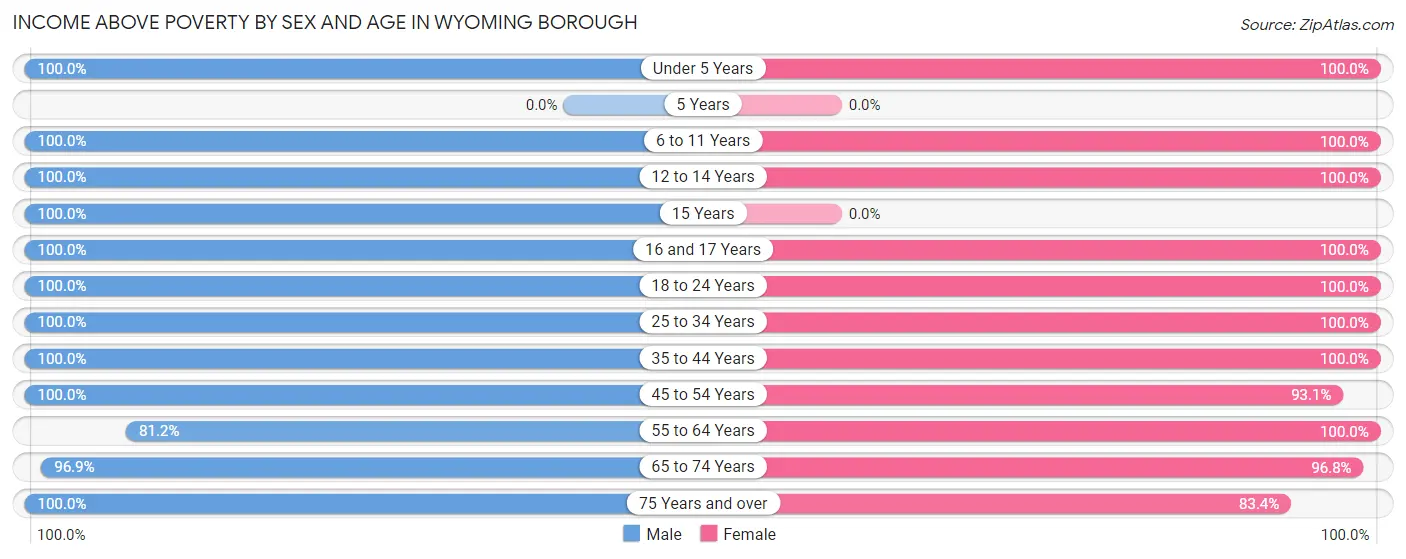
| Age Bracket | Male | Female |
| Under 5 Years | 73 (100.0%) | 18 (100.0%) |
| 5 Years | 0 (0.0%) | 0 (0.0%) |
| 6 to 11 Years | 50 (100.0%) | 101 (100.0%) |
| 12 to 14 Years | 100 (100.0%) | 47 (100.0%) |
| 15 Years | 12 (100.0%) | 0 (0.0%) |
| 16 and 17 Years | 55 (100.0%) | 17 (100.0%) |
| 18 to 24 Years | 21 (100.0%) | 100 (100.0%) |
| 25 to 34 Years | 253 (100.0%) | 174 (100.0%) |
| 35 to 44 Years | 324 (100.0%) | 156 (100.0%) |
| 45 to 54 Years | 200 (100.0%) | 215 (93.1%) |
| 55 to 64 Years | 194 (81.2%) | 276 (100.0%) |
| 65 to 74 Years | 156 (96.9%) | 152 (96.8%) |
| 75 Years and over | 71 (100.0%) | 226 (83.4%) |
| Total | 1,509 (96.8%) | 1,482 (95.7%) |
Income Below Poverty Among Married-Couple Families in Wyoming borough
| Children | Above Poverty | Below Poverty |
| No Children | 311 (100.0%) | 0 (0.0%) |
| 1 or 2 Children | 183 (100.0%) | 0 (0.0%) |
| 3 or 4 Children | 0 (0.0%) | 0 (0.0%) |
| 5 or more Children | 0 (0.0%) | 0 (0.0%) |
| Total | 494 (100.0%) | 0 (0.0%) |
Income Below Poverty Among Single-Parent Households in Wyoming borough
| Children | Single Father | Single Mother |
| No Children | 0 (0.0%) | 0 (0.0%) |
| 1 or 2 Children | 0 (0.0%) | 0 (0.0%) |
| 3 or 4 Children | 0 (0.0%) | 0 (0.0%) |
| 5 or more Children | 0 (0.0%) | 0 (0.0%) |
| Total | 0 (0.0%) | 0 (0.0%) |
Income Below Poverty Among Married-Couple vs Single-Parent Households in Wyoming borough
| Children | Married-Couple Families | Single-Parent Households |
| No Children | 0 (0.0%) | 0 (0.0%) |
| 1 or 2 Children | 0 (0.0%) | 0 (0.0%) |
| 3 or 4 Children | 0 (0.0%) | 0 (0.0%) |
| 5 or more Children | 0 (0.0%) | 0 (0.0%) |
| Total | 0 (0.0%) | 0 (0.0%) |
Race in Wyoming borough
The most populous races in Wyoming borough are White / Caucasian (2,997 | 96.5%), Two or more Races (85 | 2.7%), and Hispanic or Latino (21 | 0.7%).
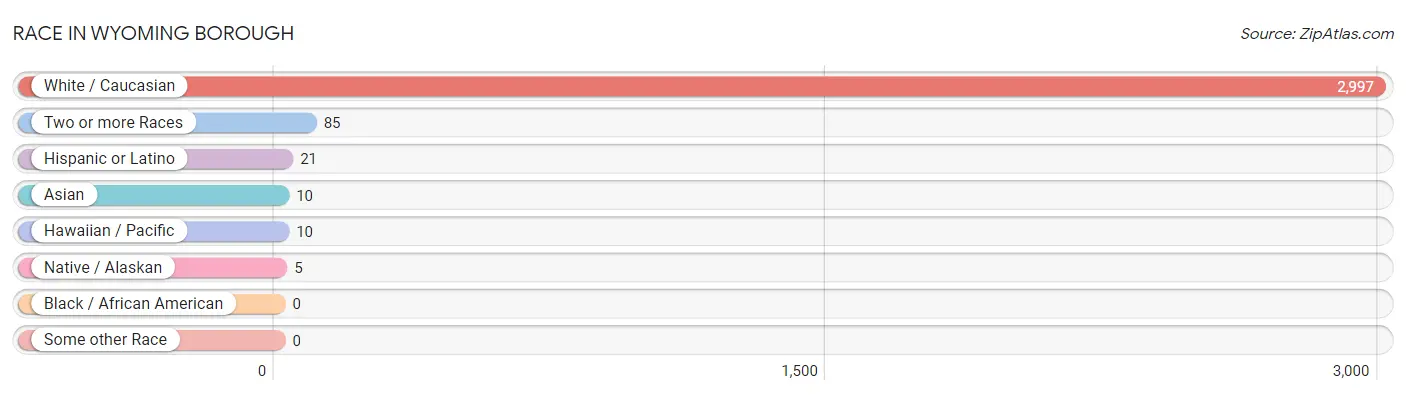
| Race | # Population | % Population |
| Asian | 10 | 0.3% |
| Black / African American | 0 | 0.0% |
| Hawaiian / Pacific | 10 | 0.3% |
| Hispanic or Latino | 21 | 0.7% |
| Native / Alaskan | 5 | 0.2% |
| White / Caucasian | 2,997 | 96.5% |
| Two or more Races | 85 | 2.7% |
| Some other Race | 0 | 0.0% |
| Total | 3,107 | 100.0% |
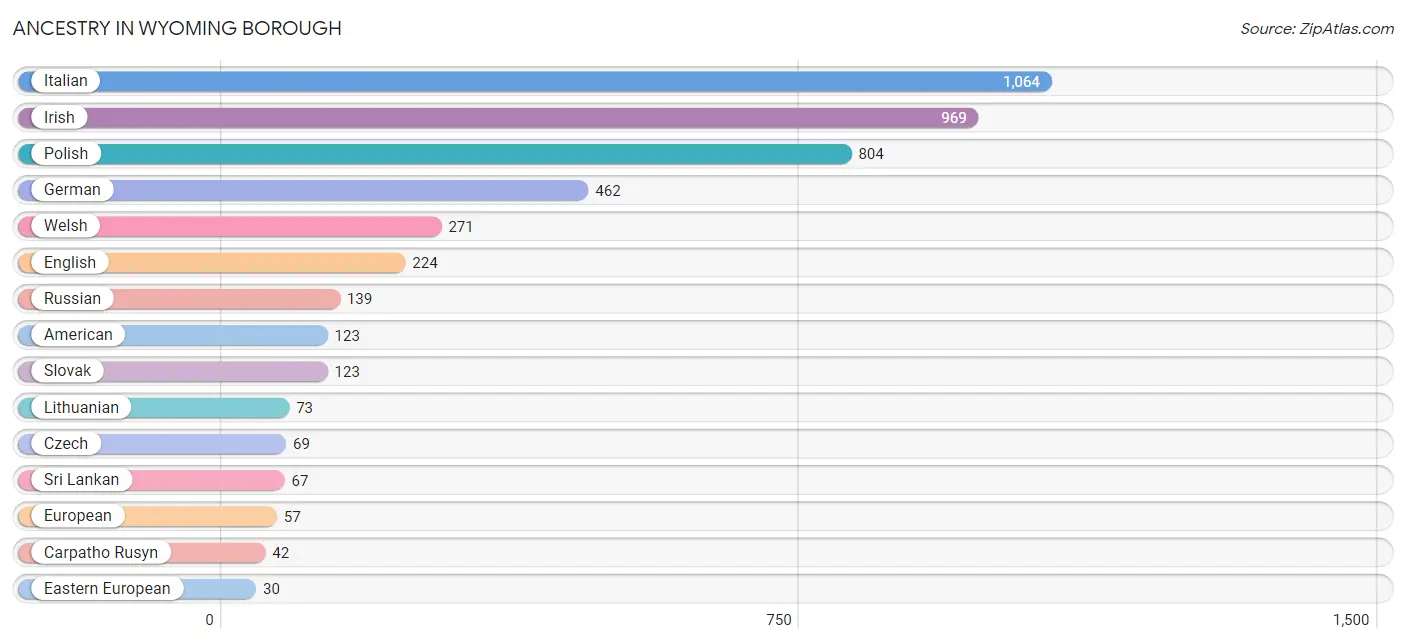
Ancestry in Wyoming borough
The most populous ancestries reported in Wyoming borough are Italian (1,064 | 34.3%), Irish (969 | 31.2%), Polish (804 | 25.9%), German (462 | 14.9%), and Welsh (271 | 8.7%), together accounting for 114.9% of all Wyoming borough residents.
| Ancestry | # Population | % Population |
| American | 123 | 4.0% |
| Arab | 7 | 0.2% |
| Armenian | 7 | 0.2% |
| Austrian | 11 | 0.4% |
| Blackfeet | 7 | 0.2% |
| British | 7 | 0.2% |
| Carpatho Rusyn | 42 | 1.3% |
| Czech | 69 | 2.2% |
| Czechoslovakian | 3 | 0.1% |
| Delaware | 3 | 0.1% |
| Dutch | 6 | 0.2% |
| Eastern European | 30 | 1.0% |
| English | 224 | 7.2% |
| European | 57 | 1.8% |
| German | 462 | 14.9% |
| Hungarian | 16 | 0.5% |
| Indian (Asian) | 10 | 0.3% |
| Irish | 969 | 31.2% |
| Italian | 1,064 | 34.3% |
| Lebanese | 7 | 0.2% |
| Lithuanian | 73 | 2.4% |
| Native Hawaiian | 10 | 0.3% |
| Pennsylvania German | 6 | 0.2% |
| Polish | 804 | 25.9% |
| Portuguese | 12 | 0.4% |
| Puerto Rican | 21 | 0.7% |
| Russian | 139 | 4.5% |
| Scandinavian | 10 | 0.3% |
| Slovak | 123 | 4.0% |
| Slovene | 10 | 0.3% |
| Sri Lankan | 67 | 2.2% |
| Swedish | 19 | 0.6% |
| Ukrainian | 6 | 0.2% |
| Welsh | 271 | 8.7% | View All 34 Rows |
Immigrants in Wyoming borough

| Immigration Origin | # Population | % Population | View All 0 Rows |
Sex and Age in Wyoming borough
Sex and Age in Wyoming borough
The most populous age groups in Wyoming borough are 35 to 39 Years (182 | 11.7%) for men and 60 to 64 Years (169 | 10.9%) for women.
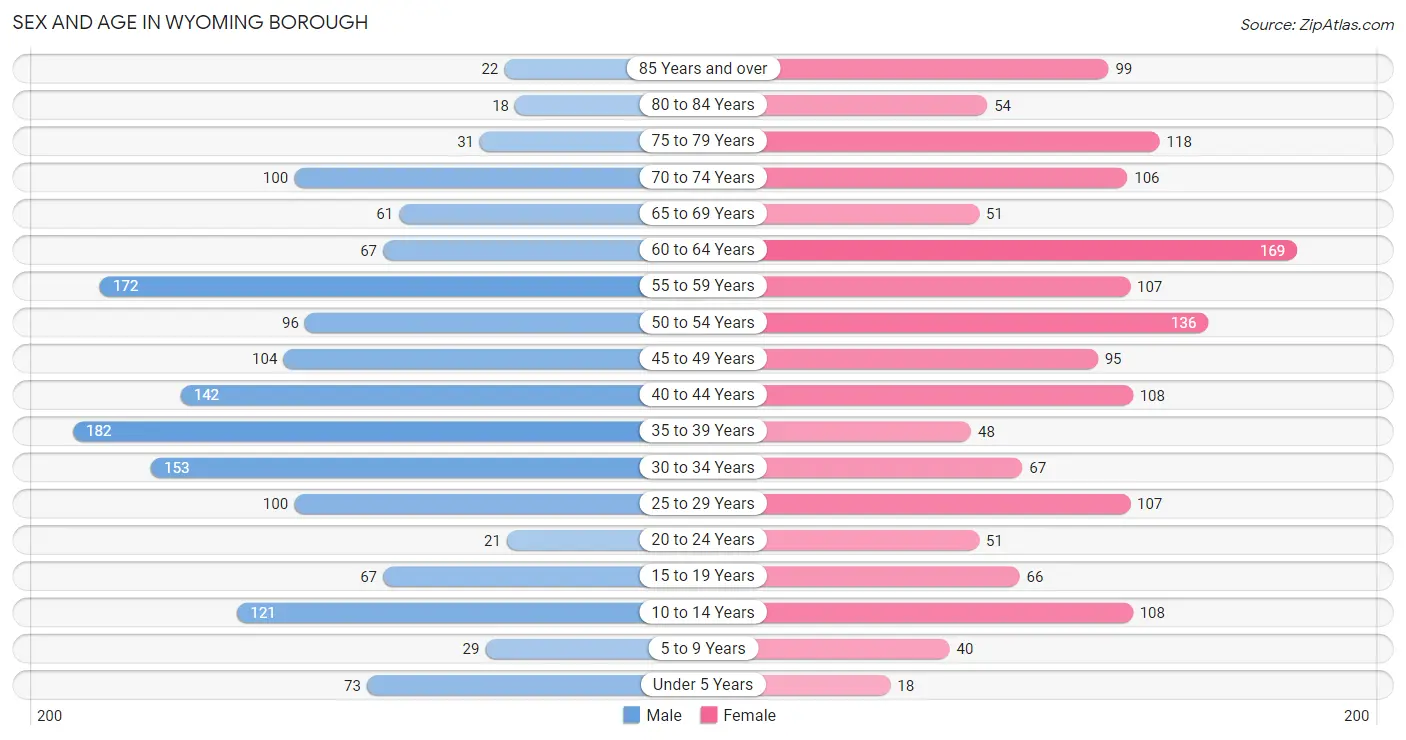
| Age Bracket | Male | Female |
| Under 5 Years | 73 (4.7%) | 18 (1.2%) |
| 5 to 9 Years | 29 (1.9%) | 40 (2.6%) |
| 10 to 14 Years | 121 (7.8%) | 108 (7.0%) |
| 15 to 19 Years | 67 (4.3%) | 66 (4.3%) |
| 20 to 24 Years | 21 (1.3%) | 51 (3.3%) |
| 25 to 29 Years | 100 (6.4%) | 107 (6.9%) |
| 30 to 34 Years | 153 (9.8%) | 67 (4.3%) |
| 35 to 39 Years | 182 (11.7%) | 48 (3.1%) |
| 40 to 44 Years | 142 (9.1%) | 108 (7.0%) |
| 45 to 49 Years | 104 (6.7%) | 95 (6.1%) |
| 50 to 54 Years | 96 (6.2%) | 136 (8.8%) |
| 55 to 59 Years | 172 (11.0%) | 107 (6.9%) |
| 60 to 64 Years | 67 (4.3%) | 169 (10.9%) |
| 65 to 69 Years | 61 (3.9%) | 51 (3.3%) |
| 70 to 74 Years | 100 (6.4%) | 106 (6.9%) |
| 75 to 79 Years | 31 (2.0%) | 118 (7.6%) |
| 80 to 84 Years | 18 (1.1%) | 54 (3.5%) |
| 85 Years and over | 22 (1.4%) | 99 (6.4%) |
| Total | 1,559 (100.0%) | 1,548 (100.0%) |
Families and Households in Wyoming borough
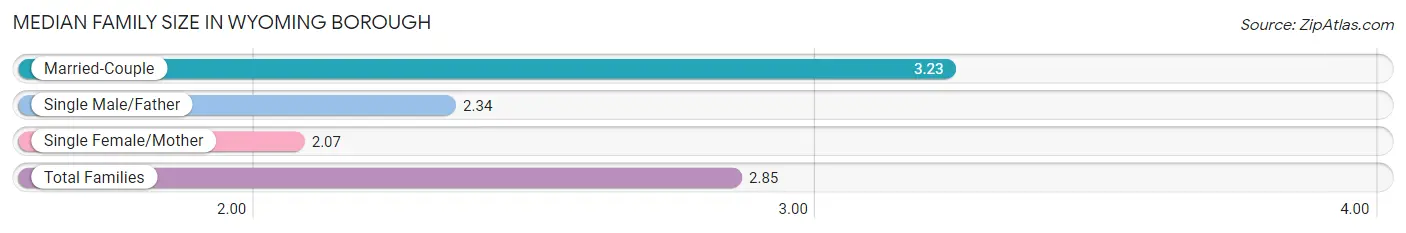
Median Family Size in Wyoming borough
The median family size in Wyoming borough is 2.85 persons per family, with married-couple families (494 | 62.9%) accounting for the largest median family size of 3.23 persons per family. On the other hand, single female/mother families (136 | 17.3%) represent the smallest median family size with 2.07 persons per family.
| Family Type | # Families | Family Size |
| Married-Couple | 494 (62.9%) | 3.23 |
| Single Male/Father | 155 (19.8%) | 2.34 |
| Single Female/Mother | 136 (17.3%) | 2.07 |
| Total Families | 785 (100.0%) | 2.85 |
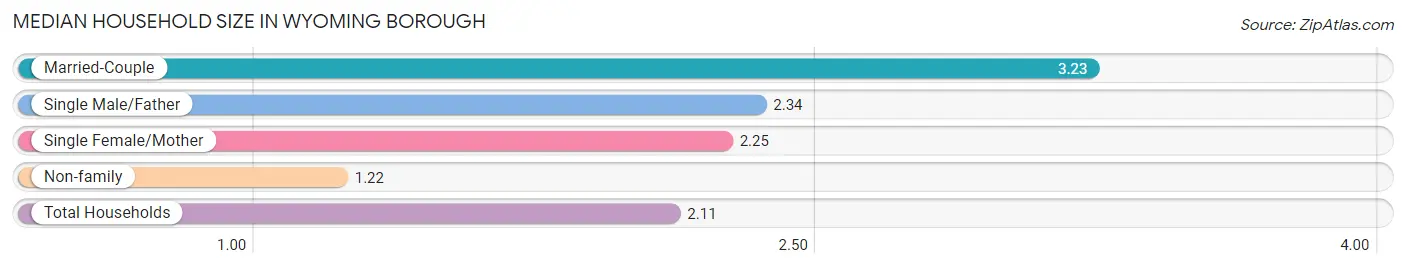
Median Household Size in Wyoming borough
The median household size in Wyoming borough is 2.11 persons per household, with married-couple households (494 | 33.5%) accounting for the largest median household size of 3.23 persons per household. non-family households (690 | 46.8%) represent the smallest median household size with 1.22 persons per household.
| Household Type | # Households | Household Size |
| Married-Couple | 494 (33.5%) | 3.23 |
| Single Male/Father | 155 (10.5%) | 2.34 |
| Single Female/Mother | 136 (9.2%) | 2.25 |
| Non-family | 690 (46.8%) | 1.22 |
| Total Households | 1,475 (100.0%) | 2.11 |
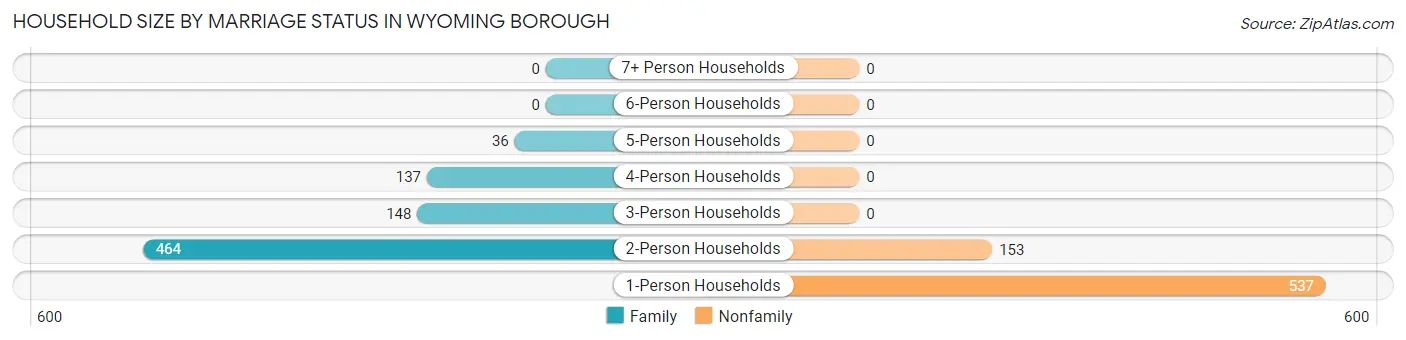
Household Size by Marriage Status in Wyoming borough
Out of a total of 1,475 households in Wyoming borough, 785 (53.2%) are family households, while 690 (46.8%) are nonfamily households. The most numerous type of family households are 2-person households, comprising 464, and the most common type of nonfamily households are 1-person households, comprising 537.
| Household Size | Family Households | Nonfamily Households |
| 1-Person Households | - | 537 (36.4%) |
| 2-Person Households | 464 (31.5%) | 153 (10.4%) |
| 3-Person Households | 148 (10.0%) | 0 (0.0%) |
| 4-Person Households | 137 (9.3%) | 0 (0.0%) |
| 5-Person Households | 36 (2.4%) | 0 (0.0%) |
| 6-Person Households | 0 (0.0%) | 0 (0.0%) |
| 7+ Person Households | 0 (0.0%) | 0 (0.0%) |
| Total | 785 (53.2%) | 690 (46.8%) |
Female Fertility in Wyoming borough
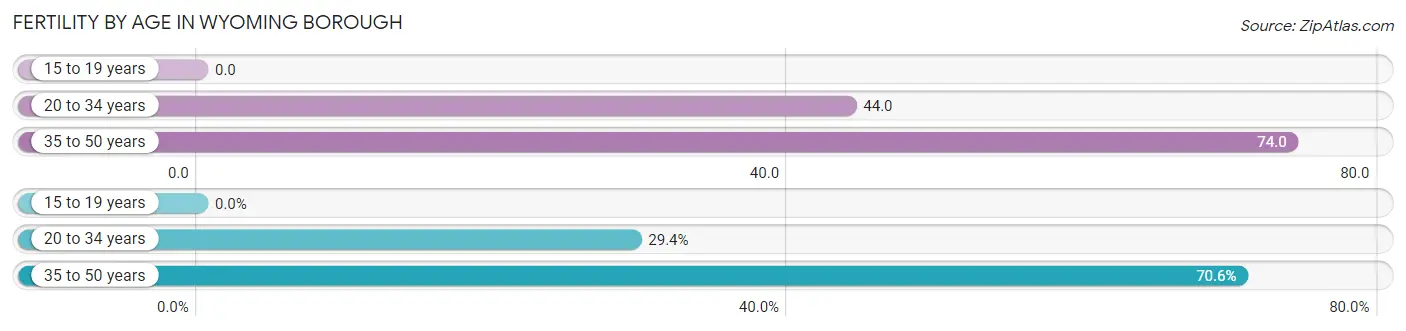
Fertility by Age in Wyoming borough
Average fertility rate in Wyoming borough is 55.0 births per 1,000 women. Women in the age bracket of 35 to 50 years have the highest fertility rate with 74.0 births per 1,000 women. Women in the age bracket of 35 to 50 years acount for 70.6% of all women with births.
| Age Bracket | Women with Births | Births / 1,000 Women |
| 15 to 19 years | 0 (0.0%) | 0.0 |
| 20 to 34 years | 10 (29.4%) | 44.0 |
| 35 to 50 years | 24 (70.6%) | 74.0 |
| Total | 34 (100.0%) | 55.0 |
Fertility by Age by Marriage Status in Wyoming borough
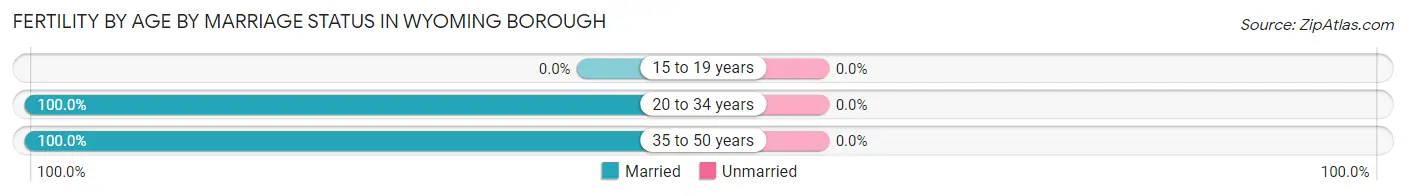
| Age Bracket | Married | Unmarried |
| 15 to 19 years | 0 (0.0%) | 0 (0.0%) |
| 20 to 34 years | 10 (100.0%) | 0 (0.0%) |
| 35 to 50 years | 24 (100.0%) | 0 (0.0%) |
| Total | 34 (100.0%) | 0 (0.0%) |
Fertility by Education in Wyoming borough
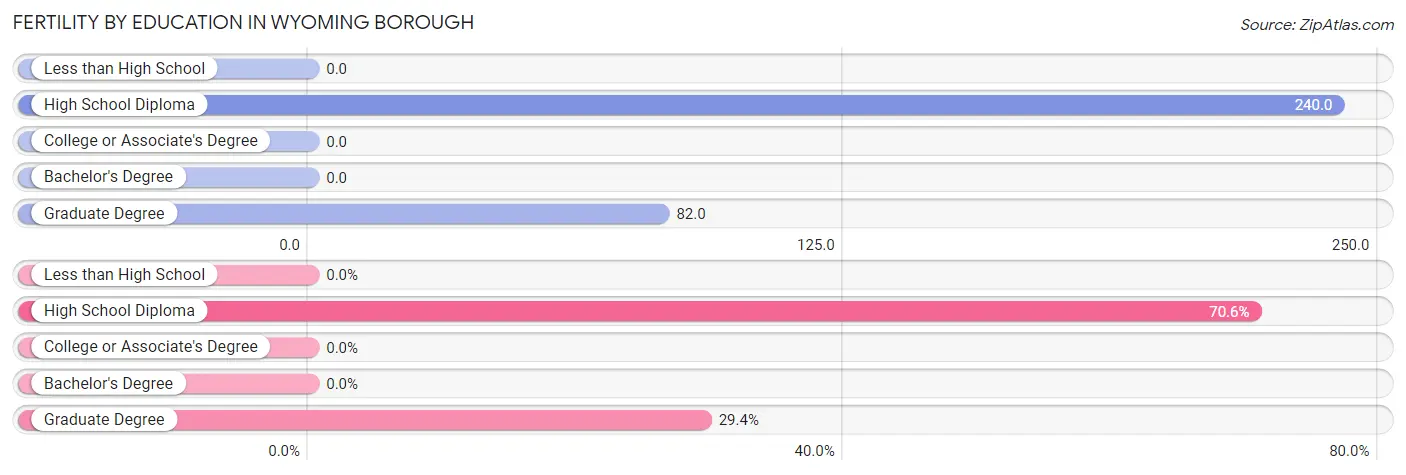
| Educational Attainment | Women with Births | Births / 1,000 Women |
| Less than High School | 0 (0.0%) | 0.0 |
| High School Diploma | 24 (70.6%) | 240.0 |
| College or Associate's Degree | 0 (0.0%) | 0.0 |
| Bachelor's Degree | 0 (0.0%) | 0.0 |
| Graduate Degree | 10 (29.4%) | 82.0 |
| Total | 34 (100.0%) | 55.0 |
Fertility by Education by Marriage Status in Wyoming borough
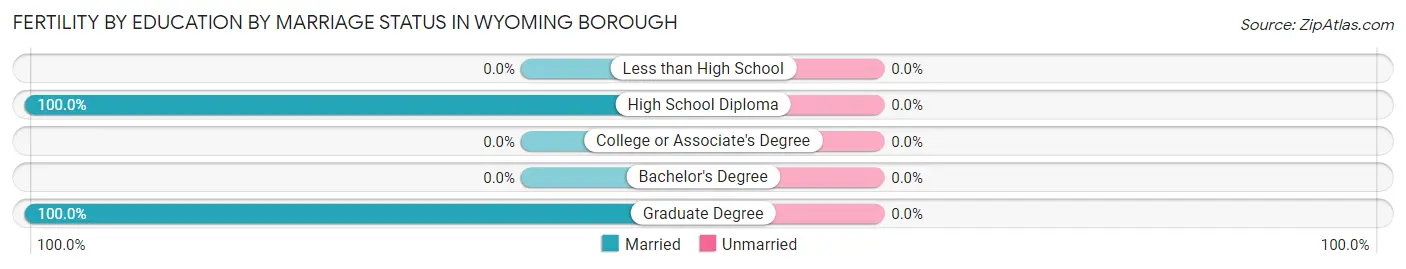
| Educational Attainment | Married | Unmarried |
| Less than High School | 0 (0.0%) | 0 (0.0%) |
| High School Diploma | 24 (100.0%) | 0 (0.0%) |
| College or Associate's Degree | 0 (0.0%) | 0 (0.0%) |
| Bachelor's Degree | 0 (0.0%) | 0 (0.0%) |
| Graduate Degree | 10 (100.0%) | 0 (0.0%) |
| Total | 34 (100.0%) | 0 (0.0%) |
Employment Characteristics in Wyoming borough
Employment by Class of Employer in Wyoming borough
Among the 1,738 employed individuals in Wyoming borough, private company employees (1,143 | 65.8%), not-for-profit organizations (322 | 18.5%), and state government employees (74 | 4.3%) make up the most common classes of employment.
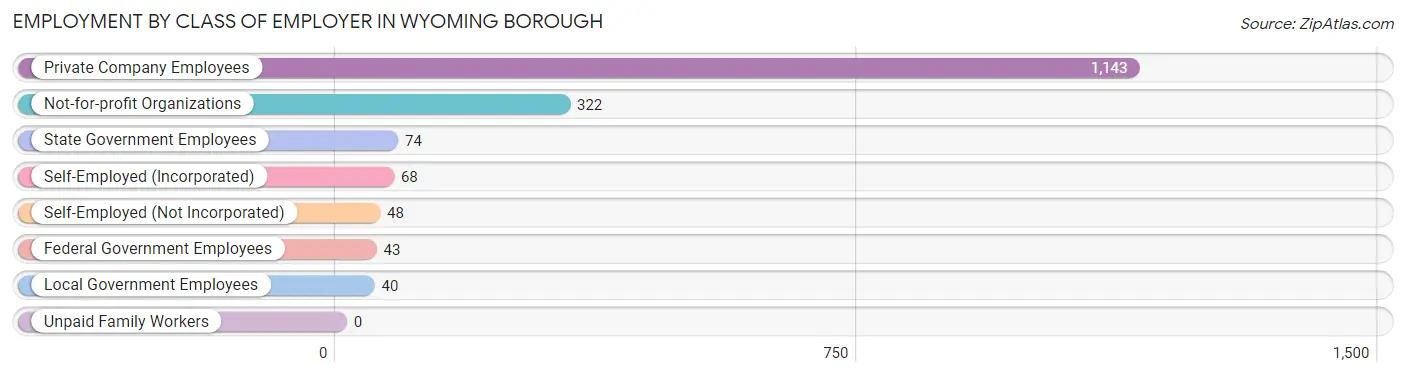
| Employer Class | # Employees | % Employees |
| Private Company Employees | 1,143 | 65.8% |
| Self-Employed (Incorporated) | 68 | 3.9% |
| Self-Employed (Not Incorporated) | 48 | 2.8% |
| Not-for-profit Organizations | 322 | 18.5% |
| Local Government Employees | 40 | 2.3% |
| State Government Employees | 74 | 4.3% |
| Federal Government Employees | 43 | 2.5% |
| Unpaid Family Workers | 0 | 0.0% |
| Total | 1,738 | 100.0% |
Employment Status by Age in Wyoming borough
According to the labor force statistics for Wyoming borough, out of the total population over 16 years of age (2,706), 66.7% or 1,805 individuals are in the labor force, with 3.4% or 61 of them unemployed. The age group with the highest labor force participation rate is 25 to 29 years, with 100.0% or 207 individuals in the labor force. Within the labor force, the 16 to 19 years age range has the highest percentage of unemployed individuals, with 28.7% or 25 of them being unemployed.
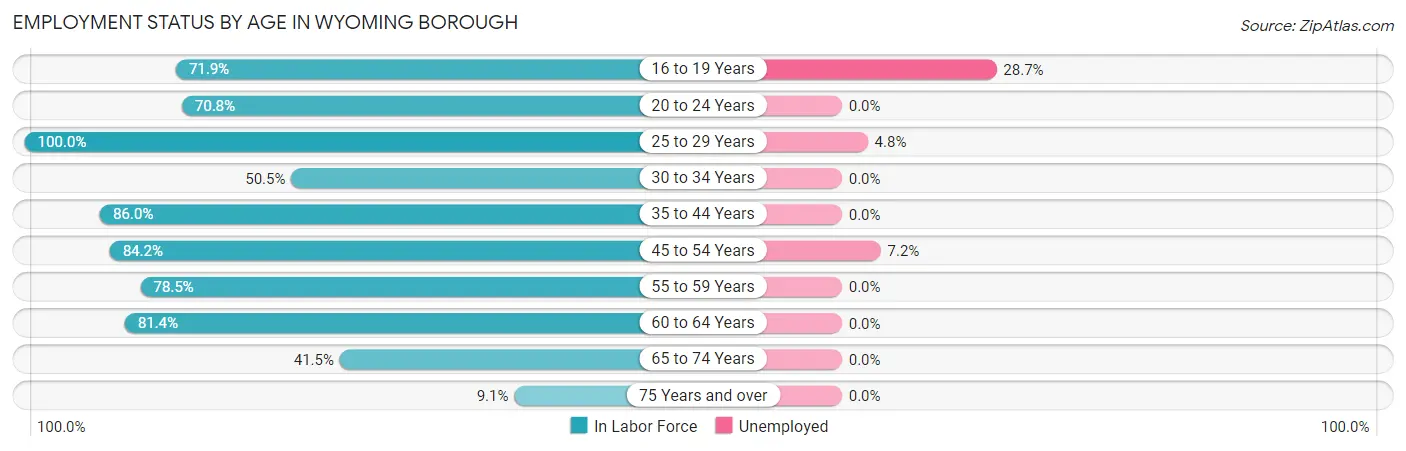
| Age Bracket | In Labor Force | Unemployed |
| 16 to 19 Years | 87 (71.9%) | 25 (28.7%) |
| 20 to 24 Years | 51 (70.8%) | 0 (0.0%) |
| 25 to 29 Years | 207 (100.0%) | 10 (4.8%) |
| 30 to 34 Years | 111 (50.5%) | 0 (0.0%) |
| 35 to 44 Years | 413 (86.0%) | 0 (0.0%) |
| 45 to 54 Years | 363 (84.2%) | 26 (7.2%) |
| 55 to 59 Years | 219 (78.5%) | 0 (0.0%) |
| 60 to 64 Years | 192 (81.4%) | 0 (0.0%) |
| 65 to 74 Years | 132 (41.5%) | 0 (0.0%) |
| 75 Years and over | 31 (9.1%) | 0 (0.0%) |
| Total | 1,805 (66.7%) | 61 (3.4%) |
Employment Status by Educational Attainment in Wyoming borough
According to labor force statistics for Wyoming borough, 81.2% of individuals (1,505) out of the total population between 25 and 64 years of age (1,853) are in the labor force, with 2.4% or 36 of them being unemployed. The group with the highest labor force participation rate are those with the educational attainment of bachelor's degree or higher, with 89.8% or 776 individuals in the labor force. Within the labor force, individuals with less than high school education have the highest percentage of unemployment, with 35.7% or 10 of them being unemployed.
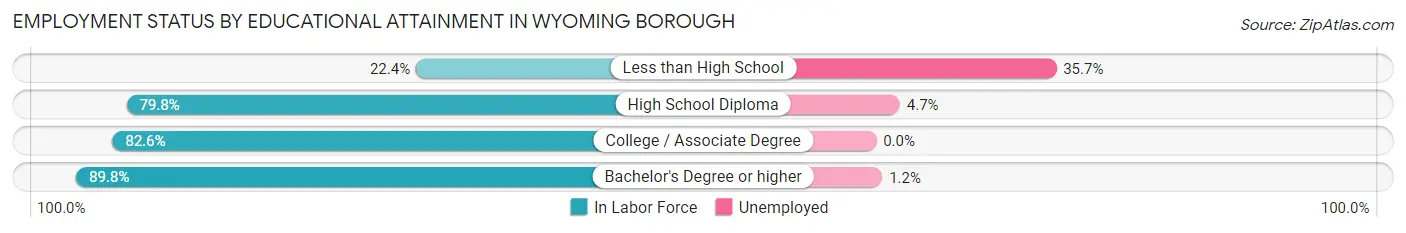
| Educational Attainment | In Labor Force | Unemployed |
| Less than High School | 28 (22.4%) | 45 (35.7%) |
| High School Diploma | 360 (79.8%) | 21 (4.7%) |
| College / Associate Degree | 341 (82.6%) | 0 (0.0%) |
| Bachelor's Degree or higher | 776 (89.8%) | 10 (1.2%) |
| Total | 1,505 (81.2%) | 44 (2.4%) |
Employment Occupations by Sex in Wyoming borough
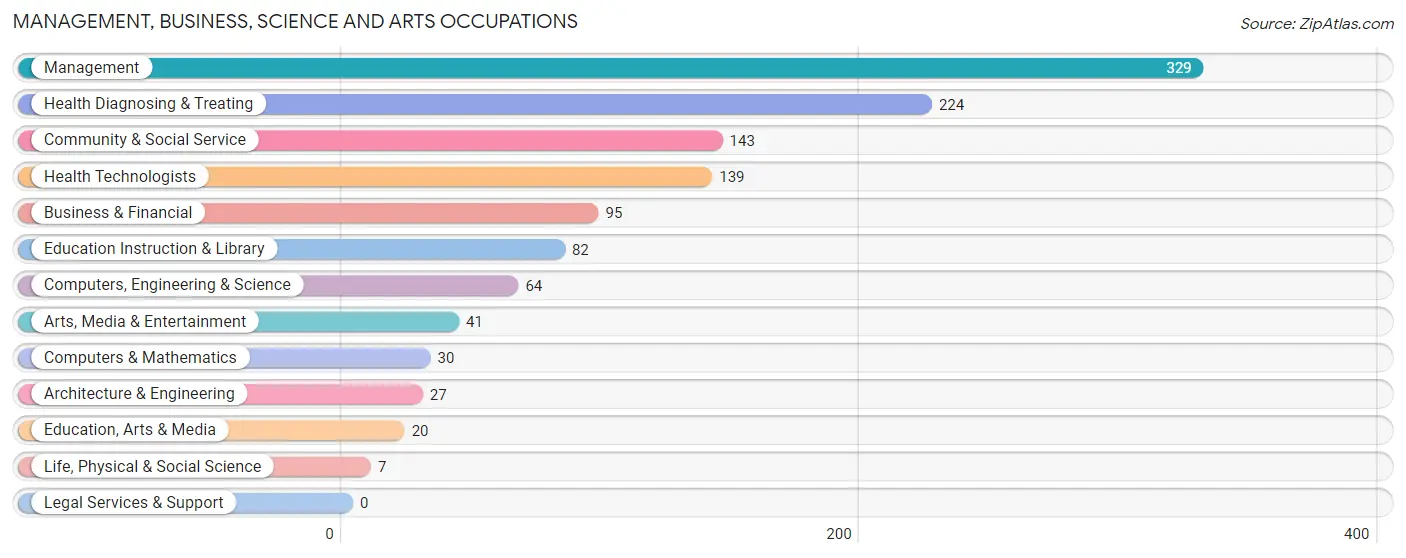
Management, Business, Science and Arts Occupations
The most common Management, Business, Science and Arts occupations in Wyoming borough are Management (329 | 18.9%), Health Diagnosing & Treating (224 | 12.8%), Community & Social Service (143 | 8.2%), Health Technologists (139 | 8.0%), and Business & Financial (95 | 5.4%).
Management, Business, Science and Arts Occupations by Sex
Within the Management, Business, Science and Arts occupations in Wyoming borough, the most male-oriented occupations are Computers & Mathematics (100.0%), Life, Physical & Social Science (100.0%), and Computers, Engineering & Science (87.5%), while the most female-oriented occupations are Education, Arts & Media (100.0%), Arts, Media & Entertainment (100.0%), and Business & Financial (93.7%).
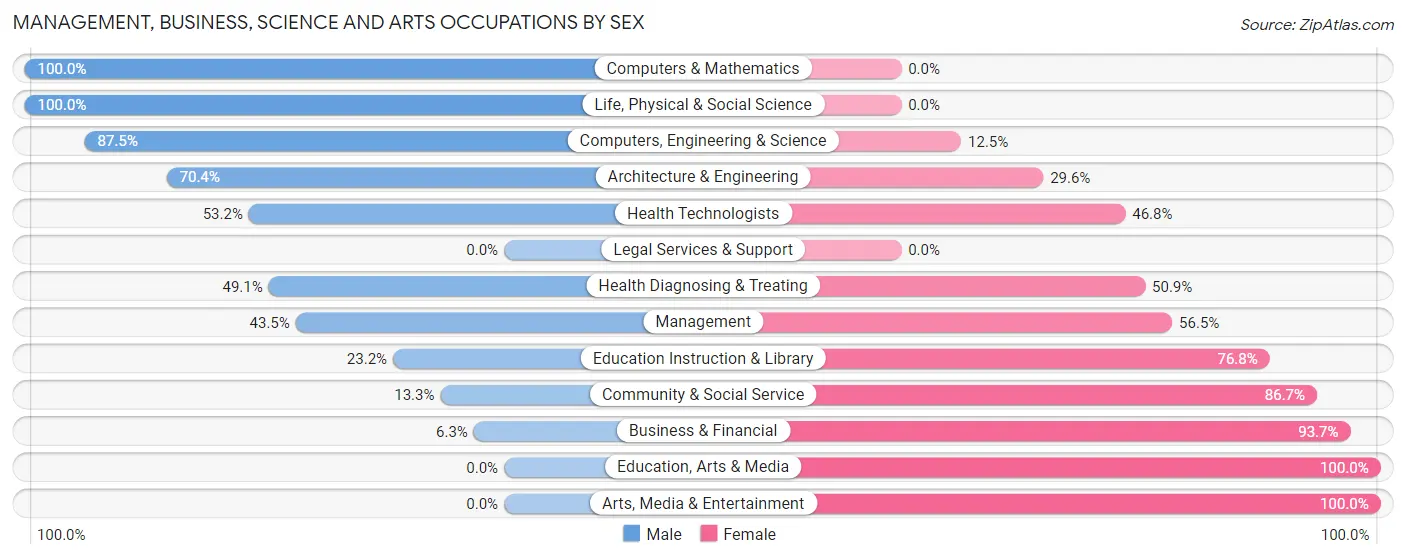
| Occupation | Male | Female |
| Management | 143 (43.5%) | 186 (56.5%) |
| Business & Financial | 6 (6.3%) | 89 (93.7%) |
| Computers, Engineering & Science | 56 (87.5%) | 8 (12.5%) |
| Computers & Mathematics | 30 (100.0%) | 0 (0.0%) |
| Architecture & Engineering | 19 (70.4%) | 8 (29.6%) |
| Life, Physical & Social Science | 7 (100.0%) | 0 (0.0%) |
| Community & Social Service | 19 (13.3%) | 124 (86.7%) |
| Education, Arts & Media | 0 (0.0%) | 20 (100.0%) |
| Legal Services & Support | 0 (0.0%) | 0 (0.0%) |
| Education Instruction & Library | 19 (23.2%) | 63 (76.8%) |
| Arts, Media & Entertainment | 0 (0.0%) | 41 (100.0%) |
| Health Diagnosing & Treating | 110 (49.1%) | 114 (50.9%) |
| Health Technologists | 74 (53.2%) | 65 (46.8%) |
| Total (Category) | 334 (39.1%) | 521 (60.9%) |
| Total (Overall) | 882 (50.5%) | 863 (49.5%) |
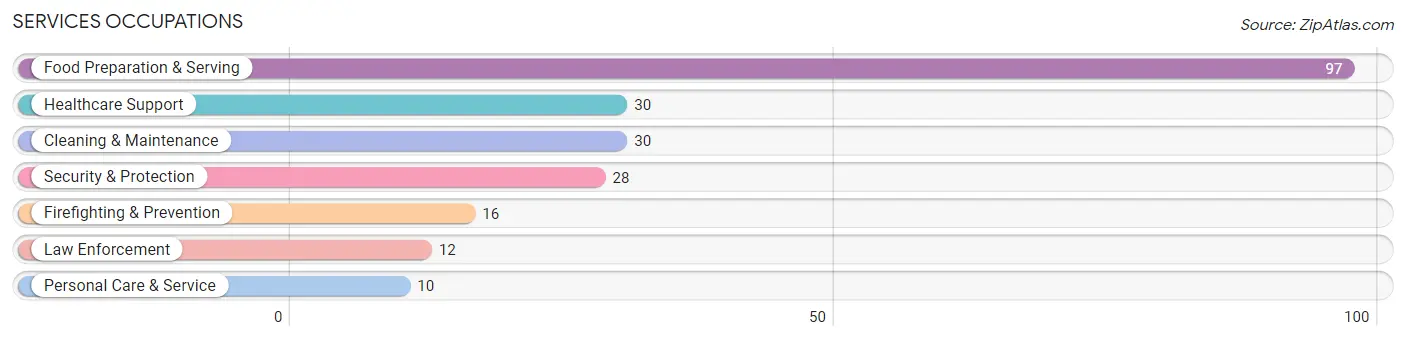
Services Occupations
The most common Services occupations in Wyoming borough are Food Preparation & Serving (97 | 5.6%), Healthcare Support (30 | 1.7%), Cleaning & Maintenance (30 | 1.7%), Security & Protection (28 | 1.6%), and Firefighting & Prevention (16 | 0.9%).
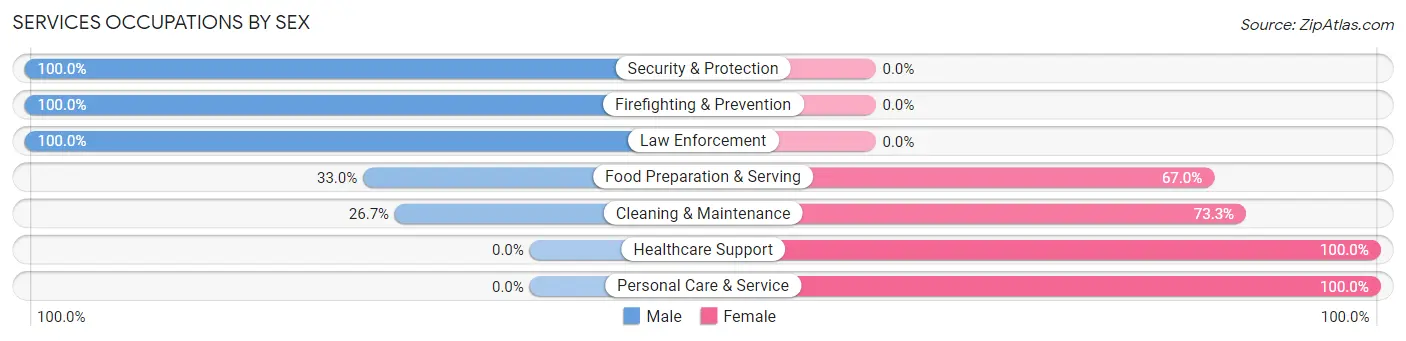
Services Occupations by Sex
Within the Services occupations in Wyoming borough, the most male-oriented occupations are Security & Protection (100.0%), Firefighting & Prevention (100.0%), and Law Enforcement (100.0%), while the most female-oriented occupations are Healthcare Support (100.0%), Personal Care & Service (100.0%), and Cleaning & Maintenance (73.3%).
| Occupation | Male | Female |
| Healthcare Support | 0 (0.0%) | 30 (100.0%) |
| Security & Protection | 28 (100.0%) | 0 (0.0%) |
| Firefighting & Prevention | 16 (100.0%) | 0 (0.0%) |
| Law Enforcement | 12 (100.0%) | 0 (0.0%) |
| Food Preparation & Serving | 32 (33.0%) | 65 (67.0%) |
| Cleaning & Maintenance | 8 (26.7%) | 22 (73.3%) |
| Personal Care & Service | 0 (0.0%) | 10 (100.0%) |
| Total (Category) | 68 (34.9%) | 127 (65.1%) |
| Total (Overall) | 882 (50.5%) | 863 (49.5%) |
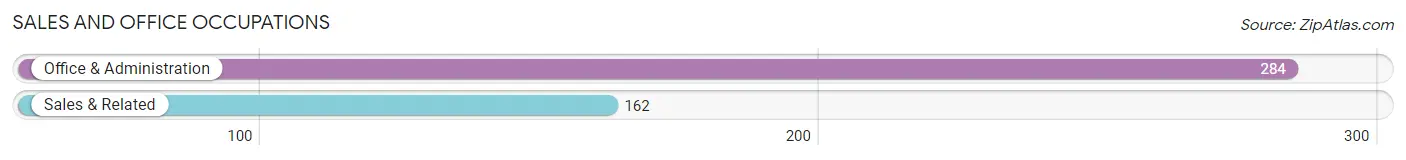
Sales and Office Occupations
The most common Sales and Office occupations in Wyoming borough are Office & Administration (284 | 16.3%), and Sales & Related (162 | 9.3%).
Sales and Office Occupations by Sex

| Occupation | Male | Female |
| Sales & Related | 151 (93.2%) | 11 (6.8%) |
| Office & Administration | 93 (32.8%) | 191 (67.2%) |
| Total (Category) | 244 (54.7%) | 202 (45.3%) |
| Total (Overall) | 882 (50.5%) | 863 (49.5%) |
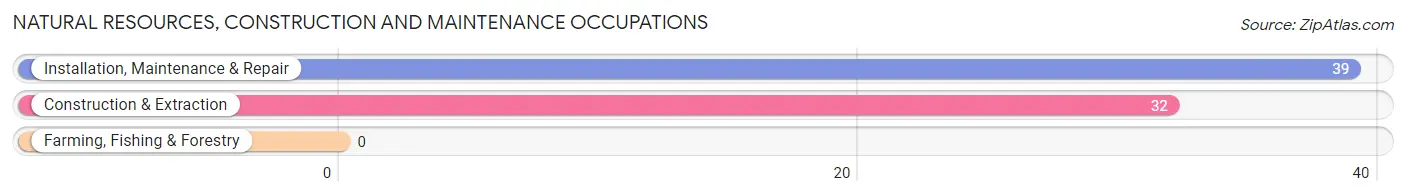
Natural Resources, Construction and Maintenance Occupations
The most common Natural Resources, Construction and Maintenance occupations in Wyoming borough are Installation, Maintenance & Repair (39 | 2.2%), and Construction & Extraction (32 | 1.8%).
Natural Resources, Construction and Maintenance Occupations by Sex
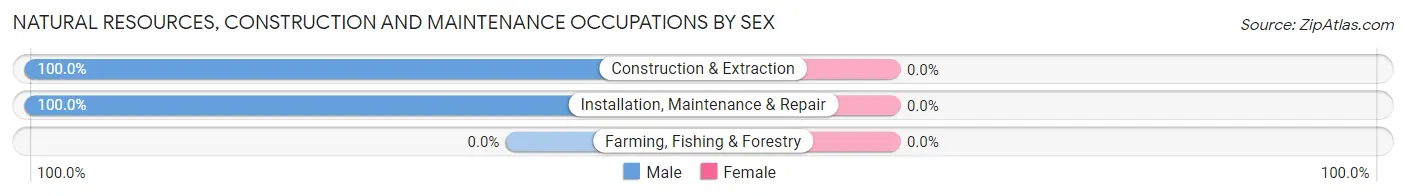
| Occupation | Male | Female |
| Farming, Fishing & Forestry | 0 (0.0%) | 0 (0.0%) |
| Construction & Extraction | 32 (100.0%) | 0 (0.0%) |
| Installation, Maintenance & Repair | 39 (100.0%) | 0 (0.0%) |
| Total (Category) | 71 (100.0%) | 0 (0.0%) |
| Total (Overall) | 882 (50.5%) | 863 (49.5%) |
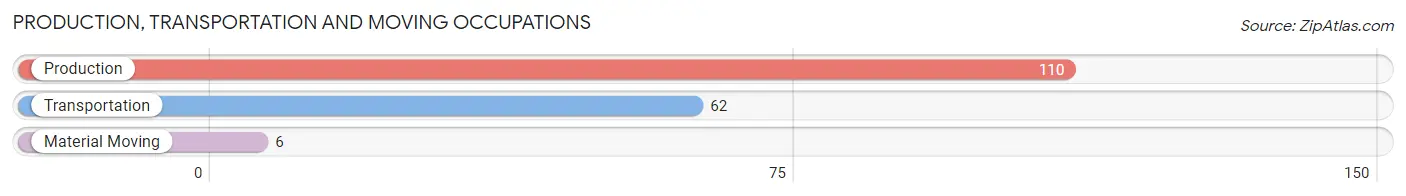
Production, Transportation and Moving Occupations
The most common Production, Transportation and Moving occupations in Wyoming borough are Production (110 | 6.3%), Transportation (62 | 3.5%), and Material Moving (6 | 0.3%).
Production, Transportation and Moving Occupations by Sex
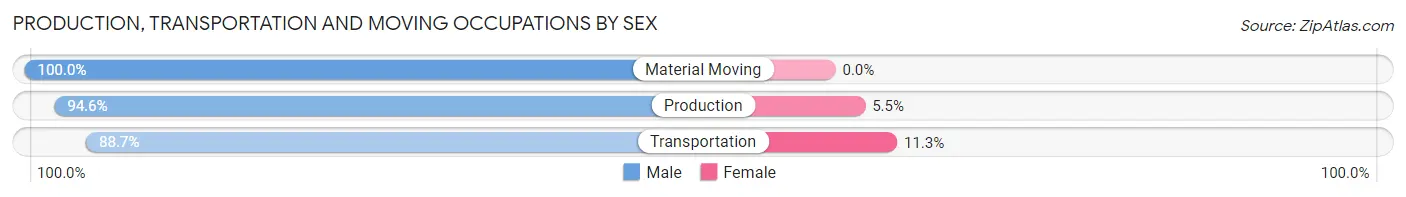
| Occupation | Male | Female |
| Production | 104 (94.6%) | 6 (5.4%) |
| Transportation | 55 (88.7%) | 7 (11.3%) |
| Material Moving | 6 (100.0%) | 0 (0.0%) |
| Total (Category) | 165 (92.7%) | 13 (7.3%) |
| Total (Overall) | 882 (50.5%) | 863 (49.5%) |
Employment Industries by Sex in Wyoming borough
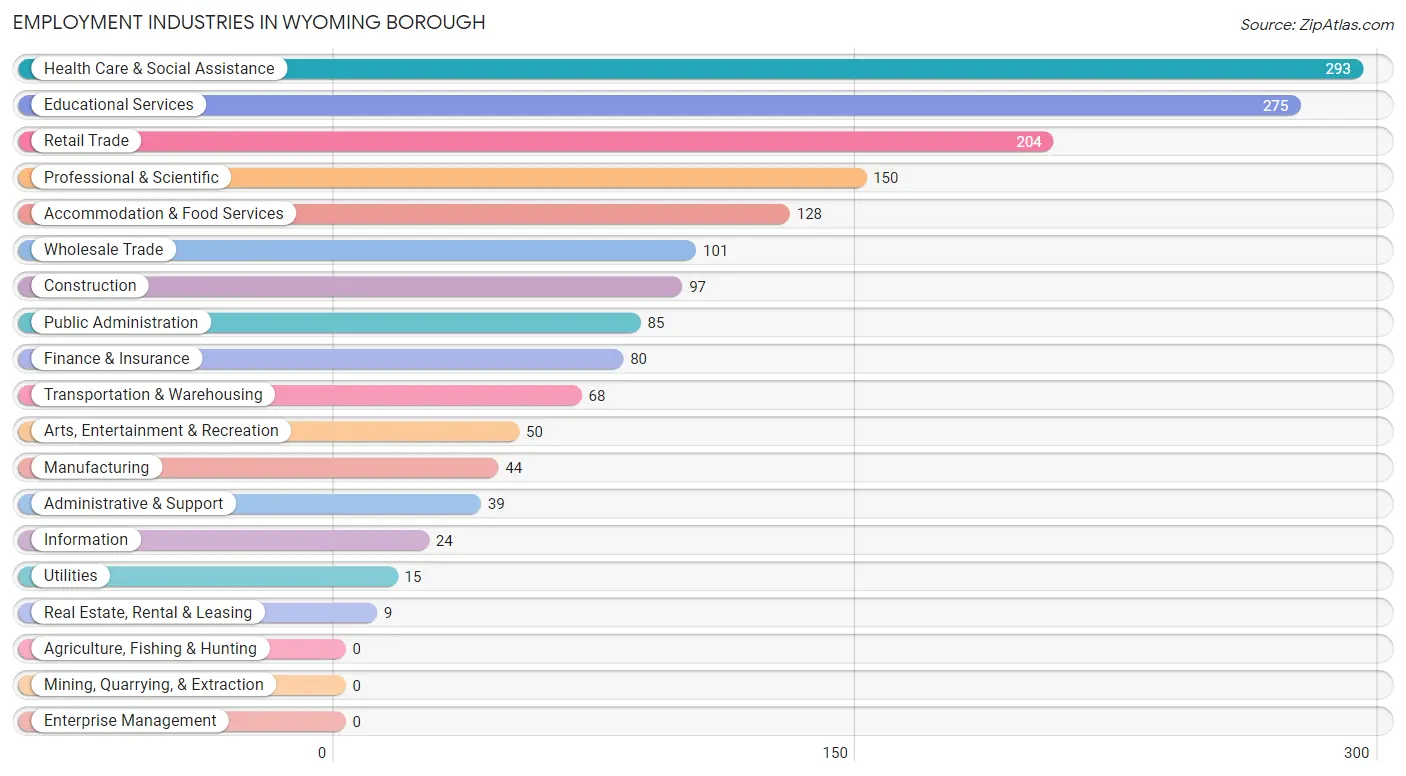
Employment Industries in Wyoming borough
The major employment industries in Wyoming borough include Health Care & Social Assistance (293 | 16.8%), Educational Services (275 | 15.8%), Retail Trade (204 | 11.7%), Professional & Scientific (150 | 8.6%), and Accommodation & Food Services (128 | 7.3%).
Employment Industries by Sex in Wyoming borough
The Wyoming borough industries that see more men than women are Construction (100.0%), Wholesale Trade (100.0%), and Utilities (100.0%), whereas the industries that tend to have a higher number of women are Real Estate, Rental & Leasing (100.0%), Educational Services (88.0%), and Finance & Insurance (85.0%).
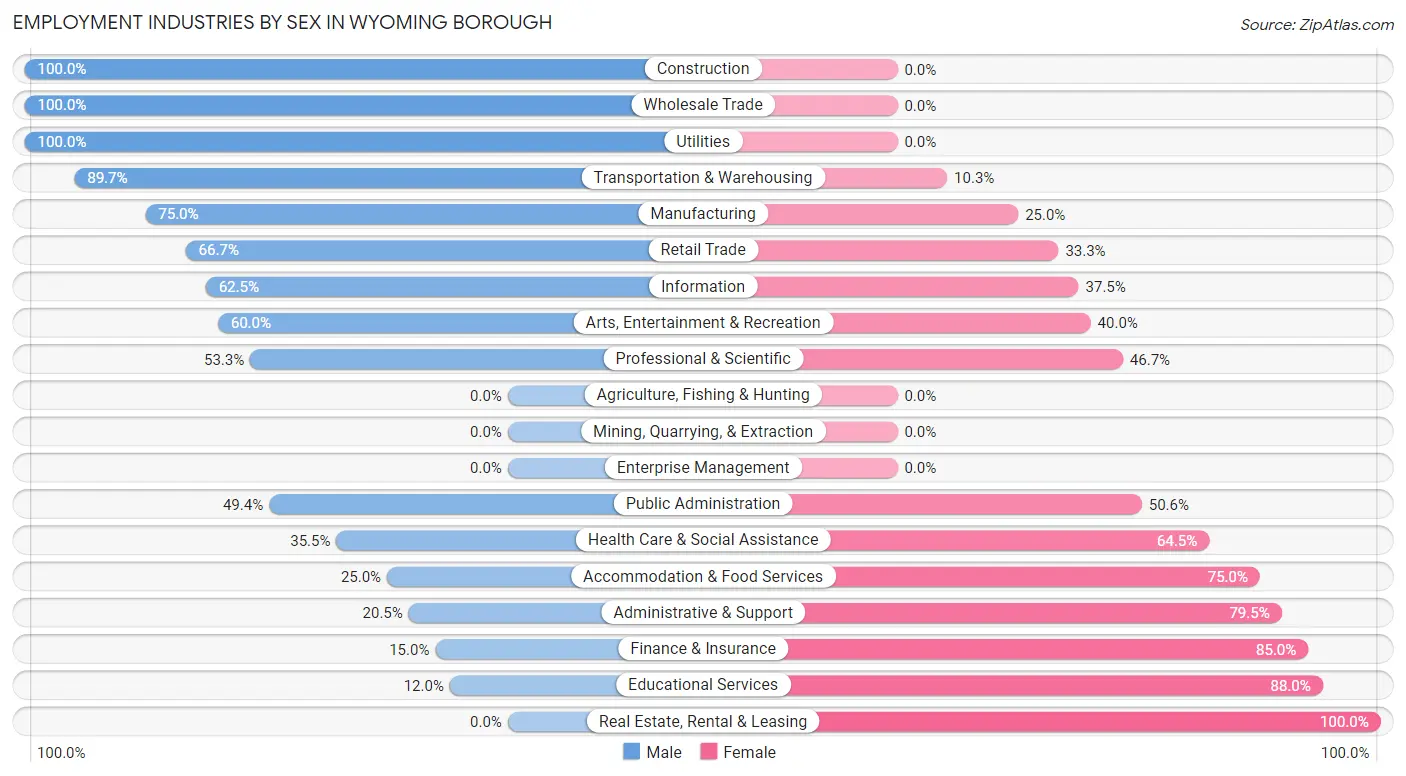
| Industry | Male | Female |
| Agriculture, Fishing & Hunting | 0 (0.0%) | 0 (0.0%) |
| Mining, Quarrying, & Extraction | 0 (0.0%) | 0 (0.0%) |
| Construction | 97 (100.0%) | 0 (0.0%) |
| Manufacturing | 33 (75.0%) | 11 (25.0%) |
| Wholesale Trade | 101 (100.0%) | 0 (0.0%) |
| Retail Trade | 136 (66.7%) | 68 (33.3%) |
| Transportation & Warehousing | 61 (89.7%) | 7 (10.3%) |
| Utilities | 15 (100.0%) | 0 (0.0%) |
| Information | 15 (62.5%) | 9 (37.5%) |
| Finance & Insurance | 12 (15.0%) | 68 (85.0%) |
| Real Estate, Rental & Leasing | 0 (0.0%) | 9 (100.0%) |
| Professional & Scientific | 80 (53.3%) | 70 (46.7%) |
| Enterprise Management | 0 (0.0%) | 0 (0.0%) |
| Administrative & Support | 8 (20.5%) | 31 (79.5%) |
| Educational Services | 33 (12.0%) | 242 (88.0%) |
| Health Care & Social Assistance | 104 (35.5%) | 189 (64.5%) |
| Arts, Entertainment & Recreation | 30 (60.0%) | 20 (40.0%) |
| Accommodation & Food Services | 32 (25.0%) | 96 (75.0%) |
| Public Administration | 42 (49.4%) | 43 (50.6%) |
| Total | 882 (50.5%) | 863 (49.5%) |
Education in Wyoming borough
School Enrollment in Wyoming borough
The most common levels of schooling among the 795 students in Wyoming borough are graduate / professional (269 | 33.8%), middle school (210 | 26.4%), and high school (128 | 16.1%).
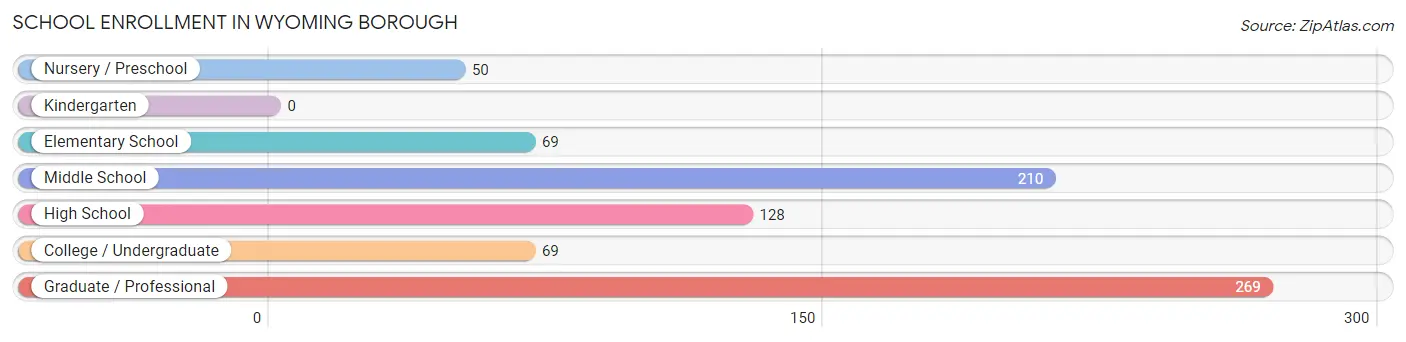
| School Level | # Students | % Students |
| Nursery / Preschool | 50 | 6.3% |
| Kindergarten | 0 | 0.0% |
| Elementary School | 69 | 8.7% |
| Middle School | 210 | 26.4% |
| High School | 128 | 16.1% |
| College / Undergraduate | 69 | 8.7% |
| Graduate / Professional | 269 | 33.8% |
| Total | 795 | 100.0% |
School Enrollment by Age by Funding Source in Wyoming borough
Out of a total of 795 students who are enrolled in schools in Wyoming borough, 333 (41.9%) attend a private institution, while the remaining 462 (58.1%) are enrolled in public schools. The age group of 25 to 34 year olds has the highest likelihood of being enrolled in private schools, with 178 (75.4% in the age bracket) enrolled. Conversely, the age group of 5 to 9 year old has the lowest likelihood of being enrolled in a private school, with 69 (100.0% in the age bracket) attending a public institution.
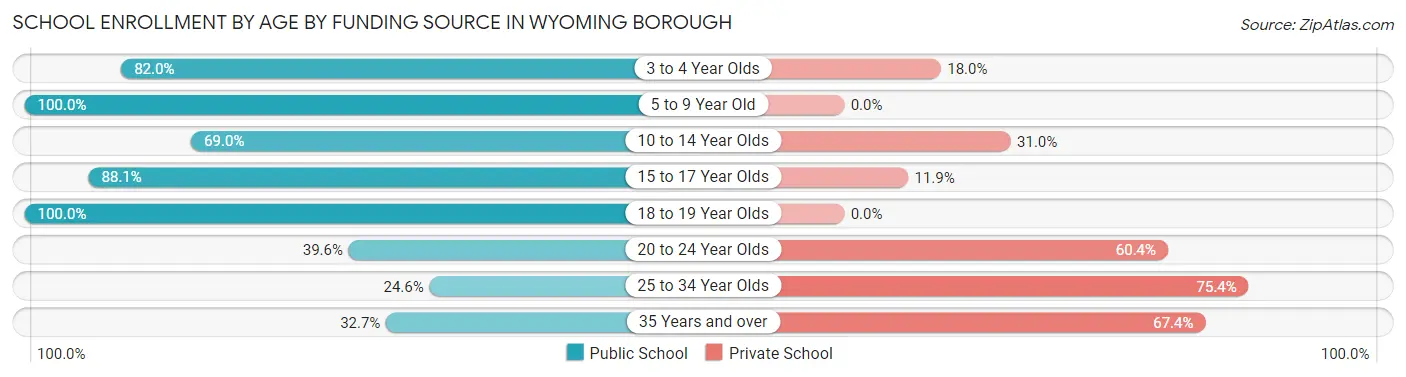
| Age Bracket | Public School | Private School |
| 3 to 4 Year Olds | 41 (82.0%) | 9 (18.0%) |
| 5 to 9 Year Old | 69 (100.0%) | 0 (0.0%) |
| 10 to 14 Year Olds | 158 (69.0%) | 71 (31.0%) |
| 15 to 17 Year Olds | 74 (88.1%) | 10 (11.9%) |
| 18 to 19 Year Olds | 25 (100.0%) | 0 (0.0%) |
| 20 to 24 Year Olds | 21 (39.6%) | 32 (60.4%) |
| 25 to 34 Year Olds | 58 (24.6%) | 178 (75.4%) |
| 35 Years and over | 16 (32.7%) | 33 (67.3%) |
| Total | 462 (58.1%) | 333 (41.9%) |
Educational Attainment by Field of Study in Wyoming borough
Education (411 | 35.4%), science & technology (185 | 15.9%), liberal arts & history (93 | 8.0%), engineering (89 | 7.7%), and social sciences (87 | 7.5%) are the most common fields of study among 1,161 individuals in Wyoming borough who have obtained a bachelor's degree or higher.
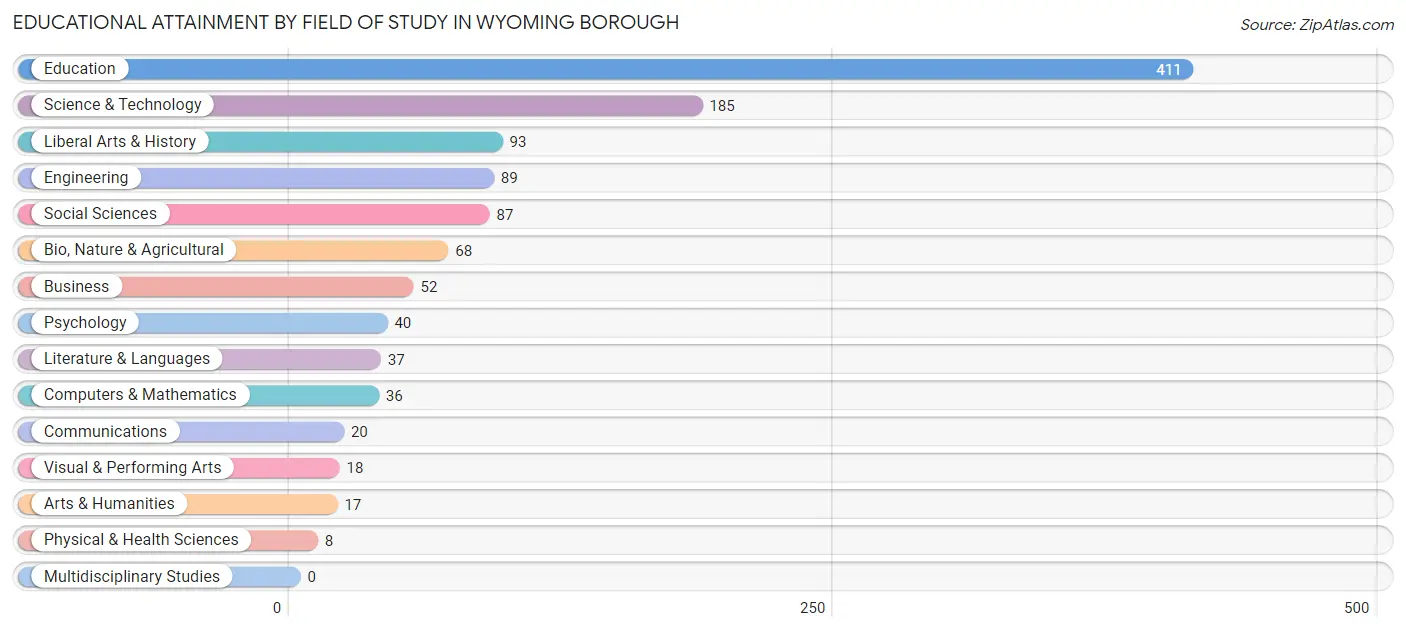
| Field of Study | # Graduates | % Graduates |
| Computers & Mathematics | 36 | 3.1% |
| Bio, Nature & Agricultural | 68 | 5.9% |
| Physical & Health Sciences | 8 | 0.7% |
| Psychology | 40 | 3.5% |
| Social Sciences | 87 | 7.5% |
| Engineering | 89 | 7.7% |
| Multidisciplinary Studies | 0 | 0.0% |
| Science & Technology | 185 | 15.9% |
| Business | 52 | 4.5% |
| Education | 411 | 35.4% |
| Literature & Languages | 37 | 3.2% |
| Liberal Arts & History | 93 | 8.0% |
| Visual & Performing Arts | 18 | 1.5% |
| Communications | 20 | 1.7% |
| Arts & Humanities | 17 | 1.5% |
| Total | 1,161 | 100.0% |
Transportation & Commute in Wyoming borough
Vehicle Availability by Sex in Wyoming borough
The most prevalent vehicle ownership categories in Wyoming borough are males with 2 vehicles (485, accounting for 55.0%) and females with 2 vehicles (411, making up 56.7%).
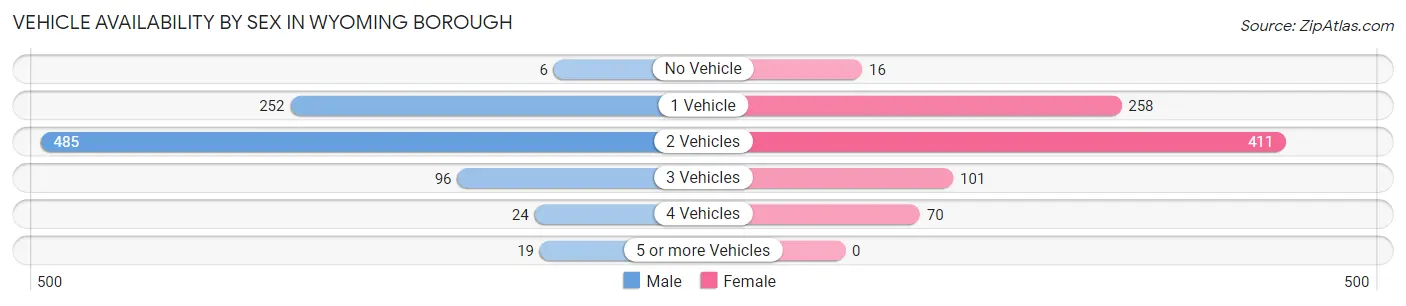
| Vehicles Available | Male | Female |
| No Vehicle | 6 (0.7%) | 16 (1.9%) |
| 1 Vehicle | 252 (28.6%) | 258 (30.1%) |
| 2 Vehicles | 485 (55.0%) | 411 (48.0%) |
| 3 Vehicles | 96 (10.9%) | 101 (11.8%) |
| 4 Vehicles | 24 (2.7%) | 70 (8.2%) |
| 5 or more Vehicles | 19 (2.1%) | 0 (0.0%) |
| Total | 882 (100.0%) | 856 (100.0%) |
Commute Time in Wyoming borough
The most frequently occuring commute durations in Wyoming borough are 15 to 19 minutes (367 commuters, 24.6%), 20 to 24 minutes (329 commuters, 22.1%), and 10 to 14 minutes (212 commuters, 14.2%).
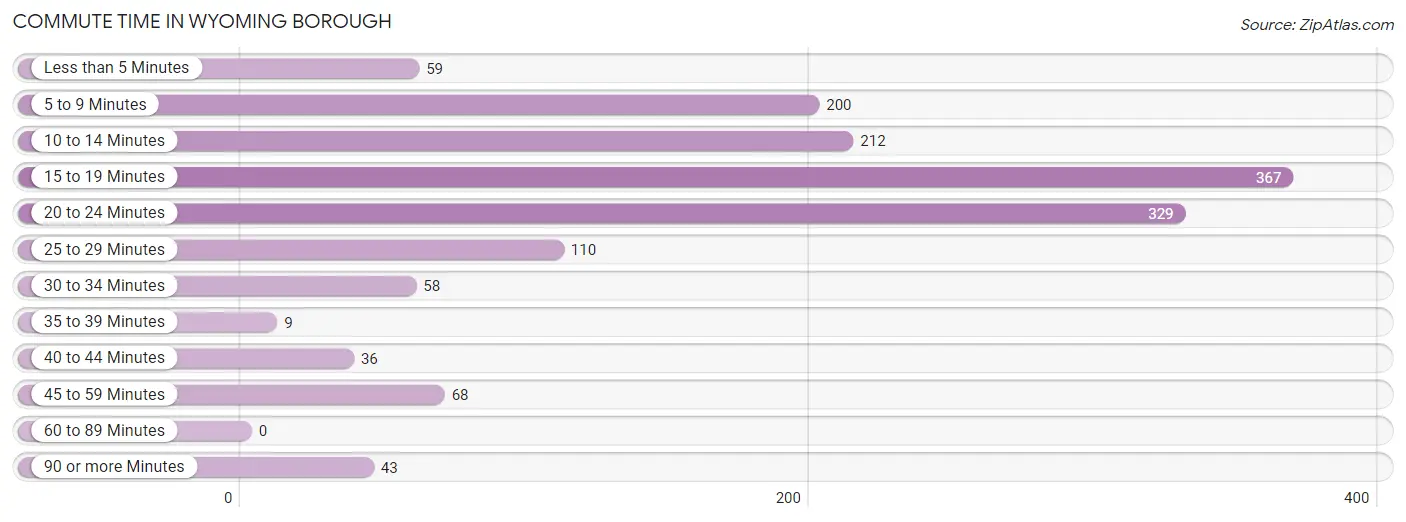
| Commute Time | # Commuters | % Commuters |
| Less than 5 Minutes | 59 | 4.0% |
| 5 to 9 Minutes | 200 | 13.4% |
| 10 to 14 Minutes | 212 | 14.2% |
| 15 to 19 Minutes | 367 | 24.6% |
| 20 to 24 Minutes | 329 | 22.1% |
| 25 to 29 Minutes | 110 | 7.4% |
| 30 to 34 Minutes | 58 | 3.9% |
| 35 to 39 Minutes | 9 | 0.6% |
| 40 to 44 Minutes | 36 | 2.4% |
| 45 to 59 Minutes | 68 | 4.6% |
| 60 to 89 Minutes | 0 | 0.0% |
| 90 or more Minutes | 43 | 2.9% |
Commute Time by Sex in Wyoming borough
The most common commute times in Wyoming borough are 20 to 24 minutes (169 commuters, 20.0%) for males and 15 to 19 minutes (210 commuters, 32.5%) for females.
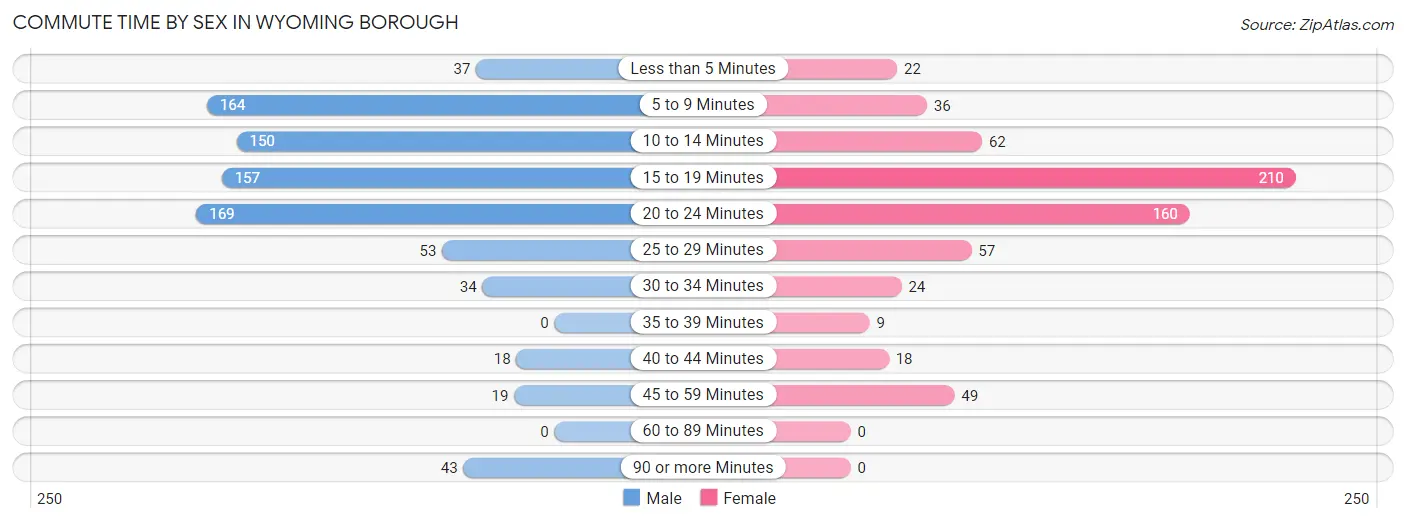
| Commute Time | Male | Female |
| Less than 5 Minutes | 37 (4.4%) | 22 (3.4%) |
| 5 to 9 Minutes | 164 (19.4%) | 36 (5.6%) |
| 10 to 14 Minutes | 150 (17.8%) | 62 (9.6%) |
| 15 to 19 Minutes | 157 (18.6%) | 210 (32.5%) |
| 20 to 24 Minutes | 169 (20.0%) | 160 (24.7%) |
| 25 to 29 Minutes | 53 (6.3%) | 57 (8.8%) |
| 30 to 34 Minutes | 34 (4.0%) | 24 (3.7%) |
| 35 to 39 Minutes | 0 (0.0%) | 9 (1.4%) |
| 40 to 44 Minutes | 18 (2.1%) | 18 (2.8%) |
| 45 to 59 Minutes | 19 (2.2%) | 49 (7.6%) |
| 60 to 89 Minutes | 0 (0.0%) | 0 (0.0%) |
| 90 or more Minutes | 43 (5.1%) | 0 (0.0%) |
Time of Departure to Work by Sex in Wyoming borough
The most frequent times of departure to work in Wyoming borough are 5:30 AM to 5:59 AM (174, 20.6%) for males and 8:30 AM to 8:59 AM (127, 19.6%) for females.
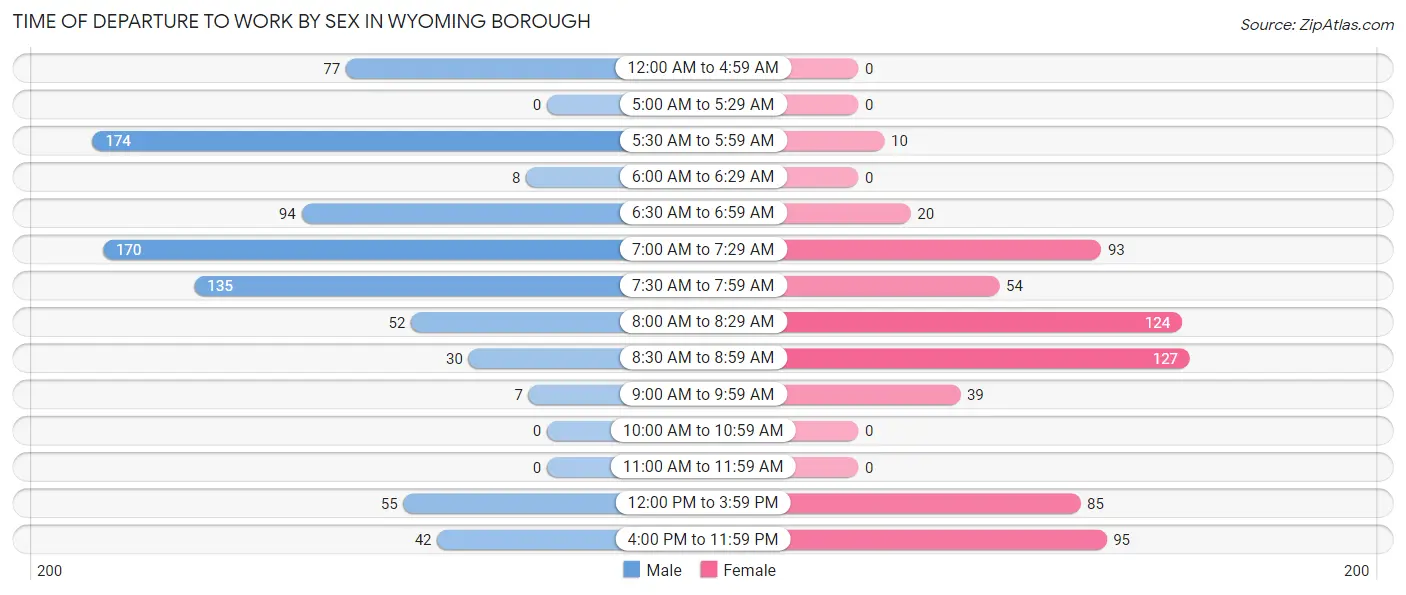
| Time of Departure | Male | Female |
| 12:00 AM to 4:59 AM | 77 (9.1%) | 0 (0.0%) |
| 5:00 AM to 5:29 AM | 0 (0.0%) | 0 (0.0%) |
| 5:30 AM to 5:59 AM | 174 (20.6%) | 10 (1.5%) |
| 6:00 AM to 6:29 AM | 8 (0.9%) | 0 (0.0%) |
| 6:30 AM to 6:59 AM | 94 (11.1%) | 20 (3.1%) |
| 7:00 AM to 7:29 AM | 170 (20.1%) | 93 (14.4%) |
| 7:30 AM to 7:59 AM | 135 (16.0%) | 54 (8.4%) |
| 8:00 AM to 8:29 AM | 52 (6.2%) | 124 (19.2%) |
| 8:30 AM to 8:59 AM | 30 (3.5%) | 127 (19.6%) |
| 9:00 AM to 9:59 AM | 7 (0.8%) | 39 (6.0%) |
| 10:00 AM to 10:59 AM | 0 (0.0%) | 0 (0.0%) |
| 11:00 AM to 11:59 AM | 0 (0.0%) | 0 (0.0%) |
| 12:00 PM to 3:59 PM | 55 (6.5%) | 85 (13.1%) |
| 4:00 PM to 11:59 PM | 42 (5.0%) | 95 (14.7%) |
| Total | 844 (100.0%) | 647 (100.0%) |
Housing Occupancy in Wyoming borough
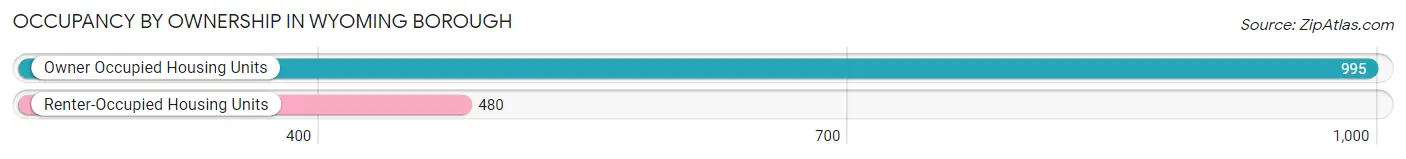
Occupancy by Ownership in Wyoming borough
Of the total 1,475 dwellings in Wyoming borough, owner-occupied units account for 995 (67.5%), while renter-occupied units make up 480 (32.5%).
| Occupancy | # Housing Units | % Housing Units |
| Owner Occupied Housing Units | 995 | 67.5% |
| Renter-Occupied Housing Units | 480 | 32.5% |
| Total Occupied Housing Units | 1,475 | 100.0% |
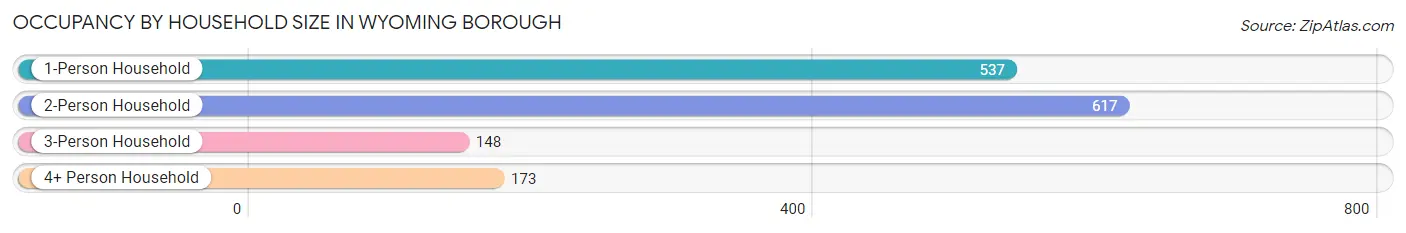
Occupancy by Household Size in Wyoming borough
| Household Size | # Housing Units | % Housing Units |
| 1-Person Household | 537 | 36.4% |
| 2-Person Household | 617 | 41.8% |
| 3-Person Household | 148 | 10.0% |
| 4+ Person Household | 173 | 11.7% |
| Total Housing Units | 1,475 | 100.0% |
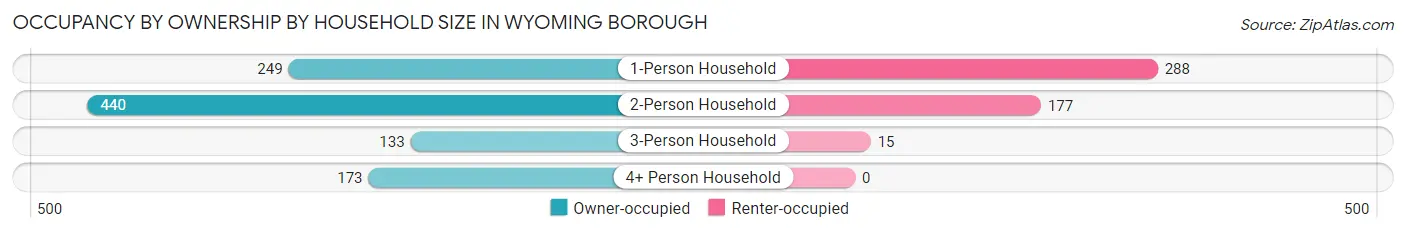
Occupancy by Ownership by Household Size in Wyoming borough
| Household Size | Owner-occupied | Renter-occupied |
| 1-Person Household | 249 (46.4%) | 288 (53.6%) |
| 2-Person Household | 440 (71.3%) | 177 (28.7%) |
| 3-Person Household | 133 (89.9%) | 15 (10.1%) |
| 4+ Person Household | 173 (100.0%) | 0 (0.0%) |
| Total Housing Units | 995 (67.5%) | 480 (32.5%) |
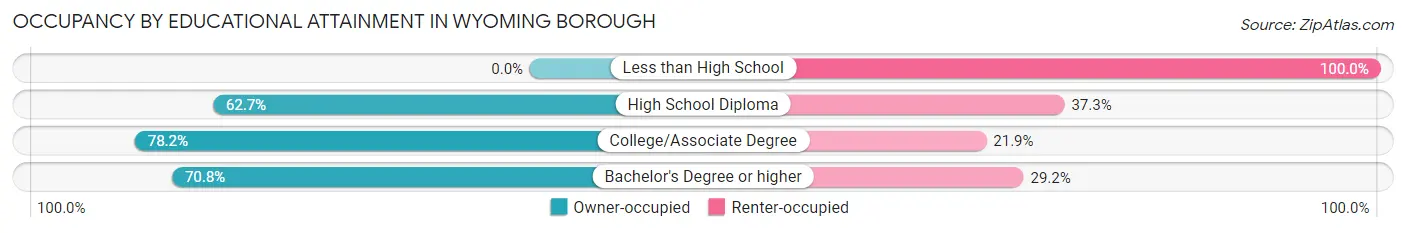
Occupancy by Educational Attainment in Wyoming borough
| Household Size | Owner-occupied | Renter-occupied |
| Less than High School | 0 (0.0%) | 42 (100.0%) |
| High School Diploma | 334 (62.7%) | 199 (37.3%) |
| College/Associate Degree | 254 (78.1%) | 71 (21.8%) |
| Bachelor's Degree or higher | 407 (70.8%) | 168 (29.2%) |
Occupancy by Age of Householder in Wyoming borough
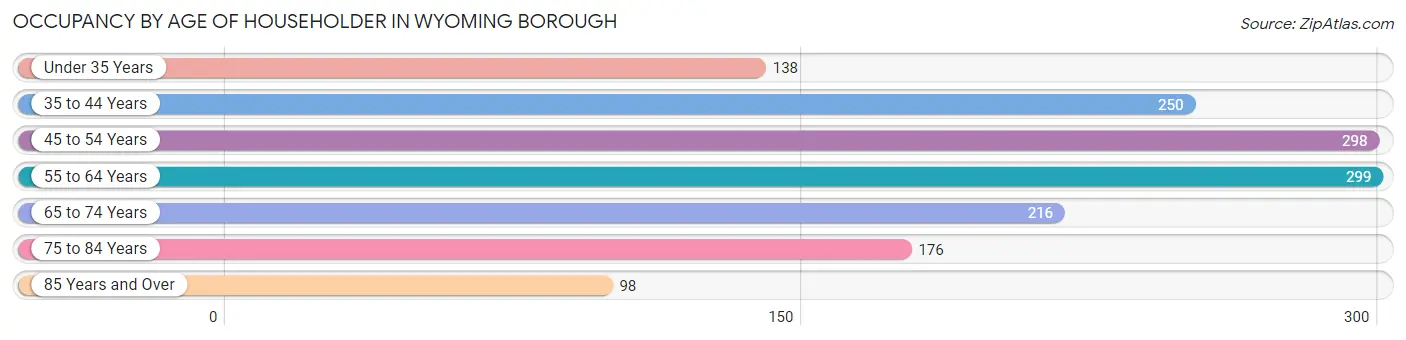
| Age Bracket | # Households | % Households |
| Under 35 Years | 138 | 9.4% |
| 35 to 44 Years | 250 | 17.0% |
| 45 to 54 Years | 298 | 20.2% |
| 55 to 64 Years | 299 | 20.3% |
| 65 to 74 Years | 216 | 14.6% |
| 75 to 84 Years | 176 | 11.9% |
| 85 Years and Over | 98 | 6.6% |
| Total | 1,475 | 100.0% |
Housing Finances in Wyoming borough
Median Income by Occupancy in Wyoming borough
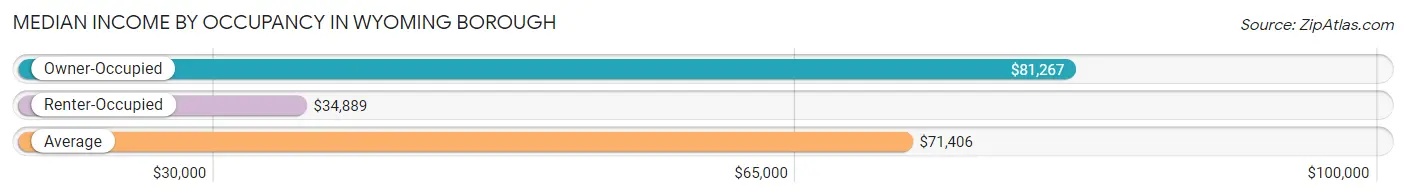
| Occupancy Type | # Households | Median Income |
| Owner-Occupied | 995 (67.5%) | $81,267 |
| Renter-Occupied | 480 (32.5%) | $34,889 |
| Average | 1,475 (100.0%) | $71,406 |
Occupancy by Householder Income Bracket in Wyoming borough
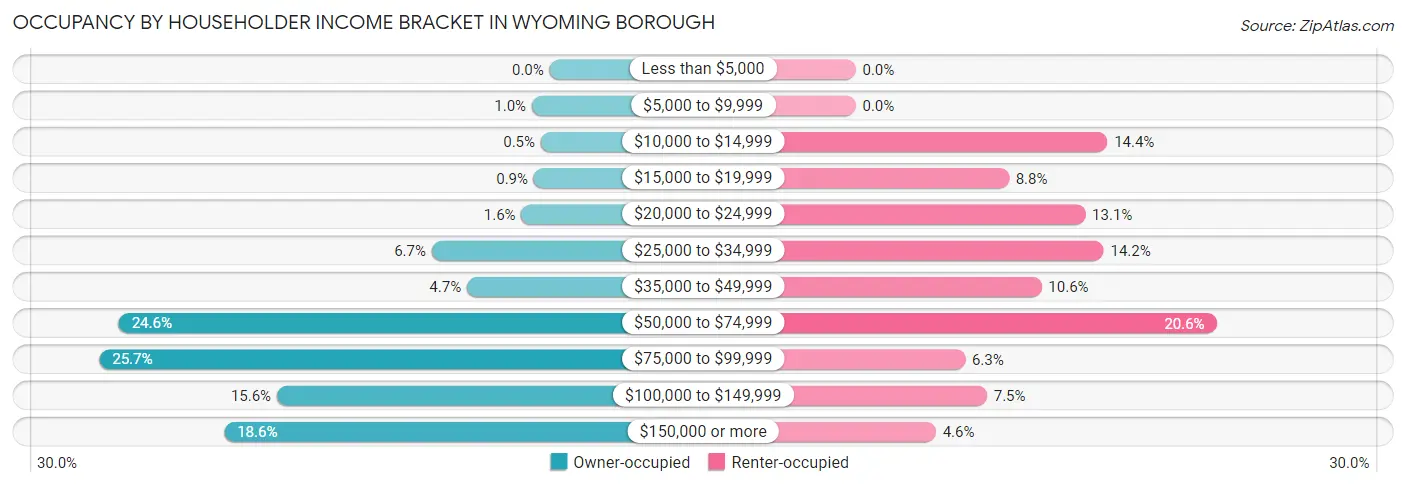
| Income Bracket | Owner-occupied | Renter-occupied |
| Less than $5,000 | 0 (0.0%) | 0 (0.0%) |
| $5,000 to $9,999 | 10 (1.0%) | 0 (0.0%) |
| $10,000 to $14,999 | 5 (0.5%) | 69 (14.4%) |
| $15,000 to $19,999 | 9 (0.9%) | 42 (8.7%) |
| $20,000 to $24,999 | 16 (1.6%) | 63 (13.1%) |
| $25,000 to $34,999 | 67 (6.7%) | 68 (14.2%) |
| $35,000 to $49,999 | 47 (4.7%) | 51 (10.6%) |
| $50,000 to $74,999 | 245 (24.6%) | 99 (20.6%) |
| $75,000 to $99,999 | 256 (25.7%) | 30 (6.2%) |
| $100,000 to $149,999 | 155 (15.6%) | 36 (7.5%) |
| $150,000 or more | 185 (18.6%) | 22 (4.6%) |
| Total | 995 (100.0%) | 480 (100.0%) |
Monthly Housing Cost Tiers in Wyoming borough
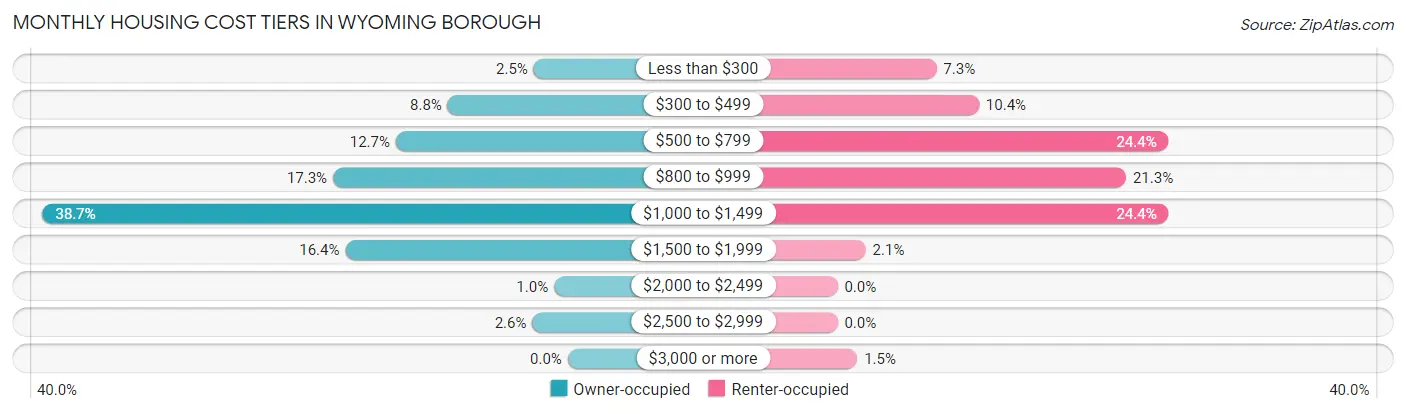
| Monthly Cost | Owner-occupied | Renter-occupied |
| Less than $300 | 25 (2.5%) | 35 (7.3%) |
| $300 to $499 | 88 (8.8%) | 50 (10.4%) |
| $500 to $799 | 126 (12.7%) | 117 (24.4%) |
| $800 to $999 | 172 (17.3%) | 102 (21.2%) |
| $1,000 to $1,499 | 385 (38.7%) | 117 (24.4%) |
| $1,500 to $1,999 | 163 (16.4%) | 10 (2.1%) |
| $2,000 to $2,499 | 10 (1.0%) | 0 (0.0%) |
| $2,500 to $2,999 | 26 (2.6%) | 0 (0.0%) |
| $3,000 or more | 0 (0.0%) | 7 (1.5%) |
| Total | 995 (100.0%) | 480 (100.0%) |
Physical Housing Characteristics in Wyoming borough
Housing Structures in Wyoming borough
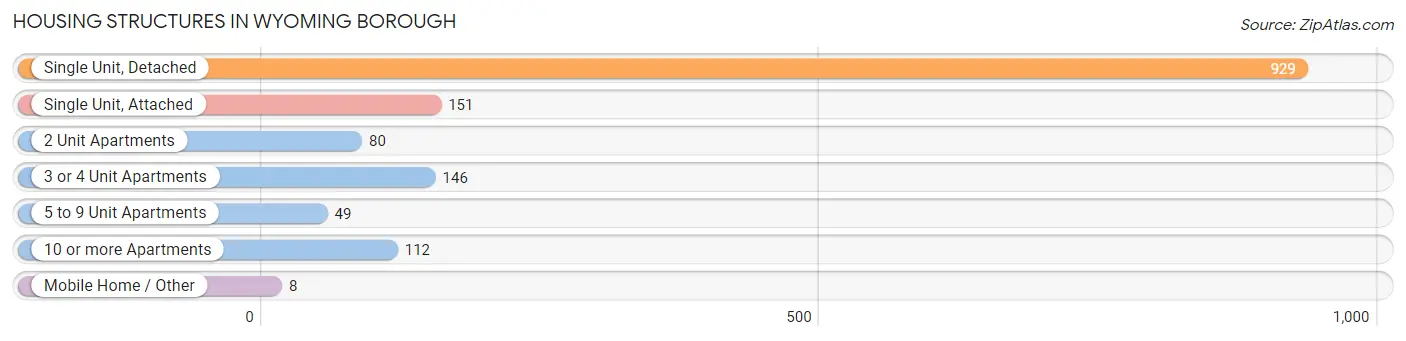
| Structure Type | # Housing Units | % Housing Units |
| Single Unit, Detached | 929 | 63.0% |
| Single Unit, Attached | 151 | 10.2% |
| 2 Unit Apartments | 80 | 5.4% |
| 3 or 4 Unit Apartments | 146 | 9.9% |
| 5 to 9 Unit Apartments | 49 | 3.3% |
| 10 or more Apartments | 112 | 7.6% |
| Mobile Home / Other | 8 | 0.5% |
| Total | 1,475 | 100.0% |
Housing Structures by Occupancy in Wyoming borough
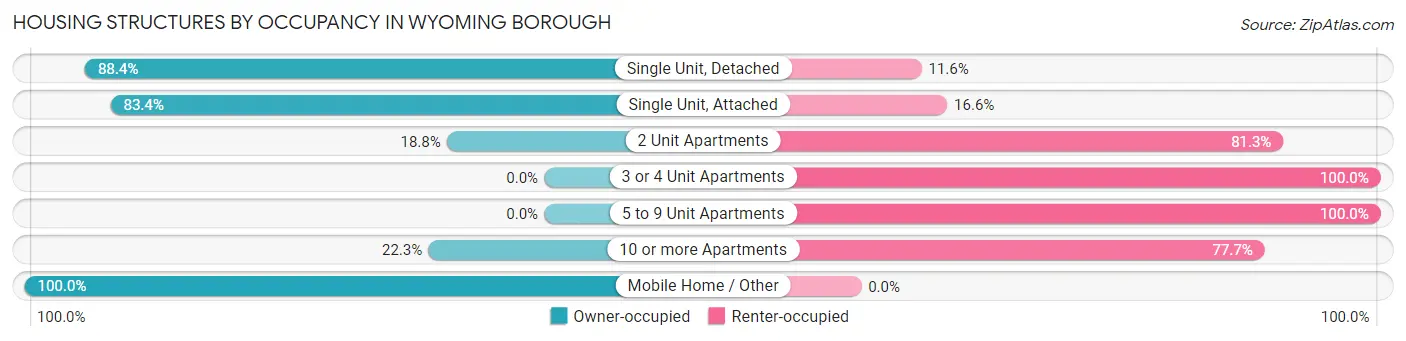
| Structure Type | Owner-occupied | Renter-occupied |
| Single Unit, Detached | 821 (88.4%) | 108 (11.6%) |
| Single Unit, Attached | 126 (83.4%) | 25 (16.6%) |
| 2 Unit Apartments | 15 (18.8%) | 65 (81.2%) |
| 3 or 4 Unit Apartments | 0 (0.0%) | 146 (100.0%) |
| 5 to 9 Unit Apartments | 0 (0.0%) | 49 (100.0%) |
| 10 or more Apartments | 25 (22.3%) | 87 (77.7%) |
| Mobile Home / Other | 8 (100.0%) | 0 (0.0%) |
| Total | 995 (67.5%) | 480 (32.5%) |
Housing Structures by Number of Rooms in Wyoming borough
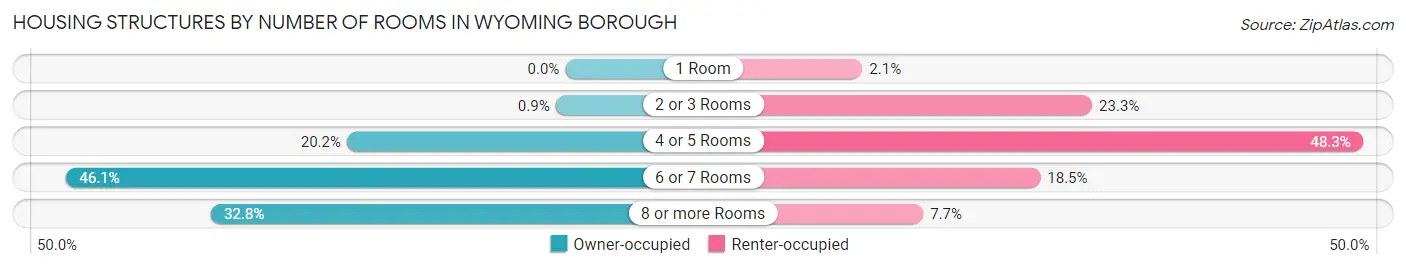
| Number of Rooms | Owner-occupied | Renter-occupied |
| 1 Room | 0 (0.0%) | 10 (2.1%) |
| 2 or 3 Rooms | 9 (0.9%) | 112 (23.3%) |
| 4 or 5 Rooms | 201 (20.2%) | 232 (48.3%) |
| 6 or 7 Rooms | 459 (46.1%) | 89 (18.5%) |
| 8 or more Rooms | 326 (32.8%) | 37 (7.7%) |
| Total | 995 (100.0%) | 480 (100.0%) |
Housing Structure by Heating Type in Wyoming borough
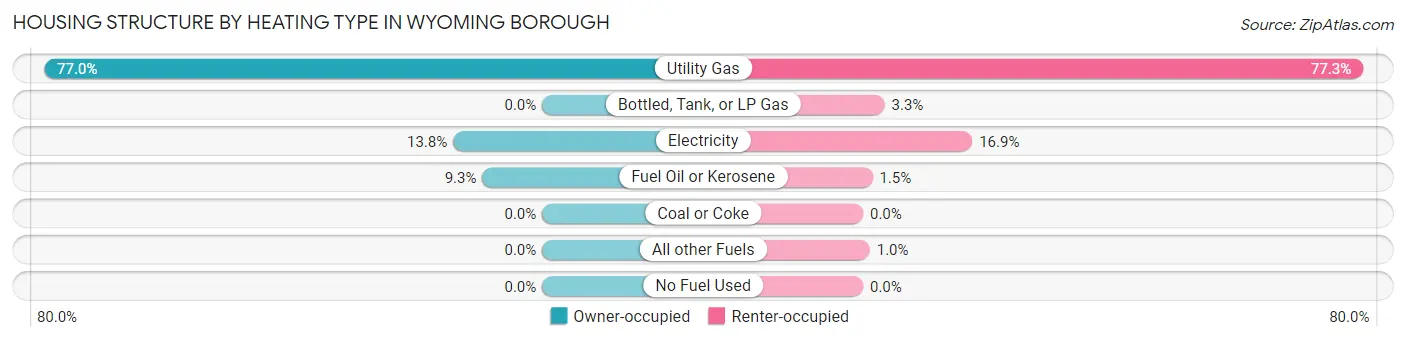
| Heating Type | Owner-occupied | Renter-occupied |
| Utility Gas | 766 (77.0%) | 371 (77.3%) |
| Bottled, Tank, or LP Gas | 0 (0.0%) | 16 (3.3%) |
| Electricity | 137 (13.8%) | 81 (16.9%) |
| Fuel Oil or Kerosene | 92 (9.2%) | 7 (1.5%) |
| Coal or Coke | 0 (0.0%) | 0 (0.0%) |
| All other Fuels | 0 (0.0%) | 5 (1.0%) |
| No Fuel Used | 0 (0.0%) | 0 (0.0%) |
| Total | 995 (100.0%) | 480 (100.0%) |
Household Vehicle Usage in Wyoming borough
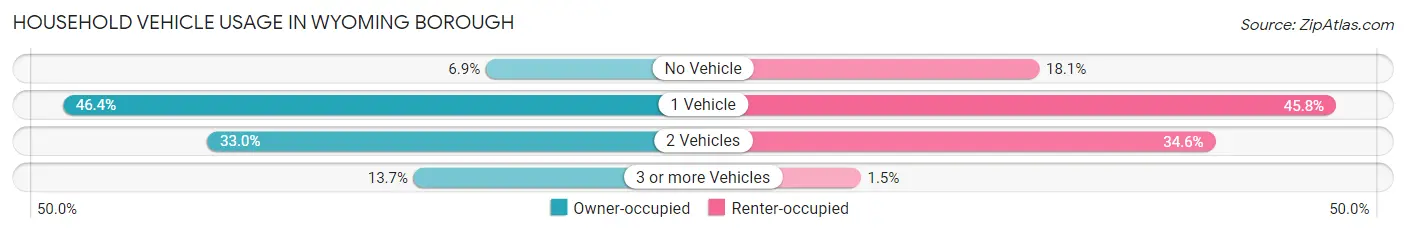
| Vehicles per Household | Owner-occupied | Renter-occupied |
| No Vehicle | 69 (6.9%) | 87 (18.1%) |
| 1 Vehicle | 462 (46.4%) | 220 (45.8%) |
| 2 Vehicles | 328 (33.0%) | 166 (34.6%) |
| 3 or more Vehicles | 136 (13.7%) | 7 (1.5%) |
| Total | 995 (100.0%) | 480 (100.0%) |
Real Estate & Mortgages in Wyoming borough
Real Estate and Mortgage Overview in Wyoming borough
| Characteristic | Without Mortgage | With Mortgage |
| Housing Units | 293 | 702 |
| Median Property Value | $178,800 | $145,500 |
| Median Household Income | $79,850 | $112 |
| Monthly Housing Costs | $646 | $0 |
| Real Estate Taxes | $2,696 | $0 |
Property Value by Mortgage Status in Wyoming borough
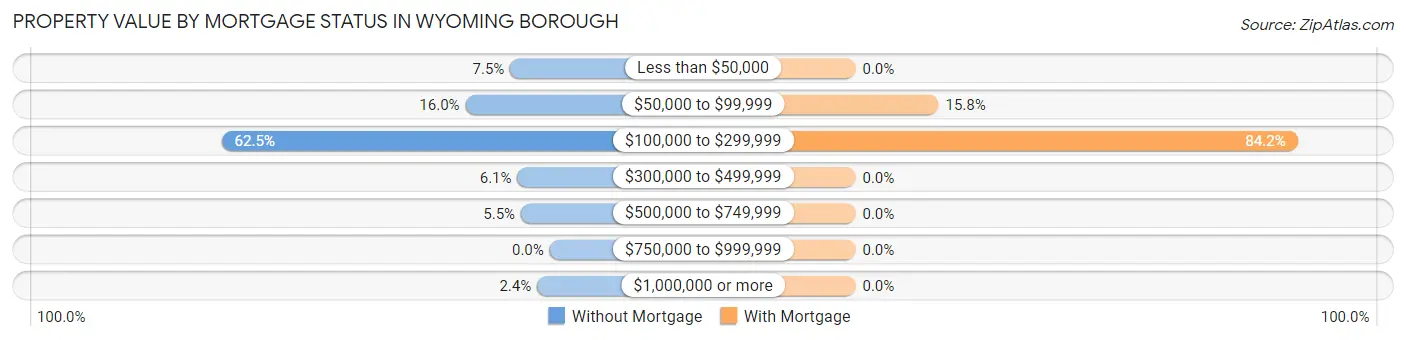
| Property Value | Without Mortgage | With Mortgage |
| Less than $50,000 | 22 (7.5%) | 0 (0.0%) |
| $50,000 to $99,999 | 47 (16.0%) | 111 (15.8%) |
| $100,000 to $299,999 | 183 (62.5%) | 591 (84.2%) |
| $300,000 to $499,999 | 18 (6.1%) | 0 (0.0%) |
| $500,000 to $749,999 | 16 (5.5%) | 0 (0.0%) |
| $750,000 to $999,999 | 0 (0.0%) | 0 (0.0%) |
| $1,000,000 or more | 7 (2.4%) | 0 (0.0%) |
| Total | 293 (100.0%) | 702 (100.0%) |
Household Income by Mortgage Status in Wyoming borough
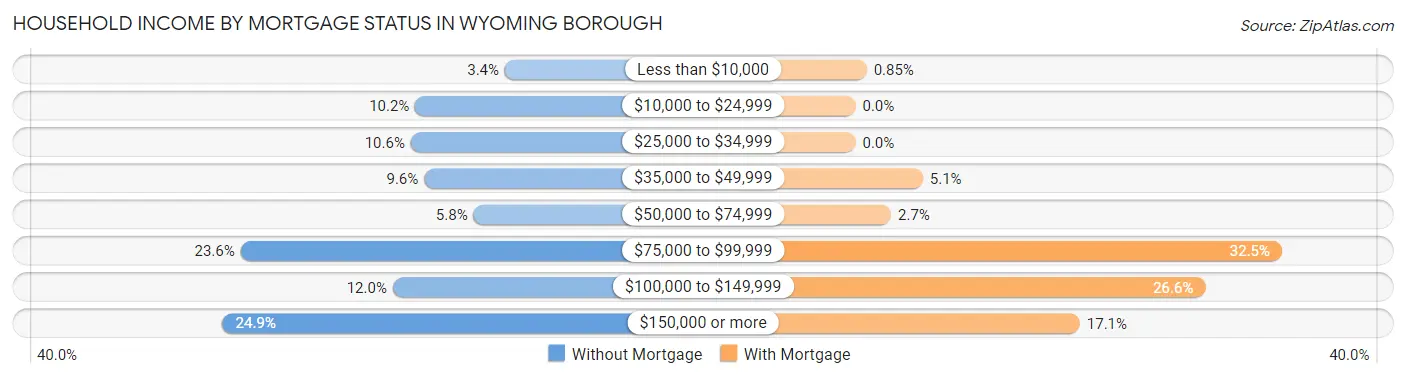
| Household Income | Without Mortgage | With Mortgage |
| Less than $10,000 | 10 (3.4%) | 6 (0.9%) |
| $10,000 to $24,999 | 30 (10.2%) | 0 (0.0%) |
| $25,000 to $34,999 | 31 (10.6%) | 0 (0.0%) |
| $35,000 to $49,999 | 28 (9.6%) | 36 (5.1%) |
| $50,000 to $74,999 | 17 (5.8%) | 19 (2.7%) |
| $75,000 to $99,999 | 69 (23.5%) | 228 (32.5%) |
| $100,000 to $149,999 | 35 (11.9%) | 187 (26.6%) |
| $150,000 or more | 73 (24.9%) | 120 (17.1%) |
| Total | 293 (100.0%) | 702 (100.0%) |
Property Value to Household Income Ratio in Wyoming borough
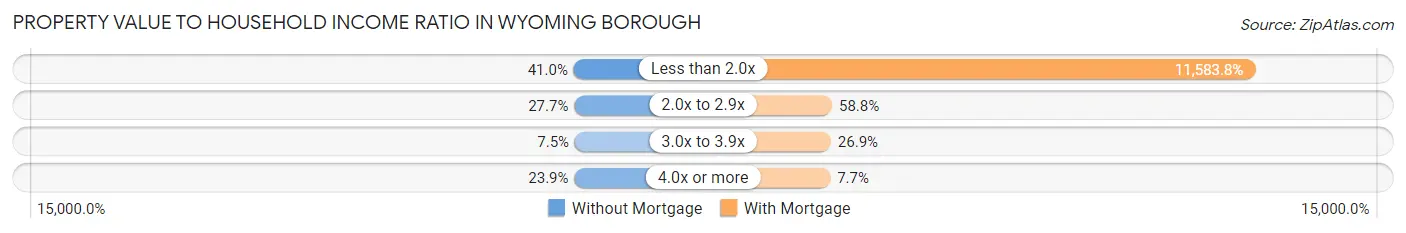
| Value-to-Income Ratio | Without Mortgage | With Mortgage |
| Less than 2.0x | 120 (41.0%) | 81,318 (11,583.8%) |
| 2.0x to 2.9x | 81 (27.7%) | 413 (58.8%) |
| 3.0x to 3.9x | 22 (7.5%) | 189 (26.9%) |
| 4.0x or more | 70 (23.9%) | 54 (7.7%) |
| Total | 293 (100.0%) | 702 (100.0%) |
Real Estate Taxes by Mortgage Status in Wyoming borough
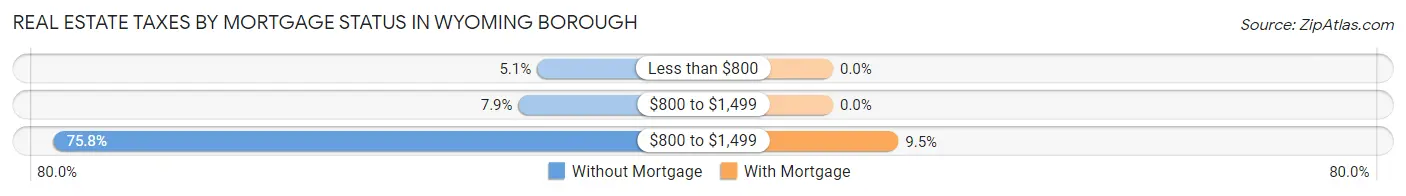
| Property Taxes | Without Mortgage | With Mortgage |
| Less than $800 | 15 (5.1%) | 0 (0.0%) |
| $800 to $1,499 | 23 (7.9%) | 0 (0.0%) |
| $800 to $1,499 | 222 (75.8%) | 67 (9.5%) |
| Total | 293 (100.0%) | 702 (100.0%) |
Health & Disability in Wyoming borough
Health Insurance Coverage by Age in Wyoming borough
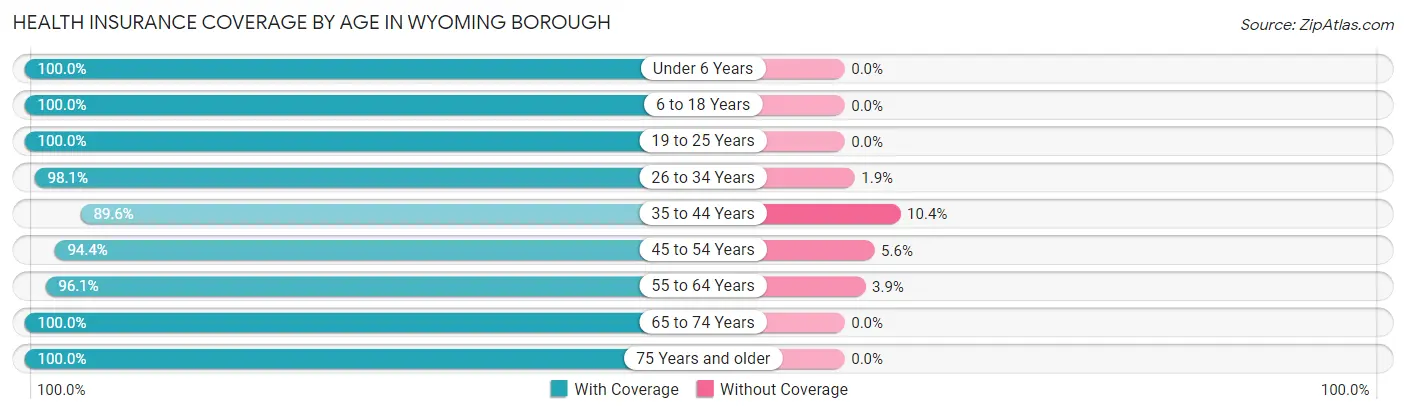
| Age Bracket | With Coverage | Without Coverage |
| Under 6 Years | 91 (100.0%) | 0 (0.0%) |
| 6 to 18 Years | 431 (100.0%) | 0 (0.0%) |
| 19 to 25 Years | 72 (100.0%) | 0 (0.0%) |
| 26 to 34 Years | 419 (98.1%) | 8 (1.9%) |
| 35 to 44 Years | 430 (89.6%) | 50 (10.4%) |
| 45 to 54 Years | 407 (94.4%) | 24 (5.6%) |
| 55 to 64 Years | 495 (96.1%) | 20 (3.9%) |
| 65 to 74 Years | 318 (100.0%) | 0 (0.0%) |
| 75 Years and older | 342 (100.0%) | 0 (0.0%) |
| Total | 3,005 (96.7%) | 102 (3.3%) |
Health Insurance Coverage by Citizenship Status in Wyoming borough
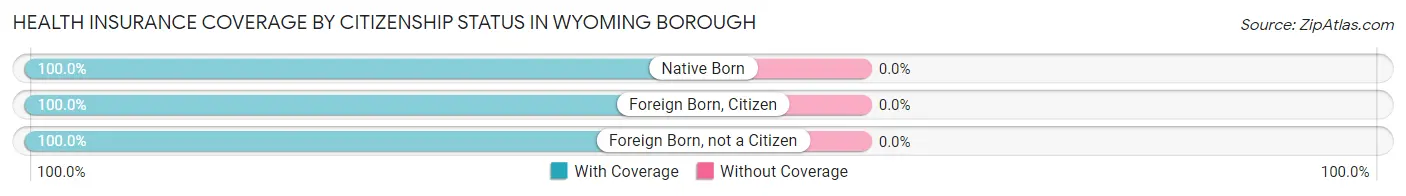
| Citizenship Status | With Coverage | Without Coverage |
| Native Born | 91 (100.0%) | 0 (0.0%) |
| Foreign Born, Citizen | 431 (100.0%) | 0 (0.0%) |
| Foreign Born, not a Citizen | 72 (100.0%) | 0 (0.0%) |
Health Insurance Coverage by Household Income in Wyoming borough
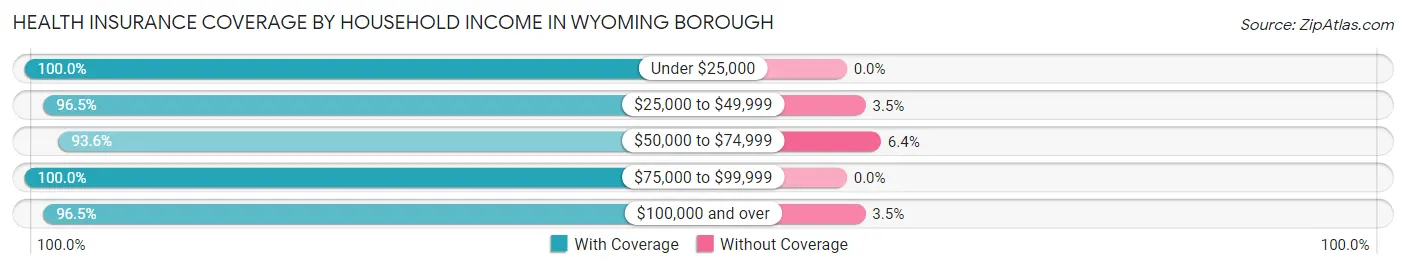
| Household Income | With Coverage | Without Coverage |
| Under $25,000 | 214 (100.0%) | 0 (0.0%) |
| $25,000 to $49,999 | 301 (96.5%) | 11 (3.5%) |
| $50,000 to $74,999 | 674 (93.6%) | 46 (6.4%) |
| $75,000 to $99,999 | 570 (100.0%) | 0 (0.0%) |
| $100,000 and over | 1,246 (96.5%) | 45 (3.5%) |
Public vs Private Health Insurance Coverage by Age in Wyoming borough
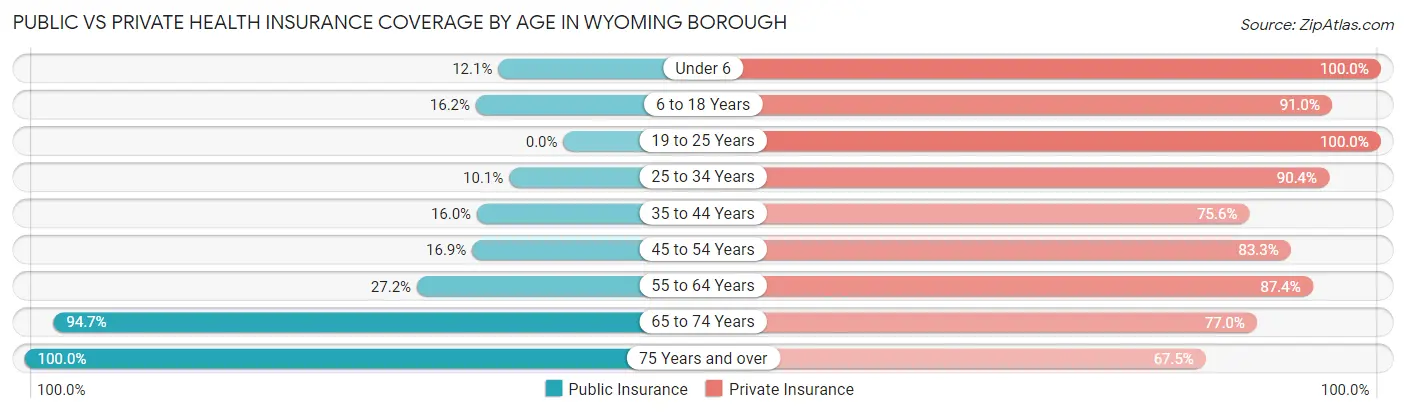
| Age Bracket | Public Insurance | Private Insurance |
| Under 6 | 11 (12.1%) | 91 (100.0%) |
| 6 to 18 Years | 70 (16.2%) | 392 (90.9%) |
| 19 to 25 Years | 0 (0.0%) | 72 (100.0%) |
| 25 to 34 Years | 43 (10.1%) | 386 (90.4%) |
| 35 to 44 Years | 77 (16.0%) | 363 (75.6%) |
| 45 to 54 Years | 73 (16.9%) | 359 (83.3%) |
| 55 to 64 Years | 140 (27.2%) | 450 (87.4%) |
| 65 to 74 Years | 301 (94.7%) | 245 (77.0%) |
| 75 Years and over | 342 (100.0%) | 231 (67.5%) |
| Total | 1,057 (34.0%) | 2,589 (83.3%) |
Disability Status by Sex by Age in Wyoming borough
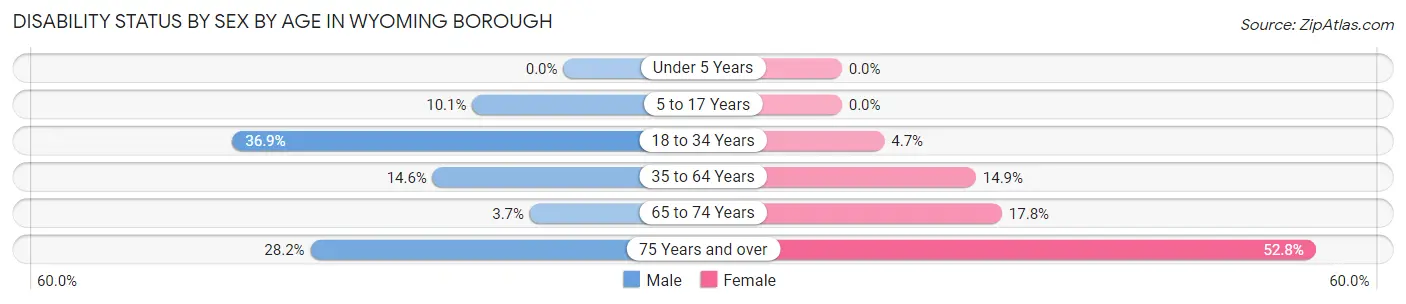
| Age Bracket | Male | Female |
| Under 5 Years | 0 (0.0%) | 0 (0.0%) |
| 5 to 17 Years | 22 (10.1%) | 0 (0.0%) |
| 18 to 34 Years | 101 (36.9%) | 13 (4.7%) |
| 35 to 64 Years | 111 (14.5%) | 99 (14.9%) |
| 65 to 74 Years | 6 (3.7%) | 28 (17.8%) |
| 75 Years and over | 20 (28.2%) | 143 (52.8%) |
Disability Class by Sex by Age in Wyoming borough
Disability Class: Hearing Difficulty
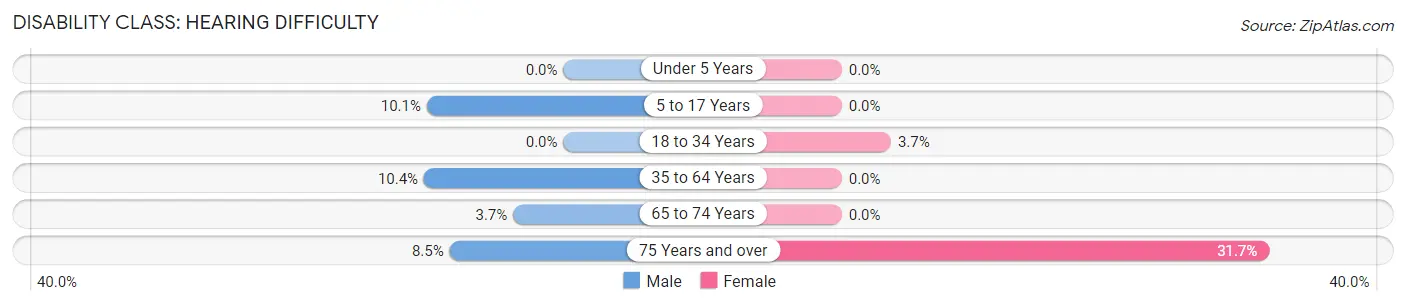
| Age Bracket | Male | Female |
| Under 5 Years | 0 (0.0%) | 0 (0.0%) |
| 5 to 17 Years | 22 (10.1%) | 0 (0.0%) |
| 18 to 34 Years | 0 (0.0%) | 10 (3.6%) |
| 35 to 64 Years | 79 (10.3%) | 0 (0.0%) |
| 65 to 74 Years | 6 (3.7%) | 0 (0.0%) |
| 75 Years and over | 6 (8.5%) | 86 (31.7%) |
Disability Class: Vision Difficulty
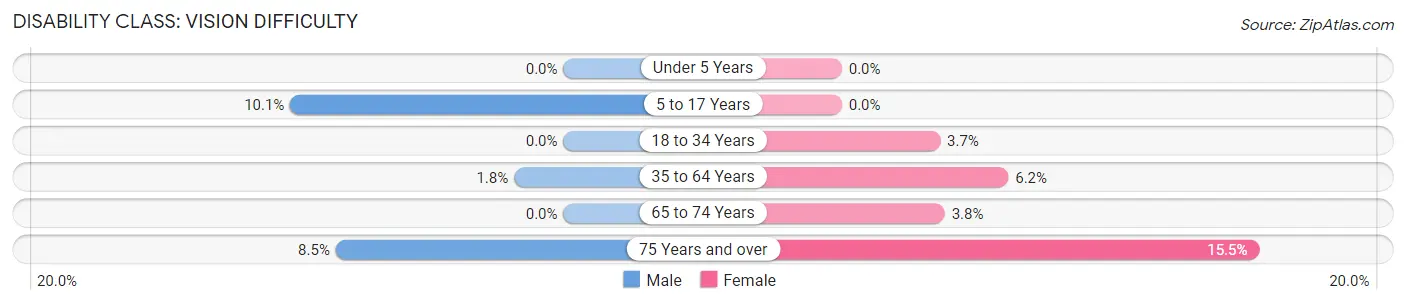
| Age Bracket | Male | Female |
| Under 5 Years | 0 (0.0%) | 0 (0.0%) |
| 5 to 17 Years | 22 (10.1%) | 0 (0.0%) |
| 18 to 34 Years | 0 (0.0%) | 10 (3.6%) |
| 35 to 64 Years | 14 (1.8%) | 41 (6.2%) |
| 65 to 74 Years | 0 (0.0%) | 6 (3.8%) |
| 75 Years and over | 6 (8.5%) | 42 (15.5%) |
Disability Class: Cognitive Difficulty
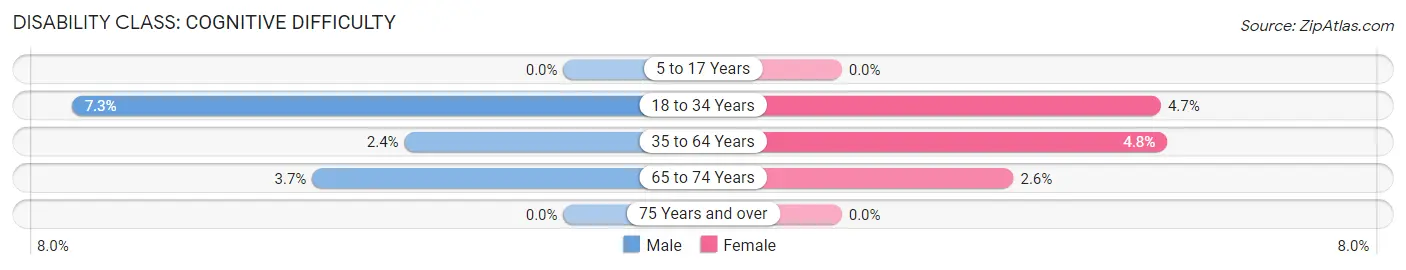
| Age Bracket | Male | Female |
| 5 to 17 Years | 0 (0.0%) | 0 (0.0%) |
| 18 to 34 Years | 20 (7.3%) | 13 (4.7%) |
| 35 to 64 Years | 18 (2.4%) | 32 (4.8%) |
| 65 to 74 Years | 6 (3.7%) | 4 (2.5%) |
| 75 Years and over | 0 (0.0%) | 0 (0.0%) |
Disability Class: Ambulatory Difficulty
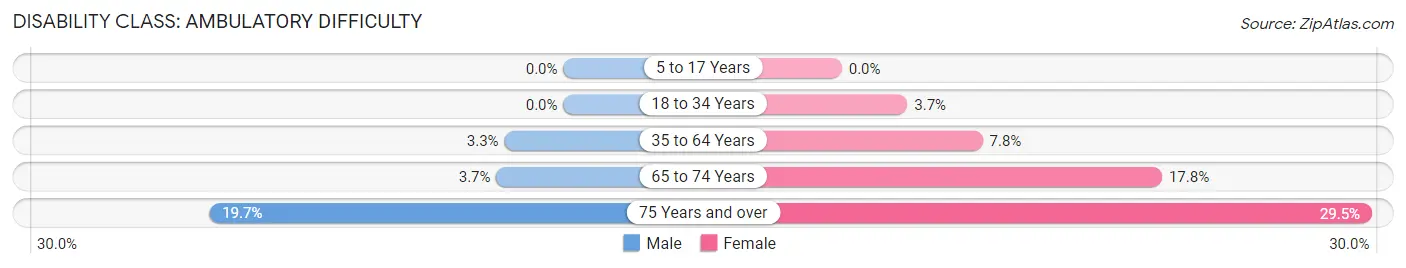
| Age Bracket | Male | Female |
| 5 to 17 Years | 0 (0.0%) | 0 (0.0%) |
| 18 to 34 Years | 0 (0.0%) | 10 (3.6%) |
| 35 to 64 Years | 25 (3.3%) | 52 (7.8%) |
| 65 to 74 Years | 6 (3.7%) | 28 (17.8%) |
| 75 Years and over | 14 (19.7%) | 80 (29.5%) |
Disability Class: Self-Care Difficulty
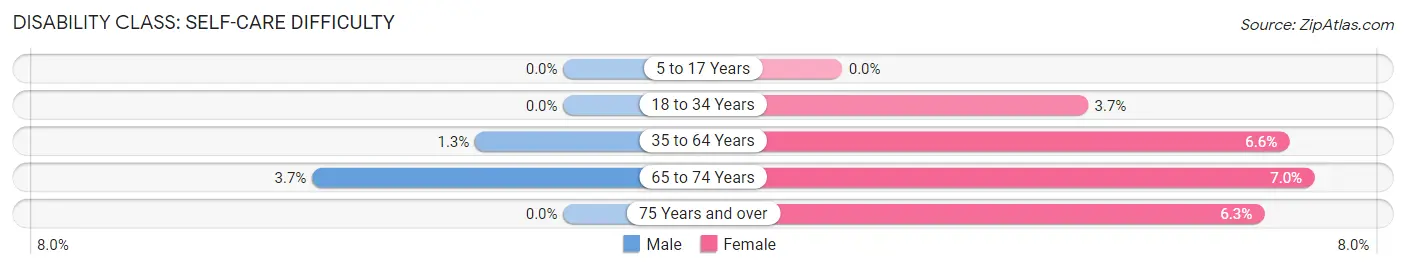
| Age Bracket | Male | Female |
| 5 to 17 Years | 0 (0.0%) | 0 (0.0%) |
| 18 to 34 Years | 0 (0.0%) | 10 (3.6%) |
| 35 to 64 Years | 10 (1.3%) | 44 (6.6%) |
| 65 to 74 Years | 6 (3.7%) | 11 (7.0%) |
| 75 Years and over | 0 (0.0%) | 17 (6.3%) |
Technology Access in Wyoming borough
Computing Device Access in Wyoming borough
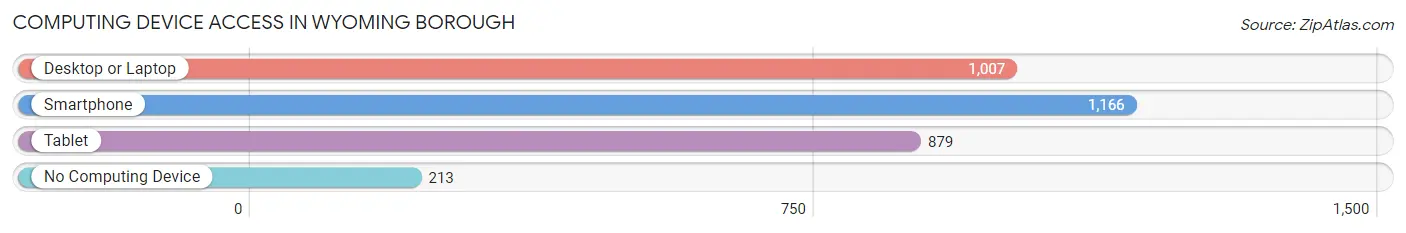
| Device Type | # Households | % Households |
| Desktop or Laptop | 1,007 | 68.3% |
| Smartphone | 1,166 | 79.0% |
| Tablet | 879 | 59.6% |
| No Computing Device | 213 | 14.4% |
| Total | 1,475 | 100.0% |
Internet Access in Wyoming borough
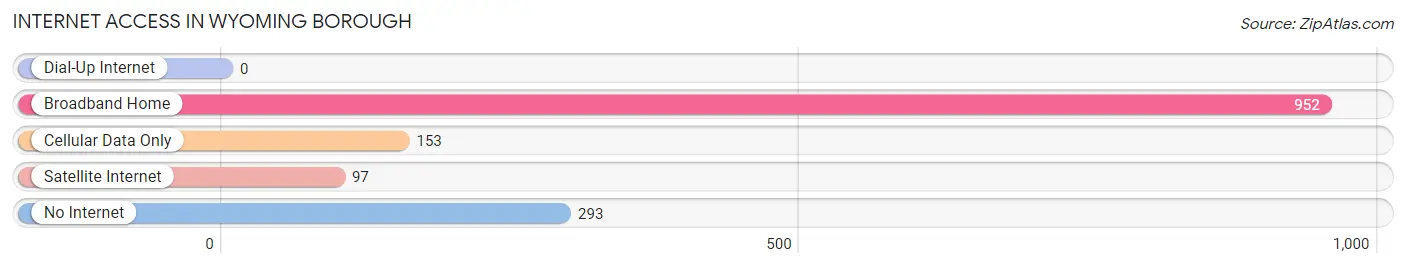
| Internet Type | # Households | % Households |
| Dial-Up Internet | 0 | 0.0% |
| Broadband Home | 952 | 64.5% |
| Cellular Data Only | 153 | 10.4% |
| Satellite Internet | 97 | 6.6% |
| No Internet | 293 | 19.9% |
| Total | 1,475 | 100.0% |
Wyoming borough Summary
Wyoming Borough is a borough located in Luzerne County, Pennsylvania, United States. It is part of the Scranton–Wilkes-Barre–Hazleton Metropolitan Statistical Area. The population was 2,926 at the 2010 census.
History
Wyoming Borough was founded in 1842 and was named after the Wyoming Valley, which was named after the Munsee Indian word meaning "large plains". The area was originally inhabited by the Susquehannock Indians, who were later displaced by the Iroquois. The first settlers in the area were mostly of English and Welsh descent.
The borough was incorporated in 1845 and was the first borough in Luzerne County. The first mayor of Wyoming Borough was William H. Hollenback, who served from 1845 to 1848.
Geography
Wyoming Borough is located at 41 17 25 North 75 51 45 West 41 290278 75 862444
According to the United States Census Bureau, the borough has a total area of 0.7 square miles (1.8 km2), all of it land.
Demographics
As of the census of 2000, there were 2,926 people, 1,220 households, and 790 families residing in the borough. The population density was 4,093.3 people per square mile (1,578.2/km2). There were 1,280 housing units at an average density of 1,788.2 per square mile (689.3/km2). The racial makeup of the borough was 97.90% White, 0.48% African American, 0.17% Native American, 0.48% Asian, 0.03% Pacific Islander, 0.17% from other races, and 0.77% from two or more races. Hispanic or Latino of any race were 0.90% of the population.
There were 1,220 households, out of which 28.2% had children under the age of 18 living with them, 48.3% were married couples living together, 12.2% had a female householder with no husband present, and 35.2% were non-families. 30.7% of all households were made up of individuals, and 14.2% had someone living alone who was 65 years of age or older. The average household size was 2.40 and the average family size was 3.01.
In the borough the population was spread out, with 23.2% under the age of 18, 7.2% from 18 to 24, 29.2% from 25 to 44, 22.2% from 45 to 64, and 18.2% who were 65 years of age or older. The median age was 39 years. For every 100 females, there were 91.2 males. For every 100 females age 18 and over, there were 87.2 males.
The median income for a household in the borough was $33,958, and the median income for a family was $41,964. Males had a median income of $31,964 versus $22,917 for females. The per capita income for the borough was $17,845. About 8.2% of families and 10.2% of the population were below the poverty line, including 14.2% of those under age 18 and 8.2% of those age 65 or over.
Economy
Wyoming Borough is home to several businesses, including a variety of restaurants, retail stores, and professional services. The borough is also home to a number of manufacturing companies, including a paper mill, a plastics manufacturer, and a metal fabrication shop.
The borough is also home to a number of educational institutions, including Wyoming Area Secondary Center, Wyoming Area Primary Center, and Wyoming Seminary.
The borough is served by the Wyoming Valley West School District
The borough is also home to a number of parks and recreational facilities, including the Wyoming Borough Park, the Wyoming Borough Pool, and the Wyoming Borough Tennis Courts.
Conclusion
Wyoming Borough is a small borough located in Luzerne County, Pennsylvania. It is part of the Scranton–Wilkes-Barre–Hazleton Metropolitan Statistical Area. The borough was founded in 1842 and was named after the Wyoming Valley, which was named after the Munsee Indian word meaning "large plains". The population was 2,926 at the 2010 census.
The borough is home to a variety of businesses, including restaurants, retail stores, and professional services. It is also home to a number of manufacturing companies, educational institutions, and parks and recreational facilities. The borough is served by the Wyoming Valley West School District.
Common Questions
What is Per Capita Income in Wyoming borough?
Per Capita income in Wyoming borough is $43,335.
What is the Median Family Income in Wyoming borough?
Median Family Income in Wyoming borough is $88,893.
What is the Median Household income in Wyoming borough?
Median Household Income in Wyoming borough is $71,406.
What is Income or Wage Gap in Wyoming borough?
Income or Wage Gap in Wyoming borough is 21.8%.
Women in Wyoming borough earn 78.2 cents for every dollar earned by a man.
What is Inequality or Gini Index in Wyoming borough?
Inequality or Gini Index in Wyoming borough is 0.41.
What is the Total Population of Wyoming borough?
Total Population of Wyoming borough is 3,107.
What is the Total Male Population of Wyoming borough?
Total Male Population of Wyoming borough is 1,559.
What is the Total Female Population of Wyoming borough?
Total Female Population of Wyoming borough is 1,548.
What is the Ratio of Males per 100 Females in Wyoming borough?
There are 100.71 Males per 100 Females in Wyoming borough.
What is the Ratio of Females per 100 Males in Wyoming borough?
There are 99.29 Females per 100 Males in Wyoming borough.
What is the Median Population Age in Wyoming borough?
Median Population Age in Wyoming borough is 47.5 Years.
What is the Average Family Size in Wyoming borough
Average Family Size in Wyoming borough is 2.9 People.
What is the Average Household Size in Wyoming borough
Average Household Size in Wyoming borough is 2.1 People.
How Large is the Labor Force in Wyoming borough?
There are 1,805 People in the Labor Forcein in Wyoming borough.
What is the Percentage of People in the Labor Force in Wyoming borough?
66.7% of People are in the Labor Force in Wyoming borough.
What is the Unemployment Rate in Wyoming borough?
Unemployment Rate in Wyoming borough is 3.4%.