Cities with the Highest Percentage of Sri Lankan Population in the United States
RELATED REPORTS & OPTIONS
Sri Lankan
United States
Compare Cities
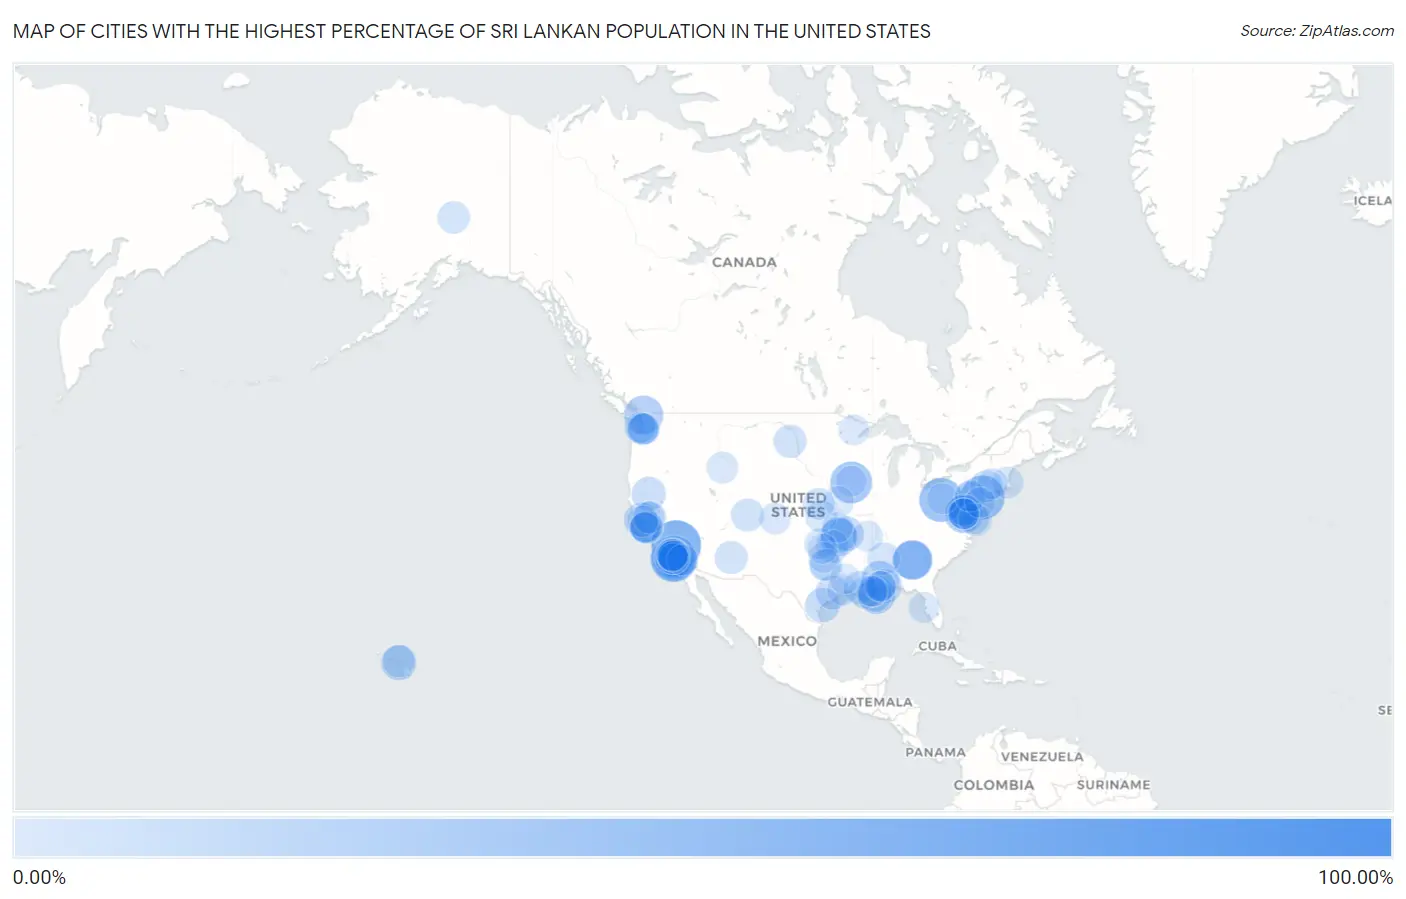
Map of Cities with the Highest Percentage of Sri Lankan Population in the United States
0.00%
100.00%
Cities with the Highest Percentage of Sri Lankan Population in the United States
| City | Sri Lankan | vs State | vs National | |
| 1. | Eagle Lake | 81.03% | 0.29%(+80.7)#1 | 0.68%(+80.4)#1 |
| 2. | Johannesburg | 52.13% | 2.03%(+50.1)#1 | 0.68%(+51.4)#2 |
| 3. | Westminster | 45.14% | 2.03%(+43.1)#2 | 0.68%(+44.5)#3 |
| 4. | Midway City | 40.04% | 2.03%(+38.0)#3 | 0.68%(+39.4)#4 |
| 5. | Zarephath | 39.19% | 0.30%(+38.9)#1 | 0.68%(+38.5)#5 |
| 6. | Westland | 38.46% | 0.40%(+38.1)#1 | 0.68%(+37.8)#6 |
| 7. | Albion | 33.39% | 0.37%(+33.0)#1 | 0.68%(+32.7)#7 |
| 8. | Garden Grove | 33.20% | 2.03%(+31.2)#4 | 0.68%(+32.5)#8 |
| 9. | Morrow | 28.22% | 0.68%(+27.5)#1 | 0.68%(+27.5)#9 |
| 10. | Fountain Valley | 26.62% | 2.03%(+24.6)#5 | 0.68%(+25.9)#10 |
| 11. | Deming | 26.46% | 1.35%(+25.1)#1 | 0.68%(+25.8)#11 |
| 12. | North Springfield | 26.04% | 0.89%(+25.2)#1 | 0.68%(+25.4)#12 |
| 13. | Lake City | 26.03% | 0.68%(+25.4)#2 | 0.68%(+25.4)#13 |
| 14. | Beaumont | 24.04% | 0.31%(+23.7)#1 | 0.68%(+23.4)#14 |
| 15. | Buras | 23.78% | 0.68%(+23.1)#1 | 0.68%(+23.1)#15 |
| 16. | Chewey | 22.54% | 0.63%(+21.9)#1 | 0.68%(+21.9)#16 |
| 17. | South San Gabriel | 20.69% | 2.03%(+18.7)#6 | 0.68%(+20.0)#17 |
| 18. | Stanton | 19.90% | 2.03%(+17.9)#7 | 0.68%(+19.2)#18 |
| 19. | Ravensworth | 19.13% | 0.89%(+18.2)#2 | 0.68%(+18.4)#19 |
| 20. | Deer Lick | 18.48% | 0.63%(+17.9)#2 | 0.68%(+17.8)#20 |
| 21. | Olowalu | 18.18% | 1.17%(+17.0)#1 | 0.68%(+17.5)#21 |
| 22. | Rosemead | 17.44% | 2.03%(+15.4)#8 | 0.68%(+16.8)#22 |
| 23. | Black Point Green Point | 16.63% | 2.03%(+14.6)#9 | 0.68%(+15.9)#23 |
| 24. | Emerald Beach | 16.59% | 0.32%(+16.3)#1 | 0.68%(+15.9)#24 |
| 25. | Fulton | 15.95% | 1.08%(+14.9)#1 | 0.68%(+15.3)#25 |
| 26. | Bayou La Batre | 15.35% | 0.24%(+15.1)#1 | 0.68%(+14.7)#26 |
| 27. | Four Corners | 15.04% | 1.08%(+14.0)#2 | 0.68%(+14.4)#27 |
| 28. | Fall River Mills | 14.60% | 2.03%(+12.6)#10 | 0.68%(+13.9)#28 |
| 29. | Empire | 13.81% | 0.68%(+13.1)#2 | 0.68%(+13.1)#29 |
| 30. | Milpitas | 13.70% | 2.03%(+11.7)#11 | 0.68%(+13.0)#30 |
| 31. | Henderson | 12.94% | 0.68%(+12.3)#3 | 0.68%(+12.3)#31 |
| 32. | Leith | 12.90% | 0.13%(+12.8)#1 | 0.68%(+12.2)#32 |
| 33. | San Jose | 12.34% | 2.03%(+10.3)#12 | 0.68%(+11.7)#33 |
| 34. | Turkey Creek | 12.25% | 0.51%(+11.7)#1 | 0.68%(+11.6)#34 |
| 35. | Crawford | 12.20% | 0.59%(+11.6)#1 | 0.68%(+11.5)#35 |
| 36. | Ocean View | 11.92% | 0.30%(+11.6)#2 | 0.68%(+11.2)#36 |
| 37. | Amelia | 11.85% | 0.68%(+11.2)#4 | 0.68%(+11.2)#37 |
| 38. | San Gabriel | 11.69% | 2.03%(+9.66)#13 | 0.68%(+11.0)#38 |
| 39. | Carlton Landing | 11.63% | 0.63%(+11.0)#3 | 0.68%(+10.9)#39 |
| 40. | Renningers | 11.43% | 0.40%(+11.0)#2 | 0.68%(+10.8)#40 |
| 41. | Vineyard | 11.38% | 2.03%(+9.35)#14 | 0.68%(+10.7)#41 |
| 42. | New Hamilton | 11.38% | 0.31%(+11.1)#2 | 0.68%(+10.7)#42 |
| 43. | Bryn Mawr Skyway | 11.34% | 1.35%(+9.99)#2 | 0.68%(+10.7)#43 |
| 44. | Bippus | 11.22% | 0.18%(+11.0)#1 | 0.68%(+10.5)#44 |
| 45. | Healy | 11.21% | 0.27%(+10.9)#1 | 0.68%(+10.5)#45 |
| 46. | Springfield | 11.12% | 0.89%(+10.2)#3 | 0.68%(+10.4)#46 |
| 47. | Highland | 10.71% | 0.20%(+10.5)#1 | 0.68%(+10.0)#47 |
| 48. | Girdletree | 10.66% | 0.55%(+10.1)#1 | 0.68%(+9.98)#48 |
| 49. | Union Mill | 10.60% | 0.89%(+9.71)#4 | 0.68%(+9.92)#49 |
| 50. | Konterra | 10.47% | 0.55%(+9.93)#2 | 0.68%(+9.79)#50 |
| 51. | Mahinahina | 10.39% | 1.17%(+9.22)#2 | 0.68%(+9.72)#51 |
| 52. | El Monte | 10.33% | 2.03%(+8.30)#15 | 0.68%(+9.65)#52 |
| 53. | Sachse | 10.28% | 1.08%(+9.20)#3 | 0.68%(+9.61)#53 |
| 54. | East Foothills | 10.21% | 2.03%(+8.18)#16 | 0.68%(+9.53)#54 |
| 55. | Alum Rock | 10.16% | 2.03%(+8.13)#17 | 0.68%(+9.48)#55 |
| 56. | Tampa | 9.92% | 0.69%(+9.24)#1 | 0.68%(+9.25)#56 |
| 57. | University Center | 9.80% | 0.89%(+8.92)#5 | 0.68%(+9.12)#57 |
| 58. | Munden | 9.77% | 0.69%(+9.09)#2 | 0.68%(+9.10)#58 |
| 59. | Alta | 9.29% | 0.070%(+9.22)#1 | 0.68%(+8.62)#59 |
| 60. | Florin | 9.27% | 2.03%(+7.24)#18 | 0.68%(+8.59)#60 |
| 61. | Ordway | 9.02% | 0.59%(+8.43)#2 | 0.68%(+8.34)#61 |
| 62. | Randolph Town | 8.99% | 0.89%(+8.10)#1 | 0.68%(+8.31)#62 |
| 63. | White Center | 8.97% | 1.35%(+7.62)#3 | 0.68%(+8.29)#63 |
| 64. | Temple City | 8.66% | 2.03%(+6.63)#19 | 0.68%(+7.98)#64 |
| 65. | West Falls Church | 8.60% | 0.89%(+7.71)#6 | 0.68%(+7.92)#65 |
| 66. | Rollingwood | 8.58% | 2.03%(+6.55)#20 | 0.68%(+7.91)#66 |
| 67. | Laytonsville | 8.56% | 0.55%(+8.01)#3 | 0.68%(+7.88)#67 |
| 68. | Avondale | 8.48% | 0.68%(+7.80)#5 | 0.68%(+7.80)#68 |
| 69. | Murphy | 8.39% | 1.08%(+7.31)#4 | 0.68%(+7.71)#69 |
| 70. | Anza | 8.37% | 2.03%(+6.34)#21 | 0.68%(+7.69)#70 |
| 71. | Smith Village | 8.33% | 0.63%(+7.71)#4 | 0.68%(+7.65)#71 |
| 72. | Annandale | 8.32% | 0.89%(+7.43)#7 | 0.68%(+7.64)#72 |
| 73. | Mount Vernon | 8.25% | 0.55%(+7.71)#4 | 0.68%(+7.57)#73 |
| 74. | Tukwila | 8.21% | 1.35%(+6.85)#4 | 0.68%(+7.53)#74 |
| 75. | Santa Ana | 8.03% | 2.03%(+6.00)#22 | 0.68%(+7.35)#75 |
| 76. | Noblestown | 7.89% | 0.40%(+7.50)#3 | 0.68%(+7.22)#76 |
| 77. | Sherwood Shores | 7.84% | 1.08%(+6.76)#5 | 0.68%(+7.16)#77 |
| 78. | Tracyton | 7.78% | 1.35%(+6.43)#5 | 0.68%(+7.11)#78 |
| 79. | Fannett | 7.68% | 1.08%(+6.60)#6 | 0.68%(+7.00)#79 |
| 80. | Pinellas Park | 7.56% | 0.47%(+7.09)#1 | 0.68%(+6.88)#80 |
| 81. | Whitten | 7.52% | 0.37%(+7.15)#2 | 0.68%(+6.84)#81 |
| 82. | Peach Orchard | 7.50% | 0.25%(+7.25)#1 | 0.68%(+6.82)#82 |
| 83. | Norfolk | 7.36% | 0.35%(+7.01)#1 | 0.68%(+6.68)#83 |
| 84. | Gulf Hills | 7.29% | 0.31%(+6.98)#3 | 0.68%(+6.61)#84 |
| 85. | Renton | 7.28% | 1.35%(+5.93)#6 | 0.68%(+6.60)#85 |
| 86. | D Iberville | 7.14% | 0.31%(+6.82)#4 | 0.68%(+6.46)#86 |
| 87. | Iron Junction | 7.06% | 0.60%(+6.46)#1 | 0.68%(+6.38)#87 |
| 88. | Fountain Springs | 6.90% | 0.40%(+6.50)#4 | 0.68%(+6.22)#88 |
| 89. | Conception | 6.77% | 0.32%(+6.45)#2 | 0.68%(+6.09)#89 |
| 90. | Arbury Hills | 6.76% | 0.29%(+6.46)#2 | 0.68%(+6.08)#90 |
| 91. | Cornwells Heights | 6.72% | 0.40%(+6.32)#5 | 0.68%(+6.04)#91 |
| 92. | West Mineral | 6.71% | 0.69%(+6.02)#3 | 0.68%(+6.03)#92 |
| 93. | Burnt Mills | 6.69% | 0.55%(+6.14)#5 | 0.68%(+6.01)#93 |
| 94. | Sharon Center | 6.68% | 0.17%(+6.50)#1 | 0.68%(+6.00)#94 |
| 95. | Hemphill | 6.67% | 1.08%(+5.59)#7 | 0.68%(+5.99)#95 |
| 96. | Burbank | 6.67% | 2.03%(+4.64)#23 | 0.68%(+5.99)#96 |
| 97. | South El Monte | 6.58% | 2.03%(+4.55)#24 | 0.68%(+5.90)#97 |
| 98. | Seven Corners | 6.38% | 0.89%(+5.49)#8 | 0.68%(+5.70)#98 |
| 99. | Byars | 6.31% | 0.63%(+5.68)#5 | 0.68%(+5.63)#99 |
| 100. | Harvey | 6.30% | 0.68%(+5.62)#6 | 0.68%(+5.62)#100 |
Common Questions
What are the Top 10 Cities with the Highest Percentage of Sri Lankan Population in the United States?
Top 10 Cities with the Highest Percentage of Sri Lankan Population in the United States are:
#1
52.13%
#2
45.14%
#3
40.04%
#4
39.19%
#5
38.46%
#6
33.39%
#7
33.20%
#8
28.22%
#9
26.62%
#10
26.46%
What city has the Highest Percentage of Sri Lankan Population in the United States?
Johannesburg has the Highest Percentage of Sri Lankan Population in the United States with 52.13%.
What is the Percentage of Sri Lankan Population in the United States?
Percentage of Sri Lankan Population in the United States is 0.68%.