Bessemer borough, PA Map & Demographics
Bessemer borough Overview
$33,315
PER CAPITA INCOME
$76,875
AVG FAMILY INCOME
$58,750
AVG HOUSEHOLD INCOME
32.2%
WAGE / INCOME GAP [ % ]
67.8¢/ $1
WAGE / INCOME GAP [ $ ]
0.44
INEQUALITY / GINI INDEX
912
TOTAL POPULATION
462
MALE POPULATION
450
FEMALE POPULATION
102.67
MALES / 100 FEMALES
97.40
FEMALES / 100 MALES
44.2
MEDIAN AGE
3.0
AVG FAMILY SIZE
2.4
AVG HOUSEHOLD SIZE
493
LABOR FORCE [ PEOPLE ]
65.1%
PERCENT IN LABOR FORCE
8.7%
UNEMPLOYMENT RATE
Income in Bessemer borough
Income Overview in Bessemer borough
Per Capita Income in Bessemer borough is $33,315, while median incomes of families and households are $76,875 and $58,750 respectively.
| Characteristic | Number | Measure |
| Per Capita Income | 912 | $33,315 |
| Median Family Income | 237 | $76,875 |
| Mean Family Income | 237 | $84,708 |
| Median Household Income | 388 | $58,750 |
| Mean Household Income | 388 | $77,464 |
| Income Deficit | 237 | $0 |
| Wage / Income Gap (%) | 912 | 32.23% |
| Wage / Income Gap ($) | 912 | 67.77¢ per $1 |
| Gini / Inequality Index | 912 | 0.44 |
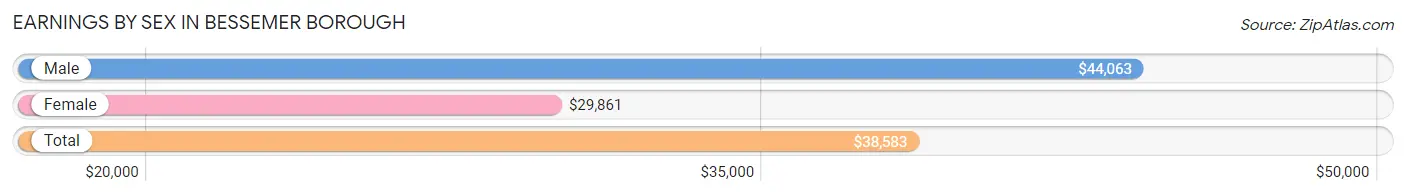
Earnings by Sex in Bessemer borough
Average Earnings in Bessemer borough are $38,583, $44,063 for men and $29,861 for women, a difference of 32.2%.
| Sex | Number | Average Earnings |
| Male | 251 (49.1%) | $44,063 |
| Female | 260 (50.9%) | $29,861 |
| Total | 511 (100.0%) | $38,583 |
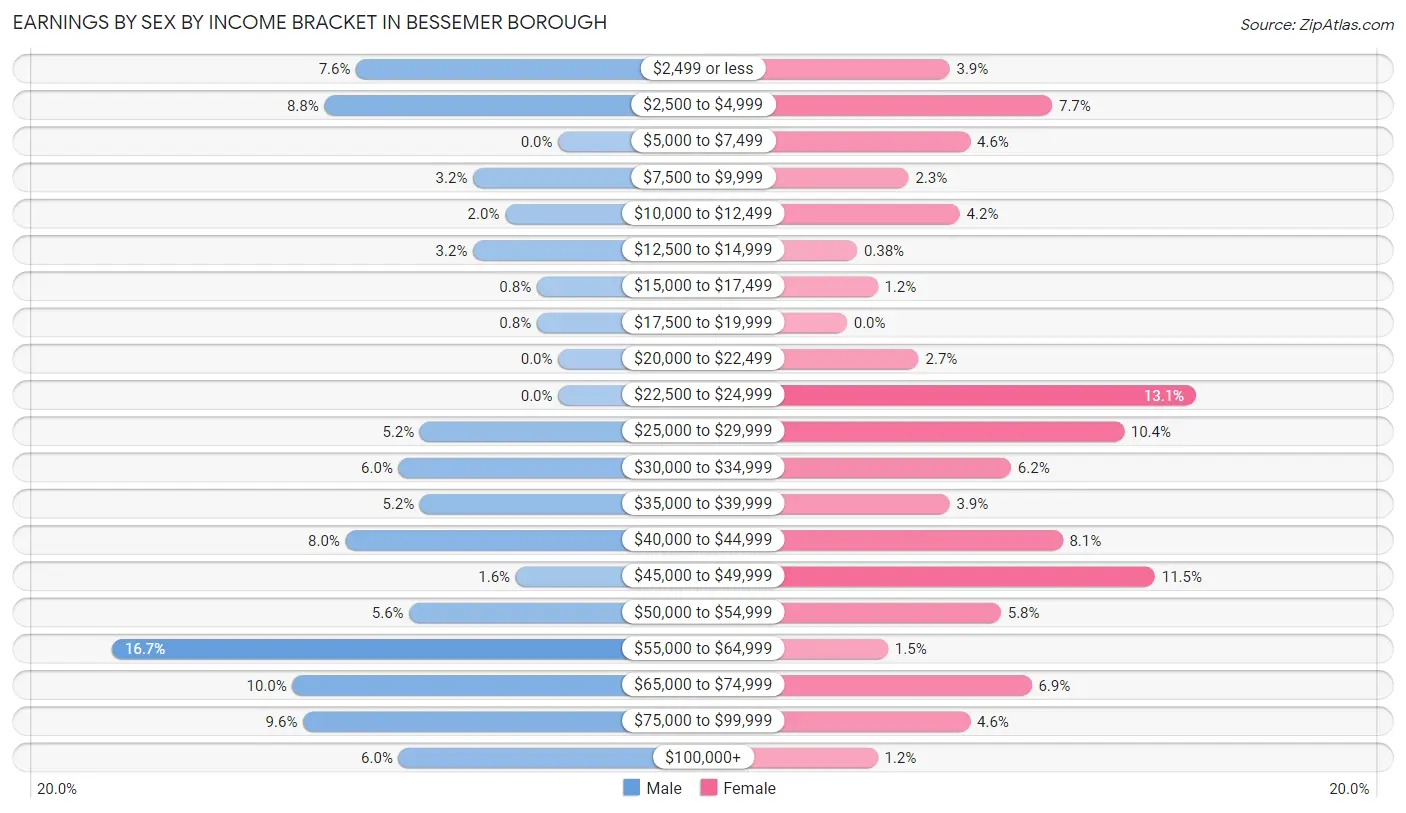
Earnings by Sex by Income Bracket in Bessemer borough
The most common earnings brackets in Bessemer borough are $55,000 to $64,999 for men (42 | 16.7%) and $22,500 to $24,999 for women (34 | 13.1%).
| Income | Male | Female |
| $2,499 or less | 19 (7.6%) | 10 (3.8%) |
| $2,500 to $4,999 | 22 (8.8%) | 20 (7.7%) |
| $5,000 to $7,499 | 0 (0.0%) | 12 (4.6%) |
| $7,500 to $9,999 | 8 (3.2%) | 6 (2.3%) |
| $10,000 to $12,499 | 5 (2.0%) | 11 (4.2%) |
| $12,500 to $14,999 | 8 (3.2%) | 1 (0.4%) |
| $15,000 to $17,499 | 2 (0.8%) | 3 (1.1%) |
| $17,500 to $19,999 | 2 (0.8%) | 0 (0.0%) |
| $20,000 to $22,499 | 0 (0.0%) | 7 (2.7%) |
| $22,500 to $24,999 | 0 (0.0%) | 34 (13.1%) |
| $25,000 to $29,999 | 13 (5.2%) | 27 (10.4%) |
| $30,000 to $34,999 | 15 (6.0%) | 16 (6.1%) |
| $35,000 to $39,999 | 13 (5.2%) | 10 (3.8%) |
| $40,000 to $44,999 | 20 (8.0%) | 21 (8.1%) |
| $45,000 to $49,999 | 4 (1.6%) | 30 (11.5%) |
| $50,000 to $54,999 | 14 (5.6%) | 15 (5.8%) |
| $55,000 to $64,999 | 42 (16.7%) | 4 (1.5%) |
| $65,000 to $74,999 | 25 (10.0%) | 18 (6.9%) |
| $75,000 to $99,999 | 24 (9.6%) | 12 (4.6%) |
| $100,000+ | 15 (6.0%) | 3 (1.1%) |
| Total | 251 (100.0%) | 260 (100.0%) |
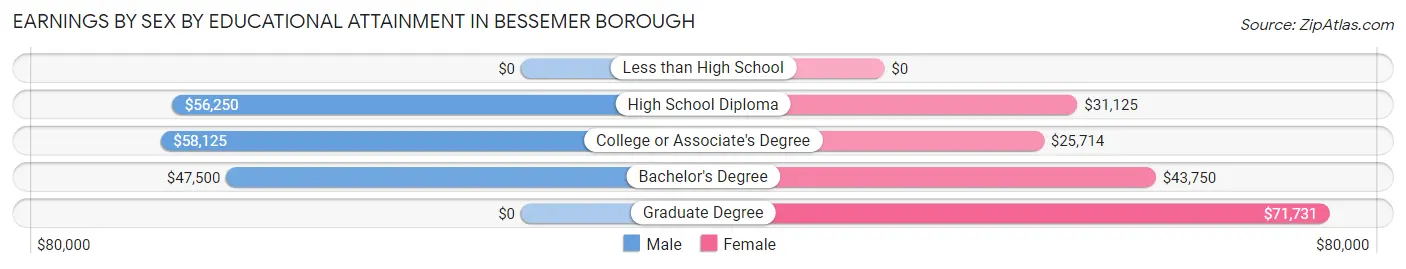
Earnings by Sex by Educational Attainment in Bessemer borough
Average earnings in Bessemer borough are $56,875 for men and $39,107 for women, a difference of 31.2%. Men with an educational attainment of college or associate's degree enjoy the highest average annual earnings of $58,125, while those with bachelor's degree education earn the least with $47,500. Women with an educational attainment of graduate degree earn the most with the average annual earnings of $71,731, while those with college or associate's degree education have the smallest earnings of $25,714.
| Educational Attainment | Male Income | Female Income |
| Less than High School | - | - |
| High School Diploma | $56,250 | $31,125 |
| College or Associate's Degree | $58,125 | $25,714 |
| Bachelor's Degree | $47,500 | $43,750 |
| Graduate Degree | - | - |
| Total | $56,875 | $39,107 |
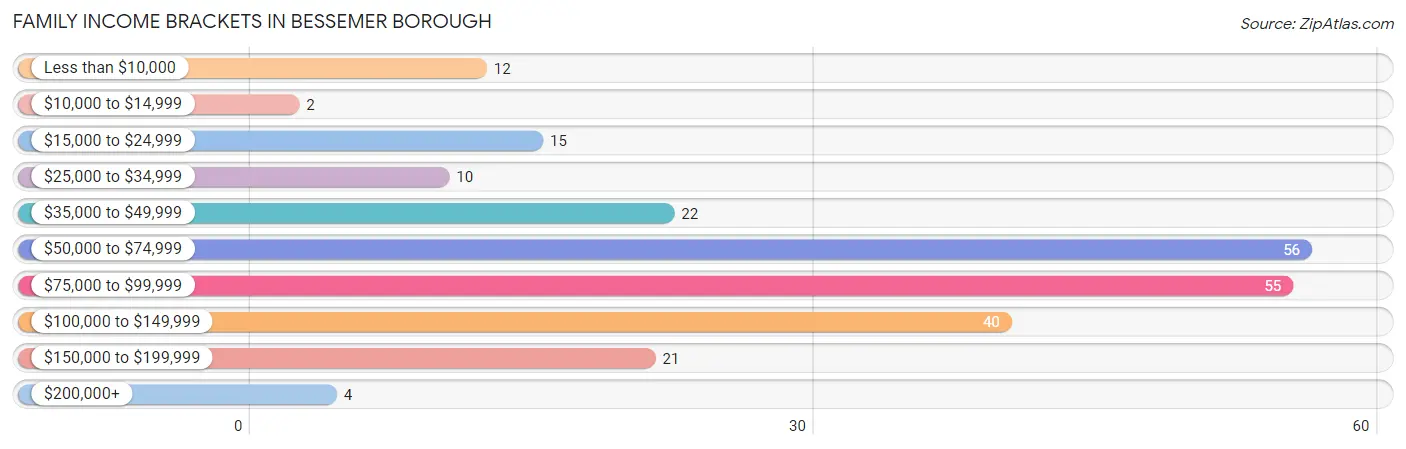
Family Income in Bessemer borough
Family Income Brackets in Bessemer borough
According to the Bessemer borough family income data, there are 56 families falling into the $50,000 to $74,999 income range, which is the most common income bracket and makes up 23.6% of all families. Conversely, the $10,000 to $14,999 income bracket is the least frequent group with only 2 families (0.8%) belonging to this category.
| Income Bracket | # Families | % Families |
| Less than $10,000 | 12 | 5.1% |
| $10,000 to $14,999 | 2 | 0.8% |
| $15,000 to $24,999 | 15 | 6.3% |
| $25,000 to $34,999 | 10 | 4.2% |
| $35,000 to $49,999 | 22 | 9.3% |
| $50,000 to $74,999 | 56 | 23.6% |
| $75,000 to $99,999 | 55 | 23.2% |
| $100,000 to $149,999 | 40 | 16.9% |
| $150,000 to $199,999 | 21 | 8.9% |
| $200,000+ | 4 | 1.7% |
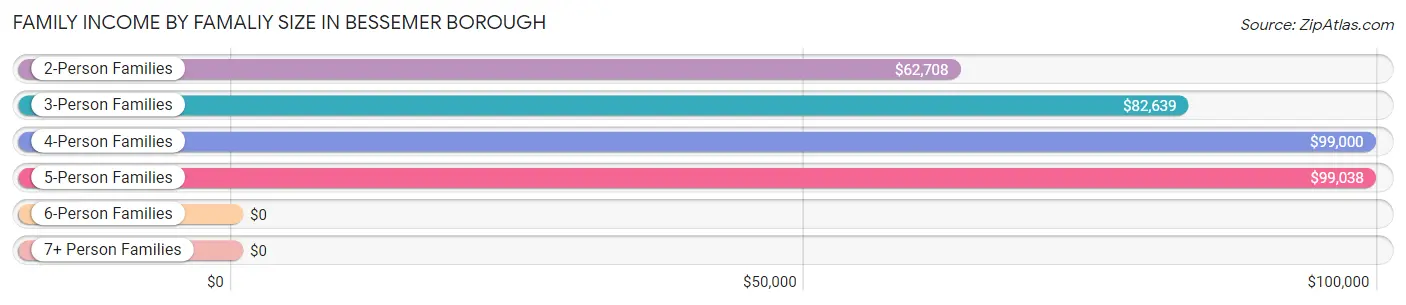
Family Income by Famaliy Size in Bessemer borough
5-person families (26 | 11.0%) account for the highest median family income in Bessemer borough with $99,038 per family, while 2-person families (127 | 53.6%) have the highest median income of $31,354 per family member.
| Income Bracket | # Families | Median Income |
| 2-Person Families | 127 (53.6%) | $62,708 |
| 3-Person Families | 45 (19.0%) | $82,639 |
| 4-Person Families | 34 (14.3%) | $99,000 |
| 5-Person Families | 26 (11.0%) | $99,038 |
| 6-Person Families | 5 (2.1%) | $0 |
| 7+ Person Families | 0 (0.0%) | $0 |
| Total | 237 (100.0%) | $76,875 |
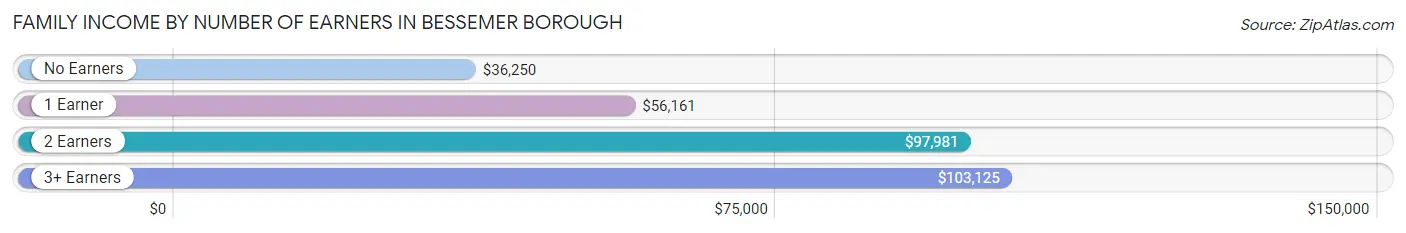
Family Income by Number of Earners in Bessemer borough
The median family income in Bessemer borough is $76,875, with families comprising 3+ earners (46) having the highest median family income of $103,125, while families with no earners (31) have the lowest median family income of $36,250, accounting for 19.4% and 13.1% of families, respectively.
| Number of Earners | # Families | Median Income |
| No Earners | 31 (13.1%) | $36,250 |
| 1 Earner | 79 (33.3%) | $56,161 |
| 2 Earners | 81 (34.2%) | $97,981 |
| 3+ Earners | 46 (19.4%) | $103,125 |
| Total | 237 (100.0%) | $76,875 |
Household Income in Bessemer borough
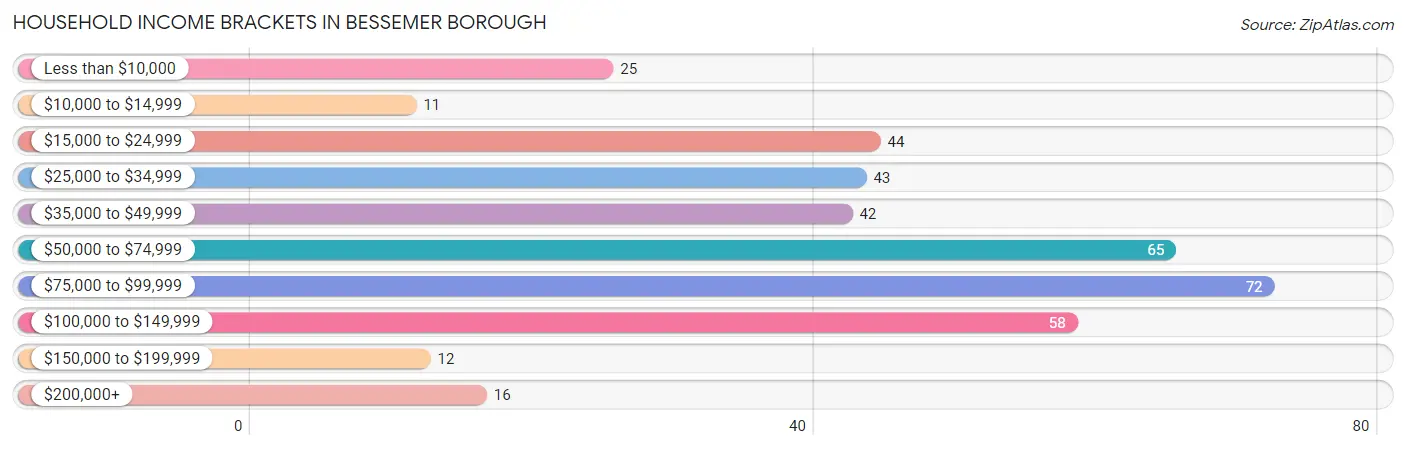
Household Income Brackets in Bessemer borough
With 72 households falling in the category, the $75,000 to $99,999 income range is the most frequent in Bessemer borough, accounting for 18.6% of all households. In contrast, only 11 households (2.8%) fall into the $10,000 to $14,999 income bracket, making it the least populous group.
| Income Bracket | # Households | % Households |
| Less than $10,000 | 25 | 6.4% |
| $10,000 to $14,999 | 11 | 2.8% |
| $15,000 to $24,999 | 44 | 11.3% |
| $25,000 to $34,999 | 43 | 11.1% |
| $35,000 to $49,999 | 42 | 10.8% |
| $50,000 to $74,999 | 65 | 16.8% |
| $75,000 to $99,999 | 72 | 18.6% |
| $100,000 to $149,999 | 58 | 14.9% |
| $150,000 to $199,999 | 12 | 3.1% |
| $200,000+ | 16 | 4.1% |
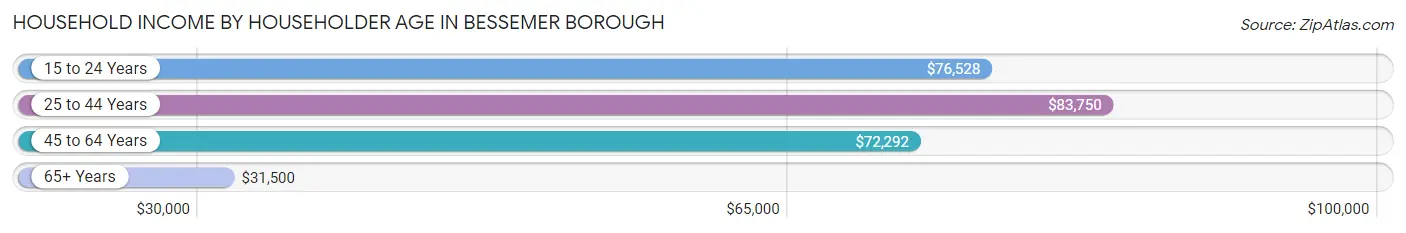
Household Income by Householder Age in Bessemer borough
The median household income in Bessemer borough is $58,750, with the highest median household income of $83,750 found in the 25 to 44 years age bracket for the primary householder. A total of 81 households (20.9%) fall into this category. Meanwhile, the 65+ years age bracket for the primary householder has the lowest median household income of $31,500, with 116 households (29.9%) in this group.
| Income Bracket | # Households | Median Income |
| 15 to 24 Years | 15 (3.9%) | $76,528 |
| 25 to 44 Years | 81 (20.9%) | $83,750 |
| 45 to 64 Years | 176 (45.4%) | $72,292 |
| 65+ Years | 116 (29.9%) | $31,500 |
| Total | 388 (100.0%) | $58,750 |
Poverty in Bessemer borough
Income Below Poverty by Sex and Age in Bessemer borough
With 11.0% poverty level for males and 9.8% for females among the residents of Bessemer borough, 6 to 11 year old males and 35 to 44 year old females are the most vulnerable to poverty, with 7 males (50.0%) and 6 females (19.4%) in their respective age groups living below the poverty level.
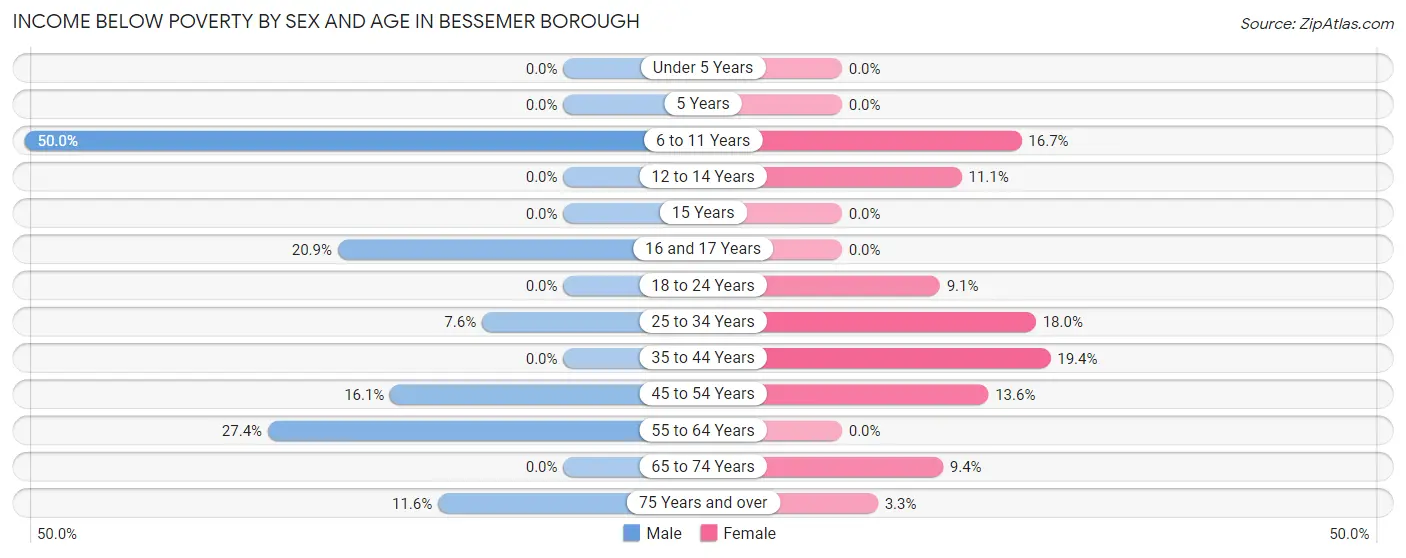
| Age Bracket | Male | Female |
| Under 5 Years | 0 (0.0%) | 0 (0.0%) |
| 5 Years | 0 (0.0%) | 0 (0.0%) |
| 6 to 11 Years | 7 (50.0%) | 4 (16.7%) |
| 12 to 14 Years | 0 (0.0%) | 2 (11.1%) |
| 15 Years | 0 (0.0%) | 0 (0.0%) |
| 16 and 17 Years | 9 (20.9%) | 0 (0.0%) |
| 18 to 24 Years | 0 (0.0%) | 4 (9.1%) |
| 25 to 34 Years | 4 (7.5%) | 9 (18.0%) |
| 35 to 44 Years | 0 (0.0%) | 6 (19.4%) |
| 45 to 54 Years | 9 (16.1%) | 14 (13.6%) |
| 55 to 64 Years | 17 (27.4%) | 0 (0.0%) |
| 65 to 74 Years | 0 (0.0%) | 3 (9.4%) |
| 75 Years and over | 5 (11.6%) | 2 (3.3%) |
| Total | 51 (11.0%) | 44 (9.8%) |
Income Above Poverty by Sex and Age in Bessemer borough
According to the poverty statistics in Bessemer borough, males aged under 5 years and females aged under 5 years are the age groups that are most secure financially, with 100.0% of males and 100.0% of females in these age groups living above the poverty line.
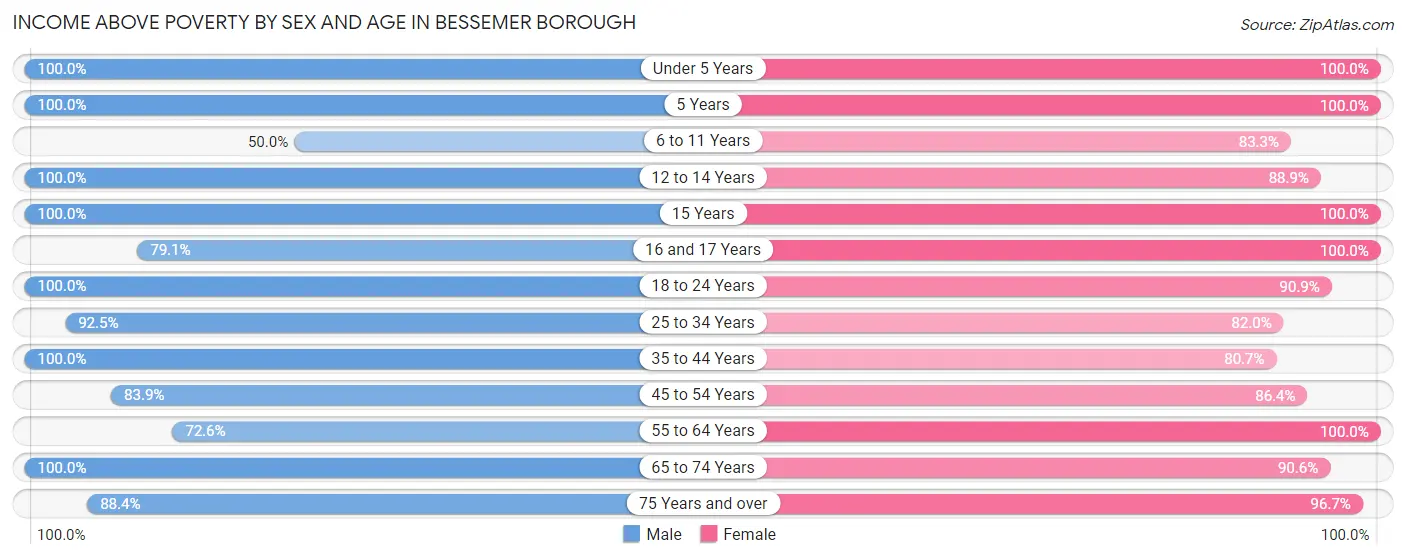
| Age Bracket | Male | Female |
| Under 5 Years | 19 (100.0%) | 13 (100.0%) |
| 5 Years | 16 (100.0%) | 5 (100.0%) |
| 6 to 11 Years | 7 (50.0%) | 20 (83.3%) |
| 12 to 14 Years | 23 (100.0%) | 16 (88.9%) |
| 15 Years | 15 (100.0%) | 8 (100.0%) |
| 16 and 17 Years | 34 (79.1%) | 5 (100.0%) |
| 18 to 24 Years | 37 (100.0%) | 40 (90.9%) |
| 25 to 34 Years | 49 (92.4%) | 41 (82.0%) |
| 35 to 44 Years | 49 (100.0%) | 25 (80.6%) |
| 45 to 54 Years | 47 (83.9%) | 89 (86.4%) |
| 55 to 64 Years | 45 (72.6%) | 57 (100.0%) |
| 65 to 74 Years | 32 (100.0%) | 29 (90.6%) |
| 75 Years and over | 38 (88.4%) | 58 (96.7%) |
| Total | 411 (89.0%) | 406 (90.2%) |
Income Below Poverty Among Married-Couple Families in Bessemer borough
The poverty statistics for married-couple families in Bessemer borough show that 9.0% or 14 of the total 155 families live below the poverty line. Families with 3 or 4 children have the highest poverty rate of 22.2%, comprising of 4 families. On the other hand, families with 1 or 2 children have the lowest poverty rate of 3.5%, which includes 2 families.
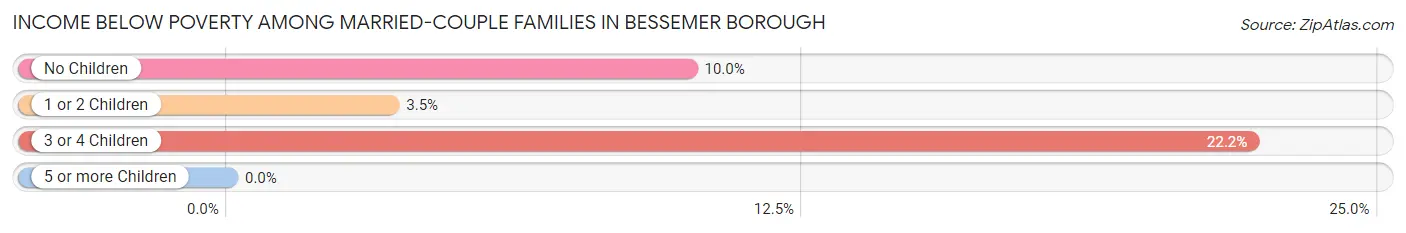
| Children | Above Poverty | Below Poverty |
| No Children | 72 (90.0%) | 8 (10.0%) |
| 1 or 2 Children | 55 (96.5%) | 2 (3.5%) |
| 3 or 4 Children | 14 (77.8%) | 4 (22.2%) |
| 5 or more Children | 0 (0.0%) | 0 (0.0%) |
| Total | 141 (91.0%) | 14 (9.0%) |
Income Below Poverty Among Single-Parent Households in Bessemer borough
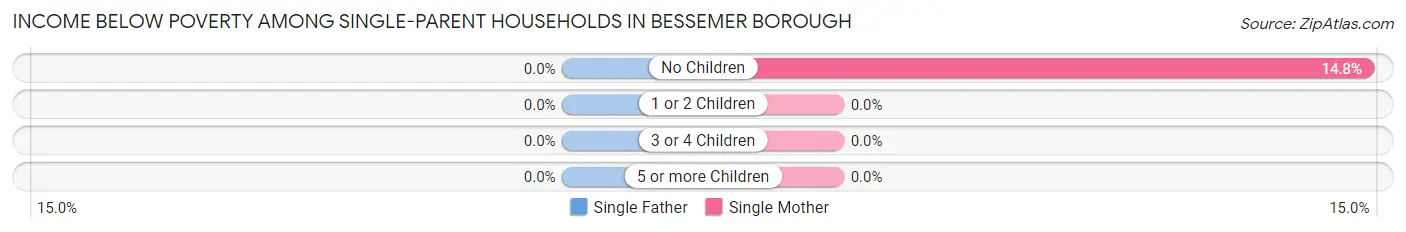
| Children | Single Father | Single Mother |
| No Children | 0 (0.0%) | 4 (14.8%) |
| 1 or 2 Children | 0 (0.0%) | 0 (0.0%) |
| 3 or 4 Children | 0 (0.0%) | 0 (0.0%) |
| 5 or more Children | 0 (0.0%) | 0 (0.0%) |
| Total | 0 (0.0%) | 4 (6.2%) |
Income Below Poverty Among Married-Couple vs Single-Parent Households in Bessemer borough
The poverty data for Bessemer borough shows that 14 of the married-couple family households (9.0%) and 4 of the single-parent households (4.9%) are living below the poverty level. Within the married-couple family households, those with 3 or 4 children have the highest poverty rate, with 4 households (22.2%) falling below the poverty line. Among the single-parent households, those with no children have the highest poverty rate, with 4 household (12.1%) living below poverty.
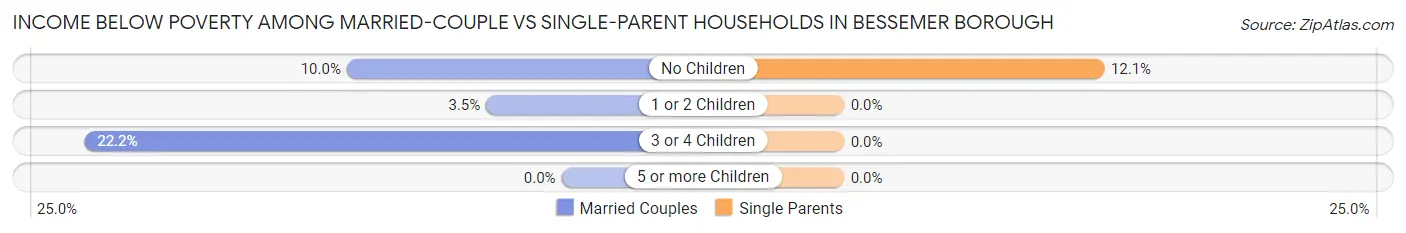
| Children | Married-Couple Families | Single-Parent Households |
| No Children | 8 (10.0%) | 4 (12.1%) |
| 1 or 2 Children | 2 (3.5%) | 0 (0.0%) |
| 3 or 4 Children | 4 (22.2%) | 0 (0.0%) |
| 5 or more Children | 0 (0.0%) | 0 (0.0%) |
| Total | 14 (9.0%) | 4 (4.9%) |
Race in Bessemer borough
The most populous races in Bessemer borough are White / Caucasian (843 | 92.4%), Two or more Races (57 | 6.2%), and Asian (12 | 1.3%).
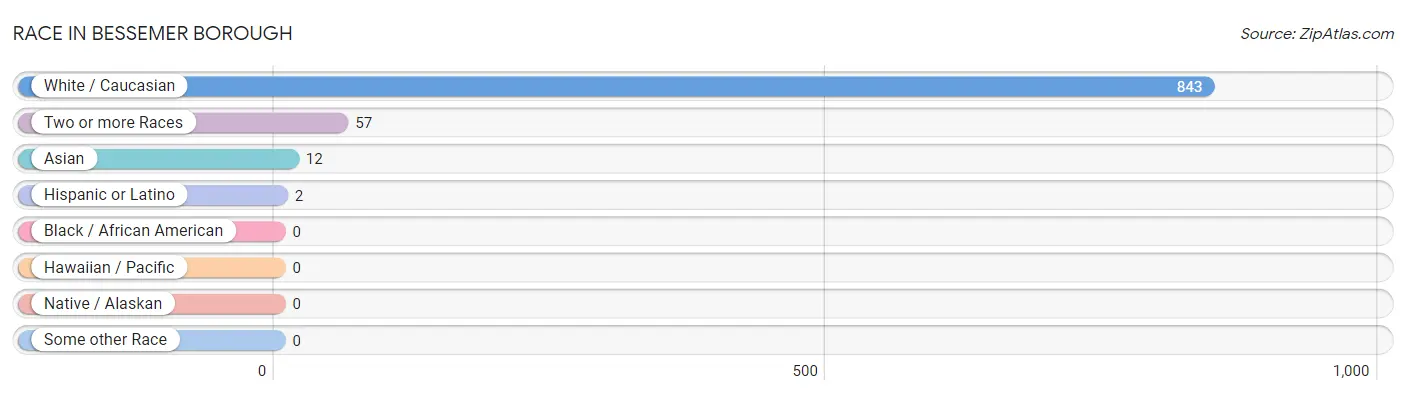
| Race | # Population | % Population |
| Asian | 12 | 1.3% |
| Black / African American | 0 | 0.0% |
| Hawaiian / Pacific | 0 | 0.0% |
| Hispanic or Latino | 2 | 0.2% |
| Native / Alaskan | 0 | 0.0% |
| White / Caucasian | 843 | 92.4% |
| Two or more Races | 57 | 6.2% |
| Some other Race | 0 | 0.0% |
| Total | 912 | 100.0% |
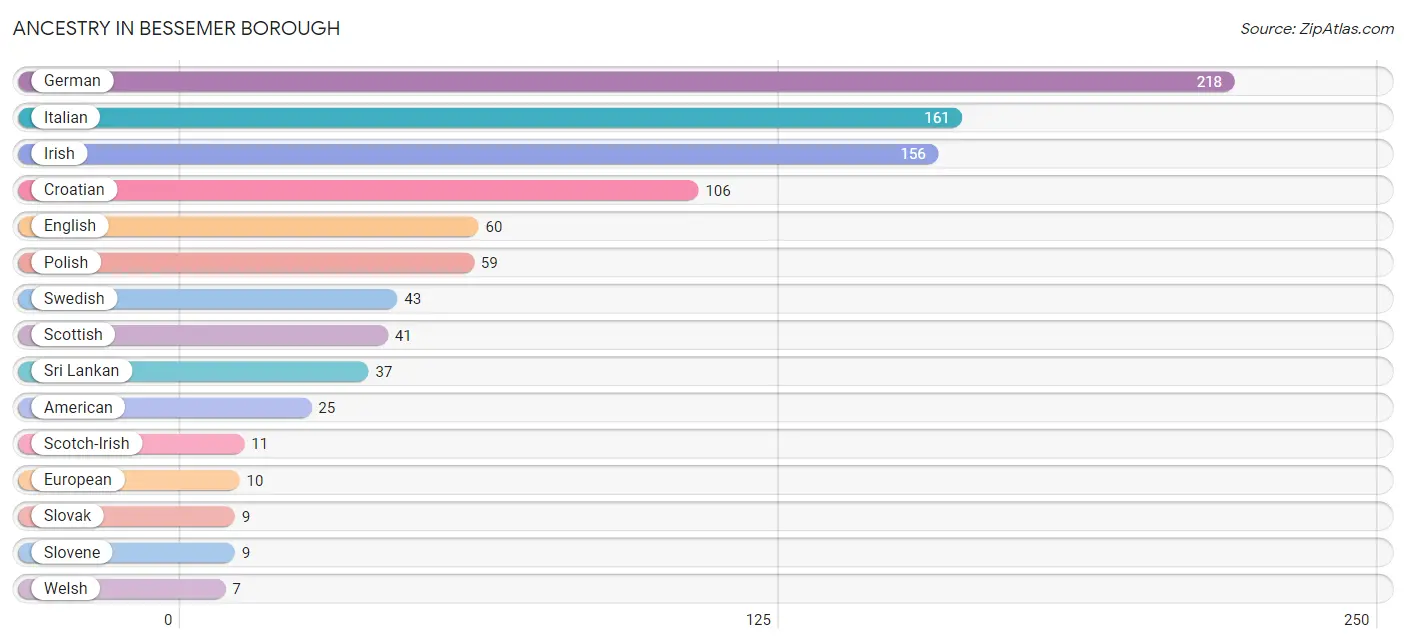
Ancestry in Bessemer borough
The most populous ancestries reported in Bessemer borough are German (218 | 23.9%), Italian (161 | 17.6%), Irish (156 | 17.1%), Croatian (106 | 11.6%), and English (60 | 6.6%), together accounting for 76.9% of all Bessemer borough residents.
| Ancestry | # Population | % Population |
| American | 25 | 2.7% |
| Arab | 1 | 0.1% |
| Austrian | 3 | 0.3% |
| Burmese | 5 | 0.5% |
| Croatian | 106 | 11.6% |
| Dutch | 2 | 0.2% |
| Eastern European | 2 | 0.2% |
| English | 60 | 6.6% |
| European | 10 | 1.1% |
| German | 218 | 23.9% |
| Irish | 156 | 17.1% |
| Italian | 161 | 17.6% |
| Lebanese | 1 | 0.1% |
| Northern European | 2 | 0.2% |
| Polish | 59 | 6.5% |
| Romanian | 1 | 0.1% |
| Scotch-Irish | 11 | 1.2% |
| Scottish | 41 | 4.5% |
| Slovak | 9 | 1.0% |
| Slovene | 9 | 1.0% |
| Spanish | 2 | 0.2% |
| Sri Lankan | 37 | 4.1% |
| Swedish | 43 | 4.7% |
| Welsh | 7 | 0.8% | View All 24 Rows |
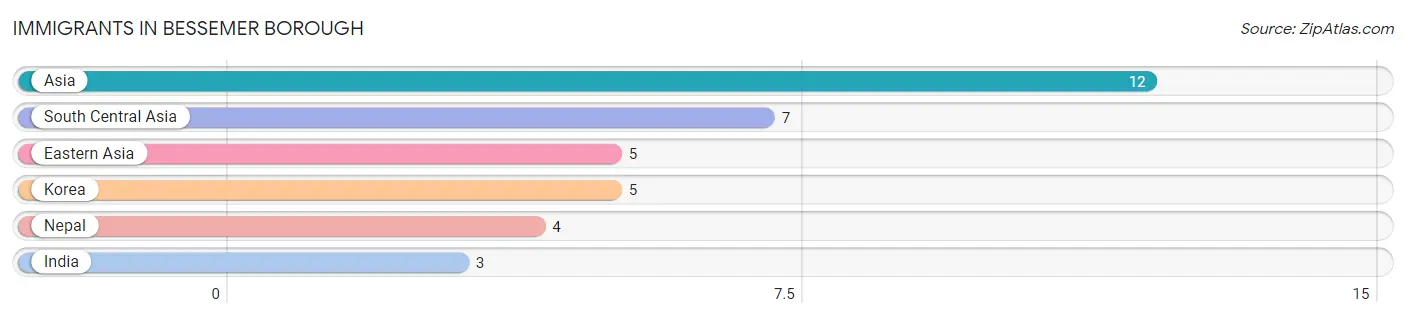
Immigrants in Bessemer borough
The most numerous immigrant groups reported in Bessemer borough came from Asia (12 | 1.3%), South Central Asia (7 | 0.8%), Eastern Asia (5 | 0.5%), Korea (5 | 0.5%), and Nepal (4 | 0.4%), together accounting for 3.6% of all Bessemer borough residents.
| Immigration Origin | # Population | % Population |
| Asia | 12 | 1.3% |
| Eastern Asia | 5 | 0.5% |
| India | 3 | 0.3% |
| Korea | 5 | 0.5% |
| Nepal | 4 | 0.4% |
| South Central Asia | 7 | 0.8% | View All 6 Rows |
Sex and Age in Bessemer borough
Sex and Age in Bessemer borough
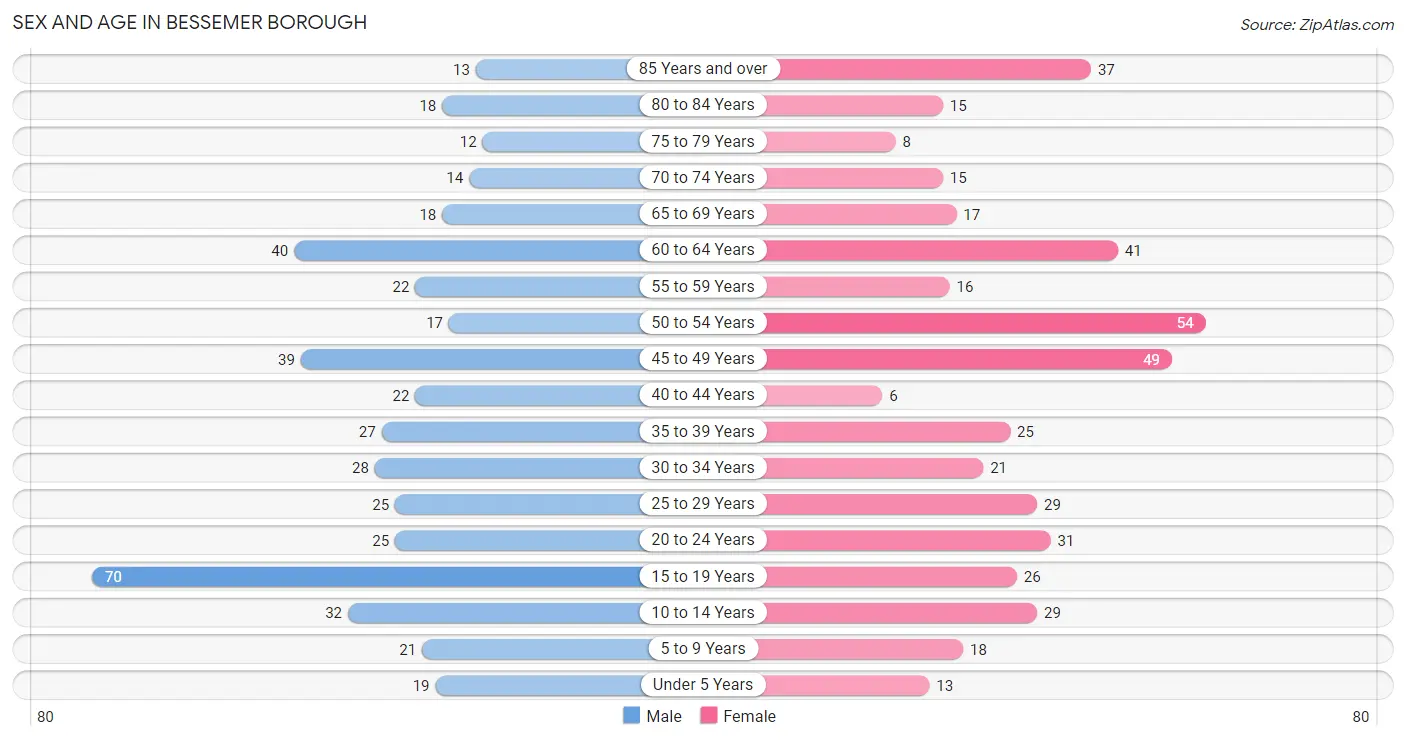
The most populous age groups in Bessemer borough are 15 to 19 Years (70 | 15.1%) for men and 50 to 54 Years (54 | 12.0%) for women.
| Age Bracket | Male | Female |
| Under 5 Years | 19 (4.1%) | 13 (2.9%) |
| 5 to 9 Years | 21 (4.5%) | 18 (4.0%) |
| 10 to 14 Years | 32 (6.9%) | 29 (6.4%) |
| 15 to 19 Years | 70 (15.1%) | 26 (5.8%) |
| 20 to 24 Years | 25 (5.4%) | 31 (6.9%) |
| 25 to 29 Years | 25 (5.4%) | 29 (6.4%) |
| 30 to 34 Years | 28 (6.1%) | 21 (4.7%) |
| 35 to 39 Years | 27 (5.8%) | 25 (5.6%) |
| 40 to 44 Years | 22 (4.8%) | 6 (1.3%) |
| 45 to 49 Years | 39 (8.4%) | 49 (10.9%) |
| 50 to 54 Years | 17 (3.7%) | 54 (12.0%) |
| 55 to 59 Years | 22 (4.8%) | 16 (3.6%) |
| 60 to 64 Years | 40 (8.7%) | 41 (9.1%) |
| 65 to 69 Years | 18 (3.9%) | 17 (3.8%) |
| 70 to 74 Years | 14 (3.0%) | 15 (3.3%) |
| 75 to 79 Years | 12 (2.6%) | 8 (1.8%) |
| 80 to 84 Years | 18 (3.9%) | 15 (3.3%) |
| 85 Years and over | 13 (2.8%) | 37 (8.2%) |
| Total | 462 (100.0%) | 450 (100.0%) |
Families and Households in Bessemer borough
Median Family Size in Bessemer borough
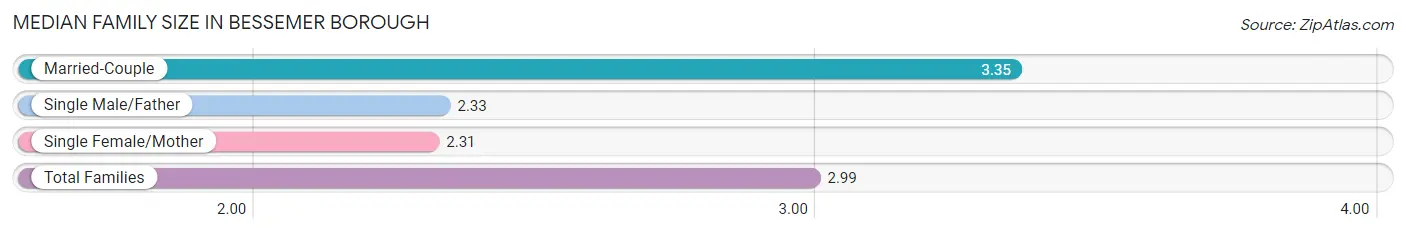
The median family size in Bessemer borough is 2.99 persons per family, with married-couple families (155 | 65.4%) accounting for the largest median family size of 3.35 persons per family. On the other hand, single female/mother families (64 | 27.0%) represent the smallest median family size with 2.31 persons per family.
| Family Type | # Families | Family Size |
| Married-Couple | 155 (65.4%) | 3.35 |
| Single Male/Father | 18 (7.6%) | 2.33 |
| Single Female/Mother | 64 (27.0%) | 2.31 |
| Total Families | 237 (100.0%) | 2.99 |
Median Household Size in Bessemer borough
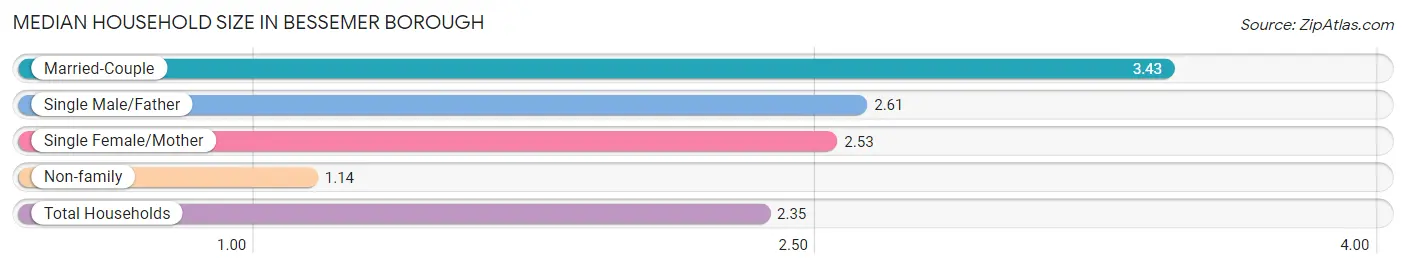
The median household size in Bessemer borough is 2.35 persons per household, with married-couple households (155 | 40.0%) accounting for the largest median household size of 3.43 persons per household. non-family households (151 | 38.9%) represent the smallest median household size with 1.14 persons per household.
| Household Type | # Households | Household Size |
| Married-Couple | 155 (40.0%) | 3.43 |
| Single Male/Father | 18 (4.6%) | 2.61 |
| Single Female/Mother | 64 (16.5%) | 2.53 |
| Non-family | 151 (38.9%) | 1.14 |
| Total Households | 388 (100.0%) | 2.35 |
Household Size by Marriage Status in Bessemer borough
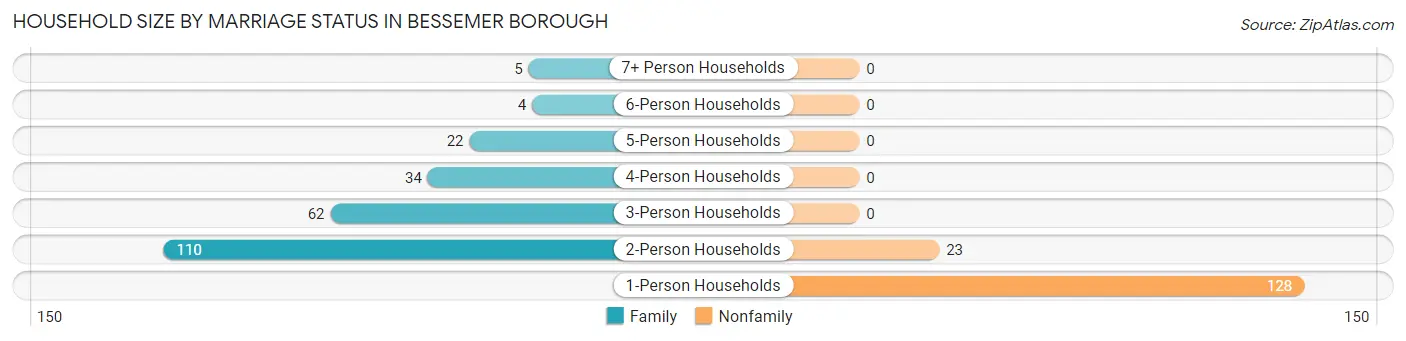
Out of a total of 388 households in Bessemer borough, 237 (61.1%) are family households, while 151 (38.9%) are nonfamily households. The most numerous type of family households are 2-person households, comprising 110, and the most common type of nonfamily households are 1-person households, comprising 128.
| Household Size | Family Households | Nonfamily Households |
| 1-Person Households | - | 128 (33.0%) |
| 2-Person Households | 110 (28.3%) | 23 (5.9%) |
| 3-Person Households | 62 (16.0%) | 0 (0.0%) |
| 4-Person Households | 34 (8.8%) | 0 (0.0%) |
| 5-Person Households | 22 (5.7%) | 0 (0.0%) |
| 6-Person Households | 4 (1.0%) | 0 (0.0%) |
| 7+ Person Households | 5 (1.3%) | 0 (0.0%) |
| Total | 237 (61.1%) | 151 (38.9%) |
Female Fertility in Bessemer borough
Fertility by Age in Bessemer borough
| Age Bracket | Women with Births | Births / 1,000 Women |
| 15 to 19 years | 0 (0.0%) | 0.0 |
| 20 to 34 years | 0 (0.0%) | 0.0 |
| 35 to 50 years | 0 (0.0%) | 0.0 |
| Total | 0 (0.0%) | 0.0 |
Fertility by Age by Marriage Status in Bessemer borough
| Age Bracket | Married | Unmarried |
| 15 to 19 years | 0 (0.0%) | 0 (0.0%) |
| 20 to 34 years | 0 (0.0%) | 0 (0.0%) |
| 35 to 50 years | 0 (0.0%) | 0 (0.0%) |
| Total | 0 (0.0%) | 0 (0.0%) |
Fertility by Education in Bessemer borough
| Educational Attainment | Women with Births | Births / 1,000 Women |
| Less than High School | 0 (0.0%) | 0.0 |
| High School Diploma | 0 (0.0%) | 0.0 |
| College or Associate's Degree | 0 (0.0%) | 0.0 |
| Bachelor's Degree | 0 (0.0%) | 0.0 |
| Graduate Degree | 0 (0.0%) | 0.0 |
| Total | 0 (0.0%) | 0.0 |
Fertility by Education by Marriage Status in Bessemer borough
| Educational Attainment | Married | Unmarried |
| Less than High School | 0 (0.0%) | 0 (0.0%) |
| High School Diploma | 0 (0.0%) | 0 (0.0%) |
| College or Associate's Degree | 0 (0.0%) | 0 (0.0%) |
| Bachelor's Degree | 0 (0.0%) | 0 (0.0%) |
| Graduate Degree | 0 (0.0%) | 0 (0.0%) |
| Total | 0 (0.0%) | 0 (0.0%) |
Employment Characteristics in Bessemer borough
Employment by Class of Employer in Bessemer borough
Among the 438 employed individuals in Bessemer borough, private company employees (344 | 78.5%), self-employed (incorporated) (21 | 4.8%), and state government employees (20 | 4.6%) make up the most common classes of employment.
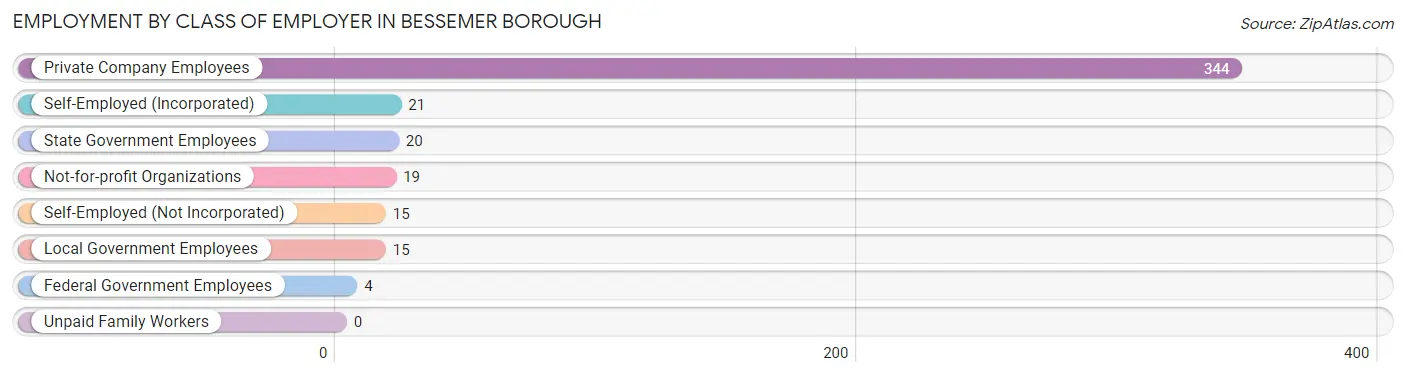
| Employer Class | # Employees | % Employees |
| Private Company Employees | 344 | 78.5% |
| Self-Employed (Incorporated) | 21 | 4.8% |
| Self-Employed (Not Incorporated) | 15 | 3.4% |
| Not-for-profit Organizations | 19 | 4.3% |
| Local Government Employees | 15 | 3.4% |
| State Government Employees | 20 | 4.6% |
| Federal Government Employees | 4 | 0.9% |
| Unpaid Family Workers | 0 | 0.0% |
| Total | 438 | 100.0% |
Employment Status by Age in Bessemer borough
According to the labor force statistics for Bessemer borough, out of the total population over 16 years of age (757), 65.1% or 493 individuals are in the labor force, with 8.7% or 43 of them unemployed. The age group with the highest labor force participation rate is 20 to 24 years, with 100.0% or 56 individuals in the labor force. Within the labor force, the 16 to 19 years age range has the highest percentage of unemployed individuals, with 22.6% or 12 of them being unemployed.
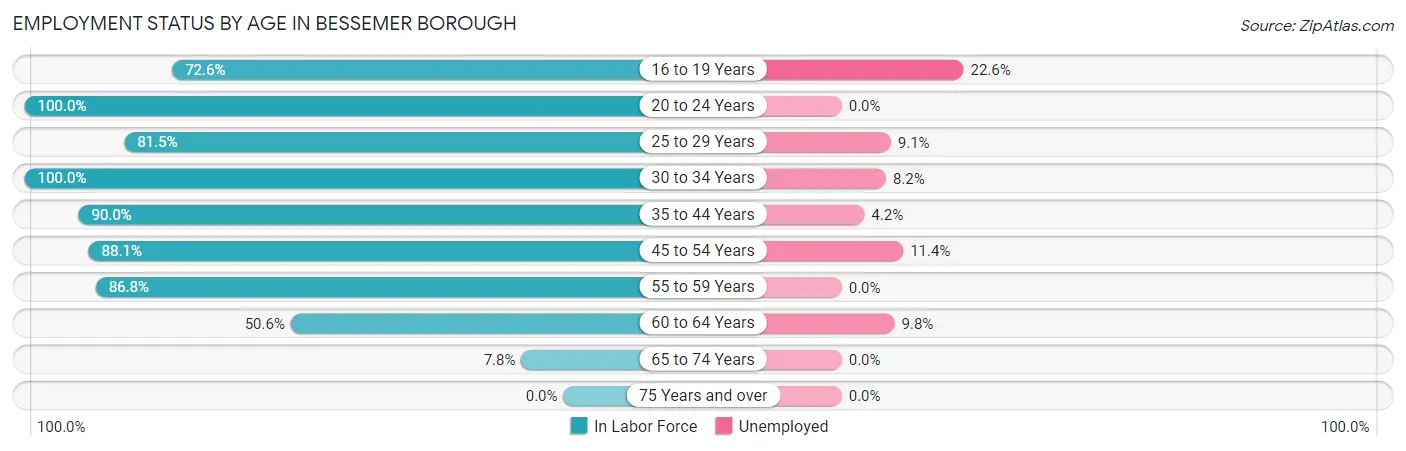
| Age Bracket | In Labor Force | Unemployed |
| 16 to 19 Years | 53 (72.6%) | 12 (22.6%) |
| 20 to 24 Years | 56 (100.0%) | 0 (0.0%) |
| 25 to 29 Years | 44 (81.5%) | 4 (9.1%) |
| 30 to 34 Years | 49 (100.0%) | 4 (8.2%) |
| 35 to 44 Years | 72 (90.0%) | 3 (4.2%) |
| 45 to 54 Years | 140 (88.1%) | 16 (11.4%) |
| 55 to 59 Years | 33 (86.8%) | 0 (0.0%) |
| 60 to 64 Years | 41 (50.6%) | 4 (9.8%) |
| 65 to 74 Years | 5 (7.8%) | 0 (0.0%) |
| 75 Years and over | 0 (0.0%) | 0 (0.0%) |
| Total | 493 (65.1%) | 43 (8.7%) |
Employment Status by Educational Attainment in Bessemer borough
According to labor force statistics for Bessemer borough, 82.2% of individuals (379) out of the total population between 25 and 64 years of age (461) are in the labor force, with 8.2% or 31 of them being unemployed. The group with the highest labor force participation rate are those with the educational attainment of bachelor's degree or higher, with 100.0% or 70 individuals in the labor force. Within the labor force, individuals with less than high school education have the highest percentage of unemployment, with 18.8% or 3 of them being unemployed.
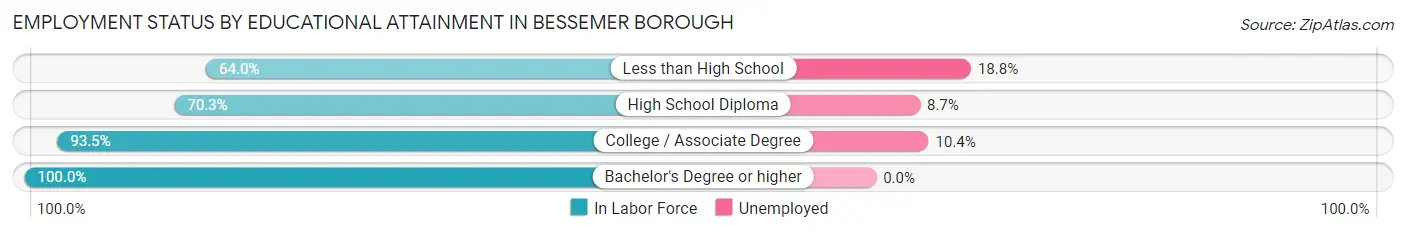
| Educational Attainment | In Labor Force | Unemployed |
| Less than High School | 16 (64.0%) | 5 (18.8%) |
| High School Diploma | 149 (70.3%) | 18 (8.7%) |
| College / Associate Degree | 144 (93.5%) | 16 (10.4%) |
| Bachelor's Degree or higher | 70 (100.0%) | 0 (0.0%) |
| Total | 379 (82.2%) | 38 (8.2%) |
Employment Occupations by Sex in Bessemer borough
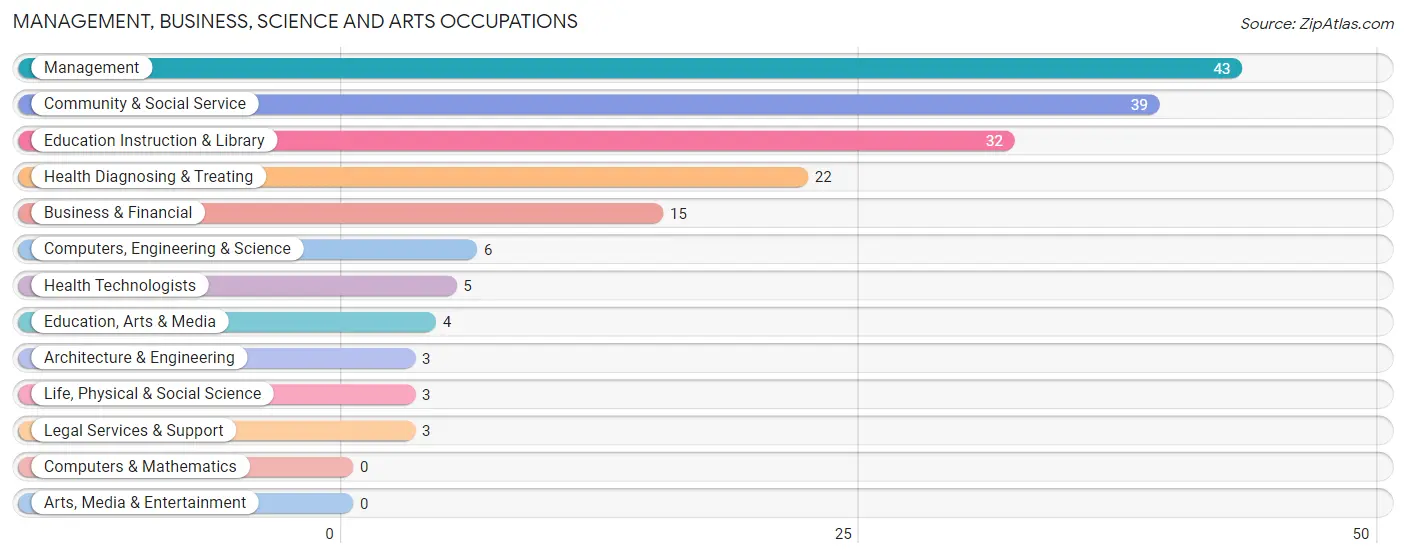
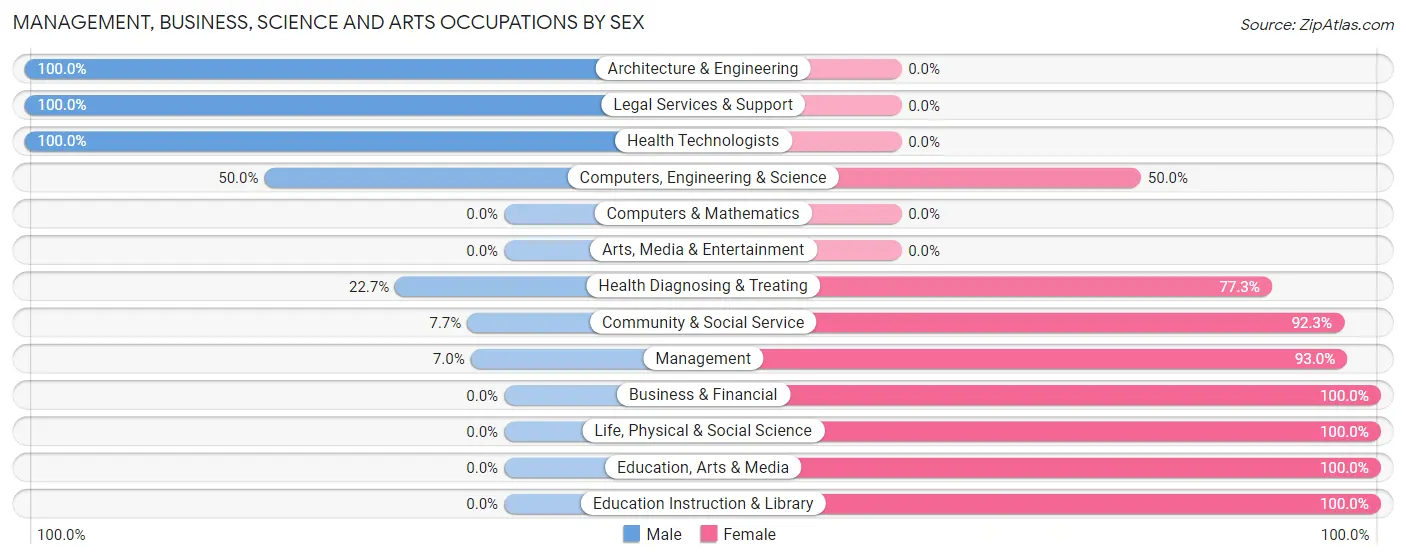
Management, Business, Science and Arts Occupations
The most common Management, Business, Science and Arts occupations in Bessemer borough are Management (43 | 9.6%), Community & Social Service (39 | 8.7%), Education Instruction & Library (32 | 7.1%), Health Diagnosing & Treating (22 | 4.9%), and Business & Financial (15 | 3.3%).
Management, Business, Science and Arts Occupations by Sex
Within the Management, Business, Science and Arts occupations in Bessemer borough, the most male-oriented occupations are Architecture & Engineering (100.0%), Legal Services & Support (100.0%), and Health Technologists (100.0%), while the most female-oriented occupations are Business & Financial (100.0%), Life, Physical & Social Science (100.0%), and Education, Arts & Media (100.0%).
| Occupation | Male | Female |
| Management | 3 (7.0%) | 40 (93.0%) |
| Business & Financial | 0 (0.0%) | 15 (100.0%) |
| Computers, Engineering & Science | 3 (50.0%) | 3 (50.0%) |
| Computers & Mathematics | 0 (0.0%) | 0 (0.0%) |
| Architecture & Engineering | 3 (100.0%) | 0 (0.0%) |
| Life, Physical & Social Science | 0 (0.0%) | 3 (100.0%) |
| Community & Social Service | 3 (7.7%) | 36 (92.3%) |
| Education, Arts & Media | 0 (0.0%) | 4 (100.0%) |
| Legal Services & Support | 3 (100.0%) | 0 (0.0%) |
| Education Instruction & Library | 0 (0.0%) | 32 (100.0%) |
| Arts, Media & Entertainment | 0 (0.0%) | 0 (0.0%) |
| Health Diagnosing & Treating | 5 (22.7%) | 17 (77.3%) |
| Health Technologists | 5 (100.0%) | 0 (0.0%) |
| Total (Category) | 14 (11.2%) | 111 (88.8%) |
| Total (Overall) | 232 (51.6%) | 218 (48.4%) |
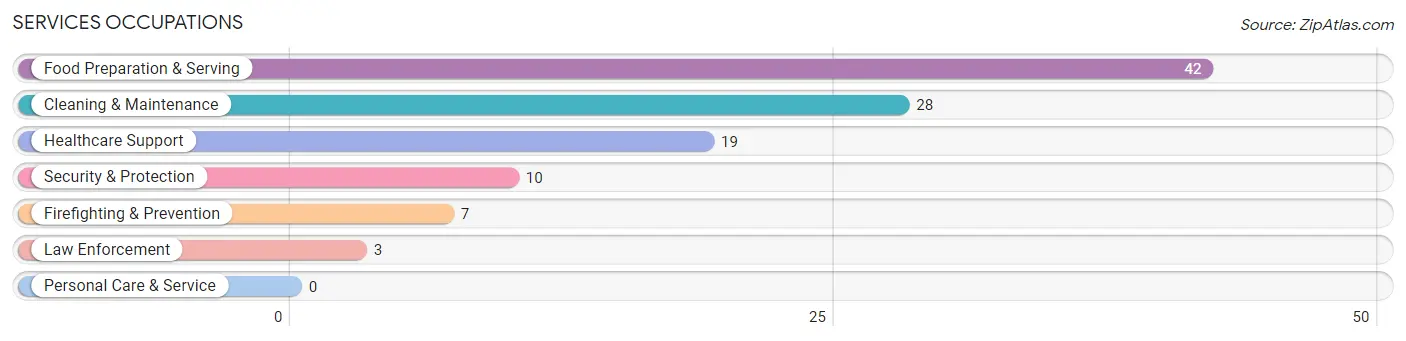
Services Occupations
The most common Services occupations in Bessemer borough are Food Preparation & Serving (42 | 9.3%), Cleaning & Maintenance (28 | 6.2%), Healthcare Support (19 | 4.2%), Security & Protection (10 | 2.2%), and Firefighting & Prevention (7 | 1.6%).
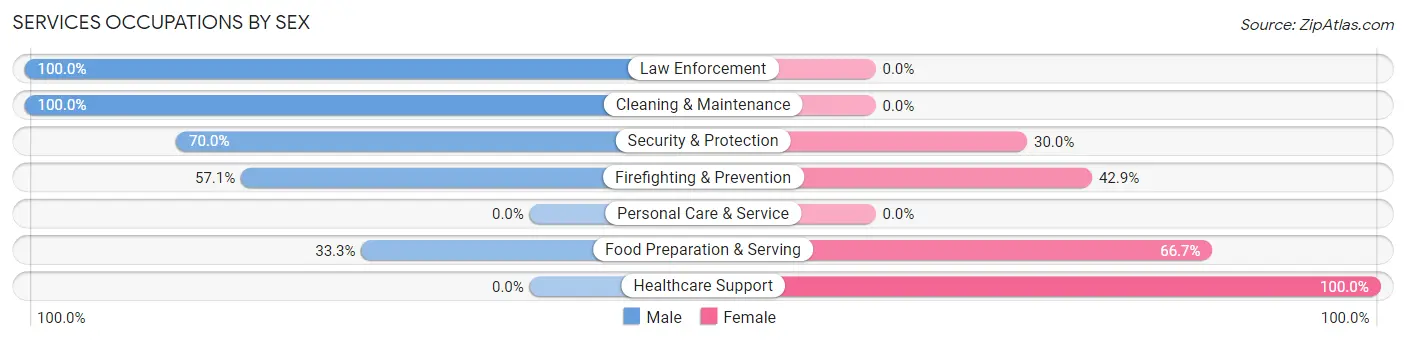
Services Occupations by Sex
Within the Services occupations in Bessemer borough, the most male-oriented occupations are Law Enforcement (100.0%), Cleaning & Maintenance (100.0%), and Security & Protection (70.0%), while the most female-oriented occupations are Healthcare Support (100.0%), Food Preparation & Serving (66.7%), and Firefighting & Prevention (42.9%).
| Occupation | Male | Female |
| Healthcare Support | 0 (0.0%) | 19 (100.0%) |
| Security & Protection | 7 (70.0%) | 3 (30.0%) |
| Firefighting & Prevention | 4 (57.1%) | 3 (42.9%) |
| Law Enforcement | 3 (100.0%) | 0 (0.0%) |
| Food Preparation & Serving | 14 (33.3%) | 28 (66.7%) |
| Cleaning & Maintenance | 28 (100.0%) | 0 (0.0%) |
| Personal Care & Service | 0 (0.0%) | 0 (0.0%) |
| Total (Category) | 49 (49.5%) | 50 (50.5%) |
| Total (Overall) | 232 (51.6%) | 218 (48.4%) |
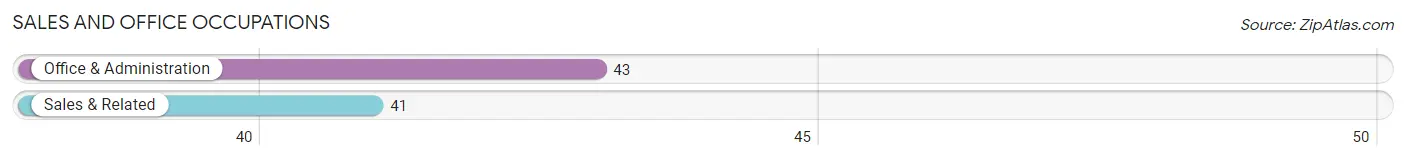
Sales and Office Occupations
The most common Sales and Office occupations in Bessemer borough are Office & Administration (43 | 9.6%), and Sales & Related (41 | 9.1%).
Sales and Office Occupations by Sex
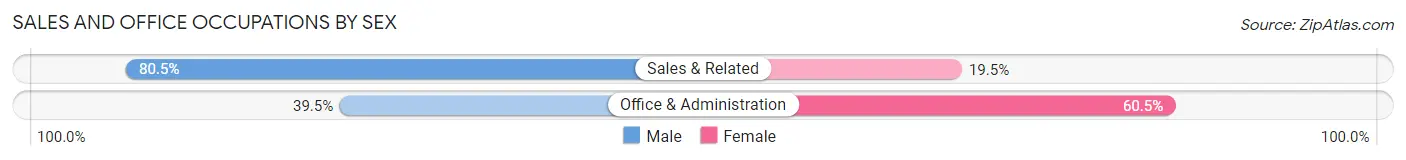
| Occupation | Male | Female |
| Sales & Related | 33 (80.5%) | 8 (19.5%) |
| Office & Administration | 17 (39.5%) | 26 (60.5%) |
| Total (Category) | 50 (59.5%) | 34 (40.5%) |
| Total (Overall) | 232 (51.6%) | 218 (48.4%) |
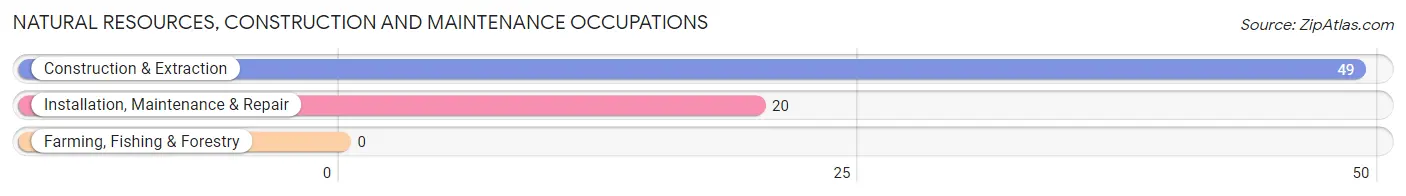
Natural Resources, Construction and Maintenance Occupations
The most common Natural Resources, Construction and Maintenance occupations in Bessemer borough are Construction & Extraction (49 | 10.9%), and Installation, Maintenance & Repair (20 | 4.4%).
Natural Resources, Construction and Maintenance Occupations by Sex
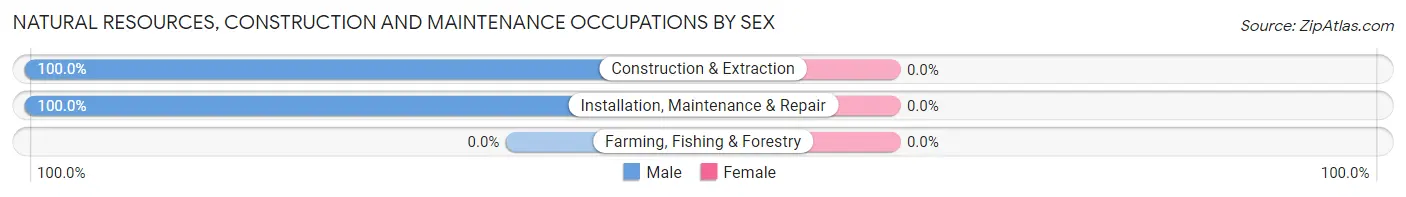
| Occupation | Male | Female |
| Farming, Fishing & Forestry | 0 (0.0%) | 0 (0.0%) |
| Construction & Extraction | 49 (100.0%) | 0 (0.0%) |
| Installation, Maintenance & Repair | 20 (100.0%) | 0 (0.0%) |
| Total (Category) | 69 (100.0%) | 0 (0.0%) |
| Total (Overall) | 232 (51.6%) | 218 (48.4%) |
Production, Transportation and Moving Occupations
The most common Production, Transportation and Moving occupations in Bessemer borough are Production (34 | 7.6%), Transportation (24 | 5.3%), and Material Moving (15 | 3.3%).
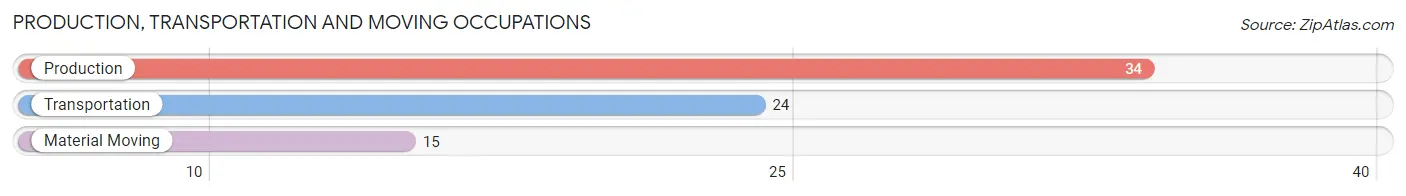
Production, Transportation and Moving Occupations by Sex
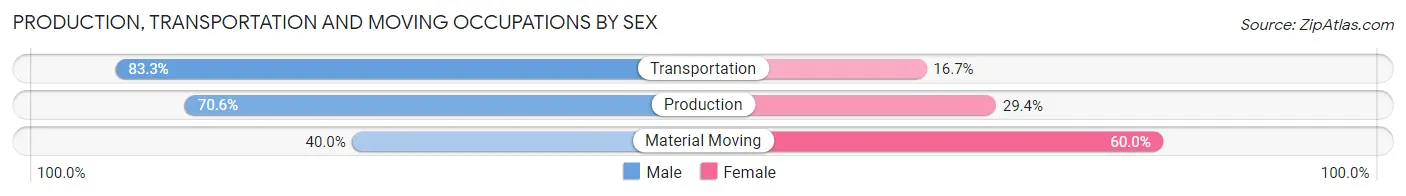
| Occupation | Male | Female |
| Production | 24 (70.6%) | 10 (29.4%) |
| Transportation | 20 (83.3%) | 4 (16.7%) |
| Material Moving | 6 (40.0%) | 9 (60.0%) |
| Total (Category) | 50 (68.5%) | 23 (31.5%) |
| Total (Overall) | 232 (51.6%) | 218 (48.4%) |
Employment Industries by Sex in Bessemer borough
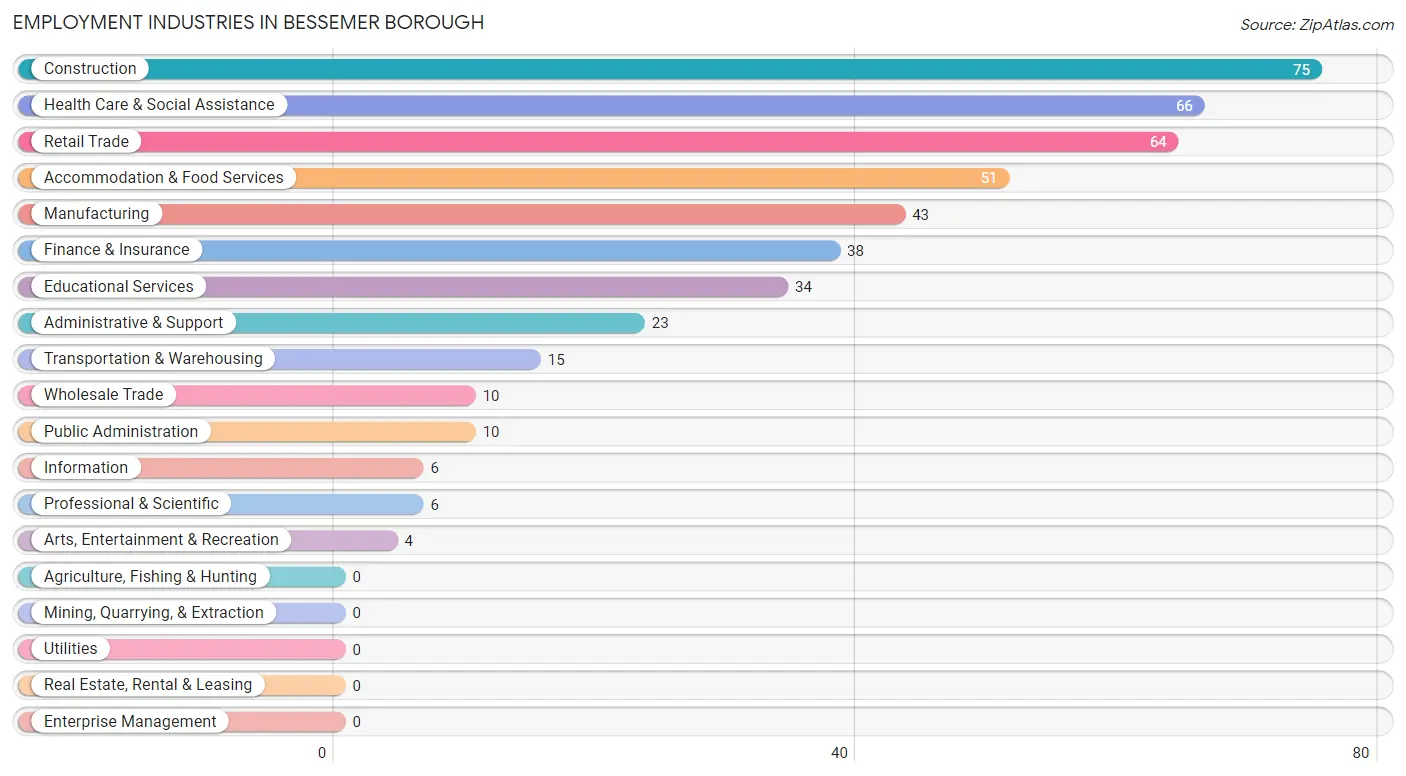
Employment Industries in Bessemer borough
The major employment industries in Bessemer borough include Construction (75 | 16.7%), Health Care & Social Assistance (66 | 14.7%), Retail Trade (64 | 14.2%), Accommodation & Food Services (51 | 11.3%), and Manufacturing (43 | 9.6%).
Employment Industries by Sex in Bessemer borough
The Bessemer borough industries that see more men than women are Administrative & Support (100.0%), Arts, Entertainment & Recreation (100.0%), and Construction (86.7%), whereas the industries that tend to have a higher number of women are Information (100.0%), Finance & Insurance (100.0%), and Educational Services (97.1%).
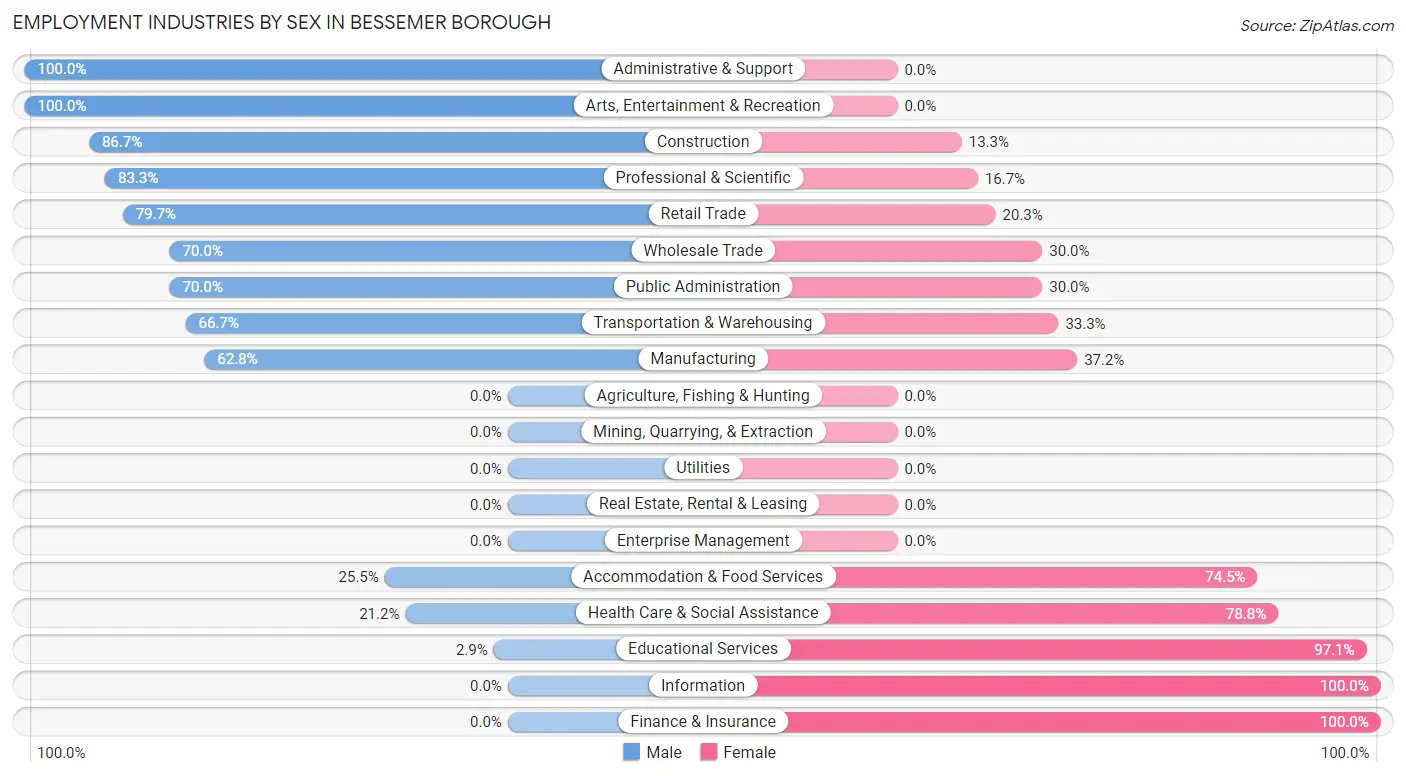
| Industry | Male | Female |
| Agriculture, Fishing & Hunting | 0 (0.0%) | 0 (0.0%) |
| Mining, Quarrying, & Extraction | 0 (0.0%) | 0 (0.0%) |
| Construction | 65 (86.7%) | 10 (13.3%) |
| Manufacturing | 27 (62.8%) | 16 (37.2%) |
| Wholesale Trade | 7 (70.0%) | 3 (30.0%) |
| Retail Trade | 51 (79.7%) | 13 (20.3%) |
| Transportation & Warehousing | 10 (66.7%) | 5 (33.3%) |
| Utilities | 0 (0.0%) | 0 (0.0%) |
| Information | 0 (0.0%) | 6 (100.0%) |
| Finance & Insurance | 0 (0.0%) | 38 (100.0%) |
| Real Estate, Rental & Leasing | 0 (0.0%) | 0 (0.0%) |
| Professional & Scientific | 5 (83.3%) | 1 (16.7%) |
| Enterprise Management | 0 (0.0%) | 0 (0.0%) |
| Administrative & Support | 23 (100.0%) | 0 (0.0%) |
| Educational Services | 1 (2.9%) | 33 (97.1%) |
| Health Care & Social Assistance | 14 (21.2%) | 52 (78.8%) |
| Arts, Entertainment & Recreation | 4 (100.0%) | 0 (0.0%) |
| Accommodation & Food Services | 13 (25.5%) | 38 (74.5%) |
| Public Administration | 7 (70.0%) | 3 (30.0%) |
| Total | 232 (51.6%) | 218 (48.4%) |
Education in Bessemer borough
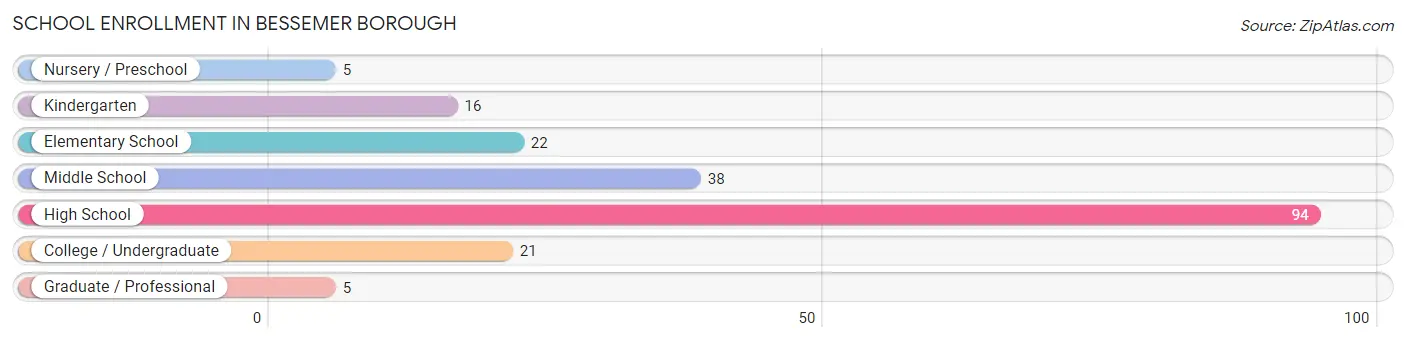
School Enrollment in Bessemer borough
The most common levels of schooling among the 201 students in Bessemer borough are high school (94 | 46.8%), middle school (38 | 18.9%), and elementary school (22 | 11.0%).
| School Level | # Students | % Students |
| Nursery / Preschool | 5 | 2.5% |
| Kindergarten | 16 | 8.0% |
| Elementary School | 22 | 11.0% |
| Middle School | 38 | 18.9% |
| High School | 94 | 46.8% |
| College / Undergraduate | 21 | 10.4% |
| Graduate / Professional | 5 | 2.5% |
| Total | 201 | 100.0% |
School Enrollment by Age by Funding Source in Bessemer borough
Out of a total of 201 students who are enrolled in schools in Bessemer borough, 17 (8.5%) attend a private institution, while the remaining 184 (91.5%) are enrolled in public schools. The age group of 20 to 24 year olds has the highest likelihood of being enrolled in private schools, with 10 (71.4% in the age bracket) enrolled. Conversely, the age group of 5 to 9 year old has the lowest likelihood of being enrolled in a private school, with 34 (100.0% in the age bracket) attending a public institution.
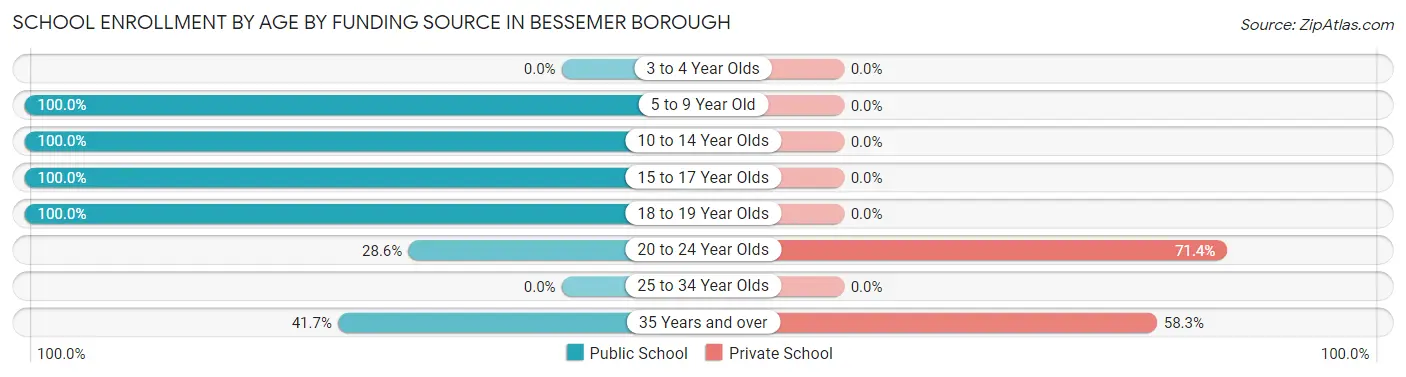
| Age Bracket | Public School | Private School |
| 3 to 4 Year Olds | 0 (0.0%) | 0 (0.0%) |
| 5 to 9 Year Old | 34 (100.0%) | 0 (0.0%) |
| 10 to 14 Year Olds | 61 (100.0%) | 0 (0.0%) |
| 15 to 17 Year Olds | 71 (100.0%) | 0 (0.0%) |
| 18 to 19 Year Olds | 9 (100.0%) | 0 (0.0%) |
| 20 to 24 Year Olds | 4 (28.6%) | 10 (71.4%) |
| 25 to 34 Year Olds | 0 (0.0%) | 0 (0.0%) |
| 35 Years and over | 5 (41.7%) | 7 (58.3%) |
| Total | 184 (91.5%) | 17 (8.5%) |
Educational Attainment by Field of Study in Bessemer borough
Education (24 | 28.2%), science & technology (16 | 18.8%), business (16 | 18.8%), physical & health sciences (9 | 10.6%), and arts & humanities (6 | 7.1%) are the most common fields of study among 85 individuals in Bessemer borough who have obtained a bachelor's degree or higher.
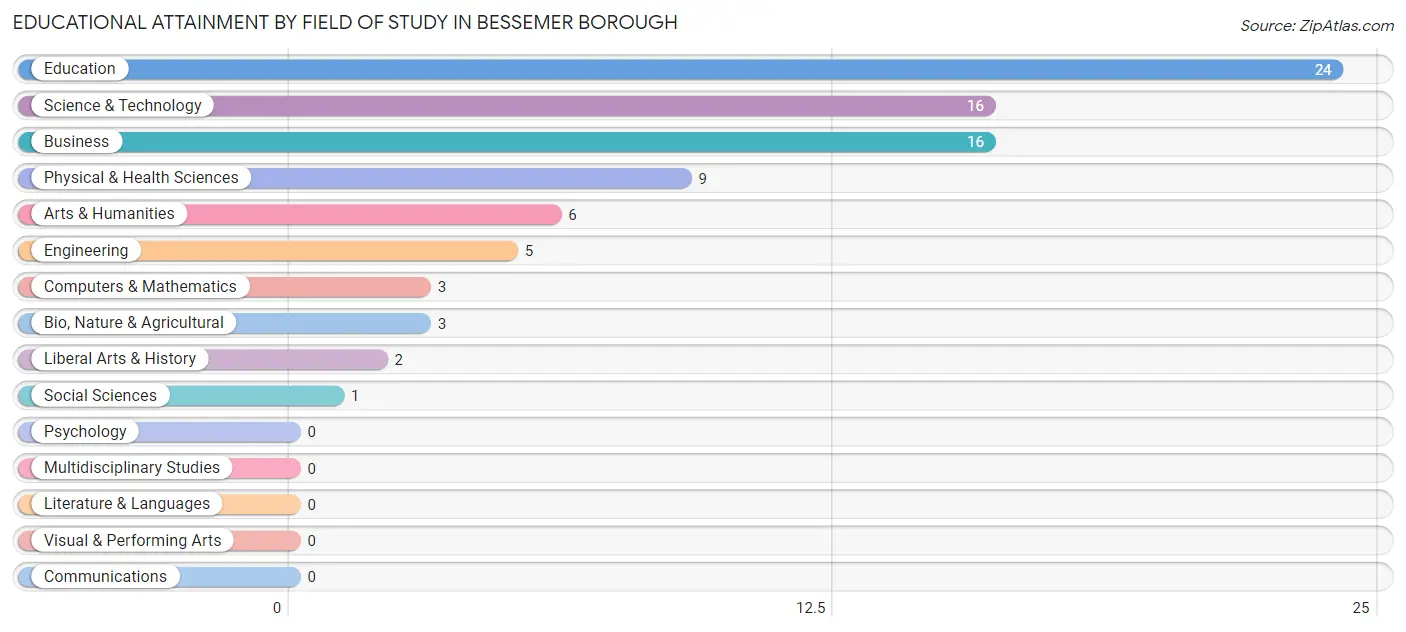
| Field of Study | # Graduates | % Graduates |
| Computers & Mathematics | 3 | 3.5% |
| Bio, Nature & Agricultural | 3 | 3.5% |
| Physical & Health Sciences | 9 | 10.6% |
| Psychology | 0 | 0.0% |
| Social Sciences | 1 | 1.2% |
| Engineering | 5 | 5.9% |
| Multidisciplinary Studies | 0 | 0.0% |
| Science & Technology | 16 | 18.8% |
| Business | 16 | 18.8% |
| Education | 24 | 28.2% |
| Literature & Languages | 0 | 0.0% |
| Liberal Arts & History | 2 | 2.4% |
| Visual & Performing Arts | 0 | 0.0% |
| Communications | 0 | 0.0% |
| Arts & Humanities | 6 | 7.1% |
| Total | 85 | 100.0% |
Transportation & Commute in Bessemer borough
Vehicle Availability by Sex in Bessemer borough
The most prevalent vehicle ownership categories in Bessemer borough are males with 3 vehicles (78, accounting for 35.0%) and females with 3 vehicles (44, making up 36.3%).
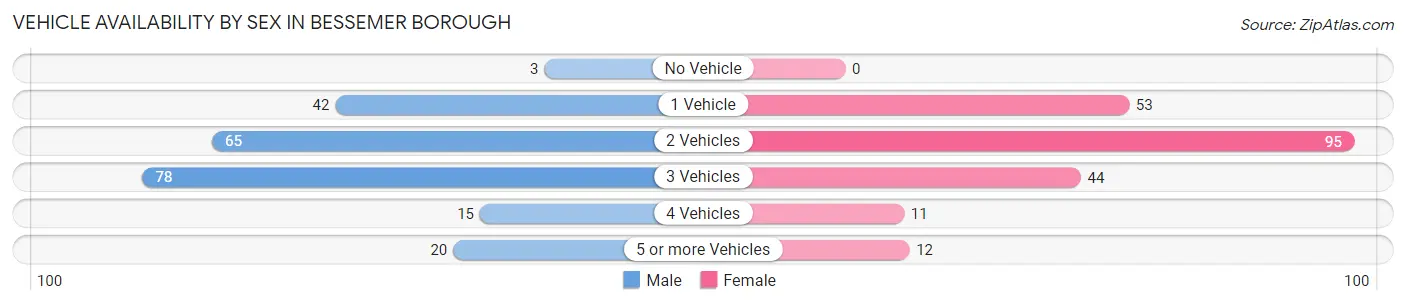
| Vehicles Available | Male | Female |
| No Vehicle | 3 (1.3%) | 0 (0.0%) |
| 1 Vehicle | 42 (18.8%) | 53 (24.6%) |
| 2 Vehicles | 65 (29.1%) | 95 (44.2%) |
| 3 Vehicles | 78 (35.0%) | 44 (20.5%) |
| 4 Vehicles | 15 (6.7%) | 11 (5.1%) |
| 5 or more Vehicles | 20 (9.0%) | 12 (5.6%) |
| Total | 223 (100.0%) | 215 (100.0%) |
Commute Time in Bessemer borough
The most frequently occuring commute durations in Bessemer borough are 30 to 34 minutes (65 commuters, 15.5%), 45 to 59 minutes (64 commuters, 15.3%), and 15 to 19 minutes (61 commuters, 14.6%).
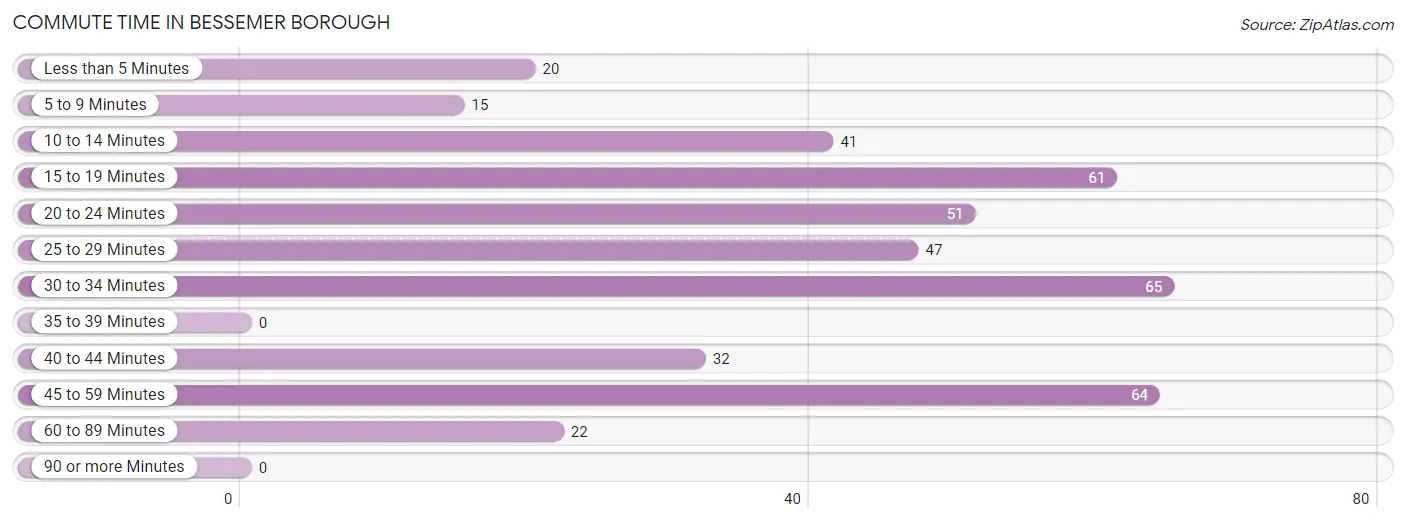
| Commute Time | # Commuters | % Commuters |
| Less than 5 Minutes | 20 | 4.8% |
| 5 to 9 Minutes | 15 | 3.6% |
| 10 to 14 Minutes | 41 | 9.8% |
| 15 to 19 Minutes | 61 | 14.6% |
| 20 to 24 Minutes | 51 | 12.2% |
| 25 to 29 Minutes | 47 | 11.2% |
| 30 to 34 Minutes | 65 | 15.5% |
| 35 to 39 Minutes | 0 | 0.0% |
| 40 to 44 Minutes | 32 | 7.7% |
| 45 to 59 Minutes | 64 | 15.3% |
| 60 to 89 Minutes | 22 | 5.3% |
| 90 or more Minutes | 0 | 0.0% |
Commute Time by Sex in Bessemer borough
The most common commute times in Bessemer borough are 15 to 19 minutes (42 commuters, 19.3%) for males and 30 to 34 minutes (50 commuters, 25.0%) for females.
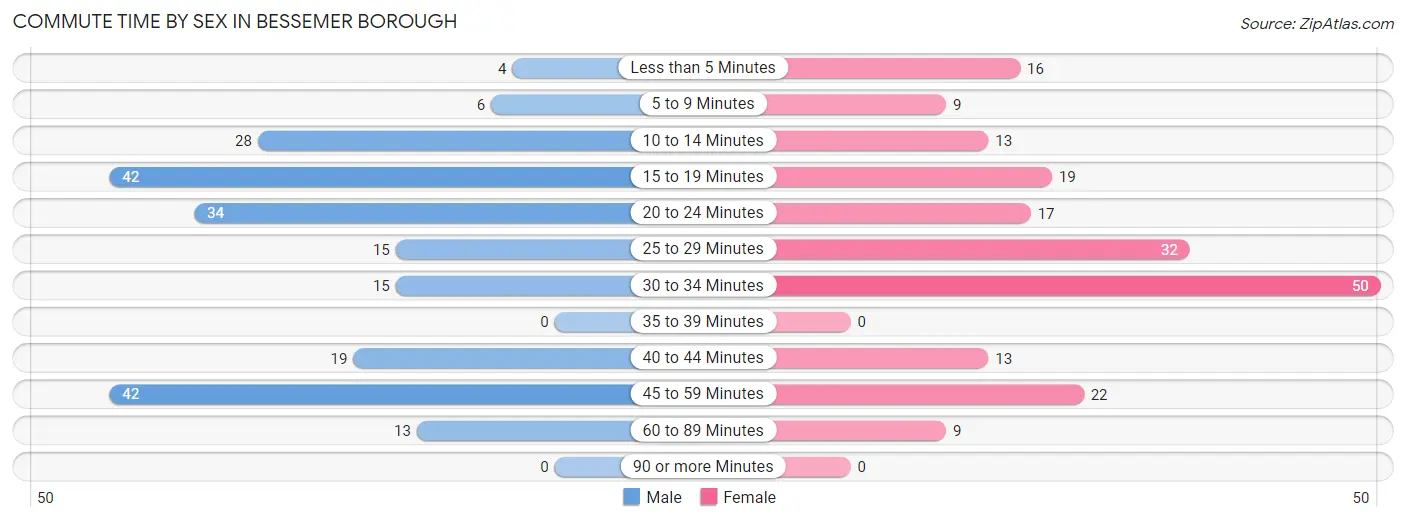
| Commute Time | Male | Female |
| Less than 5 Minutes | 4 (1.8%) | 16 (8.0%) |
| 5 to 9 Minutes | 6 (2.8%) | 9 (4.5%) |
| 10 to 14 Minutes | 28 (12.8%) | 13 (6.5%) |
| 15 to 19 Minutes | 42 (19.3%) | 19 (9.5%) |
| 20 to 24 Minutes | 34 (15.6%) | 17 (8.5%) |
| 25 to 29 Minutes | 15 (6.9%) | 32 (16.0%) |
| 30 to 34 Minutes | 15 (6.9%) | 50 (25.0%) |
| 35 to 39 Minutes | 0 (0.0%) | 0 (0.0%) |
| 40 to 44 Minutes | 19 (8.7%) | 13 (6.5%) |
| 45 to 59 Minutes | 42 (19.3%) | 22 (11.0%) |
| 60 to 89 Minutes | 13 (6.0%) | 9 (4.5%) |
| 90 or more Minutes | 0 (0.0%) | 0 (0.0%) |
Time of Departure to Work by Sex in Bessemer borough
The most frequent times of departure to work in Bessemer borough are 7:00 AM to 7:29 AM (44, 20.2%) for males and 7:00 AM to 7:29 AM (41, 20.5%) for females.
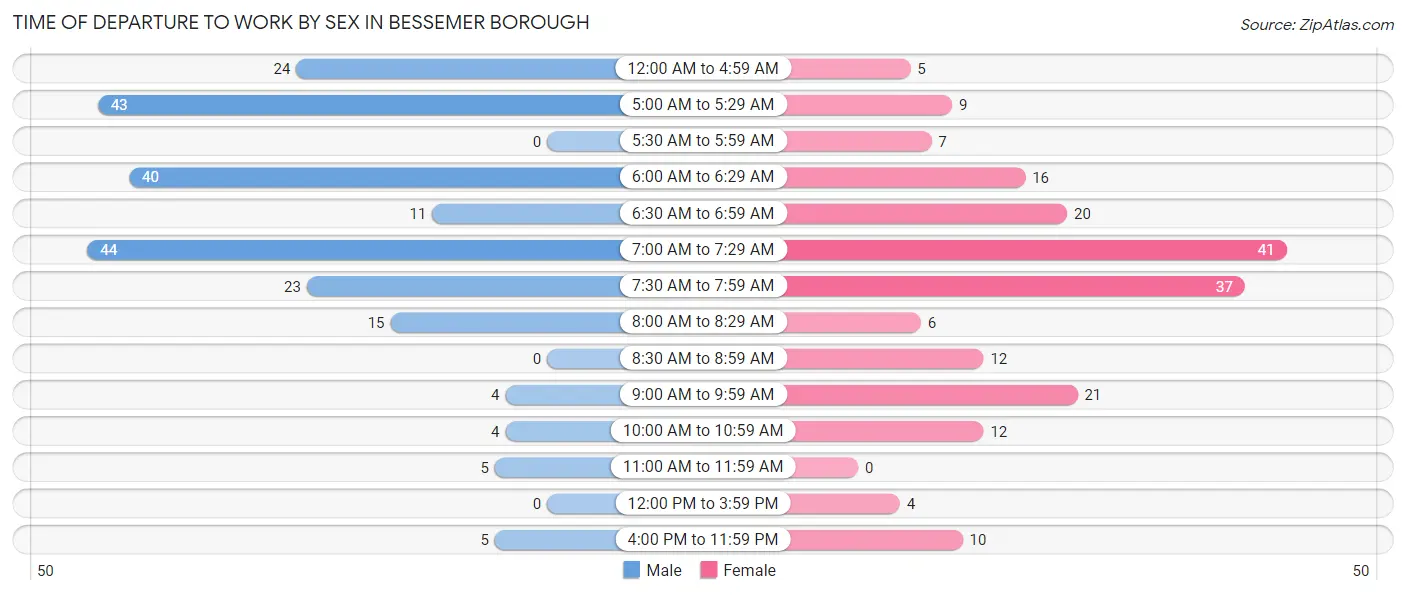
| Time of Departure | Male | Female |
| 12:00 AM to 4:59 AM | 24 (11.0%) | 5 (2.5%) |
| 5:00 AM to 5:29 AM | 43 (19.7%) | 9 (4.5%) |
| 5:30 AM to 5:59 AM | 0 (0.0%) | 7 (3.5%) |
| 6:00 AM to 6:29 AM | 40 (18.3%) | 16 (8.0%) |
| 6:30 AM to 6:59 AM | 11 (5.1%) | 20 (10.0%) |
| 7:00 AM to 7:29 AM | 44 (20.2%) | 41 (20.5%) |
| 7:30 AM to 7:59 AM | 23 (10.5%) | 37 (18.5%) |
| 8:00 AM to 8:29 AM | 15 (6.9%) | 6 (3.0%) |
| 8:30 AM to 8:59 AM | 0 (0.0%) | 12 (6.0%) |
| 9:00 AM to 9:59 AM | 4 (1.8%) | 21 (10.5%) |
| 10:00 AM to 10:59 AM | 4 (1.8%) | 12 (6.0%) |
| 11:00 AM to 11:59 AM | 5 (2.3%) | 0 (0.0%) |
| 12:00 PM to 3:59 PM | 0 (0.0%) | 4 (2.0%) |
| 4:00 PM to 11:59 PM | 5 (2.3%) | 10 (5.0%) |
| Total | 218 (100.0%) | 200 (100.0%) |
Housing Occupancy in Bessemer borough
Occupancy by Ownership in Bessemer borough
Of the total 388 dwellings in Bessemer borough, owner-occupied units account for 308 (79.4%), while renter-occupied units make up 80 (20.6%).
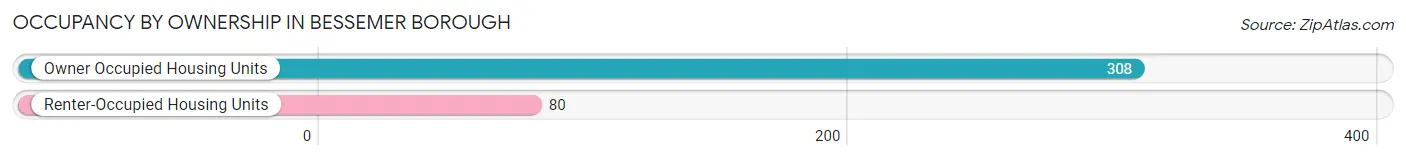
| Occupancy | # Housing Units | % Housing Units |
| Owner Occupied Housing Units | 308 | 79.4% |
| Renter-Occupied Housing Units | 80 | 20.6% |
| Total Occupied Housing Units | 388 | 100.0% |
Occupancy by Household Size in Bessemer borough
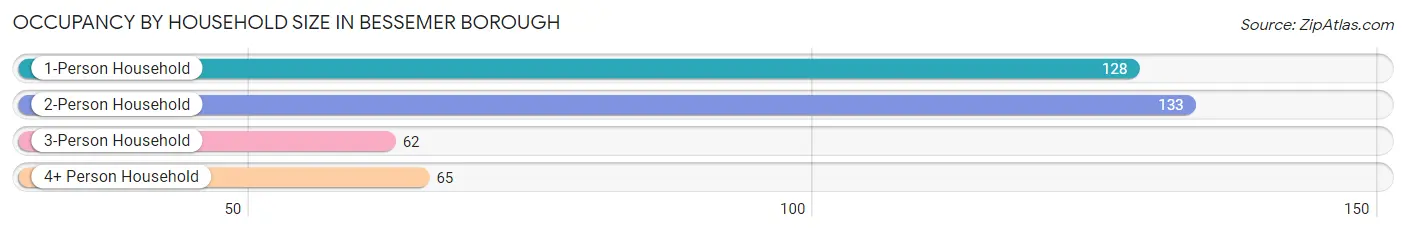
| Household Size | # Housing Units | % Housing Units |
| 1-Person Household | 128 | 33.0% |
| 2-Person Household | 133 | 34.3% |
| 3-Person Household | 62 | 16.0% |
| 4+ Person Household | 65 | 16.8% |
| Total Housing Units | 388 | 100.0% |
Occupancy by Ownership by Household Size in Bessemer borough
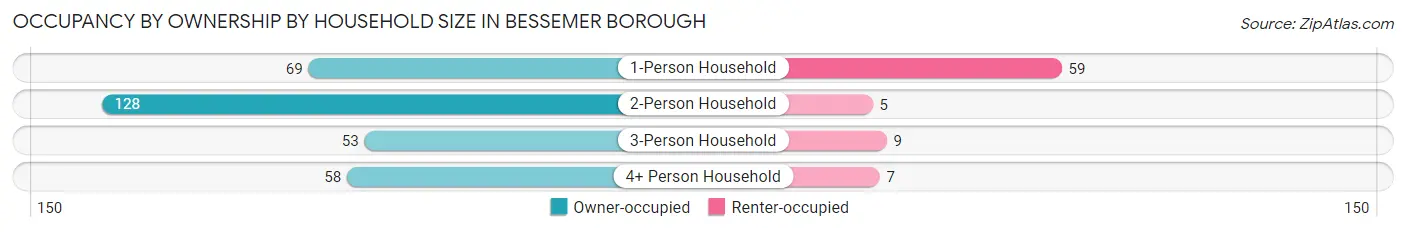
| Household Size | Owner-occupied | Renter-occupied |
| 1-Person Household | 69 (53.9%) | 59 (46.1%) |
| 2-Person Household | 128 (96.2%) | 5 (3.8%) |
| 3-Person Household | 53 (85.5%) | 9 (14.5%) |
| 4+ Person Household | 58 (89.2%) | 7 (10.8%) |
| Total Housing Units | 308 (79.4%) | 80 (20.6%) |
Occupancy by Educational Attainment in Bessemer borough
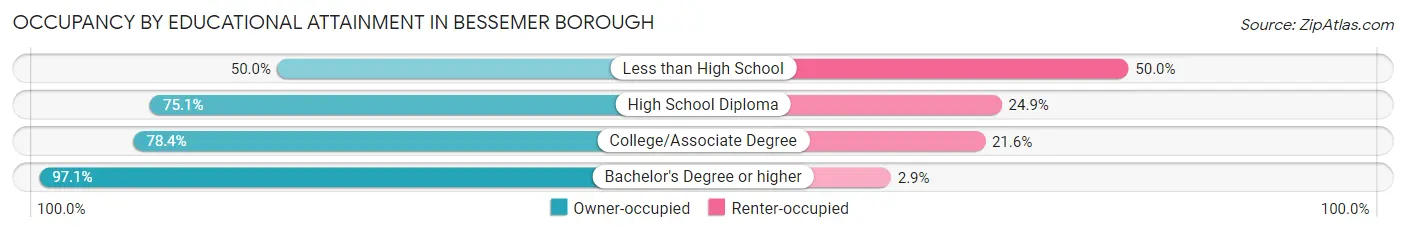
| Household Size | Owner-occupied | Renter-occupied |
| Less than High School | 4 (50.0%) | 4 (50.0%) |
| High School Diploma | 157 (75.1%) | 52 (24.9%) |
| College/Associate Degree | 80 (78.4%) | 22 (21.6%) |
| Bachelor's Degree or higher | 67 (97.1%) | 2 (2.9%) |
Occupancy by Age of Householder in Bessemer borough
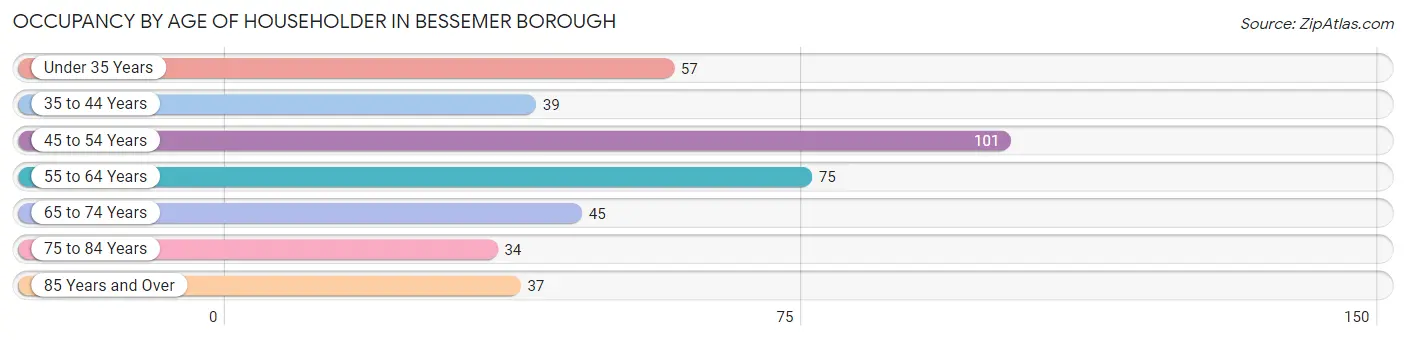
| Age Bracket | # Households | % Households |
| Under 35 Years | 57 | 14.7% |
| 35 to 44 Years | 39 | 10.1% |
| 45 to 54 Years | 101 | 26.0% |
| 55 to 64 Years | 75 | 19.3% |
| 65 to 74 Years | 45 | 11.6% |
| 75 to 84 Years | 34 | 8.8% |
| 85 Years and Over | 37 | 9.5% |
| Total | 388 | 100.0% |
Housing Finances in Bessemer borough
Median Income by Occupancy in Bessemer borough
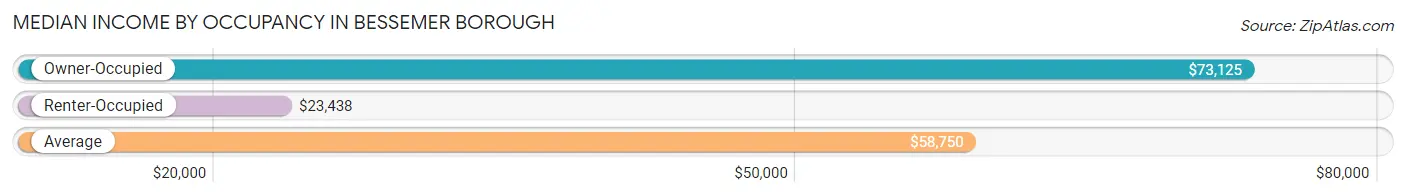
| Occupancy Type | # Households | Median Income |
| Owner-Occupied | 308 (79.4%) | $73,125 |
| Renter-Occupied | 80 (20.6%) | $23,438 |
| Average | 388 (100.0%) | $58,750 |
Occupancy by Householder Income Bracket in Bessemer borough
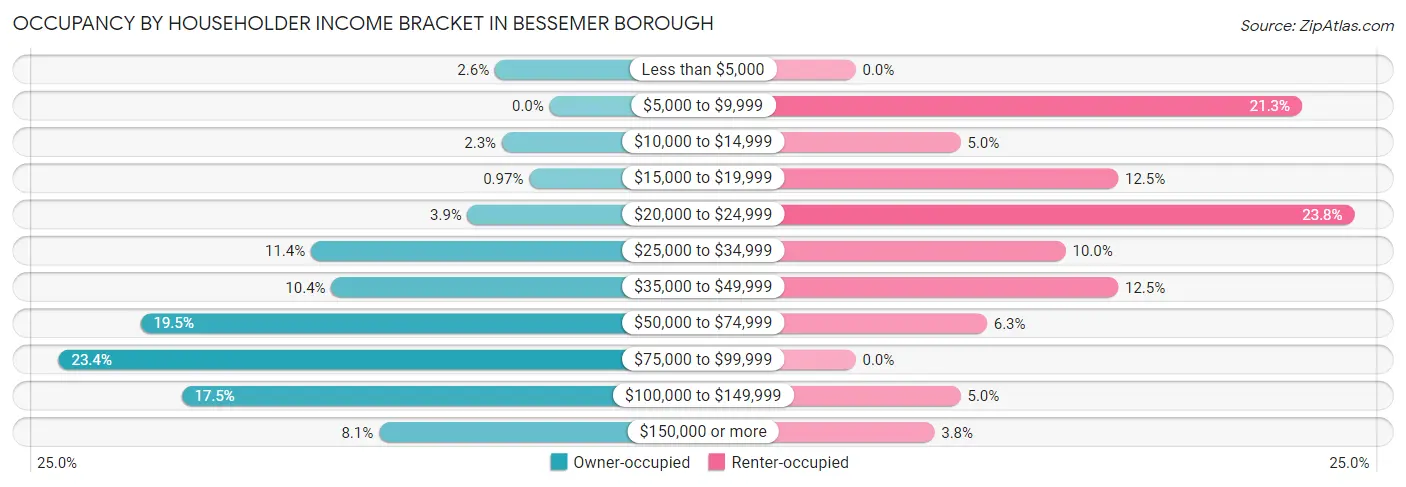
| Income Bracket | Owner-occupied | Renter-occupied |
| Less than $5,000 | 8 (2.6%) | 0 (0.0%) |
| $5,000 to $9,999 | 0 (0.0%) | 17 (21.2%) |
| $10,000 to $14,999 | 7 (2.3%) | 4 (5.0%) |
| $15,000 to $19,999 | 3 (1.0%) | 10 (12.5%) |
| $20,000 to $24,999 | 12 (3.9%) | 19 (23.7%) |
| $25,000 to $34,999 | 35 (11.4%) | 8 (10.0%) |
| $35,000 to $49,999 | 32 (10.4%) | 10 (12.5%) |
| $50,000 to $74,999 | 60 (19.5%) | 5 (6.2%) |
| $75,000 to $99,999 | 72 (23.4%) | 0 (0.0%) |
| $100,000 to $149,999 | 54 (17.5%) | 4 (5.0%) |
| $150,000 or more | 25 (8.1%) | 3 (3.7%) |
| Total | 308 (100.0%) | 80 (100.0%) |
Monthly Housing Cost Tiers in Bessemer borough
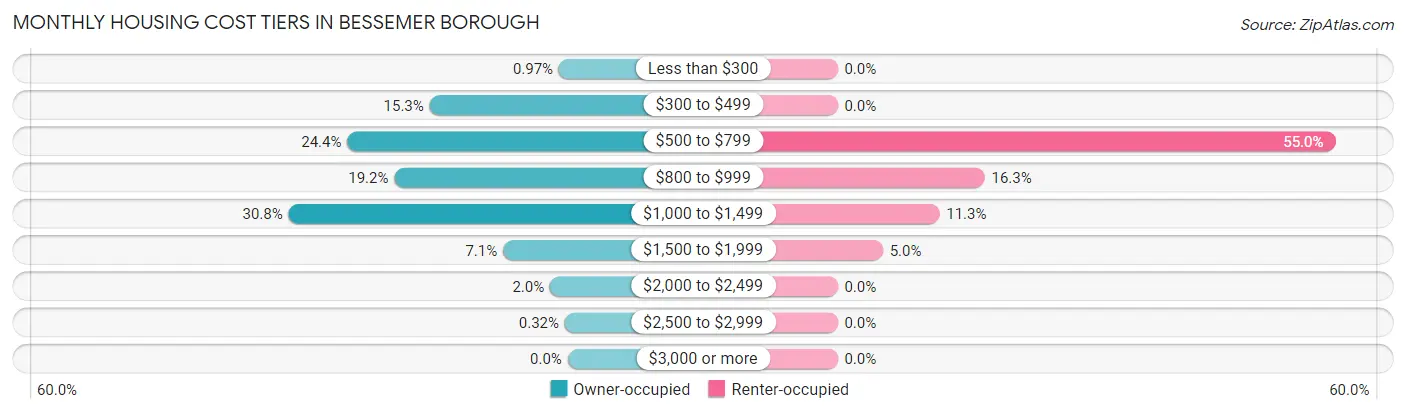
| Monthly Cost | Owner-occupied | Renter-occupied |
| Less than $300 | 3 (1.0%) | 0 (0.0%) |
| $300 to $499 | 47 (15.3%) | 0 (0.0%) |
| $500 to $799 | 75 (24.3%) | 44 (55.0%) |
| $800 to $999 | 59 (19.2%) | 13 (16.3%) |
| $1,000 to $1,499 | 95 (30.8%) | 9 (11.3%) |
| $1,500 to $1,999 | 22 (7.1%) | 4 (5.0%) |
| $2,000 to $2,499 | 6 (1.9%) | 0 (0.0%) |
| $2,500 to $2,999 | 1 (0.3%) | 0 (0.0%) |
| $3,000 or more | 0 (0.0%) | 0 (0.0%) |
| Total | 308 (100.0%) | 80 (100.0%) |
Physical Housing Characteristics in Bessemer borough
Housing Structures in Bessemer borough
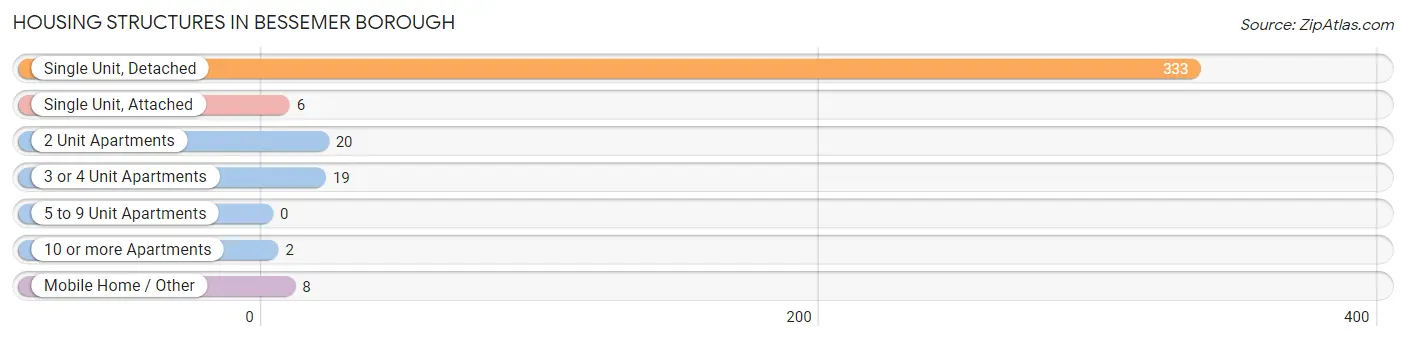
| Structure Type | # Housing Units | % Housing Units |
| Single Unit, Detached | 333 | 85.8% |
| Single Unit, Attached | 6 | 1.5% |
| 2 Unit Apartments | 20 | 5.1% |
| 3 or 4 Unit Apartments | 19 | 4.9% |
| 5 to 9 Unit Apartments | 0 | 0.0% |
| 10 or more Apartments | 2 | 0.5% |
| Mobile Home / Other | 8 | 2.1% |
| Total | 388 | 100.0% |
Housing Structures by Occupancy in Bessemer borough
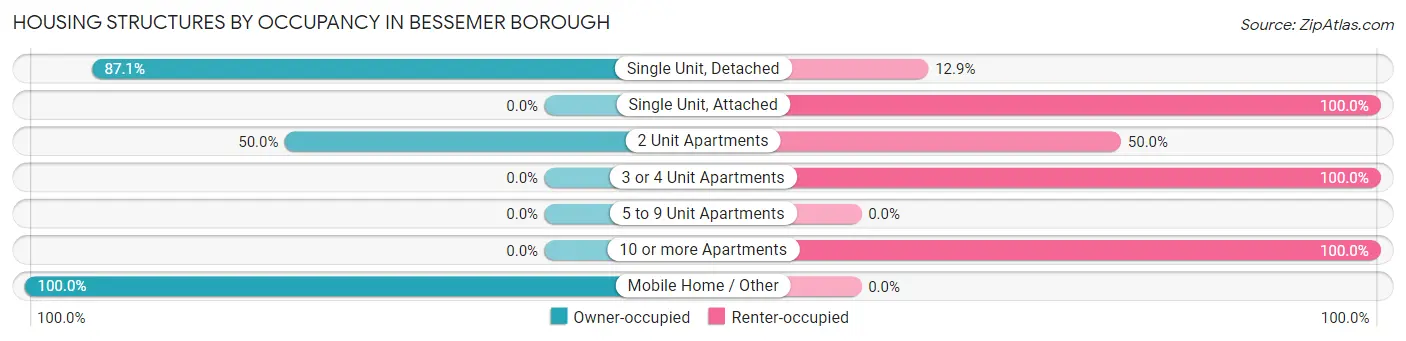
| Structure Type | Owner-occupied | Renter-occupied |
| Single Unit, Detached | 290 (87.1%) | 43 (12.9%) |
| Single Unit, Attached | 0 (0.0%) | 6 (100.0%) |
| 2 Unit Apartments | 10 (50.0%) | 10 (50.0%) |
| 3 or 4 Unit Apartments | 0 (0.0%) | 19 (100.0%) |
| 5 to 9 Unit Apartments | 0 (0.0%) | 0 (0.0%) |
| 10 or more Apartments | 0 (0.0%) | 2 (100.0%) |
| Mobile Home / Other | 8 (100.0%) | 0 (0.0%) |
| Total | 308 (79.4%) | 80 (20.6%) |
Housing Structures by Number of Rooms in Bessemer borough
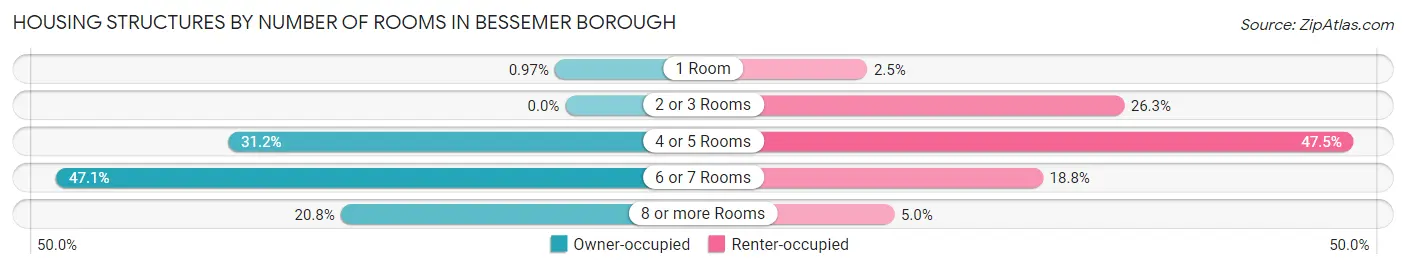
| Number of Rooms | Owner-occupied | Renter-occupied |
| 1 Room | 3 (1.0%) | 2 (2.5%) |
| 2 or 3 Rooms | 0 (0.0%) | 21 (26.3%) |
| 4 or 5 Rooms | 96 (31.2%) | 38 (47.5%) |
| 6 or 7 Rooms | 145 (47.1%) | 15 (18.8%) |
| 8 or more Rooms | 64 (20.8%) | 4 (5.0%) |
| Total | 308 (100.0%) | 80 (100.0%) |
Housing Structure by Heating Type in Bessemer borough
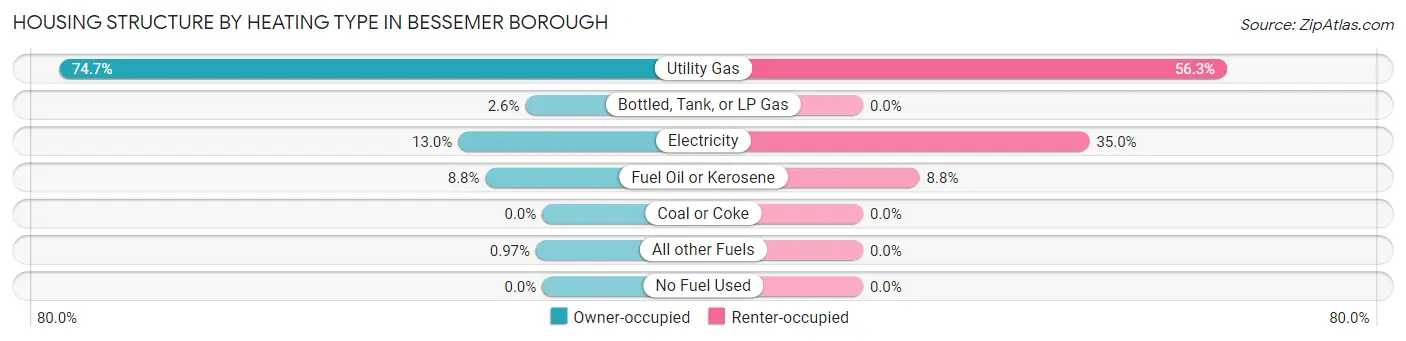
| Heating Type | Owner-occupied | Renter-occupied |
| Utility Gas | 230 (74.7%) | 45 (56.2%) |
| Bottled, Tank, or LP Gas | 8 (2.6%) | 0 (0.0%) |
| Electricity | 40 (13.0%) | 28 (35.0%) |
| Fuel Oil or Kerosene | 27 (8.8%) | 7 (8.7%) |
| Coal or Coke | 0 (0.0%) | 0 (0.0%) |
| All other Fuels | 3 (1.0%) | 0 (0.0%) |
| No Fuel Used | 0 (0.0%) | 0 (0.0%) |
| Total | 308 (100.0%) | 80 (100.0%) |
Household Vehicle Usage in Bessemer borough
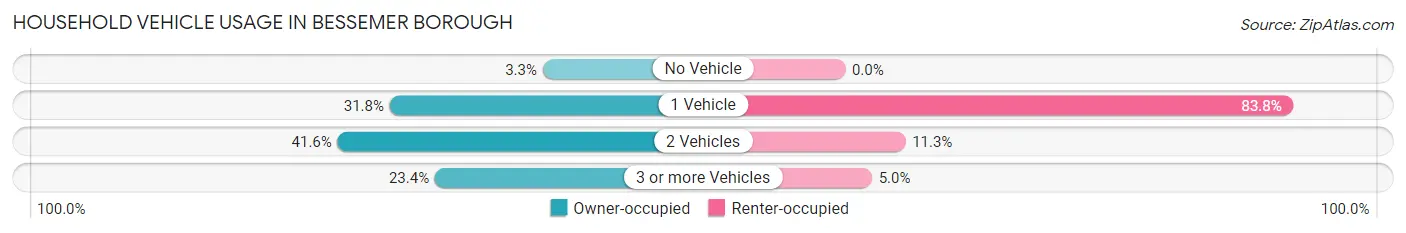
| Vehicles per Household | Owner-occupied | Renter-occupied |
| No Vehicle | 10 (3.3%) | 0 (0.0%) |
| 1 Vehicle | 98 (31.8%) | 67 (83.8%) |
| 2 Vehicles | 128 (41.6%) | 9 (11.3%) |
| 3 or more Vehicles | 72 (23.4%) | 4 (5.0%) |
| Total | 308 (100.0%) | 80 (100.0%) |
Real Estate & Mortgages in Bessemer borough
Real Estate and Mortgage Overview in Bessemer borough
| Characteristic | Without Mortgage | With Mortgage |
| Housing Units | 115 | 193 |
| Median Property Value | $110,800 | $103,900 |
| Median Household Income | $49,688 | $16 |
| Monthly Housing Costs | $526 | $0 |
| Real Estate Taxes | $1,595 | $1 |
Property Value by Mortgage Status in Bessemer borough
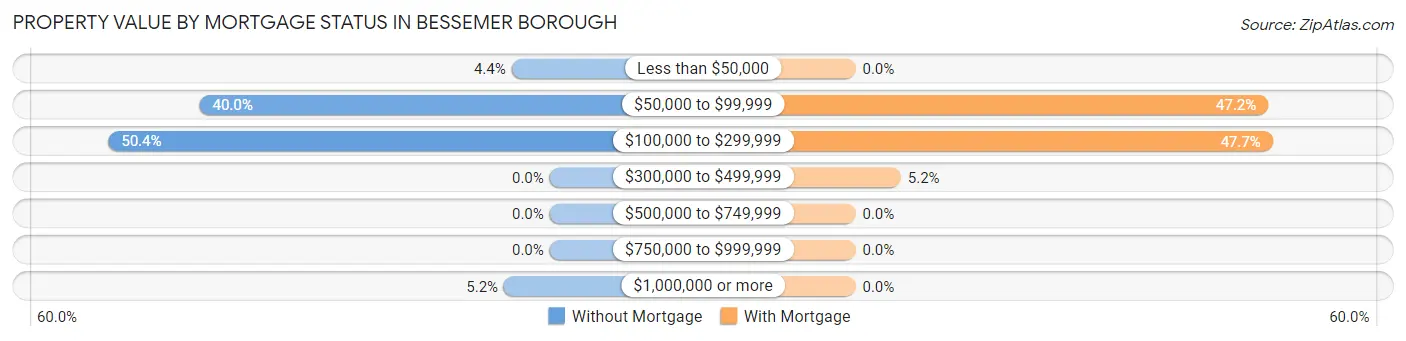
| Property Value | Without Mortgage | With Mortgage |
| Less than $50,000 | 5 (4.3%) | 0 (0.0%) |
| $50,000 to $99,999 | 46 (40.0%) | 91 (47.1%) |
| $100,000 to $299,999 | 58 (50.4%) | 92 (47.7%) |
| $300,000 to $499,999 | 0 (0.0%) | 10 (5.2%) |
| $500,000 to $749,999 | 0 (0.0%) | 0 (0.0%) |
| $750,000 to $999,999 | 0 (0.0%) | 0 (0.0%) |
| $1,000,000 or more | 6 (5.2%) | 0 (0.0%) |
| Total | 115 (100.0%) | 193 (100.0%) |
Household Income by Mortgage Status in Bessemer borough
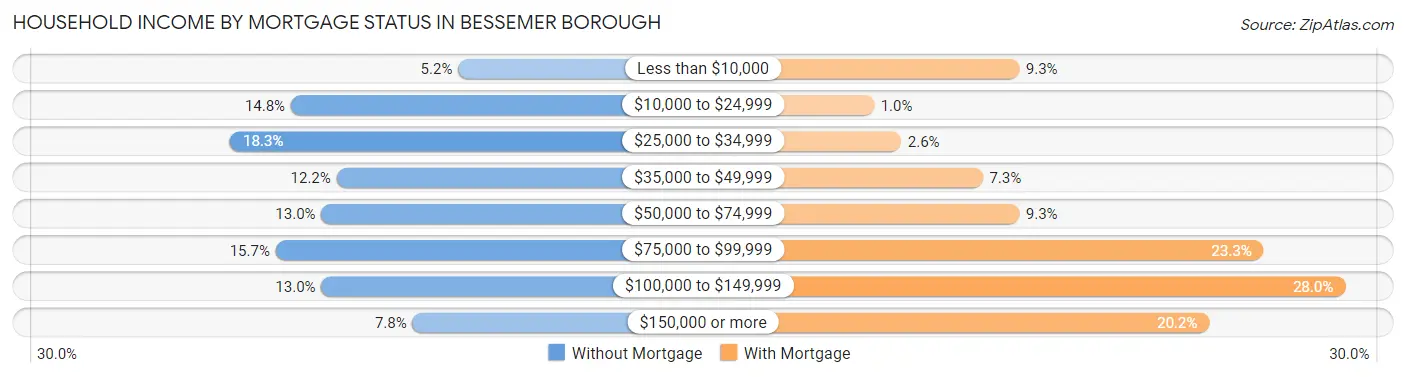
| Household Income | Without Mortgage | With Mortgage |
| Less than $10,000 | 6 (5.2%) | 18 (9.3%) |
| $10,000 to $24,999 | 17 (14.8%) | 2 (1.0%) |
| $25,000 to $34,999 | 21 (18.3%) | 5 (2.6%) |
| $35,000 to $49,999 | 14 (12.2%) | 14 (7.2%) |
| $50,000 to $74,999 | 15 (13.0%) | 18 (9.3%) |
| $75,000 to $99,999 | 18 (15.7%) | 45 (23.3%) |
| $100,000 to $149,999 | 15 (13.0%) | 54 (28.0%) |
| $150,000 or more | 9 (7.8%) | 39 (20.2%) |
| Total | 115 (100.0%) | 193 (100.0%) |
Property Value to Household Income Ratio in Bessemer borough
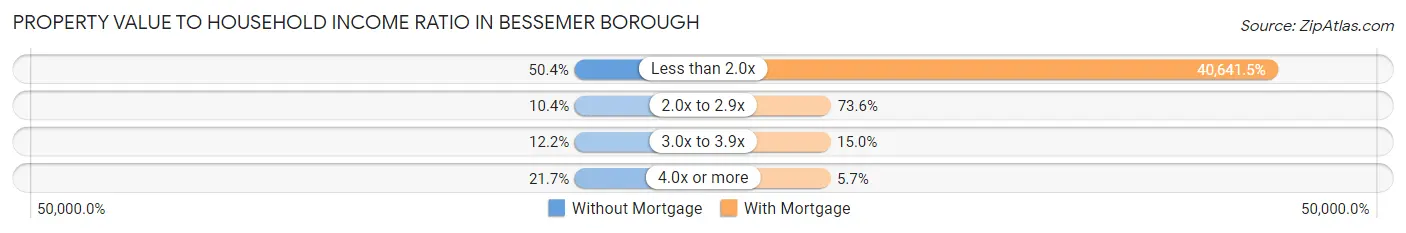
| Value-to-Income Ratio | Without Mortgage | With Mortgage |
| Less than 2.0x | 58 (50.4%) | 78,438 (40,641.4%) |
| 2.0x to 2.9x | 12 (10.4%) | 142 (73.6%) |
| 3.0x to 3.9x | 14 (12.2%) | 29 (15.0%) |
| 4.0x or more | 25 (21.7%) | 11 (5.7%) |
| Total | 115 (100.0%) | 193 (100.0%) |
Real Estate Taxes by Mortgage Status in Bessemer borough
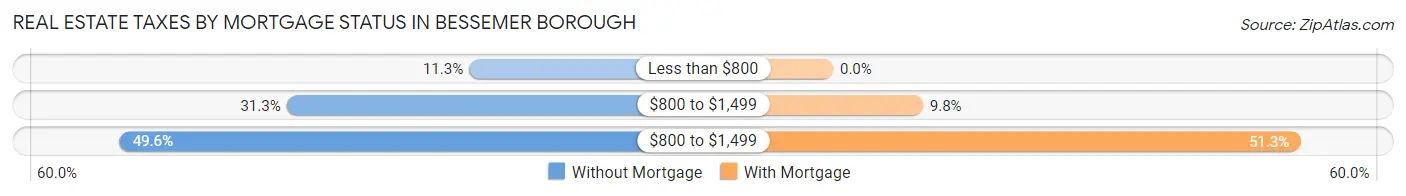
| Property Taxes | Without Mortgage | With Mortgage |
| Less than $800 | 13 (11.3%) | 0 (0.0%) |
| $800 to $1,499 | 36 (31.3%) | 19 (9.8%) |
| $800 to $1,499 | 57 (49.6%) | 99 (51.3%) |
| Total | 115 (100.0%) | 193 (100.0%) |
Health & Disability in Bessemer borough
Health Insurance Coverage by Age in Bessemer borough
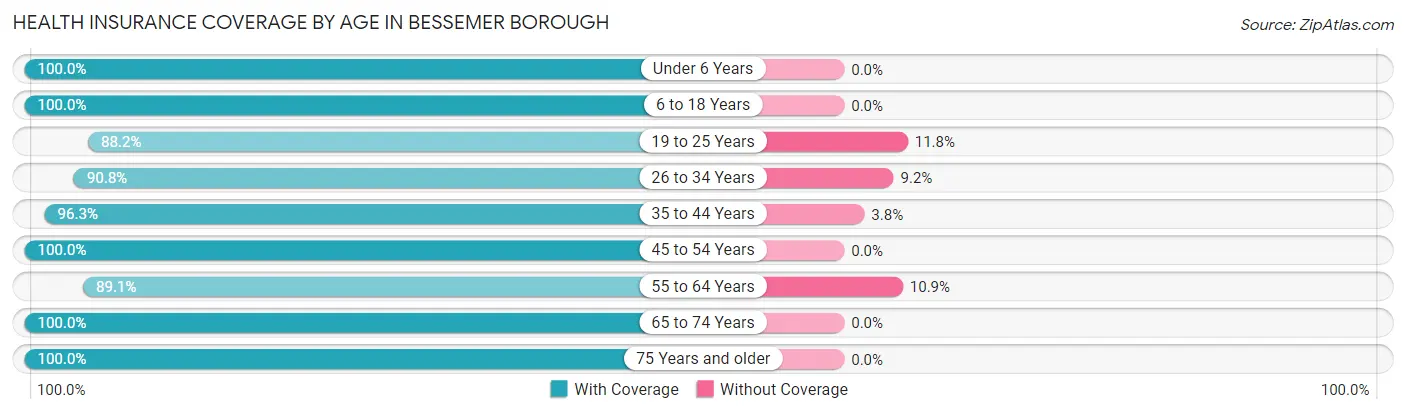
| Age Bracket | With Coverage | Without Coverage |
| Under 6 Years | 53 (100.0%) | 0 (0.0%) |
| 6 to 18 Years | 171 (100.0%) | 0 (0.0%) |
| 19 to 25 Years | 67 (88.2%) | 9 (11.8%) |
| 26 to 34 Years | 79 (90.8%) | 8 (9.2%) |
| 35 to 44 Years | 77 (96.3%) | 3 (3.7%) |
| 45 to 54 Years | 159 (100.0%) | 0 (0.0%) |
| 55 to 64 Years | 106 (89.1%) | 13 (10.9%) |
| 65 to 74 Years | 64 (100.0%) | 0 (0.0%) |
| 75 Years and older | 103 (100.0%) | 0 (0.0%) |
| Total | 879 (96.4%) | 33 (3.6%) |
Health Insurance Coverage by Citizenship Status in Bessemer borough
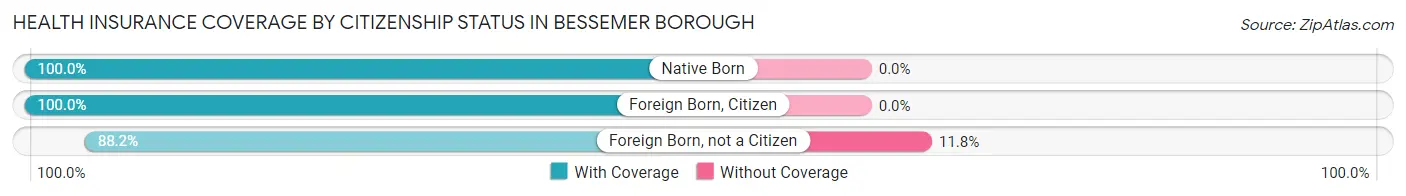
| Citizenship Status | With Coverage | Without Coverage |
| Native Born | 53 (100.0%) | 0 (0.0%) |
| Foreign Born, Citizen | 171 (100.0%) | 0 (0.0%) |
| Foreign Born, not a Citizen | 67 (88.2%) | 9 (11.8%) |
Health Insurance Coverage by Household Income in Bessemer borough
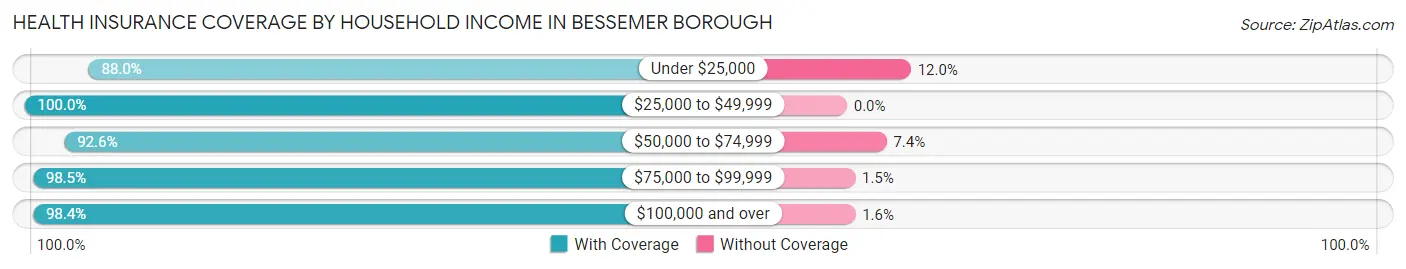
| Household Income | With Coverage | Without Coverage |
| Under $25,000 | 103 (88.0%) | 14 (12.0%) |
| $25,000 to $49,999 | 133 (100.0%) | 0 (0.0%) |
| $50,000 to $74,999 | 137 (92.6%) | 11 (7.4%) |
| $75,000 to $99,999 | 255 (98.5%) | 4 (1.5%) |
| $100,000 and over | 251 (98.4%) | 4 (1.6%) |
Public vs Private Health Insurance Coverage by Age in Bessemer borough
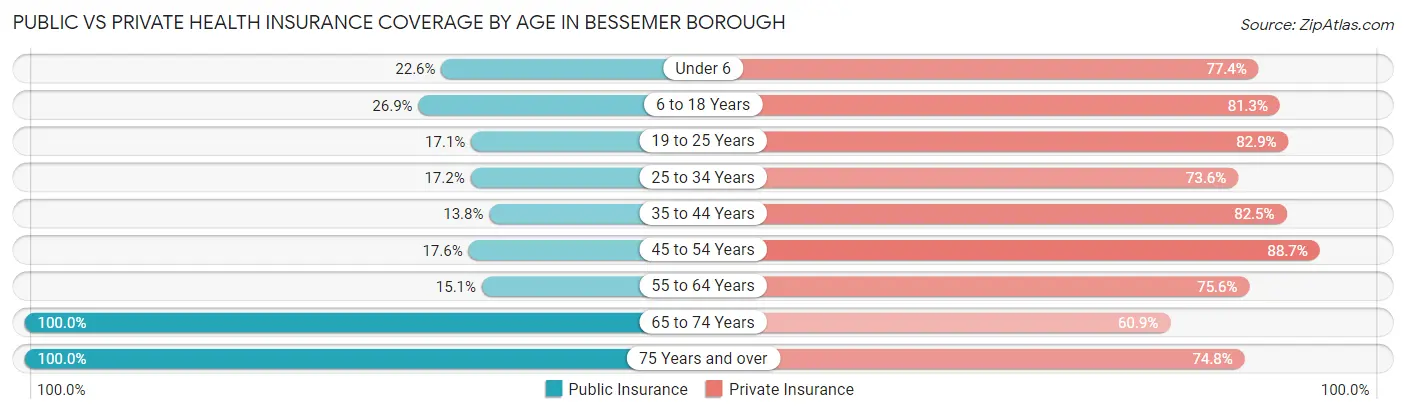
| Age Bracket | Public Insurance | Private Insurance |
| Under 6 | 12 (22.6%) | 41 (77.4%) |
| 6 to 18 Years | 46 (26.9%) | 139 (81.3%) |
| 19 to 25 Years | 13 (17.1%) | 63 (82.9%) |
| 25 to 34 Years | 15 (17.2%) | 64 (73.6%) |
| 35 to 44 Years | 11 (13.8%) | 66 (82.5%) |
| 45 to 54 Years | 28 (17.6%) | 141 (88.7%) |
| 55 to 64 Years | 18 (15.1%) | 90 (75.6%) |
| 65 to 74 Years | 64 (100.0%) | 39 (60.9%) |
| 75 Years and over | 103 (100.0%) | 77 (74.8%) |
| Total | 310 (34.0%) | 720 (78.9%) |
Disability Status by Sex by Age in Bessemer borough
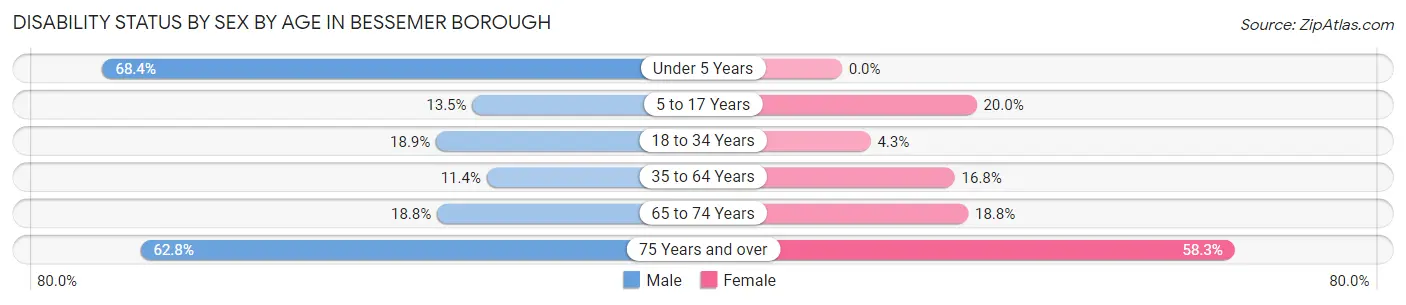
| Age Bracket | Male | Female |
| Under 5 Years | 13 (68.4%) | 0 (0.0%) |
| 5 to 17 Years | 15 (13.5%) | 12 (20.0%) |
| 18 to 34 Years | 17 (18.9%) | 4 (4.3%) |
| 35 to 64 Years | 19 (11.4%) | 32 (16.8%) |
| 65 to 74 Years | 6 (18.8%) | 6 (18.8%) |
| 75 Years and over | 27 (62.8%) | 35 (58.3%) |
Disability Class by Sex by Age in Bessemer borough
Disability Class: Hearing Difficulty
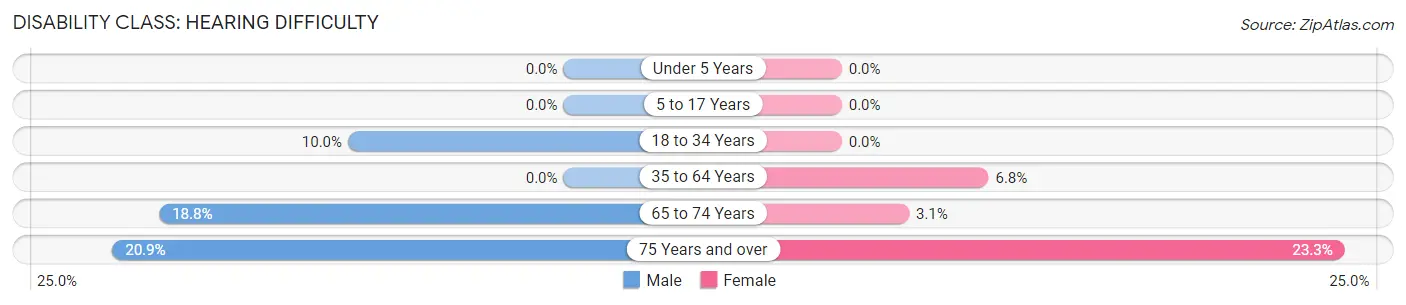
| Age Bracket | Male | Female |
| Under 5 Years | 0 (0.0%) | 0 (0.0%) |
| 5 to 17 Years | 0 (0.0%) | 0 (0.0%) |
| 18 to 34 Years | 9 (10.0%) | 0 (0.0%) |
| 35 to 64 Years | 0 (0.0%) | 13 (6.8%) |
| 65 to 74 Years | 6 (18.8%) | 1 (3.1%) |
| 75 Years and over | 9 (20.9%) | 14 (23.3%) |
Disability Class: Vision Difficulty
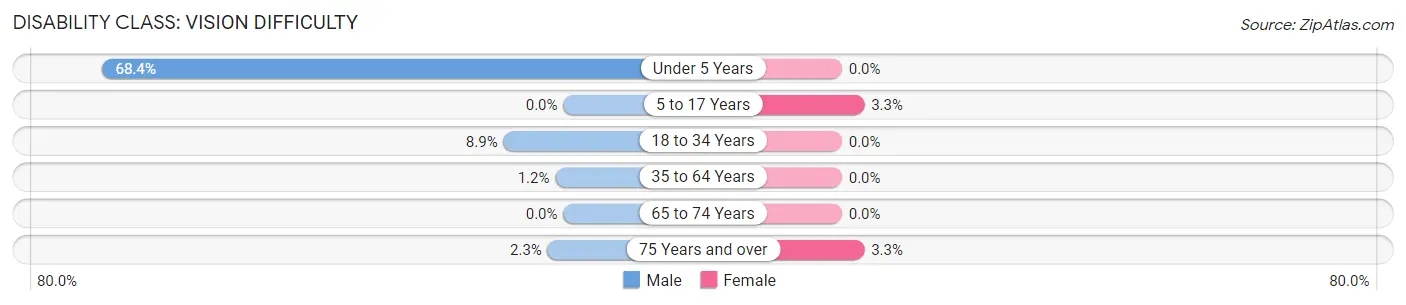
| Age Bracket | Male | Female |
| Under 5 Years | 13 (68.4%) | 0 (0.0%) |
| 5 to 17 Years | 0 (0.0%) | 2 (3.3%) |
| 18 to 34 Years | 8 (8.9%) | 0 (0.0%) |
| 35 to 64 Years | 2 (1.2%) | 0 (0.0%) |
| 65 to 74 Years | 0 (0.0%) | 0 (0.0%) |
| 75 Years and over | 1 (2.3%) | 2 (3.3%) |
Disability Class: Cognitive Difficulty
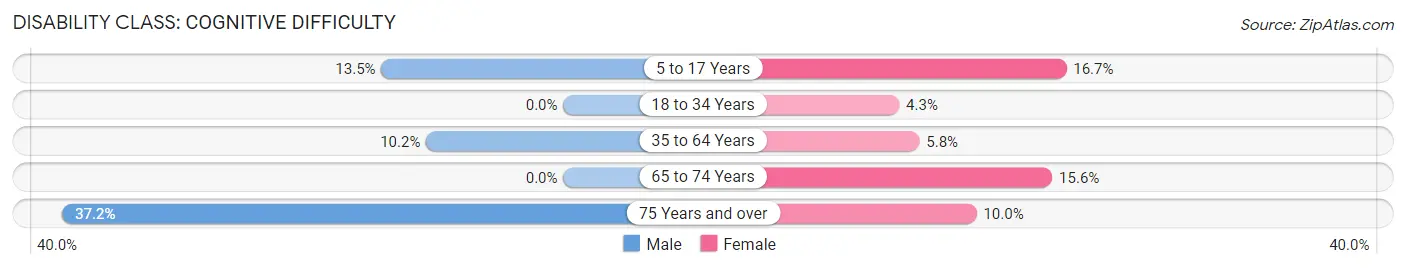
| Age Bracket | Male | Female |
| 5 to 17 Years | 15 (13.5%) | 10 (16.7%) |
| 18 to 34 Years | 0 (0.0%) | 4 (4.3%) |
| 35 to 64 Years | 17 (10.2%) | 11 (5.8%) |
| 65 to 74 Years | 0 (0.0%) | 5 (15.6%) |
| 75 Years and over | 16 (37.2%) | 6 (10.0%) |
Disability Class: Ambulatory Difficulty
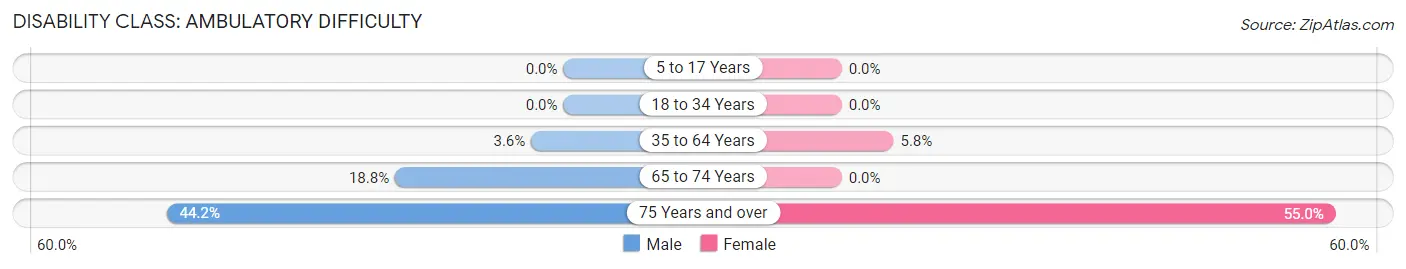
| Age Bracket | Male | Female |
| 5 to 17 Years | 0 (0.0%) | 0 (0.0%) |
| 18 to 34 Years | 0 (0.0%) | 0 (0.0%) |
| 35 to 64 Years | 6 (3.6%) | 11 (5.8%) |
| 65 to 74 Years | 6 (18.8%) | 0 (0.0%) |
| 75 Years and over | 19 (44.2%) | 33 (55.0%) |
Disability Class: Self-Care Difficulty
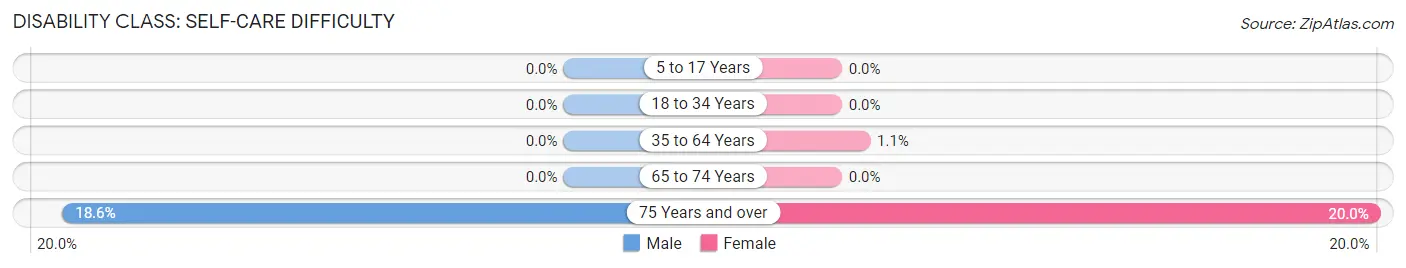
| Age Bracket | Male | Female |
| 5 to 17 Years | 0 (0.0%) | 0 (0.0%) |
| 18 to 34 Years | 0 (0.0%) | 0 (0.0%) |
| 35 to 64 Years | 0 (0.0%) | 2 (1.1%) |
| 65 to 74 Years | 0 (0.0%) | 0 (0.0%) |
| 75 Years and over | 8 (18.6%) | 12 (20.0%) |
Technology Access in Bessemer borough
Computing Device Access in Bessemer borough
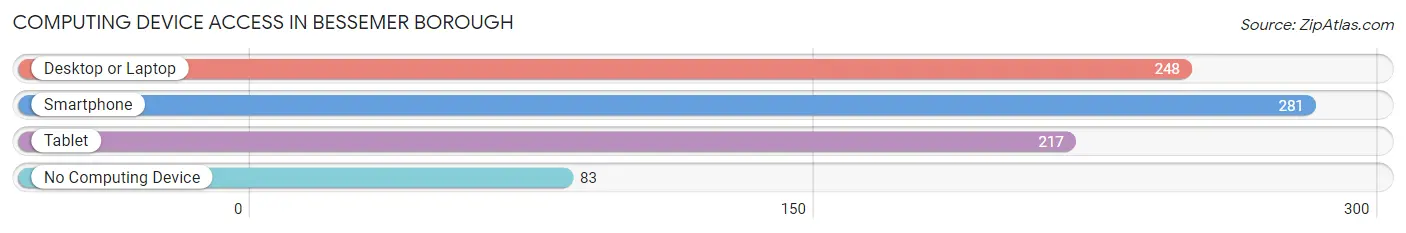
| Device Type | # Households | % Households |
| Desktop or Laptop | 248 | 63.9% |
| Smartphone | 281 | 72.4% |
| Tablet | 217 | 55.9% |
| No Computing Device | 83 | 21.4% |
| Total | 388 | 100.0% |
Internet Access in Bessemer borough
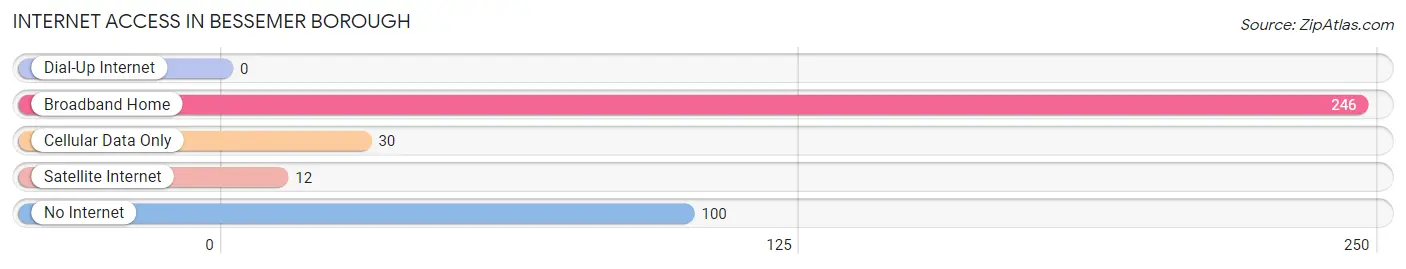
| Internet Type | # Households | % Households |
| Dial-Up Internet | 0 | 0.0% |
| Broadband Home | 246 | 63.4% |
| Cellular Data Only | 30 | 7.7% |
| Satellite Internet | 12 | 3.1% |
| No Internet | 100 | 25.8% |
| Total | 388 | 100.0% |
Bessemer borough Summary
Bessemer Borough is a small borough located in Lawrence County, Pennsylvania. It is situated in the northwest corner of the county, just south of the city of New Castle. The borough has a population of approximately 1,400 people and covers an area of 0.6 square miles.
History
Bessemer Borough was founded in 1876 by the Bessemer Coal Company. The company was founded by William Bessemer, who had previously worked in the coal industry in England. The company was responsible for the development of the town, which was named after William Bessemer. The town was originally a mining town, with the coal company providing the majority of the jobs. The town grew rapidly in the late 19th century, and by the early 20th century, it had become a thriving community.
The town was incorporated as a borough in 1901. In the early 20th century, the town was home to several businesses, including a hotel, a bank, a post office, a movie theater, and several stores. The town also had a trolley line that connected it to New Castle.
In the mid-20th century, the coal industry began to decline, and the town's economy shifted to other industries. The town is now home to several small businesses, including a grocery store, a hardware store, and a few restaurants.
Geography
Bessemer Borough is located in the northwest corner of Lawrence County, Pennsylvania. It is situated on the banks of the Shenango River, which forms the border between Pennsylvania and Ohio. The borough is bordered to the north by the city of New Castle, to the east by Union Township, to the south by Neshannock Township, and to the west by Mahoning Township.
The borough has a total area of 0.6 square miles, all of which is land. The terrain is mostly flat, with some rolling hills in the northern part of the borough. The climate is humid continental, with cold winters and hot, humid summers.
Economy
The economy of Bessemer Borough is largely based on small businesses. The town is home to several small businesses, including a grocery store, a hardware store, and a few restaurants. The town also has a few manufacturing companies, including a steel mill and a plastics factory.
The town is also home to a few small farms, which produce a variety of crops, including corn, soybeans, and hay. The town also has a few small wineries, which produce a variety of wines.
Demographics
As of the 2010 census, the population of Bessemer Borough was 1,400. The racial makeup of the borough was 97.3% White, 0.9% African American, 0.3% Native American, 0.3% Asian, and 0.9% from two or more races. Hispanic or Latino of any race were 0.9% of the population.
The median household income in the borough was $37,500, and the median family income was $45,000. The per capita income was $19,000. About 11.3% of the population was below the poverty line.
Common Questions
What is Per Capita Income in Bessemer borough?
Per Capita income in Bessemer borough is $33,315.
What is the Median Family Income in Bessemer borough?
Median Family Income in Bessemer borough is $76,875.
What is the Median Household income in Bessemer borough?
Median Household Income in Bessemer borough is $58,750.
What is Income or Wage Gap in Bessemer borough?
Income or Wage Gap in Bessemer borough is 32.2%.
Women in Bessemer borough earn 67.8 cents for every dollar earned by a man.
What is Inequality or Gini Index in Bessemer borough?
Inequality or Gini Index in Bessemer borough is 0.44.
What is the Total Population of Bessemer borough?
Total Population of Bessemer borough is 912.
What is the Total Male Population of Bessemer borough?
Total Male Population of Bessemer borough is 462.
What is the Total Female Population of Bessemer borough?
Total Female Population of Bessemer borough is 450.
What is the Ratio of Males per 100 Females in Bessemer borough?
There are 102.67 Males per 100 Females in Bessemer borough.
What is the Ratio of Females per 100 Males in Bessemer borough?
There are 97.40 Females per 100 Males in Bessemer borough.
What is the Median Population Age in Bessemer borough?
Median Population Age in Bessemer borough is 44.2 Years.
What is the Average Family Size in Bessemer borough
Average Family Size in Bessemer borough is 3.0 People.
What is the Average Household Size in Bessemer borough
Average Household Size in Bessemer borough is 2.4 People.
How Large is the Labor Force in Bessemer borough?
There are 493 People in the Labor Forcein in Bessemer borough.
What is the Percentage of People in the Labor Force in Bessemer borough?
65.1% of People are in the Labor Force in Bessemer borough.
What is the Unemployment Rate in Bessemer borough?
Unemployment Rate in Bessemer borough is 8.7%.