Mont Alto borough, PA Map & Demographics
Mont Alto borough Overview
$31,686
PER CAPITA INCOME
$76,667
AVG FAMILY INCOME
$68,438
AVG HOUSEHOLD INCOME
31.0%
WAGE / INCOME GAP [ % ]
69.0¢/ $1
WAGE / INCOME GAP [ $ ]
0.31
INEQUALITY / GINI INDEX
1,562
TOTAL POPULATION
765
MALE POPULATION
797
FEMALE POPULATION
95.98
MALES / 100 FEMALES
104.18
FEMALES / 100 MALES
40.3
MEDIAN AGE
2.5
AVG FAMILY SIZE
2.3
AVG HOUSEHOLD SIZE
979
LABOR FORCE [ PEOPLE ]
70.3%
PERCENT IN LABOR FORCE
4.4%
UNEMPLOYMENT RATE
Income in Mont Alto borough
Income Overview in Mont Alto borough
Per Capita Income in Mont Alto borough is $31,686, while median incomes of families and households are $76,667 and $68,438 respectively.
| Characteristic | Number | Measure |
| Per Capita Income | 1,562 | $31,686 |
| Median Family Income | 464 | $76,667 |
| Mean Family Income | 464 | $79,638 |
| Median Household Income | 627 | $68,438 |
| Mean Household Income | 627 | $78,391 |
| Income Deficit | 464 | $0 |
| Wage / Income Gap (%) | 1,562 | 31.02% |
| Wage / Income Gap ($) | 1,562 | 68.98¢ per $1 |
| Gini / Inequality Index | 1,562 | 0.31 |
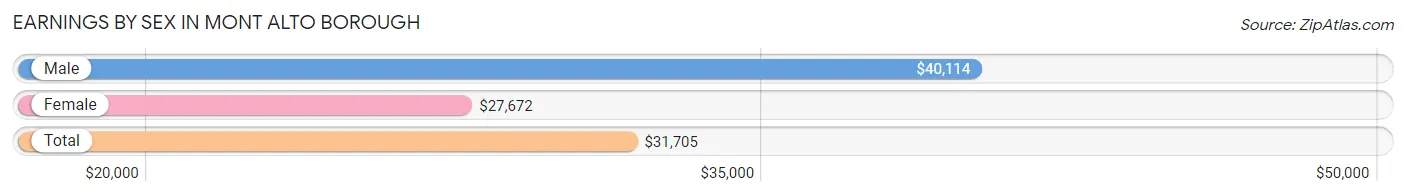
Earnings by Sex in Mont Alto borough
Average Earnings in Mont Alto borough are $31,705, $40,114 for men and $27,672 for women, a difference of 31.0%.
| Sex | Number | Average Earnings |
| Male | 540 (51.2%) | $40,114 |
| Female | 514 (48.8%) | $27,672 |
| Total | 1,054 (100.0%) | $31,705 |
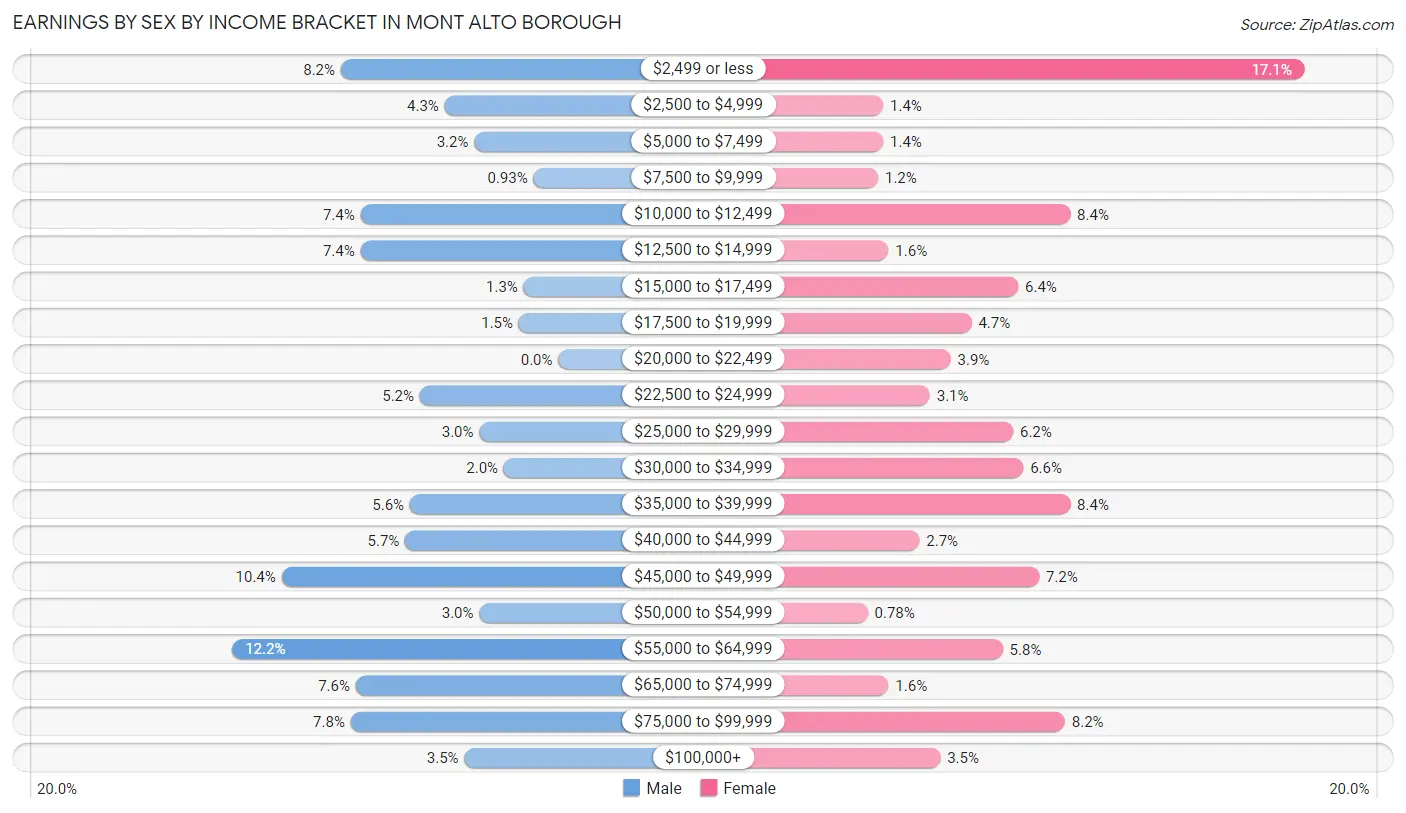
Earnings by Sex by Income Bracket in Mont Alto borough
The most common earnings brackets in Mont Alto borough are $55,000 to $64,999 for men (66 | 12.2%) and $2,499 or less for women (88 | 17.1%).
| Income | Male | Female |
| $2,499 or less | 44 (8.2%) | 88 (17.1%) |
| $2,500 to $4,999 | 23 (4.3%) | 7 (1.4%) |
| $5,000 to $7,499 | 17 (3.2%) | 7 (1.4%) |
| $7,500 to $9,999 | 5 (0.9%) | 6 (1.2%) |
| $10,000 to $12,499 | 40 (7.4%) | 43 (8.4%) |
| $12,500 to $14,999 | 40 (7.4%) | 8 (1.6%) |
| $15,000 to $17,499 | 7 (1.3%) | 33 (6.4%) |
| $17,500 to $19,999 | 8 (1.5%) | 24 (4.7%) |
| $20,000 to $22,499 | 0 (0.0%) | 20 (3.9%) |
| $22,500 to $24,999 | 28 (5.2%) | 16 (3.1%) |
| $25,000 to $29,999 | 16 (3.0%) | 32 (6.2%) |
| $30,000 to $34,999 | 11 (2.0%) | 34 (6.6%) |
| $35,000 to $39,999 | 30 (5.6%) | 43 (8.4%) |
| $40,000 to $44,999 | 31 (5.7%) | 14 (2.7%) |
| $45,000 to $49,999 | 56 (10.4%) | 37 (7.2%) |
| $50,000 to $54,999 | 16 (3.0%) | 4 (0.8%) |
| $55,000 to $64,999 | 66 (12.2%) | 30 (5.8%) |
| $65,000 to $74,999 | 41 (7.6%) | 8 (1.6%) |
| $75,000 to $99,999 | 42 (7.8%) | 42 (8.2%) |
| $100,000+ | 19 (3.5%) | 18 (3.5%) |
| Total | 540 (100.0%) | 514 (100.0%) |
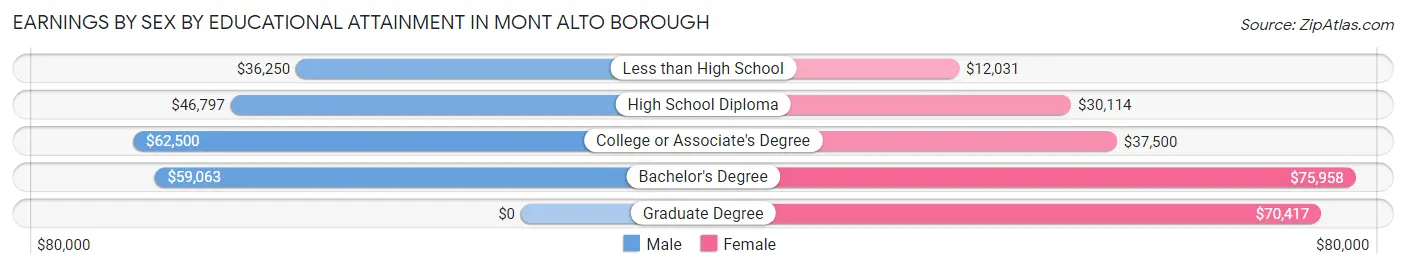
Earnings by Sex by Educational Attainment in Mont Alto borough
Average earnings in Mont Alto borough are $46,509 for men and $35,739 for women, a difference of 23.2%. Men with an educational attainment of college or associate's degree enjoy the highest average annual earnings of $62,500, while those with less than high school education earn the least with $36,250. Women with an educational attainment of bachelor's degree earn the most with the average annual earnings of $75,958, while those with less than high school education have the smallest earnings of $12,031.
| Educational Attainment | Male Income | Female Income |
| Less than High School | $36,250 | $12,031 |
| High School Diploma | $46,797 | $30,114 |
| College or Associate's Degree | $62,500 | $37,500 |
| Bachelor's Degree | $59,063 | $75,958 |
| Graduate Degree | - | - |
| Total | $46,509 | $35,739 |
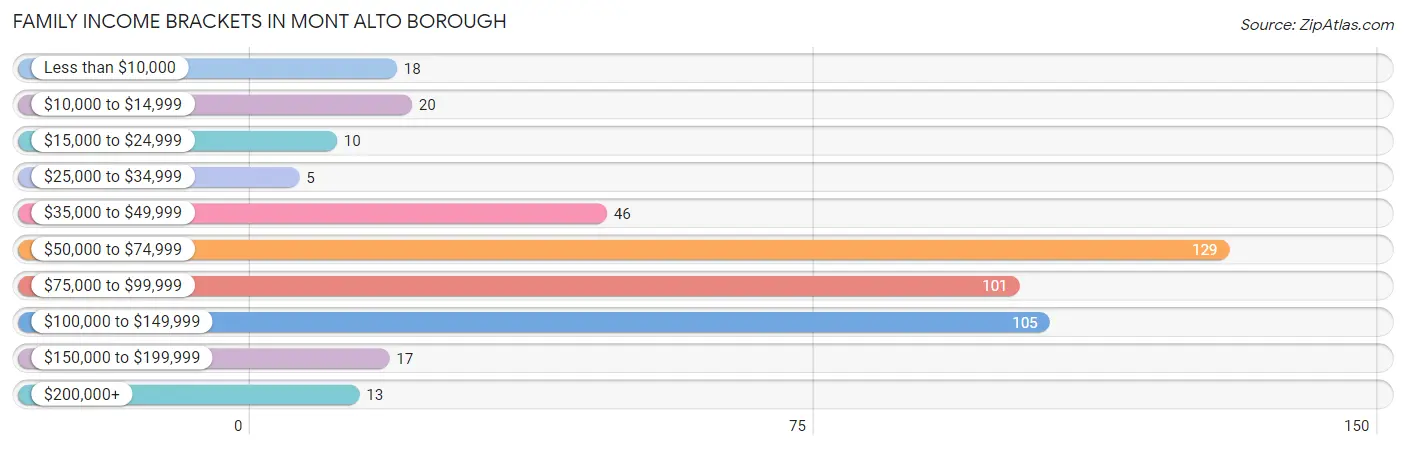
Family Income in Mont Alto borough
Family Income Brackets in Mont Alto borough
According to the Mont Alto borough family income data, there are 129 families falling into the $50,000 to $74,999 income range, which is the most common income bracket and makes up 27.8% of all families. Conversely, the $25,000 to $34,999 income bracket is the least frequent group with only 5 families (1.1%) belonging to this category.
| Income Bracket | # Families | % Families |
| Less than $10,000 | 18 | 3.9% |
| $10,000 to $14,999 | 20 | 4.3% |
| $15,000 to $24,999 | 10 | 2.2% |
| $25,000 to $34,999 | 5 | 1.1% |
| $35,000 to $49,999 | 46 | 9.9% |
| $50,000 to $74,999 | 129 | 27.8% |
| $75,000 to $99,999 | 101 | 21.8% |
| $100,000 to $149,999 | 105 | 22.6% |
| $150,000 to $199,999 | 17 | 3.7% |
| $200,000+ | 13 | 2.8% |
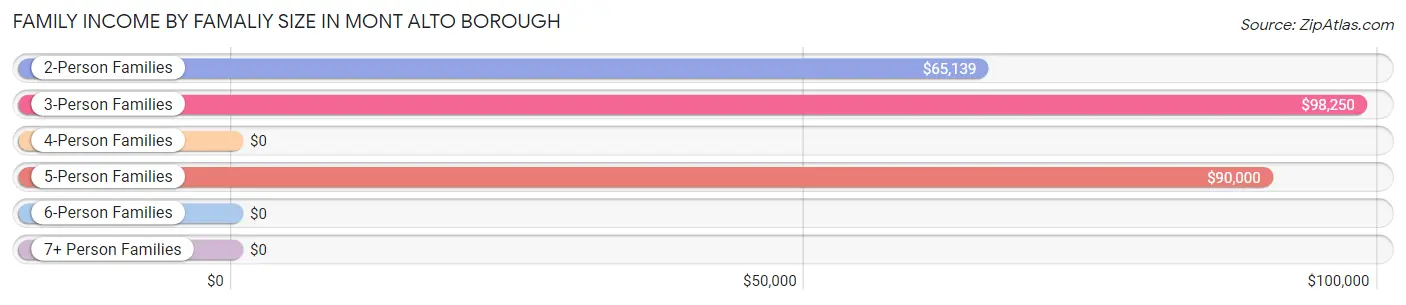
Family Income by Famaliy Size in Mont Alto borough
3-person families (131 | 28.2%) account for the highest median family income in Mont Alto borough with $98,250 per family, while 3-person families (131 | 28.2%) have the highest median income of $32,750 per family member.
| Income Bracket | # Families | Median Income |
| 2-Person Families | 267 (57.5%) | $65,139 |
| 3-Person Families | 131 (28.2%) | $98,250 |
| 4-Person Families | 38 (8.2%) | $0 |
| 5-Person Families | 28 (6.0%) | $90,000 |
| 6-Person Families | 0 (0.0%) | $0 |
| 7+ Person Families | 0 (0.0%) | $0 |
| Total | 464 (100.0%) | $76,667 |
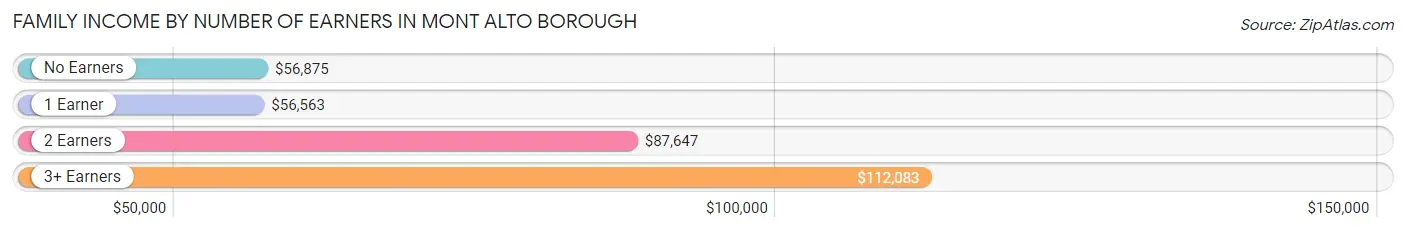
Family Income by Number of Earners in Mont Alto borough
The median family income in Mont Alto borough is $76,667, with families comprising 3+ earners (62) having the highest median family income of $112,083, while families with 1 earner (143) have the lowest median family income of $56,563, accounting for 13.4% and 30.8% of families, respectively.
| Number of Earners | # Families | Median Income |
| No Earners | 53 (11.4%) | $56,875 |
| 1 Earner | 143 (30.8%) | $56,563 |
| 2 Earners | 206 (44.4%) | $87,647 |
| 3+ Earners | 62 (13.4%) | $112,083 |
| Total | 464 (100.0%) | $76,667 |
Household Income in Mont Alto borough
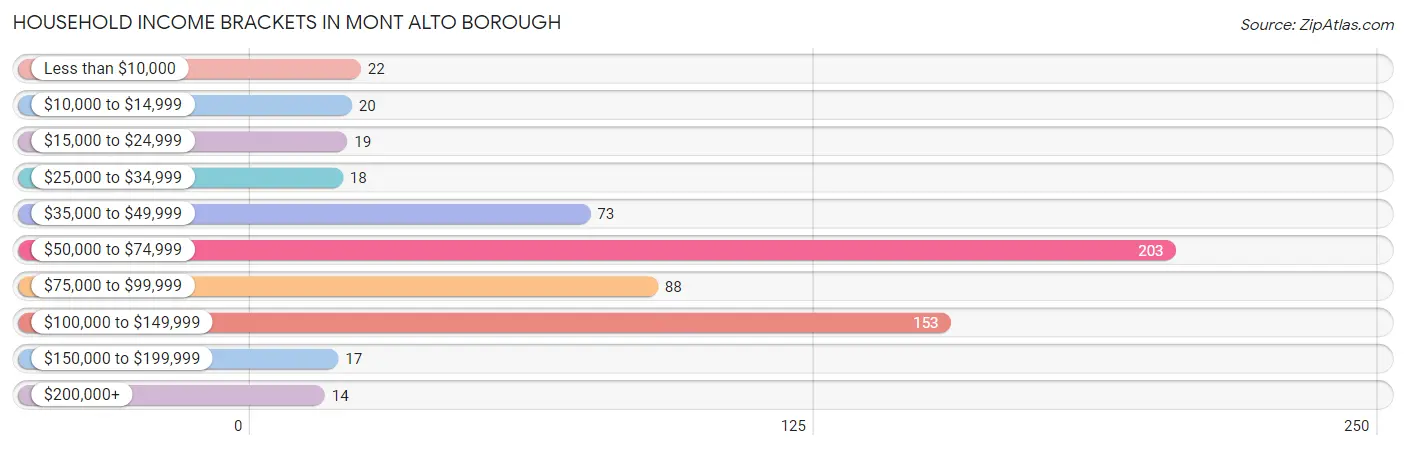
Household Income Brackets in Mont Alto borough
With 203 households falling in the category, the $50,000 to $74,999 income range is the most frequent in Mont Alto borough, accounting for 32.4% of all households. In contrast, only 14 households (2.2%) fall into the $200,000+ income bracket, making it the least populous group.
| Income Bracket | # Households | % Households |
| Less than $10,000 | 22 | 3.5% |
| $10,000 to $14,999 | 20 | 3.2% |
| $15,000 to $24,999 | 19 | 3.0% |
| $25,000 to $34,999 | 18 | 2.9% |
| $35,000 to $49,999 | 73 | 11.6% |
| $50,000 to $74,999 | 203 | 32.4% |
| $75,000 to $99,999 | 88 | 14.0% |
| $100,000 to $149,999 | 153 | 24.4% |
| $150,000 to $199,999 | 17 | 2.7% |
| $200,000+ | 14 | 2.2% |
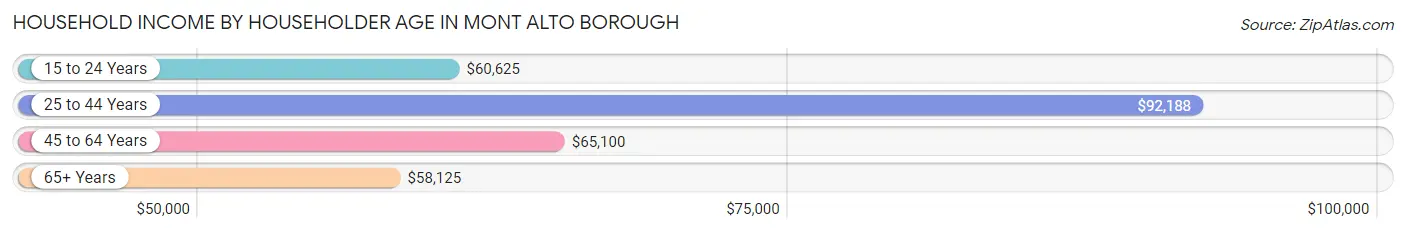
Household Income by Householder Age in Mont Alto borough
The median household income in Mont Alto borough is $68,438, with the highest median household income of $92,188 found in the 25 to 44 years age bracket for the primary householder. A total of 195 households (31.1%) fall into this category. Meanwhile, the 65+ years age bracket for the primary householder has the lowest median household income of $58,125, with 176 households (28.1%) in this group.
| Income Bracket | # Households | Median Income |
| 15 to 24 Years | 18 (2.9%) | $60,625 |
| 25 to 44 Years | 195 (31.1%) | $92,188 |
| 45 to 64 Years | 238 (38.0%) | $65,100 |
| 65+ Years | 176 (28.1%) | $58,125 |
| Total | 627 (100.0%) | $68,438 |
Poverty in Mont Alto borough
Income Below Poverty by Sex and Age in Mont Alto borough
With 9.8% poverty level for males and 13.5% for females among the residents of Mont Alto borough, 12 to 14 year old males and 18 to 24 year old females are the most vulnerable to poverty, with 7 males (43.8%) and 36 females (36.4%) in their respective age groups living below the poverty level.
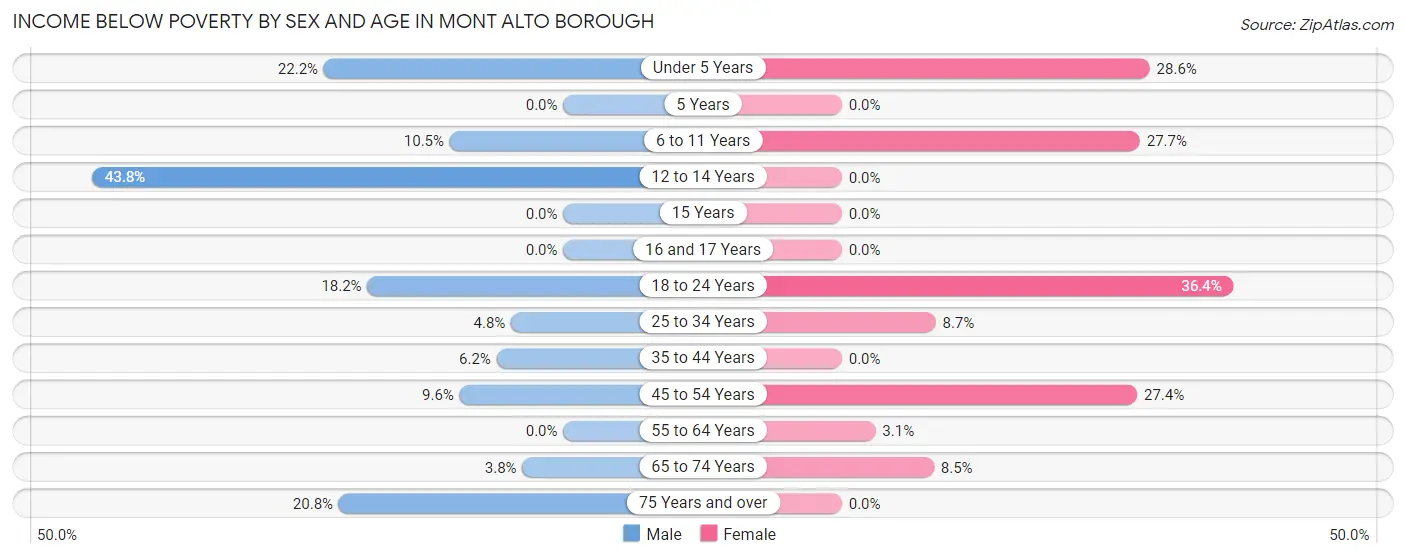
| Age Bracket | Male | Female |
| Under 5 Years | 6 (22.2%) | 8 (28.6%) |
| 5 Years | 0 (0.0%) | 0 (0.0%) |
| 6 to 11 Years | 2 (10.5%) | 13 (27.7%) |
| 12 to 14 Years | 7 (43.8%) | 0 (0.0%) |
| 15 Years | 0 (0.0%) | 0 (0.0%) |
| 16 and 17 Years | 0 (0.0%) | 0 (0.0%) |
| 18 to 24 Years | 12 (18.2%) | 36 (36.4%) |
| 25 to 34 Years | 3 (4.8%) | 12 (8.7%) |
| 35 to 44 Years | 6 (6.2%) | 0 (0.0%) |
| 45 to 54 Years | 10 (9.6%) | 20 (27.4%) |
| 55 to 64 Years | 0 (0.0%) | 3 (3.1%) |
| 65 to 74 Years | 3 (3.8%) | 7 (8.5%) |
| 75 Years and over | 20 (20.8%) | 0 (0.0%) |
| Total | 69 (9.8%) | 99 (13.5%) |
Income Above Poverty by Sex and Age in Mont Alto borough
According to the poverty statistics in Mont Alto borough, males aged 5 years and females aged 5 years are the age groups that are most secure financially, with 100.0% of males and 100.0% of females in these age groups living above the poverty line.
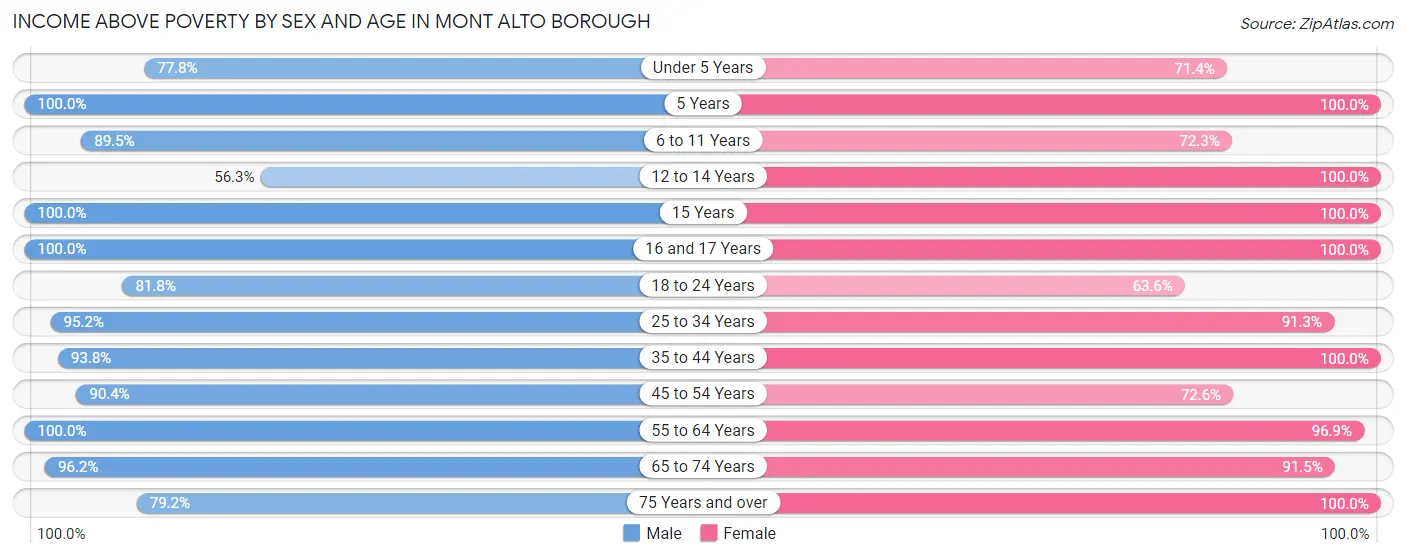
| Age Bracket | Male | Female |
| Under 5 Years | 21 (77.8%) | 20 (71.4%) |
| 5 Years | 2 (100.0%) | 2 (100.0%) |
| 6 to 11 Years | 17 (89.5%) | 34 (72.3%) |
| 12 to 14 Years | 9 (56.2%) | 9 (100.0%) |
| 15 Years | 15 (100.0%) | 5 (100.0%) |
| 16 and 17 Years | 2 (100.0%) | 14 (100.0%) |
| 18 to 24 Years | 54 (81.8%) | 63 (63.6%) |
| 25 to 34 Years | 59 (95.2%) | 126 (91.3%) |
| 35 to 44 Years | 91 (93.8%) | 90 (100.0%) |
| 45 to 54 Years | 94 (90.4%) | 53 (72.6%) |
| 55 to 64 Years | 118 (100.0%) | 93 (96.9%) |
| 65 to 74 Years | 76 (96.2%) | 75 (91.5%) |
| 75 Years and over | 76 (79.2%) | 48 (100.0%) |
| Total | 634 (90.2%) | 632 (86.5%) |
Income Below Poverty Among Married-Couple Families in Mont Alto borough
The poverty statistics for married-couple families in Mont Alto borough show that 4.0% or 15 of the total 373 families live below the poverty line. Families with 1 or 2 children have the highest poverty rate of 13.0%, comprising of 12 families. On the other hand, families with 3 or 4 children have the lowest poverty rate of 0.0%, which includes 0 families.
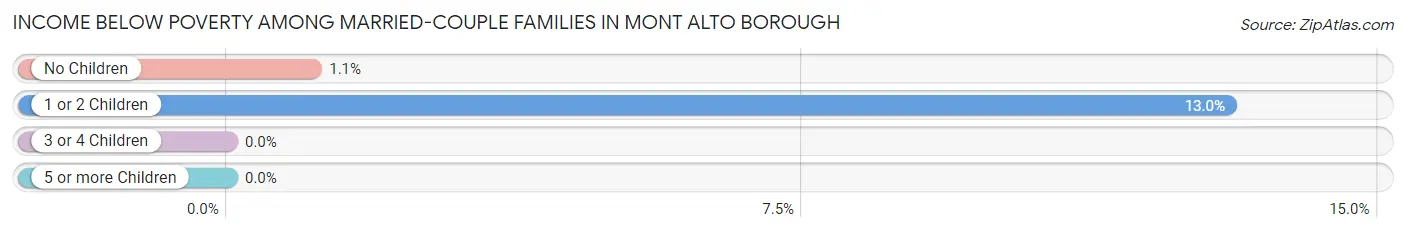
| Children | Above Poverty | Below Poverty |
| No Children | 270 (98.9%) | 3 (1.1%) |
| 1 or 2 Children | 80 (87.0%) | 12 (13.0%) |
| 3 or 4 Children | 8 (100.0%) | 0 (0.0%) |
| 5 or more Children | 0 (0.0%) | 0 (0.0%) |
| Total | 358 (96.0%) | 15 (4.0%) |
Income Below Poverty Among Single-Parent Households in Mont Alto borough
According to the poverty data in Mont Alto borough, 66.7% or 20 single-father households and 21.3% or 13 single-mother households are living below the poverty line. Among single-father households, those with no children have the highest poverty rate, with 20 households (66.7%) experiencing poverty. Likewise, among single-mother households, those with 1 or 2 children have the highest poverty rate, with 9 households (37.5%) falling below the poverty line.
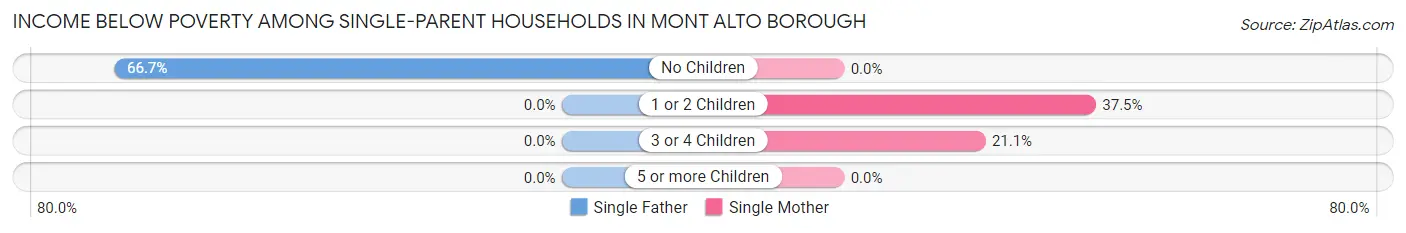
| Children | Single Father | Single Mother |
| No Children | 20 (66.7%) | 0 (0.0%) |
| 1 or 2 Children | 0 (0.0%) | 9 (37.5%) |
| 3 or 4 Children | 0 (0.0%) | 4 (21.0%) |
| 5 or more Children | 0 (0.0%) | 0 (0.0%) |
| Total | 20 (66.7%) | 13 (21.3%) |
Income Below Poverty Among Married-Couple vs Single-Parent Households in Mont Alto borough
The poverty data for Mont Alto borough shows that 15 of the married-couple family households (4.0%) and 33 of the single-parent households (36.3%) are living below the poverty level. Within the married-couple family households, those with 1 or 2 children have the highest poverty rate, with 12 households (13.0%) falling below the poverty line. Among the single-parent households, those with no children have the highest poverty rate, with 20 household (41.7%) living below poverty.
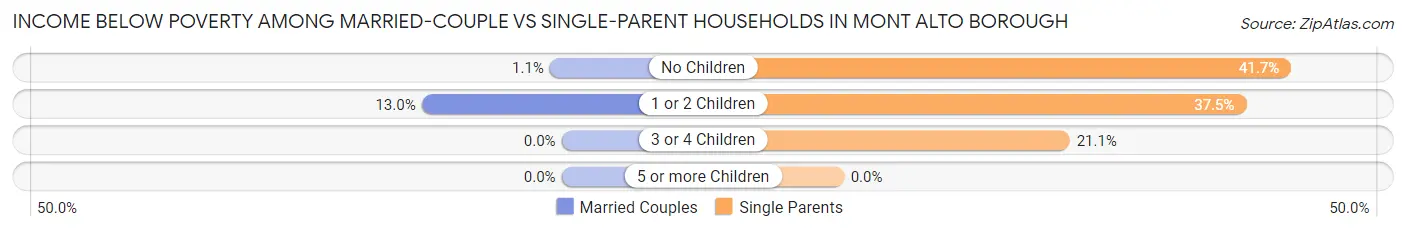
| Children | Married-Couple Families | Single-Parent Households |
| No Children | 3 (1.1%) | 20 (41.7%) |
| 1 or 2 Children | 12 (13.0%) | 9 (37.5%) |
| 3 or 4 Children | 0 (0.0%) | 4 (21.0%) |
| 5 or more Children | 0 (0.0%) | 0 (0.0%) |
| Total | 15 (4.0%) | 33 (36.3%) |
Race in Mont Alto borough
The most populous races in Mont Alto borough are White / Caucasian (1,330 | 85.2%), Two or more Races (91 | 5.8%), and Asian (52 | 3.3%).
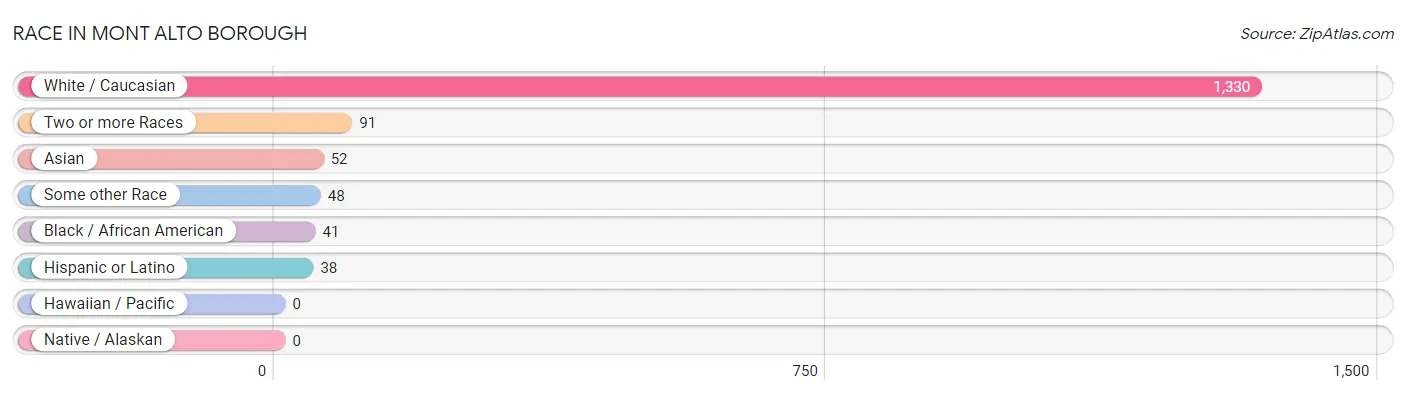
| Race | # Population | % Population |
| Asian | 52 | 3.3% |
| Black / African American | 41 | 2.6% |
| Hawaiian / Pacific | 0 | 0.0% |
| Hispanic or Latino | 38 | 2.4% |
| Native / Alaskan | 0 | 0.0% |
| White / Caucasian | 1,330 | 85.2% |
| Two or more Races | 91 | 5.8% |
| Some other Race | 48 | 3.1% |
| Total | 1,562 | 100.0% |
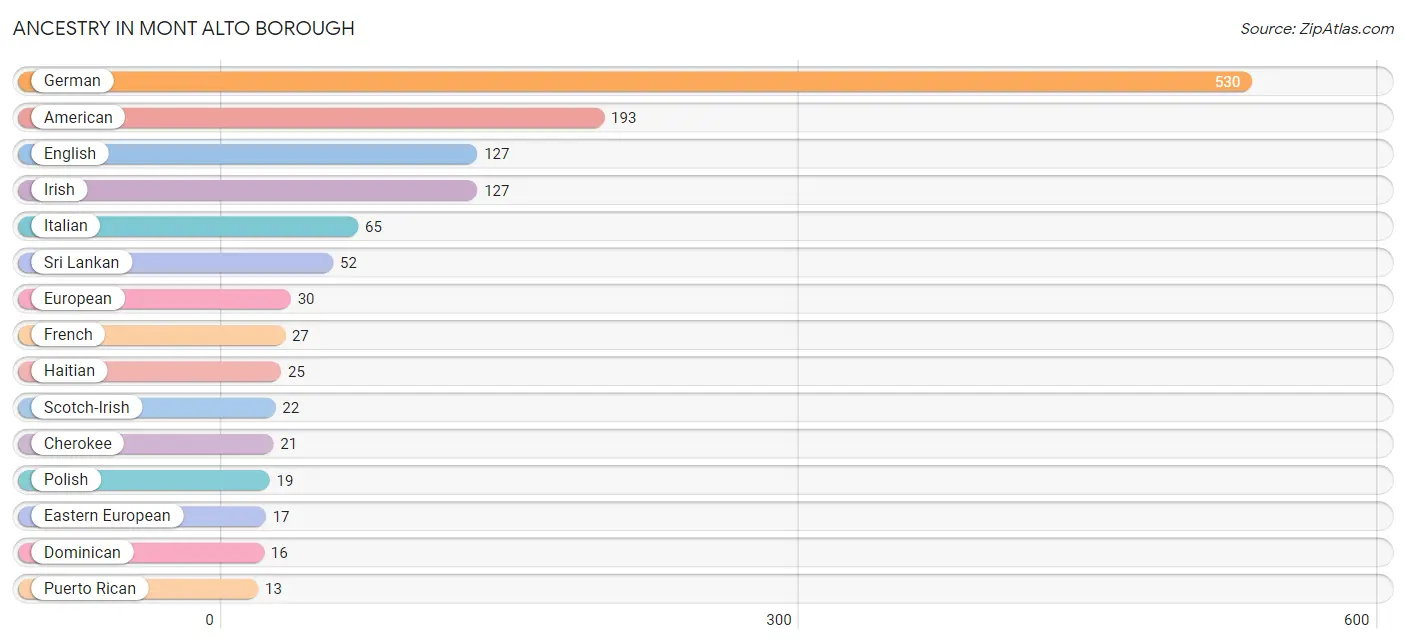
Ancestry in Mont Alto borough
The most populous ancestries reported in Mont Alto borough are German (530 | 33.9%), American (193 | 12.4%), English (127 | 8.1%), Irish (127 | 8.1%), and Italian (65 | 4.2%), together accounting for 66.7% of all Mont Alto borough residents.
| Ancestry | # Population | % Population |
| American | 193 | 12.4% |
| Bhutanese | 4 | 0.3% |
| Cherokee | 21 | 1.3% |
| Czech | 3 | 0.2% |
| Dominican | 16 | 1.0% |
| Eastern European | 17 | 1.1% |
| English | 127 | 8.1% |
| European | 30 | 1.9% |
| French | 27 | 1.7% |
| French Canadian | 3 | 0.2% |
| German | 530 | 33.9% |
| Guyanese | 5 | 0.3% |
| Haitian | 25 | 1.6% |
| Hungarian | 8 | 0.5% |
| Irish | 127 | 8.1% |
| Italian | 65 | 4.2% |
| Norwegian | 5 | 0.3% |
| Polish | 19 | 1.2% |
| Puerto Rican | 13 | 0.8% |
| Scandinavian | 3 | 0.2% |
| Scotch-Irish | 22 | 1.4% |
| Scottish | 11 | 0.7% |
| South American | 9 | 0.6% |
| Sri Lankan | 52 | 3.3% |
| Swedish | 3 | 0.2% |
| Swiss | 9 | 0.6% |
| Ukrainian | 3 | 0.2% |
| Venezuelan | 9 | 0.6% |
| Welsh | 8 | 0.5% | View All 29 Rows |
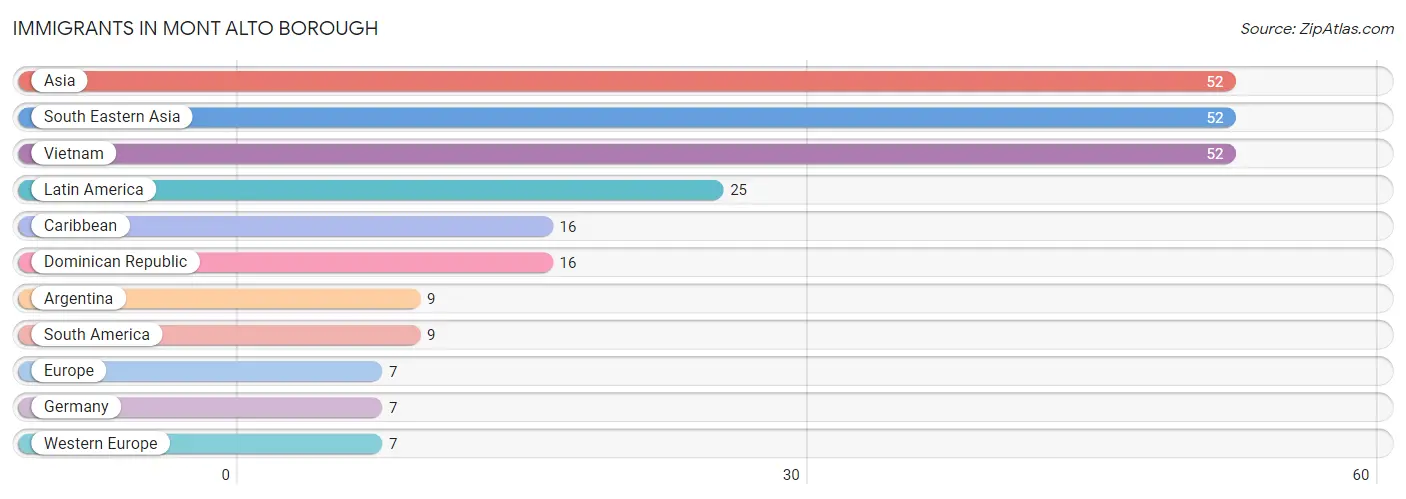
Immigrants in Mont Alto borough
The most numerous immigrant groups reported in Mont Alto borough came from Asia (52 | 3.3%), South Eastern Asia (52 | 3.3%), Vietnam (52 | 3.3%), Latin America (25 | 1.6%), and Caribbean (16 | 1.0%), together accounting for 12.6% of all Mont Alto borough residents.
| Immigration Origin | # Population | % Population |
| Argentina | 9 | 0.6% |
| Asia | 52 | 3.3% |
| Caribbean | 16 | 1.0% |
| Dominican Republic | 16 | 1.0% |
| Europe | 7 | 0.4% |
| Germany | 7 | 0.4% |
| Latin America | 25 | 1.6% |
| South America | 9 | 0.6% |
| South Eastern Asia | 52 | 3.3% |
| Vietnam | 52 | 3.3% |
| Western Europe | 7 | 0.4% | View All 11 Rows |
Sex and Age in Mont Alto borough
Sex and Age in Mont Alto borough
The most populous age groups in Mont Alto borough are 20 to 24 Years (83 | 10.8%) for men and 20 to 24 Years (100 | 12.6%) for women.
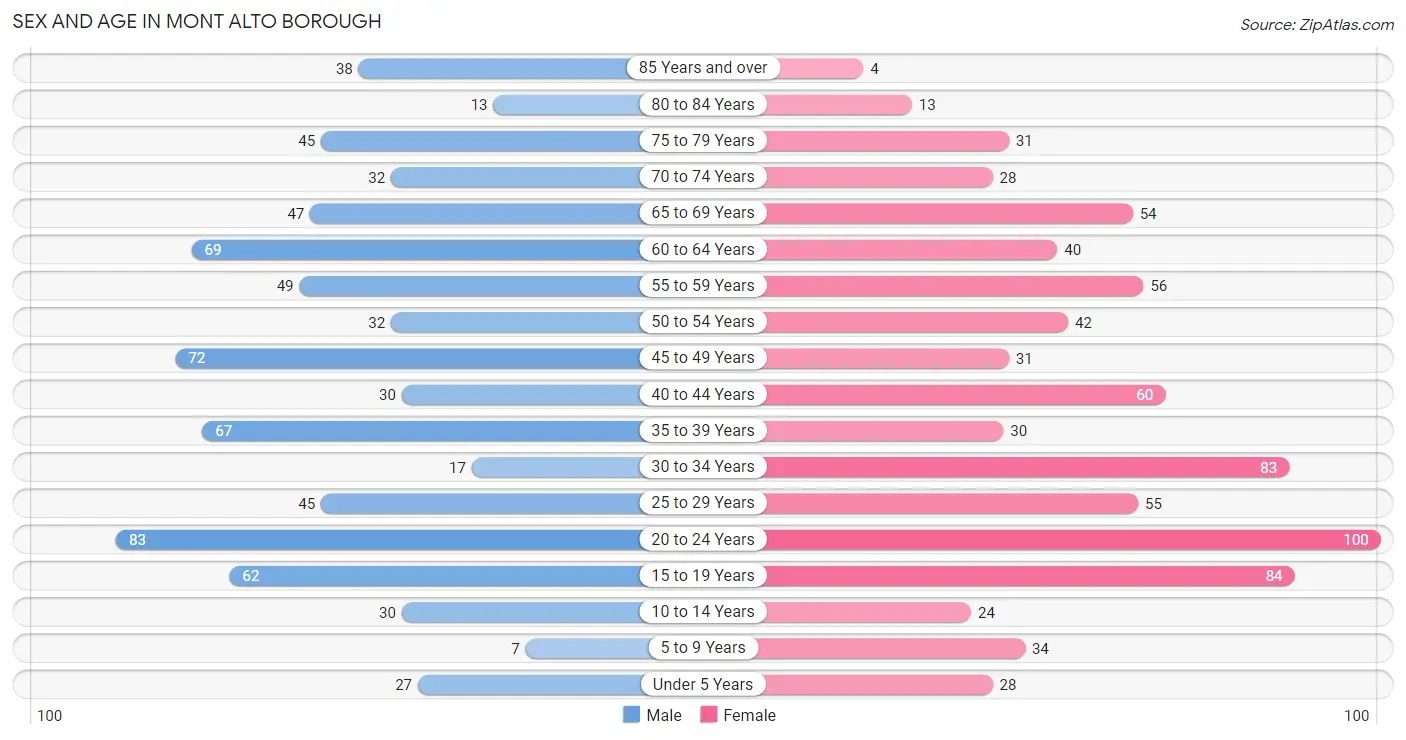
| Age Bracket | Male | Female |
| Under 5 Years | 27 (3.5%) | 28 (3.5%) |
| 5 to 9 Years | 7 (0.9%) | 34 (4.3%) |
| 10 to 14 Years | 30 (3.9%) | 24 (3.0%) |
| 15 to 19 Years | 62 (8.1%) | 84 (10.5%) |
| 20 to 24 Years | 83 (10.8%) | 100 (12.6%) |
| 25 to 29 Years | 45 (5.9%) | 55 (6.9%) |
| 30 to 34 Years | 17 (2.2%) | 83 (10.4%) |
| 35 to 39 Years | 67 (8.8%) | 30 (3.8%) |
| 40 to 44 Years | 30 (3.9%) | 60 (7.5%) |
| 45 to 49 Years | 72 (9.4%) | 31 (3.9%) |
| 50 to 54 Years | 32 (4.2%) | 42 (5.3%) |
| 55 to 59 Years | 49 (6.4%) | 56 (7.0%) |
| 60 to 64 Years | 69 (9.0%) | 40 (5.0%) |
| 65 to 69 Years | 47 (6.1%) | 54 (6.8%) |
| 70 to 74 Years | 32 (4.2%) | 28 (3.5%) |
| 75 to 79 Years | 45 (5.9%) | 31 (3.9%) |
| 80 to 84 Years | 13 (1.7%) | 13 (1.6%) |
| 85 Years and over | 38 (5.0%) | 4 (0.5%) |
| Total | 765 (100.0%) | 797 (100.0%) |
Families and Households in Mont Alto borough
Median Family Size in Mont Alto borough
The median family size in Mont Alto borough is 2.55 persons per family, with single female/mother families (61 | 13.2%) accounting for the largest median family size of 2.79 persons per family. On the other hand, single male/father families (30 | 6.5%) represent the smallest median family size with 2.27 persons per family.
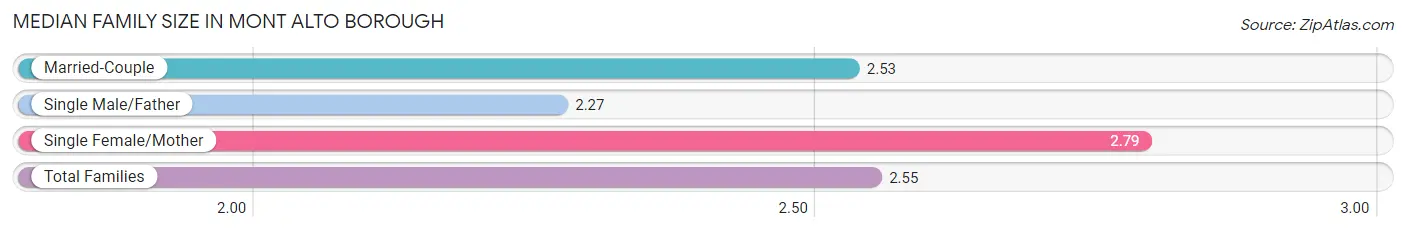
| Family Type | # Families | Family Size |
| Married-Couple | 373 (80.4%) | 2.53 |
| Single Male/Father | 30 (6.5%) | 2.27 |
| Single Female/Mother | 61 (13.2%) | 2.79 |
| Total Families | 464 (100.0%) | 2.55 |
Median Household Size in Mont Alto borough
The median household size in Mont Alto borough is 2.29 persons per household, with single female/mother households (61 | 9.7%) accounting for the largest median household size of 2.95 persons per household. non-family households (163 | 26.0%) represent the smallest median household size with 1.36 persons per household.
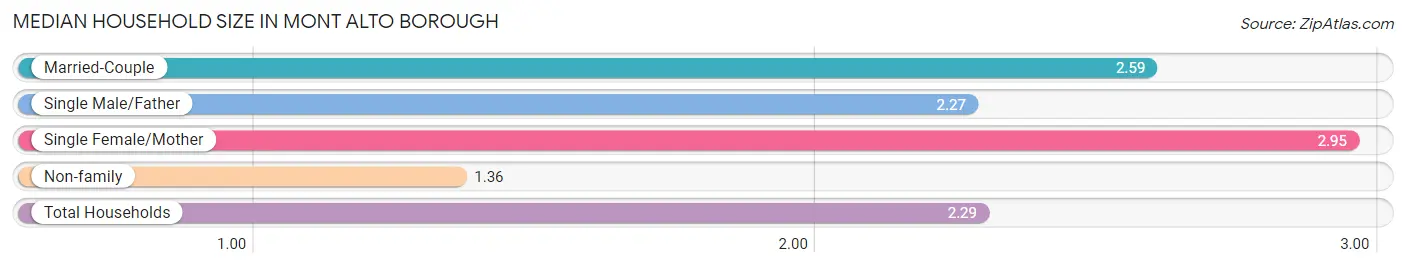
| Household Type | # Households | Household Size |
| Married-Couple | 373 (59.5%) | 2.59 |
| Single Male/Father | 30 (4.8%) | 2.27 |
| Single Female/Mother | 61 (9.7%) | 2.95 |
| Non-family | 163 (26.0%) | 1.36 |
| Total Households | 627 (100.0%) | 2.29 |
Household Size by Marriage Status in Mont Alto borough
Out of a total of 627 households in Mont Alto borough, 464 (74.0%) are family households, while 163 (26.0%) are nonfamily households. The most numerous type of family households are 2-person households, comprising 231, and the most common type of nonfamily households are 1-person households, comprising 116.
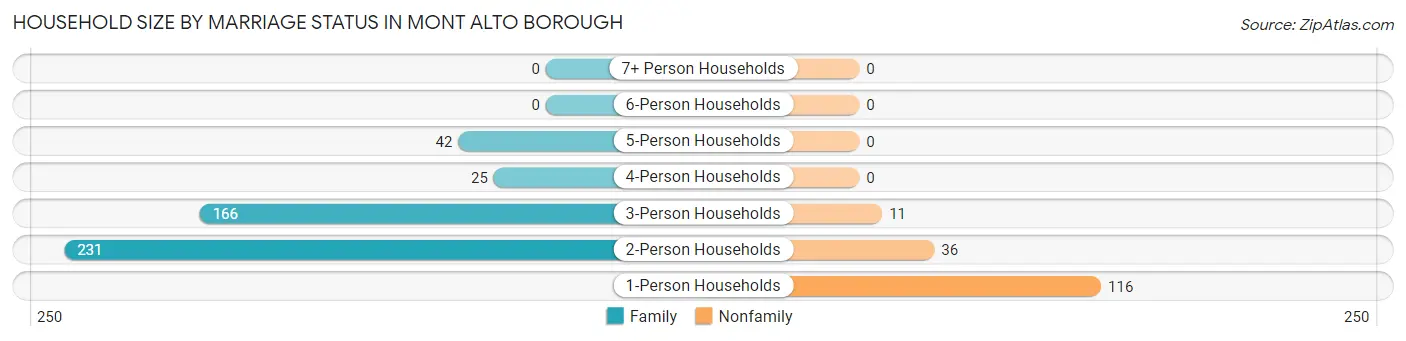
| Household Size | Family Households | Nonfamily Households |
| 1-Person Households | - | 116 (18.5%) |
| 2-Person Households | 231 (36.8%) | 36 (5.7%) |
| 3-Person Households | 166 (26.5%) | 11 (1.8%) |
| 4-Person Households | 25 (4.0%) | 0 (0.0%) |
| 5-Person Households | 42 (6.7%) | 0 (0.0%) |
| 6-Person Households | 0 (0.0%) | 0 (0.0%) |
| 7+ Person Households | 0 (0.0%) | 0 (0.0%) |
| Total | 464 (74.0%) | 163 (26.0%) |
Female Fertility in Mont Alto borough
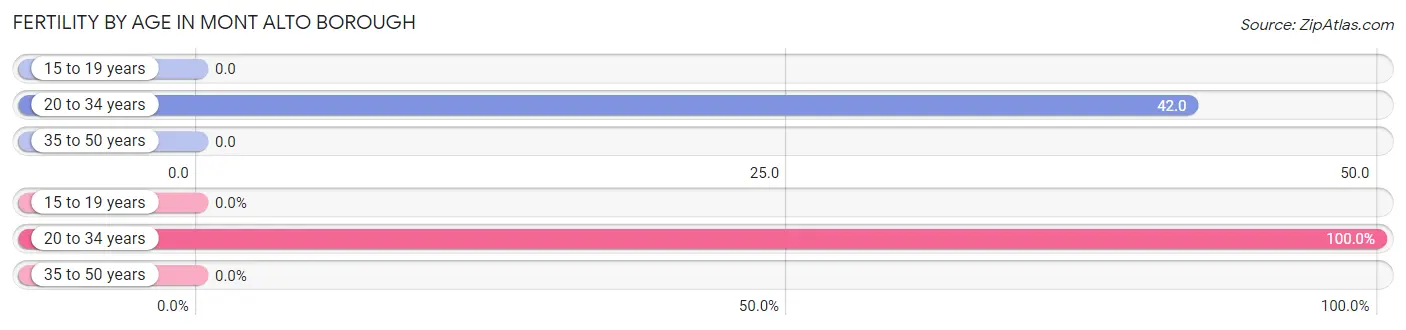
Fertility by Age in Mont Alto borough
Average fertility rate in Mont Alto borough is 22.0 births per 1,000 women. Women in the age bracket of 20 to 34 years have the highest fertility rate with 42.0 births per 1,000 women. Women in the age bracket of 20 to 34 years acount for 100.0% of all women with births.
| Age Bracket | Women with Births | Births / 1,000 Women |
| 15 to 19 years | 0 (0.0%) | 0.0 |
| 20 to 34 years | 10 (100.0%) | 42.0 |
| 35 to 50 years | 0 (0.0%) | 0.0 |
| Total | 10 (100.0%) | 22.0 |
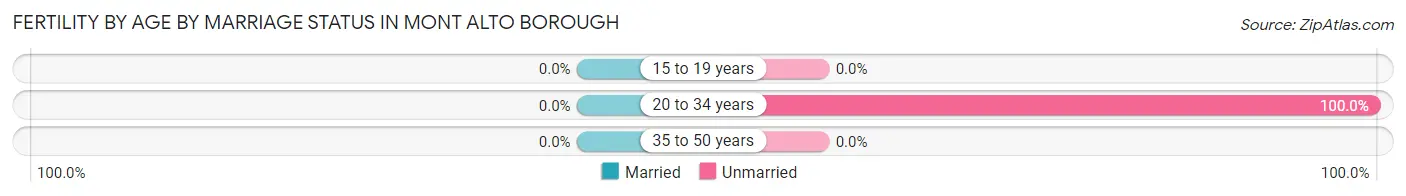
Fertility by Age by Marriage Status in Mont Alto borough
| Age Bracket | Married | Unmarried |
| 15 to 19 years | 0 (0.0%) | 0 (0.0%) |
| 20 to 34 years | 0 (0.0%) | 10 (100.0%) |
| 35 to 50 years | 0 (0.0%) | 0 (0.0%) |
| Total | 0 (0.0%) | 10 (100.0%) |
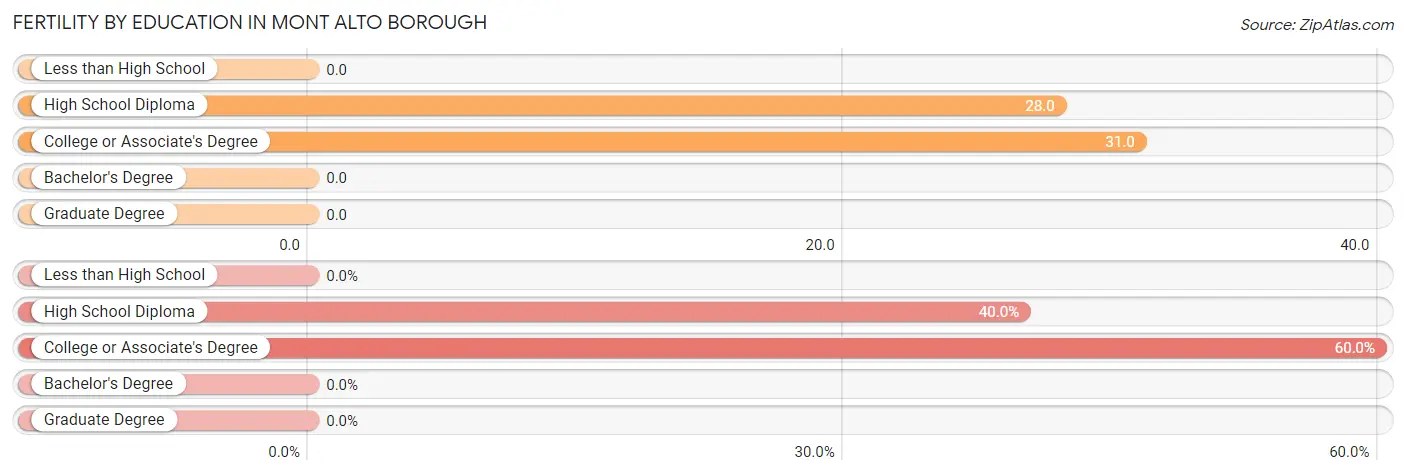
Fertility by Education in Mont Alto borough
| Educational Attainment | Women with Births | Births / 1,000 Women |
| Less than High School | 0 (0.0%) | 0.0 |
| High School Diploma | 4 (40.0%) | 28.0 |
| College or Associate's Degree | 6 (60.0%) | 31.0 |
| Bachelor's Degree | 0 (0.0%) | 0.0 |
| Graduate Degree | 0 (0.0%) | 0.0 |
| Total | 10 (100.0%) | 22.0 |
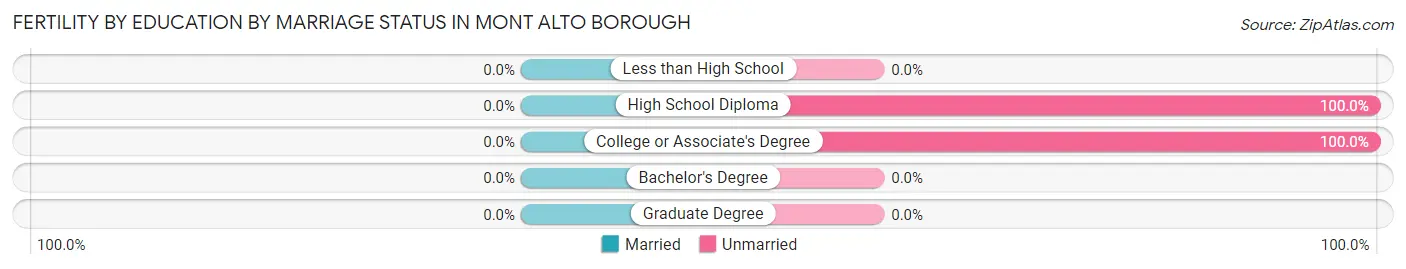
Fertility by Education by Marriage Status in Mont Alto borough
| Educational Attainment | Married | Unmarried |
| Less than High School | 0 (0.0%) | 0 (0.0%) |
| High School Diploma | 0 (0.0%) | 4 (100.0%) |
| College or Associate's Degree | 0 (0.0%) | 6 (100.0%) |
| Bachelor's Degree | 0 (0.0%) | 0 (0.0%) |
| Graduate Degree | 0 (0.0%) | 0 (0.0%) |
| Total | 0 (0.0%) | 10 (100.0%) |
Employment Characteristics in Mont Alto borough
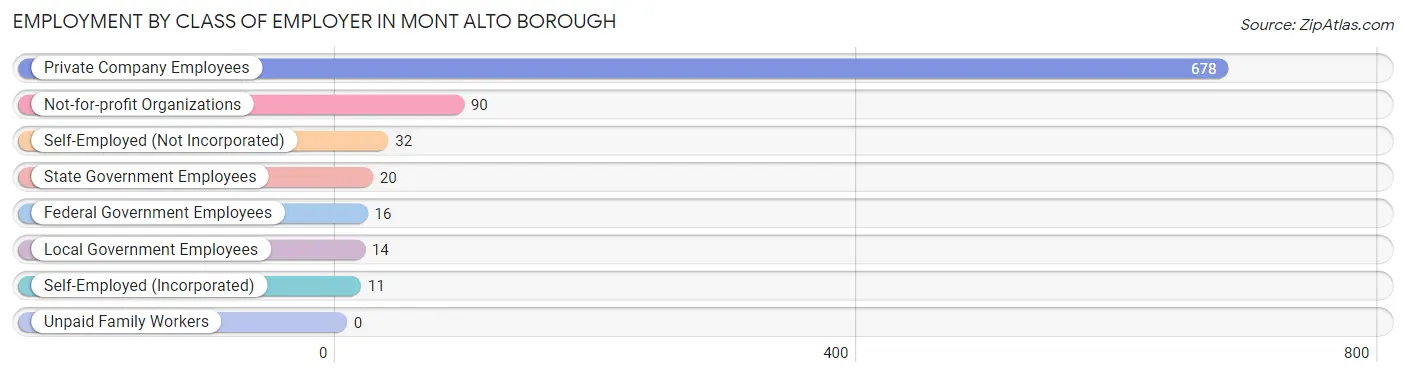
Employment by Class of Employer in Mont Alto borough
Among the 861 employed individuals in Mont Alto borough, private company employees (678 | 78.7%), not-for-profit organizations (90 | 10.4%), and self-employed (not incorporated) (32 | 3.7%) make up the most common classes of employment.
| Employer Class | # Employees | % Employees |
| Private Company Employees | 678 | 78.7% |
| Self-Employed (Incorporated) | 11 | 1.3% |
| Self-Employed (Not Incorporated) | 32 | 3.7% |
| Not-for-profit Organizations | 90 | 10.4% |
| Local Government Employees | 14 | 1.6% |
| State Government Employees | 20 | 2.3% |
| Federal Government Employees | 16 | 1.9% |
| Unpaid Family Workers | 0 | 0.0% |
| Total | 861 | 100.0% |
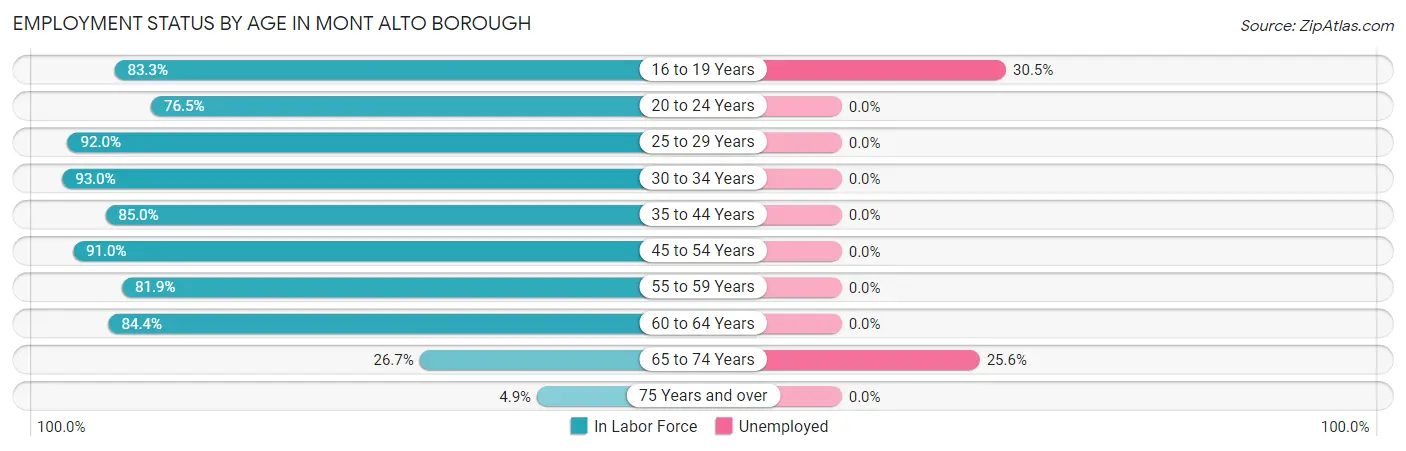
Employment Status by Age in Mont Alto borough
According to the labor force statistics for Mont Alto borough, out of the total population over 16 years of age (1,392), 70.3% or 979 individuals are in the labor force, with 4.4% or 43 of them unemployed. The age group with the highest labor force participation rate is 30 to 34 years, with 93.0% or 93 individuals in the labor force. Within the labor force, the 16 to 19 years age range has the highest percentage of unemployed individuals, with 30.5% or 32 of them being unemployed.
| Age Bracket | In Labor Force | Unemployed |
| 16 to 19 Years | 105 (83.3%) | 32 (30.5%) |
| 20 to 24 Years | 140 (76.5%) | 0 (0.0%) |
| 25 to 29 Years | 92 (92.0%) | 0 (0.0%) |
| 30 to 34 Years | 93 (93.0%) | 0 (0.0%) |
| 35 to 44 Years | 159 (85.0%) | 0 (0.0%) |
| 45 to 54 Years | 161 (91.0%) | 0 (0.0%) |
| 55 to 59 Years | 86 (81.9%) | 0 (0.0%) |
| 60 to 64 Years | 92 (84.4%) | 0 (0.0%) |
| 65 to 74 Years | 43 (26.7%) | 11 (25.6%) |
| 75 Years and over | 7 (4.9%) | 0 (0.0%) |
| Total | 979 (70.3%) | 43 (4.4%) |
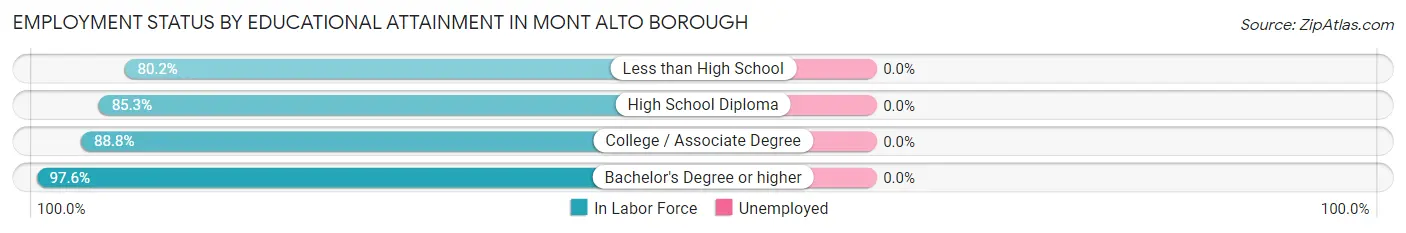
Employment Status by Educational Attainment in Mont Alto borough
| Educational Attainment | In Labor Force | Unemployed |
| Less than High School | 69 (80.2%) | 0 (0.0%) |
| High School Diploma | 291 (85.3%) | 0 (0.0%) |
| College / Associate Degree | 199 (88.8%) | 0 (0.0%) |
| Bachelor's Degree or higher | 124 (97.6%) | 0 (0.0%) |
| Total | 683 (87.8%) | 0 (0.0%) |
Employment Occupations by Sex in Mont Alto borough
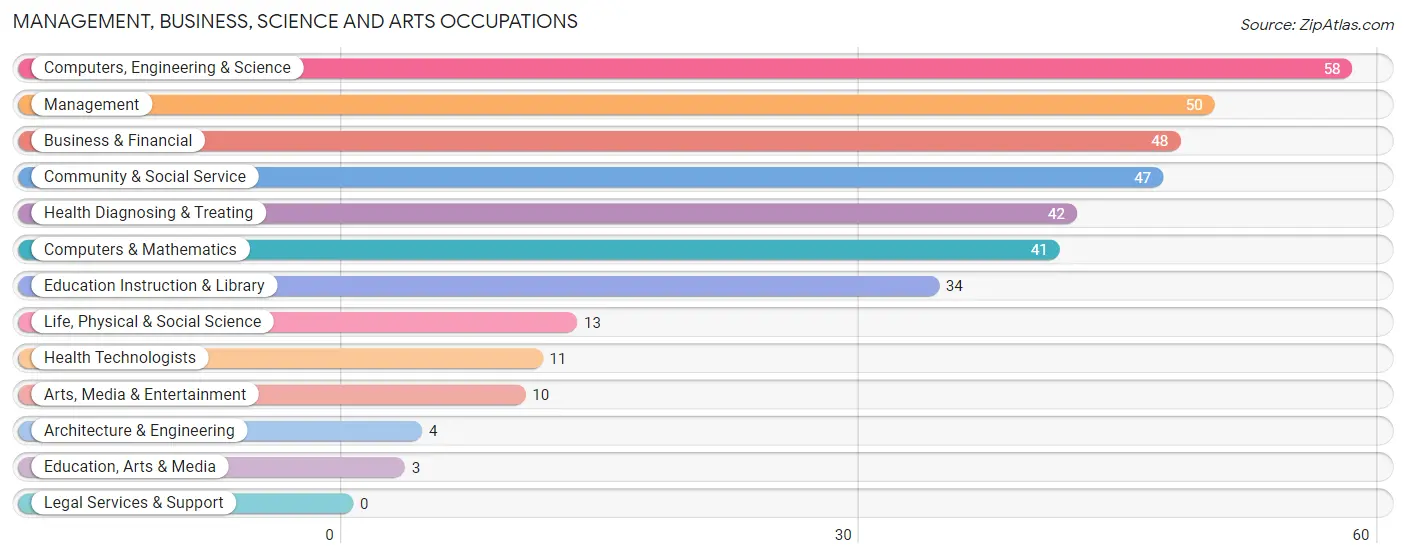
Management, Business, Science and Arts Occupations
The most common Management, Business, Science and Arts occupations in Mont Alto borough are Computers, Engineering & Science (58 | 6.2%), Management (50 | 5.3%), Business & Financial (48 | 5.1%), Community & Social Service (47 | 5.0%), and Health Diagnosing & Treating (42 | 4.5%).
Management, Business, Science and Arts Occupations by Sex
Within the Management, Business, Science and Arts occupations in Mont Alto borough, the most male-oriented occupations are Architecture & Engineering (100.0%), Life, Physical & Social Science (100.0%), and Education, Arts & Media (100.0%), while the most female-oriented occupations are Arts, Media & Entertainment (100.0%), Health Technologists (100.0%), and Health Diagnosing & Treating (78.6%).
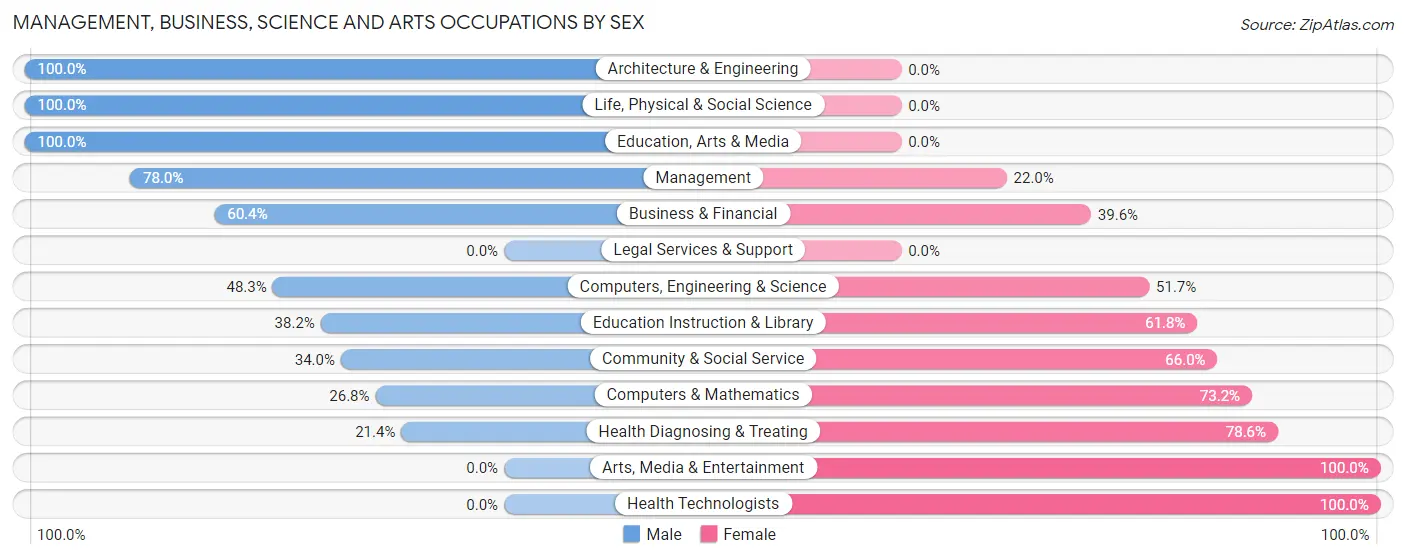
| Occupation | Male | Female |
| Management | 39 (78.0%) | 11 (22.0%) |
| Business & Financial | 29 (60.4%) | 19 (39.6%) |
| Computers, Engineering & Science | 28 (48.3%) | 30 (51.7%) |
| Computers & Mathematics | 11 (26.8%) | 30 (73.2%) |
| Architecture & Engineering | 4 (100.0%) | 0 (0.0%) |
| Life, Physical & Social Science | 13 (100.0%) | 0 (0.0%) |
| Community & Social Service | 16 (34.0%) | 31 (66.0%) |
| Education, Arts & Media | 3 (100.0%) | 0 (0.0%) |
| Legal Services & Support | 0 (0.0%) | 0 (0.0%) |
| Education Instruction & Library | 13 (38.2%) | 21 (61.8%) |
| Arts, Media & Entertainment | 0 (0.0%) | 10 (100.0%) |
| Health Diagnosing & Treating | 9 (21.4%) | 33 (78.6%) |
| Health Technologists | 0 (0.0%) | 11 (100.0%) |
| Total (Category) | 121 (49.4%) | 124 (50.6%) |
| Total (Overall) | 466 (49.8%) | 469 (50.2%) |
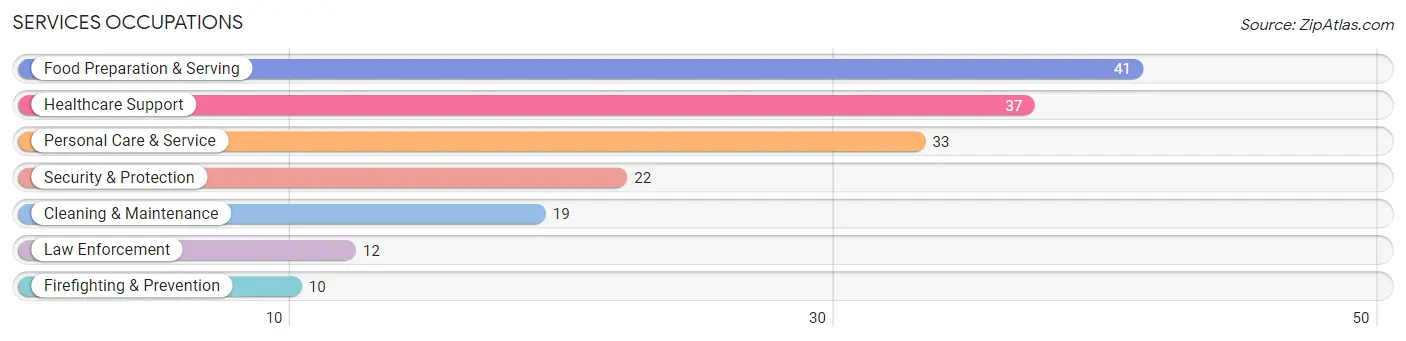
Services Occupations
The most common Services occupations in Mont Alto borough are Food Preparation & Serving (41 | 4.4%), Healthcare Support (37 | 4.0%), Personal Care & Service (33 | 3.5%), Security & Protection (22 | 2.4%), and Cleaning & Maintenance (19 | 2.0%).
Services Occupations by Sex
Within the Services occupations in Mont Alto borough, the most male-oriented occupations are Law Enforcement (100.0%), Security & Protection (90.9%), and Firefighting & Prevention (80.0%), while the most female-oriented occupations are Personal Care & Service (100.0%), Healthcare Support (70.3%), and Food Preparation & Serving (61.0%).
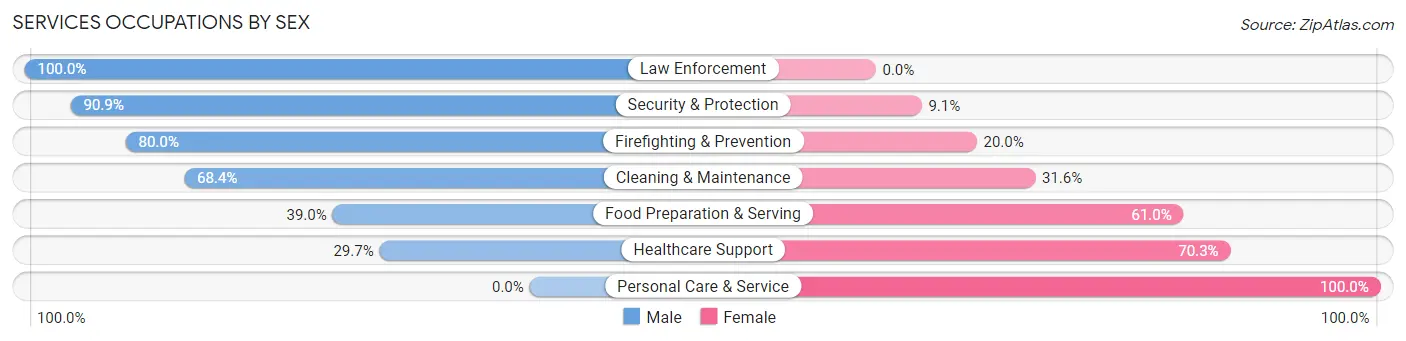
| Occupation | Male | Female |
| Healthcare Support | 11 (29.7%) | 26 (70.3%) |
| Security & Protection | 20 (90.9%) | 2 (9.1%) |
| Firefighting & Prevention | 8 (80.0%) | 2 (20.0%) |
| Law Enforcement | 12 (100.0%) | 0 (0.0%) |
| Food Preparation & Serving | 16 (39.0%) | 25 (61.0%) |
| Cleaning & Maintenance | 13 (68.4%) | 6 (31.6%) |
| Personal Care & Service | 0 (0.0%) | 33 (100.0%) |
| Total (Category) | 60 (39.5%) | 92 (60.5%) |
| Total (Overall) | 466 (49.8%) | 469 (50.2%) |
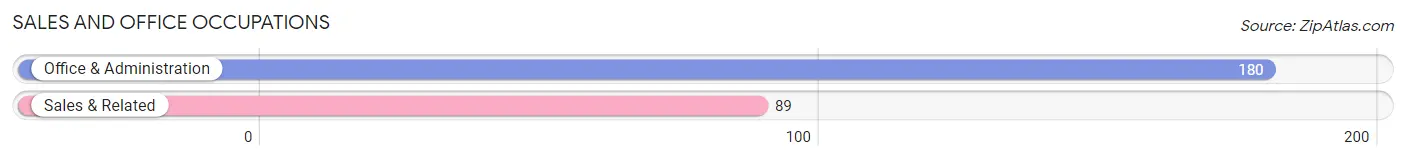
Sales and Office Occupations
The most common Sales and Office occupations in Mont Alto borough are Office & Administration (180 | 19.3%), and Sales & Related (89 | 9.5%).
Sales and Office Occupations by Sex
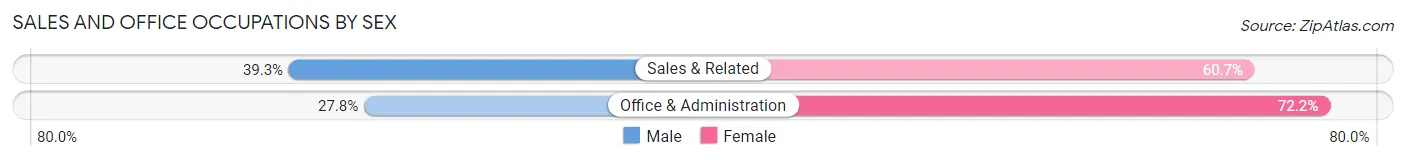
| Occupation | Male | Female |
| Sales & Related | 35 (39.3%) | 54 (60.7%) |
| Office & Administration | 50 (27.8%) | 130 (72.2%) |
| Total (Category) | 85 (31.6%) | 184 (68.4%) |
| Total (Overall) | 466 (49.8%) | 469 (50.2%) |
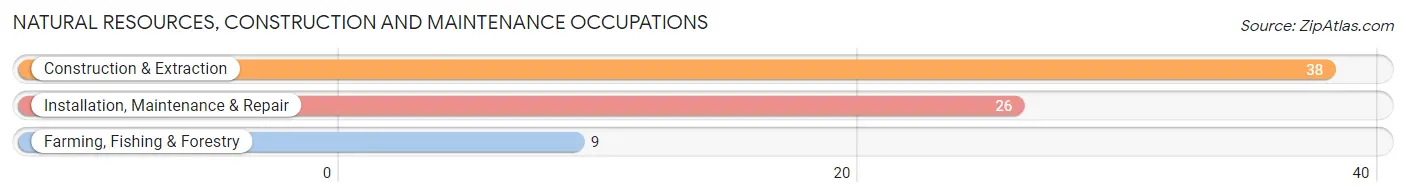
Natural Resources, Construction and Maintenance Occupations
The most common Natural Resources, Construction and Maintenance occupations in Mont Alto borough are Construction & Extraction (38 | 4.1%), Installation, Maintenance & Repair (26 | 2.8%), and Farming, Fishing & Forestry (9 | 1.0%).
Natural Resources, Construction and Maintenance Occupations by Sex
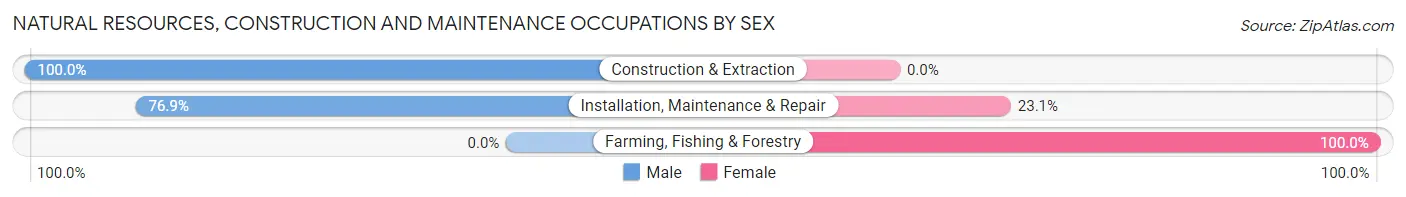
| Occupation | Male | Female |
| Farming, Fishing & Forestry | 0 (0.0%) | 9 (100.0%) |
| Construction & Extraction | 38 (100.0%) | 0 (0.0%) |
| Installation, Maintenance & Repair | 20 (76.9%) | 6 (23.1%) |
| Total (Category) | 58 (79.4%) | 15 (20.5%) |
| Total (Overall) | 466 (49.8%) | 469 (50.2%) |
Production, Transportation and Moving Occupations
The most common Production, Transportation and Moving occupations in Mont Alto borough are Production (112 | 12.0%), Material Moving (64 | 6.8%), and Transportation (20 | 2.1%).
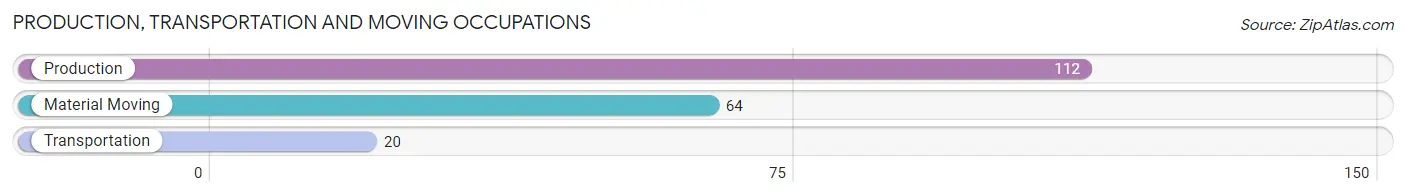
Production, Transportation and Moving Occupations by Sex
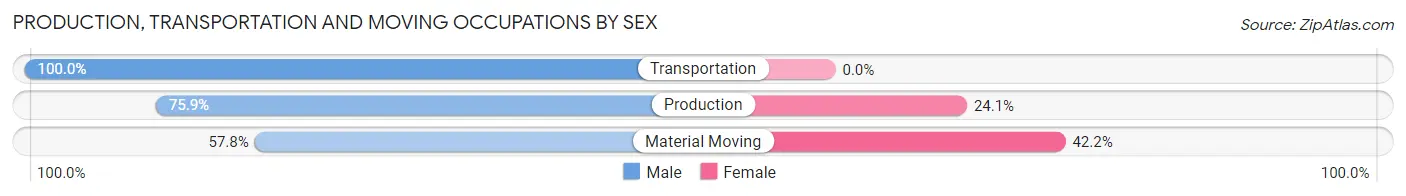
| Occupation | Male | Female |
| Production | 85 (75.9%) | 27 (24.1%) |
| Transportation | 20 (100.0%) | 0 (0.0%) |
| Material Moving | 37 (57.8%) | 27 (42.2%) |
| Total (Category) | 142 (72.5%) | 54 (27.6%) |
| Total (Overall) | 466 (49.8%) | 469 (50.2%) |
Employment Industries by Sex in Mont Alto borough
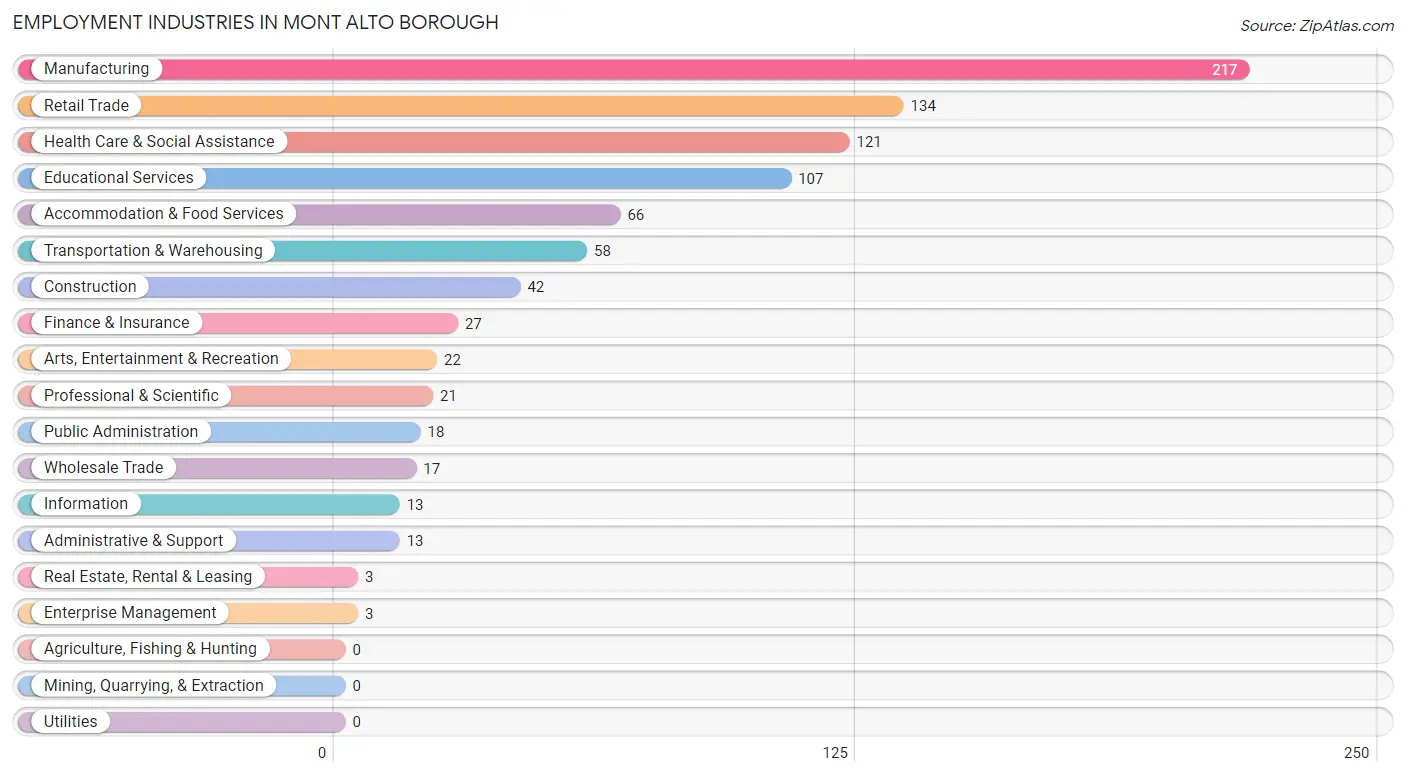
Employment Industries in Mont Alto borough
The major employment industries in Mont Alto borough include Manufacturing (217 | 23.2%), Retail Trade (134 | 14.3%), Health Care & Social Assistance (121 | 12.9%), Educational Services (107 | 11.4%), and Accommodation & Food Services (66 | 7.1%).
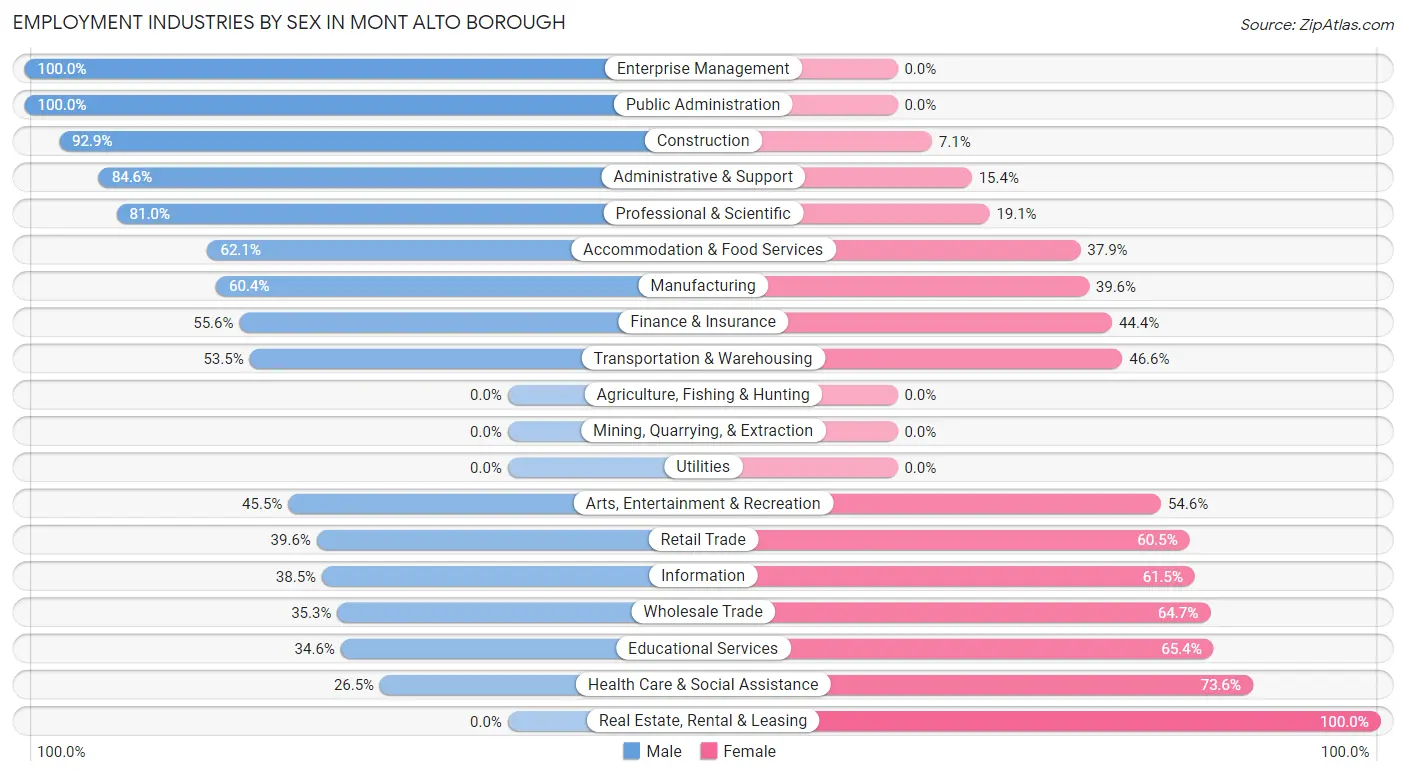
Employment Industries by Sex in Mont Alto borough
The Mont Alto borough industries that see more men than women are Enterprise Management (100.0%), Public Administration (100.0%), and Construction (92.9%), whereas the industries that tend to have a higher number of women are Real Estate, Rental & Leasing (100.0%), Health Care & Social Assistance (73.6%), and Educational Services (65.4%).
| Industry | Male | Female |
| Agriculture, Fishing & Hunting | 0 (0.0%) | 0 (0.0%) |
| Mining, Quarrying, & Extraction | 0 (0.0%) | 0 (0.0%) |
| Construction | 39 (92.9%) | 3 (7.1%) |
| Manufacturing | 131 (60.4%) | 86 (39.6%) |
| Wholesale Trade | 6 (35.3%) | 11 (64.7%) |
| Retail Trade | 53 (39.6%) | 81 (60.5%) |
| Transportation & Warehousing | 31 (53.4%) | 27 (46.6%) |
| Utilities | 0 (0.0%) | 0 (0.0%) |
| Information | 5 (38.5%) | 8 (61.5%) |
| Finance & Insurance | 15 (55.6%) | 12 (44.4%) |
| Real Estate, Rental & Leasing | 0 (0.0%) | 3 (100.0%) |
| Professional & Scientific | 17 (80.9%) | 4 (19.1%) |
| Enterprise Management | 3 (100.0%) | 0 (0.0%) |
| Administrative & Support | 11 (84.6%) | 2 (15.4%) |
| Educational Services | 37 (34.6%) | 70 (65.4%) |
| Health Care & Social Assistance | 32 (26.5%) | 89 (73.6%) |
| Arts, Entertainment & Recreation | 10 (45.5%) | 12 (54.5%) |
| Accommodation & Food Services | 41 (62.1%) | 25 (37.9%) |
| Public Administration | 18 (100.0%) | 0 (0.0%) |
| Total | 466 (49.8%) | 469 (50.2%) |
Education in Mont Alto borough
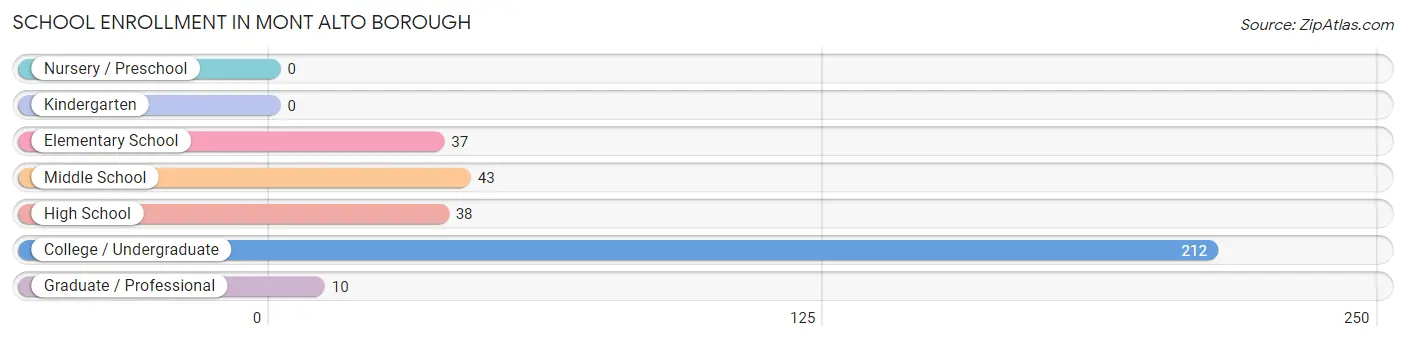
School Enrollment in Mont Alto borough
The most common levels of schooling among the 340 students in Mont Alto borough are college / undergraduate (212 | 62.4%), middle school (43 | 12.7%), and high school (38 | 11.2%).
| School Level | # Students | % Students |
| Nursery / Preschool | 0 | 0.0% |
| Kindergarten | 0 | 0.0% |
| Elementary School | 37 | 10.9% |
| Middle School | 43 | 12.7% |
| High School | 38 | 11.2% |
| College / Undergraduate | 212 | 62.4% |
| Graduate / Professional | 10 | 2.9% |
| Total | 340 | 100.0% |
School Enrollment by Age by Funding Source in Mont Alto borough
Out of a total of 340 students who are enrolled in schools in Mont Alto borough, 54 (15.9%) attend a private institution, while the remaining 286 (84.1%) are enrolled in public schools. The age group of 35 years and over has the highest likelihood of being enrolled in private schools, with 2 (40.0% in the age bracket) enrolled. Conversely, the age group of 25 to 34 year olds has the lowest likelihood of being enrolled in a private school, with 26 (100.0% in the age bracket) attending a public institution.
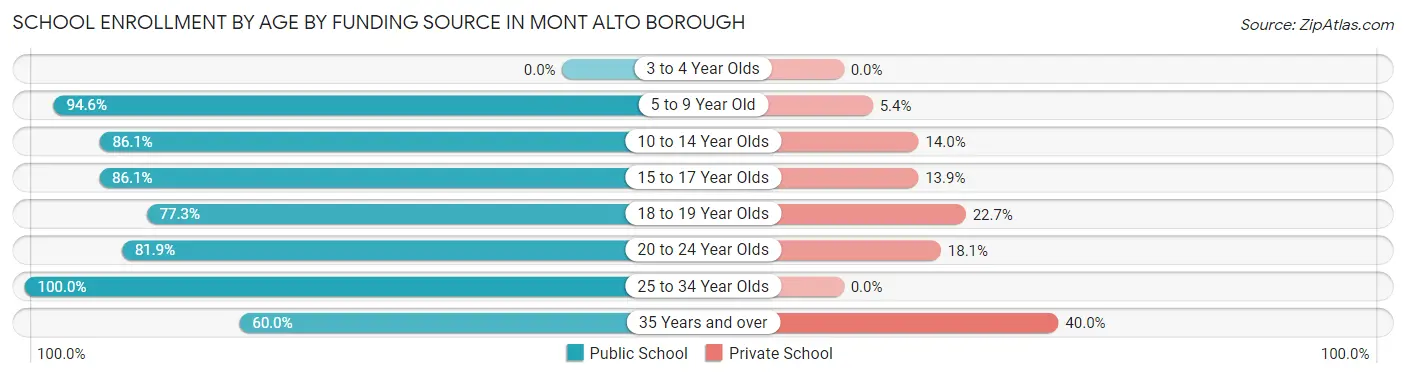
| Age Bracket | Public School | Private School |
| 3 to 4 Year Olds | 0 (0.0%) | 0 (0.0%) |
| 5 to 9 Year Old | 35 (94.6%) | 2 (5.4%) |
| 10 to 14 Year Olds | 37 (86.1%) | 6 (14.0%) |
| 15 to 17 Year Olds | 31 (86.1%) | 5 (13.9%) |
| 18 to 19 Year Olds | 68 (77.3%) | 20 (22.7%) |
| 20 to 24 Year Olds | 86 (81.9%) | 19 (18.1%) |
| 25 to 34 Year Olds | 26 (100.0%) | 0 (0.0%) |
| 35 Years and over | 3 (60.0%) | 2 (40.0%) |
| Total | 286 (84.1%) | 54 (15.9%) |
Educational Attainment by Field of Study in Mont Alto borough
Bio, nature & agricultural (47 | 27.3%), education (37 | 21.5%), business (30 | 17.4%), science & technology (13 | 7.6%), and computers & mathematics (12 | 7.0%) are the most common fields of study among 172 individuals in Mont Alto borough who have obtained a bachelor's degree or higher.
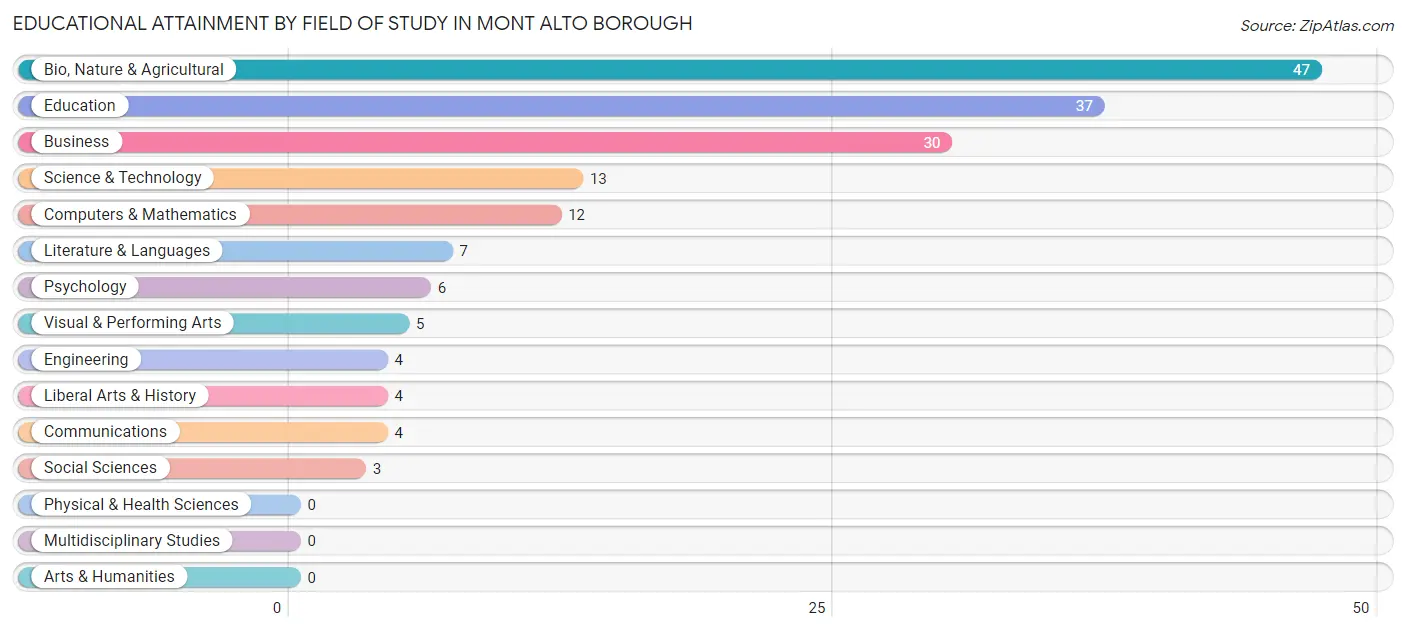
| Field of Study | # Graduates | % Graduates |
| Computers & Mathematics | 12 | 7.0% |
| Bio, Nature & Agricultural | 47 | 27.3% |
| Physical & Health Sciences | 0 | 0.0% |
| Psychology | 6 | 3.5% |
| Social Sciences | 3 | 1.7% |
| Engineering | 4 | 2.3% |
| Multidisciplinary Studies | 0 | 0.0% |
| Science & Technology | 13 | 7.6% |
| Business | 30 | 17.4% |
| Education | 37 | 21.5% |
| Literature & Languages | 7 | 4.1% |
| Liberal Arts & History | 4 | 2.3% |
| Visual & Performing Arts | 5 | 2.9% |
| Communications | 4 | 2.3% |
| Arts & Humanities | 0 | 0.0% |
| Total | 172 | 100.0% |
Transportation & Commute in Mont Alto borough
Vehicle Availability by Sex in Mont Alto borough
The most prevalent vehicle ownership categories in Mont Alto borough are males with 2 vehicles (159, accounting for 36.9%) and females with 2 vehicles (108, making up 39.5%).
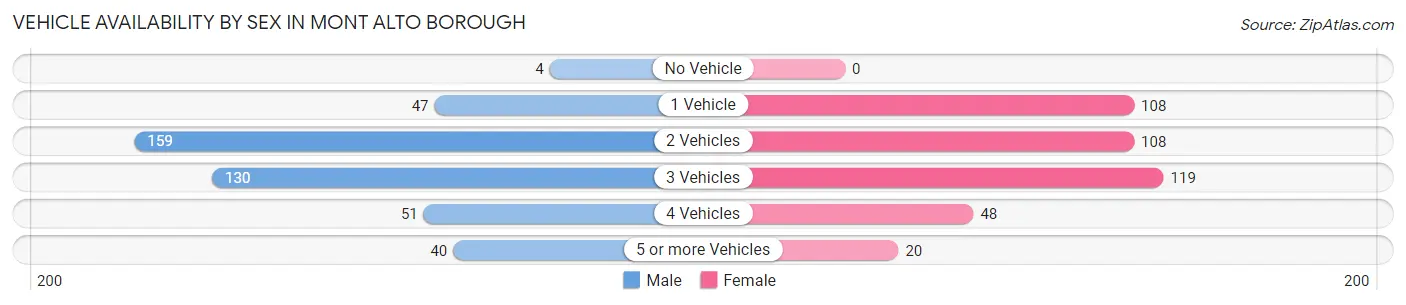
| Vehicles Available | Male | Female |
| No Vehicle | 4 (0.9%) | 0 (0.0%) |
| 1 Vehicle | 47 (10.9%) | 108 (26.8%) |
| 2 Vehicles | 159 (36.9%) | 108 (26.8%) |
| 3 Vehicles | 130 (30.2%) | 119 (29.5%) |
| 4 Vehicles | 51 (11.8%) | 48 (11.9%) |
| 5 or more Vehicles | 40 (9.3%) | 20 (5.0%) |
| Total | 431 (100.0%) | 403 (100.0%) |
Commute Time in Mont Alto borough
The most frequently occuring commute durations in Mont Alto borough are 20 to 24 minutes (192 commuters, 23.8%), 15 to 19 minutes (126 commuters, 15.6%), and 25 to 29 minutes (120 commuters, 14.9%).
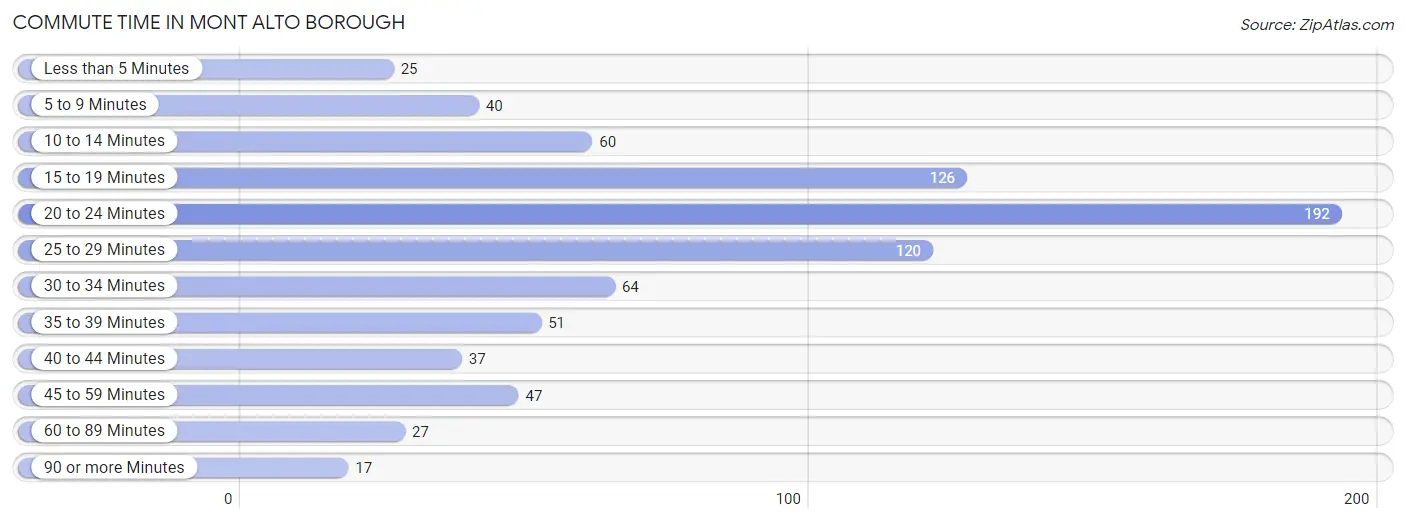
| Commute Time | # Commuters | % Commuters |
| Less than 5 Minutes | 25 | 3.1% |
| 5 to 9 Minutes | 40 | 5.0% |
| 10 to 14 Minutes | 60 | 7.4% |
| 15 to 19 Minutes | 126 | 15.6% |
| 20 to 24 Minutes | 192 | 23.8% |
| 25 to 29 Minutes | 120 | 14.9% |
| 30 to 34 Minutes | 64 | 7.9% |
| 35 to 39 Minutes | 51 | 6.3% |
| 40 to 44 Minutes | 37 | 4.6% |
| 45 to 59 Minutes | 47 | 5.8% |
| 60 to 89 Minutes | 27 | 3.4% |
| 90 or more Minutes | 17 | 2.1% |
Commute Time by Sex in Mont Alto borough
The most common commute times in Mont Alto borough are 20 to 24 minutes (77 commuters, 18.9%) for males and 20 to 24 minutes (115 commuters, 28.8%) for females.
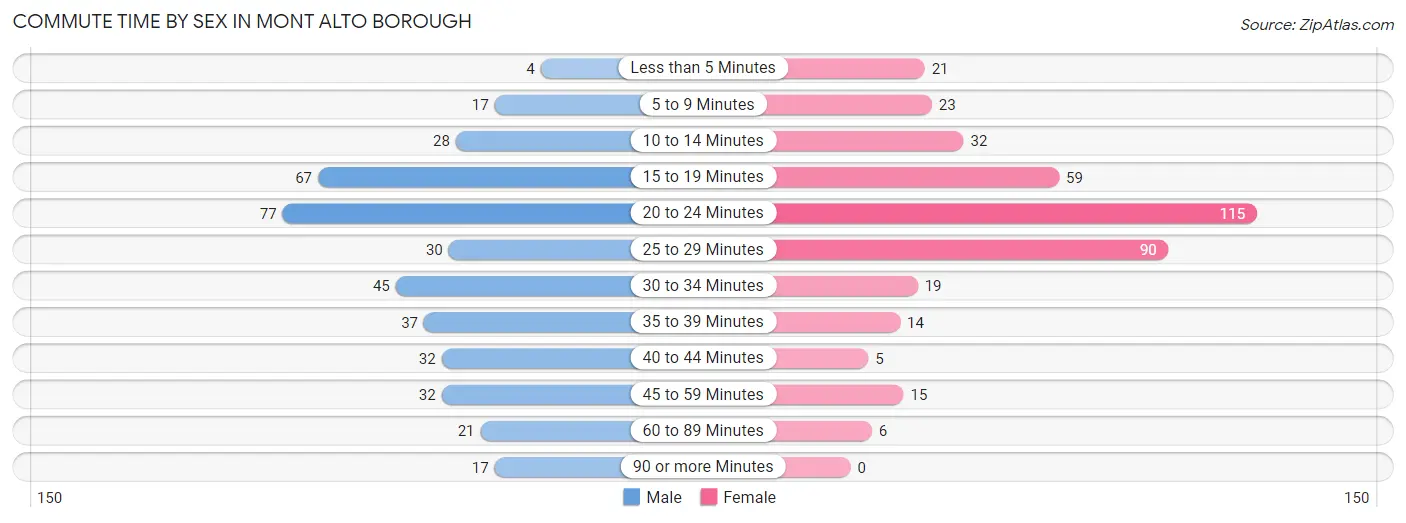
| Commute Time | Male | Female |
| Less than 5 Minutes | 4 (1.0%) | 21 (5.3%) |
| 5 to 9 Minutes | 17 (4.2%) | 23 (5.8%) |
| 10 to 14 Minutes | 28 (6.9%) | 32 (8.0%) |
| 15 to 19 Minutes | 67 (16.5%) | 59 (14.8%) |
| 20 to 24 Minutes | 77 (18.9%) | 115 (28.8%) |
| 25 to 29 Minutes | 30 (7.4%) | 90 (22.6%) |
| 30 to 34 Minutes | 45 (11.1%) | 19 (4.8%) |
| 35 to 39 Minutes | 37 (9.1%) | 14 (3.5%) |
| 40 to 44 Minutes | 32 (7.9%) | 5 (1.3%) |
| 45 to 59 Minutes | 32 (7.9%) | 15 (3.8%) |
| 60 to 89 Minutes | 21 (5.2%) | 6 (1.5%) |
| 90 or more Minutes | 17 (4.2%) | 0 (0.0%) |
Time of Departure to Work by Sex in Mont Alto borough
The most frequent times of departure to work in Mont Alto borough are 5:30 AM to 5:59 AM (78, 19.2%) for males and 6:30 AM to 6:59 AM (75, 18.8%) for females.
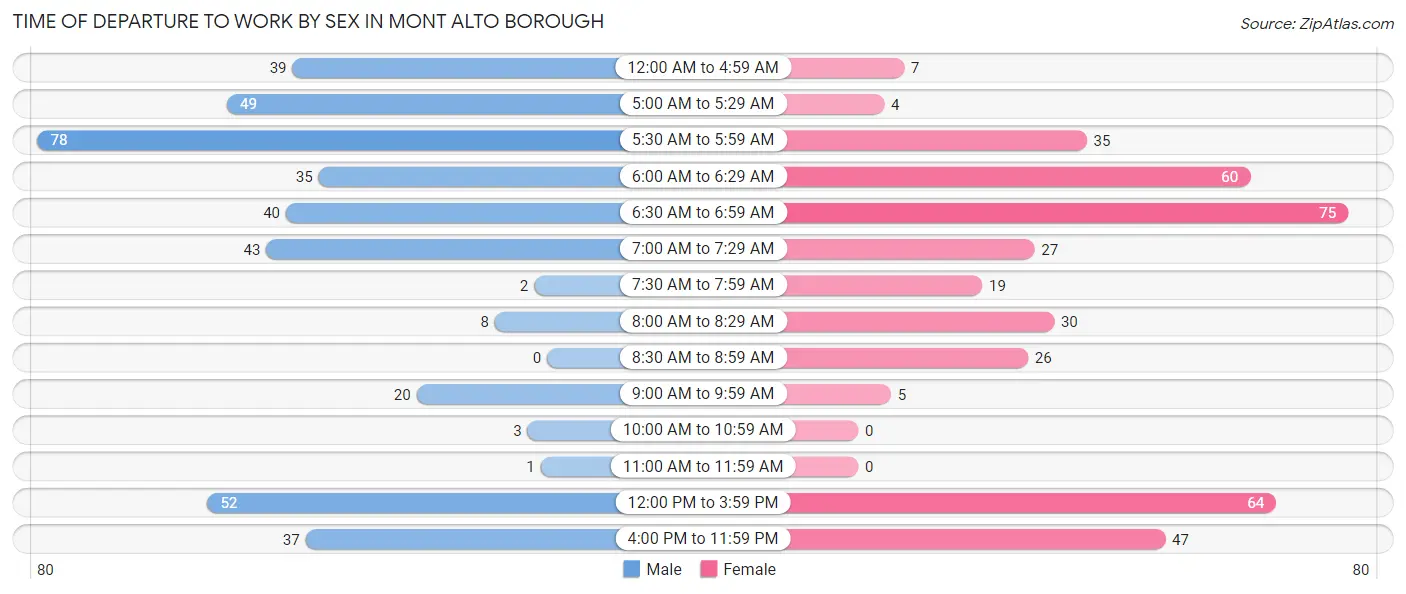
| Time of Departure | Male | Female |
| 12:00 AM to 4:59 AM | 39 (9.6%) | 7 (1.8%) |
| 5:00 AM to 5:29 AM | 49 (12.0%) | 4 (1.0%) |
| 5:30 AM to 5:59 AM | 78 (19.2%) | 35 (8.8%) |
| 6:00 AM to 6:29 AM | 35 (8.6%) | 60 (15.0%) |
| 6:30 AM to 6:59 AM | 40 (9.8%) | 75 (18.8%) |
| 7:00 AM to 7:29 AM | 43 (10.6%) | 27 (6.8%) |
| 7:30 AM to 7:59 AM | 2 (0.5%) | 19 (4.8%) |
| 8:00 AM to 8:29 AM | 8 (2.0%) | 30 (7.5%) |
| 8:30 AM to 8:59 AM | 0 (0.0%) | 26 (6.5%) |
| 9:00 AM to 9:59 AM | 20 (4.9%) | 5 (1.3%) |
| 10:00 AM to 10:59 AM | 3 (0.7%) | 0 (0.0%) |
| 11:00 AM to 11:59 AM | 1 (0.3%) | 0 (0.0%) |
| 12:00 PM to 3:59 PM | 52 (12.8%) | 64 (16.0%) |
| 4:00 PM to 11:59 PM | 37 (9.1%) | 47 (11.8%) |
| Total | 407 (100.0%) | 399 (100.0%) |
Housing Occupancy in Mont Alto borough
Occupancy by Ownership in Mont Alto borough
Of the total 627 dwellings in Mont Alto borough, owner-occupied units account for 462 (73.7%), while renter-occupied units make up 165 (26.3%).
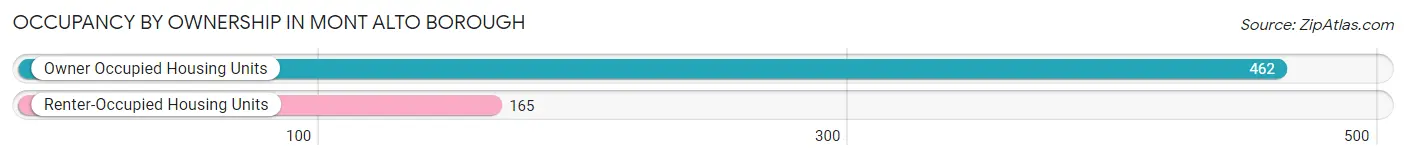
| Occupancy | # Housing Units | % Housing Units |
| Owner Occupied Housing Units | 462 | 73.7% |
| Renter-Occupied Housing Units | 165 | 26.3% |
| Total Occupied Housing Units | 627 | 100.0% |
Occupancy by Household Size in Mont Alto borough
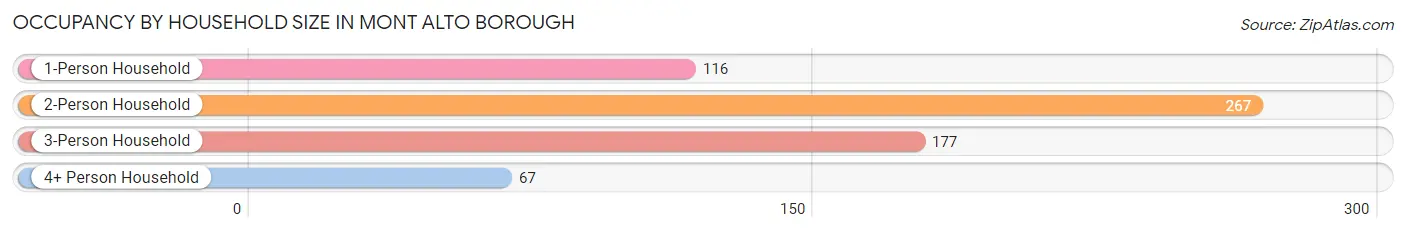
| Household Size | # Housing Units | % Housing Units |
| 1-Person Household | 116 | 18.5% |
| 2-Person Household | 267 | 42.6% |
| 3-Person Household | 177 | 28.2% |
| 4+ Person Household | 67 | 10.7% |
| Total Housing Units | 627 | 100.0% |
Occupancy by Ownership by Household Size in Mont Alto borough
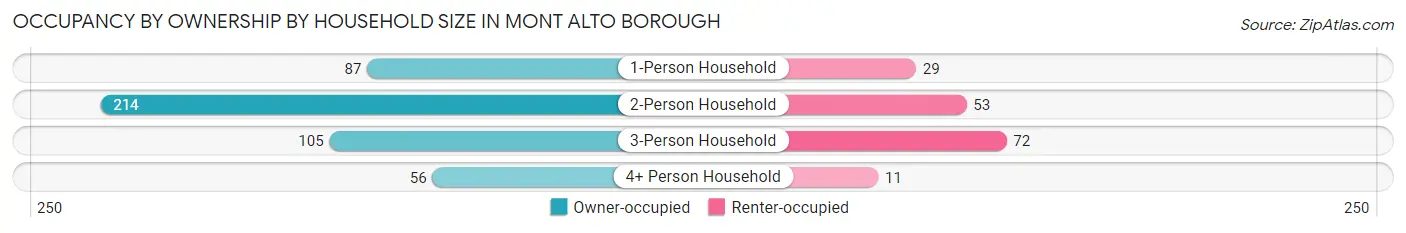
| Household Size | Owner-occupied | Renter-occupied |
| 1-Person Household | 87 (75.0%) | 29 (25.0%) |
| 2-Person Household | 214 (80.1%) | 53 (19.9%) |
| 3-Person Household | 105 (59.3%) | 72 (40.7%) |
| 4+ Person Household | 56 (83.6%) | 11 (16.4%) |
| Total Housing Units | 462 (73.7%) | 165 (26.3%) |
Occupancy by Educational Attainment in Mont Alto borough
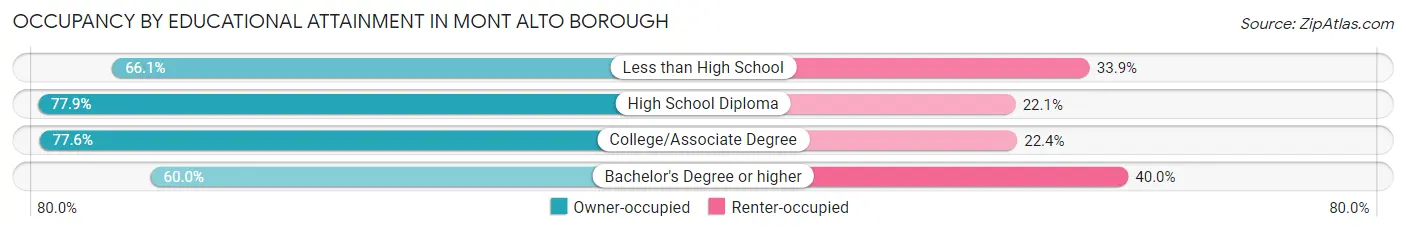
| Household Size | Owner-occupied | Renter-occupied |
| Less than High School | 39 (66.1%) | 20 (33.9%) |
| High School Diploma | 204 (77.9%) | 58 (22.1%) |
| College/Associate Degree | 156 (77.6%) | 45 (22.4%) |
| Bachelor's Degree or higher | 63 (60.0%) | 42 (40.0%) |
Occupancy by Age of Householder in Mont Alto borough
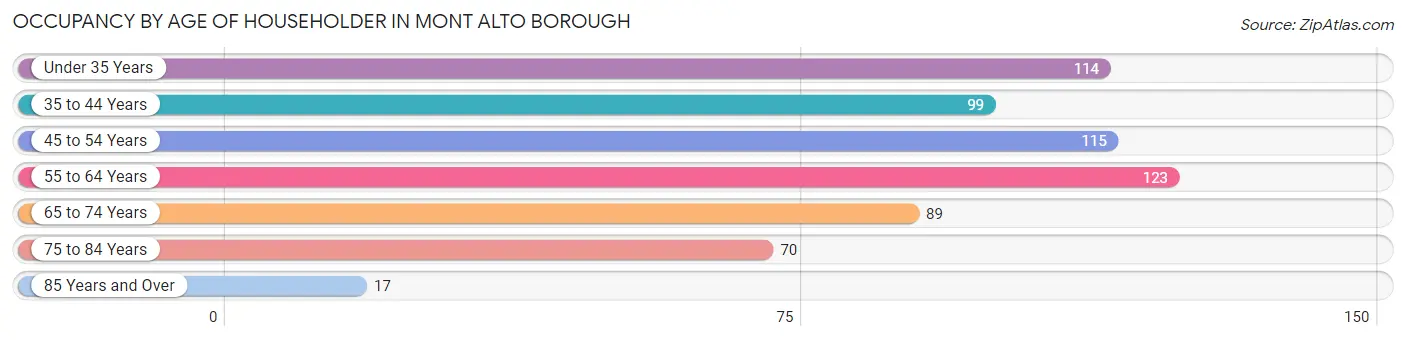
| Age Bracket | # Households | % Households |
| Under 35 Years | 114 | 18.2% |
| 35 to 44 Years | 99 | 15.8% |
| 45 to 54 Years | 115 | 18.3% |
| 55 to 64 Years | 123 | 19.6% |
| 65 to 74 Years | 89 | 14.2% |
| 75 to 84 Years | 70 | 11.2% |
| 85 Years and Over | 17 | 2.7% |
| Total | 627 | 100.0% |
Housing Finances in Mont Alto borough
Median Income by Occupancy in Mont Alto borough
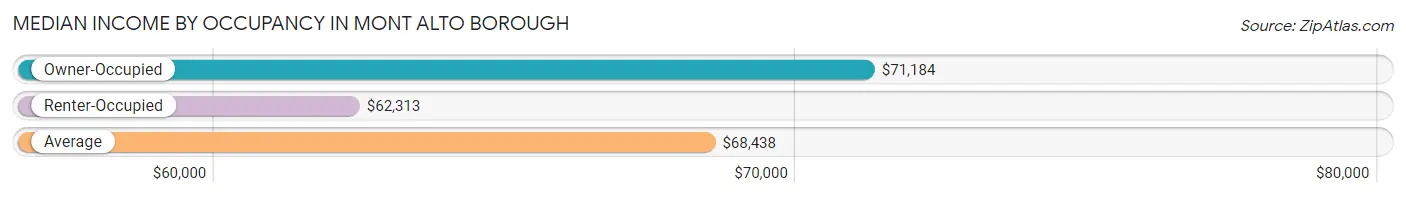
| Occupancy Type | # Households | Median Income |
| Owner-Occupied | 462 (73.7%) | $71,184 |
| Renter-Occupied | 165 (26.3%) | $62,313 |
| Average | 627 (100.0%) | $68,438 |
Occupancy by Householder Income Bracket in Mont Alto borough
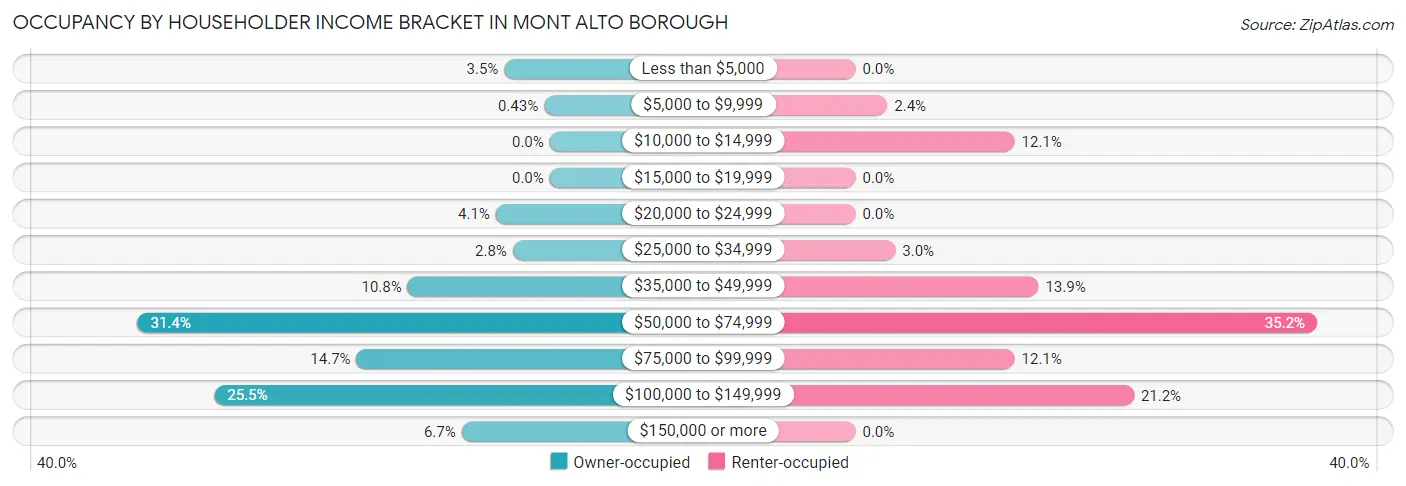
| Income Bracket | Owner-occupied | Renter-occupied |
| Less than $5,000 | 16 (3.5%) | 0 (0.0%) |
| $5,000 to $9,999 | 2 (0.4%) | 4 (2.4%) |
| $10,000 to $14,999 | 0 (0.0%) | 20 (12.1%) |
| $15,000 to $19,999 | 0 (0.0%) | 0 (0.0%) |
| $20,000 to $24,999 | 19 (4.1%) | 0 (0.0%) |
| $25,000 to $34,999 | 13 (2.8%) | 5 (3.0%) |
| $35,000 to $49,999 | 50 (10.8%) | 23 (13.9%) |
| $50,000 to $74,999 | 145 (31.4%) | 58 (35.1%) |
| $75,000 to $99,999 | 68 (14.7%) | 20 (12.1%) |
| $100,000 to $149,999 | 118 (25.5%) | 35 (21.2%) |
| $150,000 or more | 31 (6.7%) | 0 (0.0%) |
| Total | 462 (100.0%) | 165 (100.0%) |
Monthly Housing Cost Tiers in Mont Alto borough
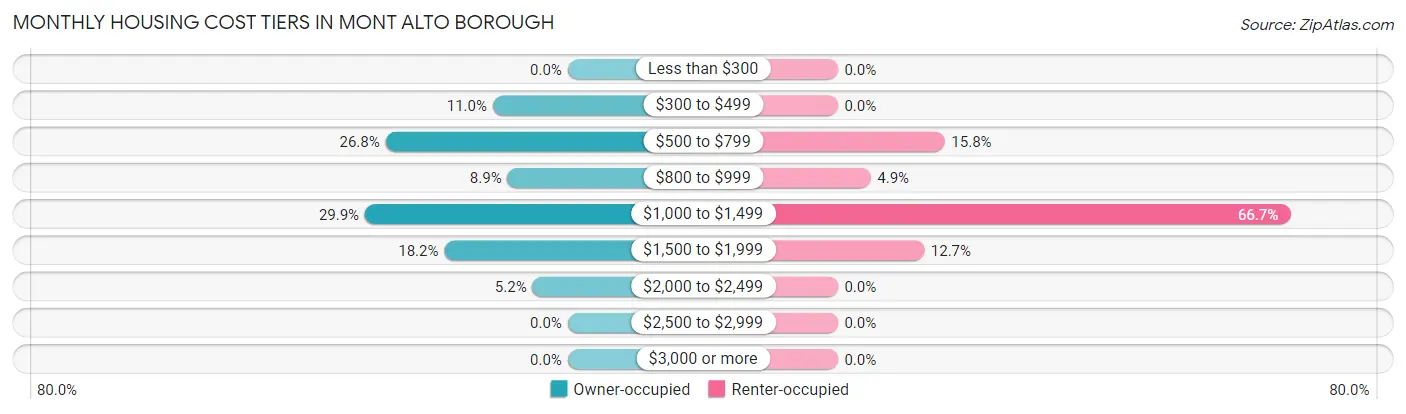
| Monthly Cost | Owner-occupied | Renter-occupied |
| Less than $300 | 0 (0.0%) | 0 (0.0%) |
| $300 to $499 | 51 (11.0%) | 0 (0.0%) |
| $500 to $799 | 124 (26.8%) | 26 (15.8%) |
| $800 to $999 | 41 (8.9%) | 8 (4.9%) |
| $1,000 to $1,499 | 138 (29.9%) | 110 (66.7%) |
| $1,500 to $1,999 | 84 (18.2%) | 21 (12.7%) |
| $2,000 to $2,499 | 24 (5.2%) | 0 (0.0%) |
| $2,500 to $2,999 | 0 (0.0%) | 0 (0.0%) |
| $3,000 or more | 0 (0.0%) | 0 (0.0%) |
| Total | 462 (100.0%) | 165 (100.0%) |
Physical Housing Characteristics in Mont Alto borough
Housing Structures in Mont Alto borough
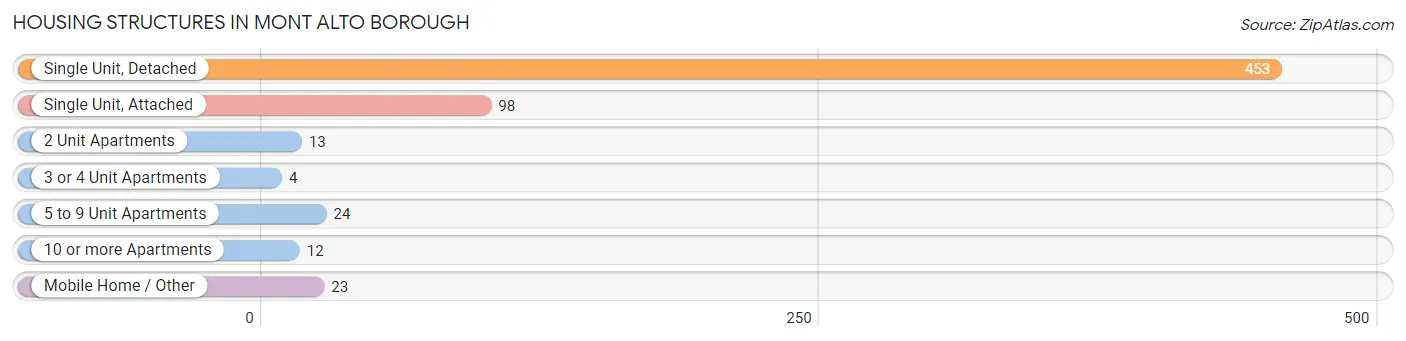
| Structure Type | # Housing Units | % Housing Units |
| Single Unit, Detached | 453 | 72.3% |
| Single Unit, Attached | 98 | 15.6% |
| 2 Unit Apartments | 13 | 2.1% |
| 3 or 4 Unit Apartments | 4 | 0.6% |
| 5 to 9 Unit Apartments | 24 | 3.8% |
| 10 or more Apartments | 12 | 1.9% |
| Mobile Home / Other | 23 | 3.7% |
| Total | 627 | 100.0% |
Housing Structures by Occupancy in Mont Alto borough
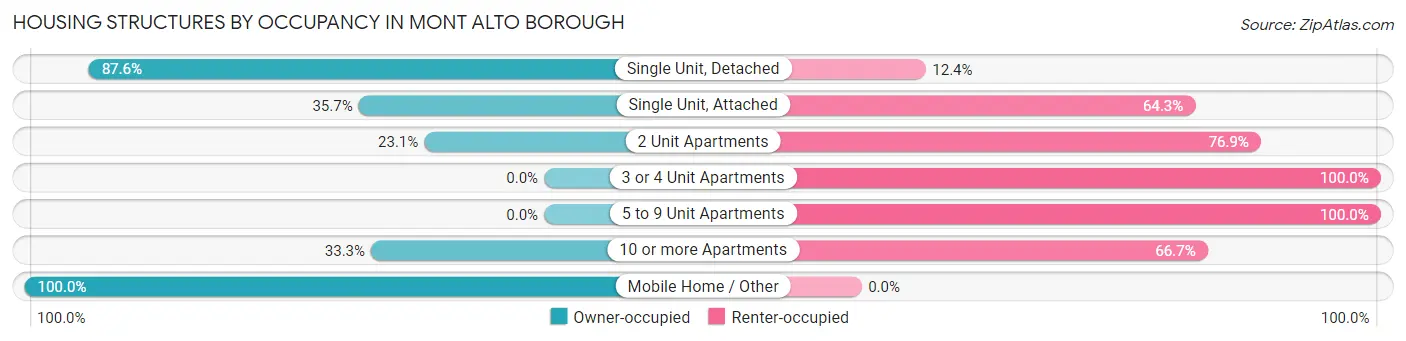
| Structure Type | Owner-occupied | Renter-occupied |
| Single Unit, Detached | 397 (87.6%) | 56 (12.4%) |
| Single Unit, Attached | 35 (35.7%) | 63 (64.3%) |
| 2 Unit Apartments | 3 (23.1%) | 10 (76.9%) |
| 3 or 4 Unit Apartments | 0 (0.0%) | 4 (100.0%) |
| 5 to 9 Unit Apartments | 0 (0.0%) | 24 (100.0%) |
| 10 or more Apartments | 4 (33.3%) | 8 (66.7%) |
| Mobile Home / Other | 23 (100.0%) | 0 (0.0%) |
| Total | 462 (73.7%) | 165 (26.3%) |
Housing Structures by Number of Rooms in Mont Alto borough
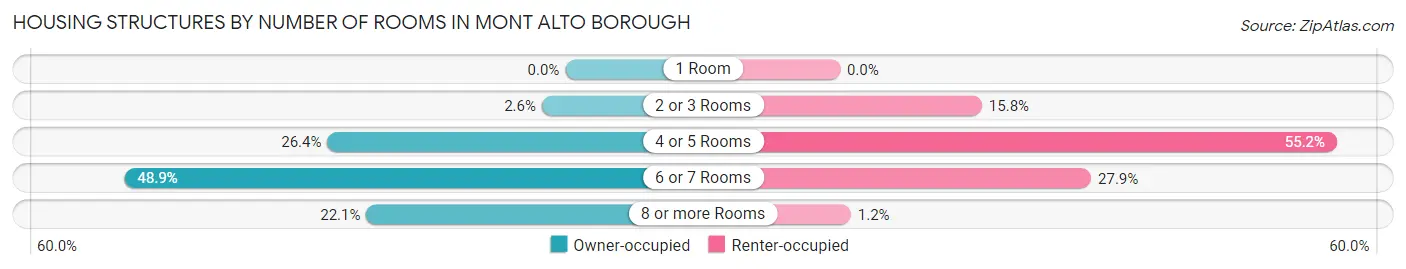
| Number of Rooms | Owner-occupied | Renter-occupied |
| 1 Room | 0 (0.0%) | 0 (0.0%) |
| 2 or 3 Rooms | 12 (2.6%) | 26 (15.8%) |
| 4 or 5 Rooms | 122 (26.4%) | 91 (55.1%) |
| 6 or 7 Rooms | 226 (48.9%) | 46 (27.9%) |
| 8 or more Rooms | 102 (22.1%) | 2 (1.2%) |
| Total | 462 (100.0%) | 165 (100.0%) |
Housing Structure by Heating Type in Mont Alto borough
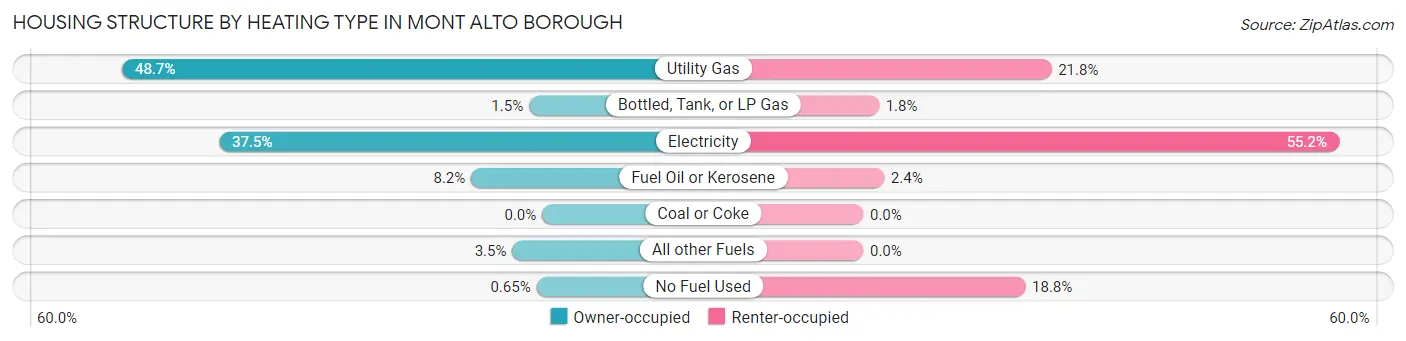
| Heating Type | Owner-occupied | Renter-occupied |
| Utility Gas | 225 (48.7%) | 36 (21.8%) |
| Bottled, Tank, or LP Gas | 7 (1.5%) | 3 (1.8%) |
| Electricity | 173 (37.4%) | 91 (55.1%) |
| Fuel Oil or Kerosene | 38 (8.2%) | 4 (2.4%) |
| Coal or Coke | 0 (0.0%) | 0 (0.0%) |
| All other Fuels | 16 (3.5%) | 0 (0.0%) |
| No Fuel Used | 3 (0.6%) | 31 (18.8%) |
| Total | 462 (100.0%) | 165 (100.0%) |
Household Vehicle Usage in Mont Alto borough
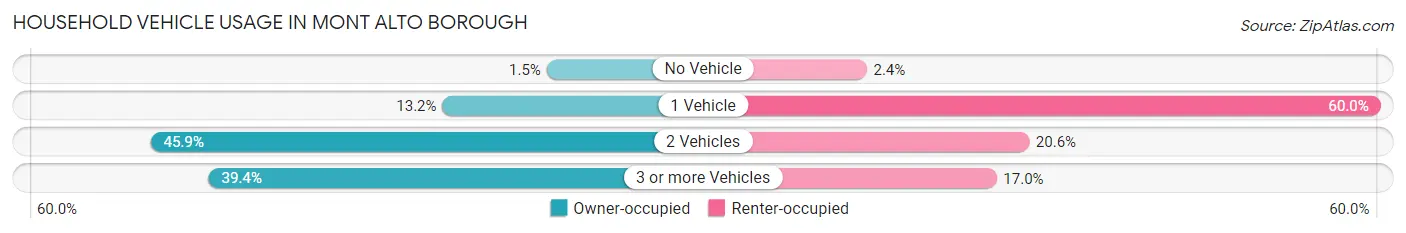
| Vehicles per Household | Owner-occupied | Renter-occupied |
| No Vehicle | 7 (1.5%) | 4 (2.4%) |
| 1 Vehicle | 61 (13.2%) | 99 (60.0%) |
| 2 Vehicles | 212 (45.9%) | 34 (20.6%) |
| 3 or more Vehicles | 182 (39.4%) | 28 (17.0%) |
| Total | 462 (100.0%) | 165 (100.0%) |
Real Estate & Mortgages in Mont Alto borough
Real Estate and Mortgage Overview in Mont Alto borough
| Characteristic | Without Mortgage | With Mortgage |
| Housing Units | 161 | 301 |
| Median Property Value | $167,700 | $178,500 |
| Median Household Income | $59,886 | $24 |
| Monthly Housing Costs | $544 | $0 |
| Real Estate Taxes | $2,090 | $0 |
Property Value by Mortgage Status in Mont Alto borough
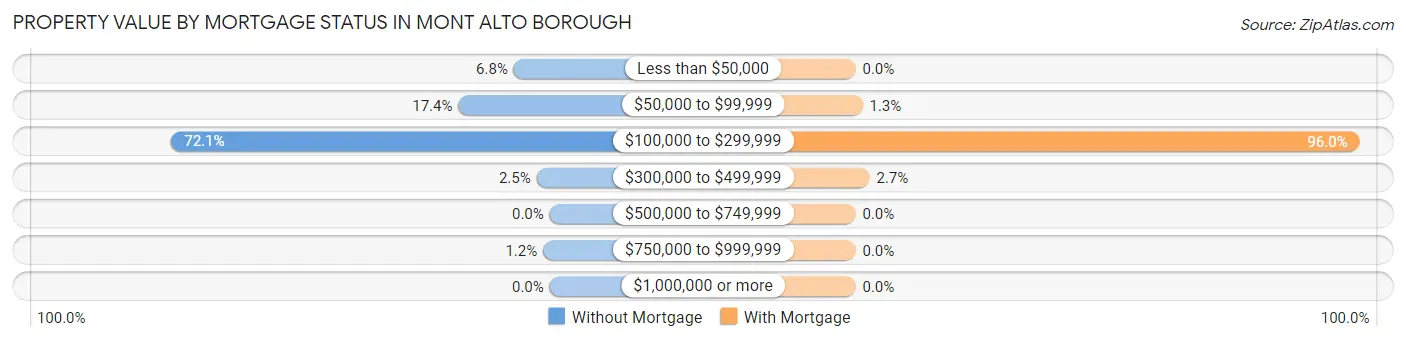
| Property Value | Without Mortgage | With Mortgage |
| Less than $50,000 | 11 (6.8%) | 0 (0.0%) |
| $50,000 to $99,999 | 28 (17.4%) | 4 (1.3%) |
| $100,000 to $299,999 | 116 (72.1%) | 289 (96.0%) |
| $300,000 to $499,999 | 4 (2.5%) | 8 (2.7%) |
| $500,000 to $749,999 | 0 (0.0%) | 0 (0.0%) |
| $750,000 to $999,999 | 2 (1.2%) | 0 (0.0%) |
| $1,000,000 or more | 0 (0.0%) | 0 (0.0%) |
| Total | 161 (100.0%) | 301 (100.0%) |
Household Income by Mortgage Status in Mont Alto borough
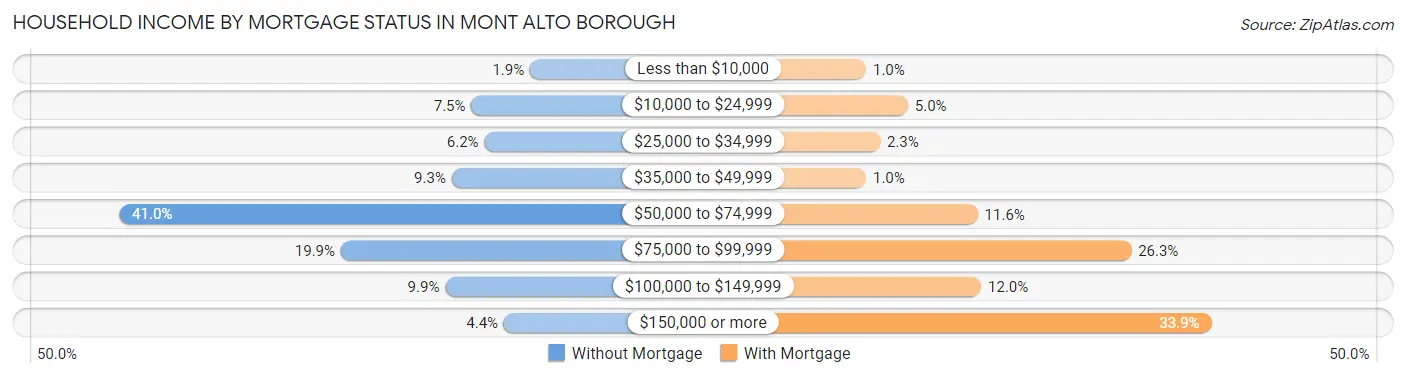
| Household Income | Without Mortgage | With Mortgage |
| Less than $10,000 | 3 (1.9%) | 3 (1.0%) |
| $10,000 to $24,999 | 12 (7.4%) | 15 (5.0%) |
| $25,000 to $34,999 | 10 (6.2%) | 7 (2.3%) |
| $35,000 to $49,999 | 15 (9.3%) | 3 (1.0%) |
| $50,000 to $74,999 | 66 (41.0%) | 35 (11.6%) |
| $75,000 to $99,999 | 32 (19.9%) | 79 (26.3%) |
| $100,000 to $149,999 | 16 (9.9%) | 36 (12.0%) |
| $150,000 or more | 7 (4.3%) | 102 (33.9%) |
| Total | 161 (100.0%) | 301 (100.0%) |
Property Value to Household Income Ratio in Mont Alto borough
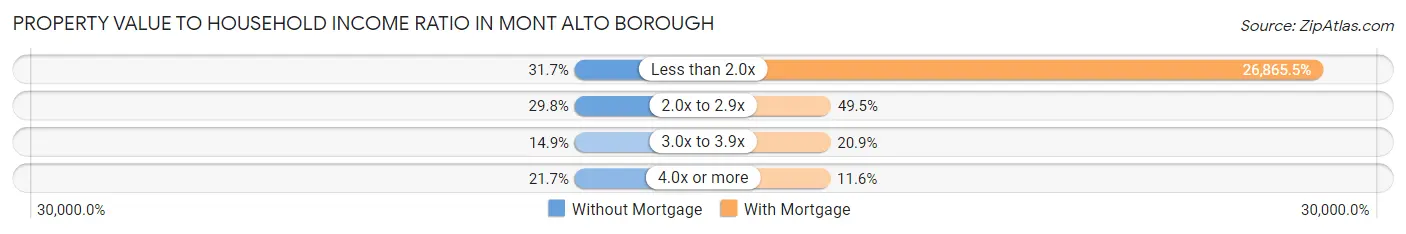
| Value-to-Income Ratio | Without Mortgage | With Mortgage |
| Less than 2.0x | 51 (31.7%) | 80,865 (26,865.4%) |
| 2.0x to 2.9x | 48 (29.8%) | 149 (49.5%) |
| 3.0x to 3.9x | 24 (14.9%) | 63 (20.9%) |
| 4.0x or more | 35 (21.7%) | 35 (11.6%) |
| Total | 161 (100.0%) | 301 (100.0%) |
Real Estate Taxes by Mortgage Status in Mont Alto borough
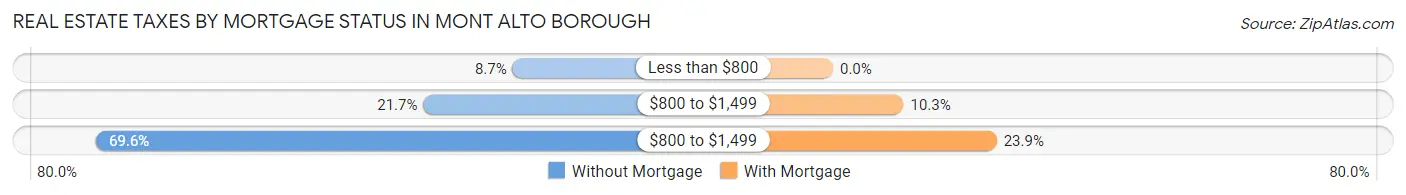
| Property Taxes | Without Mortgage | With Mortgage |
| Less than $800 | 14 (8.7%) | 0 (0.0%) |
| $800 to $1,499 | 35 (21.7%) | 31 (10.3%) |
| $800 to $1,499 | 112 (69.6%) | 72 (23.9%) |
| Total | 161 (100.0%) | 301 (100.0%) |
Health & Disability in Mont Alto borough
Health Insurance Coverage by Age in Mont Alto borough
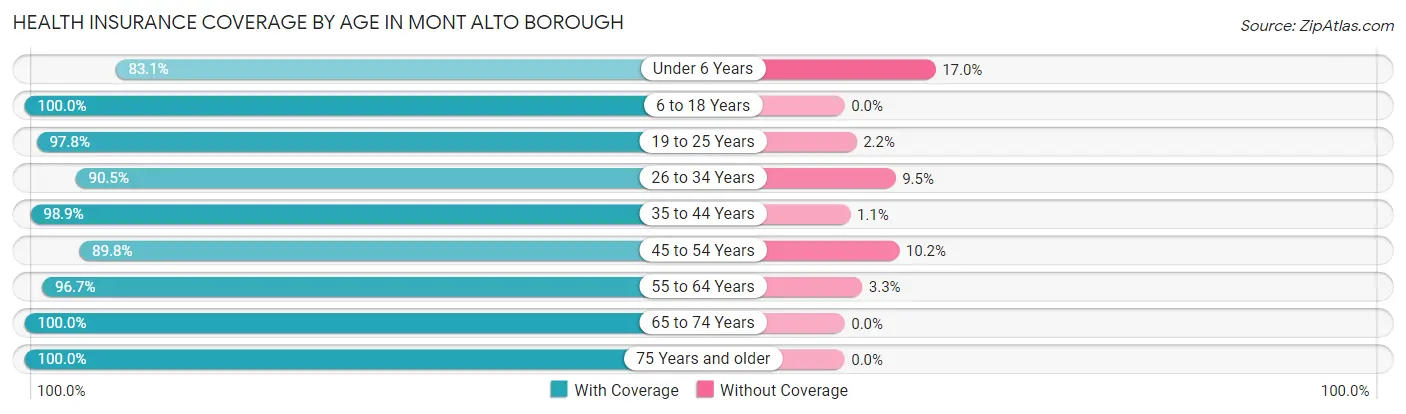
| Age Bracket | With Coverage | Without Coverage |
| Under 6 Years | 49 (83.1%) | 10 (17.0%) |
| 6 to 18 Years | 171 (100.0%) | 0 (0.0%) |
| 19 to 25 Years | 264 (97.8%) | 6 (2.2%) |
| 26 to 34 Years | 162 (90.5%) | 17 (9.5%) |
| 35 to 44 Years | 185 (98.9%) | 2 (1.1%) |
| 45 to 54 Years | 159 (89.8%) | 18 (10.2%) |
| 55 to 64 Years | 207 (96.7%) | 7 (3.3%) |
| 65 to 74 Years | 161 (100.0%) | 0 (0.0%) |
| 75 Years and older | 144 (100.0%) | 0 (0.0%) |
| Total | 1,502 (96.2%) | 60 (3.8%) |
Health Insurance Coverage by Citizenship Status in Mont Alto borough
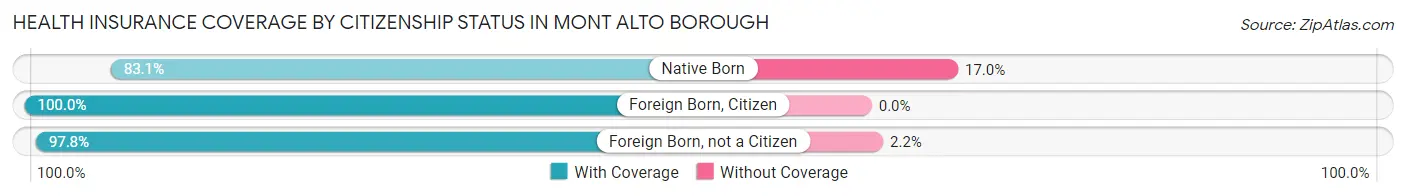
| Citizenship Status | With Coverage | Without Coverage |
| Native Born | 49 (83.1%) | 10 (17.0%) |
| Foreign Born, Citizen | 171 (100.0%) | 0 (0.0%) |
| Foreign Born, not a Citizen | 264 (97.8%) | 6 (2.2%) |
Health Insurance Coverage by Household Income in Mont Alto borough
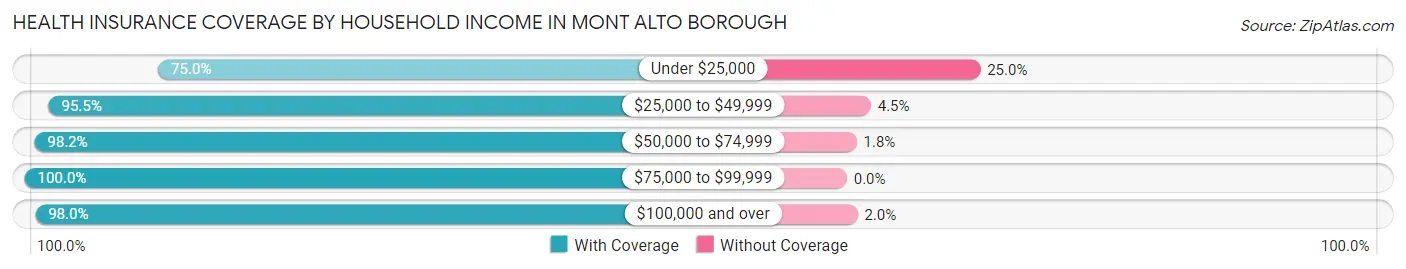
| Household Income | With Coverage | Without Coverage |
| Under $25,000 | 105 (75.0%) | 35 (25.0%) |
| $25,000 to $49,999 | 149 (95.5%) | 7 (4.5%) |
| $50,000 to $74,999 | 430 (98.2%) | 8 (1.8%) |
| $75,000 to $99,999 | 201 (100.0%) | 0 (0.0%) |
| $100,000 and over | 489 (98.0%) | 10 (2.0%) |
Public vs Private Health Insurance Coverage by Age in Mont Alto borough
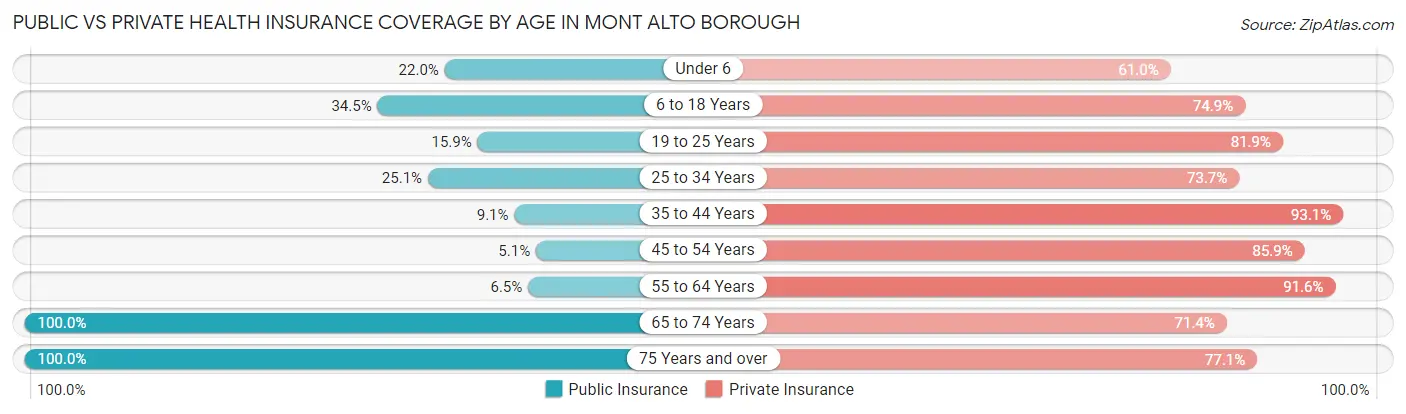
| Age Bracket | Public Insurance | Private Insurance |
| Under 6 | 13 (22.0%) | 36 (61.0%) |
| 6 to 18 Years | 59 (34.5%) | 128 (74.9%) |
| 19 to 25 Years | 43 (15.9%) | 221 (81.9%) |
| 25 to 34 Years | 45 (25.1%) | 132 (73.7%) |
| 35 to 44 Years | 17 (9.1%) | 174 (93.0%) |
| 45 to 54 Years | 9 (5.1%) | 152 (85.9%) |
| 55 to 64 Years | 14 (6.5%) | 196 (91.6%) |
| 65 to 74 Years | 161 (100.0%) | 115 (71.4%) |
| 75 Years and over | 144 (100.0%) | 111 (77.1%) |
| Total | 505 (32.3%) | 1,265 (81.0%) |
Disability Status by Sex by Age in Mont Alto borough
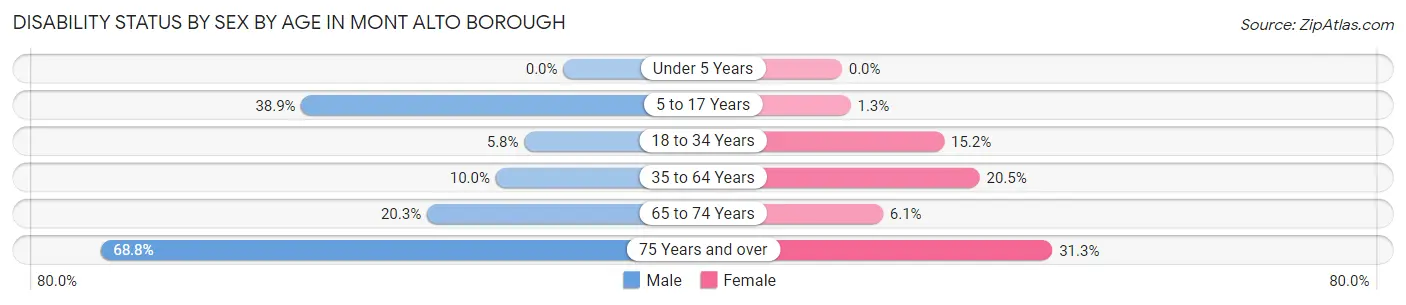
| Age Bracket | Male | Female |
| Under 5 Years | 0 (0.0%) | 0 (0.0%) |
| 5 to 17 Years | 21 (38.9%) | 1 (1.3%) |
| 18 to 34 Years | 11 (5.8%) | 46 (15.2%) |
| 35 to 64 Years | 32 (10.0%) | 53 (20.5%) |
| 65 to 74 Years | 16 (20.3%) | 5 (6.1%) |
| 75 Years and over | 66 (68.8%) | 15 (31.2%) |
Disability Class by Sex by Age in Mont Alto borough
Disability Class: Hearing Difficulty
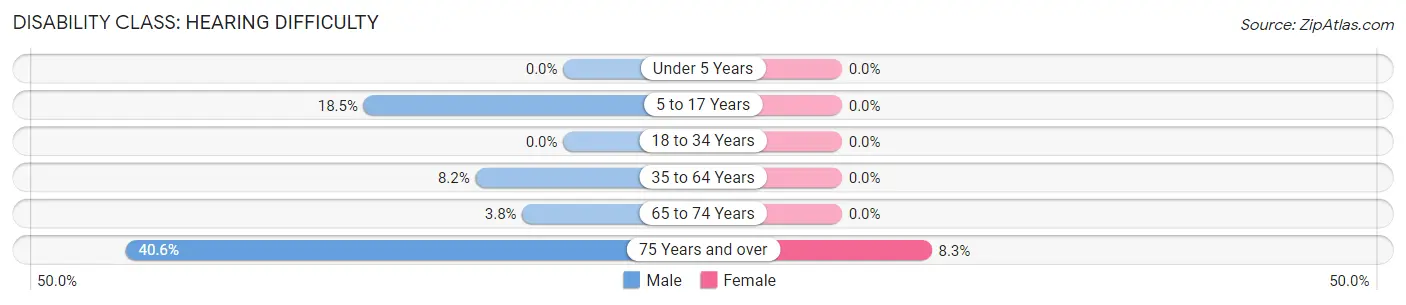
| Age Bracket | Male | Female |
| Under 5 Years | 0 (0.0%) | 0 (0.0%) |
| 5 to 17 Years | 10 (18.5%) | 0 (0.0%) |
| 18 to 34 Years | 0 (0.0%) | 0 (0.0%) |
| 35 to 64 Years | 26 (8.2%) | 0 (0.0%) |
| 65 to 74 Years | 3 (3.8%) | 0 (0.0%) |
| 75 Years and over | 39 (40.6%) | 4 (8.3%) |
Disability Class: Vision Difficulty
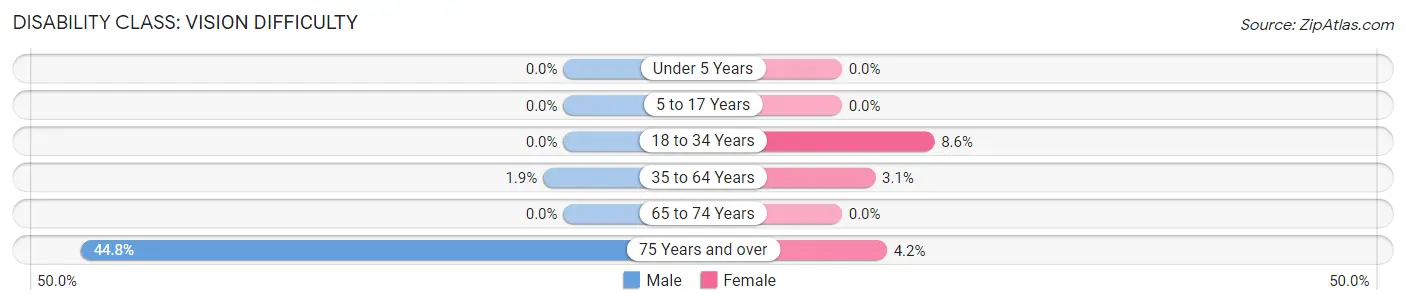
| Age Bracket | Male | Female |
| Under 5 Years | 0 (0.0%) | 0 (0.0%) |
| 5 to 17 Years | 0 (0.0%) | 0 (0.0%) |
| 18 to 34 Years | 0 (0.0%) | 26 (8.6%) |
| 35 to 64 Years | 6 (1.9%) | 8 (3.1%) |
| 65 to 74 Years | 0 (0.0%) | 0 (0.0%) |
| 75 Years and over | 43 (44.8%) | 2 (4.2%) |
Disability Class: Cognitive Difficulty
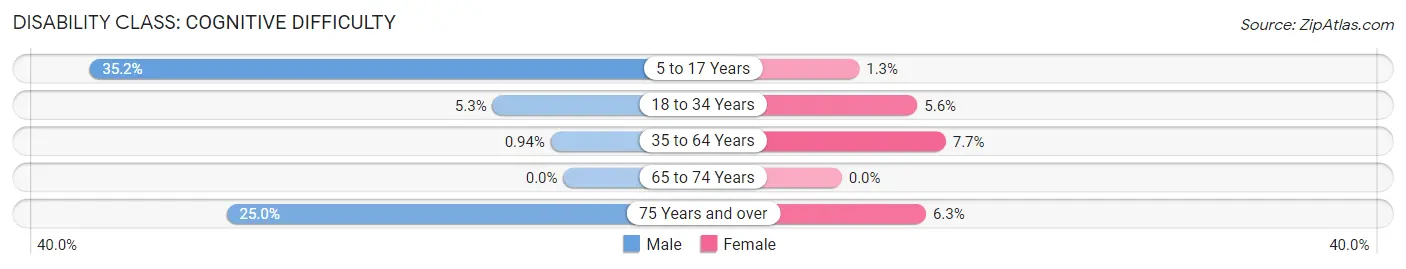
| Age Bracket | Male | Female |
| 5 to 17 Years | 19 (35.2%) | 1 (1.3%) |
| 18 to 34 Years | 10 (5.3%) | 17 (5.6%) |
| 35 to 64 Years | 3 (0.9%) | 20 (7.7%) |
| 65 to 74 Years | 0 (0.0%) | 0 (0.0%) |
| 75 Years and over | 24 (25.0%) | 3 (6.2%) |
Disability Class: Ambulatory Difficulty
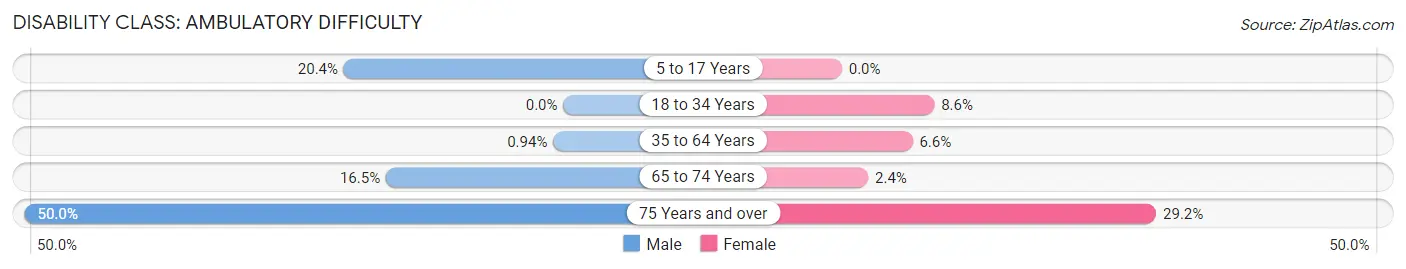
| Age Bracket | Male | Female |
| 5 to 17 Years | 11 (20.4%) | 0 (0.0%) |
| 18 to 34 Years | 0 (0.0%) | 26 (8.6%) |
| 35 to 64 Years | 3 (0.9%) | 17 (6.6%) |
| 65 to 74 Years | 13 (16.5%) | 2 (2.4%) |
| 75 Years and over | 48 (50.0%) | 14 (29.2%) |
Disability Class: Self-Care Difficulty
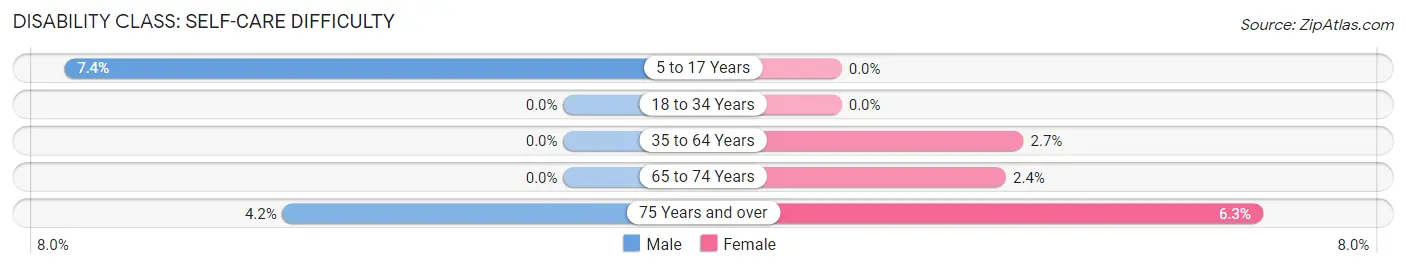
| Age Bracket | Male | Female |
| 5 to 17 Years | 4 (7.4%) | 0 (0.0%) |
| 18 to 34 Years | 0 (0.0%) | 0 (0.0%) |
| 35 to 64 Years | 0 (0.0%) | 7 (2.7%) |
| 65 to 74 Years | 0 (0.0%) | 2 (2.4%) |
| 75 Years and over | 4 (4.2%) | 3 (6.2%) |
Technology Access in Mont Alto borough
Computing Device Access in Mont Alto borough
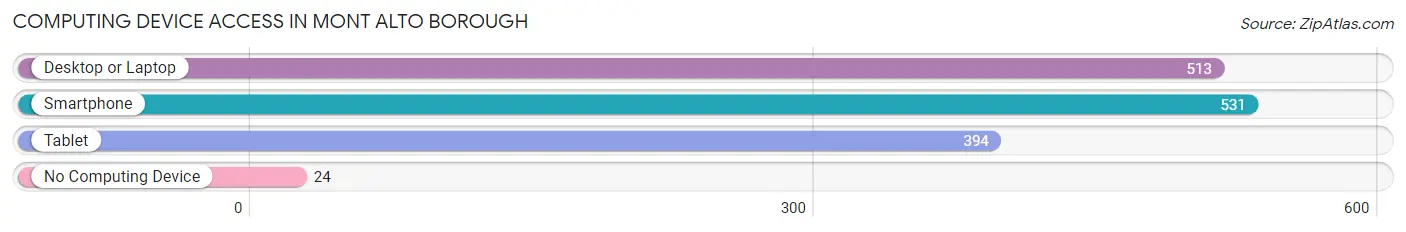
| Device Type | # Households | % Households |
| Desktop or Laptop | 513 | 81.8% |
| Smartphone | 531 | 84.7% |
| Tablet | 394 | 62.8% |
| No Computing Device | 24 | 3.8% |
| Total | 627 | 100.0% |
Internet Access in Mont Alto borough
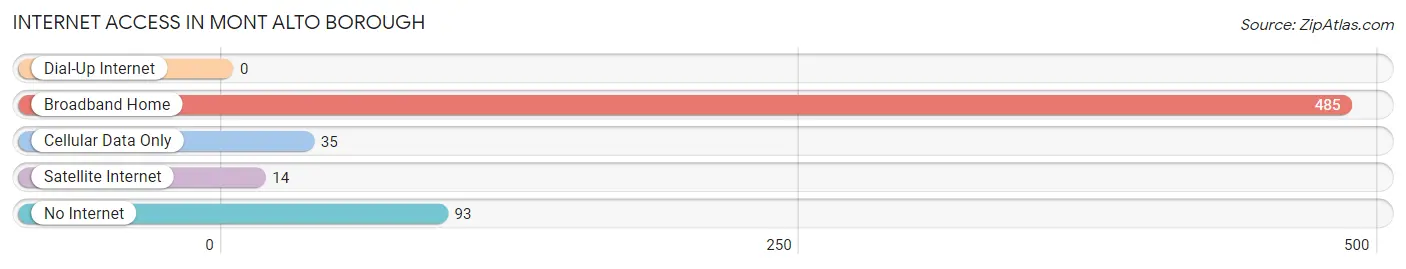
| Internet Type | # Households | % Households |
| Dial-Up Internet | 0 | 0.0% |
| Broadband Home | 485 | 77.3% |
| Cellular Data Only | 35 | 5.6% |
| Satellite Internet | 14 | 2.2% |
| No Internet | 93 | 14.8% |
| Total | 627 | 100.0% |
Mont Alto borough Summary
Introduction
Mont Alto Borough is a small borough located in Franklin County, Pennsylvania. It is situated in the Cumberland Valley, approximately 10 miles south of Chambersburg and 15 miles north of Hagerstown, Maryland. The borough is part of the Chambersburg Metropolitan Statistical Area and is home to approximately 1,400 people. The borough is known for its rich history, beautiful scenery, and vibrant economy.
History
Mont Alto Borough was founded in 1845 by a group of settlers from the nearby town of Waynesboro. The settlers were looking for a place to settle and build a community. The name “Mont Alto” was chosen because of the high elevation of the area. The borough was officially incorporated in 1851.
The borough was originally a farming community, but it soon became a center for industry. In 1872, the Mont Alto Iron Works was established, and it quickly became the largest employer in the area. The iron works produced a variety of products, including stoves, boilers, and other metal products. The iron works closed in the early 1900s, but the borough continued to grow and develop.
In the early 1900s, the borough became a popular tourist destination. The area was known for its beautiful scenery and outdoor activities, such as fishing and hunting. The borough also became a popular destination for summer vacationers.
In the 1950s, the borough began to experience a decline in population. This was due to the decline of the iron works and the rise of suburbanization. However, the borough has experienced a resurgence in recent years, with an influx of new businesses and residents.
Geography
Mont Alto Borough is located in the Cumberland Valley, approximately 10 miles south of Chambersburg and 15 miles north of Hagerstown, Maryland. The borough is situated on a plateau, with an elevation of 1,400 feet. The borough is surrounded by rolling hills and forests, making it a popular destination for outdoor activities.
The borough is located in a humid continental climate zone, with hot summers and cold winters. The average temperature in the summer is around 75 degrees Fahrenheit, and the average temperature in the winter is around 30 degrees Fahrenheit. The borough receives an average of 40 inches of precipitation per year.
Economy
Mont Alto Borough has a vibrant economy, with a variety of businesses and industries. The borough is home to several manufacturing companies, including a plastics manufacturer and a metal fabrication company. The borough is also home to several retail stores, restaurants, and other businesses.
The borough is also home to several educational institutions, including a community college and a technical school. The borough is also home to a variety of healthcare facilities, including a hospital and several medical clinics.
Demographics
As of the 2010 census, the population of Mont Alto Borough was 1,400. The population is predominantly white, with a small percentage of African Americans and Hispanics. The median household income is $41,000, and the median home value is $125,000. The borough has a low unemployment rate of 4.2%.
Conclusion
Mont Alto Borough is a small borough located in Franklin County, Pennsylvania. The borough is known for its rich history, beautiful scenery, and vibrant economy. The borough is home to a variety of businesses and industries, as well as several educational institutions and healthcare facilities. The population of the borough is predominantly white, with a small percentage of African Americans and Hispanics. The median household income is $41,000, and the median home value is $125,000. The borough has a low unemployment rate of 4.2%.
Common Questions
What is Per Capita Income in Mont Alto borough?
Per Capita income in Mont Alto borough is $31,686.
What is the Median Family Income in Mont Alto borough?
Median Family Income in Mont Alto borough is $76,667.
What is the Median Household income in Mont Alto borough?
Median Household Income in Mont Alto borough is $68,438.
What is Income or Wage Gap in Mont Alto borough?
Income or Wage Gap in Mont Alto borough is 31.0%.
Women in Mont Alto borough earn 69.0 cents for every dollar earned by a man.
What is Inequality or Gini Index in Mont Alto borough?
Inequality or Gini Index in Mont Alto borough is 0.31.
What is the Total Population of Mont Alto borough?
Total Population of Mont Alto borough is 1,562.
What is the Total Male Population of Mont Alto borough?
Total Male Population of Mont Alto borough is 765.
What is the Total Female Population of Mont Alto borough?
Total Female Population of Mont Alto borough is 797.
What is the Ratio of Males per 100 Females in Mont Alto borough?
There are 95.98 Males per 100 Females in Mont Alto borough.
What is the Ratio of Females per 100 Males in Mont Alto borough?
There are 104.18 Females per 100 Males in Mont Alto borough.
What is the Median Population Age in Mont Alto borough?
Median Population Age in Mont Alto borough is 40.3 Years.
What is the Average Family Size in Mont Alto borough
Average Family Size in Mont Alto borough is 2.5 People.
What is the Average Household Size in Mont Alto borough
Average Household Size in Mont Alto borough is 2.3 People.
How Large is the Labor Force in Mont Alto borough?
There are 979 People in the Labor Forcein in Mont Alto borough.
What is the Percentage of People in the Labor Force in Mont Alto borough?
70.3% of People are in the Labor Force in Mont Alto borough.
What is the Unemployment Rate in Mont Alto borough?
Unemployment Rate in Mont Alto borough is 4.4%.