Hilldale, PA Map & Demographics
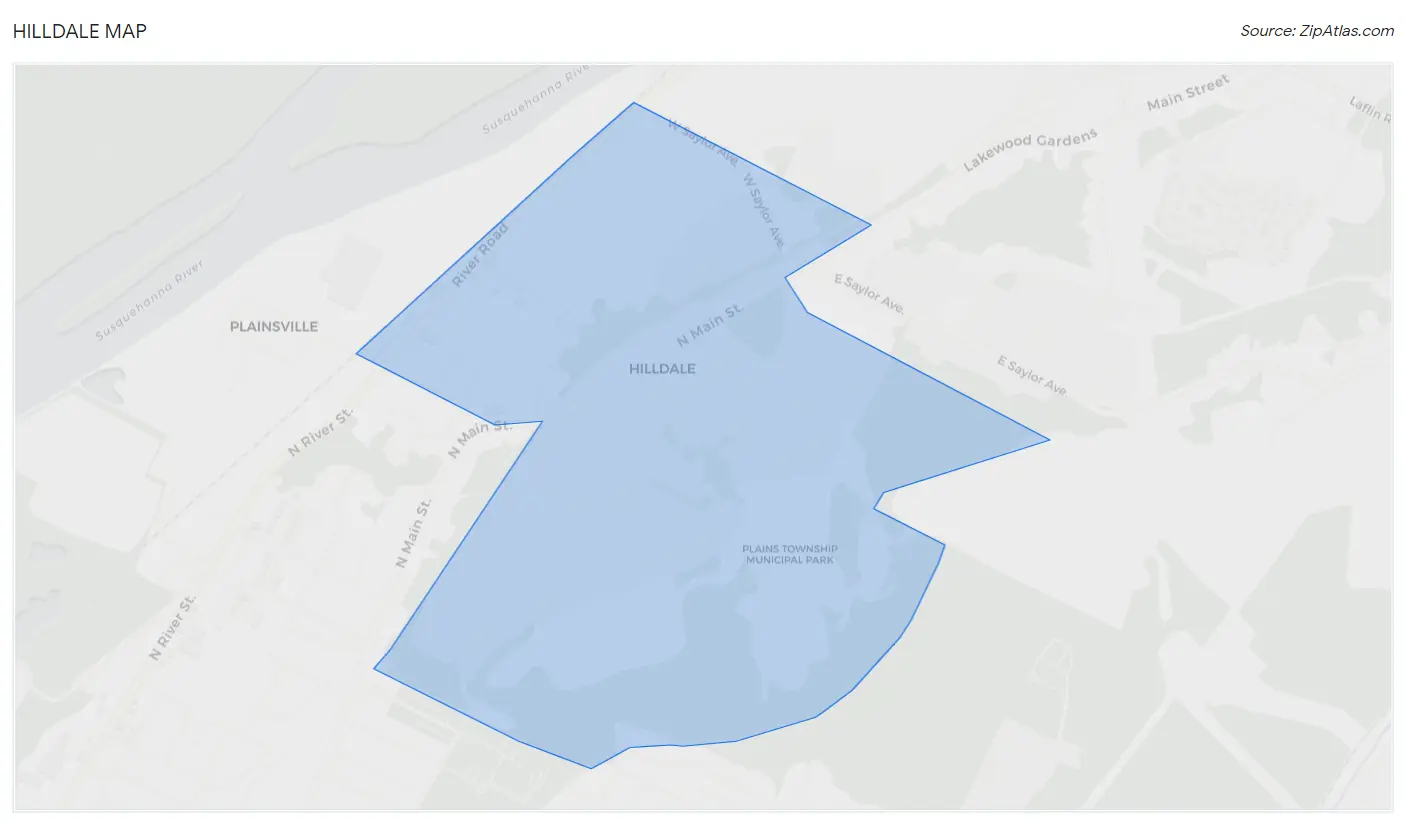
Hilldale Map
Hilldale Overview
$40,277
PER CAPITA INCOME
$105,865
AVG FAMILY INCOME
$76,875
AVG HOUSEHOLD INCOME
0.35
INEQUALITY / GINI INDEX
852
TOTAL POPULATION
348
MALE POPULATION
504
FEMALE POPULATION
69.05
MALES / 100 FEMALES
144.83
FEMALES / 100 MALES
55.4
MEDIAN AGE
2.5
AVG FAMILY SIZE
1.9
AVG HOUSEHOLD SIZE
504
LABOR FORCE [ PEOPLE ]
61.8%
PERCENT IN LABOR FORCE
11.3%
UNEMPLOYMENT RATE
Hilldale Area Codes
Income in Hilldale
Income Overview in Hilldale
Per Capita Income in Hilldale is $40,277, while median incomes of families and households are $105,865 and $76,875 respectively.
| Characteristic | Number | Measure |
| Per Capita Income | 852 | $40,277 |
| Median Family Income | 207 | $105,865 |
| Mean Family Income | 207 | $112,205 |
| Median Household Income | 441 | $76,875 |
| Mean Household Income | 441 | $77,519 |
| Income Deficit | 207 | $0 |
| Wage / Income Gap (%) | 852 | 0.00% |
| Wage / Income Gap ($) | 852 | 100.00¢ per $1 |
| Gini / Inequality Index | 852 | 0.35 |
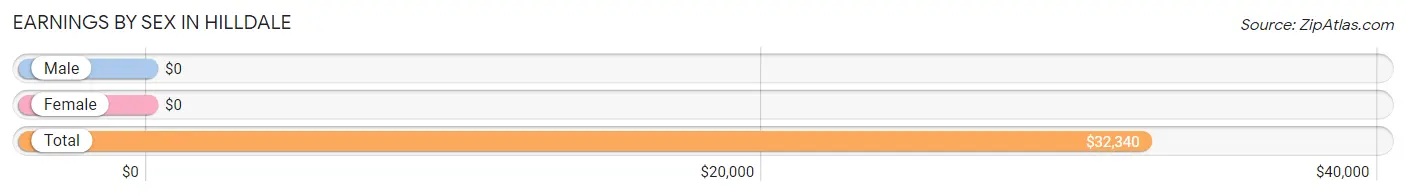
Earnings by Sex in Hilldale
| Sex | Number | Average Earnings |
| Male | 248 (47.5%) | $0 |
| Female | 274 (52.5%) | $0 |
| Total | 522 (100.0%) | $32,340 |
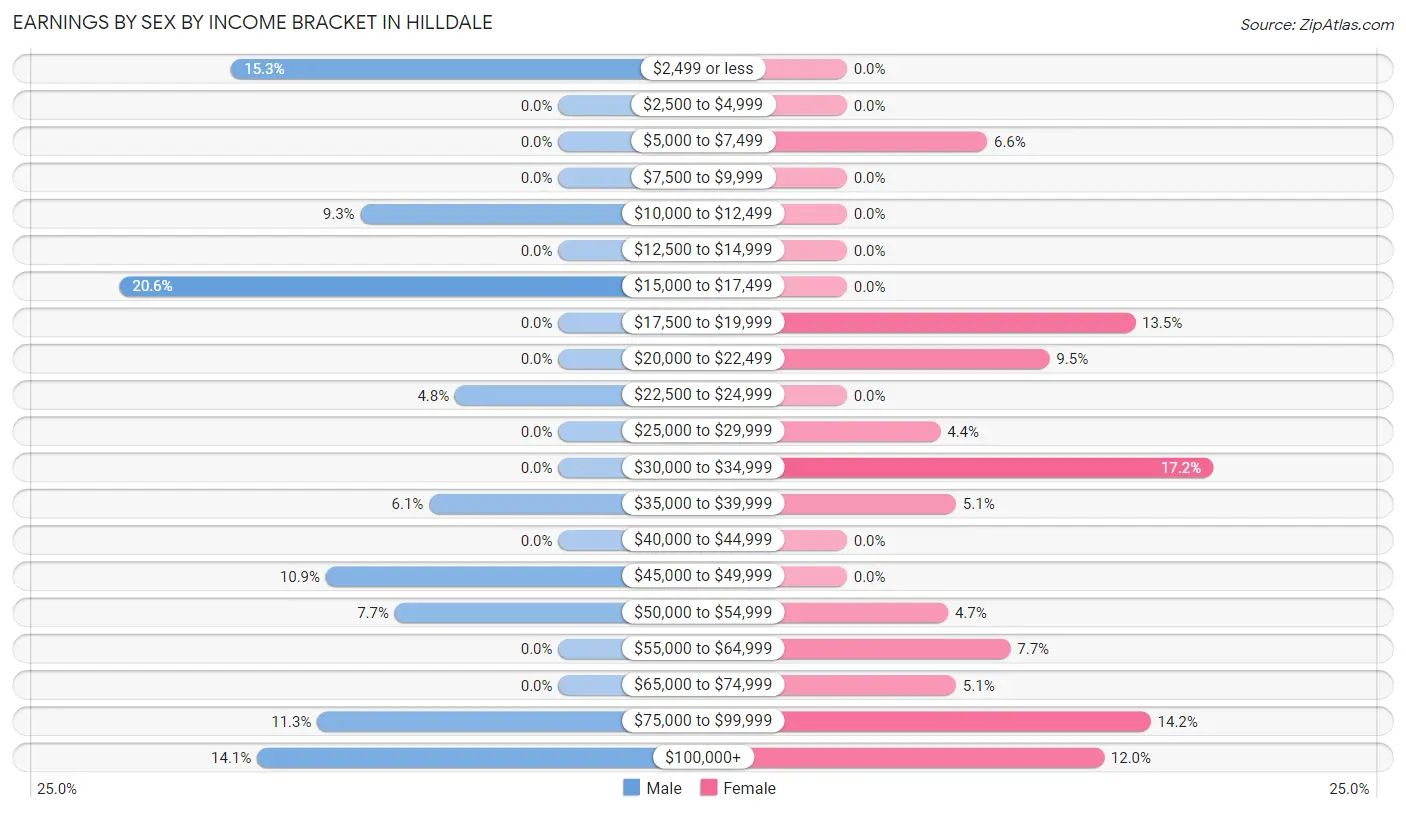
Earnings by Sex by Income Bracket in Hilldale
The most common earnings brackets in Hilldale are $15,000 to $17,499 for men (51 | 20.6%) and $30,000 to $34,999 for women (47 | 17.2%).
| Income | Male | Female |
| $2,499 or less | 38 (15.3%) | 0 (0.0%) |
| $2,500 to $4,999 | 0 (0.0%) | 0 (0.0%) |
| $5,000 to $7,499 | 0 (0.0%) | 18 (6.6%) |
| $7,500 to $9,999 | 0 (0.0%) | 0 (0.0%) |
| $10,000 to $12,499 | 23 (9.3%) | 0 (0.0%) |
| $12,500 to $14,999 | 0 (0.0%) | 0 (0.0%) |
| $15,000 to $17,499 | 51 (20.6%) | 0 (0.0%) |
| $17,500 to $19,999 | 0 (0.0%) | 37 (13.5%) |
| $20,000 to $22,499 | 0 (0.0%) | 26 (9.5%) |
| $22,500 to $24,999 | 12 (4.8%) | 0 (0.0%) |
| $25,000 to $29,999 | 0 (0.0%) | 12 (4.4%) |
| $30,000 to $34,999 | 0 (0.0%) | 47 (17.2%) |
| $35,000 to $39,999 | 15 (6.0%) | 14 (5.1%) |
| $40,000 to $44,999 | 0 (0.0%) | 0 (0.0%) |
| $45,000 to $49,999 | 27 (10.9%) | 0 (0.0%) |
| $50,000 to $54,999 | 19 (7.7%) | 13 (4.7%) |
| $55,000 to $64,999 | 0 (0.0%) | 21 (7.7%) |
| $65,000 to $74,999 | 0 (0.0%) | 14 (5.1%) |
| $75,000 to $99,999 | 28 (11.3%) | 39 (14.2%) |
| $100,000+ | 35 (14.1%) | 33 (12.0%) |
| Total | 248 (100.0%) | 274 (100.0%) |
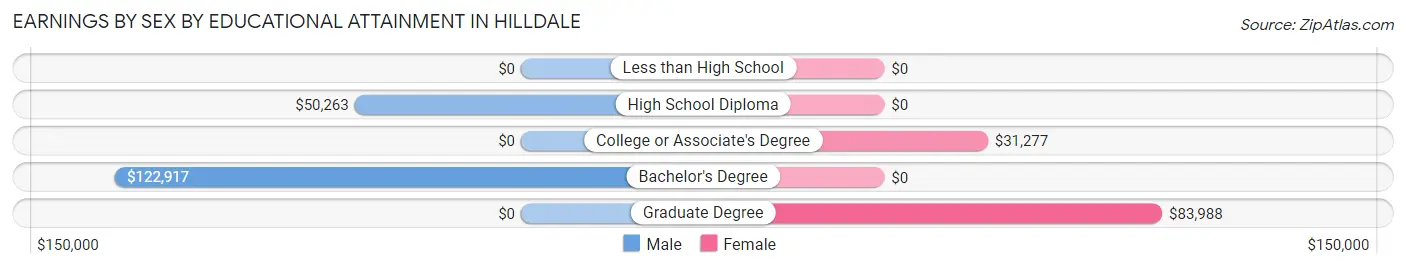
Earnings by Sex by Educational Attainment in Hilldale
| Educational Attainment | Male Income | Female Income |
| Less than High School | - | - |
| High School Diploma | $50,263 | $0 |
| College or Associate's Degree | - | - |
| Bachelor's Degree | $122,917 | $0 |
| Graduate Degree | - | - |
| Total | $49,554 | $0 |
Family Income in Hilldale
Family Income Brackets in Hilldale
According to the Hilldale family income data, there are 87 families falling into the $100,000 to $149,999 income range, which is the most common income bracket and makes up 42.0% of all families.
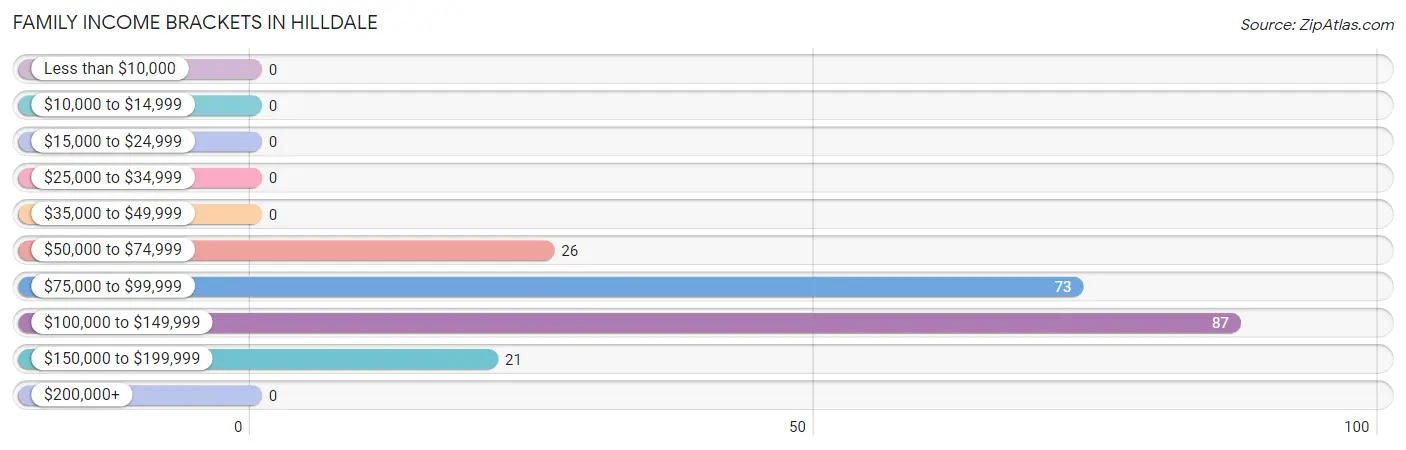
| Income Bracket | # Families | % Families |
| Less than $10,000 | 0 | 0.0% |
| $10,000 to $14,999 | 0 | 0.0% |
| $15,000 to $24,999 | 0 | 0.0% |
| $25,000 to $34,999 | 0 | 0.0% |
| $35,000 to $49,999 | 0 | 0.0% |
| $50,000 to $74,999 | 26 | 12.6% |
| $75,000 to $99,999 | 73 | 35.3% |
| $100,000 to $149,999 | 87 | 42.0% |
| $150,000 to $199,999 | 21 | 10.1% |
| $200,000+ | 0 | 0.0% |
Family Income by Famaliy Size in Hilldale
2-person families (147 | 71.0%) account for the highest median family income in Hilldale with $117,596 per family, while 2-person families (147 | 71.0%) have the highest median income of $58,798 per family member.
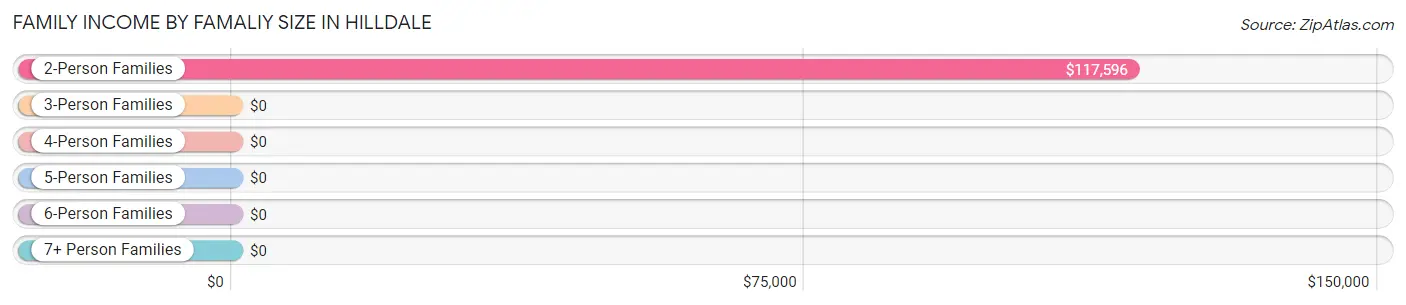
| Income Bracket | # Families | Median Income |
| 2-Person Families | 147 (71.0%) | $117,596 |
| 3-Person Families | 21 (10.1%) | $0 |
| 4-Person Families | 39 (18.8%) | $0 |
| 5-Person Families | 0 (0.0%) | $0 |
| 6-Person Families | 0 (0.0%) | $0 |
| 7+ Person Families | 0 (0.0%) | $0 |
| Total | 207 (100.0%) | $105,865 |
Family Income by Number of Earners in Hilldale
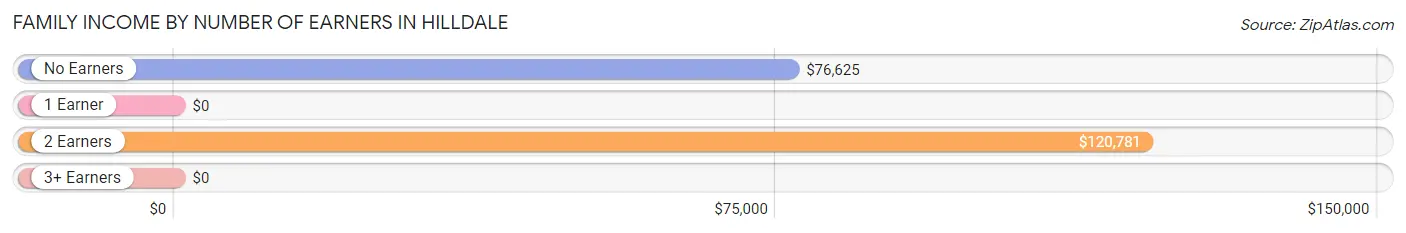
| Number of Earners | # Families | Median Income |
| No Earners | 29 (14.0%) | $76,625 |
| 1 Earner | 59 (28.5%) | $0 |
| 2 Earners | 98 (47.3%) | $120,781 |
| 3+ Earners | 21 (10.1%) | $0 |
| Total | 207 (100.0%) | $105,865 |
Household Income in Hilldale
Household Income Brackets in Hilldale
With 106 households falling in the category, the $75,000 to $99,999 income range is the most frequent in Hilldale, accounting for 24.0% of all households.
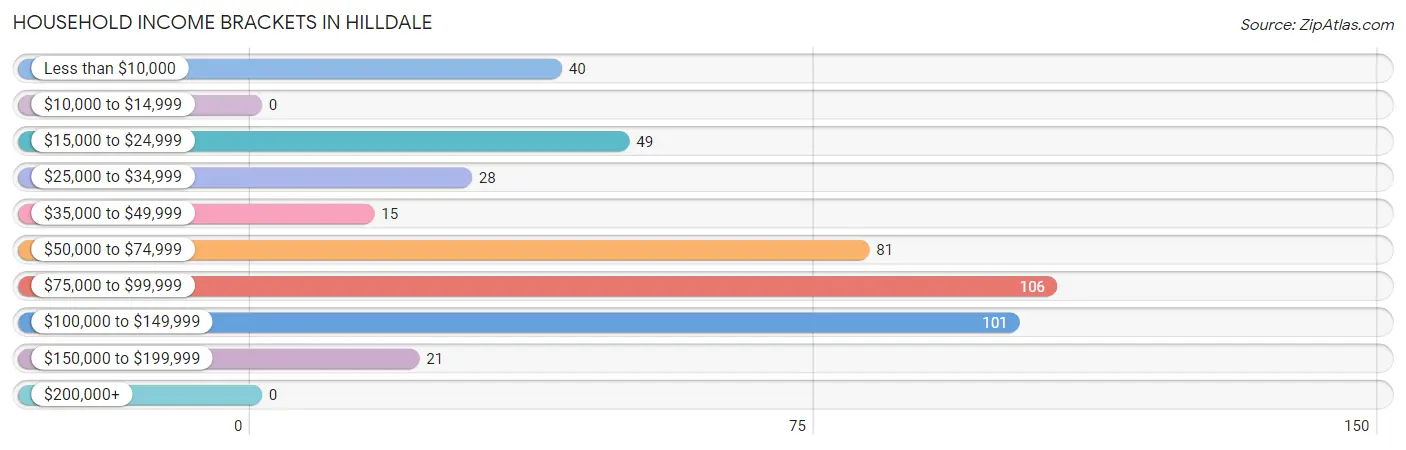
| Income Bracket | # Households | % Households |
| Less than $10,000 | 40 | 9.1% |
| $10,000 to $14,999 | 0 | 0.0% |
| $15,000 to $24,999 | 49 | 11.1% |
| $25,000 to $34,999 | 28 | 6.3% |
| $35,000 to $49,999 | 15 | 3.4% |
| $50,000 to $74,999 | 81 | 18.4% |
| $75,000 to $99,999 | 106 | 24.0% |
| $100,000 to $149,999 | 101 | 22.9% |
| $150,000 to $199,999 | 21 | 4.8% |
| $200,000+ | 0 | 0.0% |
Household Income by Householder Age in Hilldale
The median household income in Hilldale is $76,875, with the highest median household income of $84,167 found in the 45 to 64 years age bracket for the primary householder. A total of 280 households (63.5%) fall into this category.
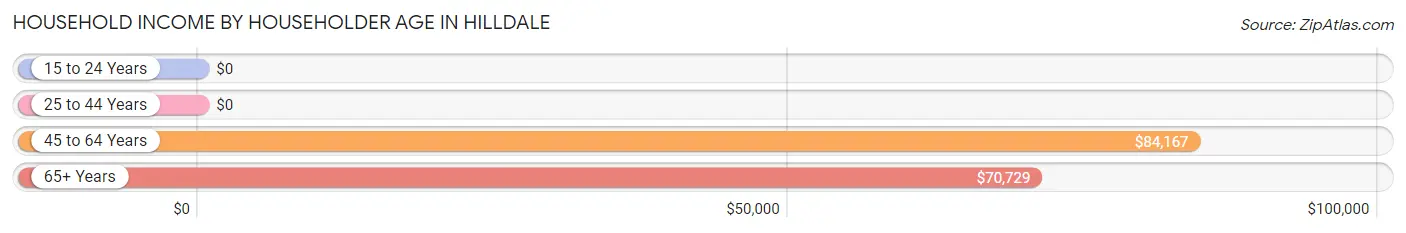
| Income Bracket | # Households | Median Income |
| 15 to 24 Years | 0 (0.0%) | $0 |
| 25 to 44 Years | 18 (4.1%) | $0 |
| 45 to 64 Years | 280 (63.5%) | $84,167 |
| 65+ Years | 143 (32.4%) | $70,729 |
| Total | 441 (100.0%) | $76,875 |
Poverty in Hilldale
Income Below Poverty by Sex and Age in Hilldale
With 11.5% poverty level for males and 6.6% for females among the residents of Hilldale, 55 to 64 year old males and 45 to 54 year old females are the most vulnerable to poverty, with 40 males (41.7%) and 33 females (32.7%) in their respective age groups living below the poverty level.
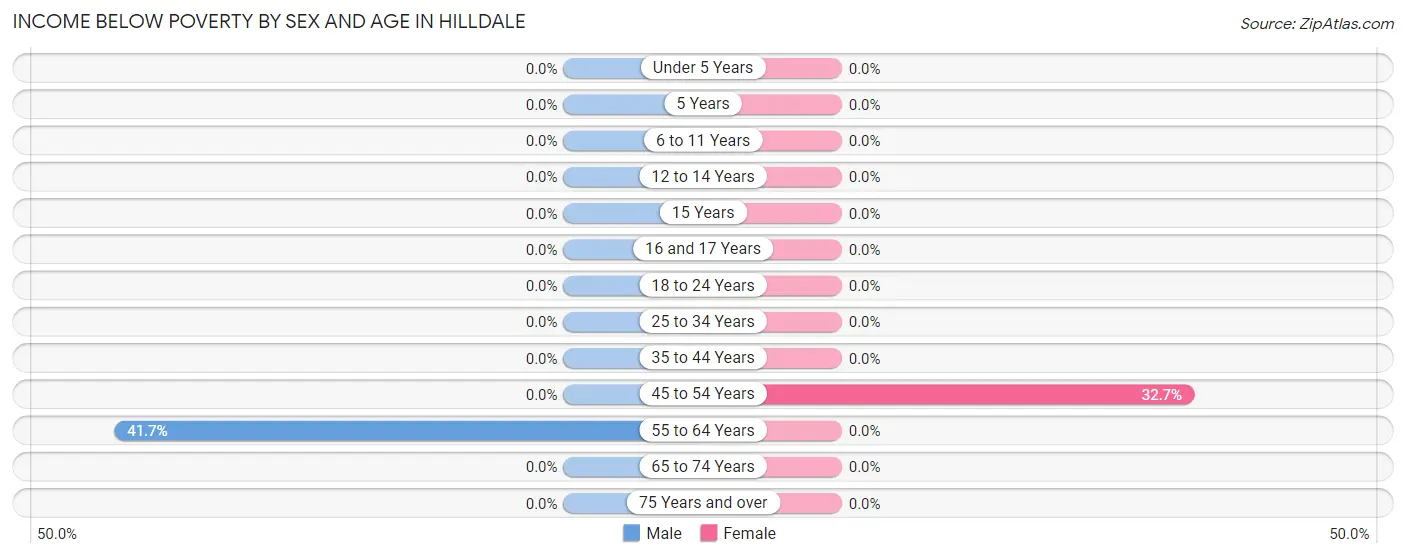
| Age Bracket | Male | Female |
| Under 5 Years | 0 (0.0%) | 0 (0.0%) |
| 5 Years | 0 (0.0%) | 0 (0.0%) |
| 6 to 11 Years | 0 (0.0%) | 0 (0.0%) |
| 12 to 14 Years | 0 (0.0%) | 0 (0.0%) |
| 15 Years | 0 (0.0%) | 0 (0.0%) |
| 16 and 17 Years | 0 (0.0%) | 0 (0.0%) |
| 18 to 24 Years | 0 (0.0%) | 0 (0.0%) |
| 25 to 34 Years | 0 (0.0%) | 0 (0.0%) |
| 35 to 44 Years | 0 (0.0%) | 0 (0.0%) |
| 45 to 54 Years | 0 (0.0%) | 33 (32.7%) |
| 55 to 64 Years | 40 (41.7%) | 0 (0.0%) |
| 65 to 74 Years | 0 (0.0%) | 0 (0.0%) |
| 75 Years and over | 0 (0.0%) | 0 (0.0%) |
| Total | 40 (11.5%) | 33 (6.6%) |
Income Above Poverty by Sex and Age in Hilldale
According to the poverty statistics in Hilldale, males aged under 5 years and females aged under 5 years are the age groups that are most secure financially, with 100.0% of males and 100.0% of females in these age groups living above the poverty line.
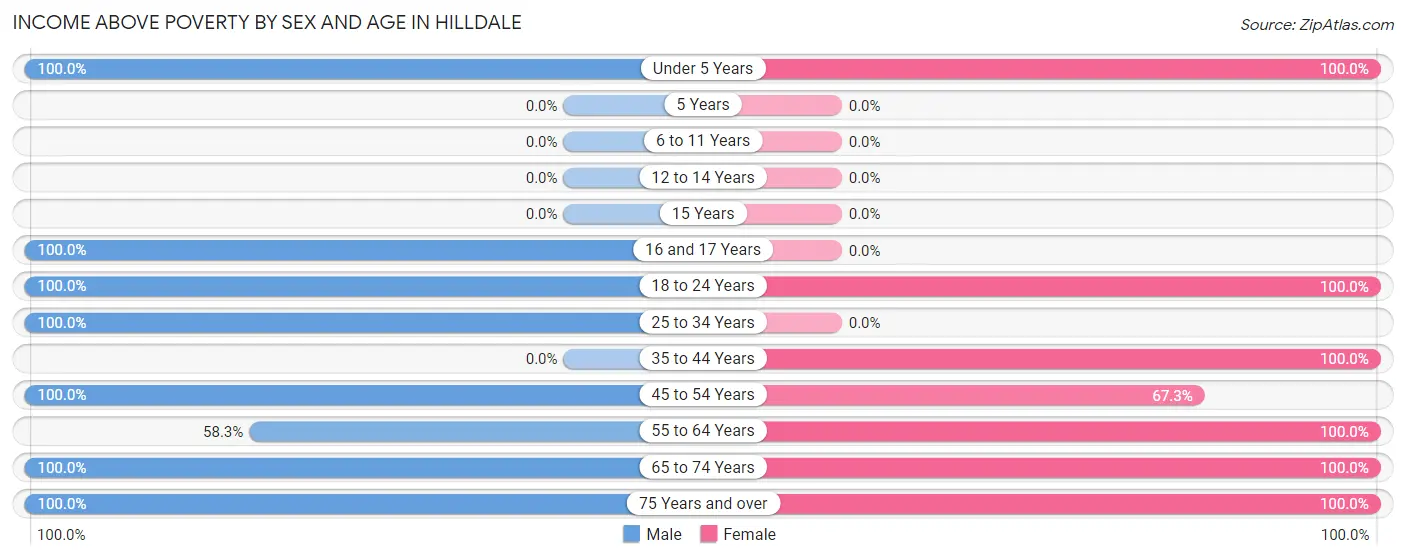
| Age Bracket | Male | Female |
| Under 5 Years | 17 (100.0%) | 20 (100.0%) |
| 5 Years | 0 (0.0%) | 0 (0.0%) |
| 6 to 11 Years | 0 (0.0%) | 0 (0.0%) |
| 12 to 14 Years | 0 (0.0%) | 0 (0.0%) |
| 15 Years | 0 (0.0%) | 0 (0.0%) |
| 16 and 17 Years | 22 (100.0%) | 0 (0.0%) |
| 18 to 24 Years | 57 (100.0%) | 69 (100.0%) |
| 25 to 34 Years | 36 (100.0%) | 0 (0.0%) |
| 35 to 44 Years | 0 (0.0%) | 36 (100.0%) |
| 45 to 54 Years | 46 (100.0%) | 68 (67.3%) |
| 55 to 64 Years | 56 (58.3%) | 117 (100.0%) |
| 65 to 74 Years | 64 (100.0%) | 87 (100.0%) |
| 75 Years and over | 10 (100.0%) | 74 (100.0%) |
| Total | 308 (88.5%) | 471 (93.4%) |
Income Below Poverty Among Married-Couple Families in Hilldale
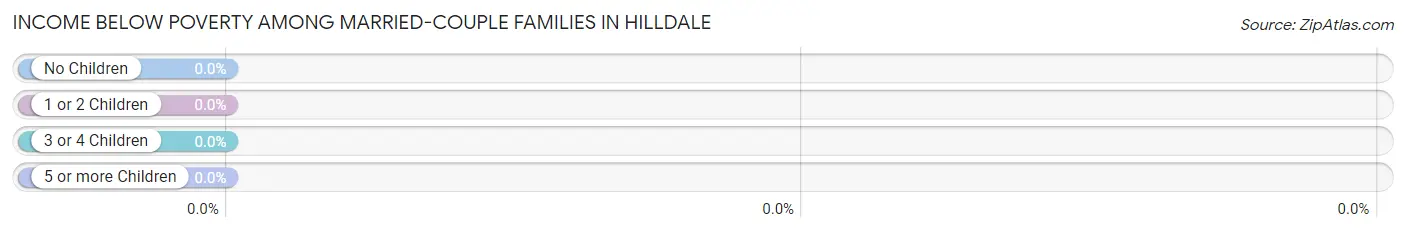
| Children | Above Poverty | Below Poverty |
| No Children | 119 (100.0%) | 0 (0.0%) |
| 1 or 2 Children | 18 (100.0%) | 0 (0.0%) |
| 3 or 4 Children | 0 (0.0%) | 0 (0.0%) |
| 5 or more Children | 0 (0.0%) | 0 (0.0%) |
| Total | 137 (100.0%) | 0 (0.0%) |
Income Below Poverty Among Single-Parent Households in Hilldale
| Children | Single Father | Single Mother |
| No Children | 0 (0.0%) | 0 (0.0%) |
| 1 or 2 Children | 0 (0.0%) | 0 (0.0%) |
| 3 or 4 Children | 0 (0.0%) | 0 (0.0%) |
| 5 or more Children | 0 (0.0%) | 0 (0.0%) |
| Total | 0 (0.0%) | 0 (0.0%) |
Income Below Poverty Among Married-Couple vs Single-Parent Households in Hilldale
| Children | Married-Couple Families | Single-Parent Households |
| No Children | 0 (0.0%) | 0 (0.0%) |
| 1 or 2 Children | 0 (0.0%) | 0 (0.0%) |
| 3 or 4 Children | 0 (0.0%) | 0 (0.0%) |
| 5 or more Children | 0 (0.0%) | 0 (0.0%) |
| Total | 0 (0.0%) | 0 (0.0%) |
Race in Hilldale
The most populous races in Hilldale are White / Caucasian (852 | 100.0%), and Hispanic or Latino (26 | 3.0%).
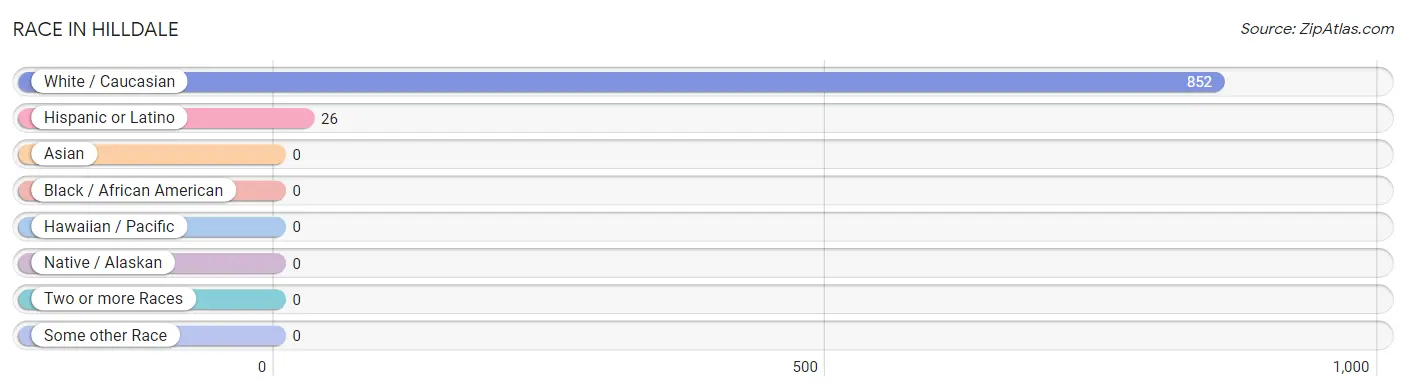
| Race | # Population | % Population |
| Asian | 0 | 0.0% |
| Black / African American | 0 | 0.0% |
| Hawaiian / Pacific | 0 | 0.0% |
| Hispanic or Latino | 26 | 3.0% |
| Native / Alaskan | 0 | 0.0% |
| White / Caucasian | 852 | 100.0% |
| Two or more Races | 0 | 0.0% |
| Some other Race | 0 | 0.0% |
| Total | 852 | 100.0% |
Ancestry in Hilldale
The most populous ancestries reported in Hilldale are Italian (331 | 38.9%), Polish (198 | 23.2%), German (153 | 18.0%), Irish (148 | 17.4%), and English (67 | 7.9%), together accounting for 105.3% of all Hilldale residents.
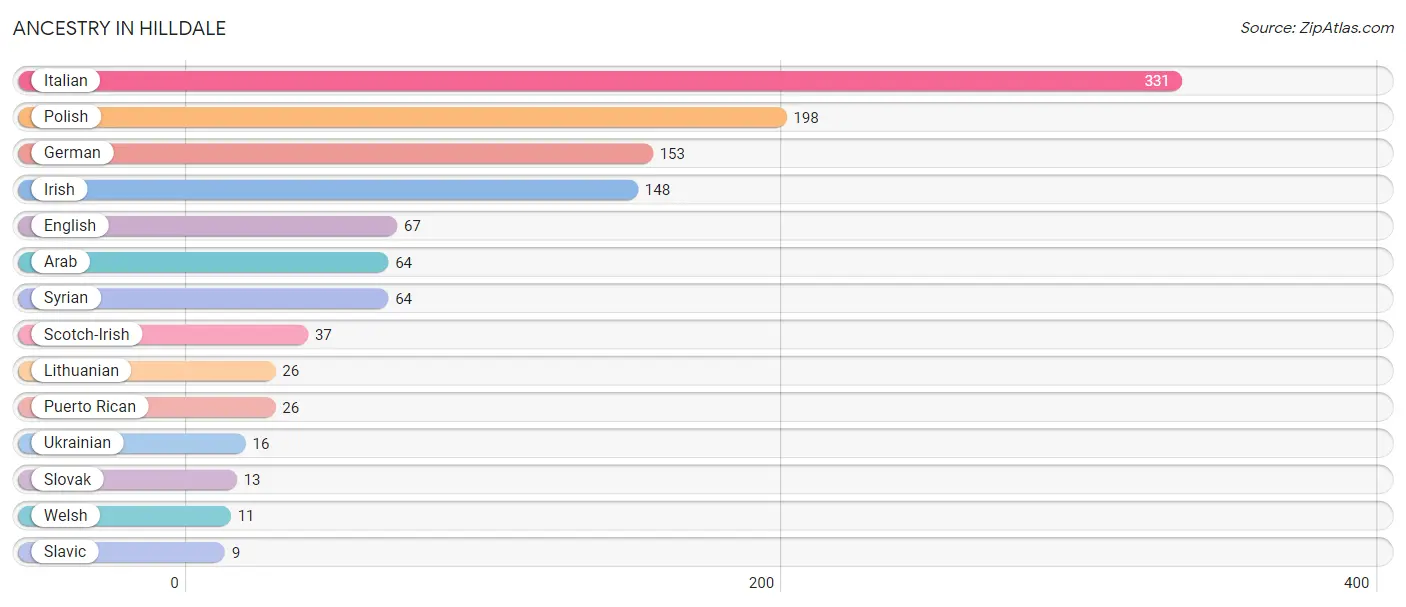
| Ancestry | # Population | % Population |
| Arab | 64 | 7.5% |
| English | 67 | 7.9% |
| German | 153 | 18.0% |
| Irish | 148 | 17.4% |
| Italian | 331 | 38.9% |
| Lithuanian | 26 | 3.0% |
| Polish | 198 | 23.2% |
| Puerto Rican | 26 | 3.0% |
| Scotch-Irish | 37 | 4.3% |
| Slavic | 9 | 1.1% |
| Slovak | 13 | 1.5% |
| Syrian | 64 | 7.5% |
| Ukrainian | 16 | 1.9% |
| Welsh | 11 | 1.3% | View All 14 Rows |
Immigrants in Hilldale

| Immigration Origin | # Population | % Population | View All 0 Rows |
Sex and Age in Hilldale
Sex and Age in Hilldale
The most populous age groups in Hilldale are 20 to 24 Years (57 | 16.4%) for men and 50 to 54 Years (101 | 20.0%) for women.
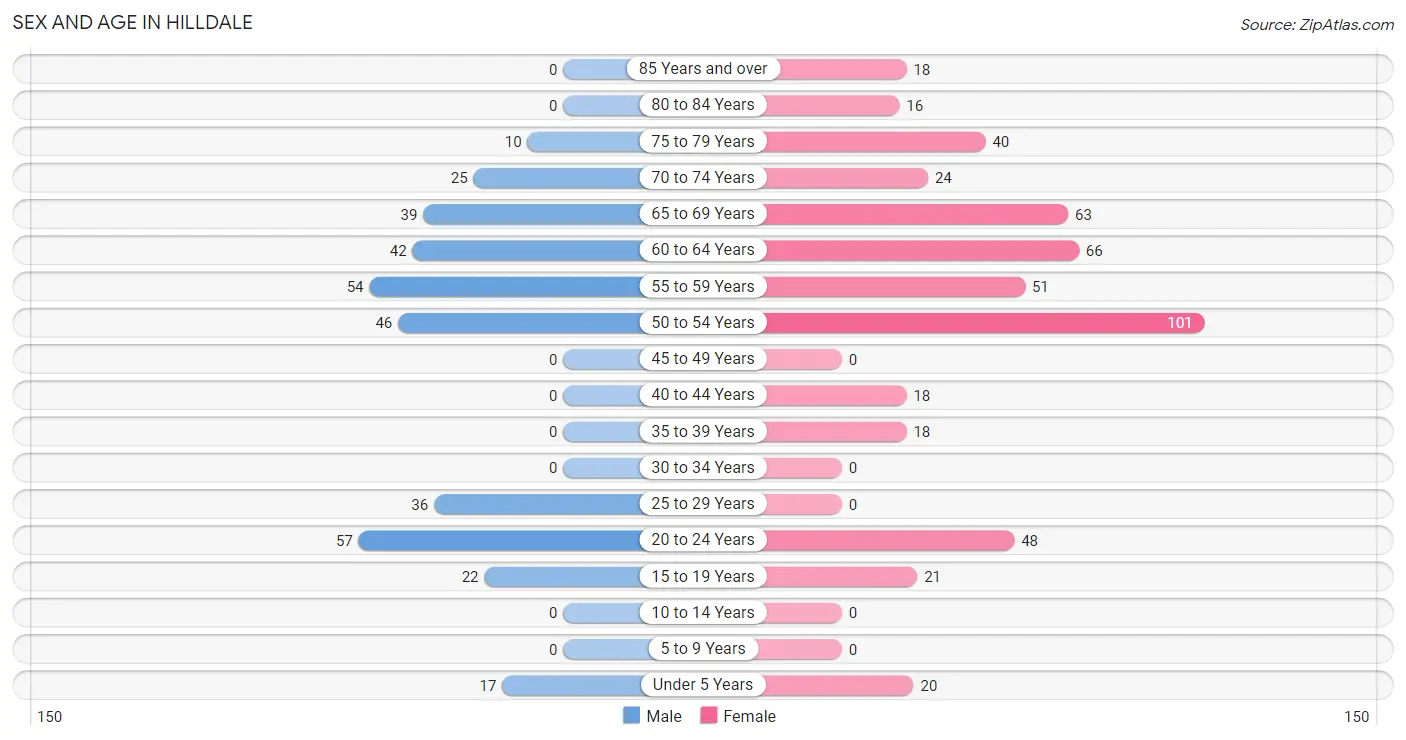
| Age Bracket | Male | Female |
| Under 5 Years | 17 (4.9%) | 20 (4.0%) |
| 5 to 9 Years | 0 (0.0%) | 0 (0.0%) |
| 10 to 14 Years | 0 (0.0%) | 0 (0.0%) |
| 15 to 19 Years | 22 (6.3%) | 21 (4.2%) |
| 20 to 24 Years | 57 (16.4%) | 48 (9.5%) |
| 25 to 29 Years | 36 (10.3%) | 0 (0.0%) |
| 30 to 34 Years | 0 (0.0%) | 0 (0.0%) |
| 35 to 39 Years | 0 (0.0%) | 18 (3.6%) |
| 40 to 44 Years | 0 (0.0%) | 18 (3.6%) |
| 45 to 49 Years | 0 (0.0%) | 0 (0.0%) |
| 50 to 54 Years | 46 (13.2%) | 101 (20.0%) |
| 55 to 59 Years | 54 (15.5%) | 51 (10.1%) |
| 60 to 64 Years | 42 (12.1%) | 66 (13.1%) |
| 65 to 69 Years | 39 (11.2%) | 63 (12.5%) |
| 70 to 74 Years | 25 (7.2%) | 24 (4.8%) |
| 75 to 79 Years | 10 (2.9%) | 40 (7.9%) |
| 80 to 84 Years | 0 (0.0%) | 16 (3.2%) |
| 85 Years and over | 0 (0.0%) | 18 (3.6%) |
| Total | 348 (100.0%) | 504 (100.0%) |
Families and Households in Hilldale
Median Family Size in Hilldale
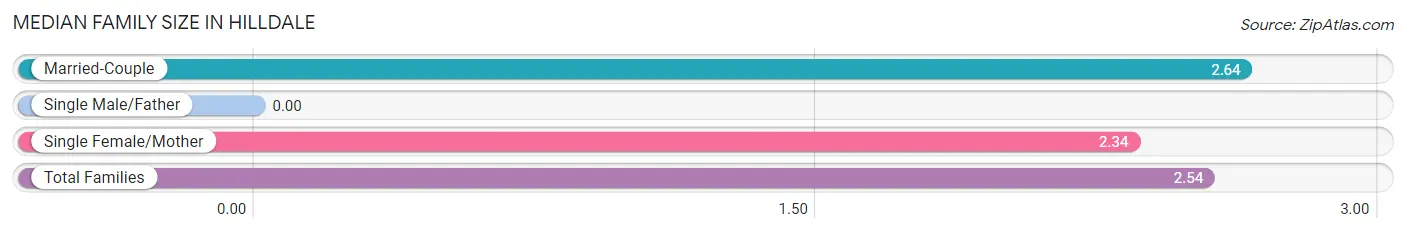
| Family Type | # Families | Family Size |
| Married-Couple | 137 (66.2%) | 2.64 |
| Single Male/Father | 0 (0.0%) | - |
| Single Female/Mother | 70 (33.8%) | 2.34 |
| Total Families | 207 (100.0%) | 2.54 |
Median Household Size in Hilldale
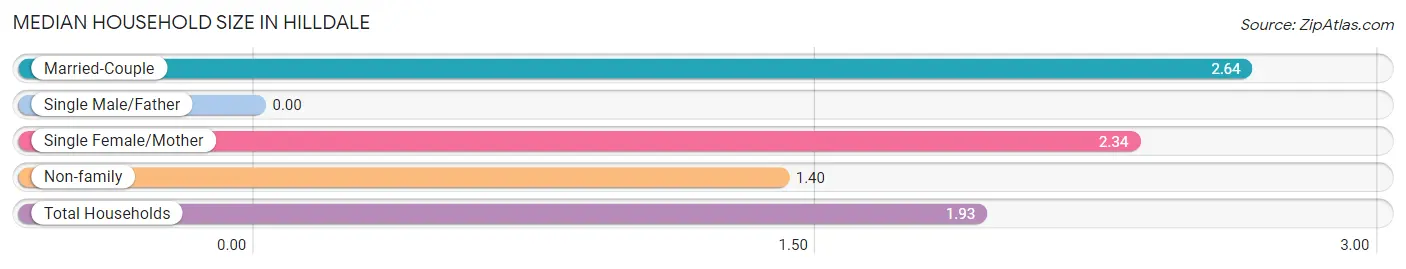
| Household Type | # Households | Household Size |
| Married-Couple | 137 (31.1%) | 2.64 |
| Single Male/Father | 0 (0.0%) | - |
| Single Female/Mother | 70 (15.9%) | 2.34 |
| Non-family | 234 (53.1%) | 1.40 |
| Total Households | 441 (100.0%) | 1.93 |
Household Size by Marriage Status in Hilldale
Out of a total of 441 households in Hilldale, 207 (46.9%) are family households, while 234 (53.1%) are nonfamily households. The most numerous type of family households are 2-person households, comprising 147, and the most common type of nonfamily households are 1-person households, comprising 201.
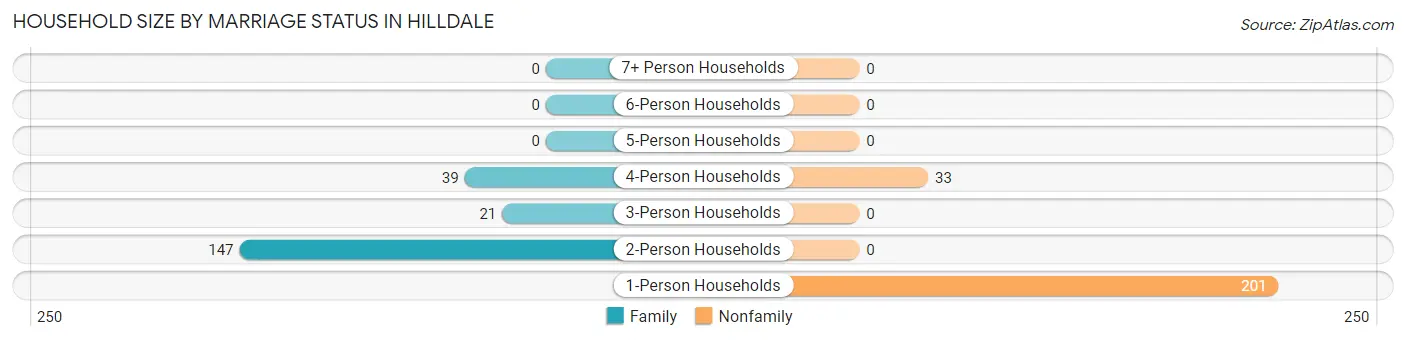
| Household Size | Family Households | Nonfamily Households |
| 1-Person Households | - | 201 (45.6%) |
| 2-Person Households | 147 (33.3%) | 0 (0.0%) |
| 3-Person Households | 21 (4.8%) | 0 (0.0%) |
| 4-Person Households | 39 (8.8%) | 33 (7.5%) |
| 5-Person Households | 0 (0.0%) | 0 (0.0%) |
| 6-Person Households | 0 (0.0%) | 0 (0.0%) |
| 7+ Person Households | 0 (0.0%) | 0 (0.0%) |
| Total | 207 (46.9%) | 234 (53.1%) |
Female Fertility in Hilldale
Fertility by Age in Hilldale
| Age Bracket | Women with Births | Births / 1,000 Women |
| 15 to 19 years | 0 (0.0%) | 0.0 |
| 20 to 34 years | 0 (0.0%) | 0.0 |
| 35 to 50 years | 0 (0.0%) | 0.0 |
| Total | 0 (0.0%) | 0.0 |
Fertility by Age by Marriage Status in Hilldale
| Age Bracket | Married | Unmarried |
| 15 to 19 years | 0 (0.0%) | 0 (0.0%) |
| 20 to 34 years | 0 (0.0%) | 0 (0.0%) |
| 35 to 50 years | 0 (0.0%) | 0 (0.0%) |
| Total | 0 (0.0%) | 0 (0.0%) |
Fertility by Education in Hilldale
| Educational Attainment | Women with Births | Births / 1,000 Women |
| Less than High School | 0 (0.0%) | 0.0 |
| High School Diploma | 0 (0.0%) | 0.0 |
| College or Associate's Degree | 0 (0.0%) | 0.0 |
| Bachelor's Degree | 0 (0.0%) | 0.0 |
| Graduate Degree | 0 (0.0%) | 0.0 |
| Total | 0 (0.0%) | 0.0 |
Fertility by Education by Marriage Status in Hilldale
| Educational Attainment | Married | Unmarried |
| Less than High School | 0 (0.0%) | 0 (0.0%) |
| High School Diploma | 0 (0.0%) | 0 (0.0%) |
| College or Associate's Degree | 0 (0.0%) | 0 (0.0%) |
| Bachelor's Degree | 0 (0.0%) | 0 (0.0%) |
| Graduate Degree | 0 (0.0%) | 0 (0.0%) |
| Total | 0 (0.0%) | 0 (0.0%) |
Employment Characteristics in Hilldale
Employment by Class of Employer in Hilldale
Among the 447 employed individuals in Hilldale, private company employees (332 | 74.3%), self-employed (incorporated) (42 | 9.4%), and state government employees (32 | 7.2%) make up the most common classes of employment.
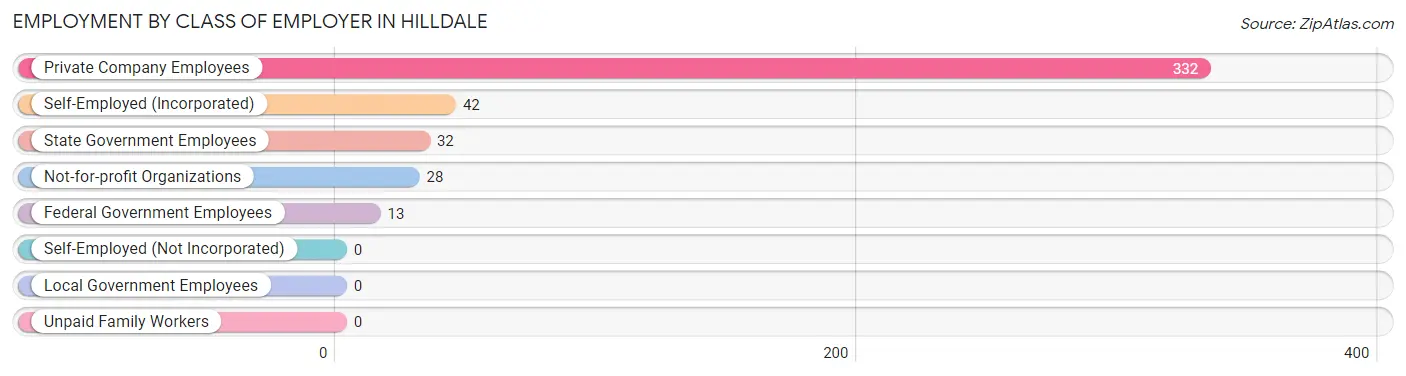
| Employer Class | # Employees | % Employees |
| Private Company Employees | 332 | 74.3% |
| Self-Employed (Incorporated) | 42 | 9.4% |
| Self-Employed (Not Incorporated) | 0 | 0.0% |
| Not-for-profit Organizations | 28 | 6.3% |
| Local Government Employees | 0 | 0.0% |
| State Government Employees | 32 | 7.2% |
| Federal Government Employees | 13 | 2.9% |
| Unpaid Family Workers | 0 | 0.0% |
| Total | 447 | 100.0% |
Employment Status by Age in Hilldale
According to the labor force statistics for Hilldale, out of the total population over 16 years of age (815), 61.8% or 504 individuals are in the labor force, with 11.3% or 57 of them unemployed. The age group with the highest labor force participation rate is 25 to 29 years, with 100.0% or 36 individuals in the labor force. Within the labor force, the 20 to 24 years age range has the highest percentage of unemployed individuals, with 68.7% or 57 of them being unemployed.
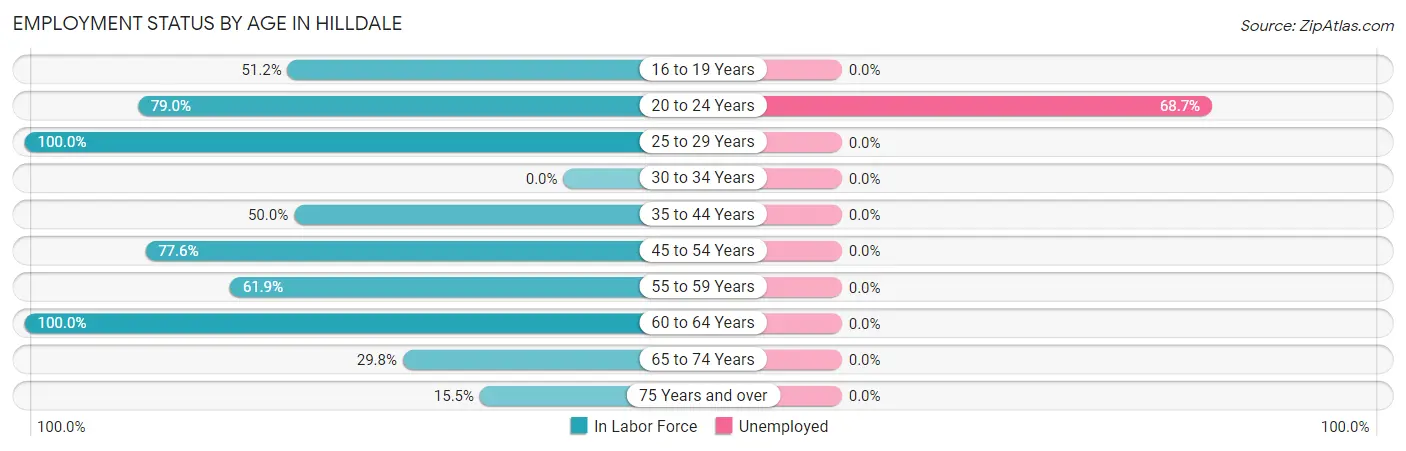
| Age Bracket | In Labor Force | Unemployed |
| 16 to 19 Years | 22 (51.2%) | 0 (0.0%) |
| 20 to 24 Years | 83 (79.0%) | 57 (68.7%) |
| 25 to 29 Years | 36 (100.0%) | 0 (0.0%) |
| 30 to 34 Years | 0 (0.0%) | 0 (0.0%) |
| 35 to 44 Years | 18 (50.0%) | 0 (0.0%) |
| 45 to 54 Years | 114 (77.6%) | 0 (0.0%) |
| 55 to 59 Years | 65 (61.9%) | 0 (0.0%) |
| 60 to 64 Years | 108 (100.0%) | 0 (0.0%) |
| 65 to 74 Years | 45 (29.8%) | 0 (0.0%) |
| 75 Years and over | 13 (15.5%) | 0 (0.0%) |
| Total | 504 (61.8%) | 57 (11.3%) |
Employment Status by Educational Attainment in Hilldale
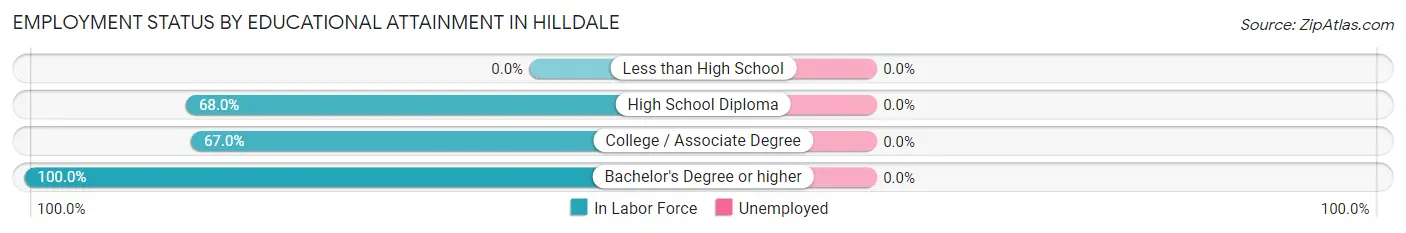
| Educational Attainment | In Labor Force | Unemployed |
| Less than High School | 0 (0.0%) | 0 (0.0%) |
| High School Diploma | 70 (68.0%) | 0 (0.0%) |
| College / Associate Degree | 118 (67.0%) | 0 (0.0%) |
| Bachelor's Degree or higher | 153 (100.0%) | 0 (0.0%) |
| Total | 341 (78.9%) | 0 (0.0%) |
Employment Occupations by Sex in Hilldale
Management, Business, Science and Arts Occupations
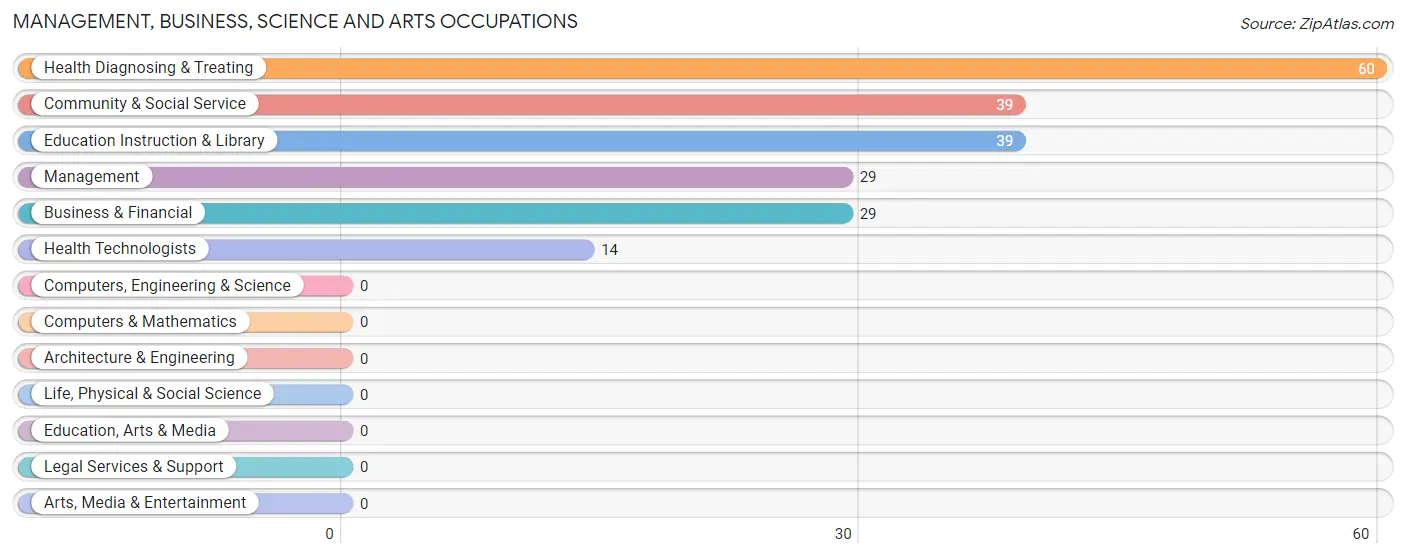
The most common Management, Business, Science and Arts occupations in Hilldale are Health Diagnosing & Treating (60 | 13.4%), Community & Social Service (39 | 8.7%), Education Instruction & Library (39 | 8.7%), Management (29 | 6.5%), and Business & Financial (29 | 6.5%).
Management, Business, Science and Arts Occupations by Sex
Within the Management, Business, Science and Arts occupations in Hilldale, the most male-oriented occupations are Health Technologists (100.0%), Health Diagnosing & Treating (71.7%), and Management (51.7%), while the most female-oriented occupations are Business & Financial (100.0%), Community & Social Service (100.0%), and Education Instruction & Library (100.0%).
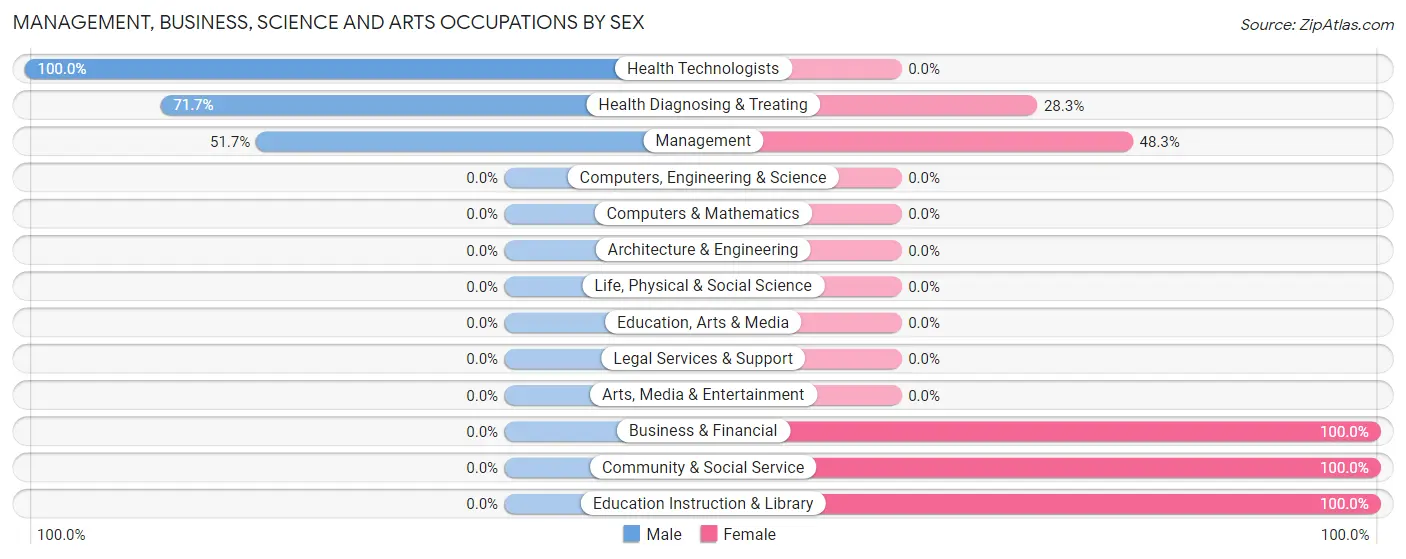
| Occupation | Male | Female |
| Management | 15 (51.7%) | 14 (48.3%) |
| Business & Financial | 0 (0.0%) | 29 (100.0%) |
| Computers, Engineering & Science | 0 (0.0%) | 0 (0.0%) |
| Computers & Mathematics | 0 (0.0%) | 0 (0.0%) |
| Architecture & Engineering | 0 (0.0%) | 0 (0.0%) |
| Life, Physical & Social Science | 0 (0.0%) | 0 (0.0%) |
| Community & Social Service | 0 (0.0%) | 39 (100.0%) |
| Education, Arts & Media | 0 (0.0%) | 0 (0.0%) |
| Legal Services & Support | 0 (0.0%) | 0 (0.0%) |
| Education Instruction & Library | 0 (0.0%) | 39 (100.0%) |
| Arts, Media & Entertainment | 0 (0.0%) | 0 (0.0%) |
| Health Diagnosing & Treating | 43 (71.7%) | 17 (28.3%) |
| Health Technologists | 14 (100.0%) | 0 (0.0%) |
| Total (Category) | 58 (36.9%) | 99 (63.1%) |
| Total (Overall) | 191 (42.7%) | 256 (57.3%) |
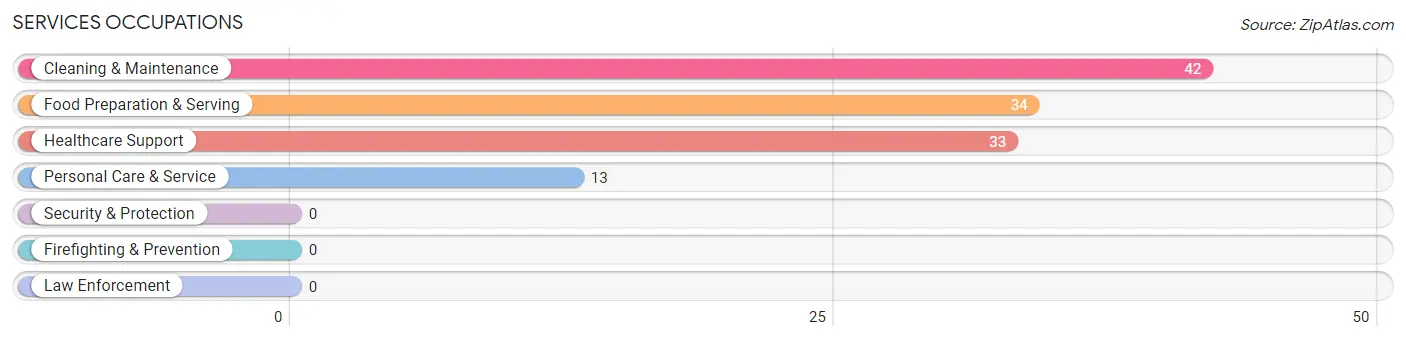
Services Occupations
The most common Services occupations in Hilldale are Cleaning & Maintenance (42 | 9.4%), Food Preparation & Serving (34 | 7.6%), Healthcare Support (33 | 7.4%), and Personal Care & Service (13 | 2.9%).
Services Occupations by Sex
Within the Services occupations in Hilldale, the most male-oriented occupations are Personal Care & Service (100.0%), Food Preparation & Serving (64.7%), and Cleaning & Maintenance (38.1%), while the most female-oriented occupations are Healthcare Support (100.0%), Cleaning & Maintenance (61.9%), and Food Preparation & Serving (35.3%).
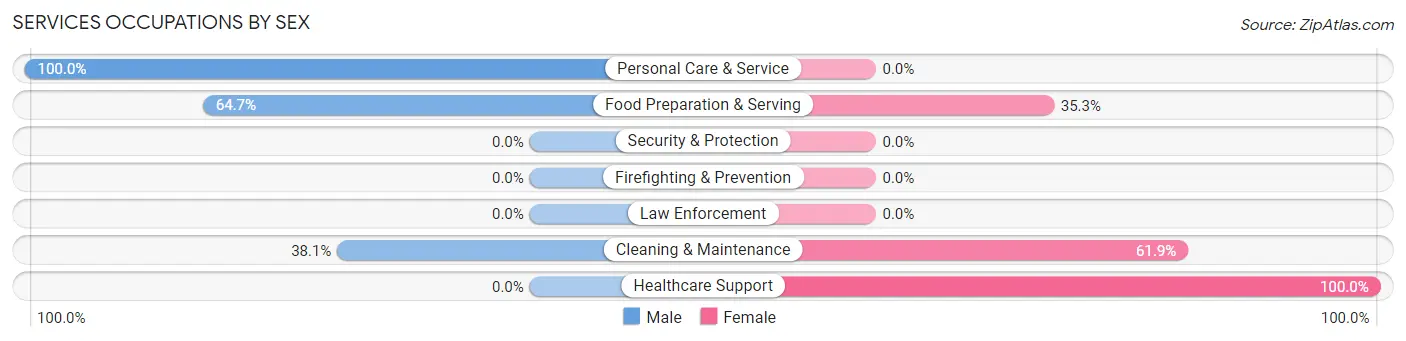
| Occupation | Male | Female |
| Healthcare Support | 0 (0.0%) | 33 (100.0%) |
| Security & Protection | 0 (0.0%) | 0 (0.0%) |
| Firefighting & Prevention | 0 (0.0%) | 0 (0.0%) |
| Law Enforcement | 0 (0.0%) | 0 (0.0%) |
| Food Preparation & Serving | 22 (64.7%) | 12 (35.3%) |
| Cleaning & Maintenance | 16 (38.1%) | 26 (61.9%) |
| Personal Care & Service | 13 (100.0%) | 0 (0.0%) |
| Total (Category) | 51 (41.8%) | 71 (58.2%) |
| Total (Overall) | 191 (42.7%) | 256 (57.3%) |
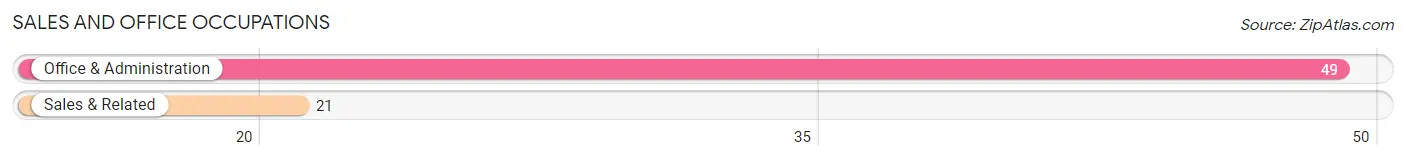
Sales and Office Occupations
The most common Sales and Office occupations in Hilldale are Office & Administration (49 | 11.0%), and Sales & Related (21 | 4.7%).
Sales and Office Occupations by Sex
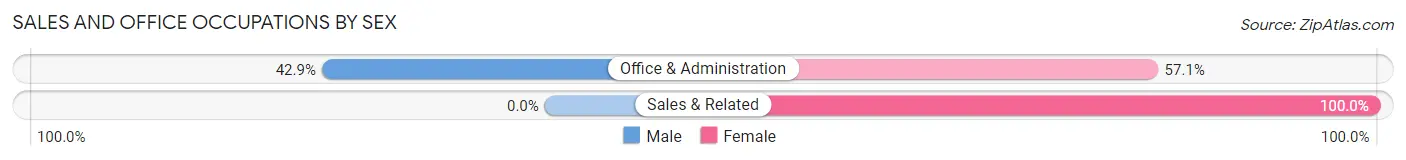
| Occupation | Male | Female |
| Sales & Related | 0 (0.0%) | 21 (100.0%) |
| Office & Administration | 21 (42.9%) | 28 (57.1%) |
| Total (Category) | 21 (30.0%) | 49 (70.0%) |
| Total (Overall) | 191 (42.7%) | 256 (57.3%) |
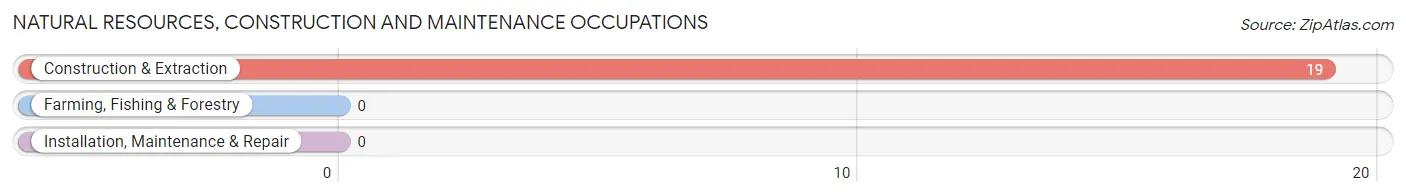
Natural Resources, Construction and Maintenance Occupations
The most common Natural Resources, Construction and Maintenance occupations in Hilldale are , and Construction & Extraction (19 | 4.3%).
Natural Resources, Construction and Maintenance Occupations by Sex
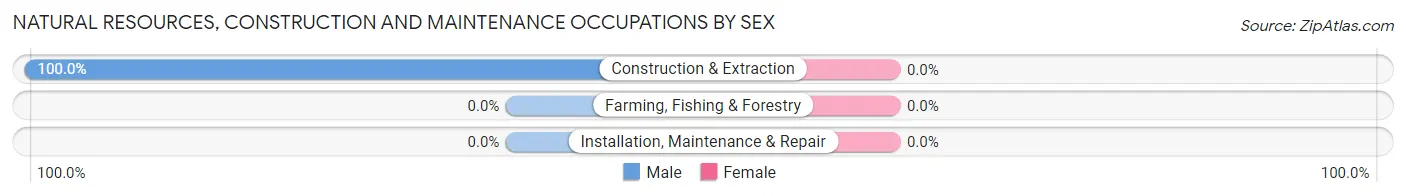
| Occupation | Male | Female |
| Farming, Fishing & Forestry | 0 (0.0%) | 0 (0.0%) |
| Construction & Extraction | 19 (100.0%) | 0 (0.0%) |
| Installation, Maintenance & Repair | 0 (0.0%) | 0 (0.0%) |
| Total (Category) | 19 (100.0%) | 0 (0.0%) |
| Total (Overall) | 191 (42.7%) | 256 (57.3%) |
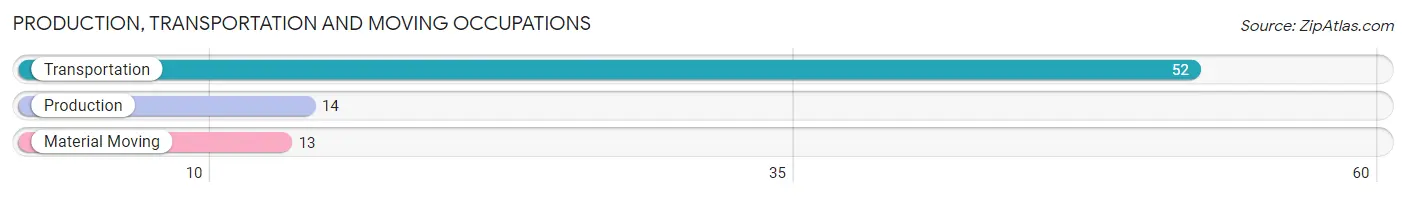
Production, Transportation and Moving Occupations
The most common Production, Transportation and Moving occupations in Hilldale are Transportation (52 | 11.6%), Production (14 | 3.1%), and Material Moving (13 | 2.9%).
Production, Transportation and Moving Occupations by Sex
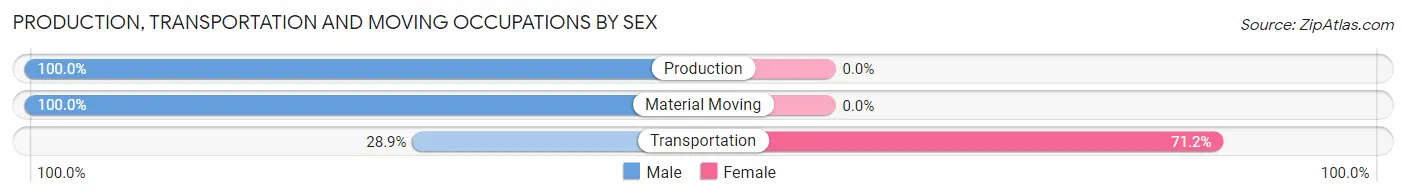
| Occupation | Male | Female |
| Production | 14 (100.0%) | 0 (0.0%) |
| Transportation | 15 (28.8%) | 37 (71.2%) |
| Material Moving | 13 (100.0%) | 0 (0.0%) |
| Total (Category) | 42 (53.2%) | 37 (46.8%) |
| Total (Overall) | 191 (42.7%) | 256 (57.3%) |
Employment Industries by Sex in Hilldale
Employment Industries in Hilldale
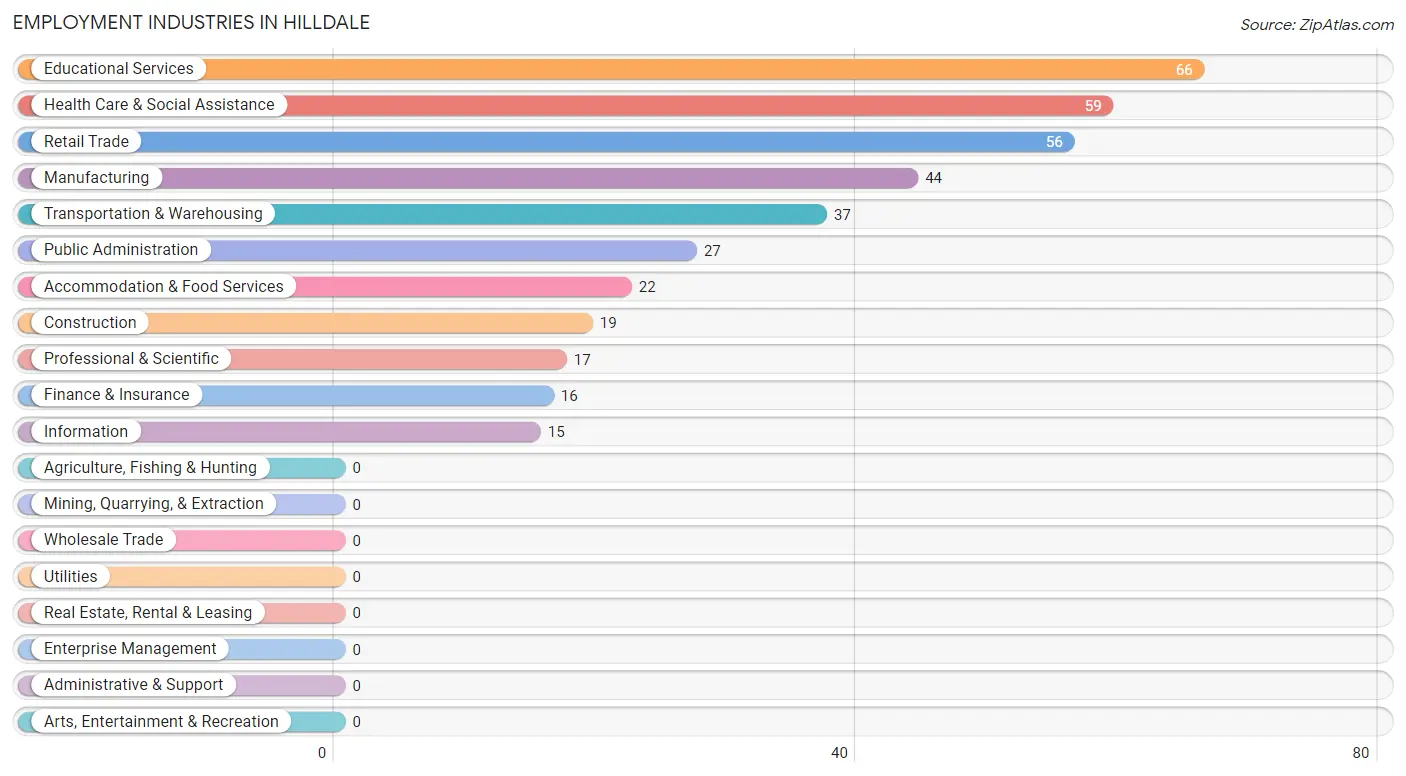
The major employment industries in Hilldale include Educational Services (66 | 14.8%), Health Care & Social Assistance (59 | 13.2%), Retail Trade (56 | 12.5%), Manufacturing (44 | 9.8%), and Transportation & Warehousing (37 | 8.3%).
Employment Industries by Sex in Hilldale
The Hilldale industries that see more men than women are Construction (100.0%), Information (100.0%), and Professional & Scientific (100.0%), whereas the industries that tend to have a higher number of women are Transportation & Warehousing (100.0%), Finance & Insurance (100.0%), and Public Administration (100.0%).
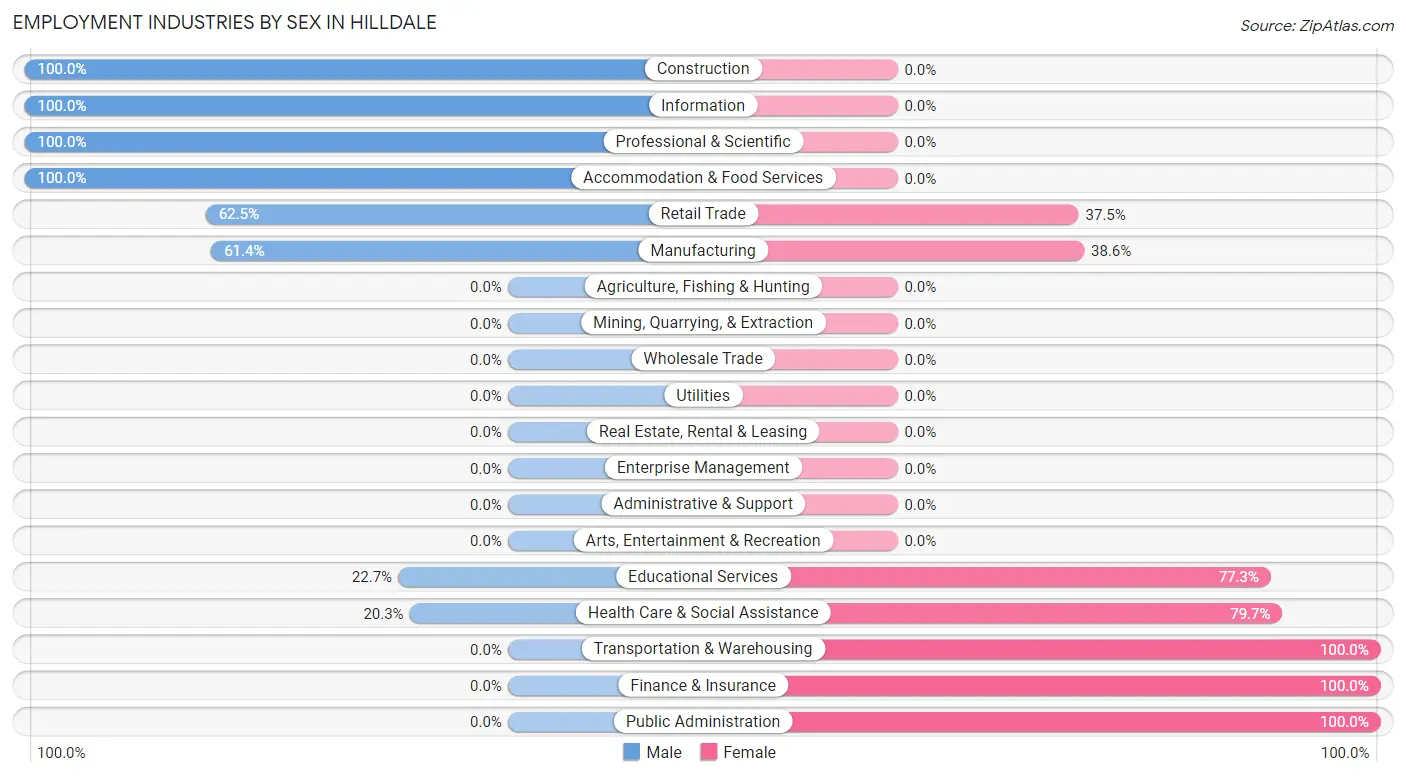
| Industry | Male | Female |
| Agriculture, Fishing & Hunting | 0 (0.0%) | 0 (0.0%) |
| Mining, Quarrying, & Extraction | 0 (0.0%) | 0 (0.0%) |
| Construction | 19 (100.0%) | 0 (0.0%) |
| Manufacturing | 27 (61.4%) | 17 (38.6%) |
| Wholesale Trade | 0 (0.0%) | 0 (0.0%) |
| Retail Trade | 35 (62.5%) | 21 (37.5%) |
| Transportation & Warehousing | 0 (0.0%) | 37 (100.0%) |
| Utilities | 0 (0.0%) | 0 (0.0%) |
| Information | 15 (100.0%) | 0 (0.0%) |
| Finance & Insurance | 0 (0.0%) | 16 (100.0%) |
| Real Estate, Rental & Leasing | 0 (0.0%) | 0 (0.0%) |
| Professional & Scientific | 17 (100.0%) | 0 (0.0%) |
| Enterprise Management | 0 (0.0%) | 0 (0.0%) |
| Administrative & Support | 0 (0.0%) | 0 (0.0%) |
| Educational Services | 15 (22.7%) | 51 (77.3%) |
| Health Care & Social Assistance | 12 (20.3%) | 47 (79.7%) |
| Arts, Entertainment & Recreation | 0 (0.0%) | 0 (0.0%) |
| Accommodation & Food Services | 22 (100.0%) | 0 (0.0%) |
| Public Administration | 0 (0.0%) | 27 (100.0%) |
| Total | 191 (42.7%) | 256 (57.3%) |
Education in Hilldale
School Enrollment in Hilldale
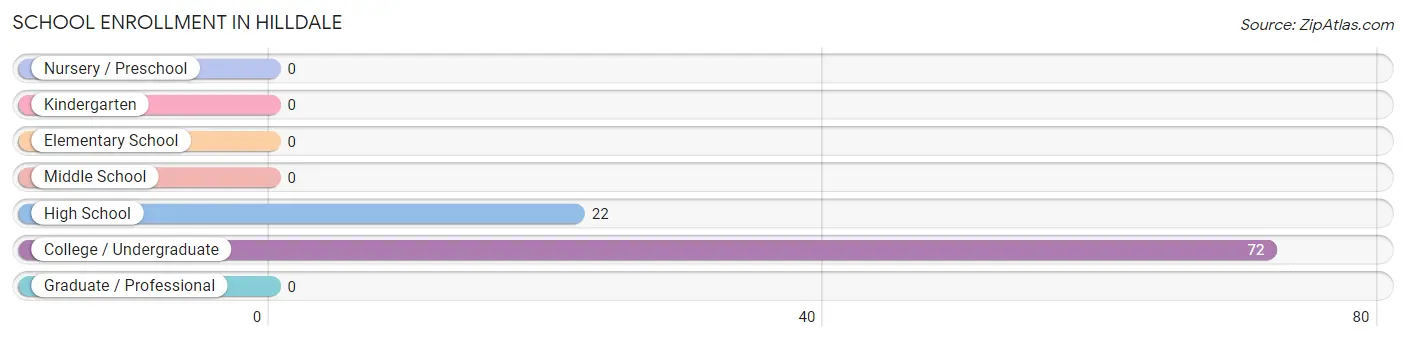
The most common levels of schooling among the 94 students in Hilldale are college / undergraduate (72 | 76.6%), and high school (22 | 23.4%).
| School Level | # Students | % Students |
| Nursery / Preschool | 0 | 0.0% |
| Kindergarten | 0 | 0.0% |
| Elementary School | 0 | 0.0% |
| Middle School | 0 | 0.0% |
| High School | 22 | 23.4% |
| College / Undergraduate | 72 | 76.6% |
| Graduate / Professional | 0 | 0.0% |
| Total | 94 | 100.0% |
School Enrollment by Age by Funding Source in Hilldale
Out of a total of 94 students who are enrolled in schools in Hilldale, 29 (30.9%) attend a private institution, while the remaining 65 (69.1%) are enrolled in public schools. The age group of 25 to 34 year olds has the highest likelihood of being enrolled in private schools, with 17 (100.0% in the age bracket) enrolled. Conversely, the age group of 15 to 17 year olds has the lowest likelihood of being enrolled in a private school, with 22 (100.0% in the age bracket) attending a public institution.
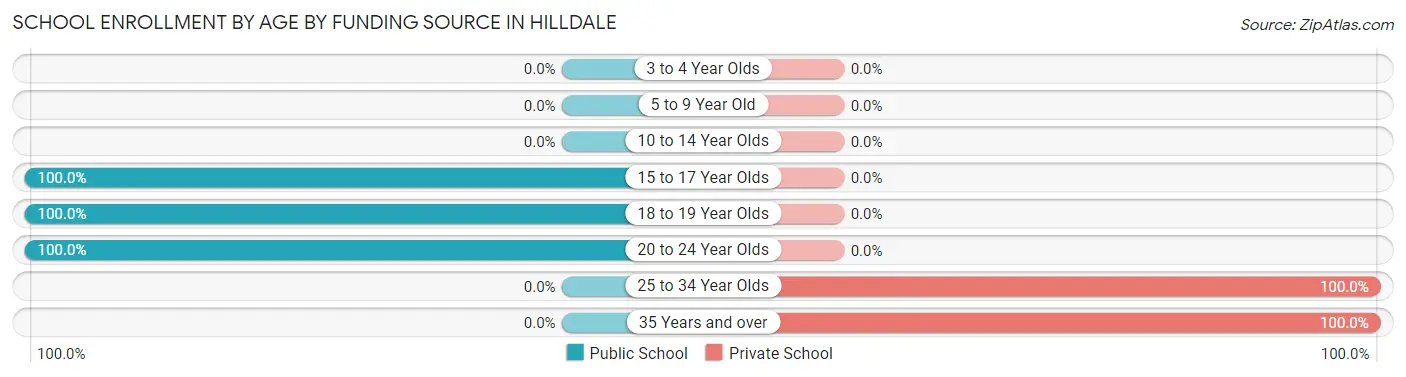
| Age Bracket | Public School | Private School |
| 3 to 4 Year Olds | 0 (0.0%) | 0 (0.0%) |
| 5 to 9 Year Old | 0 (0.0%) | 0 (0.0%) |
| 10 to 14 Year Olds | 0 (0.0%) | 0 (0.0%) |
| 15 to 17 Year Olds | 22 (100.0%) | 0 (0.0%) |
| 18 to 19 Year Olds | 21 (100.0%) | 0 (0.0%) |
| 20 to 24 Year Olds | 22 (100.0%) | 0 (0.0%) |
| 25 to 34 Year Olds | 0 (0.0%) | 17 (100.0%) |
| 35 Years and over | 0 (0.0%) | 12 (100.0%) |
| Total | 65 (69.1%) | 29 (30.9%) |
Educational Attainment by Field of Study in Hilldale
Education (66 | 33.3%), science & technology (49 | 24.7%), business (34 | 17.2%), computers & mathematics (16 | 8.1%), and liberal arts & history (15 | 7.6%) are the most common fields of study among 198 individuals in Hilldale who have obtained a bachelor's degree or higher.
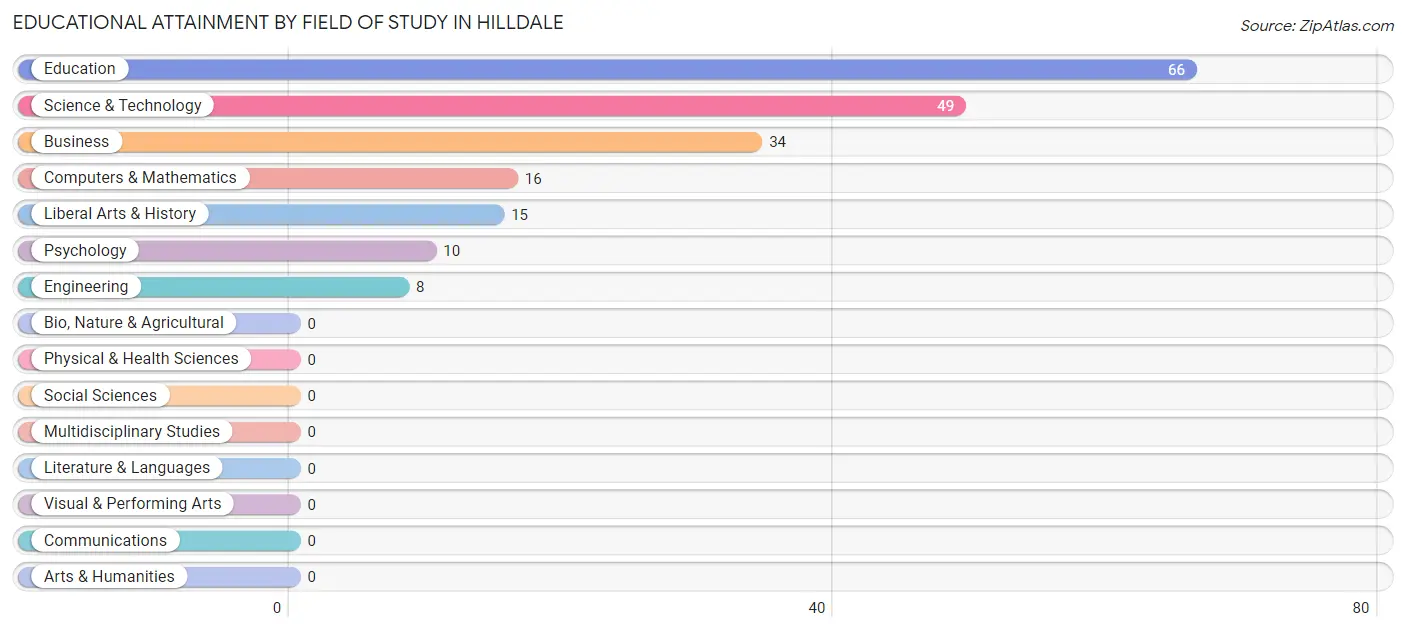
| Field of Study | # Graduates | % Graduates |
| Computers & Mathematics | 16 | 8.1% |
| Bio, Nature & Agricultural | 0 | 0.0% |
| Physical & Health Sciences | 0 | 0.0% |
| Psychology | 10 | 5.1% |
| Social Sciences | 0 | 0.0% |
| Engineering | 8 | 4.0% |
| Multidisciplinary Studies | 0 | 0.0% |
| Science & Technology | 49 | 24.7% |
| Business | 34 | 17.2% |
| Education | 66 | 33.3% |
| Literature & Languages | 0 | 0.0% |
| Liberal Arts & History | 15 | 7.6% |
| Visual & Performing Arts | 0 | 0.0% |
| Communications | 0 | 0.0% |
| Arts & Humanities | 0 | 0.0% |
| Total | 198 | 100.0% |
Transportation & Commute in Hilldale
Vehicle Availability by Sex in Hilldale
The most prevalent vehicle ownership categories in Hilldale are males with 2 vehicles (107, accounting for 56.0%) and females with 2 vehicles (73, making up 41.8%).
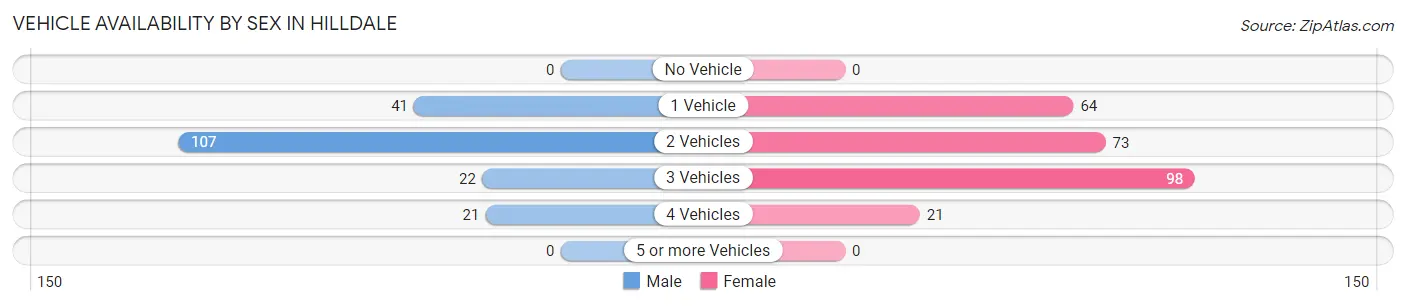
| Vehicles Available | Male | Female |
| No Vehicle | 0 (0.0%) | 0 (0.0%) |
| 1 Vehicle | 41 (21.5%) | 64 (25.0%) |
| 2 Vehicles | 107 (56.0%) | 73 (28.5%) |
| 3 Vehicles | 22 (11.5%) | 98 (38.3%) |
| 4 Vehicles | 21 (11.0%) | 21 (8.2%) |
| 5 or more Vehicles | 0 (0.0%) | 0 (0.0%) |
| Total | 191 (100.0%) | 256 (100.0%) |
Commute Time in Hilldale
The most frequently occuring commute durations in Hilldale are 15 to 19 minutes (138 commuters, 30.9%), 10 to 14 minutes (123 commuters, 27.5%), and 5 to 9 minutes (121 commuters, 27.1%).
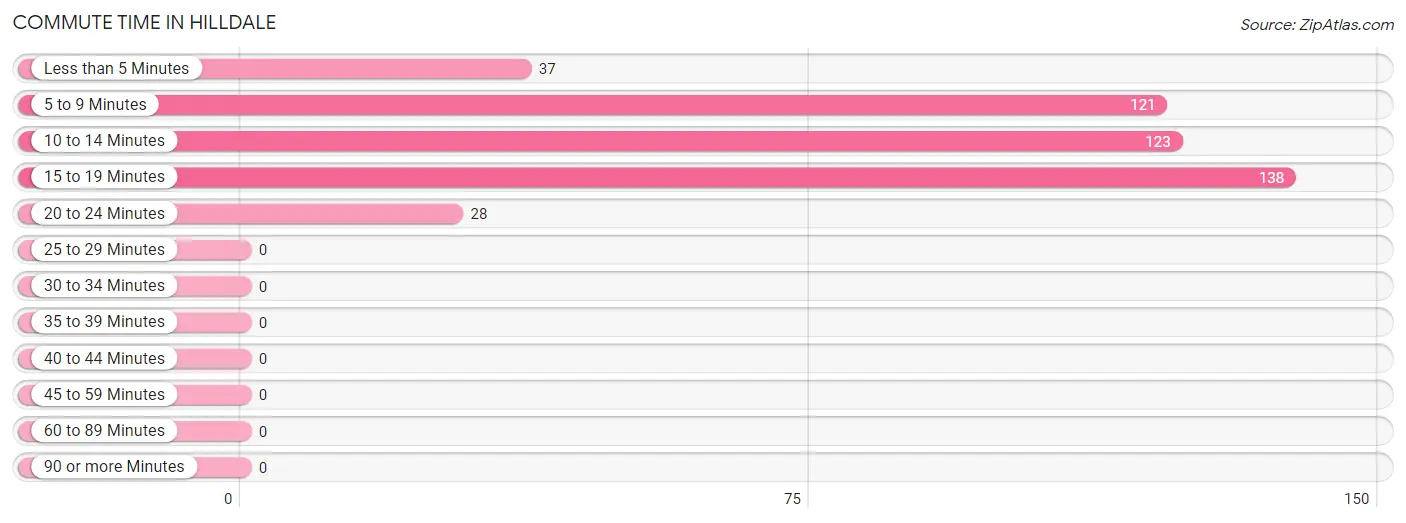
| Commute Time | # Commuters | % Commuters |
| Less than 5 Minutes | 37 | 8.3% |
| 5 to 9 Minutes | 121 | 27.1% |
| 10 to 14 Minutes | 123 | 27.5% |
| 15 to 19 Minutes | 138 | 30.9% |
| 20 to 24 Minutes | 28 | 6.3% |
| 25 to 29 Minutes | 0 | 0.0% |
| 30 to 34 Minutes | 0 | 0.0% |
| 35 to 39 Minutes | 0 | 0.0% |
| 40 to 44 Minutes | 0 | 0.0% |
| 45 to 59 Minutes | 0 | 0.0% |
| 60 to 89 Minutes | 0 | 0.0% |
| 90 or more Minutes | 0 | 0.0% |
Commute Time by Sex in Hilldale
The most common commute times in Hilldale are 15 to 19 minutes (78 commuters, 40.8%) for males and 5 to 9 minutes (108 commuters, 42.2%) for females.
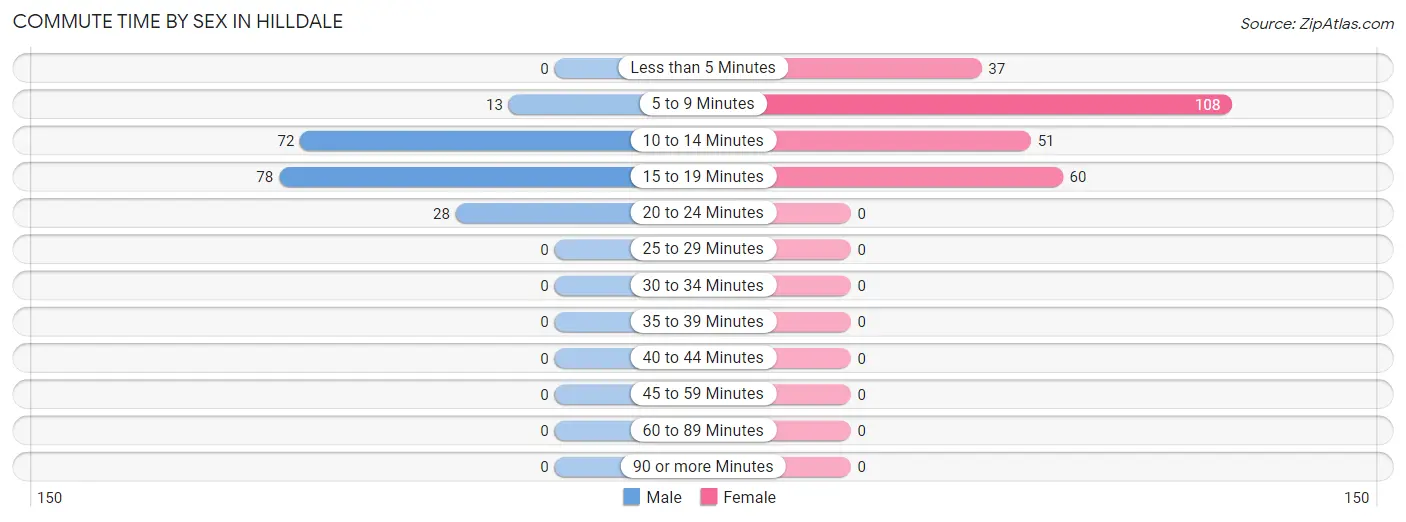
| Commute Time | Male | Female |
| Less than 5 Minutes | 0 (0.0%) | 37 (14.4%) |
| 5 to 9 Minutes | 13 (6.8%) | 108 (42.2%) |
| 10 to 14 Minutes | 72 (37.7%) | 51 (19.9%) |
| 15 to 19 Minutes | 78 (40.8%) | 60 (23.4%) |
| 20 to 24 Minutes | 28 (14.7%) | 0 (0.0%) |
| 25 to 29 Minutes | 0 (0.0%) | 0 (0.0%) |
| 30 to 34 Minutes | 0 (0.0%) | 0 (0.0%) |
| 35 to 39 Minutes | 0 (0.0%) | 0 (0.0%) |
| 40 to 44 Minutes | 0 (0.0%) | 0 (0.0%) |
| 45 to 59 Minutes | 0 (0.0%) | 0 (0.0%) |
| 60 to 89 Minutes | 0 (0.0%) | 0 (0.0%) |
| 90 or more Minutes | 0 (0.0%) | 0 (0.0%) |
Time of Departure to Work by Sex in Hilldale
The most frequent times of departure to work in Hilldale are 8:00 AM to 8:29 AM (64, 33.5%) for males and 8:00 AM to 8:29 AM (67, 26.2%) for females.
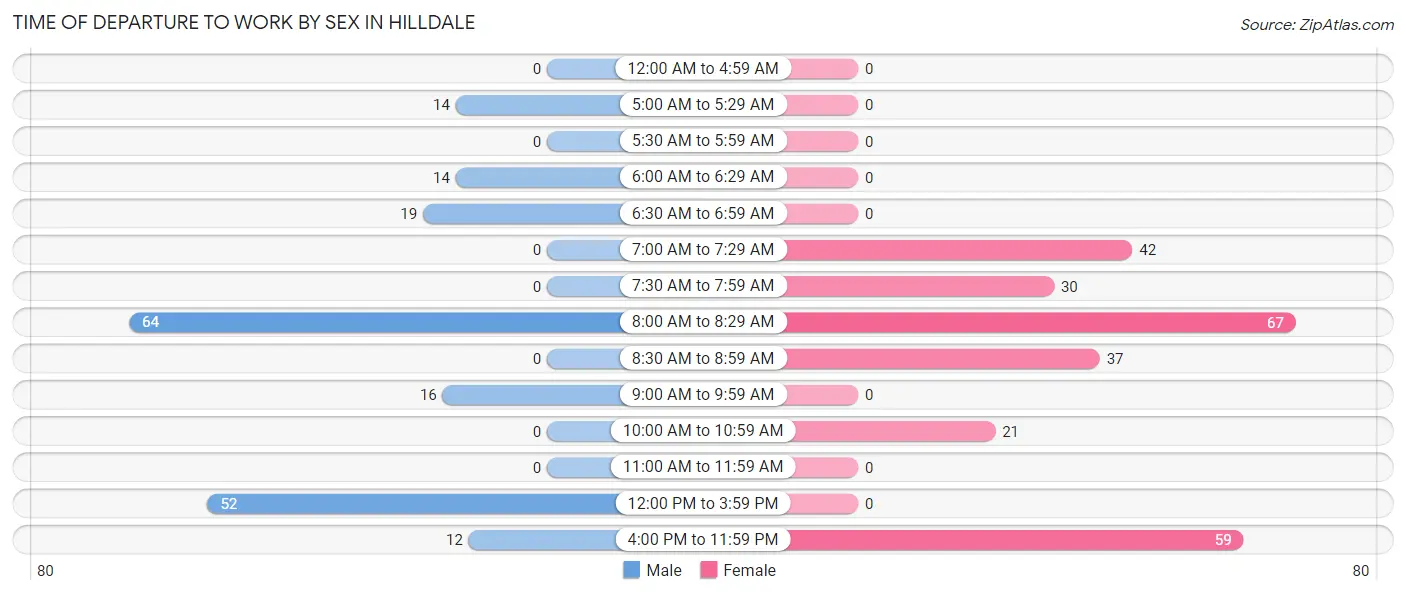
| Time of Departure | Male | Female |
| 12:00 AM to 4:59 AM | 0 (0.0%) | 0 (0.0%) |
| 5:00 AM to 5:29 AM | 14 (7.3%) | 0 (0.0%) |
| 5:30 AM to 5:59 AM | 0 (0.0%) | 0 (0.0%) |
| 6:00 AM to 6:29 AM | 14 (7.3%) | 0 (0.0%) |
| 6:30 AM to 6:59 AM | 19 (10.0%) | 0 (0.0%) |
| 7:00 AM to 7:29 AM | 0 (0.0%) | 42 (16.4%) |
| 7:30 AM to 7:59 AM | 0 (0.0%) | 30 (11.7%) |
| 8:00 AM to 8:29 AM | 64 (33.5%) | 67 (26.2%) |
| 8:30 AM to 8:59 AM | 0 (0.0%) | 37 (14.4%) |
| 9:00 AM to 9:59 AM | 16 (8.4%) | 0 (0.0%) |
| 10:00 AM to 10:59 AM | 0 (0.0%) | 21 (8.2%) |
| 11:00 AM to 11:59 AM | 0 (0.0%) | 0 (0.0%) |
| 12:00 PM to 3:59 PM | 52 (27.2%) | 0 (0.0%) |
| 4:00 PM to 11:59 PM | 12 (6.3%) | 59 (23.1%) |
| Total | 191 (100.0%) | 256 (100.0%) |
Housing Occupancy in Hilldale
Occupancy by Ownership in Hilldale
Of the total 441 dwellings in Hilldale, owner-occupied units account for 402 (91.2%), while renter-occupied units make up 39 (8.8%).
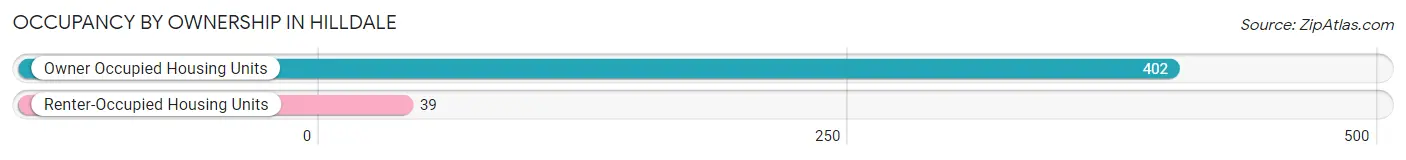
| Occupancy | # Housing Units | % Housing Units |
| Owner Occupied Housing Units | 402 | 91.2% |
| Renter-Occupied Housing Units | 39 | 8.8% |
| Total Occupied Housing Units | 441 | 100.0% |
Occupancy by Household Size in Hilldale
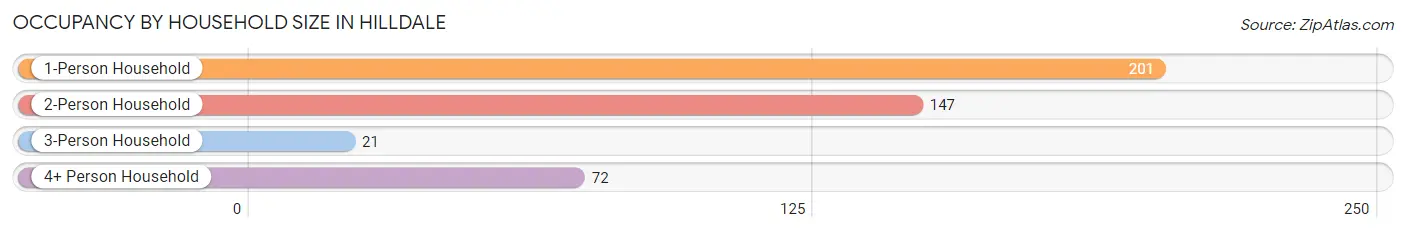
| Household Size | # Housing Units | % Housing Units |
| 1-Person Household | 201 | 45.6% |
| 2-Person Household | 147 | 33.3% |
| 3-Person Household | 21 | 4.8% |
| 4+ Person Household | 72 | 16.3% |
| Total Housing Units | 441 | 100.0% |
Occupancy by Ownership by Household Size in Hilldale
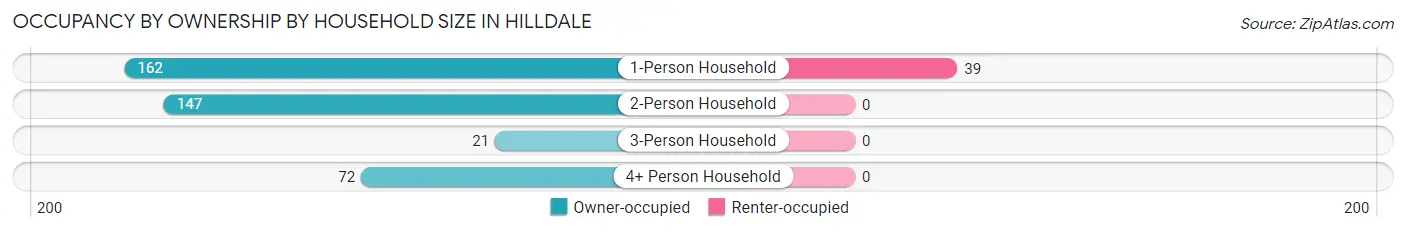
| Household Size | Owner-occupied | Renter-occupied |
| 1-Person Household | 162 (80.6%) | 39 (19.4%) |
| 2-Person Household | 147 (100.0%) | 0 (0.0%) |
| 3-Person Household | 21 (100.0%) | 0 (0.0%) |
| 4+ Person Household | 72 (100.0%) | 0 (0.0%) |
| Total Housing Units | 402 (91.2%) | 39 (8.8%) |
Occupancy by Educational Attainment in Hilldale
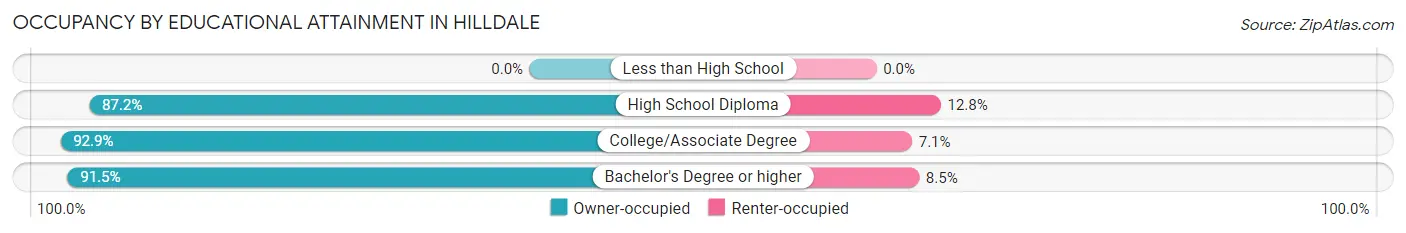
| Household Size | Owner-occupied | Renter-occupied |
| Less than High School | 0 (0.0%) | 0 (0.0%) |
| High School Diploma | 82 (87.2%) | 12 (12.8%) |
| College/Associate Degree | 158 (92.9%) | 12 (7.1%) |
| Bachelor's Degree or higher | 162 (91.5%) | 15 (8.5%) |
Occupancy by Age of Householder in Hilldale
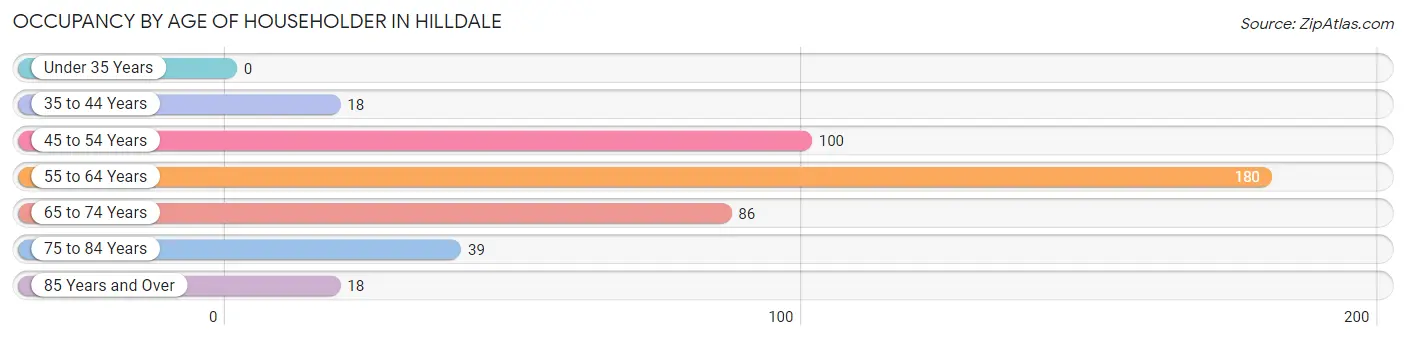
| Age Bracket | # Households | % Households |
| Under 35 Years | 0 | 0.0% |
| 35 to 44 Years | 18 | 4.1% |
| 45 to 54 Years | 100 | 22.7% |
| 55 to 64 Years | 180 | 40.8% |
| 65 to 74 Years | 86 | 19.5% |
| 75 to 84 Years | 39 | 8.8% |
| 85 Years and Over | 18 | 4.1% |
| Total | 441 | 100.0% |
Housing Finances in Hilldale
Median Income by Occupancy in Hilldale
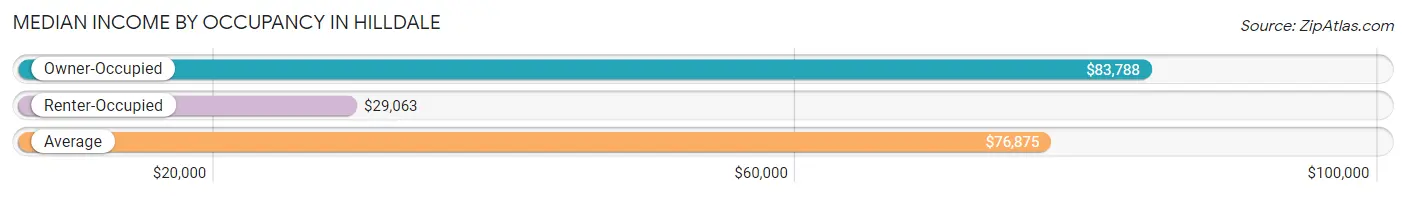
| Occupancy Type | # Households | Median Income |
| Owner-Occupied | 402 (91.2%) | $83,788 |
| Renter-Occupied | 39 (8.8%) | $29,063 |
| Average | 441 (100.0%) | $76,875 |
Occupancy by Householder Income Bracket in Hilldale
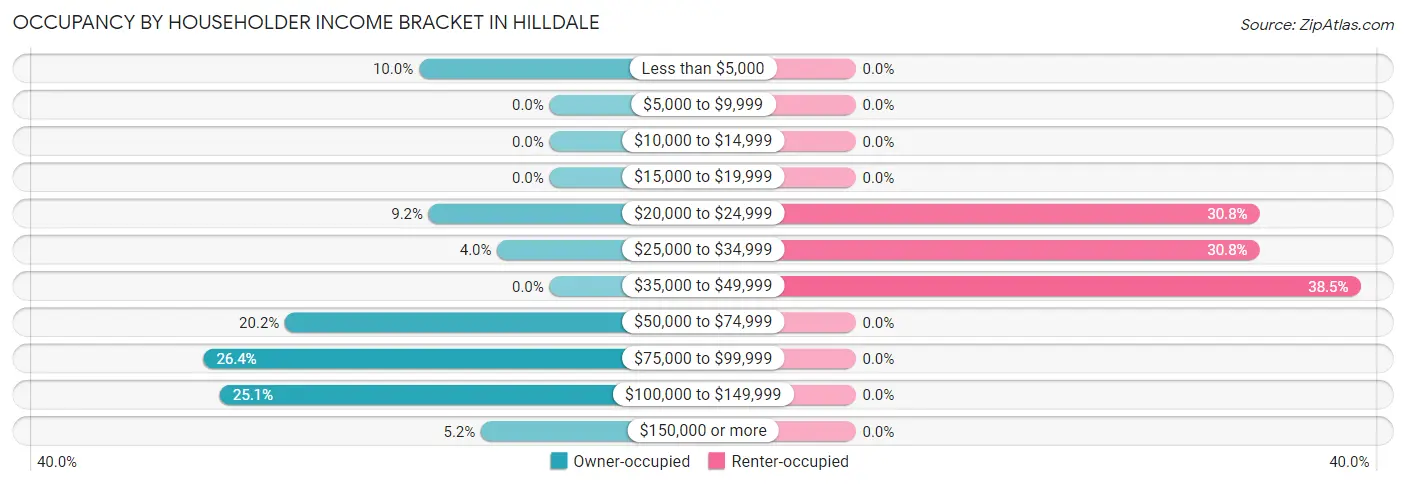
| Income Bracket | Owner-occupied | Renter-occupied |
| Less than $5,000 | 40 (10.0%) | 0 (0.0%) |
| $5,000 to $9,999 | 0 (0.0%) | 0 (0.0%) |
| $10,000 to $14,999 | 0 (0.0%) | 0 (0.0%) |
| $15,000 to $19,999 | 0 (0.0%) | 0 (0.0%) |
| $20,000 to $24,999 | 37 (9.2%) | 12 (30.8%) |
| $25,000 to $34,999 | 16 (4.0%) | 12 (30.8%) |
| $35,000 to $49,999 | 0 (0.0%) | 15 (38.5%) |
| $50,000 to $74,999 | 81 (20.2%) | 0 (0.0%) |
| $75,000 to $99,999 | 106 (26.4%) | 0 (0.0%) |
| $100,000 to $149,999 | 101 (25.1%) | 0 (0.0%) |
| $150,000 or more | 21 (5.2%) | 0 (0.0%) |
| Total | 402 (100.0%) | 39 (100.0%) |
Monthly Housing Cost Tiers in Hilldale
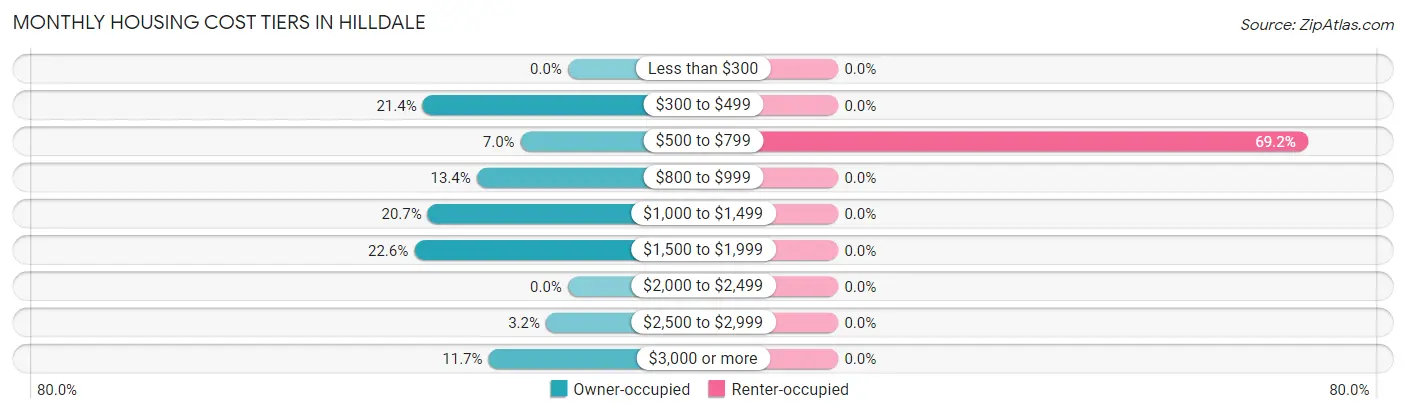
| Monthly Cost | Owner-occupied | Renter-occupied |
| Less than $300 | 0 (0.0%) | 0 (0.0%) |
| $300 to $499 | 86 (21.4%) | 0 (0.0%) |
| $500 to $799 | 28 (7.0%) | 27 (69.2%) |
| $800 to $999 | 54 (13.4%) | 0 (0.0%) |
| $1,000 to $1,499 | 83 (20.6%) | 0 (0.0%) |
| $1,500 to $1,999 | 91 (22.6%) | 0 (0.0%) |
| $2,000 to $2,499 | 0 (0.0%) | 0 (0.0%) |
| $2,500 to $2,999 | 13 (3.2%) | 0 (0.0%) |
| $3,000 or more | 47 (11.7%) | 0 (0.0%) |
| Total | 402 (100.0%) | 39 (100.0%) |
Physical Housing Characteristics in Hilldale
Housing Structures in Hilldale
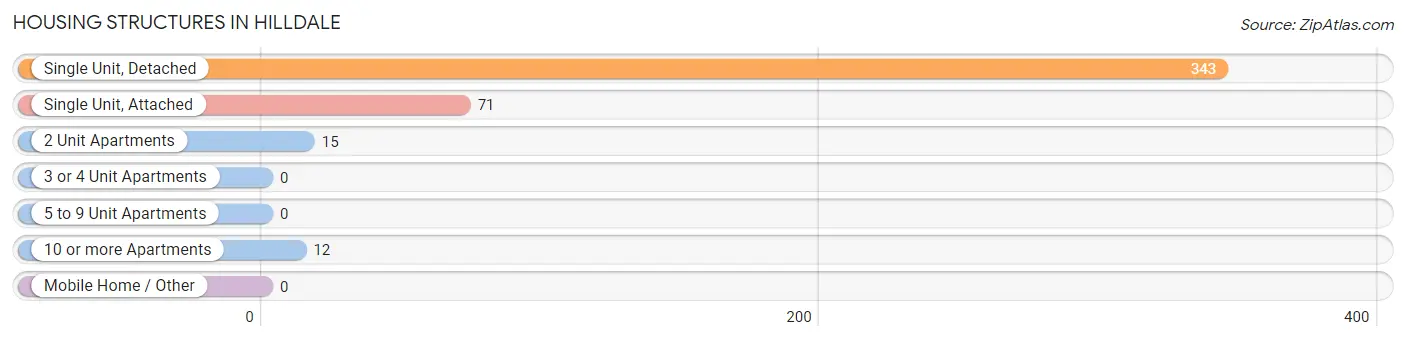
| Structure Type | # Housing Units | % Housing Units |
| Single Unit, Detached | 343 | 77.8% |
| Single Unit, Attached | 71 | 16.1% |
| 2 Unit Apartments | 15 | 3.4% |
| 3 or 4 Unit Apartments | 0 | 0.0% |
| 5 to 9 Unit Apartments | 0 | 0.0% |
| 10 or more Apartments | 12 | 2.7% |
| Mobile Home / Other | 0 | 0.0% |
| Total | 441 | 100.0% |
Housing Structures by Occupancy in Hilldale
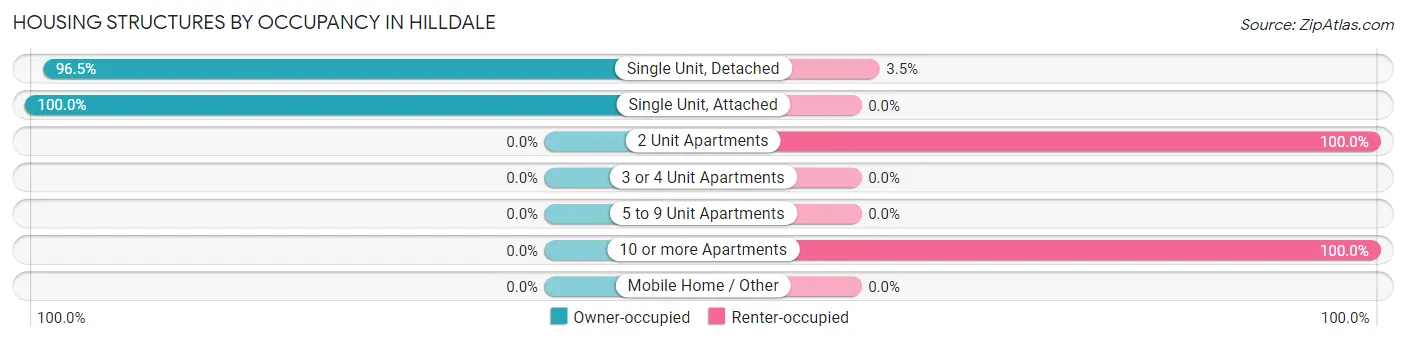
| Structure Type | Owner-occupied | Renter-occupied |
| Single Unit, Detached | 331 (96.5%) | 12 (3.5%) |
| Single Unit, Attached | 71 (100.0%) | 0 (0.0%) |
| 2 Unit Apartments | 0 (0.0%) | 15 (100.0%) |
| 3 or 4 Unit Apartments | 0 (0.0%) | 0 (0.0%) |
| 5 to 9 Unit Apartments | 0 (0.0%) | 0 (0.0%) |
| 10 or more Apartments | 0 (0.0%) | 12 (100.0%) |
| Mobile Home / Other | 0 (0.0%) | 0 (0.0%) |
| Total | 402 (91.2%) | 39 (8.8%) |
Housing Structures by Number of Rooms in Hilldale
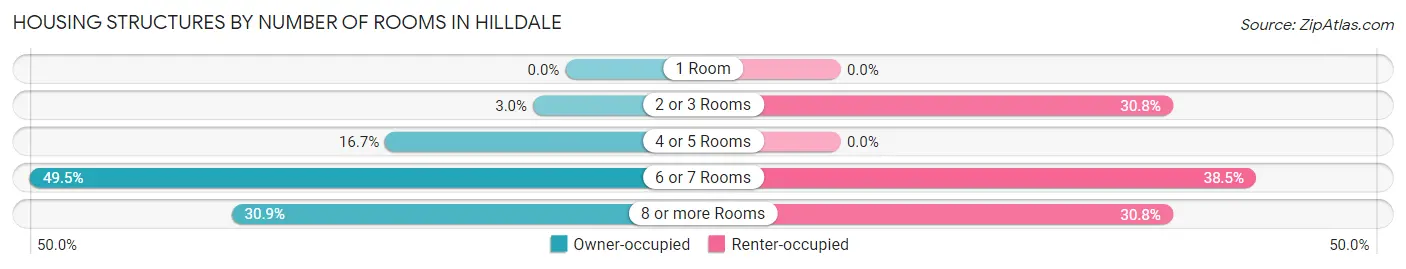
| Number of Rooms | Owner-occupied | Renter-occupied |
| 1 Room | 0 (0.0%) | 0 (0.0%) |
| 2 or 3 Rooms | 12 (3.0%) | 12 (30.8%) |
| 4 or 5 Rooms | 67 (16.7%) | 0 (0.0%) |
| 6 or 7 Rooms | 199 (49.5%) | 15 (38.5%) |
| 8 or more Rooms | 124 (30.8%) | 12 (30.8%) |
| Total | 402 (100.0%) | 39 (100.0%) |
Housing Structure by Heating Type in Hilldale
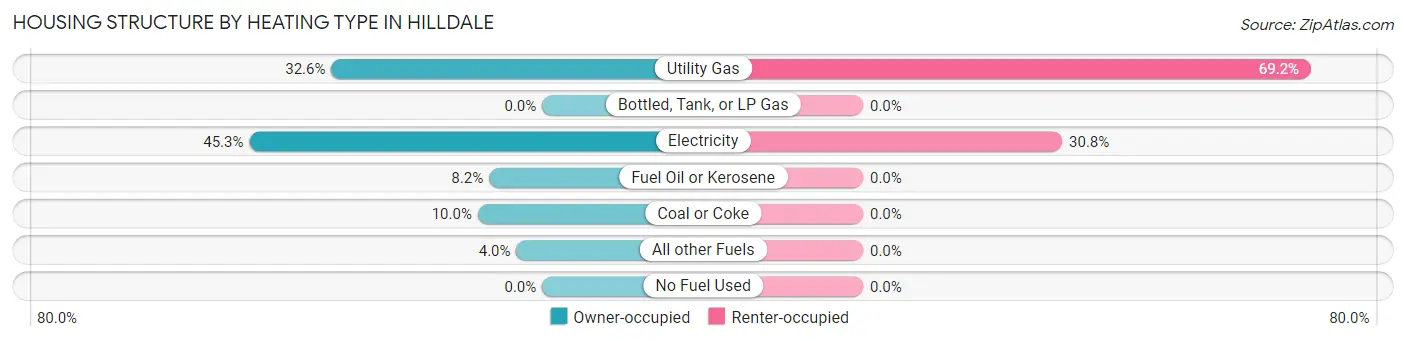
| Heating Type | Owner-occupied | Renter-occupied |
| Utility Gas | 131 (32.6%) | 27 (69.2%) |
| Bottled, Tank, or LP Gas | 0 (0.0%) | 0 (0.0%) |
| Electricity | 182 (45.3%) | 12 (30.8%) |
| Fuel Oil or Kerosene | 33 (8.2%) | 0 (0.0%) |
| Coal or Coke | 40 (10.0%) | 0 (0.0%) |
| All other Fuels | 16 (4.0%) | 0 (0.0%) |
| No Fuel Used | 0 (0.0%) | 0 (0.0%) |
| Total | 402 (100.0%) | 39 (100.0%) |
Household Vehicle Usage in Hilldale
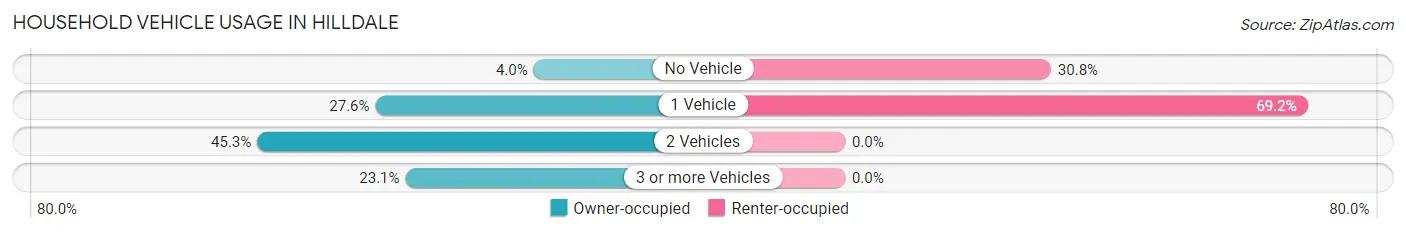
| Vehicles per Household | Owner-occupied | Renter-occupied |
| No Vehicle | 16 (4.0%) | 12 (30.8%) |
| 1 Vehicle | 111 (27.6%) | 27 (69.2%) |
| 2 Vehicles | 182 (45.3%) | 0 (0.0%) |
| 3 or more Vehicles | 93 (23.1%) | 0 (0.0%) |
| Total | 402 (100.0%) | 39 (100.0%) |
Real Estate & Mortgages in Hilldale
Real Estate and Mortgage Overview in Hilldale
| Characteristic | Without Mortgage | With Mortgage |
| Housing Units | 170 | 232 |
| Median Property Value | - | - |
| Median Household Income | $65,972 | $0 |
| Monthly Housing Costs | $492 | $47 |
| Real Estate Taxes | $2,659 | $0 |
Property Value by Mortgage Status in Hilldale
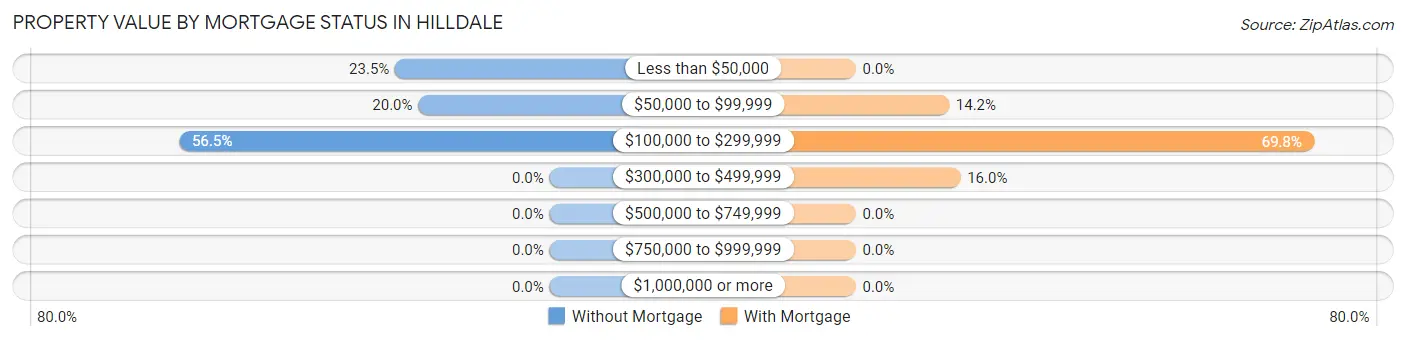
| Property Value | Without Mortgage | With Mortgage |
| Less than $50,000 | 40 (23.5%) | 0 (0.0%) |
| $50,000 to $99,999 | 34 (20.0%) | 33 (14.2%) |
| $100,000 to $299,999 | 96 (56.5%) | 162 (69.8%) |
| $300,000 to $499,999 | 0 (0.0%) | 37 (16.0%) |
| $500,000 to $749,999 | 0 (0.0%) | 0 (0.0%) |
| $750,000 to $999,999 | 0 (0.0%) | 0 (0.0%) |
| $1,000,000 or more | 0 (0.0%) | 0 (0.0%) |
| Total | 170 (100.0%) | 232 (100.0%) |
Household Income by Mortgage Status in Hilldale
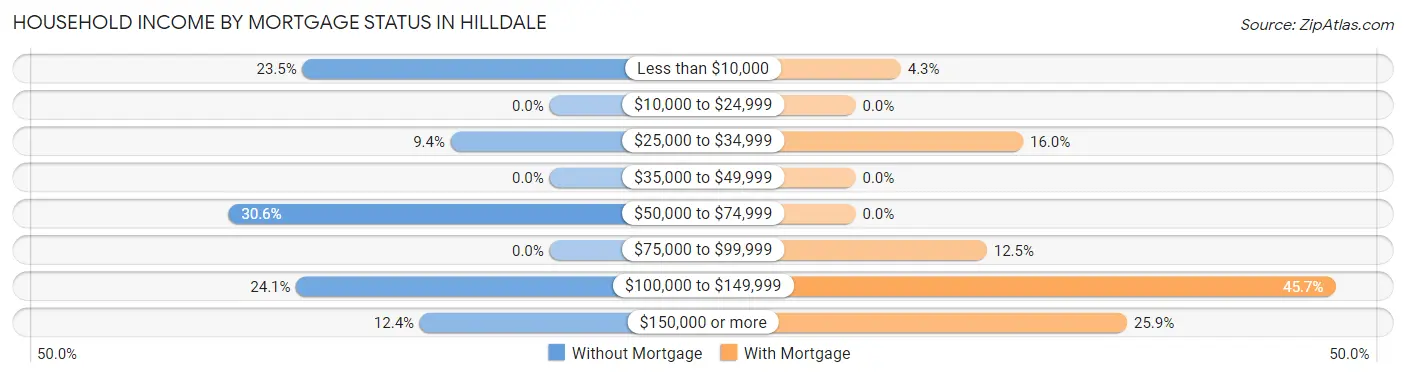
| Household Income | Without Mortgage | With Mortgage |
| Less than $10,000 | 40 (23.5%) | 10 (4.3%) |
| $10,000 to $24,999 | 0 (0.0%) | 0 (0.0%) |
| $25,000 to $34,999 | 16 (9.4%) | 37 (16.0%) |
| $35,000 to $49,999 | 0 (0.0%) | 0 (0.0%) |
| $50,000 to $74,999 | 52 (30.6%) | 0 (0.0%) |
| $75,000 to $99,999 | 0 (0.0%) | 29 (12.5%) |
| $100,000 to $149,999 | 41 (24.1%) | 106 (45.7%) |
| $150,000 or more | 21 (12.3%) | 60 (25.9%) |
| Total | 170 (100.0%) | 232 (100.0%) |
Property Value to Household Income Ratio in Hilldale
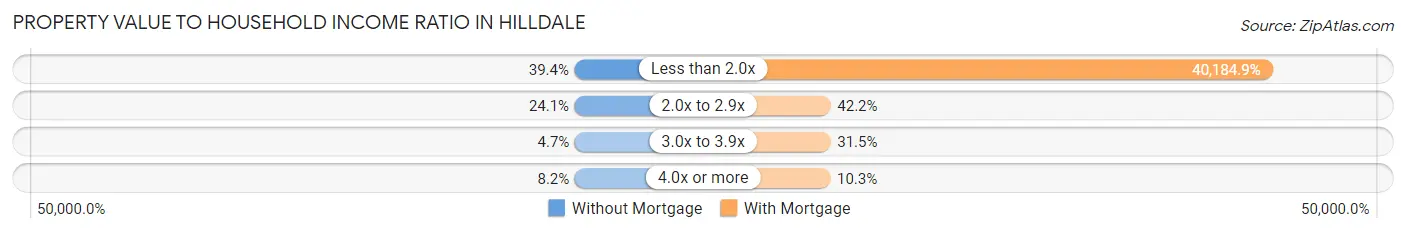
| Value-to-Income Ratio | Without Mortgage | With Mortgage |
| Less than 2.0x | 67 (39.4%) | 93,229 (40,184.9%) |
| 2.0x to 2.9x | 41 (24.1%) | 98 (42.2%) |
| 3.0x to 3.9x | 8 (4.7%) | 73 (31.5%) |
| 4.0x or more | 14 (8.2%) | 24 (10.3%) |
| Total | 170 (100.0%) | 232 (100.0%) |
Real Estate Taxes by Mortgage Status in Hilldale
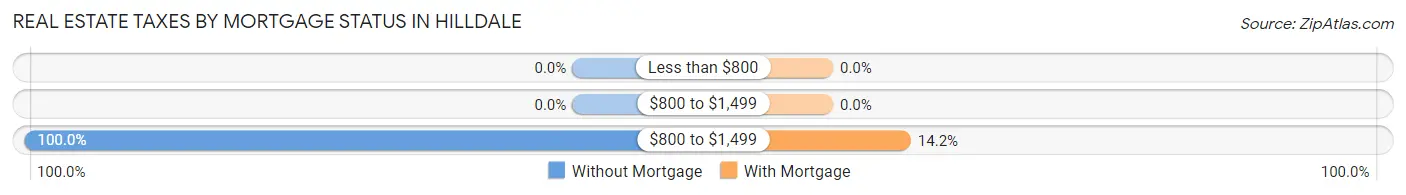
| Property Taxes | Without Mortgage | With Mortgage |
| Less than $800 | 0 (0.0%) | 0 (0.0%) |
| $800 to $1,499 | 0 (0.0%) | 0 (0.0%) |
| $800 to $1,499 | 170 (100.0%) | 33 (14.2%) |
| Total | 170 (100.0%) | 232 (100.0%) |
Health & Disability in Hilldale
Health Insurance Coverage by Age in Hilldale
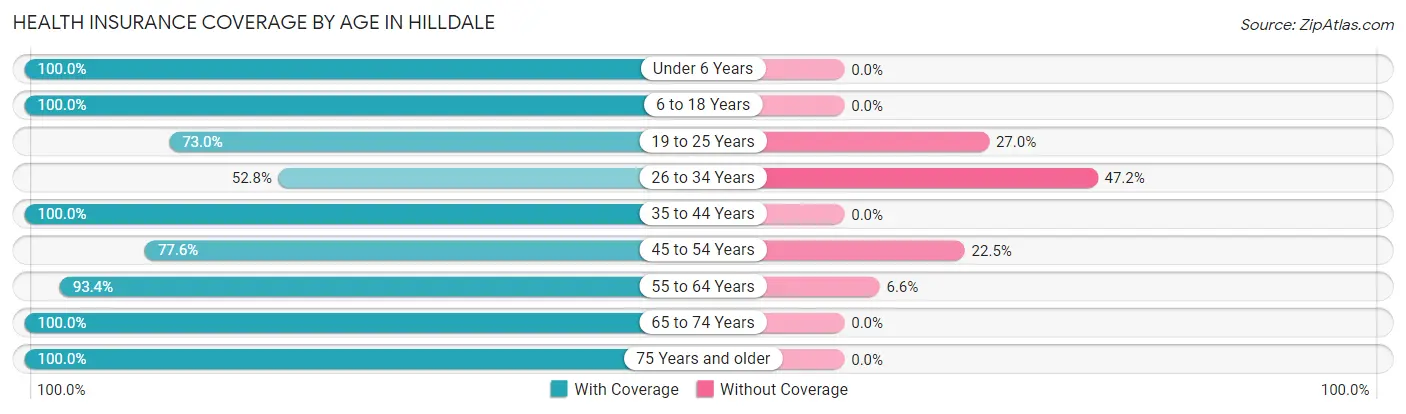
| Age Bracket | With Coverage | Without Coverage |
| Under 6 Years | 37 (100.0%) | 0 (0.0%) |
| 6 to 18 Years | 22 (100.0%) | 0 (0.0%) |
| 19 to 25 Years | 92 (73.0%) | 34 (27.0%) |
| 26 to 34 Years | 19 (52.8%) | 17 (47.2%) |
| 35 to 44 Years | 36 (100.0%) | 0 (0.0%) |
| 45 to 54 Years | 114 (77.5%) | 33 (22.5%) |
| 55 to 64 Years | 199 (93.4%) | 14 (6.6%) |
| 65 to 74 Years | 151 (100.0%) | 0 (0.0%) |
| 75 Years and older | 84 (100.0%) | 0 (0.0%) |
| Total | 754 (88.5%) | 98 (11.5%) |
Health Insurance Coverage by Citizenship Status in Hilldale
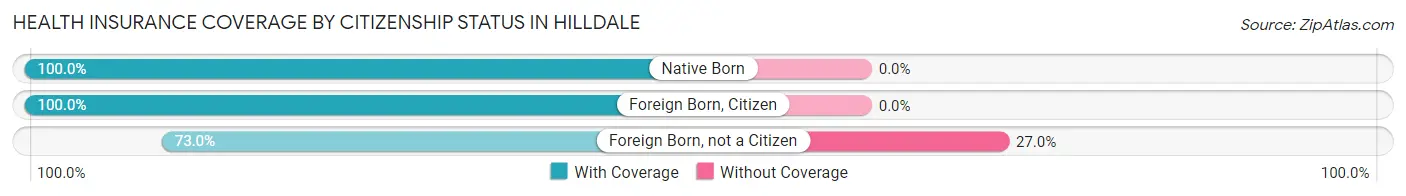
| Citizenship Status | With Coverage | Without Coverage |
| Native Born | 37 (100.0%) | 0 (0.0%) |
| Foreign Born, Citizen | 22 (100.0%) | 0 (0.0%) |
| Foreign Born, not a Citizen | 92 (73.0%) | 34 (27.0%) |
Health Insurance Coverage by Household Income in Hilldale
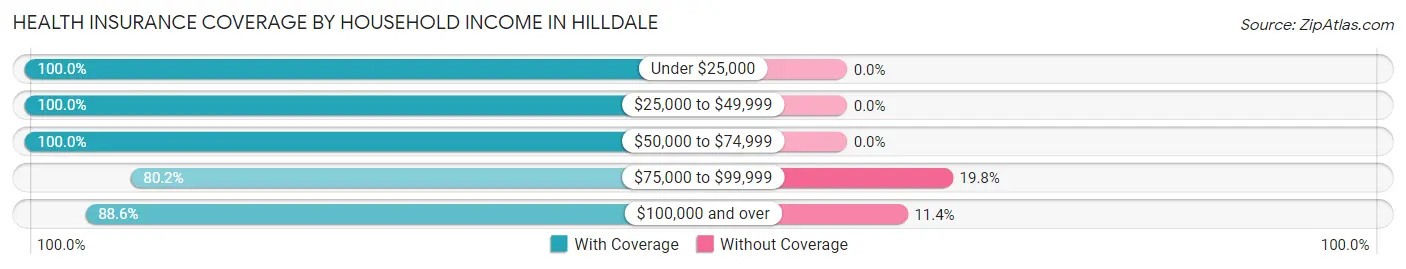
| Household Income | With Coverage | Without Coverage |
| Under $25,000 | 89 (100.0%) | 0 (0.0%) |
| $25,000 to $49,999 | 43 (100.0%) | 0 (0.0%) |
| $50,000 to $74,999 | 109 (100.0%) | 0 (0.0%) |
| $75,000 to $99,999 | 271 (80.2%) | 67 (19.8%) |
| $100,000 and over | 242 (88.6%) | 31 (11.4%) |
Public vs Private Health Insurance Coverage by Age in Hilldale
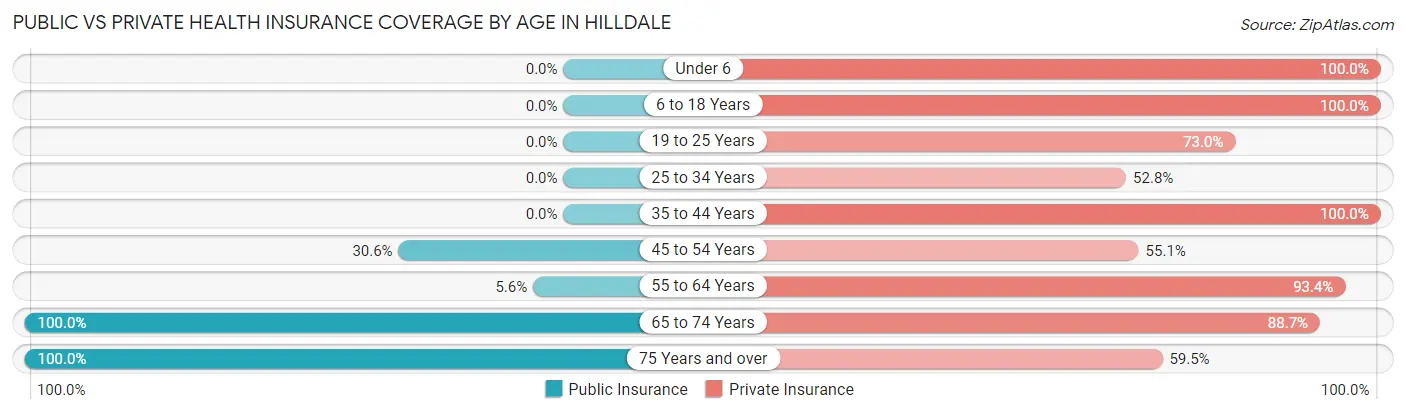
| Age Bracket | Public Insurance | Private Insurance |
| Under 6 | 0 (0.0%) | 37 (100.0%) |
| 6 to 18 Years | 0 (0.0%) | 22 (100.0%) |
| 19 to 25 Years | 0 (0.0%) | 92 (73.0%) |
| 25 to 34 Years | 0 (0.0%) | 19 (52.8%) |
| 35 to 44 Years | 0 (0.0%) | 36 (100.0%) |
| 45 to 54 Years | 45 (30.6%) | 81 (55.1%) |
| 55 to 64 Years | 12 (5.6%) | 199 (93.4%) |
| 65 to 74 Years | 151 (100.0%) | 134 (88.7%) |
| 75 Years and over | 84 (100.0%) | 50 (59.5%) |
| Total | 292 (34.3%) | 670 (78.6%) |
Disability Status by Sex by Age in Hilldale
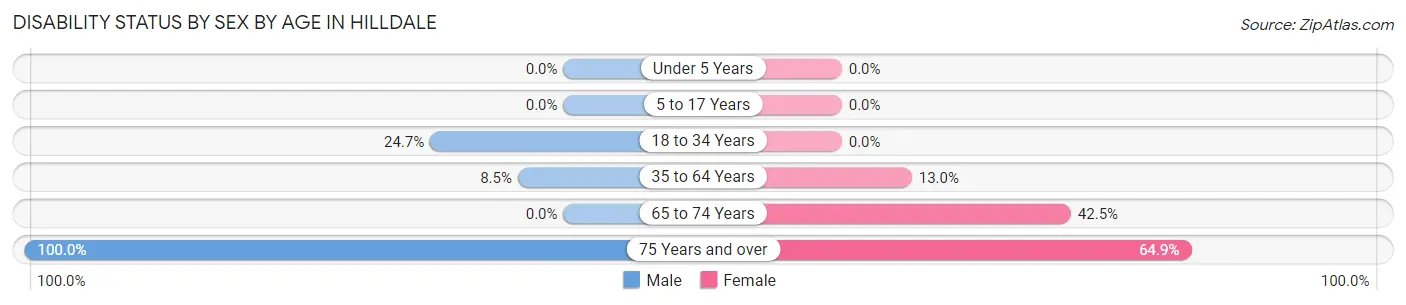
| Age Bracket | Male | Female |
| Under 5 Years | 0 (0.0%) | 0 (0.0%) |
| 5 to 17 Years | 0 (0.0%) | 0 (0.0%) |
| 18 to 34 Years | 23 (24.7%) | 0 (0.0%) |
| 35 to 64 Years | 12 (8.5%) | 33 (13.0%) |
| 65 to 74 Years | 0 (0.0%) | 37 (42.5%) |
| 75 Years and over | 10 (100.0%) | 48 (64.9%) |
Disability Class by Sex by Age in Hilldale
Disability Class: Hearing Difficulty
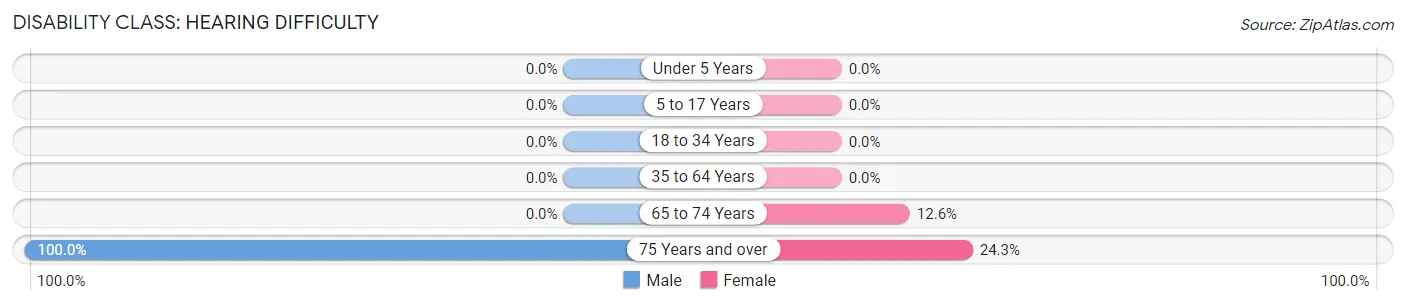
| Age Bracket | Male | Female |
| Under 5 Years | 0 (0.0%) | 0 (0.0%) |
| 5 to 17 Years | 0 (0.0%) | 0 (0.0%) |
| 18 to 34 Years | 0 (0.0%) | 0 (0.0%) |
| 35 to 64 Years | 0 (0.0%) | 0 (0.0%) |
| 65 to 74 Years | 0 (0.0%) | 11 (12.6%) |
| 75 Years and over | 10 (100.0%) | 18 (24.3%) |
Disability Class: Vision Difficulty
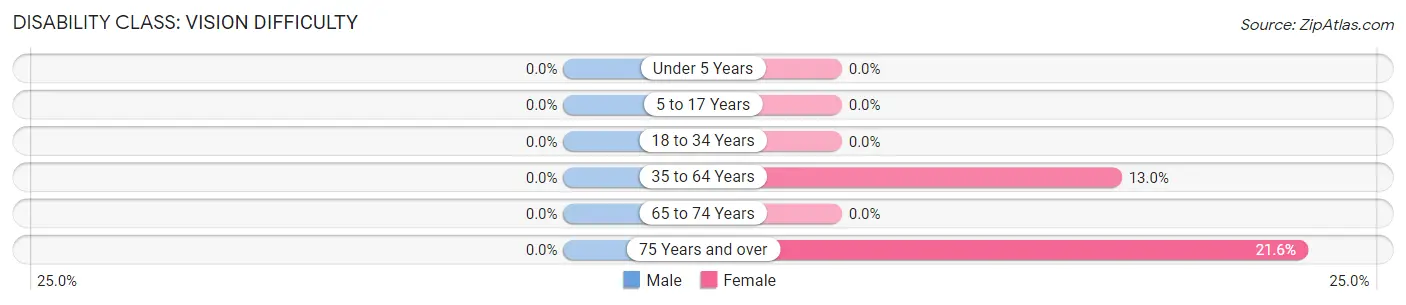
| Age Bracket | Male | Female |
| Under 5 Years | 0 (0.0%) | 0 (0.0%) |
| 5 to 17 Years | 0 (0.0%) | 0 (0.0%) |
| 18 to 34 Years | 0 (0.0%) | 0 (0.0%) |
| 35 to 64 Years | 0 (0.0%) | 33 (13.0%) |
| 65 to 74 Years | 0 (0.0%) | 0 (0.0%) |
| 75 Years and over | 0 (0.0%) | 16 (21.6%) |
Disability Class: Cognitive Difficulty
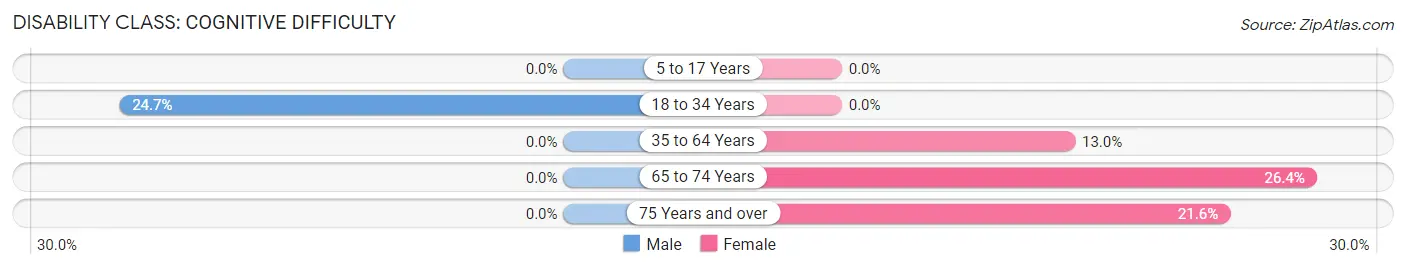
| Age Bracket | Male | Female |
| 5 to 17 Years | 0 (0.0%) | 0 (0.0%) |
| 18 to 34 Years | 23 (24.7%) | 0 (0.0%) |
| 35 to 64 Years | 0 (0.0%) | 33 (13.0%) |
| 65 to 74 Years | 0 (0.0%) | 23 (26.4%) |
| 75 Years and over | 0 (0.0%) | 16 (21.6%) |
Disability Class: Ambulatory Difficulty
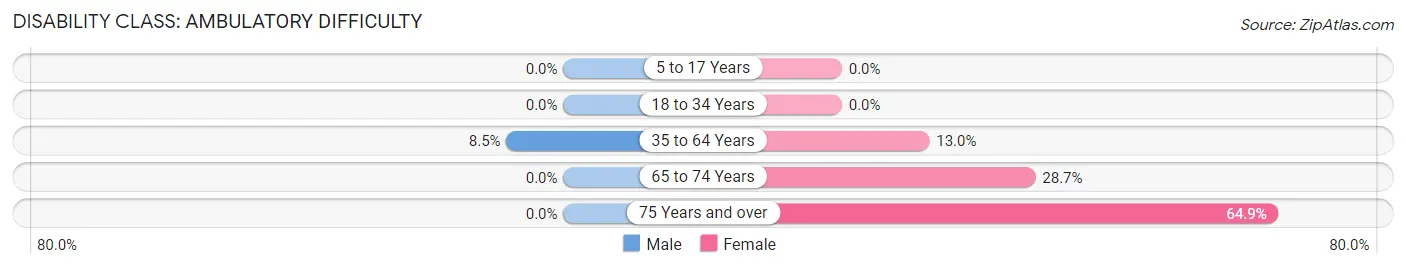
| Age Bracket | Male | Female |
| 5 to 17 Years | 0 (0.0%) | 0 (0.0%) |
| 18 to 34 Years | 0 (0.0%) | 0 (0.0%) |
| 35 to 64 Years | 12 (8.5%) | 33 (13.0%) |
| 65 to 74 Years | 0 (0.0%) | 25 (28.7%) |
| 75 Years and over | 0 (0.0%) | 48 (64.9%) |
Disability Class: Self-Care Difficulty
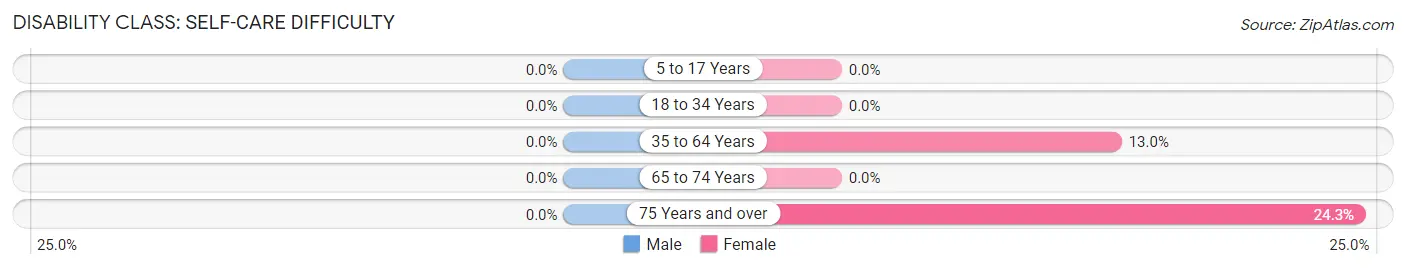
| Age Bracket | Male | Female |
| 5 to 17 Years | 0 (0.0%) | 0 (0.0%) |
| 18 to 34 Years | 0 (0.0%) | 0 (0.0%) |
| 35 to 64 Years | 0 (0.0%) | 33 (13.0%) |
| 65 to 74 Years | 0 (0.0%) | 0 (0.0%) |
| 75 Years and over | 0 (0.0%) | 18 (24.3%) |
Technology Access in Hilldale
Computing Device Access in Hilldale
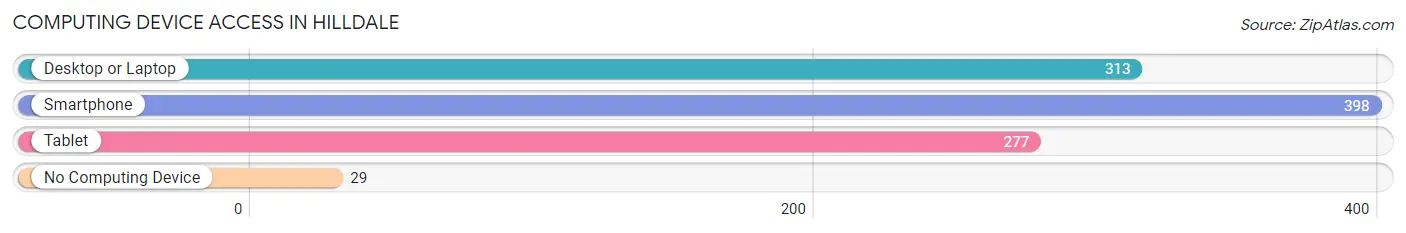
| Device Type | # Households | % Households |
| Desktop or Laptop | 313 | 71.0% |
| Smartphone | 398 | 90.2% |
| Tablet | 277 | 62.8% |
| No Computing Device | 29 | 6.6% |
| Total | 441 | 100.0% |
Internet Access in Hilldale
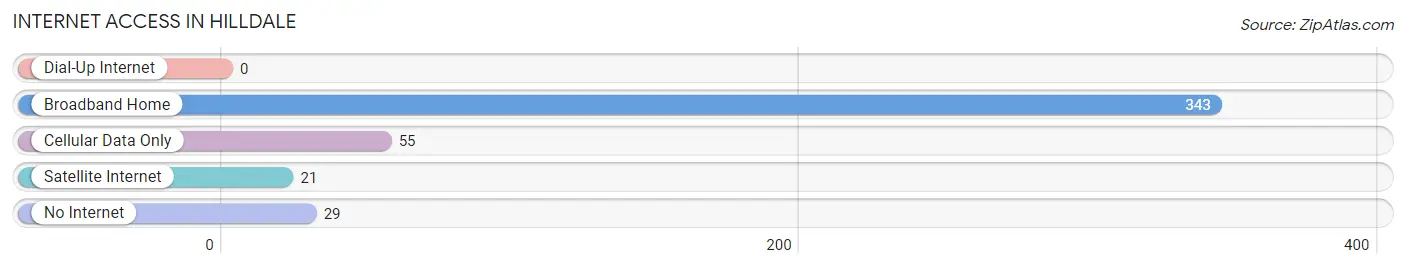
| Internet Type | # Households | % Households |
| Dial-Up Internet | 0 | 0.0% |
| Broadband Home | 343 | 77.8% |
| Cellular Data Only | 55 | 12.5% |
| Satellite Internet | 21 | 4.8% |
| No Internet | 29 | 6.6% |
| Total | 441 | 100.0% |
Hilldale Summary
Hilldale, Pennsylvania is a small borough located in the Allegheny Mountains of Pennsylvania. It is situated in the northern part of the state, about 25 miles from the state capital of Harrisburg. The borough is part of the greater Pittsburgh metropolitan area and is located in Fayette County.
History
The area that is now Hilldale was first settled in the late 1700s by German immigrants. The town was originally known as “Hillsdale” and was incorporated in 1872. The name was changed to Hilldale in 1875. The town was a small farming community until the late 1800s when the coal industry began to boom in the area. The coal industry brought jobs and economic growth to the area and Hilldale quickly became a thriving town.
In the early 1900s, Hilldale was a major hub for the coal industry. The town was home to several coal mines and the Hilldale Coal Company. The coal industry provided jobs and economic stability to the town for many years. However, the industry began to decline in the mid-1900s and the town’s economy shifted to other industries.
Geography
Hilldale is located in the Allegheny Mountains of Pennsylvania. The borough is situated in the northern part of the state, about 25 miles from the state capital of Harrisburg. The borough is part of the greater Pittsburgh metropolitan area and is located in Fayette County.
The borough is situated in a valley surrounded by hills and mountains. The terrain is mostly hilly and wooded, with some flat areas. The climate is humid continental, with cold winters and hot summers.
Economy
The economy of Hilldale is largely based on tourism and retail. The town is home to several small businesses, including restaurants, shops, and galleries. The town is also home to a few small manufacturing companies.
The town is also home to a few small farms, which produce a variety of crops, including corn, soybeans, and hay. The town is also home to a few wineries, which produce a variety of wines.
Demographics
As of the 2010 census, the population of Hilldale was 1,845. The racial makeup of the town was 97.3% White, 0.7% African American, 0.2% Native American, 0.2% Asian, 0.1% Pacific Islander, 0.7% from other races, and 0.9% from two or more races. Hispanic or Latino of any race were 1.3% of the population.
The median household income in Hilldale was $41,250, and the median family income was $50,000. The per capita income for the town was $20,845. About 8.3% of families and 10.2% of the population were below the poverty line, including 14.3% of those under age 18 and 6.2% of those age 65 or over.
Hilldale is a small town with a rich history and a vibrant economy. The town is home to a variety of businesses and industries, and is a popular tourist destination. The town is also home to a diverse population, with a variety of racial and ethnic backgrounds. Hilldale is a great place to live, work, and visit.
Common Questions
What is Per Capita Income in Hilldale?
Per Capita income in Hilldale is $40,277.
What is the Median Family Income in Hilldale?
Median Family Income in Hilldale is $105,865.
What is the Median Household income in Hilldale?
Median Household Income in Hilldale is $76,875.
What is Inequality or Gini Index in Hilldale?
Inequality or Gini Index in Hilldale is 0.35.
What is the Total Population of Hilldale?
Total Population of Hilldale is 852.
What is the Total Male Population of Hilldale?
Total Male Population of Hilldale is 348.
What is the Total Female Population of Hilldale?
Total Female Population of Hilldale is 504.
What is the Ratio of Males per 100 Females in Hilldale?
There are 69.05 Males per 100 Females in Hilldale.
What is the Ratio of Females per 100 Males in Hilldale?
There are 144.83 Females per 100 Males in Hilldale.
What is the Median Population Age in Hilldale?
Median Population Age in Hilldale is 55.4 Years.
What is the Average Family Size in Hilldale
Average Family Size in Hilldale is 2.5 People.
What is the Average Household Size in Hilldale
Average Household Size in Hilldale is 1.9 People.
How Large is the Labor Force in Hilldale?
There are 504 People in the Labor Forcein in Hilldale.
What is the Percentage of People in the Labor Force in Hilldale?
61.8% of People are in the Labor Force in Hilldale.
What is the Unemployment Rate in Hilldale?
Unemployment Rate in Hilldale is 11.3%.