Eighty Four, PA Map & Demographics
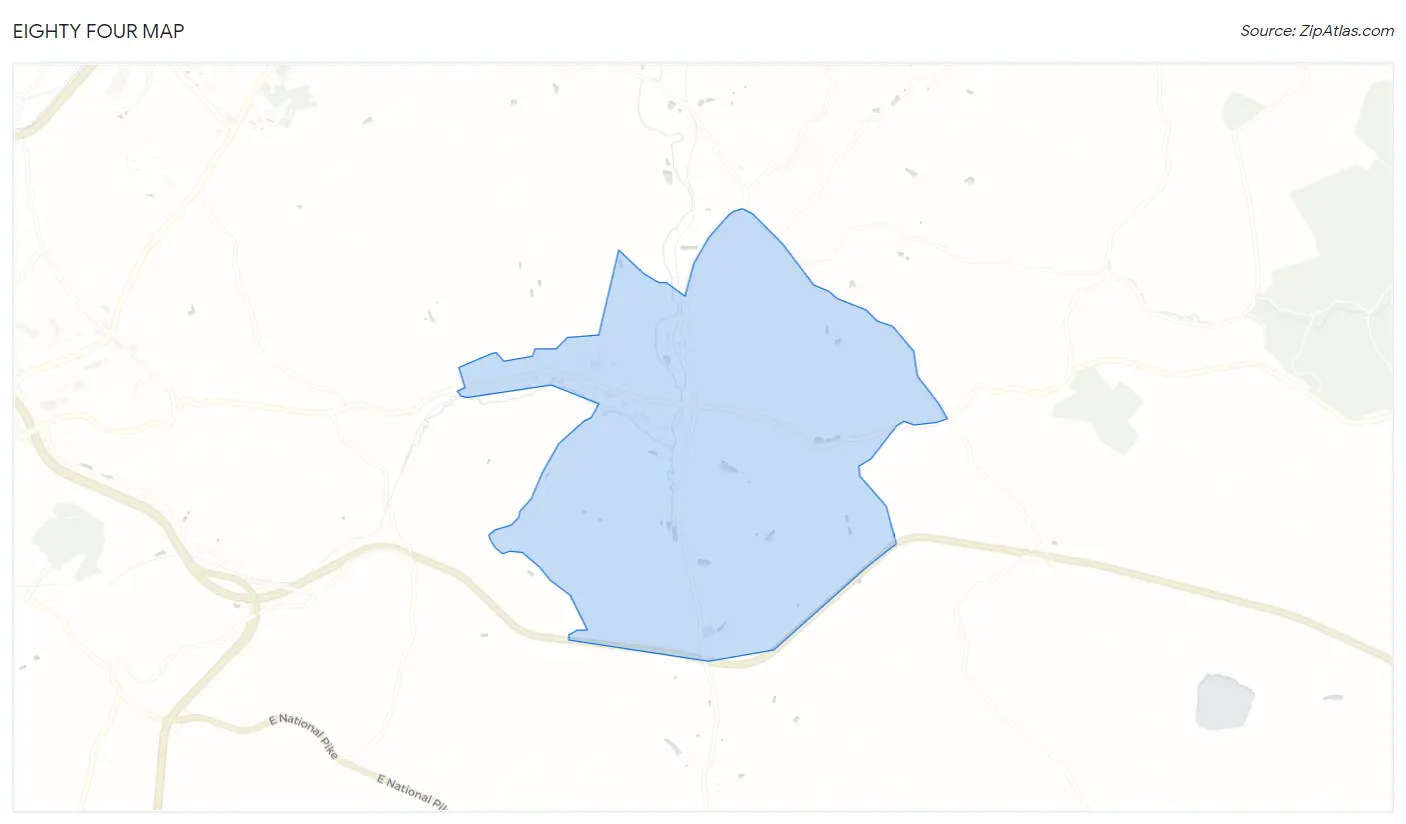
Eighty Four Map
Eighty Four Overview
$39,405
PER CAPITA INCOME
$125,215
AVG FAMILY INCOME
$110,833
AVG HOUSEHOLD INCOME
0.36
INEQUALITY / GINI INDEX
653
TOTAL POPULATION
372
MALE POPULATION
281
FEMALE POPULATION
132.38
MALES / 100 FEMALES
75.54
FEMALES / 100 MALES
51.3
MEDIAN AGE
3.1
AVG FAMILY SIZE
2.5
AVG HOUSEHOLD SIZE
269
LABOR FORCE [ PEOPLE ]
45.8%
PERCENT IN LABOR FORCE
Eighty Four Zip Codes
Eighty Four Area Codes
Income in Eighty Four
Income Overview in Eighty Four
Per Capita Income in Eighty Four is $39,405, while median incomes of families and households are $125,215 and $110,833 respectively.
| Characteristic | Number | Measure |
| Per Capita Income | 653 | $39,405 |
| Median Family Income | 185 | $125,215 |
| Mean Family Income | 185 | $108,136 |
| Median Household Income | 256 | $110,833 |
| Mean Household Income | 256 | $95,807 |
| Income Deficit | 185 | $0 |
| Wage / Income Gap (%) | 653 | 0.00% |
| Wage / Income Gap ($) | 653 | 100.00¢ per $1 |
| Gini / Inequality Index | 653 | 0.36 |
Earnings by Sex in Eighty Four
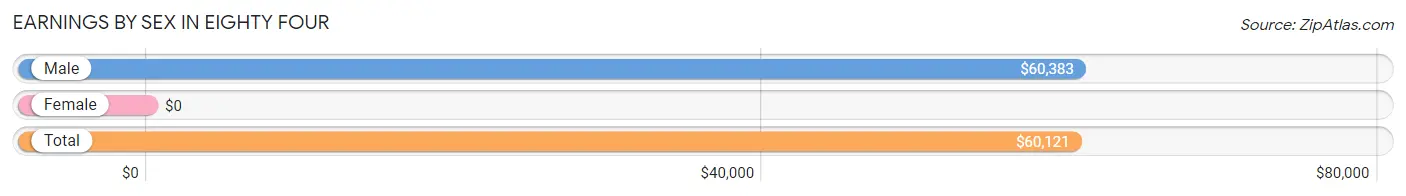
| Sex | Number | Average Earnings |
| Male | 255 (82.3%) | $60,383 |
| Female | 55 (17.7%) | $0 |
| Total | 310 (100.0%) | $60,121 |
Earnings by Sex by Income Bracket in Eighty Four
The most common earnings brackets in Eighty Four are $55,000 to $64,999 for men (113 | 44.3%) and $100,000+ for women (21 | 38.2%).
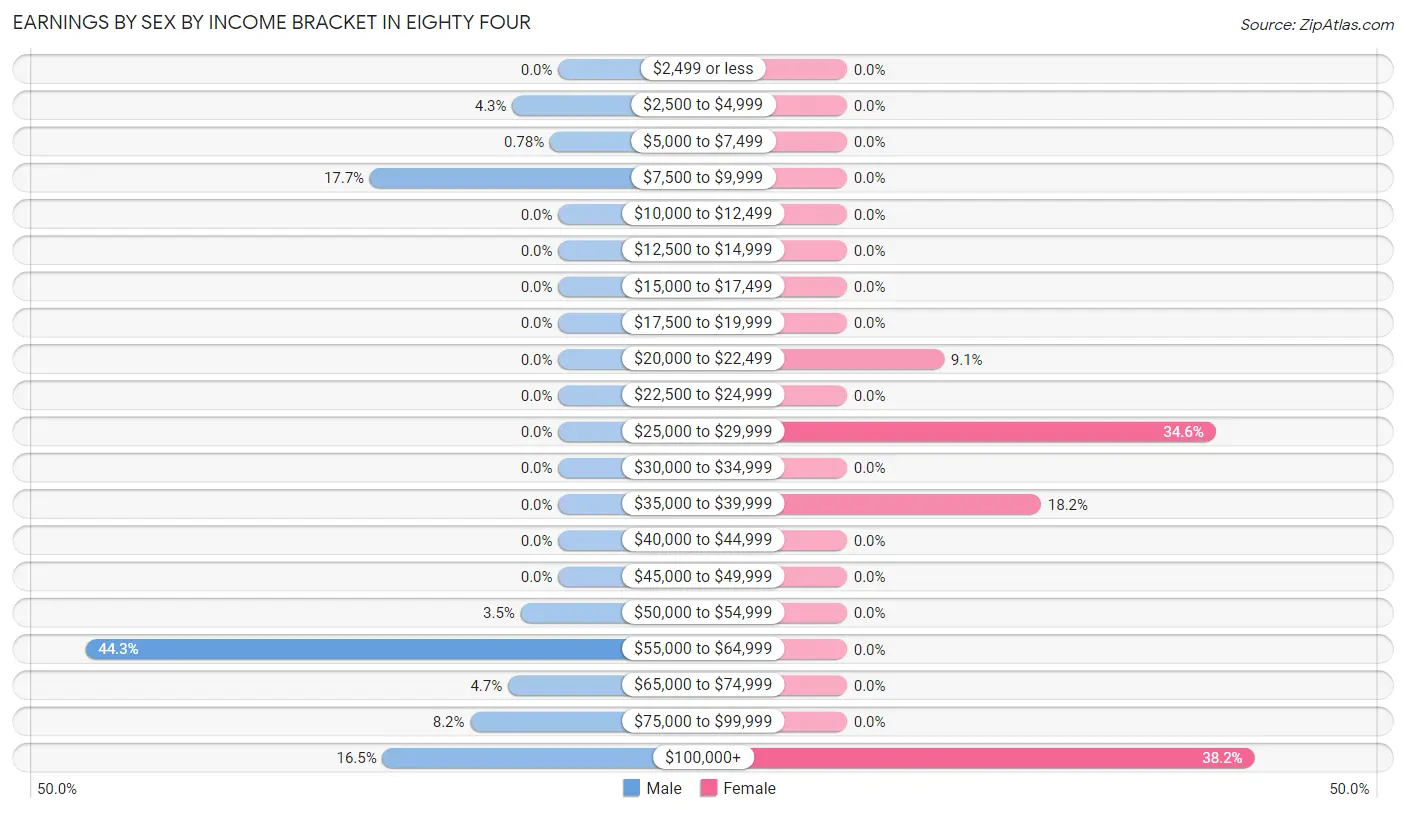
| Income | Male | Female |
| $2,499 or less | 0 (0.0%) | 0 (0.0%) |
| $2,500 to $4,999 | 11 (4.3%) | 0 (0.0%) |
| $5,000 to $7,499 | 2 (0.8%) | 0 (0.0%) |
| $7,500 to $9,999 | 45 (17.6%) | 0 (0.0%) |
| $10,000 to $12,499 | 0 (0.0%) | 0 (0.0%) |
| $12,500 to $14,999 | 0 (0.0%) | 0 (0.0%) |
| $15,000 to $17,499 | 0 (0.0%) | 0 (0.0%) |
| $17,500 to $19,999 | 0 (0.0%) | 0 (0.0%) |
| $20,000 to $22,499 | 0 (0.0%) | 5 (9.1%) |
| $22,500 to $24,999 | 0 (0.0%) | 0 (0.0%) |
| $25,000 to $29,999 | 0 (0.0%) | 19 (34.5%) |
| $30,000 to $34,999 | 0 (0.0%) | 0 (0.0%) |
| $35,000 to $39,999 | 0 (0.0%) | 10 (18.2%) |
| $40,000 to $44,999 | 0 (0.0%) | 0 (0.0%) |
| $45,000 to $49,999 | 0 (0.0%) | 0 (0.0%) |
| $50,000 to $54,999 | 9 (3.5%) | 0 (0.0%) |
| $55,000 to $64,999 | 113 (44.3%) | 0 (0.0%) |
| $65,000 to $74,999 | 12 (4.7%) | 0 (0.0%) |
| $75,000 to $99,999 | 21 (8.2%) | 0 (0.0%) |
| $100,000+ | 42 (16.5%) | 21 (38.2%) |
| Total | 255 (100.0%) | 55 (100.0%) |
Earnings by Sex by Educational Attainment in Eighty Four
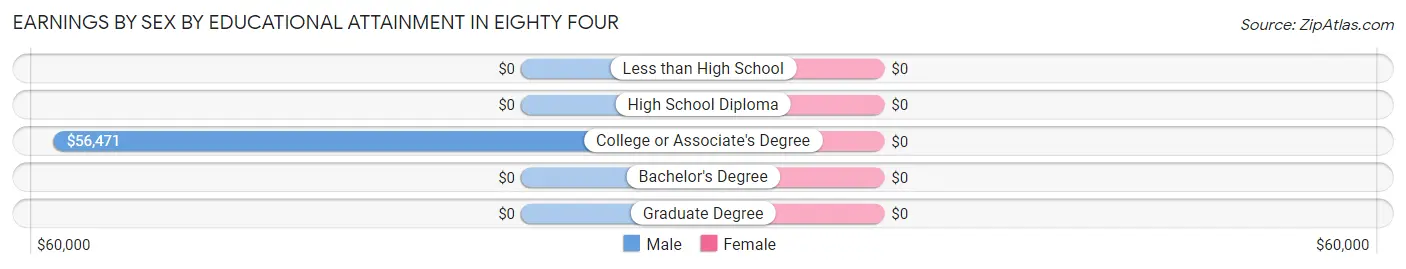
| Educational Attainment | Male Income | Female Income |
| Less than High School | - | - |
| High School Diploma | - | - |
| College or Associate's Degree | $56,471 | $0 |
| Bachelor's Degree | - | - |
| Graduate Degree | - | - |
| Total | $68,125 | $0 |
Family Income in Eighty Four
Family Income Brackets in Eighty Four
According to the Eighty Four family income data, there are 105 families falling into the $100,000 to $149,999 income range, which is the most common income bracket and makes up 56.8% of all families.
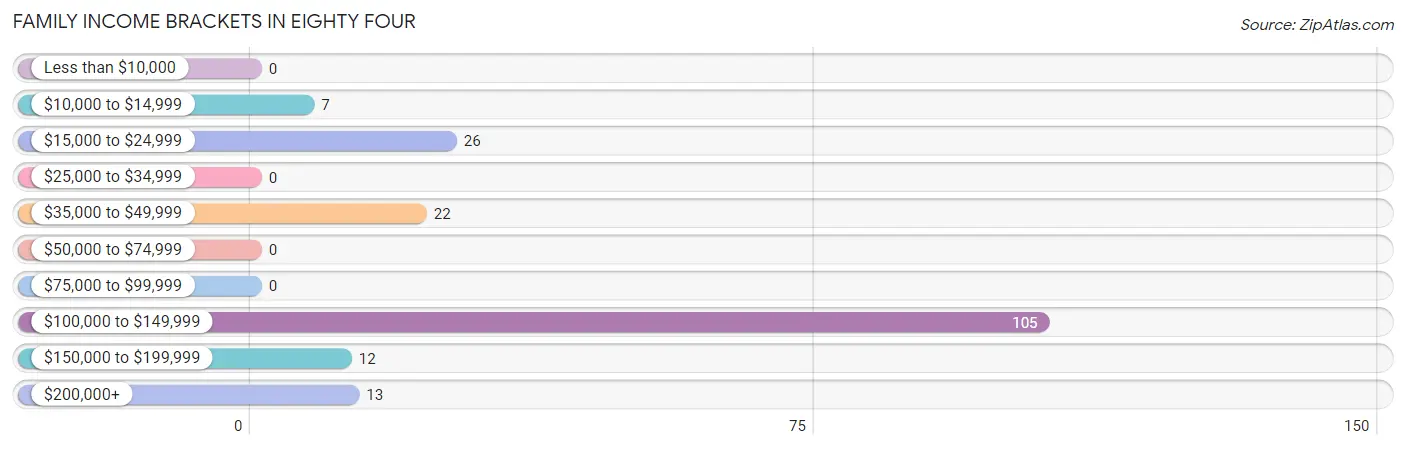
| Income Bracket | # Families | % Families |
| Less than $10,000 | 0 | 0.0% |
| $10,000 to $14,999 | 7 | 3.8% |
| $15,000 to $24,999 | 26 | 14.1% |
| $25,000 to $34,999 | 0 | 0.0% |
| $35,000 to $49,999 | 22 | 11.9% |
| $50,000 to $74,999 | 0 | 0.0% |
| $75,000 to $99,999 | 0 | 0.0% |
| $100,000 to $149,999 | 105 | 56.8% |
| $150,000 to $199,999 | 12 | 6.5% |
| $200,000+ | 13 | 7.0% |
Family Income by Famaliy Size in Eighty Four
| Income Bracket | # Families | Median Income |
| 2-Person Families | 104 (56.2%) | $0 |
| 3-Person Families | 12 (6.5%) | $0 |
| 4-Person Families | 51 (27.6%) | $0 |
| 5-Person Families | 9 (4.9%) | $0 |
| 6-Person Families | 9 (4.9%) | $0 |
| 7+ Person Families | 0 (0.0%) | $0 |
| Total | 185 (100.0%) | $125,215 |
Family Income by Number of Earners in Eighty Four
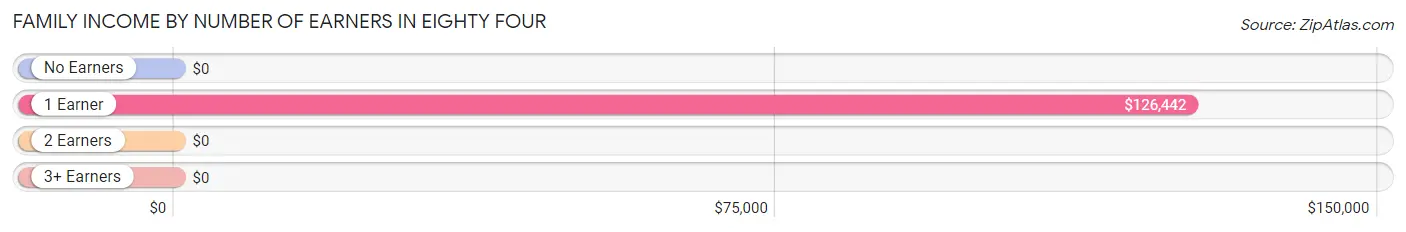
| Number of Earners | # Families | Median Income |
| No Earners | 59 (31.9%) | $0 |
| 1 Earner | 41 (22.2%) | $126,442 |
| 2 Earners | 25 (13.5%) | $0 |
| 3+ Earners | 60 (32.4%) | $0 |
| Total | 185 (100.0%) | $125,215 |
Household Income in Eighty Four
Household Income Brackets in Eighty Four
With 123 households falling in the category, the $100,000 to $149,999 income range is the most frequent in Eighty Four, accounting for 48.0% of all households.
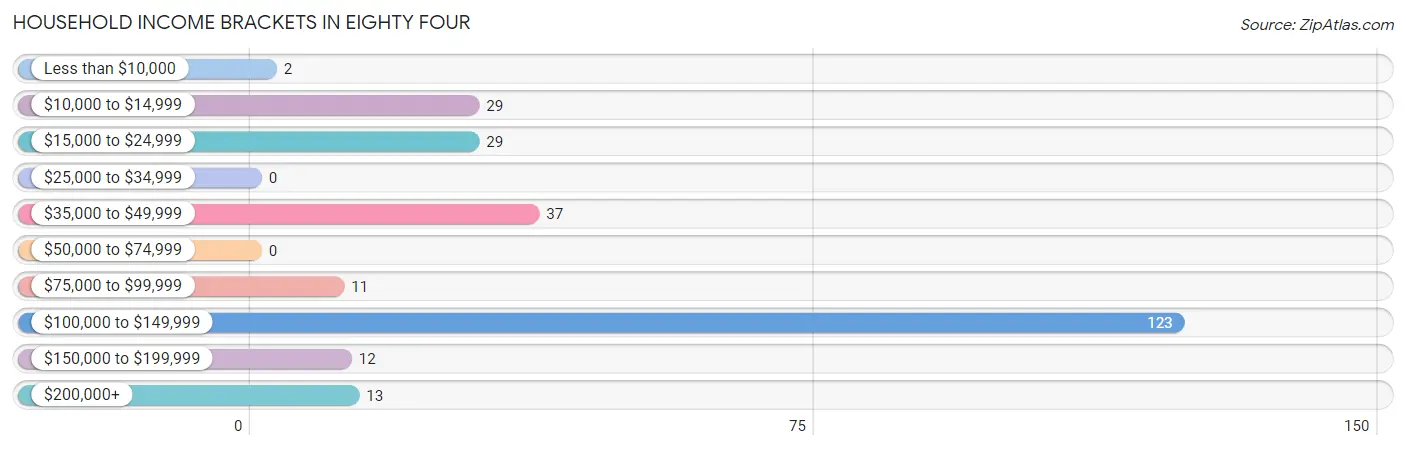
| Income Bracket | # Households | % Households |
| Less than $10,000 | 2 | 0.8% |
| $10,000 to $14,999 | 29 | 11.3% |
| $15,000 to $24,999 | 29 | 11.3% |
| $25,000 to $34,999 | 0 | 0.0% |
| $35,000 to $49,999 | 37 | 14.5% |
| $50,000 to $74,999 | 0 | 0.0% |
| $75,000 to $99,999 | 11 | 4.3% |
| $100,000 to $149,999 | 123 | 48.0% |
| $150,000 to $199,999 | 12 | 4.7% |
| $200,000+ | 13 | 5.1% |
Household Income by Householder Age in Eighty Four
The median household income in Eighty Four is $110,833, with the highest median household income of $125,254 found in the 45 to 64 years age bracket for the primary householder. A total of 139 households (54.3%) fall into this category. Meanwhile, the 15 to 24 years age bracket for the primary householder has the lowest median household income of $0, with 6 households (2.3%) in this group.
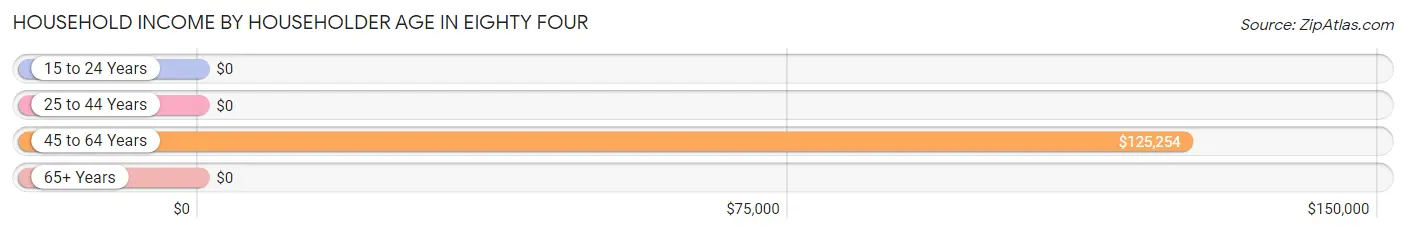
| Income Bracket | # Households | Median Income |
| 15 to 24 Years | 6 (2.3%) | $0 |
| 25 to 44 Years | 18 (7.0%) | $0 |
| 45 to 64 Years | 139 (54.3%) | $125,254 |
| 65+ Years | 93 (36.3%) | $0 |
| Total | 256 (100.0%) | $110,833 |
Poverty in Eighty Four
Income Below Poverty by Sex and Age in Eighty Four
With 8.6% poverty level for males and 2.5% for females among the residents of Eighty Four, 65 to 74 year old males and 45 to 54 year old females are the most vulnerable to poverty, with 13 males (17.8%) and 7 females (7.4%) in their respective age groups living below the poverty level.
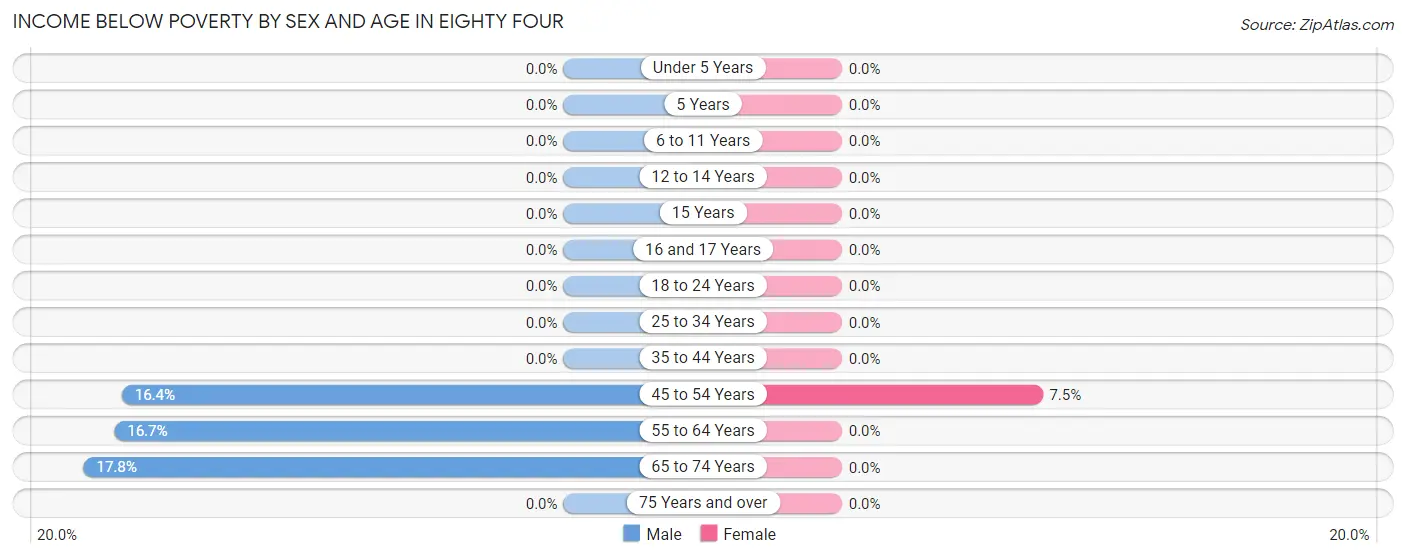
| Age Bracket | Male | Female |
| Under 5 Years | 0 (0.0%) | 0 (0.0%) |
| 5 Years | 0 (0.0%) | 0 (0.0%) |
| 6 to 11 Years | 0 (0.0%) | 0 (0.0%) |
| 12 to 14 Years | 0 (0.0%) | 0 (0.0%) |
| 15 Years | 0 (0.0%) | 0 (0.0%) |
| 16 and 17 Years | 0 (0.0%) | 0 (0.0%) |
| 18 to 24 Years | 0 (0.0%) | 0 (0.0%) |
| 25 to 34 Years | 0 (0.0%) | 0 (0.0%) |
| 35 to 44 Years | 0 (0.0%) | 0 (0.0%) |
| 45 to 54 Years | 10 (16.4%) | 7 (7.4%) |
| 55 to 64 Years | 9 (16.7%) | 0 (0.0%) |
| 65 to 74 Years | 13 (17.8%) | 0 (0.0%) |
| 75 Years and over | 0 (0.0%) | 0 (0.0%) |
| Total | 32 (8.6%) | 7 (2.5%) |
Income Above Poverty by Sex and Age in Eighty Four
According to the poverty statistics in Eighty Four, males aged 6 to 11 years and females aged 6 to 11 years are the age groups that are most secure financially, with 100.0% of males and 100.0% of females in these age groups living above the poverty line.
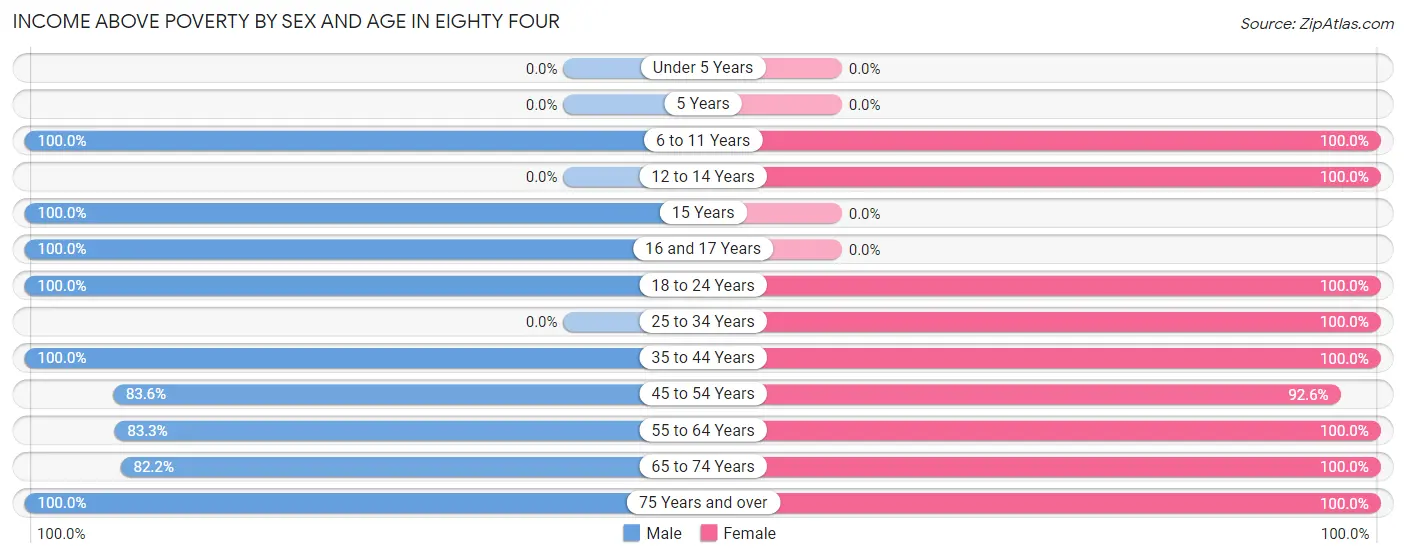
| Age Bracket | Male | Female |
| Under 5 Years | 0 (0.0%) | 0 (0.0%) |
| 5 Years | 0 (0.0%) | 0 (0.0%) |
| 6 to 11 Years | 19 (100.0%) | 19 (100.0%) |
| 12 to 14 Years | 0 (0.0%) | 19 (100.0%) |
| 15 Years | 9 (100.0%) | 0 (0.0%) |
| 16 and 17 Years | 11 (100.0%) | 0 (0.0%) |
| 18 to 24 Years | 109 (100.0%) | 5 (100.0%) |
| 25 to 34 Years | 0 (0.0%) | 28 (100.0%) |
| 35 to 44 Years | 19 (100.0%) | 23 (100.0%) |
| 45 to 54 Years | 51 (83.6%) | 87 (92.5%) |
| 55 to 64 Years | 45 (83.3%) | 32 (100.0%) |
| 65 to 74 Years | 60 (82.2%) | 22 (100.0%) |
| 75 Years and over | 17 (100.0%) | 39 (100.0%) |
| Total | 340 (91.4%) | 274 (97.5%) |
Income Below Poverty Among Married-Couple Families in Eighty Four
The poverty statistics for married-couple families in Eighty Four show that 4.5% or 7 of the total 154 families live below the poverty line. Families with no children have the highest poverty rate of 5.4%, comprising of 7 families. On the other hand, families with 1 or 2 children have the lowest poverty rate of 0.0%, which includes 0 families.
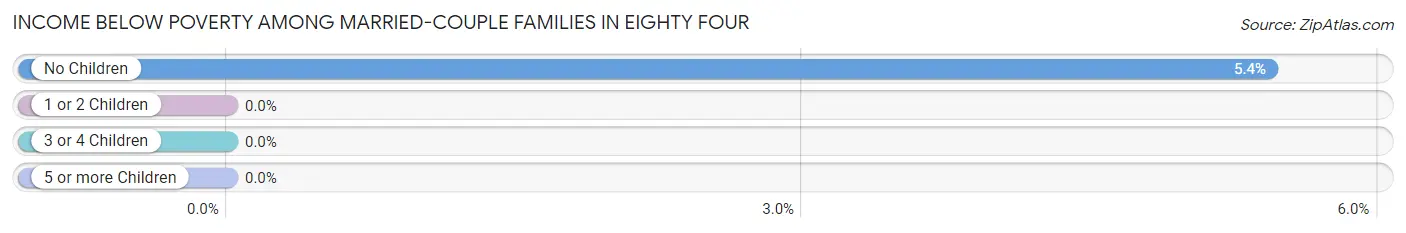
| Children | Above Poverty | Below Poverty |
| No Children | 122 (94.6%) | 7 (5.4%) |
| 1 or 2 Children | 7 (100.0%) | 0 (0.0%) |
| 3 or 4 Children | 18 (100.0%) | 0 (0.0%) |
| 5 or more Children | 0 (0.0%) | 0 (0.0%) |
| Total | 147 (95.5%) | 7 (4.5%) |
Income Below Poverty Among Single-Parent Households in Eighty Four
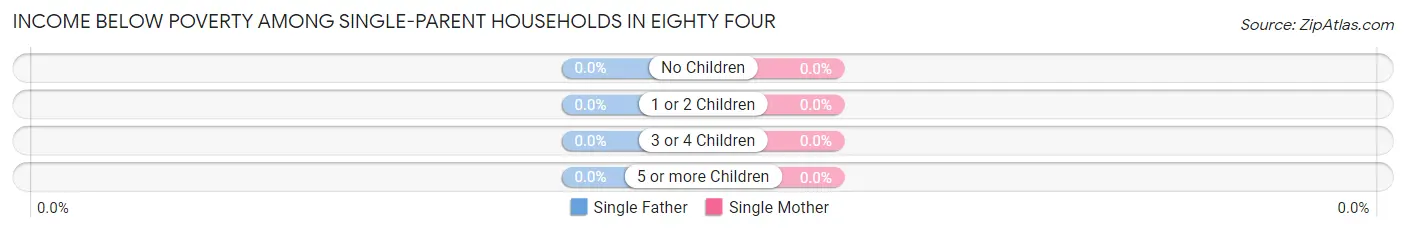
| Children | Single Father | Single Mother |
| No Children | 0 (0.0%) | 0 (0.0%) |
| 1 or 2 Children | 0 (0.0%) | 0 (0.0%) |
| 3 or 4 Children | 0 (0.0%) | 0 (0.0%) |
| 5 or more Children | 0 (0.0%) | 0 (0.0%) |
| Total | 0 (0.0%) | 0 (0.0%) |
Income Below Poverty Among Married-Couple vs Single-Parent Households in Eighty Four
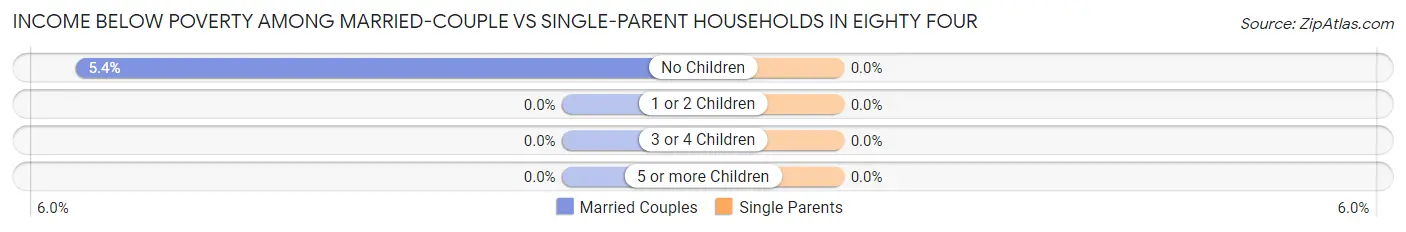
| Children | Married-Couple Families | Single-Parent Households |
| No Children | 7 (5.4%) | 0 (0.0%) |
| 1 or 2 Children | 0 (0.0%) | 0 (0.0%) |
| 3 or 4 Children | 0 (0.0%) | 0 (0.0%) |
| 5 or more Children | 0 (0.0%) | 0 (0.0%) |
| Total | 7 (4.5%) | 0 (0.0%) |
Race in Eighty Four
The most populous races in Eighty Four are White / Caucasian (647 | 99.1%), and Two or more Races (6 | 0.9%).
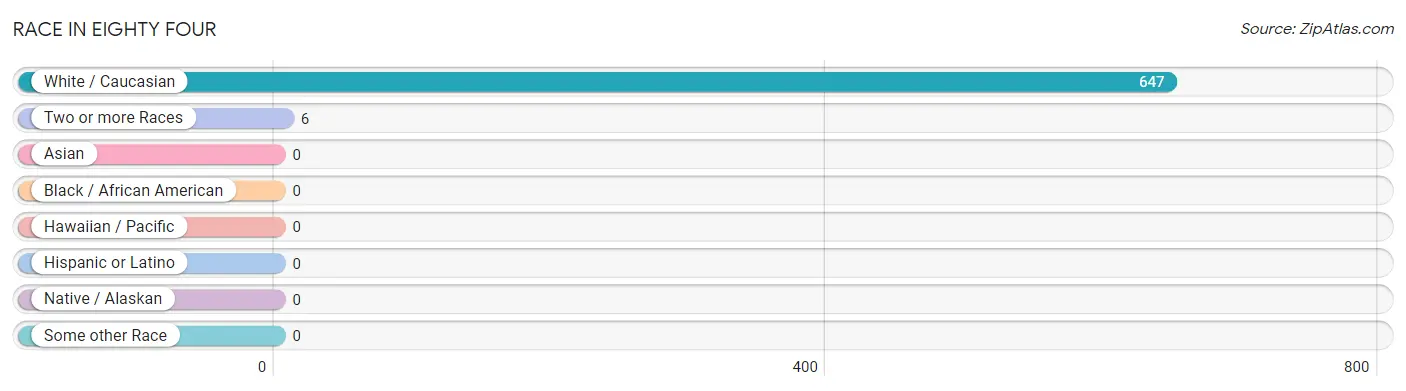
| Race | # Population | % Population |
| Asian | 0 | 0.0% |
| Black / African American | 0 | 0.0% |
| Hawaiian / Pacific | 0 | 0.0% |
| Hispanic or Latino | 0 | 0.0% |
| Native / Alaskan | 0 | 0.0% |
| White / Caucasian | 647 | 99.1% |
| Two or more Races | 6 | 0.9% |
| Some other Race | 0 | 0.0% |
| Total | 653 | 100.0% |
Ancestry in Eighty Four
The most populous ancestries reported in Eighty Four are German (254 | 38.9%), Irish (196 | 30.0%), Croatian (53 | 8.1%), English (51 | 7.8%), and Italian (35 | 5.4%), together accounting for 90.2% of all Eighty Four residents.
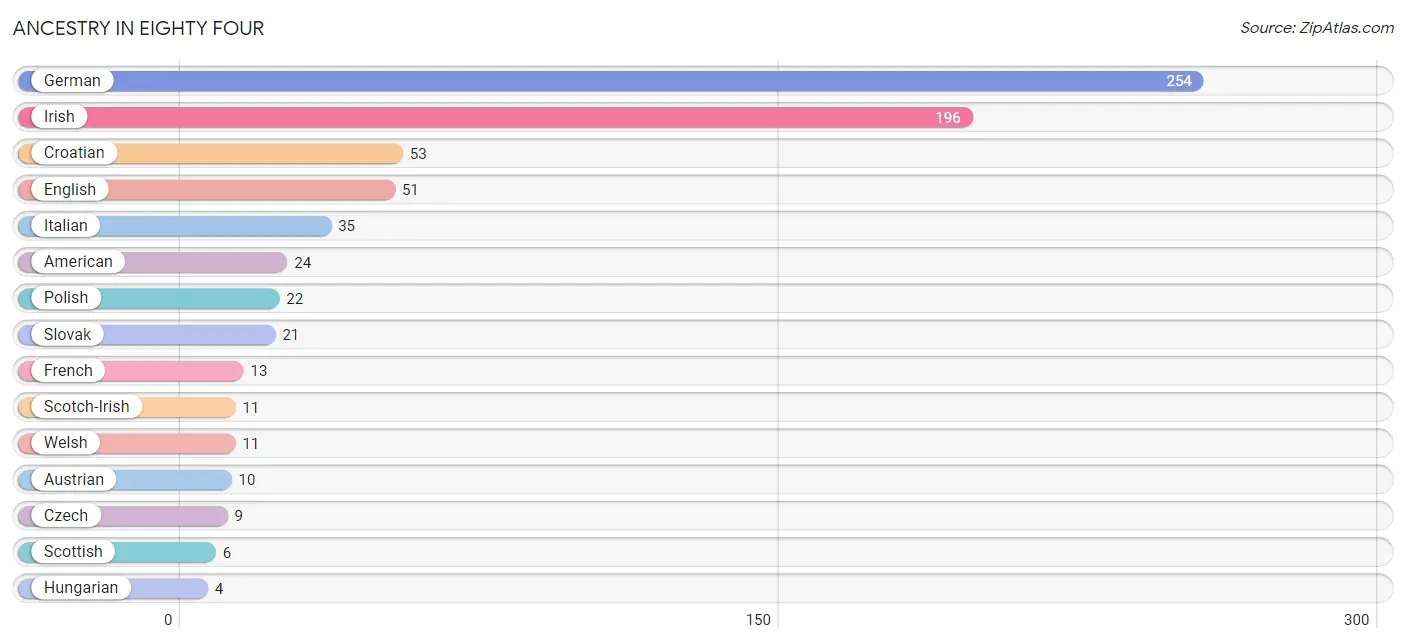
| Ancestry | # Population | % Population |
| American | 24 | 3.7% |
| Austrian | 10 | 1.5% |
| Croatian | 53 | 8.1% |
| Czech | 9 | 1.4% |
| English | 51 | 7.8% |
| French | 13 | 2.0% |
| German | 254 | 38.9% |
| Hungarian | 4 | 0.6% |
| Irish | 196 | 30.0% |
| Italian | 35 | 5.4% |
| Polish | 22 | 3.4% |
| Scotch-Irish | 11 | 1.7% |
| Scottish | 6 | 0.9% |
| Slovak | 21 | 3.2% |
| Welsh | 11 | 1.7% | View All 15 Rows |
Immigrants in Eighty Four

| Immigration Origin | # Population | % Population | View All 0 Rows |
Sex and Age in Eighty Four
Sex and Age in Eighty Four
The most populous age groups in Eighty Four are 20 to 24 Years (68 | 18.3%) for men and 50 to 54 Years (62 | 22.1%) for women.
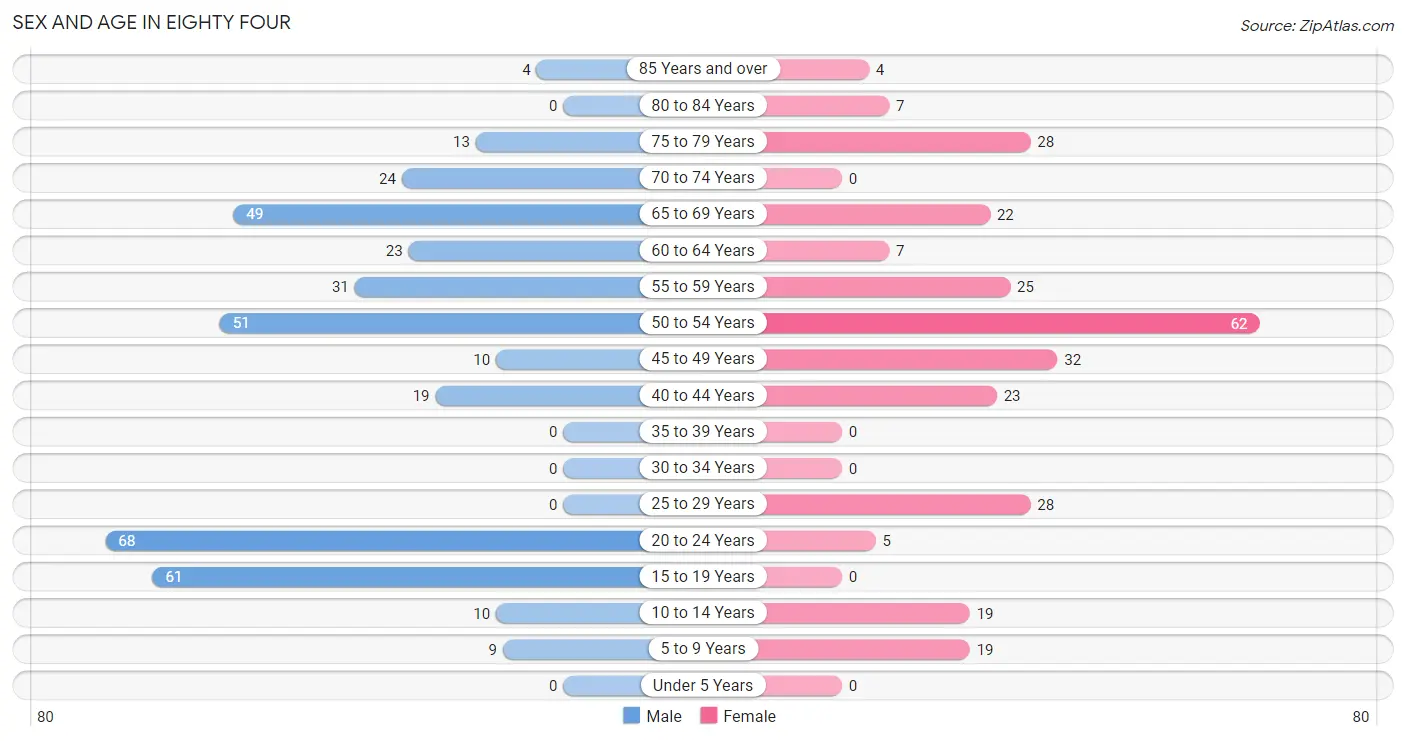
| Age Bracket | Male | Female |
| Under 5 Years | 0 (0.0%) | 0 (0.0%) |
| 5 to 9 Years | 9 (2.4%) | 19 (6.8%) |
| 10 to 14 Years | 10 (2.7%) | 19 (6.8%) |
| 15 to 19 Years | 61 (16.4%) | 0 (0.0%) |
| 20 to 24 Years | 68 (18.3%) | 5 (1.8%) |
| 25 to 29 Years | 0 (0.0%) | 28 (10.0%) |
| 30 to 34 Years | 0 (0.0%) | 0 (0.0%) |
| 35 to 39 Years | 0 (0.0%) | 0 (0.0%) |
| 40 to 44 Years | 19 (5.1%) | 23 (8.2%) |
| 45 to 49 Years | 10 (2.7%) | 32 (11.4%) |
| 50 to 54 Years | 51 (13.7%) | 62 (22.1%) |
| 55 to 59 Years | 31 (8.3%) | 25 (8.9%) |
| 60 to 64 Years | 23 (6.2%) | 7 (2.5%) |
| 65 to 69 Years | 49 (13.2%) | 22 (7.8%) |
| 70 to 74 Years | 24 (6.5%) | 0 (0.0%) |
| 75 to 79 Years | 13 (3.5%) | 28 (10.0%) |
| 80 to 84 Years | 0 (0.0%) | 7 (2.5%) |
| 85 Years and over | 4 (1.1%) | 4 (1.4%) |
| Total | 372 (100.0%) | 281 (100.0%) |
Families and Households in Eighty Four
Median Family Size in Eighty Four
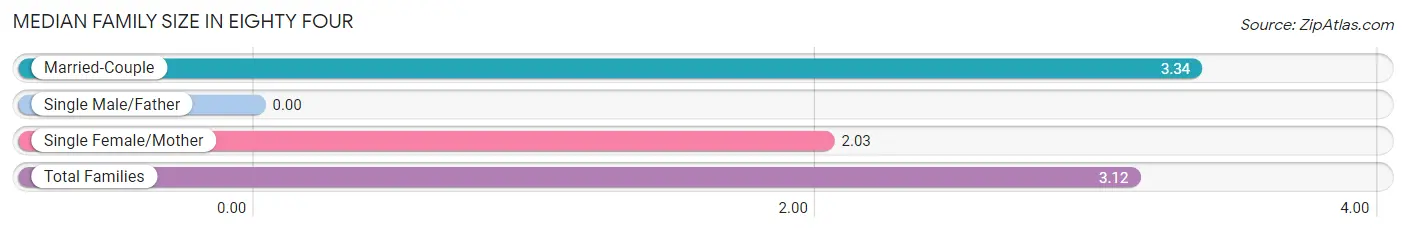
| Family Type | # Families | Family Size |
| Married-Couple | 154 (83.2%) | 3.34 |
| Single Male/Father | 0 (0.0%) | - |
| Single Female/Mother | 31 (16.8%) | 2.03 |
| Total Families | 185 (100.0%) | 3.12 |
Median Household Size in Eighty Four
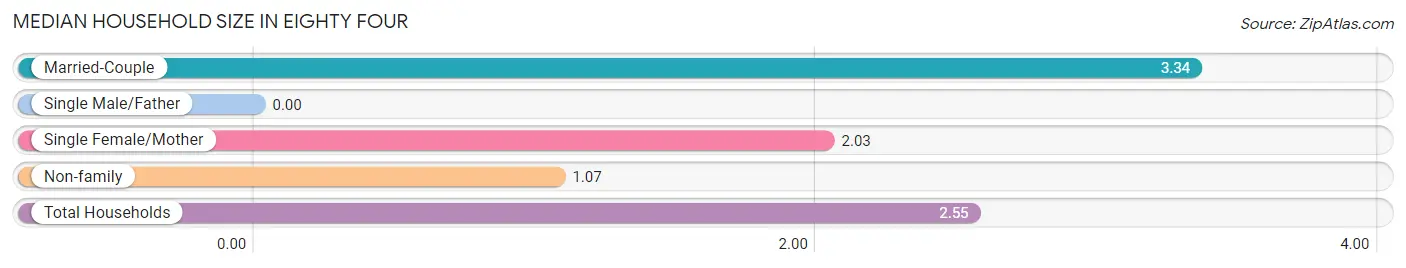
| Household Type | # Households | Household Size |
| Married-Couple | 154 (60.2%) | 3.34 |
| Single Male/Father | 0 (0.0%) | - |
| Single Female/Mother | 31 (12.1%) | 2.03 |
| Non-family | 71 (27.7%) | 1.07 |
| Total Households | 256 (100.0%) | 2.55 |
Household Size by Marriage Status in Eighty Four
Out of a total of 256 households in Eighty Four, 185 (72.3%) are family households, while 71 (27.7%) are nonfamily households. The most numerous type of family households are 2-person households, comprising 104, and the most common type of nonfamily households are 1-person households, comprising 65.
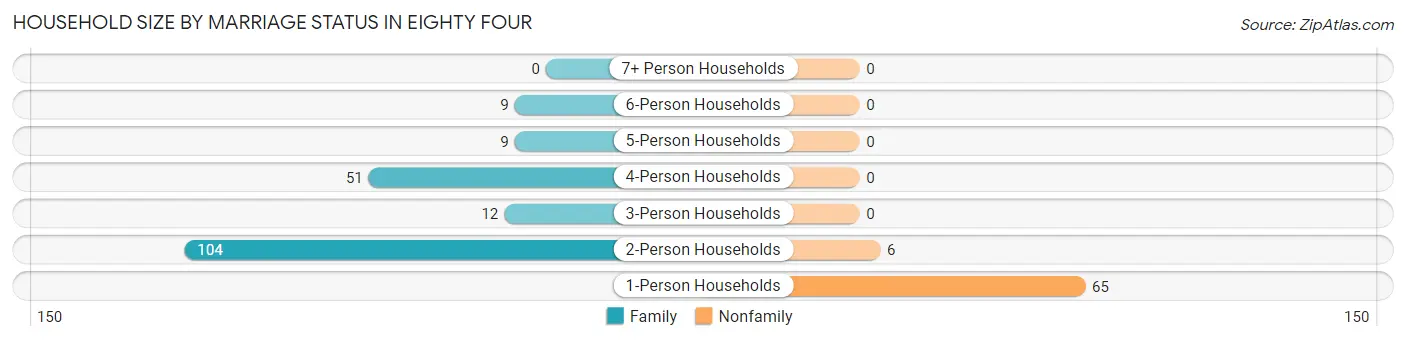
| Household Size | Family Households | Nonfamily Households |
| 1-Person Households | - | 65 (25.4%) |
| 2-Person Households | 104 (40.6%) | 6 (2.3%) |
| 3-Person Households | 12 (4.7%) | 0 (0.0%) |
| 4-Person Households | 51 (19.9%) | 0 (0.0%) |
| 5-Person Households | 9 (3.5%) | 0 (0.0%) |
| 6-Person Households | 9 (3.5%) | 0 (0.0%) |
| 7+ Person Households | 0 (0.0%) | 0 (0.0%) |
| Total | 185 (72.3%) | 71 (27.7%) |
Female Fertility in Eighty Four
Fertility by Age in Eighty Four
| Age Bracket | Women with Births | Births / 1,000 Women |
| 15 to 19 years | 0 (0.0%) | 0.0 |
| 20 to 34 years | 0 (0.0%) | 0.0 |
| 35 to 50 years | 0 (0.0%) | 0.0 |
| Total | 0 (0.0%) | 0.0 |
Fertility by Age by Marriage Status in Eighty Four
| Age Bracket | Married | Unmarried |
| 15 to 19 years | 0 (0.0%) | 0 (0.0%) |
| 20 to 34 years | 0 (0.0%) | 0 (0.0%) |
| 35 to 50 years | 0 (0.0%) | 0 (0.0%) |
| Total | 0 (0.0%) | 0 (0.0%) |
Fertility by Education in Eighty Four
| Educational Attainment | Women with Births | Births / 1,000 Women |
| Less than High School | 0 (0.0%) | 0.0 |
| High School Diploma | 0 (0.0%) | 0.0 |
| College or Associate's Degree | 0 (0.0%) | 0.0 |
| Bachelor's Degree | 0 (0.0%) | 0.0 |
| Graduate Degree | 0 (0.0%) | 0.0 |
| Total | 0 (0.0%) | 0.0 |
Fertility by Education by Marriage Status in Eighty Four
| Educational Attainment | Married | Unmarried |
| Less than High School | 0 (0.0%) | 0 (0.0%) |
| High School Diploma | 0 (0.0%) | 0 (0.0%) |
| College or Associate's Degree | 0 (0.0%) | 0 (0.0%) |
| Bachelor's Degree | 0 (0.0%) | 0 (0.0%) |
| Graduate Degree | 0 (0.0%) | 0 (0.0%) |
| Total | 0 (0.0%) | 0 (0.0%) |
Employment Characteristics in Eighty Four
Employment by Class of Employer in Eighty Four
Among the 269 employed individuals in Eighty Four, private company employees (198 | 73.6%), self-employed (incorporated) (57 | 21.2%), and not-for-profit organizations (12 | 4.5%) make up the most common classes of employment.
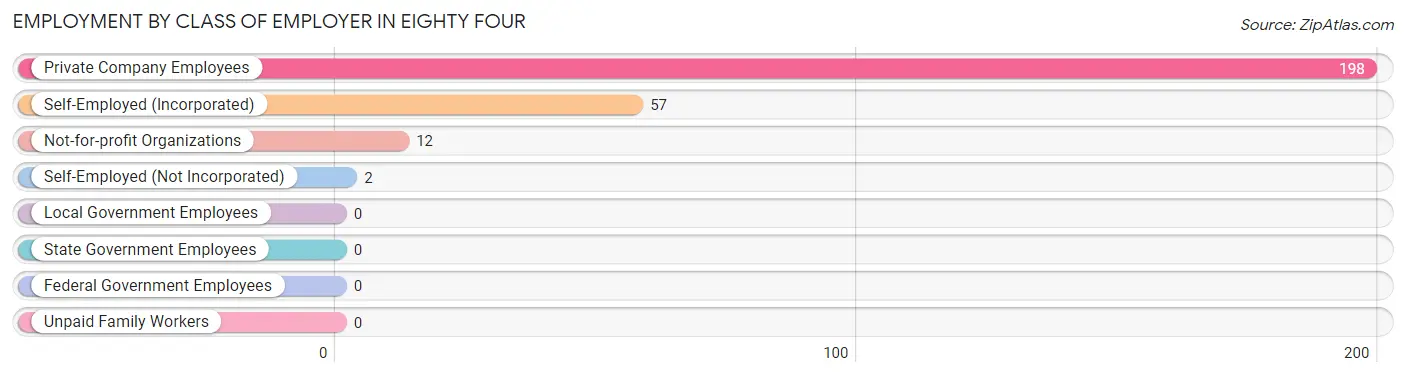
| Employer Class | # Employees | % Employees |
| Private Company Employees | 198 | 73.6% |
| Self-Employed (Incorporated) | 57 | 21.2% |
| Self-Employed (Not Incorporated) | 2 | 0.7% |
| Not-for-profit Organizations | 12 | 4.5% |
| Local Government Employees | 0 | 0.0% |
| State Government Employees | 0 | 0.0% |
| Federal Government Employees | 0 | 0.0% |
| Unpaid Family Workers | 0 | 0.0% |
| Total | 269 | 100.0% |
Employment Status by Age in Eighty Four
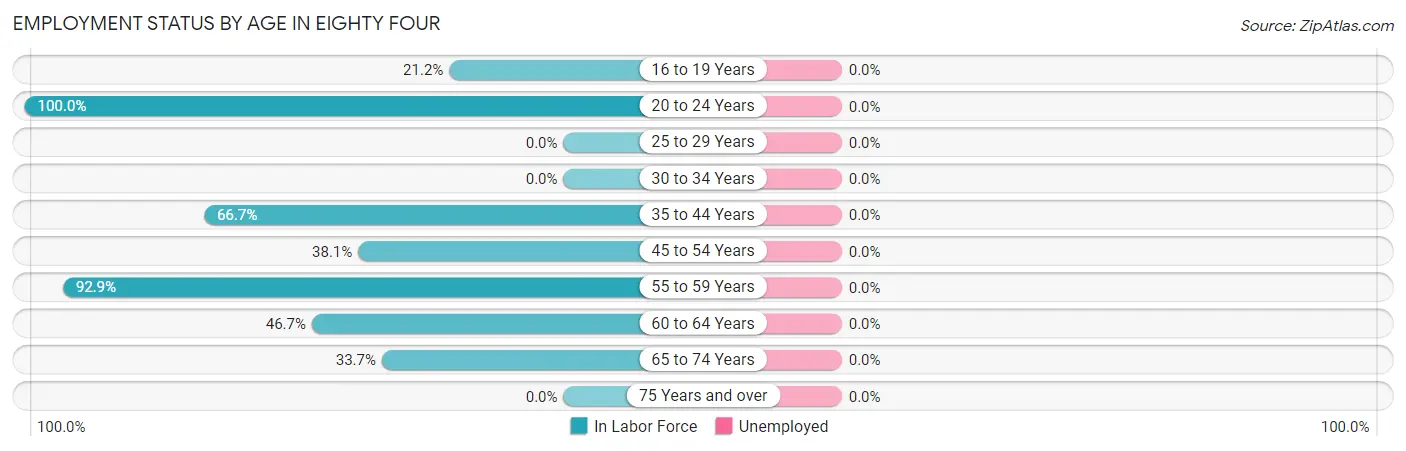
| Age Bracket | In Labor Force | Unemployed |
| 16 to 19 Years | 11 (21.2%) | 0 (0.0%) |
| 20 to 24 Years | 73 (100.0%) | 0 (0.0%) |
| 25 to 29 Years | 0 (0.0%) | 0 (0.0%) |
| 30 to 34 Years | 0 (0.0%) | 0 (0.0%) |
| 35 to 44 Years | 28 (66.7%) | 0 (0.0%) |
| 45 to 54 Years | 59 (38.1%) | 0 (0.0%) |
| 55 to 59 Years | 52 (92.9%) | 0 (0.0%) |
| 60 to 64 Years | 14 (46.7%) | 0 (0.0%) |
| 65 to 74 Years | 32 (33.7%) | 0 (0.0%) |
| 75 Years and over | 0 (0.0%) | 0 (0.0%) |
| Total | 269 (45.8%) | 0 (0.0%) |
Employment Status by Educational Attainment in Eighty Four
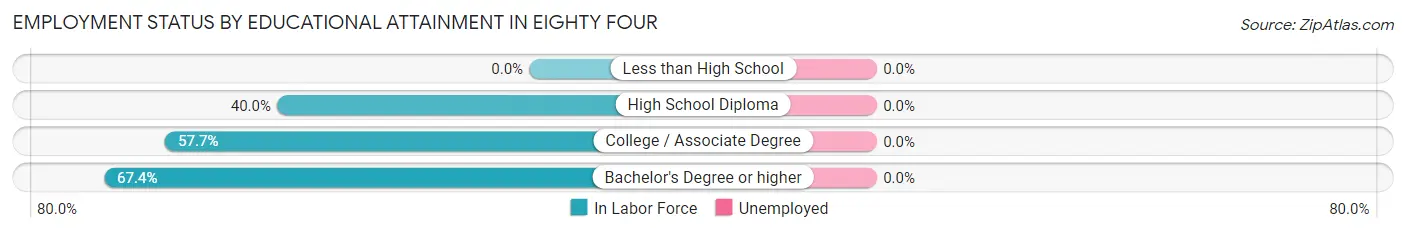
| Educational Attainment | In Labor Force | Unemployed |
| Less than High School | 0 (0.0%) | 0 (0.0%) |
| High School Diploma | 40 (40.0%) | 0 (0.0%) |
| College / Associate Degree | 82 (57.7%) | 0 (0.0%) |
| Bachelor's Degree or higher | 31 (67.4%) | 0 (0.0%) |
| Total | 153 (49.2%) | 0 (0.0%) |
Employment Occupations by Sex in Eighty Four
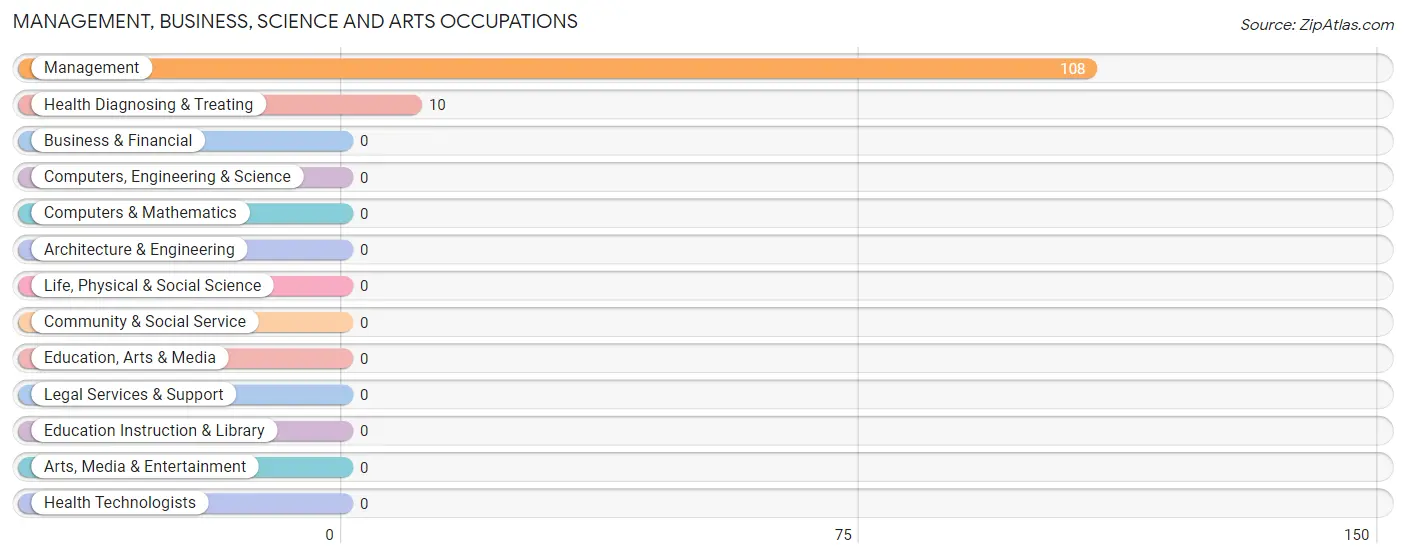
Management, Business, Science and Arts Occupations
The most common Management, Business, Science and Arts occupations in Eighty Four are Management (108 | 40.2%), and Health Diagnosing & Treating (10 | 3.7%).
Management, Business, Science and Arts Occupations by Sex
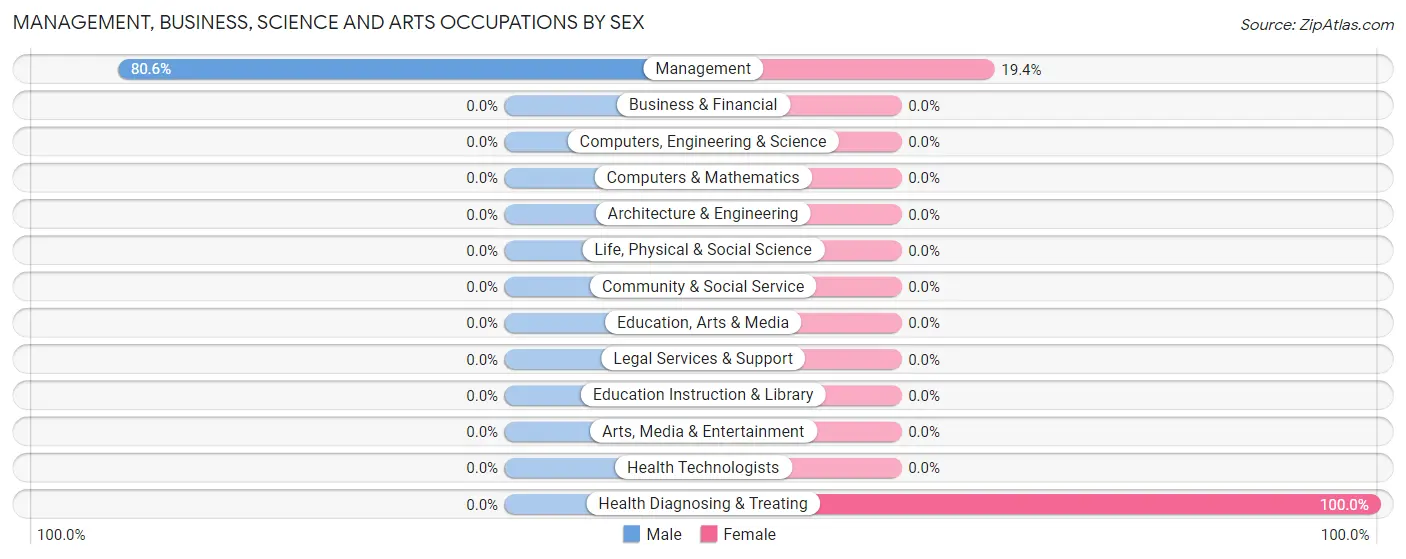
| Occupation | Male | Female |
| Management | 87 (80.6%) | 21 (19.4%) |
| Business & Financial | 0 (0.0%) | 0 (0.0%) |
| Computers, Engineering & Science | 0 (0.0%) | 0 (0.0%) |
| Computers & Mathematics | 0 (0.0%) | 0 (0.0%) |
| Architecture & Engineering | 0 (0.0%) | 0 (0.0%) |
| Life, Physical & Social Science | 0 (0.0%) | 0 (0.0%) |
| Community & Social Service | 0 (0.0%) | 0 (0.0%) |
| Education, Arts & Media | 0 (0.0%) | 0 (0.0%) |
| Legal Services & Support | 0 (0.0%) | 0 (0.0%) |
| Education Instruction & Library | 0 (0.0%) | 0 (0.0%) |
| Arts, Media & Entertainment | 0 (0.0%) | 0 (0.0%) |
| Health Diagnosing & Treating | 0 (0.0%) | 10 (100.0%) |
| Health Technologists | 0 (0.0%) | 0 (0.0%) |
| Total (Category) | 87 (73.7%) | 31 (26.3%) |
| Total (Overall) | 214 (79.5%) | 55 (20.4%) |
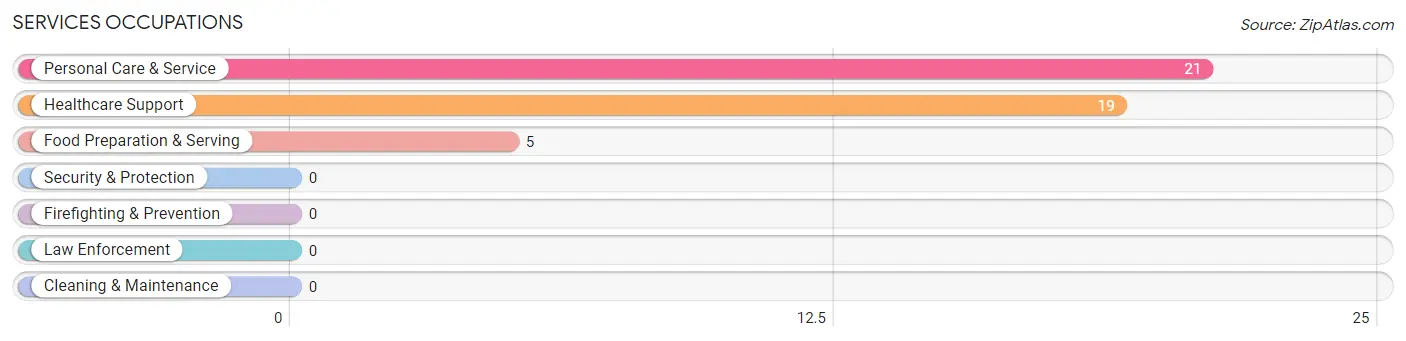
Services Occupations
The most common Services occupations in Eighty Four are Personal Care & Service (21 | 7.8%), Healthcare Support (19 | 7.1%), and Food Preparation & Serving (5 | 1.9%).
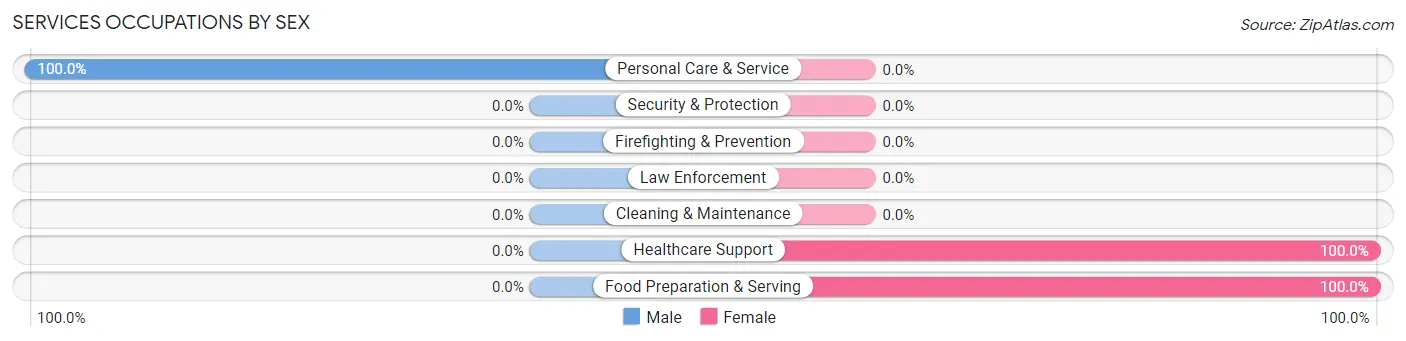
Services Occupations by Sex
| Occupation | Male | Female |
| Healthcare Support | 0 (0.0%) | 19 (100.0%) |
| Security & Protection | 0 (0.0%) | 0 (0.0%) |
| Firefighting & Prevention | 0 (0.0%) | 0 (0.0%) |
| Law Enforcement | 0 (0.0%) | 0 (0.0%) |
| Food Preparation & Serving | 0 (0.0%) | 5 (100.0%) |
| Cleaning & Maintenance | 0 (0.0%) | 0 (0.0%) |
| Personal Care & Service | 21 (100.0%) | 0 (0.0%) |
| Total (Category) | 21 (46.7%) | 24 (53.3%) |
| Total (Overall) | 214 (79.5%) | 55 (20.4%) |
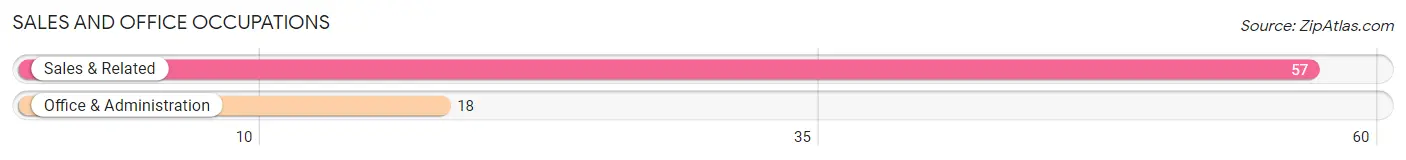
Sales and Office Occupations
The most common Sales and Office occupations in Eighty Four are Sales & Related (57 | 21.2%), and Office & Administration (18 | 6.7%).
Sales and Office Occupations by Sex
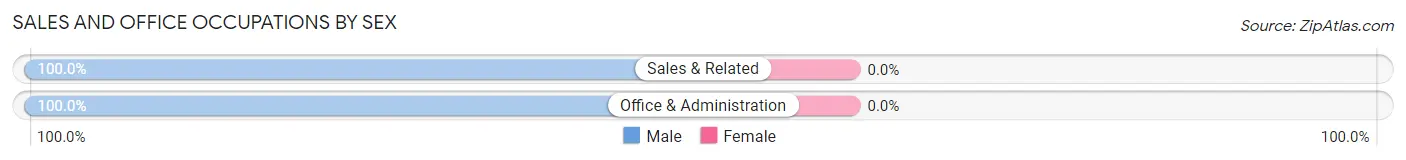
| Occupation | Male | Female |
| Sales & Related | 57 (100.0%) | 0 (0.0%) |
| Office & Administration | 18 (100.0%) | 0 (0.0%) |
| Total (Category) | 75 (100.0%) | 0 (0.0%) |
| Total (Overall) | 214 (79.5%) | 55 (20.4%) |
Natural Resources, Construction and Maintenance Occupations
The most common Natural Resources, Construction and Maintenance occupations in Eighty Four are , and Construction & Extraction (10 | 3.7%).
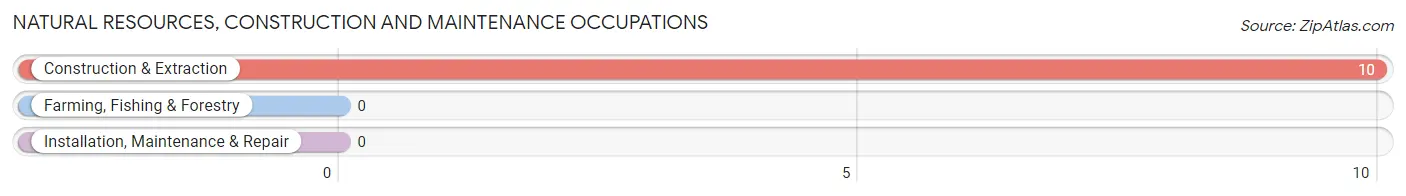
Natural Resources, Construction and Maintenance Occupations by Sex
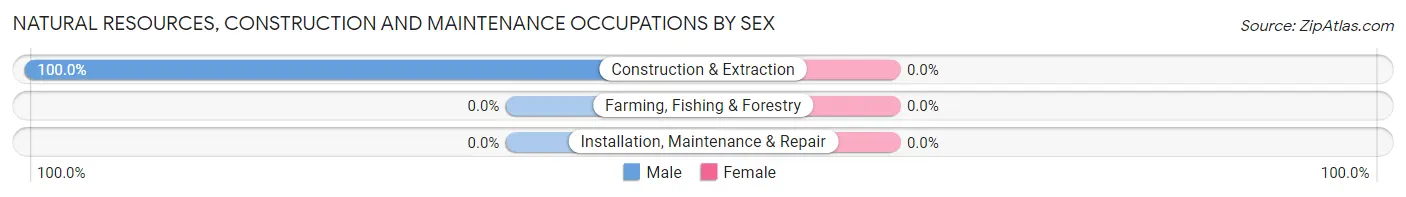
| Occupation | Male | Female |
| Farming, Fishing & Forestry | 0 (0.0%) | 0 (0.0%) |
| Construction & Extraction | 10 (100.0%) | 0 (0.0%) |
| Installation, Maintenance & Repair | 0 (0.0%) | 0 (0.0%) |
| Total (Category) | 10 (100.0%) | 0 (0.0%) |
| Total (Overall) | 214 (79.5%) | 55 (20.4%) |
Production, Transportation and Moving Occupations
The most common Production, Transportation and Moving occupations in Eighty Four are Material Moving (11 | 4.1%), Production (6 | 2.2%), and Transportation (4 | 1.5%).
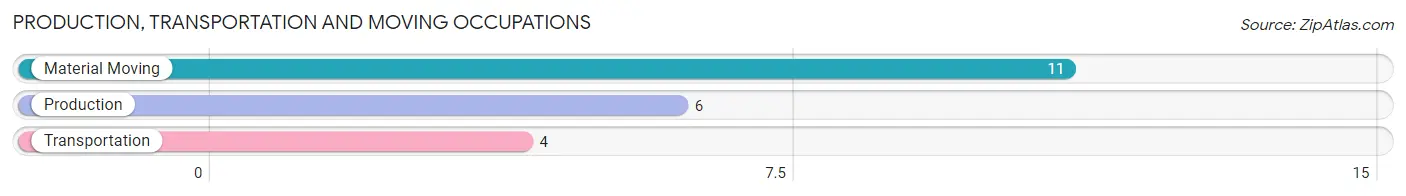
Production, Transportation and Moving Occupations by Sex
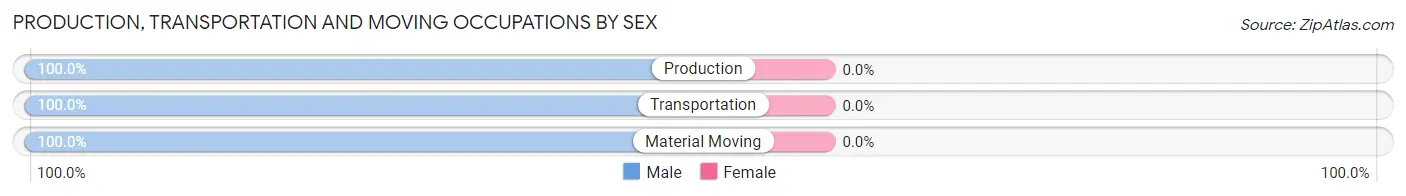
| Occupation | Male | Female |
| Production | 6 (100.0%) | 0 (0.0%) |
| Transportation | 4 (100.0%) | 0 (0.0%) |
| Material Moving | 11 (100.0%) | 0 (0.0%) |
| Total (Category) | 21 (100.0%) | 0 (0.0%) |
| Total (Overall) | 214 (79.5%) | 55 (20.4%) |
Employment Industries by Sex in Eighty Four
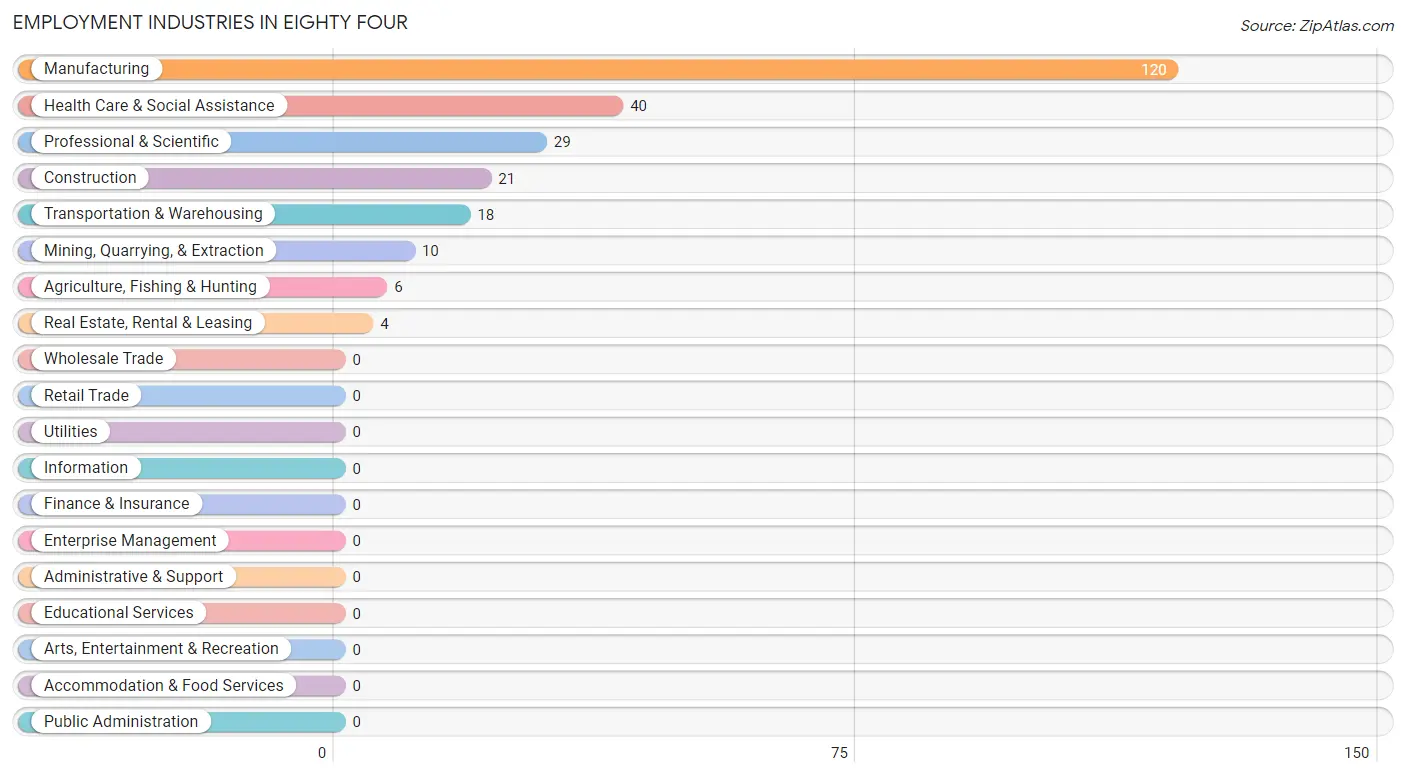
Employment Industries in Eighty Four
The major employment industries in Eighty Four include Manufacturing (120 | 44.6%), Health Care & Social Assistance (40 | 14.9%), Professional & Scientific (29 | 10.8%), Construction (21 | 7.8%), and Transportation & Warehousing (18 | 6.7%).
Employment Industries by Sex in Eighty Four
The Eighty Four industries that see more men than women are Mining, Quarrying, & Extraction (100.0%), Construction (100.0%), and Manufacturing (100.0%), whereas the industries that tend to have a higher number of women are Agriculture, Fishing & Hunting (100.0%), Health Care & Social Assistance (100.0%), and Professional & Scientific (31.0%).
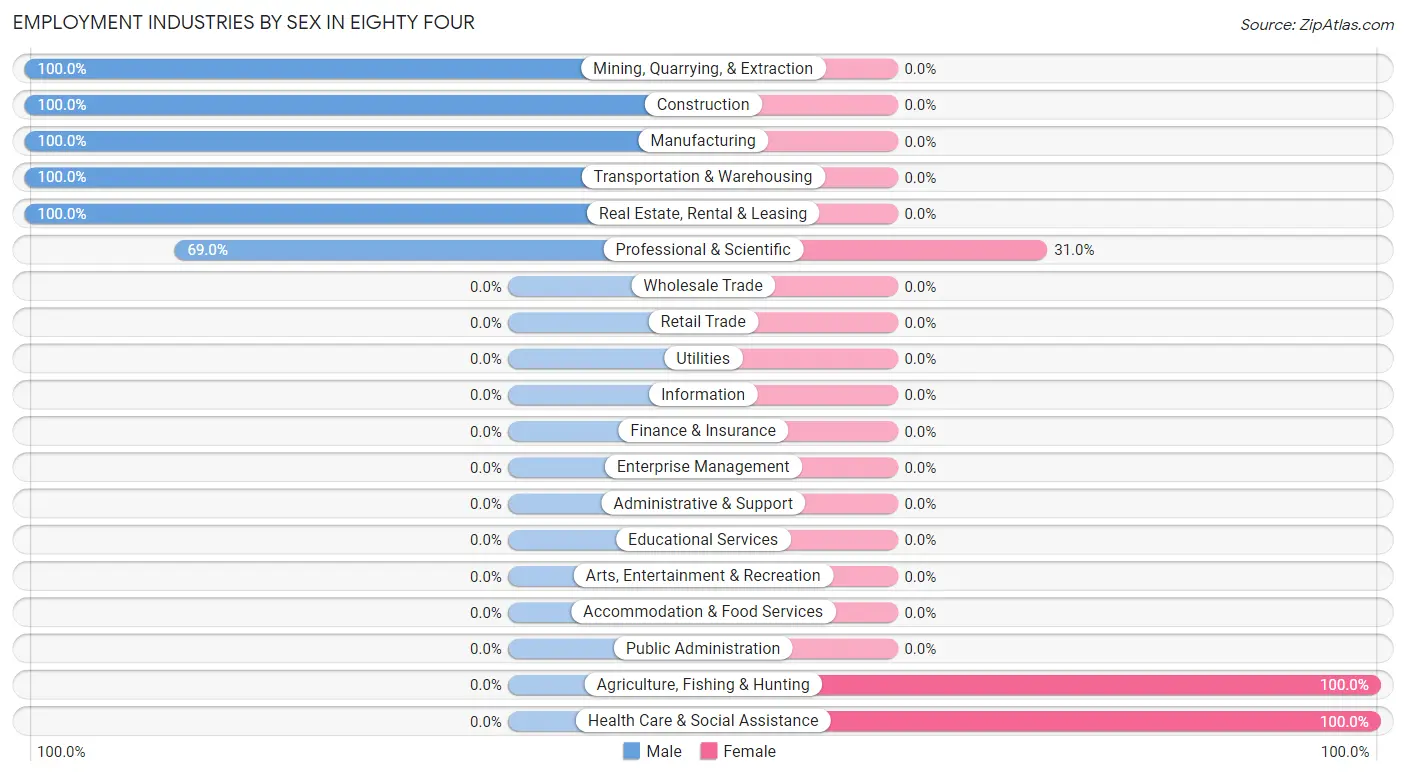
| Industry | Male | Female |
| Agriculture, Fishing & Hunting | 0 (0.0%) | 6 (100.0%) |
| Mining, Quarrying, & Extraction | 10 (100.0%) | 0 (0.0%) |
| Construction | 21 (100.0%) | 0 (0.0%) |
| Manufacturing | 120 (100.0%) | 0 (0.0%) |
| Wholesale Trade | 0 (0.0%) | 0 (0.0%) |
| Retail Trade | 0 (0.0%) | 0 (0.0%) |
| Transportation & Warehousing | 18 (100.0%) | 0 (0.0%) |
| Utilities | 0 (0.0%) | 0 (0.0%) |
| Information | 0 (0.0%) | 0 (0.0%) |
| Finance & Insurance | 0 (0.0%) | 0 (0.0%) |
| Real Estate, Rental & Leasing | 4 (100.0%) | 0 (0.0%) |
| Professional & Scientific | 20 (69.0%) | 9 (31.0%) |
| Enterprise Management | 0 (0.0%) | 0 (0.0%) |
| Administrative & Support | 0 (0.0%) | 0 (0.0%) |
| Educational Services | 0 (0.0%) | 0 (0.0%) |
| Health Care & Social Assistance | 0 (0.0%) | 40 (100.0%) |
| Arts, Entertainment & Recreation | 0 (0.0%) | 0 (0.0%) |
| Accommodation & Food Services | 0 (0.0%) | 0 (0.0%) |
| Public Administration | 0 (0.0%) | 0 (0.0%) |
| Total | 214 (79.5%) | 55 (20.4%) |
Education in Eighty Four
School Enrollment in Eighty Four
The most common levels of schooling among the 118 students in Eighty Four are high school (61 | 51.7%), middle school (29 | 24.6%), and elementary school (28 | 23.7%).
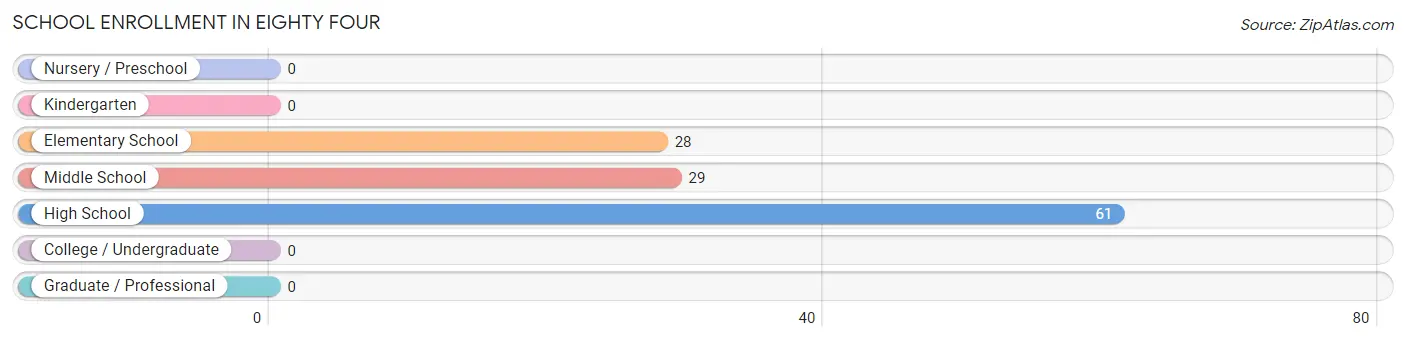
| School Level | # Students | % Students |
| Nursery / Preschool | 0 | 0.0% |
| Kindergarten | 0 | 0.0% |
| Elementary School | 28 | 23.7% |
| Middle School | 29 | 24.6% |
| High School | 61 | 51.7% |
| College / Undergraduate | 0 | 0.0% |
| Graduate / Professional | 0 | 0.0% |
| Total | 118 | 100.0% |
School Enrollment by Age by Funding Source in Eighty Four
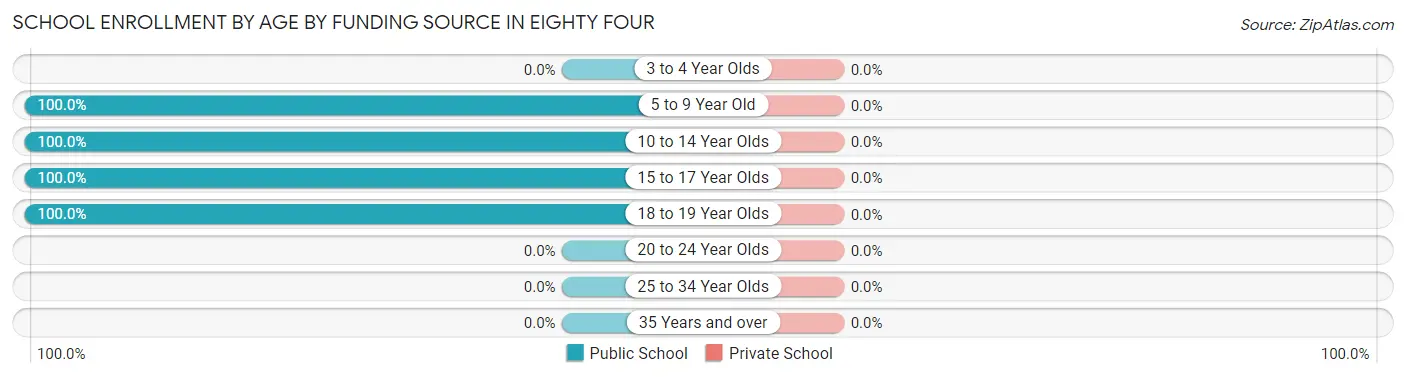
| Age Bracket | Public School | Private School |
| 3 to 4 Year Olds | 0 (0.0%) | 0 (0.0%) |
| 5 to 9 Year Old | 28 (100.0%) | 0 (0.0%) |
| 10 to 14 Year Olds | 29 (100.0%) | 0 (0.0%) |
| 15 to 17 Year Olds | 20 (100.0%) | 0 (0.0%) |
| 18 to 19 Year Olds | 41 (100.0%) | 0 (0.0%) |
| 20 to 24 Year Olds | 0 (0.0%) | 0 (0.0%) |
| 25 to 34 Year Olds | 0 (0.0%) | 0 (0.0%) |
| 35 Years and over | 0 (0.0%) | 0 (0.0%) |
| Total | 118 (100.0%) | 0 (0.0%) |
Educational Attainment by Field of Study in Eighty Four
Business (16 | 29.6%), communications (15 | 27.8%), physical & health sciences (9 | 16.7%), science & technology (6 | 11.1%), and social sciences (4 | 7.4%) are the most common fields of study among 54 individuals in Eighty Four who have obtained a bachelor's degree or higher.
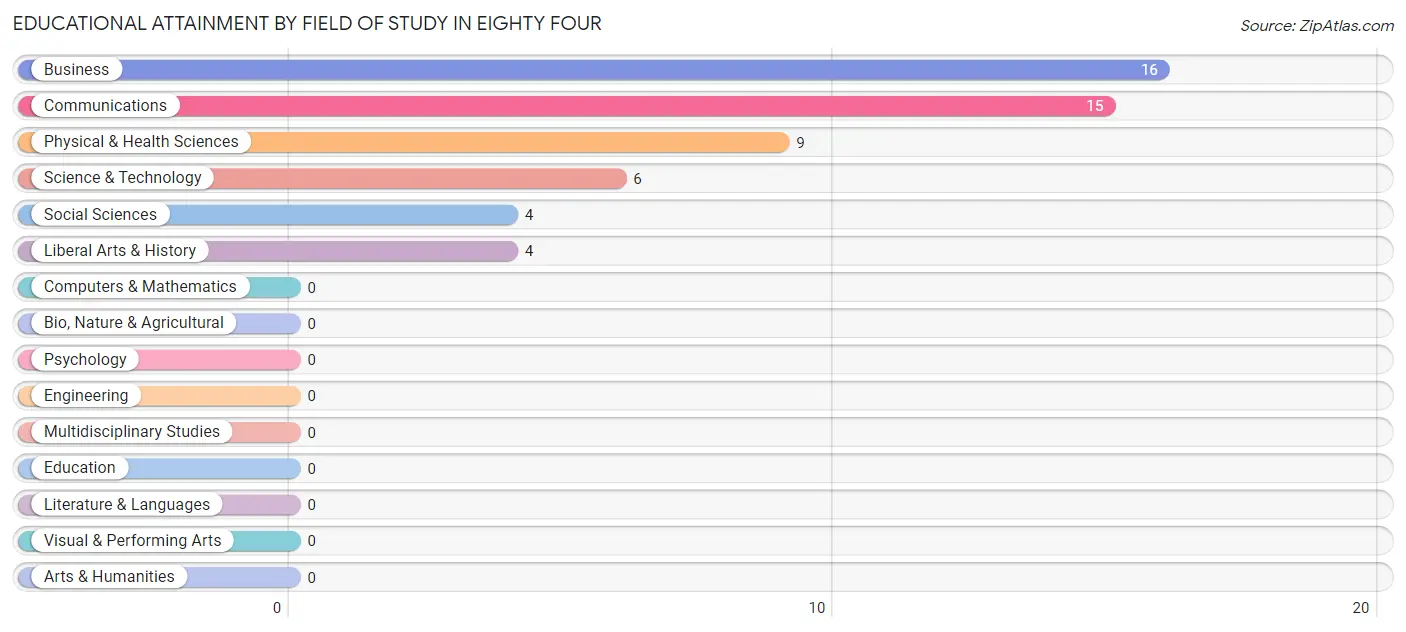
| Field of Study | # Graduates | % Graduates |
| Computers & Mathematics | 0 | 0.0% |
| Bio, Nature & Agricultural | 0 | 0.0% |
| Physical & Health Sciences | 9 | 16.7% |
| Psychology | 0 | 0.0% |
| Social Sciences | 4 | 7.4% |
| Engineering | 0 | 0.0% |
| Multidisciplinary Studies | 0 | 0.0% |
| Science & Technology | 6 | 11.1% |
| Business | 16 | 29.6% |
| Education | 0 | 0.0% |
| Literature & Languages | 0 | 0.0% |
| Liberal Arts & History | 4 | 7.4% |
| Visual & Performing Arts | 0 | 0.0% |
| Communications | 15 | 27.8% |
| Arts & Humanities | 0 | 0.0% |
| Total | 54 | 100.0% |
Transportation & Commute in Eighty Four
Vehicle Availability by Sex in Eighty Four
The most prevalent vehicle ownership categories in Eighty Four are males with 5 or more vehicles (113, accounting for 52.8%) and females with 5 or more vehicles (0, making up 205.4%).
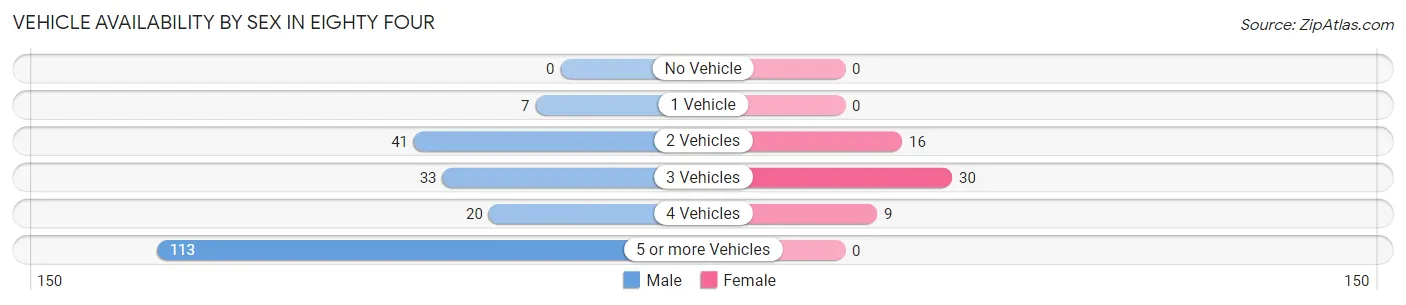
| Vehicles Available | Male | Female |
| No Vehicle | 0 (0.0%) | 0 (0.0%) |
| 1 Vehicle | 7 (3.3%) | 0 (0.0%) |
| 2 Vehicles | 41 (19.2%) | 16 (29.1%) |
| 3 Vehicles | 33 (15.4%) | 30 (54.5%) |
| 4 Vehicles | 20 (9.3%) | 9 (16.4%) |
| 5 or more Vehicles | 113 (52.8%) | 0 (0.0%) |
| Total | 214 (100.0%) | 55 (100.0%) |
Commute Time in Eighty Four
The most frequently occuring commute durations in Eighty Four are 40 to 44 minutes (68 commuters, 28.3%), 20 to 24 minutes (53 commuters, 22.1%), and less than 5 minutes (37 commuters, 15.4%).
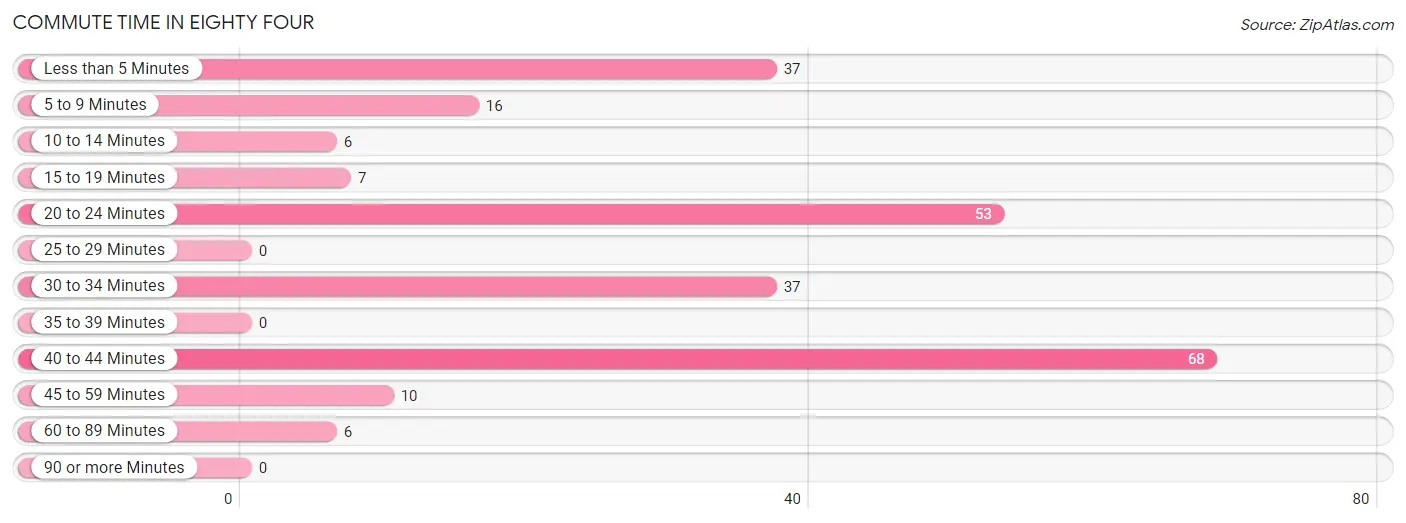
| Commute Time | # Commuters | % Commuters |
| Less than 5 Minutes | 37 | 15.4% |
| 5 to 9 Minutes | 16 | 6.7% |
| 10 to 14 Minutes | 6 | 2.5% |
| 15 to 19 Minutes | 7 | 2.9% |
| 20 to 24 Minutes | 53 | 22.1% |
| 25 to 29 Minutes | 0 | 0.0% |
| 30 to 34 Minutes | 37 | 15.4% |
| 35 to 39 Minutes | 0 | 0.0% |
| 40 to 44 Minutes | 68 | 28.3% |
| 45 to 59 Minutes | 10 | 4.2% |
| 60 to 89 Minutes | 6 | 2.5% |
| 90 or more Minutes | 0 | 0.0% |
Commute Time by Sex in Eighty Four
The most common commute times in Eighty Four are 40 to 44 minutes (68 commuters, 35.0%) for males and less than 5 minutes (19 commuters, 41.3%) for females.
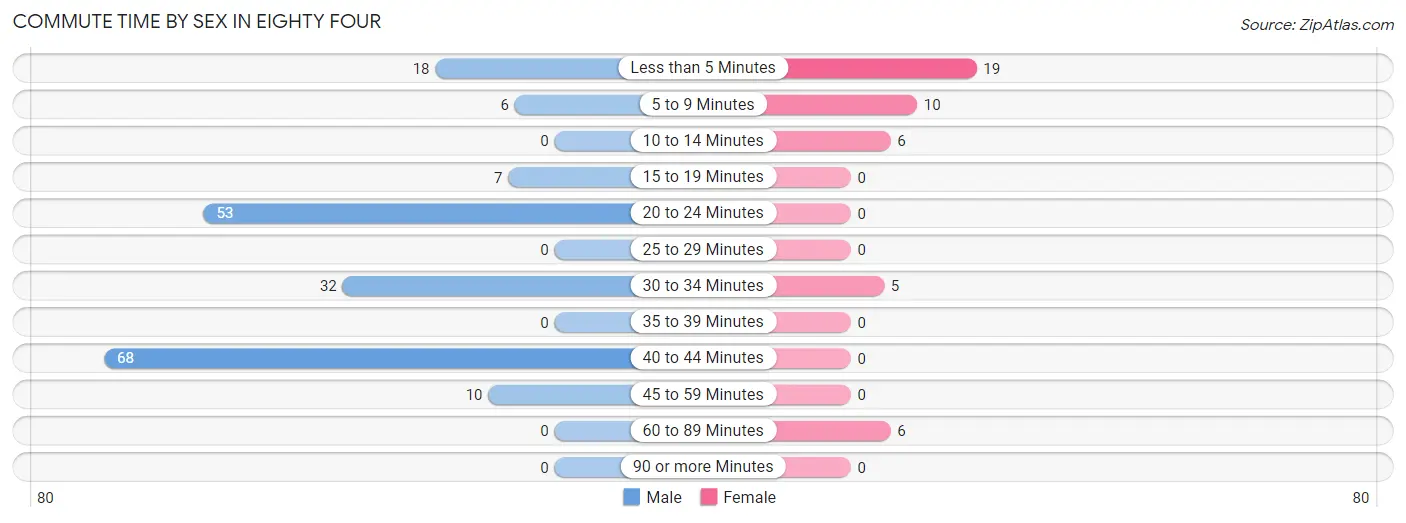
| Commute Time | Male | Female |
| Less than 5 Minutes | 18 (9.3%) | 19 (41.3%) |
| 5 to 9 Minutes | 6 (3.1%) | 10 (21.7%) |
| 10 to 14 Minutes | 0 (0.0%) | 6 (13.0%) |
| 15 to 19 Minutes | 7 (3.6%) | 0 (0.0%) |
| 20 to 24 Minutes | 53 (27.3%) | 0 (0.0%) |
| 25 to 29 Minutes | 0 (0.0%) | 0 (0.0%) |
| 30 to 34 Minutes | 32 (16.5%) | 5 (10.9%) |
| 35 to 39 Minutes | 0 (0.0%) | 0 (0.0%) |
| 40 to 44 Minutes | 68 (35.0%) | 0 (0.0%) |
| 45 to 59 Minutes | 10 (5.1%) | 0 (0.0%) |
| 60 to 89 Minutes | 0 (0.0%) | 6 (13.0%) |
| 90 or more Minutes | 0 (0.0%) | 0 (0.0%) |
Time of Departure to Work by Sex in Eighty Four
The most frequent times of departure to work in Eighty Four are 7:00 AM to 7:29 AM (89, 45.9%) for males and 9:00 AM to 9:59 AM (24, 52.2%) for females.
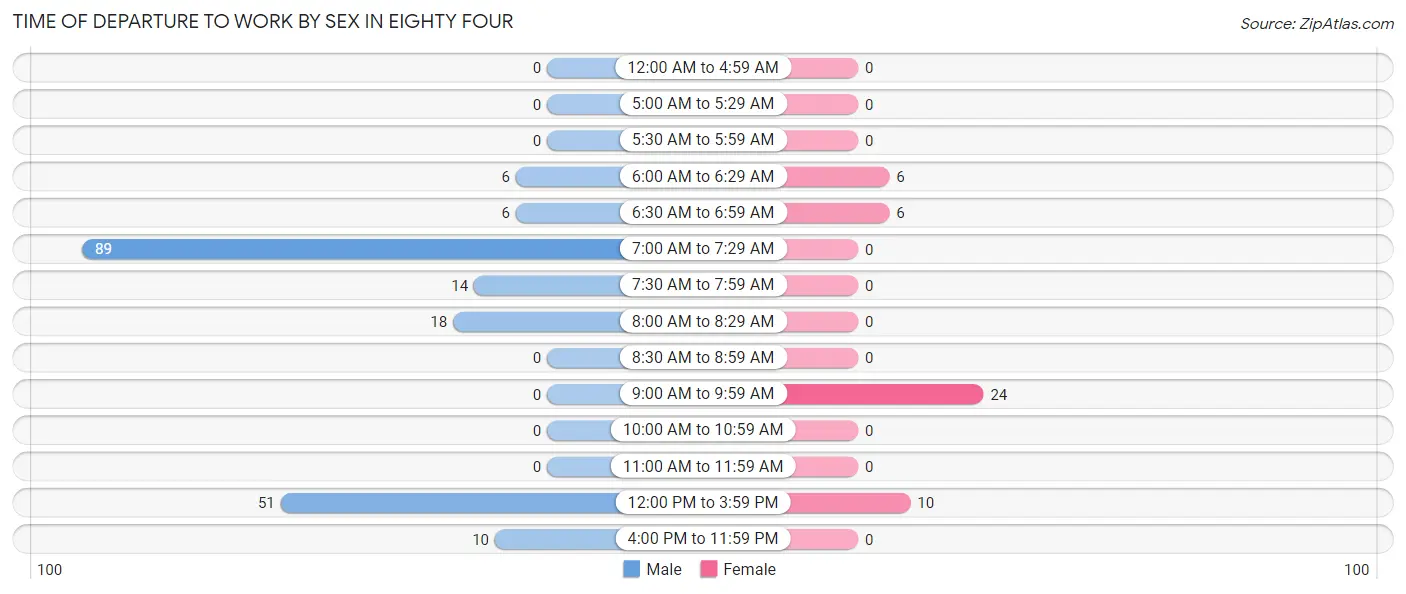
| Time of Departure | Male | Female |
| 12:00 AM to 4:59 AM | 0 (0.0%) | 0 (0.0%) |
| 5:00 AM to 5:29 AM | 0 (0.0%) | 0 (0.0%) |
| 5:30 AM to 5:59 AM | 0 (0.0%) | 0 (0.0%) |
| 6:00 AM to 6:29 AM | 6 (3.1%) | 6 (13.0%) |
| 6:30 AM to 6:59 AM | 6 (3.1%) | 6 (13.0%) |
| 7:00 AM to 7:29 AM | 89 (45.9%) | 0 (0.0%) |
| 7:30 AM to 7:59 AM | 14 (7.2%) | 0 (0.0%) |
| 8:00 AM to 8:29 AM | 18 (9.3%) | 0 (0.0%) |
| 8:30 AM to 8:59 AM | 0 (0.0%) | 0 (0.0%) |
| 9:00 AM to 9:59 AM | 0 (0.0%) | 24 (52.2%) |
| 10:00 AM to 10:59 AM | 0 (0.0%) | 0 (0.0%) |
| 11:00 AM to 11:59 AM | 0 (0.0%) | 0 (0.0%) |
| 12:00 PM to 3:59 PM | 51 (26.3%) | 10 (21.7%) |
| 4:00 PM to 11:59 PM | 10 (5.1%) | 0 (0.0%) |
| Total | 194 (100.0%) | 46 (100.0%) |
Housing Occupancy in Eighty Four
Occupancy by Ownership in Eighty Four
Of the total 256 dwellings in Eighty Four, owner-occupied units account for 233 (91.0%), while renter-occupied units make up 23 (9.0%).
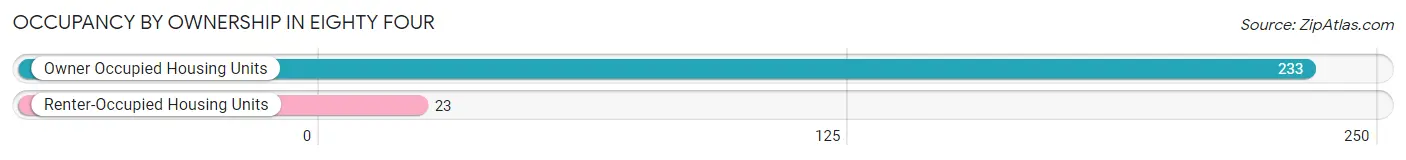
| Occupancy | # Housing Units | % Housing Units |
| Owner Occupied Housing Units | 233 | 91.0% |
| Renter-Occupied Housing Units | 23 | 9.0% |
| Total Occupied Housing Units | 256 | 100.0% |
Occupancy by Household Size in Eighty Four
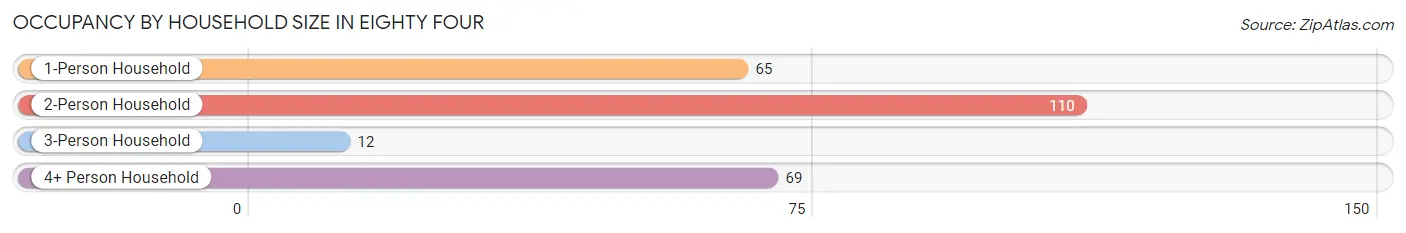
| Household Size | # Housing Units | % Housing Units |
| 1-Person Household | 65 | 25.4% |
| 2-Person Household | 110 | 43.0% |
| 3-Person Household | 12 | 4.7% |
| 4+ Person Household | 69 | 27.0% |
| Total Housing Units | 256 | 100.0% |
Occupancy by Ownership by Household Size in Eighty Four
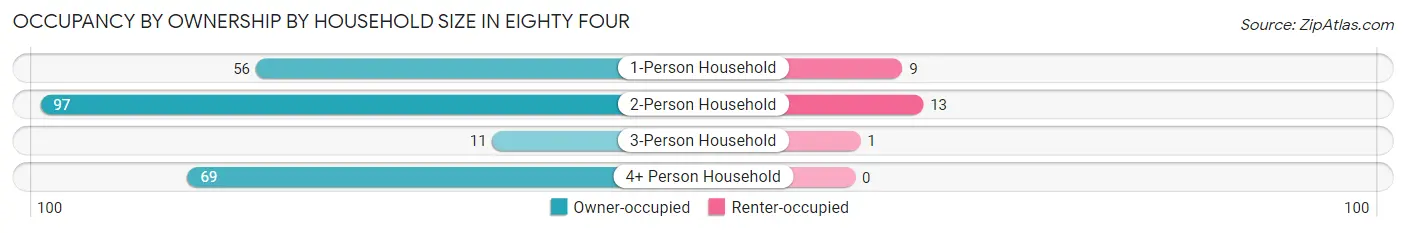
| Household Size | Owner-occupied | Renter-occupied |
| 1-Person Household | 56 (86.2%) | 9 (13.9%) |
| 2-Person Household | 97 (88.2%) | 13 (11.8%) |
| 3-Person Household | 11 (91.7%) | 1 (8.3%) |
| 4+ Person Household | 69 (100.0%) | 0 (0.0%) |
| Total Housing Units | 233 (91.0%) | 23 (9.0%) |
Occupancy by Educational Attainment in Eighty Four
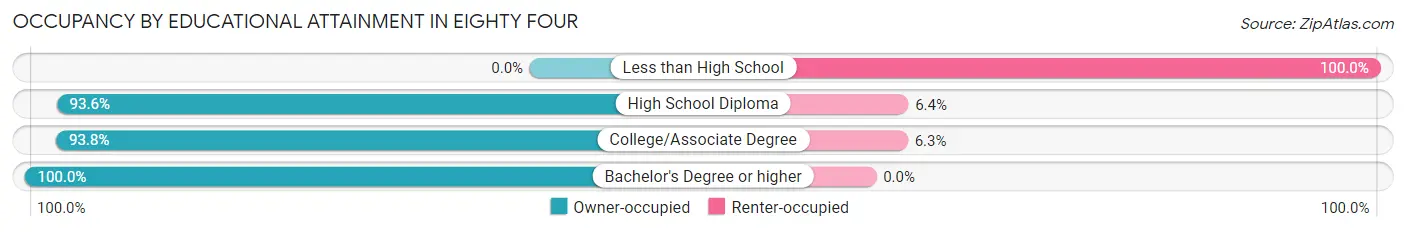
| Household Size | Owner-occupied | Renter-occupied |
| Less than High School | 0 (0.0%) | 10 (100.0%) |
| High School Diploma | 103 (93.6%) | 7 (6.4%) |
| College/Associate Degree | 90 (93.8%) | 6 (6.2%) |
| Bachelor's Degree or higher | 40 (100.0%) | 0 (0.0%) |
Occupancy by Age of Householder in Eighty Four
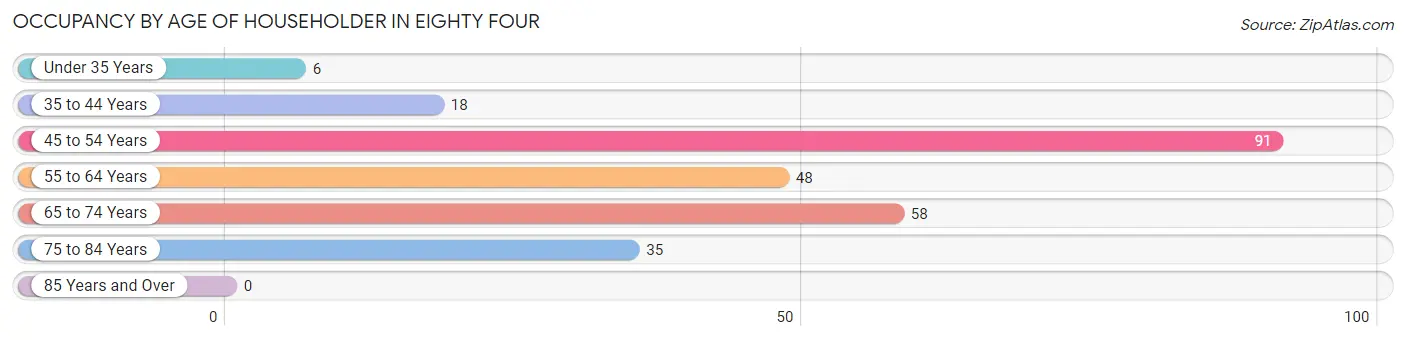
| Age Bracket | # Households | % Households |
| Under 35 Years | 6 | 2.3% |
| 35 to 44 Years | 18 | 7.0% |
| 45 to 54 Years | 91 | 35.5% |
| 55 to 64 Years | 48 | 18.8% |
| 65 to 74 Years | 58 | 22.7% |
| 75 to 84 Years | 35 | 13.7% |
| 85 Years and Over | 0 | 0.0% |
| Total | 256 | 100.0% |
Housing Finances in Eighty Four
Median Income by Occupancy in Eighty Four
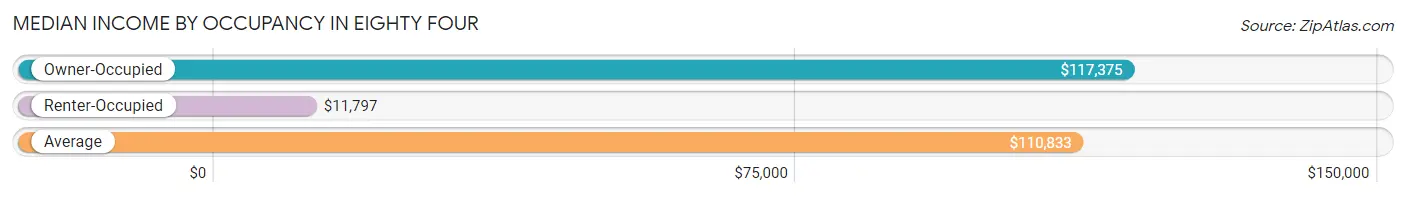
| Occupancy Type | # Households | Median Income |
| Owner-Occupied | 233 (91.0%) | $117,375 |
| Renter-Occupied | 23 (9.0%) | $11,797 |
| Average | 256 (100.0%) | $110,833 |
Occupancy by Householder Income Bracket in Eighty Four
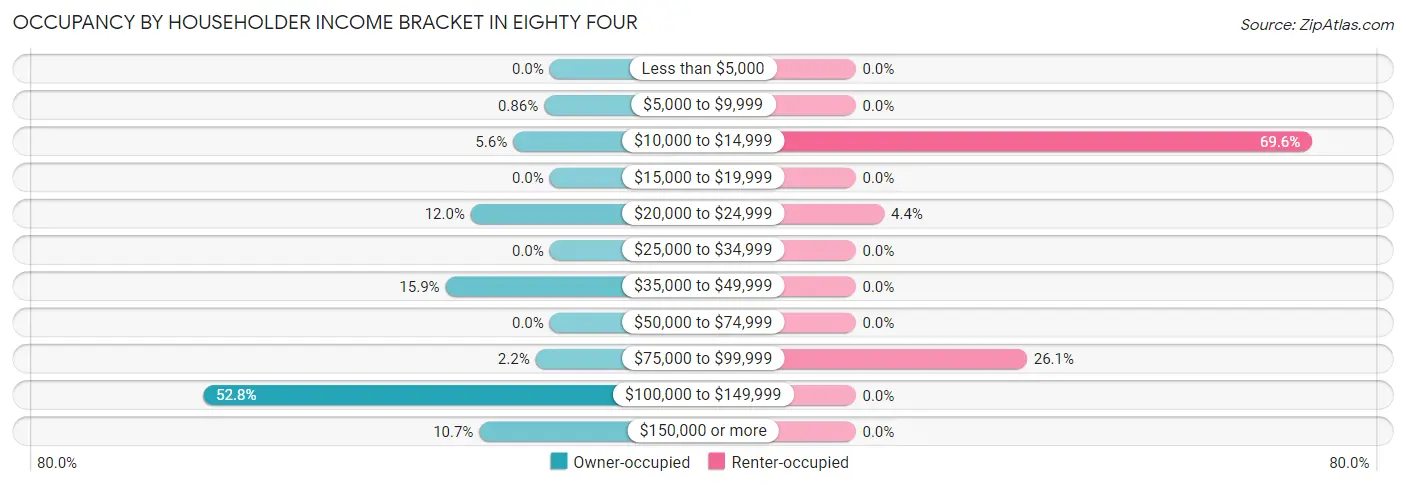
| Income Bracket | Owner-occupied | Renter-occupied |
| Less than $5,000 | 0 (0.0%) | 0 (0.0%) |
| $5,000 to $9,999 | 2 (0.9%) | 0 (0.0%) |
| $10,000 to $14,999 | 13 (5.6%) | 16 (69.6%) |
| $15,000 to $19,999 | 0 (0.0%) | 0 (0.0%) |
| $20,000 to $24,999 | 28 (12.0%) | 1 (4.3%) |
| $25,000 to $34,999 | 0 (0.0%) | 0 (0.0%) |
| $35,000 to $49,999 | 37 (15.9%) | 0 (0.0%) |
| $50,000 to $74,999 | 0 (0.0%) | 0 (0.0%) |
| $75,000 to $99,999 | 5 (2.1%) | 6 (26.1%) |
| $100,000 to $149,999 | 123 (52.8%) | 0 (0.0%) |
| $150,000 or more | 25 (10.7%) | 0 (0.0%) |
| Total | 233 (100.0%) | 23 (100.0%) |
Monthly Housing Cost Tiers in Eighty Four
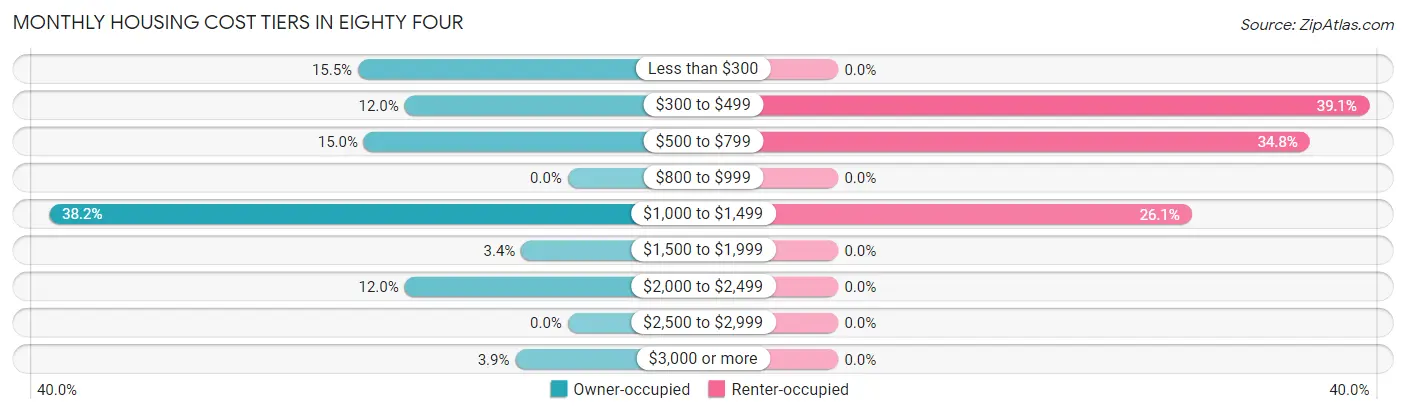
| Monthly Cost | Owner-occupied | Renter-occupied |
| Less than $300 | 36 (15.4%) | 0 (0.0%) |
| $300 to $499 | 28 (12.0%) | 9 (39.1%) |
| $500 to $799 | 35 (15.0%) | 8 (34.8%) |
| $800 to $999 | 0 (0.0%) | 0 (0.0%) |
| $1,000 to $1,499 | 89 (38.2%) | 6 (26.1%) |
| $1,500 to $1,999 | 8 (3.4%) | 0 (0.0%) |
| $2,000 to $2,499 | 28 (12.0%) | 0 (0.0%) |
| $2,500 to $2,999 | 0 (0.0%) | 0 (0.0%) |
| $3,000 or more | 9 (3.9%) | 0 (0.0%) |
| Total | 233 (100.0%) | 23 (100.0%) |
Physical Housing Characteristics in Eighty Four
Housing Structures in Eighty Four
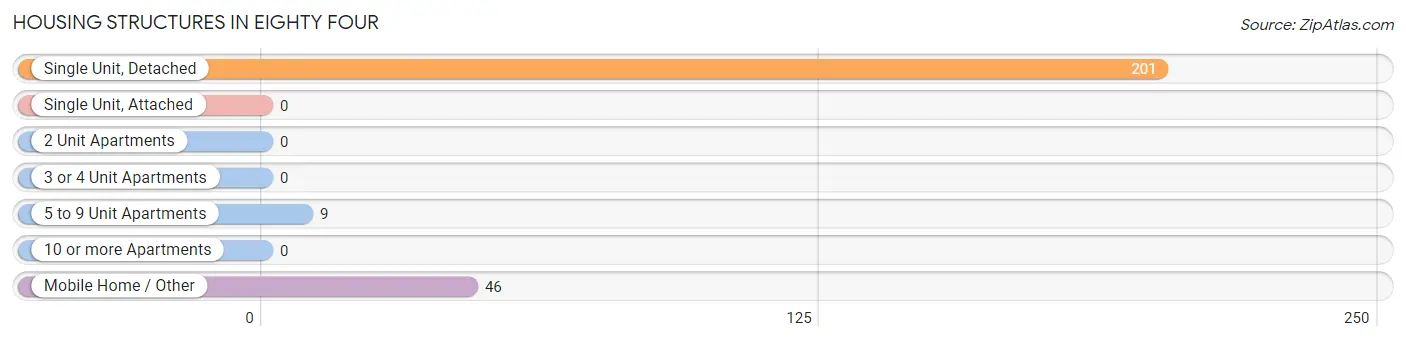
| Structure Type | # Housing Units | % Housing Units |
| Single Unit, Detached | 201 | 78.5% |
| Single Unit, Attached | 0 | 0.0% |
| 2 Unit Apartments | 0 | 0.0% |
| 3 or 4 Unit Apartments | 0 | 0.0% |
| 5 to 9 Unit Apartments | 9 | 3.5% |
| 10 or more Apartments | 0 | 0.0% |
| Mobile Home / Other | 46 | 18.0% |
| Total | 256 | 100.0% |
Housing Structures by Occupancy in Eighty Four
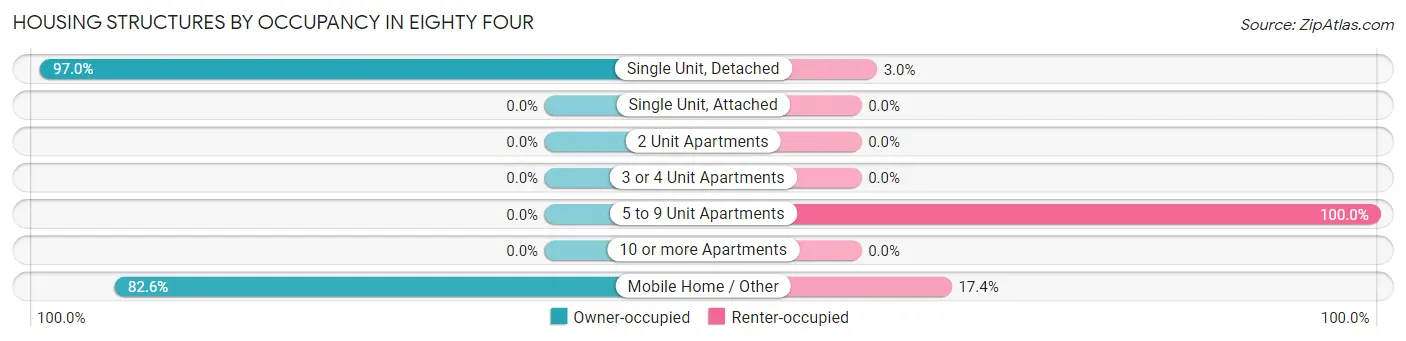
| Structure Type | Owner-occupied | Renter-occupied |
| Single Unit, Detached | 195 (97.0%) | 6 (3.0%) |
| Single Unit, Attached | 0 (0.0%) | 0 (0.0%) |
| 2 Unit Apartments | 0 (0.0%) | 0 (0.0%) |
| 3 or 4 Unit Apartments | 0 (0.0%) | 0 (0.0%) |
| 5 to 9 Unit Apartments | 0 (0.0%) | 9 (100.0%) |
| 10 or more Apartments | 0 (0.0%) | 0 (0.0%) |
| Mobile Home / Other | 38 (82.6%) | 8 (17.4%) |
| Total | 233 (91.0%) | 23 (9.0%) |
Housing Structures by Number of Rooms in Eighty Four
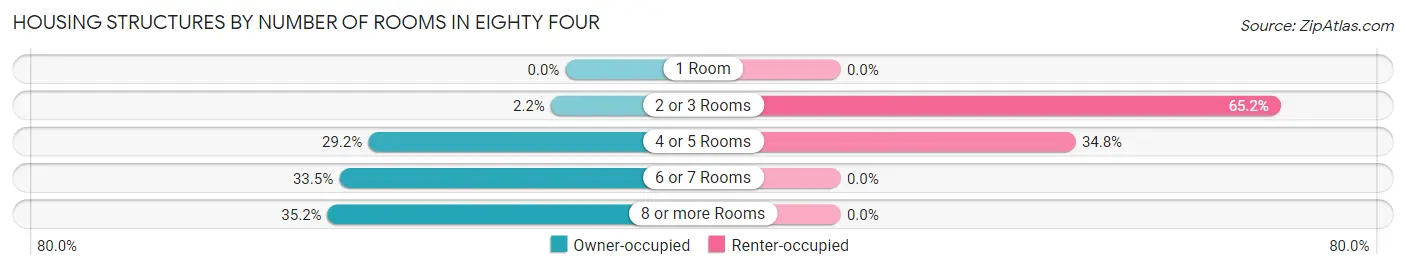
| Number of Rooms | Owner-occupied | Renter-occupied |
| 1 Room | 0 (0.0%) | 0 (0.0%) |
| 2 or 3 Rooms | 5 (2.1%) | 15 (65.2%) |
| 4 or 5 Rooms | 68 (29.2%) | 8 (34.8%) |
| 6 or 7 Rooms | 78 (33.5%) | 0 (0.0%) |
| 8 or more Rooms | 82 (35.2%) | 0 (0.0%) |
| Total | 233 (100.0%) | 23 (100.0%) |
Housing Structure by Heating Type in Eighty Four
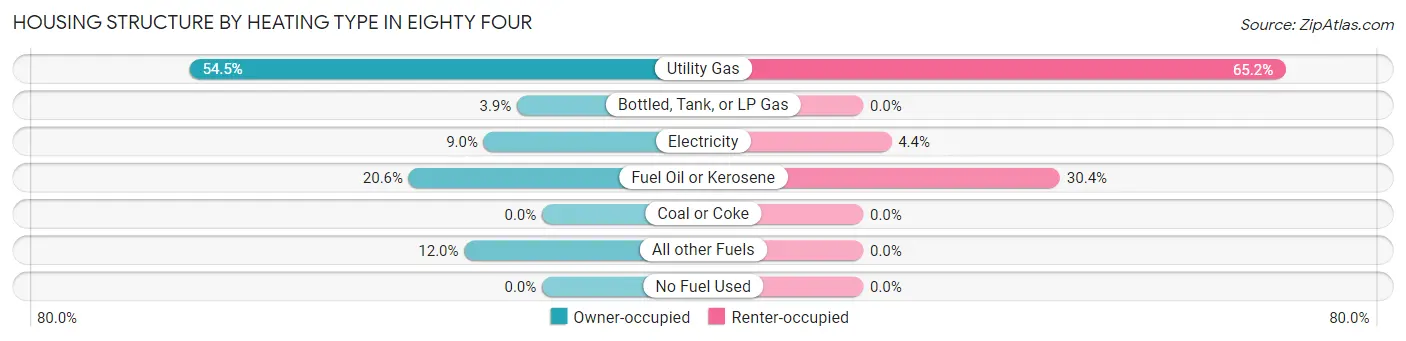
| Heating Type | Owner-occupied | Renter-occupied |
| Utility Gas | 127 (54.5%) | 15 (65.2%) |
| Bottled, Tank, or LP Gas | 9 (3.9%) | 0 (0.0%) |
| Electricity | 21 (9.0%) | 1 (4.3%) |
| Fuel Oil or Kerosene | 48 (20.6%) | 7 (30.4%) |
| Coal or Coke | 0 (0.0%) | 0 (0.0%) |
| All other Fuels | 28 (12.0%) | 0 (0.0%) |
| No Fuel Used | 0 (0.0%) | 0 (0.0%) |
| Total | 233 (100.0%) | 23 (100.0%) |
Household Vehicle Usage in Eighty Four
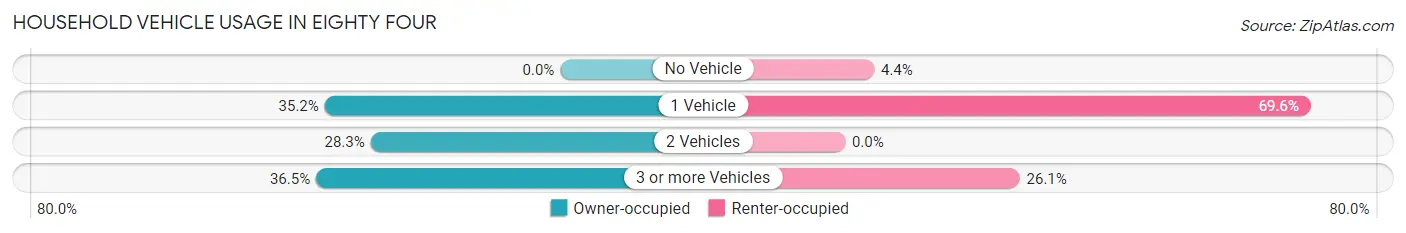
| Vehicles per Household | Owner-occupied | Renter-occupied |
| No Vehicle | 0 (0.0%) | 1 (4.3%) |
| 1 Vehicle | 82 (35.2%) | 16 (69.6%) |
| 2 Vehicles | 66 (28.3%) | 0 (0.0%) |
| 3 or more Vehicles | 85 (36.5%) | 6 (26.1%) |
| Total | 233 (100.0%) | 23 (100.0%) |
Real Estate & Mortgages in Eighty Four
Real Estate and Mortgage Overview in Eighty Four
| Characteristic | Without Mortgage | With Mortgage |
| Housing Units | 86 | 147 |
| Median Property Value | - | - |
| Median Household Income | - | - |
| Monthly Housing Costs | $318 | $9 |
| Real Estate Taxes | - | - |
Property Value by Mortgage Status in Eighty Four
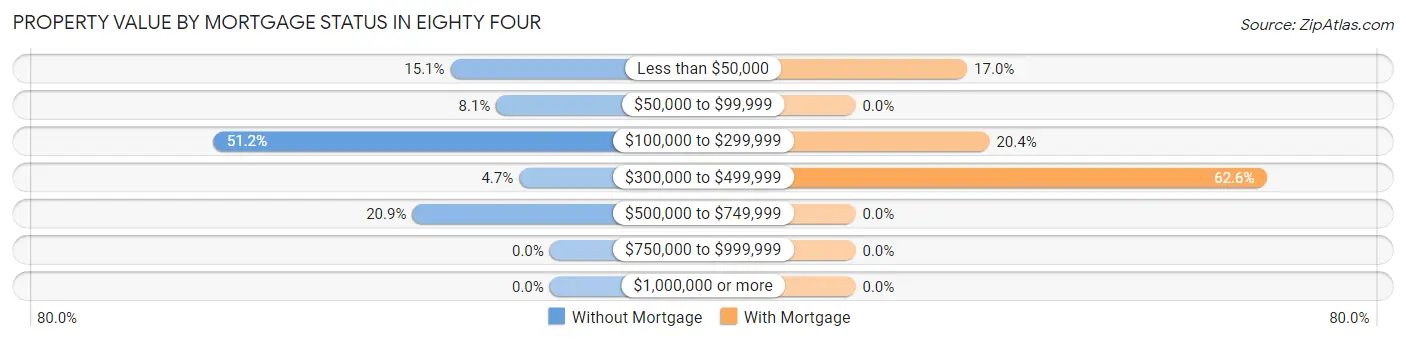
| Property Value | Without Mortgage | With Mortgage |
| Less than $50,000 | 13 (15.1%) | 25 (17.0%) |
| $50,000 to $99,999 | 7 (8.1%) | 0 (0.0%) |
| $100,000 to $299,999 | 44 (51.2%) | 30 (20.4%) |
| $300,000 to $499,999 | 4 (4.6%) | 92 (62.6%) |
| $500,000 to $749,999 | 18 (20.9%) | 0 (0.0%) |
| $750,000 to $999,999 | 0 (0.0%) | 0 (0.0%) |
| $1,000,000 or more | 0 (0.0%) | 0 (0.0%) |
| Total | 86 (100.0%) | 147 (100.0%) |
Household Income by Mortgage Status in Eighty Four
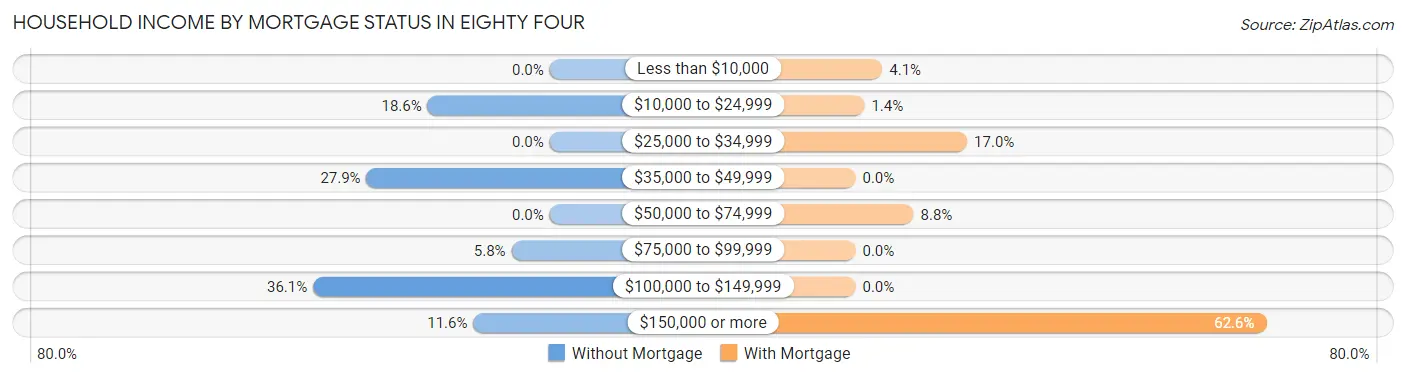
| Household Income | Without Mortgage | With Mortgage |
| Less than $10,000 | 0 (0.0%) | 6 (4.1%) |
| $10,000 to $24,999 | 16 (18.6%) | 2 (1.4%) |
| $25,000 to $34,999 | 0 (0.0%) | 25 (17.0%) |
| $35,000 to $49,999 | 24 (27.9%) | 0 (0.0%) |
| $50,000 to $74,999 | 0 (0.0%) | 13 (8.8%) |
| $75,000 to $99,999 | 5 (5.8%) | 0 (0.0%) |
| $100,000 to $149,999 | 31 (36.0%) | 0 (0.0%) |
| $150,000 or more | 10 (11.6%) | 92 (62.6%) |
| Total | 86 (100.0%) | 147 (100.0%) |
Property Value to Household Income Ratio in Eighty Four
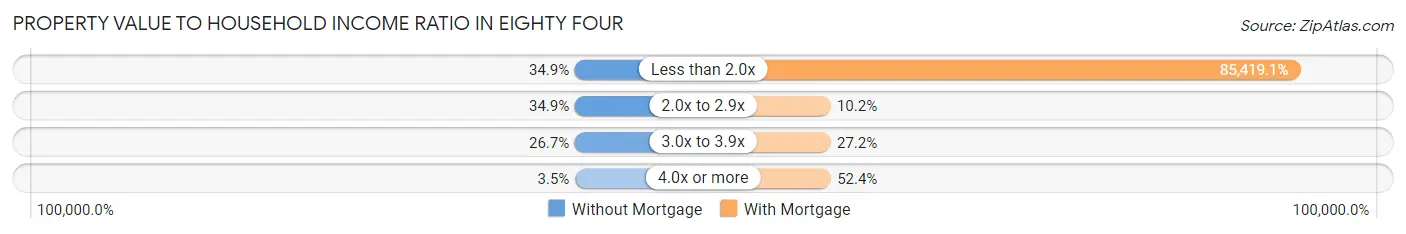
| Value-to-Income Ratio | Without Mortgage | With Mortgage |
| Less than 2.0x | 30 (34.9%) | 125,566 (85,419.1%) |
| 2.0x to 2.9x | 30 (34.9%) | 15 (10.2%) |
| 3.0x to 3.9x | 23 (26.7%) | 40 (27.2%) |
| 4.0x or more | 3 (3.5%) | 77 (52.4%) |
| Total | 86 (100.0%) | 147 (100.0%) |
Real Estate Taxes by Mortgage Status in Eighty Four
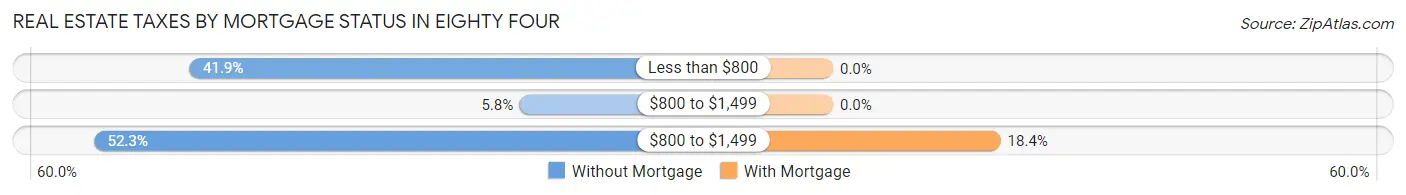
| Property Taxes | Without Mortgage | With Mortgage |
| Less than $800 | 36 (41.9%) | 0 (0.0%) |
| $800 to $1,499 | 5 (5.8%) | 0 (0.0%) |
| $800 to $1,499 | 45 (52.3%) | 27 (18.4%) |
| Total | 86 (100.0%) | 147 (100.0%) |
Health & Disability in Eighty Four
Health Insurance Coverage by Age in Eighty Four
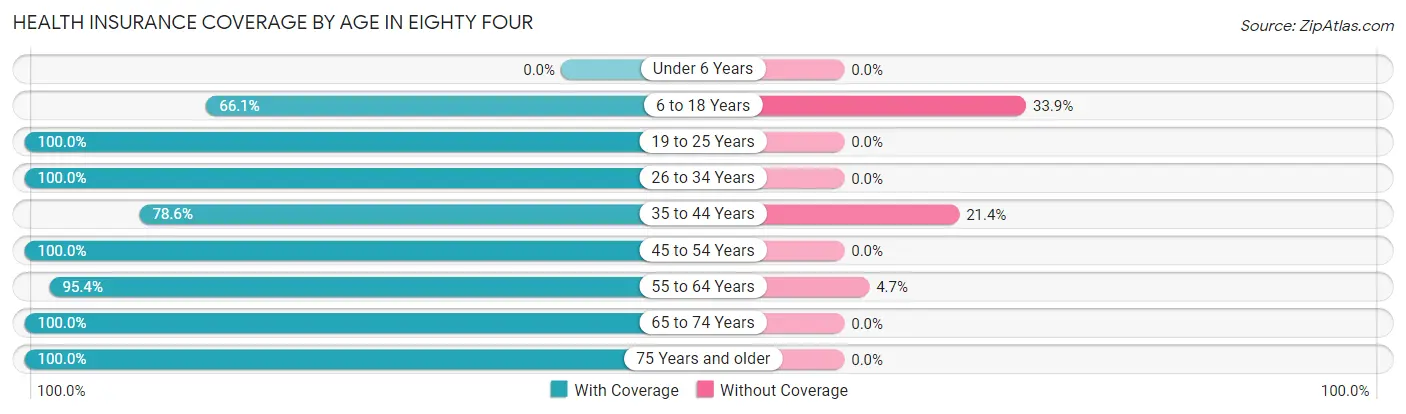
| Age Bracket | With Coverage | Without Coverage |
| Under 6 Years | 0 (0.0%) | 0 (0.0%) |
| 6 to 18 Years | 78 (66.1%) | 40 (33.9%) |
| 19 to 25 Years | 73 (100.0%) | 0 (0.0%) |
| 26 to 34 Years | 28 (100.0%) | 0 (0.0%) |
| 35 to 44 Years | 33 (78.6%) | 9 (21.4%) |
| 45 to 54 Years | 155 (100.0%) | 0 (0.0%) |
| 55 to 64 Years | 82 (95.4%) | 4 (4.6%) |
| 65 to 74 Years | 95 (100.0%) | 0 (0.0%) |
| 75 Years and older | 56 (100.0%) | 0 (0.0%) |
| Total | 600 (91.9%) | 53 (8.1%) |
Health Insurance Coverage by Citizenship Status in Eighty Four
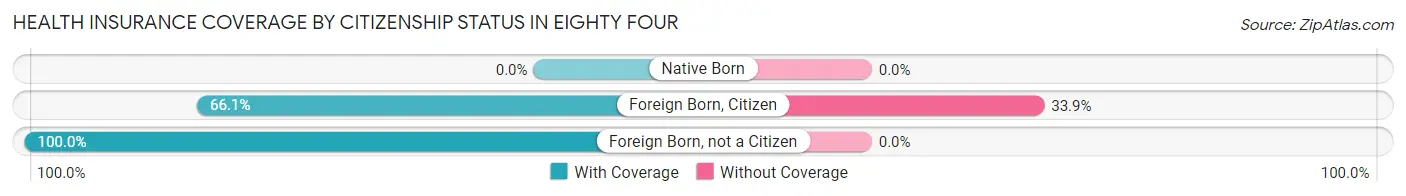
| Citizenship Status | With Coverage | Without Coverage |
| Native Born | 0 (0.0%) | 0 (0.0%) |
| Foreign Born, Citizen | 78 (66.1%) | 40 (33.9%) |
| Foreign Born, not a Citizen | 73 (100.0%) | 0 (0.0%) |
Health Insurance Coverage by Household Income in Eighty Four
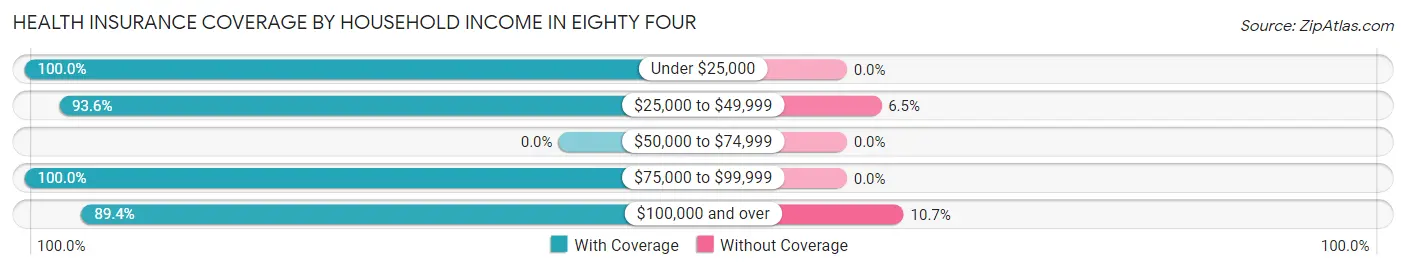
| Household Income | With Coverage | Without Coverage |
| Under $25,000 | 115 (100.0%) | 0 (0.0%) |
| $25,000 to $49,999 | 58 (93.5%) | 4 (6.5%) |
| $50,000 to $74,999 | 0 (0.0%) | 0 (0.0%) |
| $75,000 to $99,999 | 16 (100.0%) | 0 (0.0%) |
| $100,000 and over | 411 (89.3%) | 49 (10.6%) |
Public vs Private Health Insurance Coverage by Age in Eighty Four
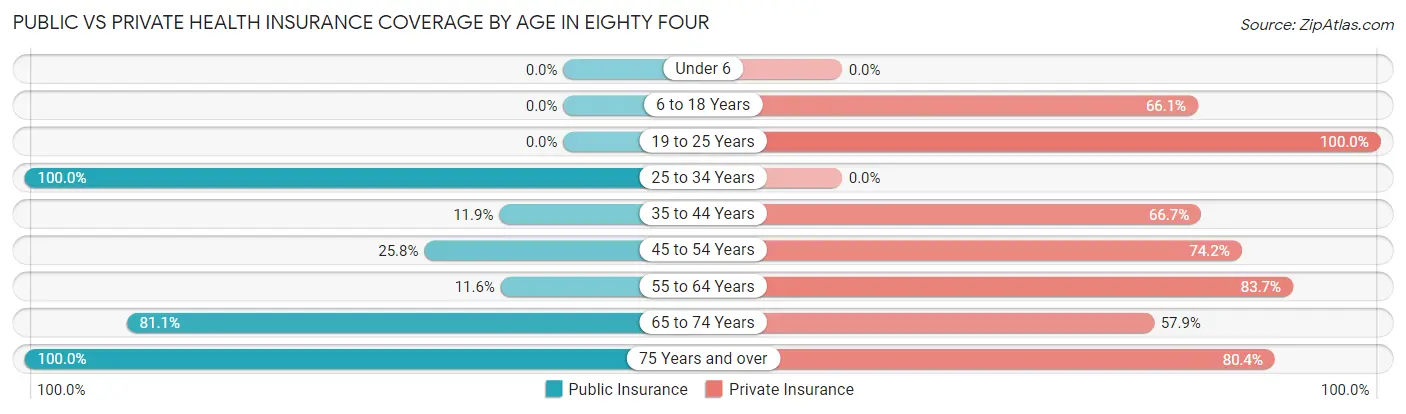
| Age Bracket | Public Insurance | Private Insurance |
| Under 6 | 0 (0.0%) | 0 (0.0%) |
| 6 to 18 Years | 0 (0.0%) | 78 (66.1%) |
| 19 to 25 Years | 0 (0.0%) | 73 (100.0%) |
| 25 to 34 Years | 28 (100.0%) | 0 (0.0%) |
| 35 to 44 Years | 5 (11.9%) | 28 (66.7%) |
| 45 to 54 Years | 40 (25.8%) | 115 (74.2%) |
| 55 to 64 Years | 10 (11.6%) | 72 (83.7%) |
| 65 to 74 Years | 77 (81.0%) | 55 (57.9%) |
| 75 Years and over | 56 (100.0%) | 45 (80.4%) |
| Total | 216 (33.1%) | 466 (71.4%) |
Disability Status by Sex by Age in Eighty Four
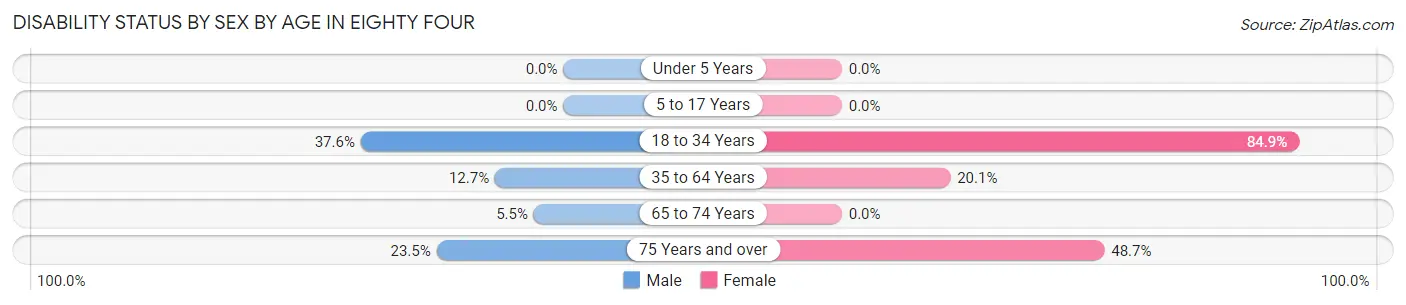
| Age Bracket | Male | Female |
| Under 5 Years | 0 (0.0%) | 0 (0.0%) |
| 5 to 17 Years | 0 (0.0%) | 0 (0.0%) |
| 18 to 34 Years | 41 (37.6%) | 28 (84.9%) |
| 35 to 64 Years | 17 (12.7%) | 30 (20.1%) |
| 65 to 74 Years | 4 (5.5%) | 0 (0.0%) |
| 75 Years and over | 4 (23.5%) | 19 (48.7%) |
Disability Class by Sex by Age in Eighty Four
Disability Class: Hearing Difficulty
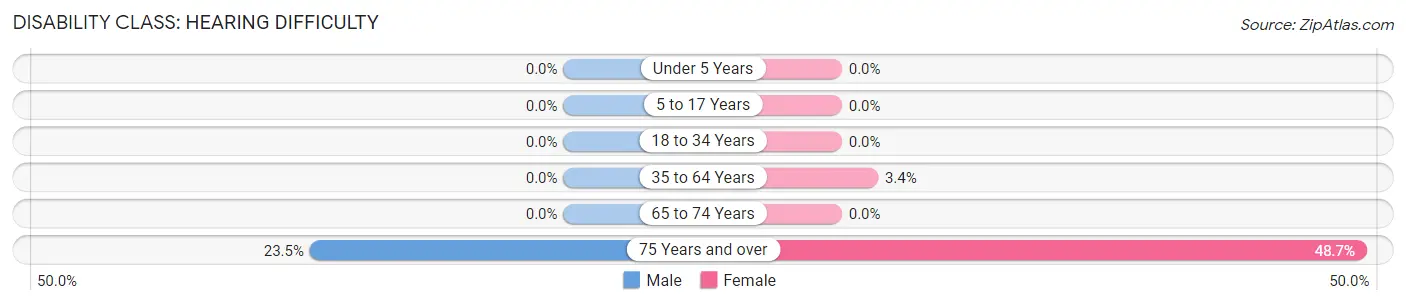
| Age Bracket | Male | Female |
| Under 5 Years | 0 (0.0%) | 0 (0.0%) |
| 5 to 17 Years | 0 (0.0%) | 0 (0.0%) |
| 18 to 34 Years | 0 (0.0%) | 0 (0.0%) |
| 35 to 64 Years | 0 (0.0%) | 5 (3.4%) |
| 65 to 74 Years | 0 (0.0%) | 0 (0.0%) |
| 75 Years and over | 4 (23.5%) | 19 (48.7%) |
Disability Class: Vision Difficulty
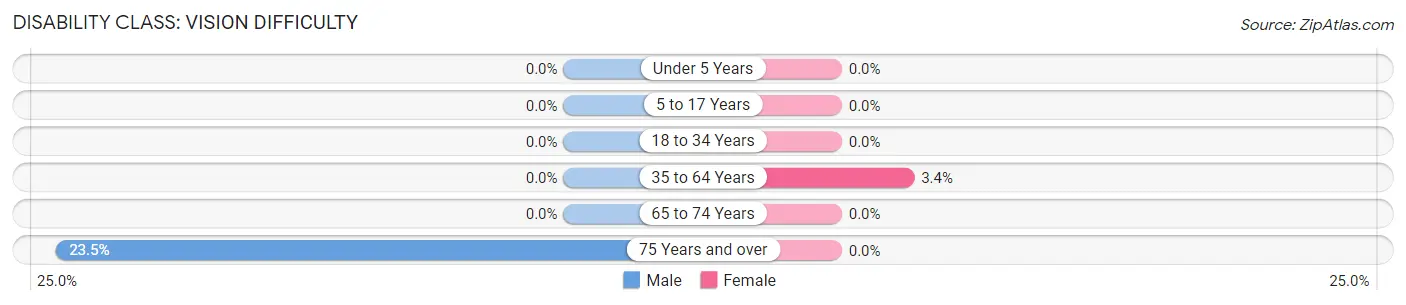
| Age Bracket | Male | Female |
| Under 5 Years | 0 (0.0%) | 0 (0.0%) |
| 5 to 17 Years | 0 (0.0%) | 0 (0.0%) |
| 18 to 34 Years | 0 (0.0%) | 0 (0.0%) |
| 35 to 64 Years | 0 (0.0%) | 5 (3.4%) |
| 65 to 74 Years | 0 (0.0%) | 0 (0.0%) |
| 75 Years and over | 4 (23.5%) | 0 (0.0%) |
Disability Class: Cognitive Difficulty
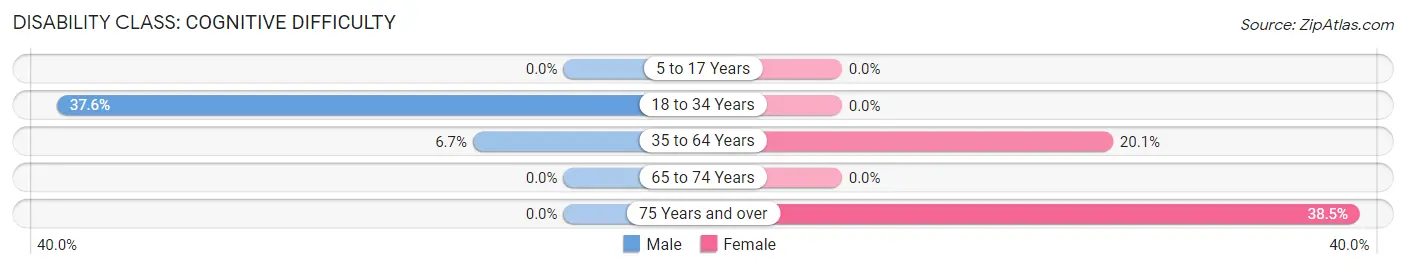
| Age Bracket | Male | Female |
| 5 to 17 Years | 0 (0.0%) | 0 (0.0%) |
| 18 to 34 Years | 41 (37.6%) | 0 (0.0%) |
| 35 to 64 Years | 9 (6.7%) | 30 (20.1%) |
| 65 to 74 Years | 0 (0.0%) | 0 (0.0%) |
| 75 Years and over | 0 (0.0%) | 15 (38.5%) |
Disability Class: Ambulatory Difficulty
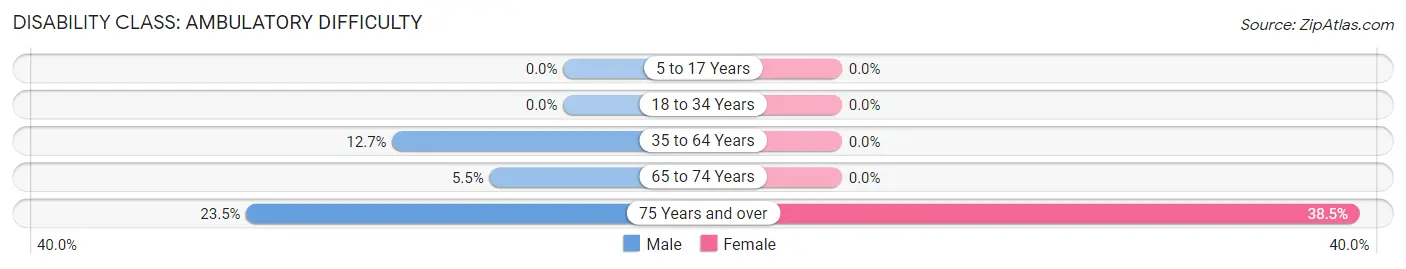
| Age Bracket | Male | Female |
| 5 to 17 Years | 0 (0.0%) | 0 (0.0%) |
| 18 to 34 Years | 0 (0.0%) | 0 (0.0%) |
| 35 to 64 Years | 17 (12.7%) | 0 (0.0%) |
| 65 to 74 Years | 4 (5.5%) | 0 (0.0%) |
| 75 Years and over | 4 (23.5%) | 15 (38.5%) |
Disability Class: Self-Care Difficulty
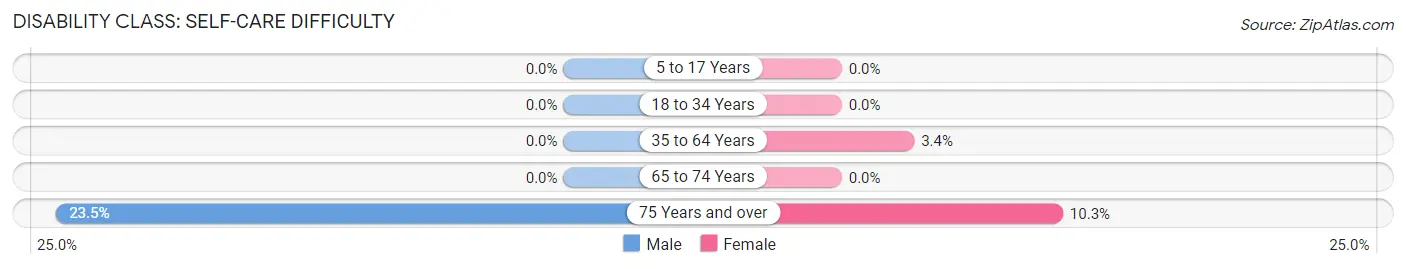
| Age Bracket | Male | Female |
| 5 to 17 Years | 0 (0.0%) | 0 (0.0%) |
| 18 to 34 Years | 0 (0.0%) | 0 (0.0%) |
| 35 to 64 Years | 0 (0.0%) | 5 (3.4%) |
| 65 to 74 Years | 0 (0.0%) | 0 (0.0%) |
| 75 Years and over | 4 (23.5%) | 4 (10.3%) |
Technology Access in Eighty Four
Computing Device Access in Eighty Four
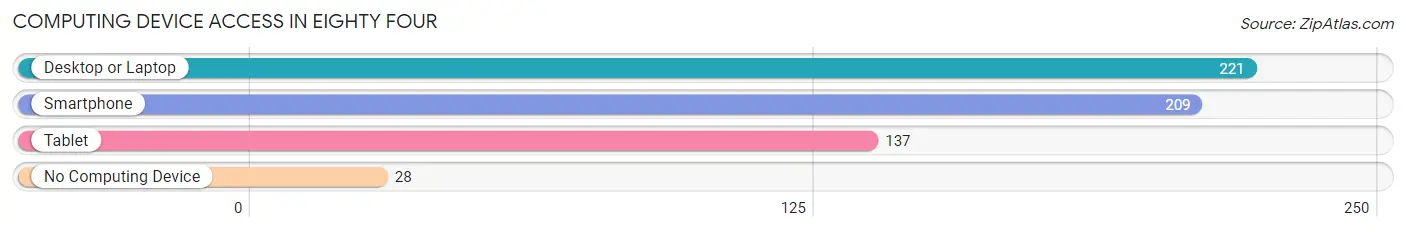
| Device Type | # Households | % Households |
| Desktop or Laptop | 221 | 86.3% |
| Smartphone | 209 | 81.6% |
| Tablet | 137 | 53.5% |
| No Computing Device | 28 | 10.9% |
| Total | 256 | 100.0% |
Internet Access in Eighty Four
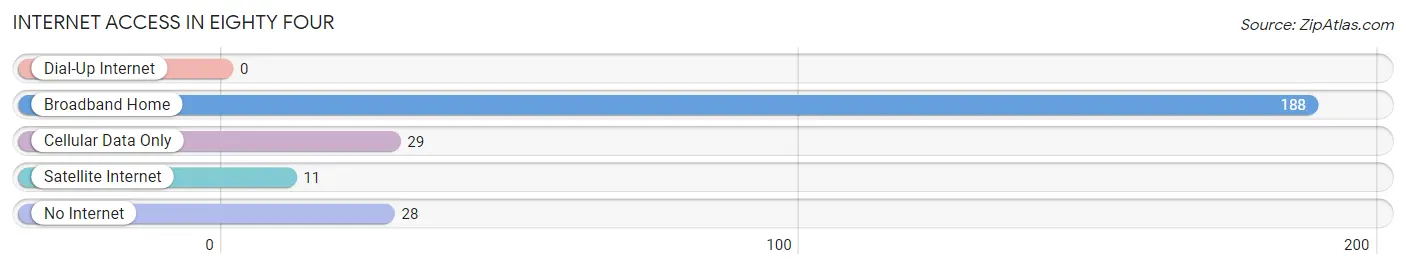
| Internet Type | # Households | % Households |
| Dial-Up Internet | 0 | 0.0% |
| Broadband Home | 188 | 73.4% |
| Cellular Data Only | 29 | 11.3% |
| Satellite Internet | 11 | 4.3% |
| No Internet | 28 | 10.9% |
| Total | 256 | 100.0% |
Eighty Four Summary
Eighty Four, Pennsylvania is a small borough located in Washington County, Pennsylvania. It is situated in the southwestern corner of the state, approximately 25 miles south of Pittsburgh. The population of Eighty Four was 1,845 at the 2010 census.
History
Eighty Four was founded in 1884 by William and Mary Ann Miller. The Millers named the town after the year they arrived, 1884. The town was originally known as Miller’s Crossroads, but the name was changed to Eighty Four in 1887.
The town was originally a farming community, but it soon became a center for coal mining. The coal industry was the main source of employment for the town’s residents until the 1950s. The coal mines were eventually closed and the town’s economy shifted to other industries, such as manufacturing and retail.
Geography
Eighty Four is located in southwestern Pennsylvania, approximately 25 miles south of Pittsburgh. The borough is situated in the Monongahela Valley, which is part of the Appalachian Plateau. The borough is bordered by the townships of North Strabane, Somerset, and Amwell.
The borough is located at an elevation of 1,068 feet above sea level. The climate is humid continental, with hot summers and cold winters. The average annual temperature is 52.3°F, and the average annual precipitation is 40.2 inches.
Economy
The economy of Eighty Four is largely based on manufacturing and retail. The borough is home to several manufacturing companies, including a steel mill, a plastics factory, and a paper mill. The retail sector is also important to the local economy, with several stores and restaurants located in the borough.
The borough also has a small tourism industry, with several attractions located in the area. These include the Eighty Four Community Park, the Eighty Four Historical Society Museum, and the Eighty Four Country Club.
Demographics
As of the 2010 census, the population of Eighty Four was 1,845. The racial makeup of the borough was 97.2% White, 0.9% African American, 0.2% Native American, 0.3% Asian, 0.1% Pacific Islander, 0.3% from other races, and 0.9% from two or more races. Hispanic or Latino of any race were 1.2% of the population.
The median household income in Eighty Four was $45,938, and the median family income was $51,938. The per capita income was $20,938. About 8.2% of families and 10.2% of the population were below the poverty line, including 14.2% of those under age 18 and 6.2% of those age 65 or over.
Eighty Four is a small borough with a rich history and a diverse economy. The borough is home to several manufacturing and retail businesses, as well as several attractions. The population of the borough is largely white, with a small minority population. The median household income is slightly above the national average, and the poverty rate is slightly below the national average.
Common Questions
What is Per Capita Income in Eighty Four?
Per Capita income in Eighty Four is $39,405.
What is the Median Family Income in Eighty Four?
Median Family Income in Eighty Four is $125,215.
What is the Median Household income in Eighty Four?
Median Household Income in Eighty Four is $110,833.
What is Inequality or Gini Index in Eighty Four?
Inequality or Gini Index in Eighty Four is 0.36.
What is the Total Population of Eighty Four?
Total Population of Eighty Four is 653.
What is the Total Male Population of Eighty Four?
Total Male Population of Eighty Four is 372.
What is the Total Female Population of Eighty Four?
Total Female Population of Eighty Four is 281.
What is the Ratio of Males per 100 Females in Eighty Four?
There are 132.38 Males per 100 Females in Eighty Four.
What is the Ratio of Females per 100 Males in Eighty Four?
There are 75.54 Females per 100 Males in Eighty Four.
What is the Median Population Age in Eighty Four?
Median Population Age in Eighty Four is 51.3 Years.
What is the Average Family Size in Eighty Four
Average Family Size in Eighty Four is 3.1 People.
What is the Average Household Size in Eighty Four
Average Household Size in Eighty Four is 2.5 People.
How Large is the Labor Force in Eighty Four?
There are 269 People in the Labor Forcein in Eighty Four.
What is the Percentage of People in the Labor Force in Eighty Four?
45.8% of People are in the Labor Force in Eighty Four.