Kreamer, PA Map & Demographics
Kreamer Map
Kreamer Overview
$38,575
PER CAPITA INCOME
$89,000
AVG FAMILY INCOME
$56,250
AVG HOUSEHOLD INCOME
31.3%
WAGE / INCOME GAP [ % ]
68.7¢/ $1
WAGE / INCOME GAP [ $ ]
0.39
INEQUALITY / GINI INDEX
536
TOTAL POPULATION
229
MALE POPULATION
307
FEMALE POPULATION
74.59
MALES / 100 FEMALES
134.06
FEMALES / 100 MALES
57.3
MEDIAN AGE
2.5
AVG FAMILY SIZE
2.0
AVG HOUSEHOLD SIZE
330
LABOR FORCE [ PEOPLE ]
69.5%
PERCENT IN LABOR FORCE
Kreamer Area Codes
Income in Kreamer
Income Overview in Kreamer
Per Capita Income in Kreamer is $38,575, while median incomes of families and households are $89,000 and $56,250 respectively.
| Characteristic | Number | Measure |
| Per Capita Income | 536 | $38,575 |
| Median Family Income | 178 | $89,000 |
| Mean Family Income | 178 | $93,667 |
| Median Household Income | 264 | $56,250 |
| Mean Household Income | 264 | $75,827 |
| Income Deficit | 178 | $0 |
| Wage / Income Gap (%) | 536 | 31.29% |
| Wage / Income Gap ($) | 536 | 68.71¢ per $1 |
| Gini / Inequality Index | 536 | 0.39 |
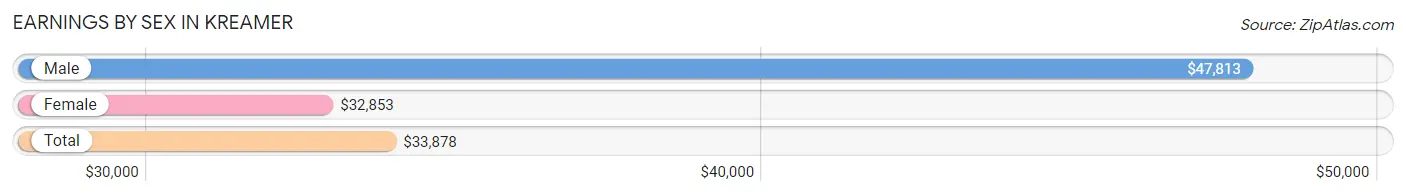
Earnings by Sex in Kreamer
Average Earnings in Kreamer are $33,878, $47,813 for men and $32,853 for women, a difference of 31.3%.
| Sex | Number | Average Earnings |
| Male | 166 (49.3%) | $47,813 |
| Female | 171 (50.7%) | $32,853 |
| Total | 337 (100.0%) | $33,878 |
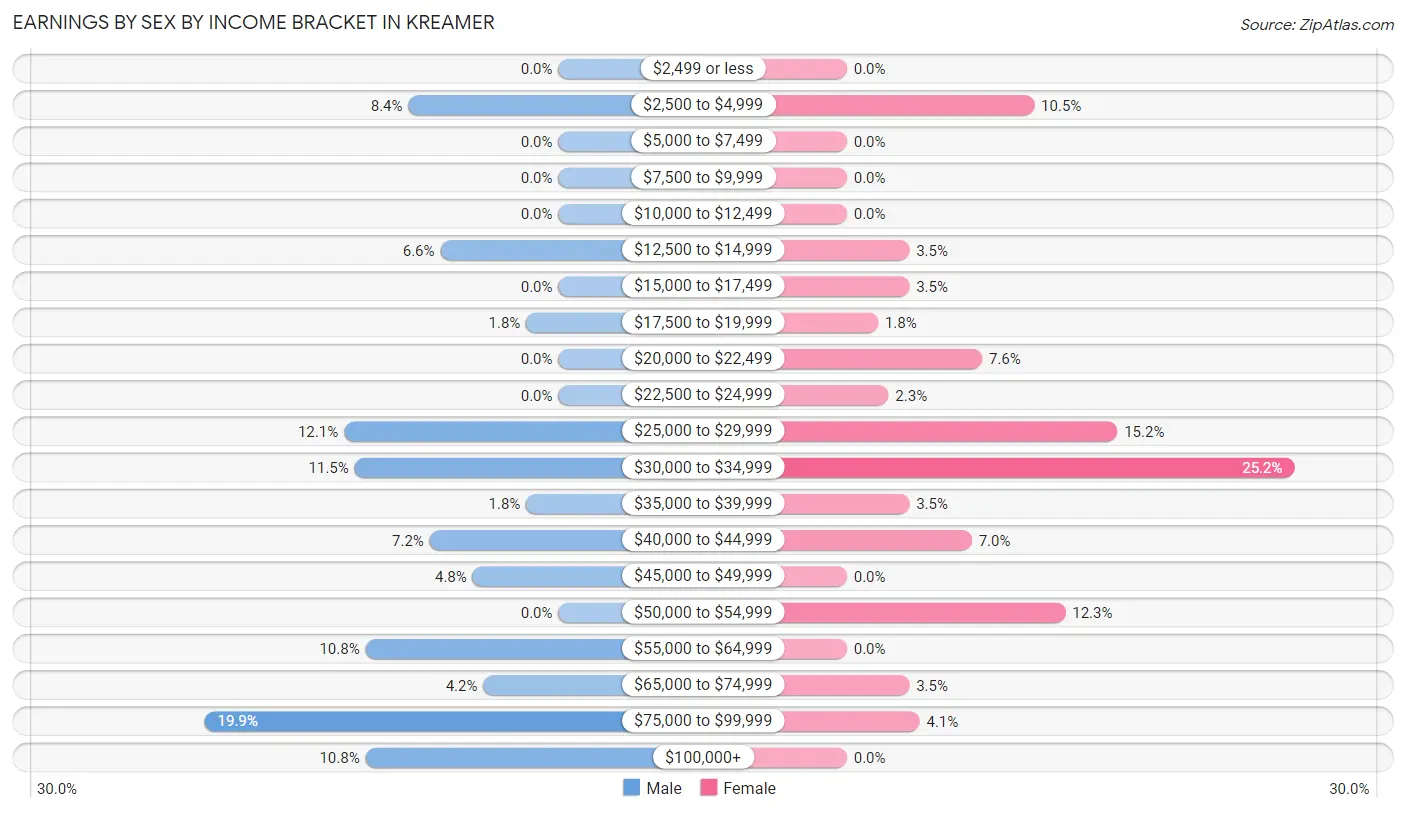
Earnings by Sex by Income Bracket in Kreamer
The most common earnings brackets in Kreamer are $75,000 to $99,999 for men (33 | 19.9%) and $30,000 to $34,999 for women (43 | 25.2%).
| Income | Male | Female |
| $2,499 or less | 0 (0.0%) | 0 (0.0%) |
| $2,500 to $4,999 | 14 (8.4%) | 18 (10.5%) |
| $5,000 to $7,499 | 0 (0.0%) | 0 (0.0%) |
| $7,500 to $9,999 | 0 (0.0%) | 0 (0.0%) |
| $10,000 to $12,499 | 0 (0.0%) | 0 (0.0%) |
| $12,500 to $14,999 | 11 (6.6%) | 6 (3.5%) |
| $15,000 to $17,499 | 0 (0.0%) | 6 (3.5%) |
| $17,500 to $19,999 | 3 (1.8%) | 3 (1.8%) |
| $20,000 to $22,499 | 0 (0.0%) | 13 (7.6%) |
| $22,500 to $24,999 | 0 (0.0%) | 4 (2.3%) |
| $25,000 to $29,999 | 20 (12.0%) | 26 (15.2%) |
| $30,000 to $34,999 | 19 (11.5%) | 43 (25.2%) |
| $35,000 to $39,999 | 3 (1.8%) | 6 (3.5%) |
| $40,000 to $44,999 | 12 (7.2%) | 12 (7.0%) |
| $45,000 to $49,999 | 8 (4.8%) | 0 (0.0%) |
| $50,000 to $54,999 | 0 (0.0%) | 21 (12.3%) |
| $55,000 to $64,999 | 18 (10.8%) | 0 (0.0%) |
| $65,000 to $74,999 | 7 (4.2%) | 6 (3.5%) |
| $75,000 to $99,999 | 33 (19.9%) | 7 (4.1%) |
| $100,000+ | 18 (10.8%) | 0 (0.0%) |
| Total | 166 (100.0%) | 171 (100.0%) |
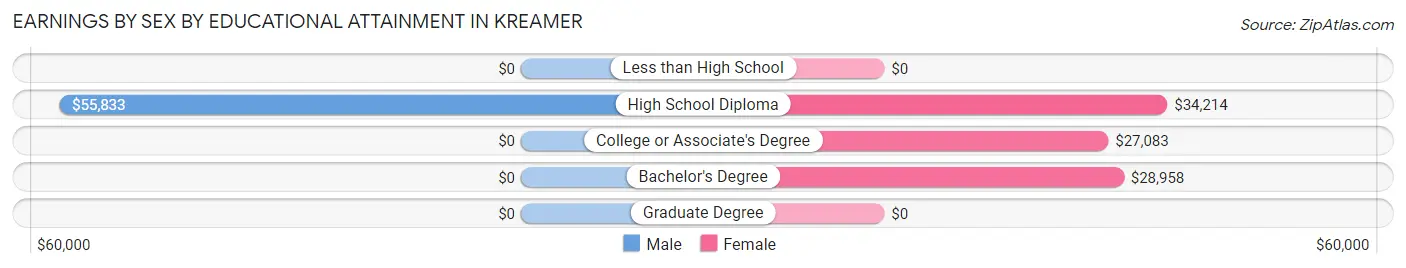
Earnings by Sex by Educational Attainment in Kreamer
Average earnings in Kreamer are $52,500 for men and $33,205 for women, a difference of 36.7%. Men with an educational attainment of high school diploma enjoy the highest average annual earnings of $55,833, while those with high school diploma education earn the least with $55,833. Women with an educational attainment of high school diploma earn the most with the average annual earnings of $34,214, while those with college or associate's degree education have the smallest earnings of $27,083.
| Educational Attainment | Male Income | Female Income |
| Less than High School | - | - |
| High School Diploma | $55,833 | $34,214 |
| College or Associate's Degree | - | - |
| Bachelor's Degree | - | - |
| Graduate Degree | - | - |
| Total | $52,500 | $33,205 |
Family Income in Kreamer
Family Income Brackets in Kreamer
According to the Kreamer family income data, there are 58 families falling into the $50,000 to $74,999 income range, which is the most common income bracket and makes up 32.6% of all families.
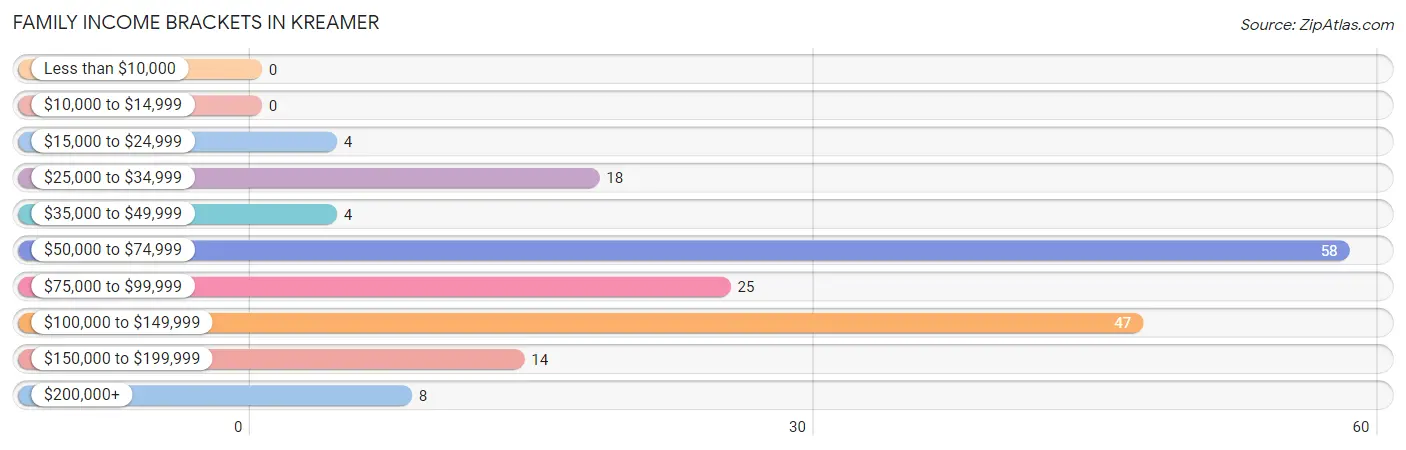
| Income Bracket | # Families | % Families |
| Less than $10,000 | 0 | 0.0% |
| $10,000 to $14,999 | 0 | 0.0% |
| $15,000 to $24,999 | 4 | 2.2% |
| $25,000 to $34,999 | 18 | 10.1% |
| $35,000 to $49,999 | 4 | 2.2% |
| $50,000 to $74,999 | 58 | 32.6% |
| $75,000 to $99,999 | 25 | 14.0% |
| $100,000 to $149,999 | 47 | 26.4% |
| $150,000 to $199,999 | 14 | 7.9% |
| $200,000+ | 8 | 4.5% |
Family Income by Famaliy Size in Kreamer
4-person families (18 | 10.1%) account for the highest median family income in Kreamer with $130,938 per family, while 2-person families (139 | 78.1%) have the highest median income of $36,812 per family member.
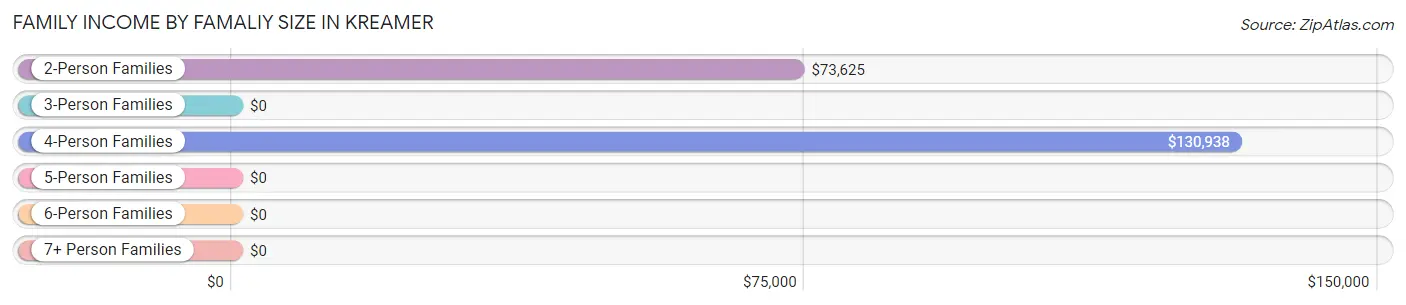
| Income Bracket | # Families | Median Income |
| 2-Person Families | 139 (78.1%) | $73,625 |
| 3-Person Families | 16 (9.0%) | $0 |
| 4-Person Families | 18 (10.1%) | $130,938 |
| 5-Person Families | 5 (2.8%) | $0 |
| 6-Person Families | 0 (0.0%) | $0 |
| 7+ Person Families | 0 (0.0%) | $0 |
| Total | 178 (100.0%) | $89,000 |
Family Income by Number of Earners in Kreamer
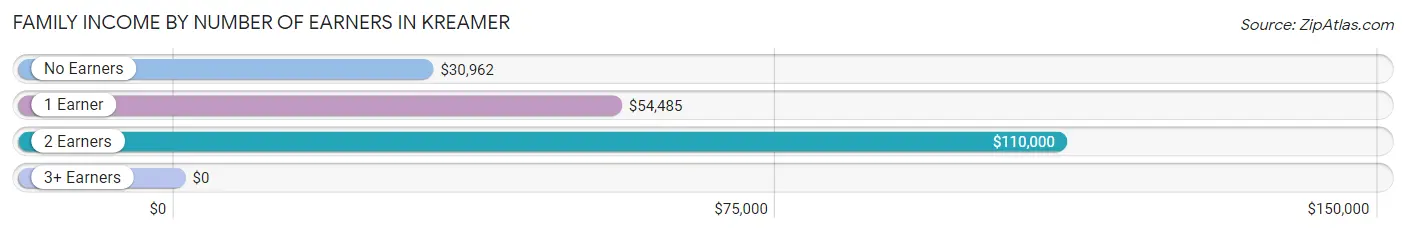
| Number of Earners | # Families | Median Income |
| No Earners | 28 (15.7%) | $30,962 |
| 1 Earner | 57 (32.0%) | $54,485 |
| 2 Earners | 84 (47.2%) | $110,000 |
| 3+ Earners | 9 (5.1%) | $0 |
| Total | 178 (100.0%) | $89,000 |
Household Income in Kreamer
Household Income Brackets in Kreamer
With 65 households falling in the category, the $50,000 to $74,999 income range is the most frequent in Kreamer, accounting for 24.6% of all households. In contrast, only 4 households (1.5%) fall into the $15,000 to $24,999 income bracket, making it the least populous group.
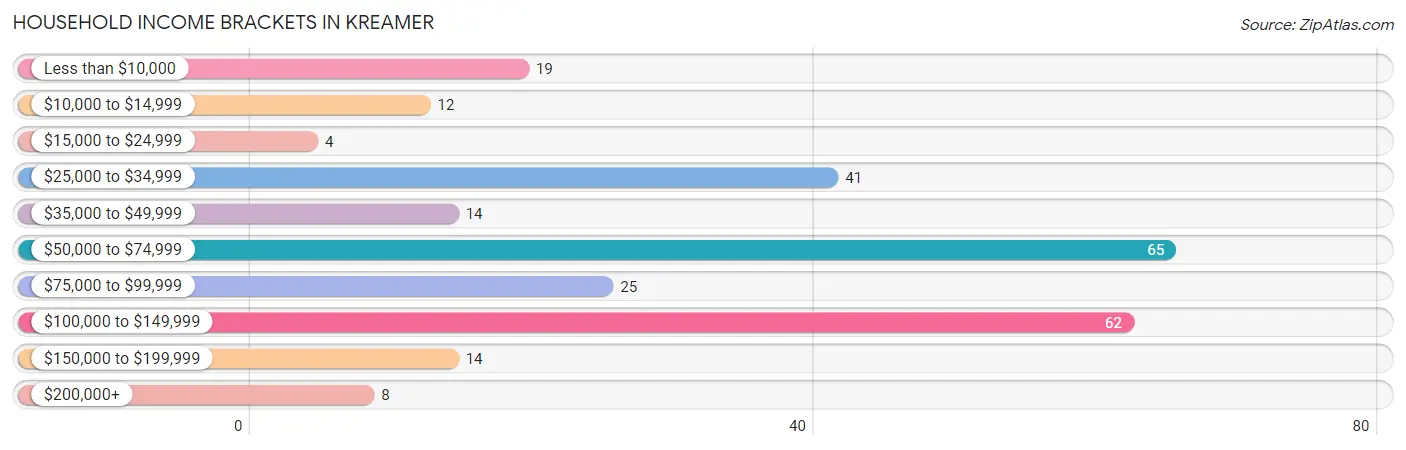
| Income Bracket | # Households | % Households |
| Less than $10,000 | 19 | 7.2% |
| $10,000 to $14,999 | 12 | 4.5% |
| $15,000 to $24,999 | 4 | 1.5% |
| $25,000 to $34,999 | 41 | 15.5% |
| $35,000 to $49,999 | 14 | 5.3% |
| $50,000 to $74,999 | 65 | 24.6% |
| $75,000 to $99,999 | 25 | 9.5% |
| $100,000 to $149,999 | 62 | 23.5% |
| $150,000 to $199,999 | 14 | 5.3% |
| $200,000+ | 8 | 3.0% |
Household Income by Householder Age in Kreamer
The median household income in Kreamer is $56,250, with the highest median household income of $114,107 found in the 25 to 44 years age bracket for the primary householder. A total of 43 households (16.3%) fall into this category. Meanwhile, the 15 to 24 years age bracket for the primary householder has the lowest median household income of $0, with 14 households (5.3%) in this group.
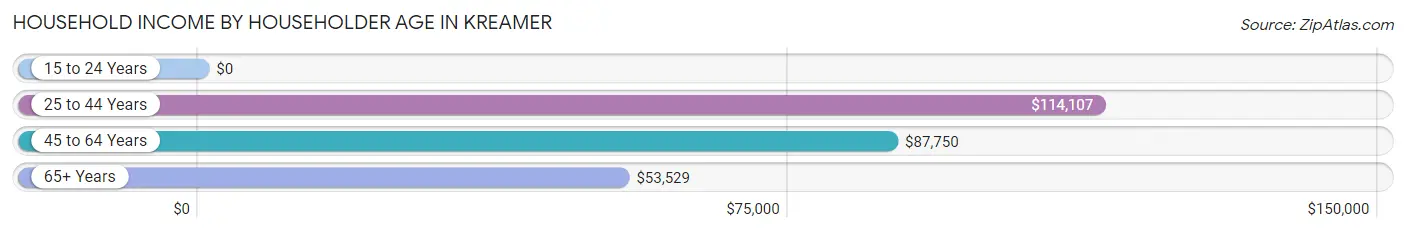
| Income Bracket | # Households | Median Income |
| 15 to 24 Years | 14 (5.3%) | $0 |
| 25 to 44 Years | 43 (16.3%) | $114,107 |
| 45 to 64 Years | 105 (39.8%) | $87,750 |
| 65+ Years | 102 (38.6%) | $53,529 |
| Total | 264 (100.0%) | $56,250 |
Poverty in Kreamer
Income Below Poverty by Sex and Age in Kreamer
With 7.9% poverty level for males and 5.2% for females among the residents of Kreamer, 18 to 24 year old males and 25 to 34 year old females are the most vulnerable to poverty, with 14 males (100.0%) and 7 females (41.2%) in their respective age groups living below the poverty level.
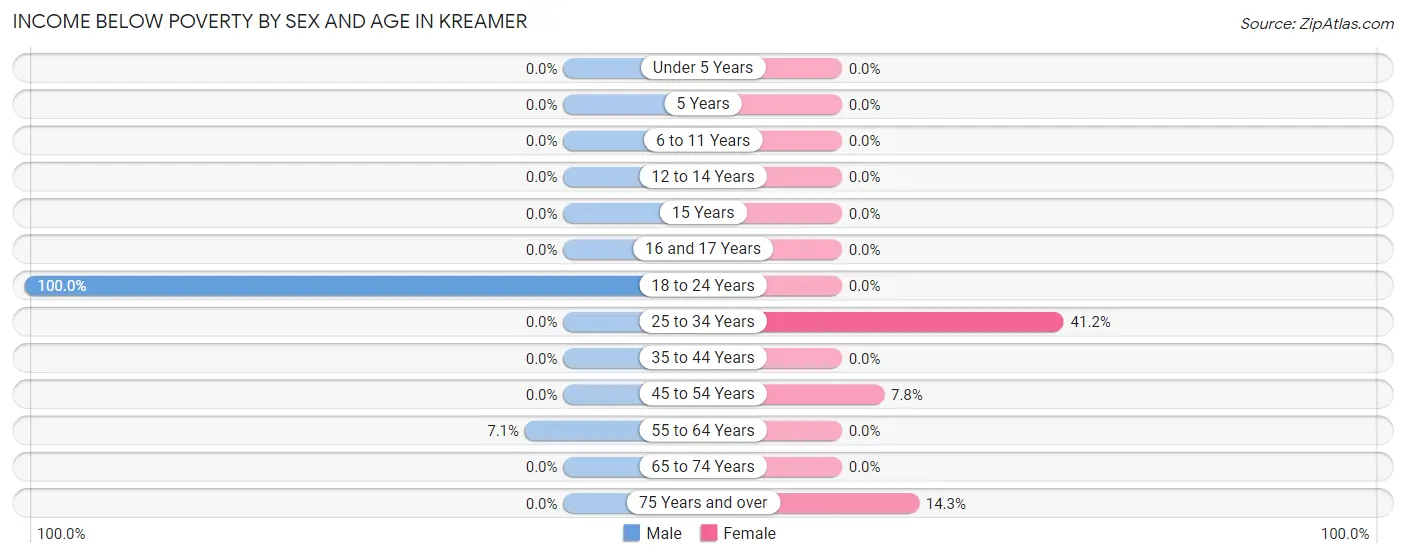
| Age Bracket | Male | Female |
| Under 5 Years | 0 (0.0%) | 0 (0.0%) |
| 5 Years | 0 (0.0%) | 0 (0.0%) |
| 6 to 11 Years | 0 (0.0%) | 0 (0.0%) |
| 12 to 14 Years | 0 (0.0%) | 0 (0.0%) |
| 15 Years | 0 (0.0%) | 0 (0.0%) |
| 16 and 17 Years | 0 (0.0%) | 0 (0.0%) |
| 18 to 24 Years | 14 (100.0%) | 0 (0.0%) |
| 25 to 34 Years | 0 (0.0%) | 7 (41.2%) |
| 35 to 44 Years | 0 (0.0%) | 0 (0.0%) |
| 45 to 54 Years | 0 (0.0%) | 4 (7.8%) |
| 55 to 64 Years | 4 (7.1%) | 0 (0.0%) |
| 65 to 74 Years | 0 (0.0%) | 0 (0.0%) |
| 75 Years and over | 0 (0.0%) | 5 (14.3%) |
| Total | 18 (7.9%) | 16 (5.2%) |
Income Above Poverty by Sex and Age in Kreamer
According to the poverty statistics in Kreamer, males aged under 5 years and females aged under 5 years are the age groups that are most secure financially, with 100.0% of males and 100.0% of females in these age groups living above the poverty line.
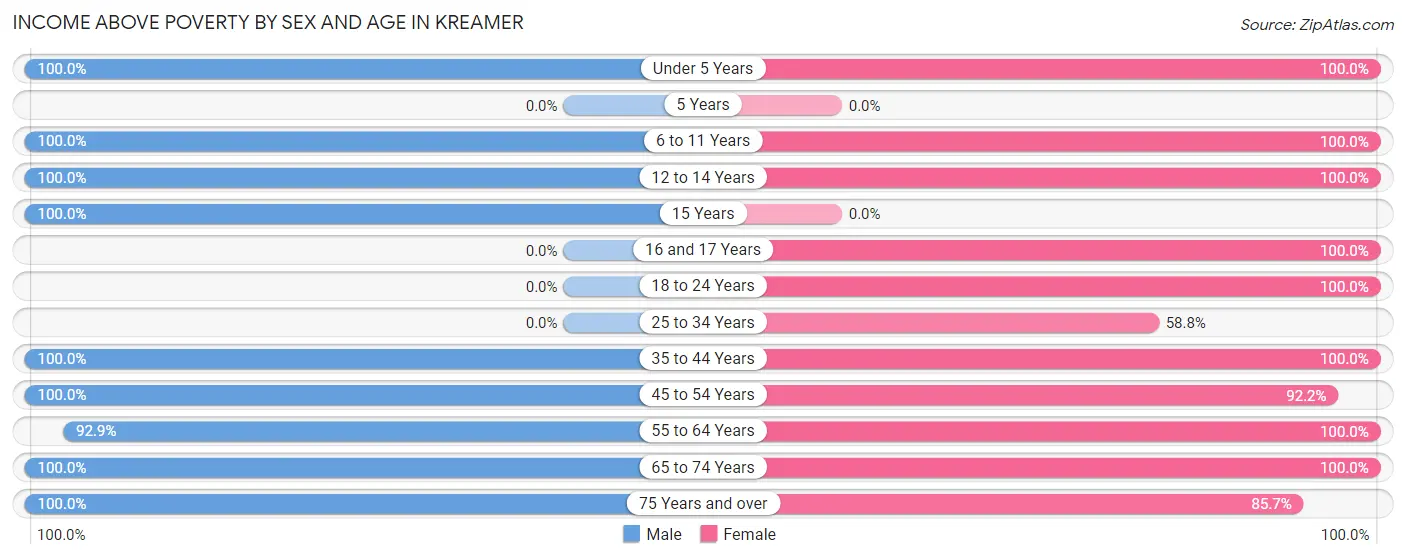
| Age Bracket | Male | Female |
| Under 5 Years | 6 (100.0%) | 15 (100.0%) |
| 5 Years | 0 (0.0%) | 0 (0.0%) |
| 6 to 11 Years | 5 (100.0%) | 14 (100.0%) |
| 12 to 14 Years | 10 (100.0%) | 6 (100.0%) |
| 15 Years | 5 (100.0%) | 0 (0.0%) |
| 16 and 17 Years | 0 (0.0%) | 11 (100.0%) |
| 18 to 24 Years | 0 (0.0%) | 5 (100.0%) |
| 25 to 34 Years | 0 (0.0%) | 10 (58.8%) |
| 35 to 44 Years | 27 (100.0%) | 25 (100.0%) |
| 45 to 54 Years | 40 (100.0%) | 47 (92.2%) |
| 55 to 64 Years | 52 (92.9%) | 81 (100.0%) |
| 65 to 74 Years | 28 (100.0%) | 47 (100.0%) |
| 75 Years and over | 38 (100.0%) | 30 (85.7%) |
| Total | 211 (92.1%) | 291 (94.8%) |
Income Below Poverty Among Married-Couple Families in Kreamer
The poverty statistics for married-couple families in Kreamer show that 2.6% or 4 of the total 152 families live below the poverty line. Families with no children have the highest poverty rate of 3.5%, comprising of 4 families. On the other hand, families with 1 or 2 children have the lowest poverty rate of 0.0%, which includes 0 families.
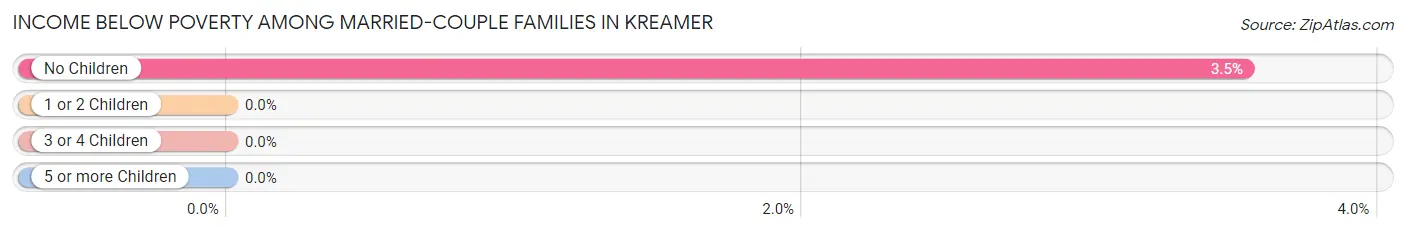
| Children | Above Poverty | Below Poverty |
| No Children | 109 (96.5%) | 4 (3.5%) |
| 1 or 2 Children | 34 (100.0%) | 0 (0.0%) |
| 3 or 4 Children | 5 (100.0%) | 0 (0.0%) |
| 5 or more Children | 0 (0.0%) | 0 (0.0%) |
| Total | 148 (97.4%) | 4 (2.6%) |
Income Below Poverty Among Single-Parent Households in Kreamer
| Children | Single Father | Single Mother |
| No Children | 0 (0.0%) | 0 (0.0%) |
| 1 or 2 Children | 0 (0.0%) | 0 (0.0%) |
| 3 or 4 Children | 0 (0.0%) | 0 (0.0%) |
| 5 or more Children | 0 (0.0%) | 0 (0.0%) |
| Total | 0 (0.0%) | 0 (0.0%) |
Income Below Poverty Among Married-Couple vs Single-Parent Households in Kreamer
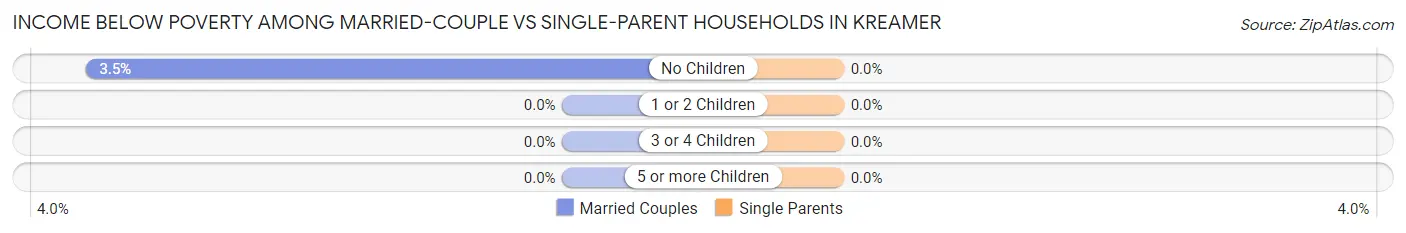
| Children | Married-Couple Families | Single-Parent Households |
| No Children | 4 (3.5%) | 0 (0.0%) |
| 1 or 2 Children | 0 (0.0%) | 0 (0.0%) |
| 3 or 4 Children | 0 (0.0%) | 0 (0.0%) |
| 5 or more Children | 0 (0.0%) | 0 (0.0%) |
| Total | 4 (2.6%) | 0 (0.0%) |
Race in Kreamer
The most populous races in Kreamer are , and White / Caucasian (536 | 100.0%).
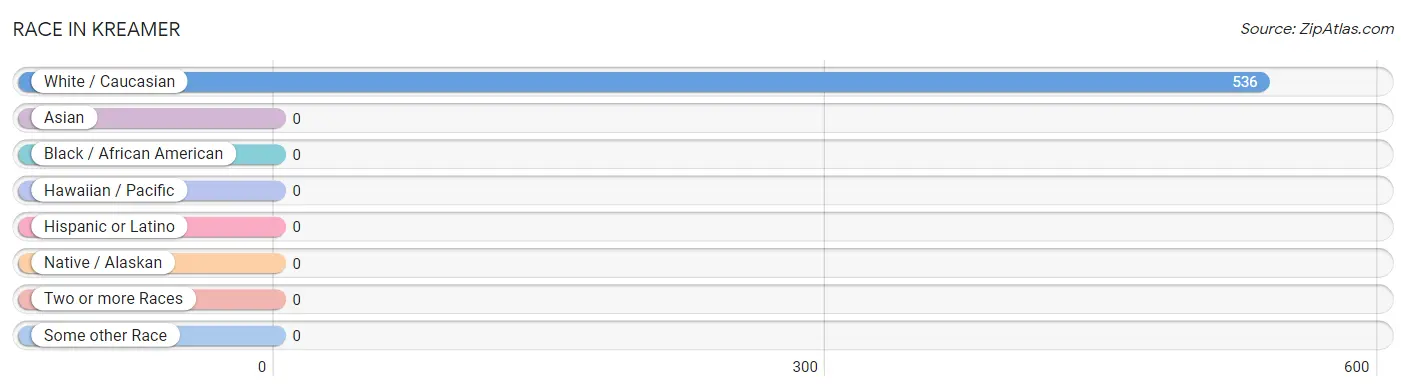
| Race | # Population | % Population |
| Asian | 0 | 0.0% |
| Black / African American | 0 | 0.0% |
| Hawaiian / Pacific | 0 | 0.0% |
| Hispanic or Latino | 0 | 0.0% |
| Native / Alaskan | 0 | 0.0% |
| White / Caucasian | 536 | 100.0% |
| Two or more Races | 0 | 0.0% |
| Some other Race | 0 | 0.0% |
| Total | 536 | 100.0% |
Ancestry in Kreamer
The most populous ancestries reported in Kreamer are German (329 | 61.4%), Pennsylvania German (42 | 7.8%), Irish (38 | 7.1%), Polish (38 | 7.1%), and Slovak (21 | 3.9%), together accounting for 87.3% of all Kreamer residents.
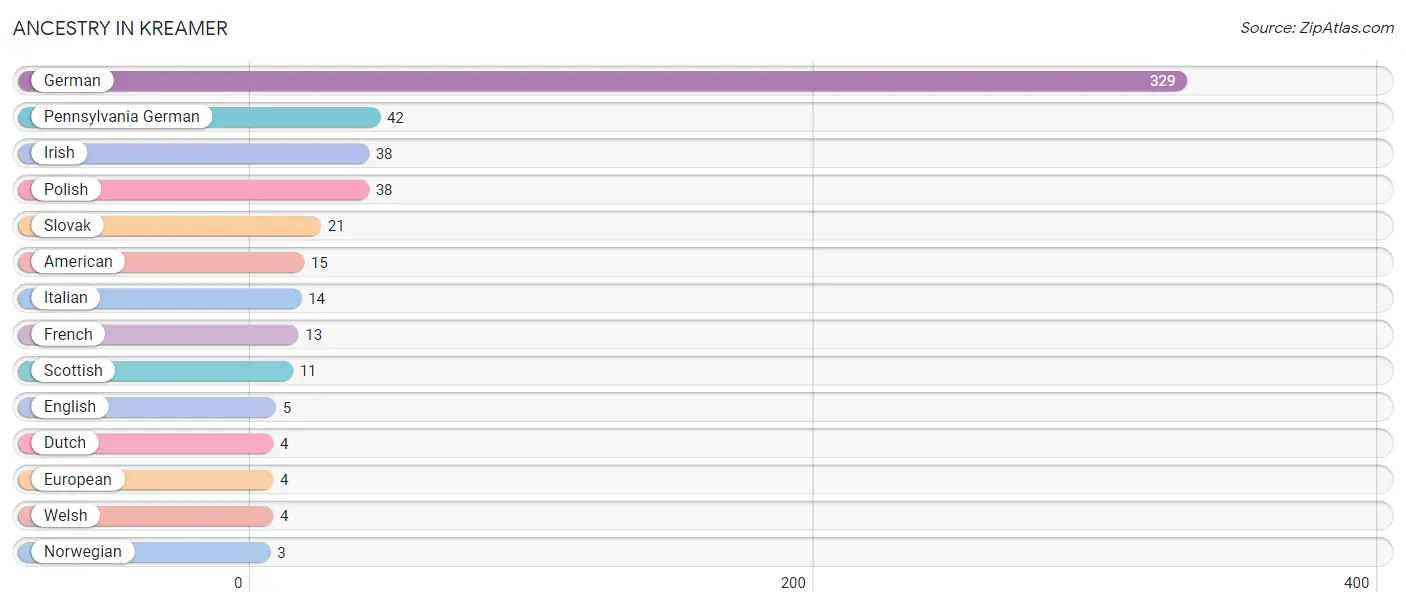
| Ancestry | # Population | % Population |
| American | 15 | 2.8% |
| Dutch | 4 | 0.7% |
| English | 5 | 0.9% |
| European | 4 | 0.7% |
| French | 13 | 2.4% |
| German | 329 | 61.4% |
| Irish | 38 | 7.1% |
| Italian | 14 | 2.6% |
| Norwegian | 3 | 0.6% |
| Pennsylvania German | 42 | 7.8% |
| Polish | 38 | 7.1% |
| Scottish | 11 | 2.1% |
| Slovak | 21 | 3.9% |
| Welsh | 4 | 0.7% | View All 14 Rows |
Immigrants in Kreamer

| Immigration Origin | # Population | % Population | View All 0 Rows |
Sex and Age in Kreamer
Sex and Age in Kreamer
The most populous age groups in Kreamer are 50 to 54 Years (40 | 17.5%) for men and 60 to 64 Years (64 | 20.8%) for women.
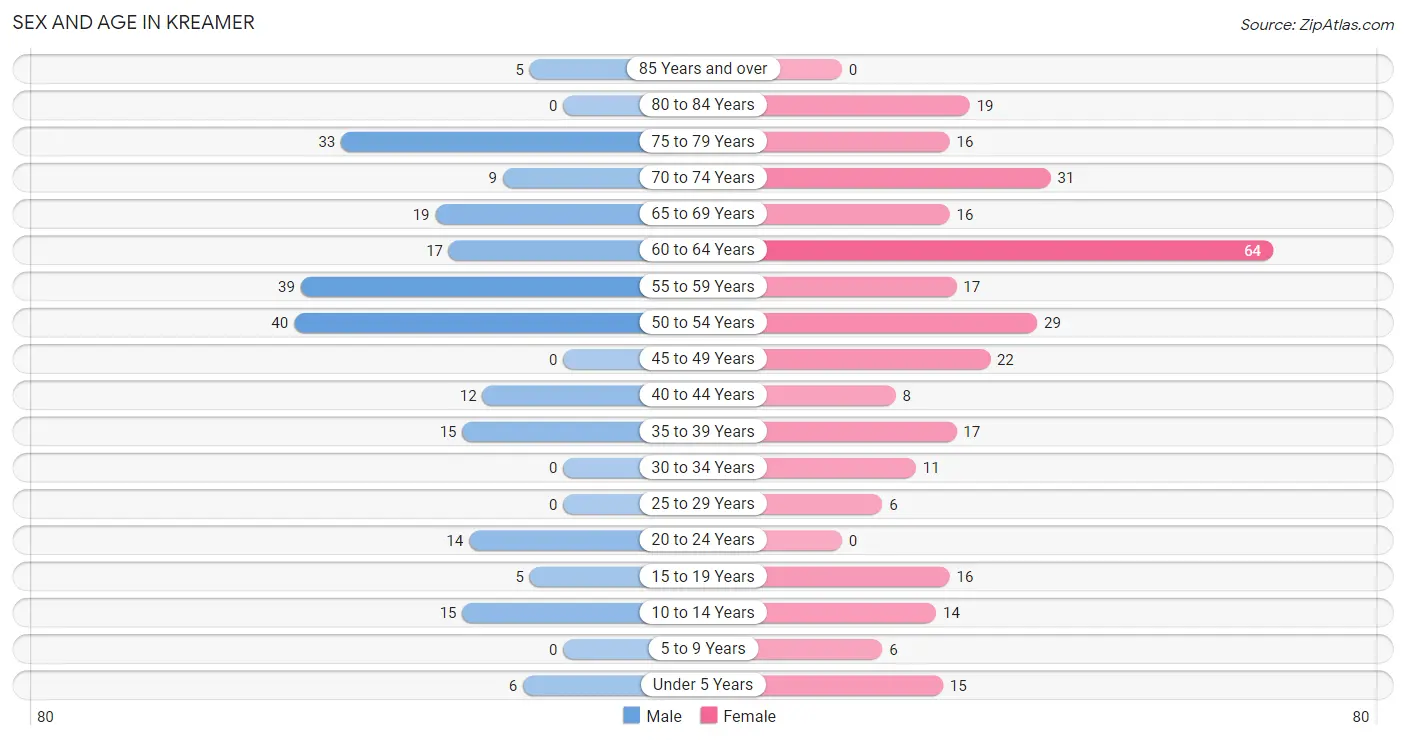
| Age Bracket | Male | Female |
| Under 5 Years | 6 (2.6%) | 15 (4.9%) |
| 5 to 9 Years | 0 (0.0%) | 6 (1.9%) |
| 10 to 14 Years | 15 (6.6%) | 14 (4.6%) |
| 15 to 19 Years | 5 (2.2%) | 16 (5.2%) |
| 20 to 24 Years | 14 (6.1%) | 0 (0.0%) |
| 25 to 29 Years | 0 (0.0%) | 6 (1.9%) |
| 30 to 34 Years | 0 (0.0%) | 11 (3.6%) |
| 35 to 39 Years | 15 (6.6%) | 17 (5.5%) |
| 40 to 44 Years | 12 (5.2%) | 8 (2.6%) |
| 45 to 49 Years | 0 (0.0%) | 22 (7.2%) |
| 50 to 54 Years | 40 (17.5%) | 29 (9.5%) |
| 55 to 59 Years | 39 (17.0%) | 17 (5.5%) |
| 60 to 64 Years | 17 (7.4%) | 64 (20.8%) |
| 65 to 69 Years | 19 (8.3%) | 16 (5.2%) |
| 70 to 74 Years | 9 (3.9%) | 31 (10.1%) |
| 75 to 79 Years | 33 (14.4%) | 16 (5.2%) |
| 80 to 84 Years | 0 (0.0%) | 19 (6.2%) |
| 85 Years and over | 5 (2.2%) | 0 (0.0%) |
| Total | 229 (100.0%) | 307 (100.0%) |
Families and Households in Kreamer
Median Family Size in Kreamer
The median family size in Kreamer is 2.48 persons per family, with single female/mother families (15 | 8.4%) accounting for the largest median family size of 3.33 persons per family. On the other hand, single male/father families (11 | 6.2%) represent the smallest median family size with 2.09 persons per family.
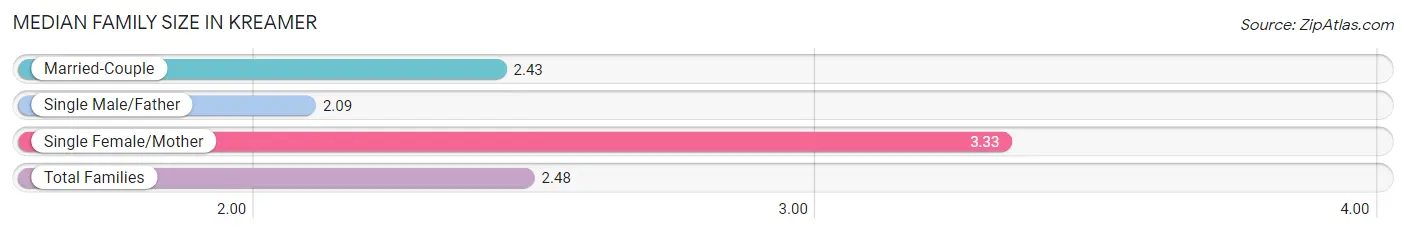
| Family Type | # Families | Family Size |
| Married-Couple | 152 (85.4%) | 2.43 |
| Single Male/Father | 11 (6.2%) | 2.09 |
| Single Female/Mother | 15 (8.4%) | 3.33 |
| Total Families | 178 (100.0%) | 2.48 |
Median Household Size in Kreamer
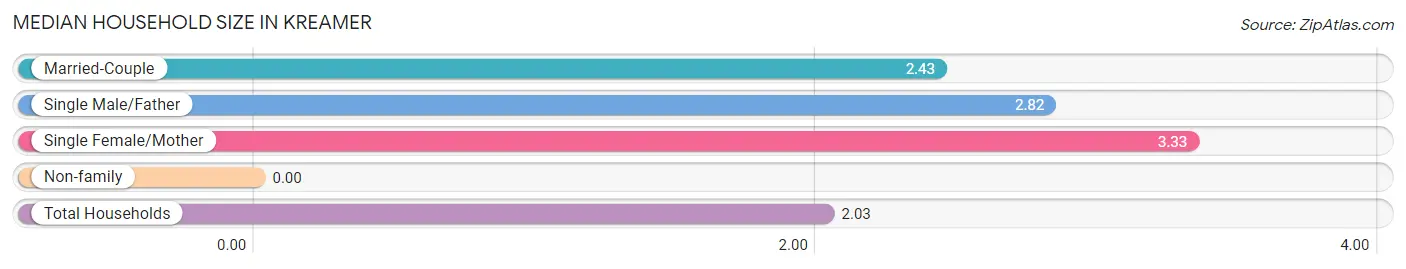
| Household Type | # Households | Household Size |
| Married-Couple | 152 (57.6%) | 2.43 |
| Single Male/Father | 11 (4.2%) | 2.82 |
| Single Female/Mother | 15 (5.7%) | 3.33 |
| Non-family | 86 (32.6%) | - |
| Total Households | 264 (100.0%) | 2.03 |
Household Size by Marriage Status in Kreamer
Out of a total of 264 households in Kreamer, 178 (67.4%) are family households, while 86 (32.6%) are nonfamily households. The most numerous type of family households are 2-person households, comprising 132, and the most common type of nonfamily households are 1-person households, comprising 86.
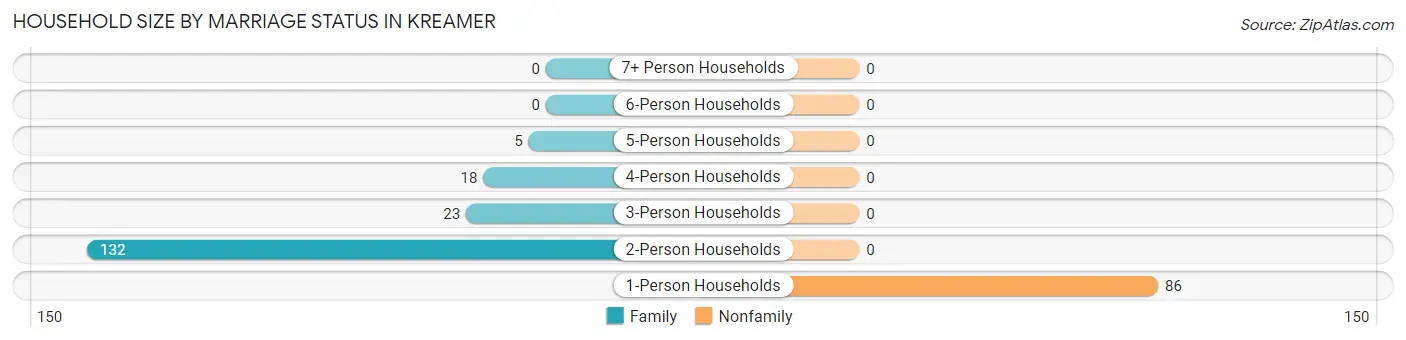
| Household Size | Family Households | Nonfamily Households |
| 1-Person Households | - | 86 (32.6%) |
| 2-Person Households | 132 (50.0%) | 0 (0.0%) |
| 3-Person Households | 23 (8.7%) | 0 (0.0%) |
| 4-Person Households | 18 (6.8%) | 0 (0.0%) |
| 5-Person Households | 5 (1.9%) | 0 (0.0%) |
| 6-Person Households | 0 (0.0%) | 0 (0.0%) |
| 7+ Person Households | 0 (0.0%) | 0 (0.0%) |
| Total | 178 (67.4%) | 86 (32.6%) |
Female Fertility in Kreamer
Fertility by Age in Kreamer
| Age Bracket | Women with Births | Births / 1,000 Women |
| 15 to 19 years | 0 (0.0%) | 0.0 |
| 20 to 34 years | 0 (0.0%) | 0.0 |
| 35 to 50 years | 0 (0.0%) | 0.0 |
| Total | 0 (0.0%) | 0.0 |
Fertility by Age by Marriage Status in Kreamer
| Age Bracket | Married | Unmarried |
| 15 to 19 years | 0 (0.0%) | 0 (0.0%) |
| 20 to 34 years | 0 (0.0%) | 0 (0.0%) |
| 35 to 50 years | 0 (0.0%) | 0 (0.0%) |
| Total | 0 (0.0%) | 0 (0.0%) |
Fertility by Education in Kreamer
| Educational Attainment | Women with Births | Births / 1,000 Women |
| Less than High School | 0 (0.0%) | 0.0 |
| High School Diploma | 0 (0.0%) | 0.0 |
| College or Associate's Degree | 0 (0.0%) | 0.0 |
| Bachelor's Degree | 0 (0.0%) | 0.0 |
| Graduate Degree | 0 (0.0%) | 0.0 |
| Total | 0 (0.0%) | 0.0 |
Fertility by Education by Marriage Status in Kreamer

| Educational Attainment | Married | Unmarried |
| Less than High School | 0 (0.0%) | 0 (0.0%) |
| High School Diploma | 0 (0.0%) | 0 (0.0%) |
| College or Associate's Degree | 0 (0.0%) | 0 (0.0%) |
| Bachelor's Degree | 0 (0.0%) | 0 (0.0%) |
| Graduate Degree | 0 (0.0%) | 0 (0.0%) |
| Total | 0 (0.0%) | 0 (0.0%) |
Employment Characteristics in Kreamer
Employment by Class of Employer in Kreamer
Among the 330 employed individuals in Kreamer, private company employees (264 | 80.0%), self-employed (not incorporated) (23 | 7.0%), and local government employees (22 | 6.7%) make up the most common classes of employment.
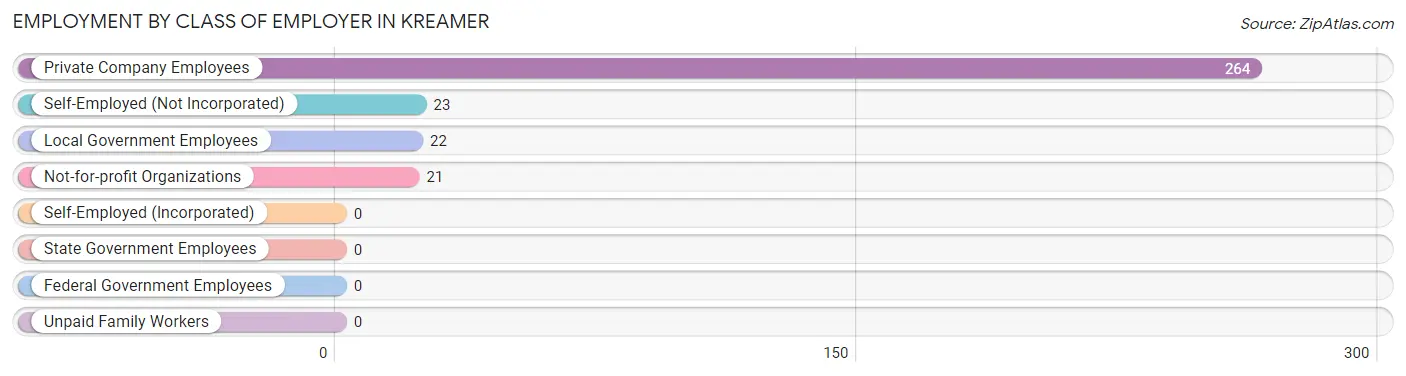
| Employer Class | # Employees | % Employees |
| Private Company Employees | 264 | 80.0% |
| Self-Employed (Incorporated) | 0 | 0.0% |
| Self-Employed (Not Incorporated) | 23 | 7.0% |
| Not-for-profit Organizations | 21 | 6.4% |
| Local Government Employees | 22 | 6.7% |
| State Government Employees | 0 | 0.0% |
| Federal Government Employees | 0 | 0.0% |
| Unpaid Family Workers | 0 | 0.0% |
| Total | 330 | 100.0% |
Employment Status by Age in Kreamer
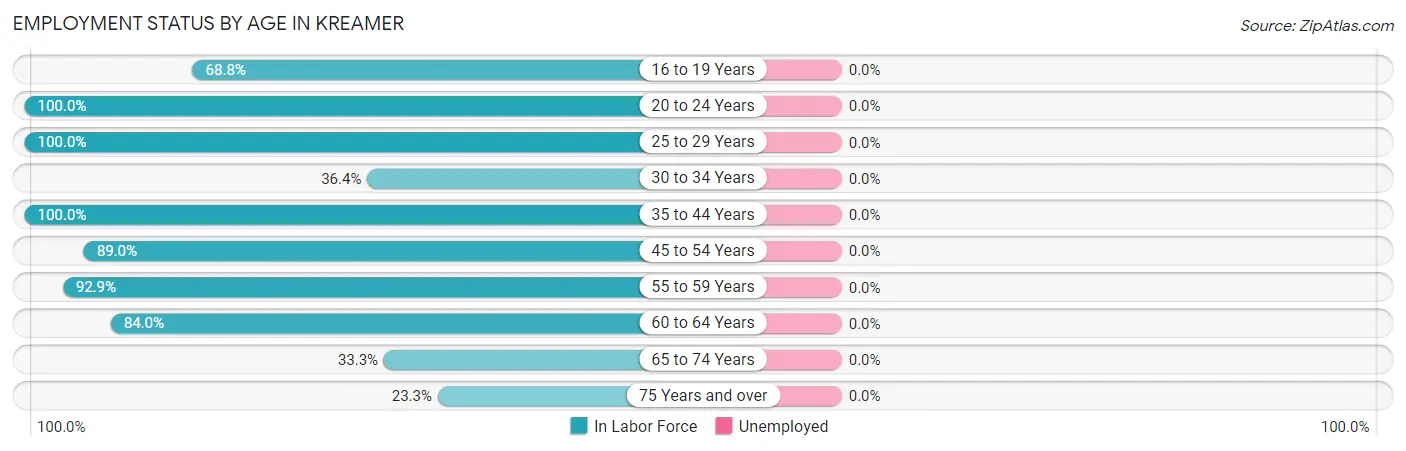
| Age Bracket | In Labor Force | Unemployed |
| 16 to 19 Years | 11 (68.8%) | 0 (0.0%) |
| 20 to 24 Years | 14 (100.0%) | 0 (0.0%) |
| 25 to 29 Years | 6 (100.0%) | 0 (0.0%) |
| 30 to 34 Years | 4 (36.4%) | 0 (0.0%) |
| 35 to 44 Years | 52 (100.0%) | 0 (0.0%) |
| 45 to 54 Years | 81 (89.0%) | 0 (0.0%) |
| 55 to 59 Years | 52 (92.9%) | 0 (0.0%) |
| 60 to 64 Years | 68 (84.0%) | 0 (0.0%) |
| 65 to 74 Years | 25 (33.3%) | 0 (0.0%) |
| 75 Years and over | 17 (23.3%) | 0 (0.0%) |
| Total | 330 (69.5%) | 0 (0.0%) |
Employment Status by Educational Attainment in Kreamer
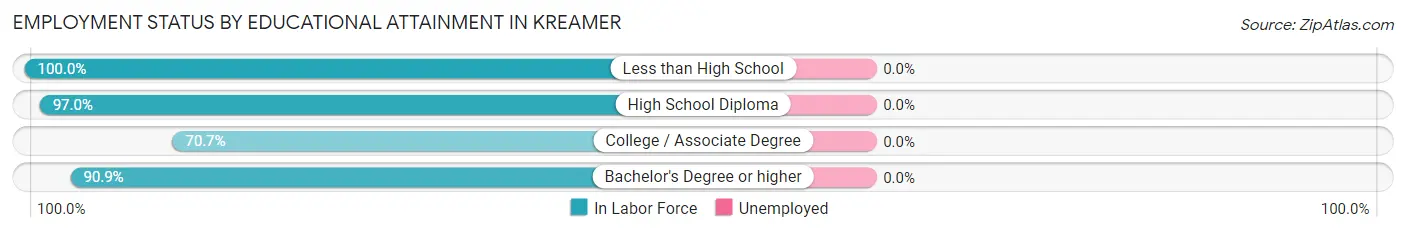
| Educational Attainment | In Labor Force | Unemployed |
| Less than High School | 17 (100.0%) | 0 (0.0%) |
| High School Diploma | 128 (97.0%) | 0 (0.0%) |
| College / Associate Degree | 58 (70.7%) | 0 (0.0%) |
| Bachelor's Degree or higher | 60 (90.9%) | 0 (0.0%) |
| Total | 263 (88.6%) | 0 (0.0%) |
Employment Occupations by Sex in Kreamer
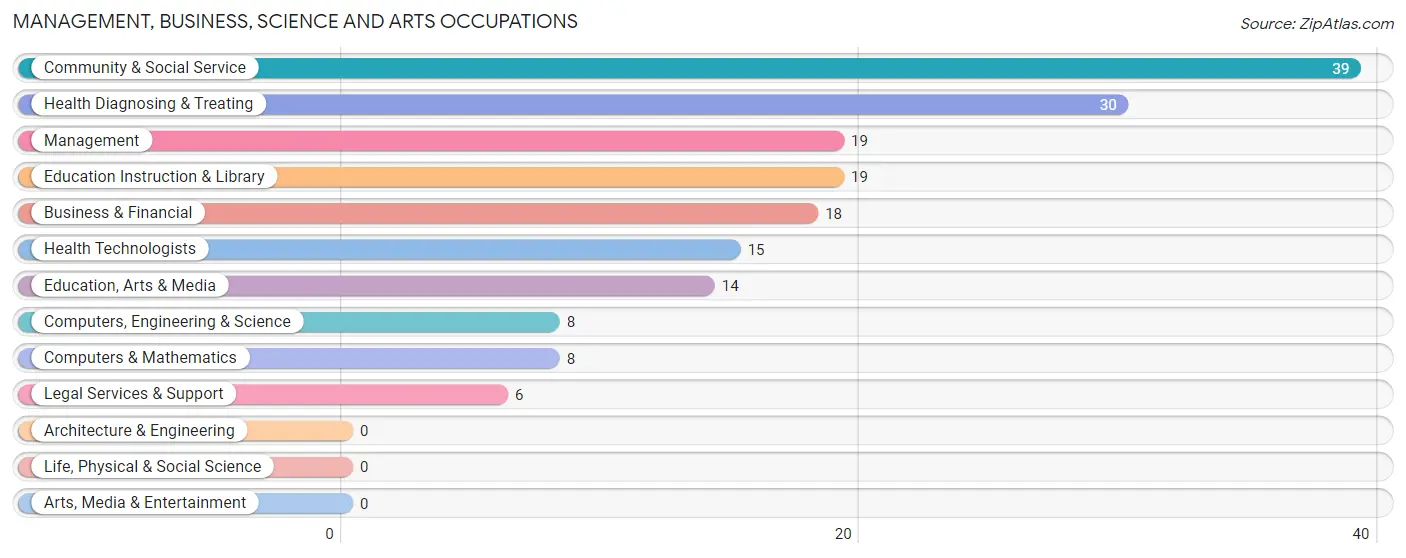
Management, Business, Science and Arts Occupations
The most common Management, Business, Science and Arts occupations in Kreamer are Community & Social Service (39 | 11.8%), Health Diagnosing & Treating (30 | 9.1%), Management (19 | 5.8%), Education Instruction & Library (19 | 5.8%), and Business & Financial (18 | 5.4%).
Management, Business, Science and Arts Occupations by Sex
Within the Management, Business, Science and Arts occupations in Kreamer, the most male-oriented occupations are Business & Financial (100.0%), Computers, Engineering & Science (100.0%), and Computers & Mathematics (100.0%), while the most female-oriented occupations are Legal Services & Support (100.0%), Education Instruction & Library (100.0%), and Health Diagnosing & Treating (100.0%).
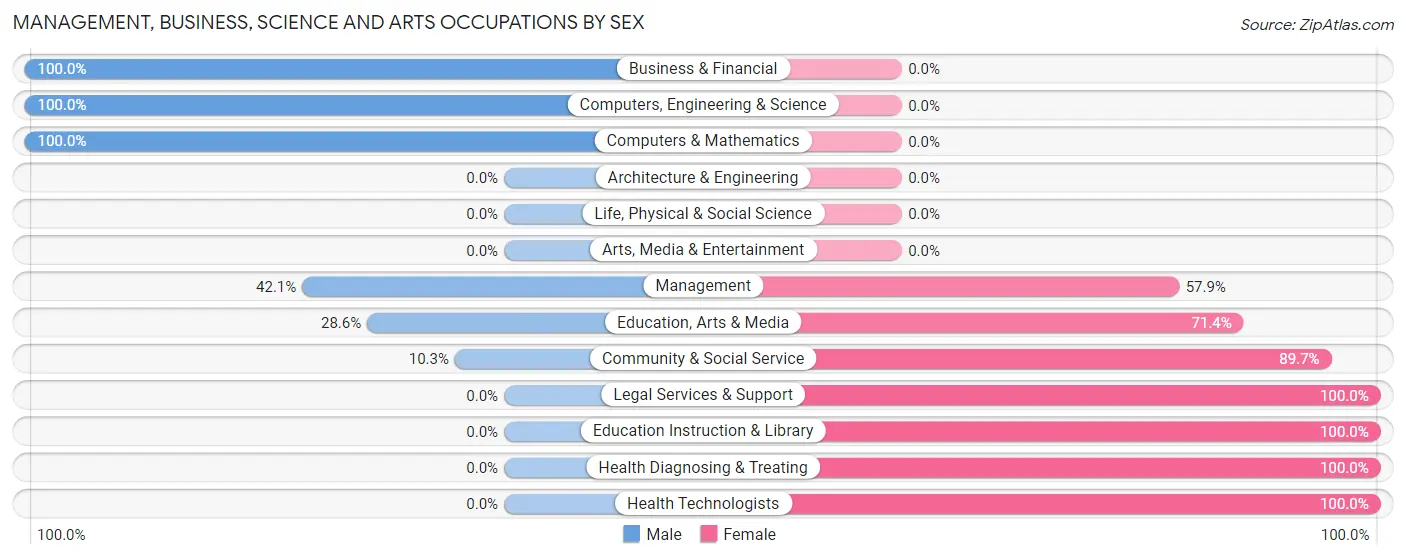
| Occupation | Male | Female |
| Management | 8 (42.1%) | 11 (57.9%) |
| Business & Financial | 18 (100.0%) | 0 (0.0%) |
| Computers, Engineering & Science | 8 (100.0%) | 0 (0.0%) |
| Computers & Mathematics | 8 (100.0%) | 0 (0.0%) |
| Architecture & Engineering | 0 (0.0%) | 0 (0.0%) |
| Life, Physical & Social Science | 0 (0.0%) | 0 (0.0%) |
| Community & Social Service | 4 (10.3%) | 35 (89.7%) |
| Education, Arts & Media | 4 (28.6%) | 10 (71.4%) |
| Legal Services & Support | 0 (0.0%) | 6 (100.0%) |
| Education Instruction & Library | 0 (0.0%) | 19 (100.0%) |
| Arts, Media & Entertainment | 0 (0.0%) | 0 (0.0%) |
| Health Diagnosing & Treating | 0 (0.0%) | 30 (100.0%) |
| Health Technologists | 0 (0.0%) | 15 (100.0%) |
| Total (Category) | 38 (33.3%) | 76 (66.7%) |
| Total (Overall) | 166 (50.3%) | 164 (49.7%) |
Services Occupations
The most common Services occupations in Kreamer are Cleaning & Maintenance (28 | 8.5%), Healthcare Support (12 | 3.6%), and Food Preparation & Serving (11 | 3.3%).
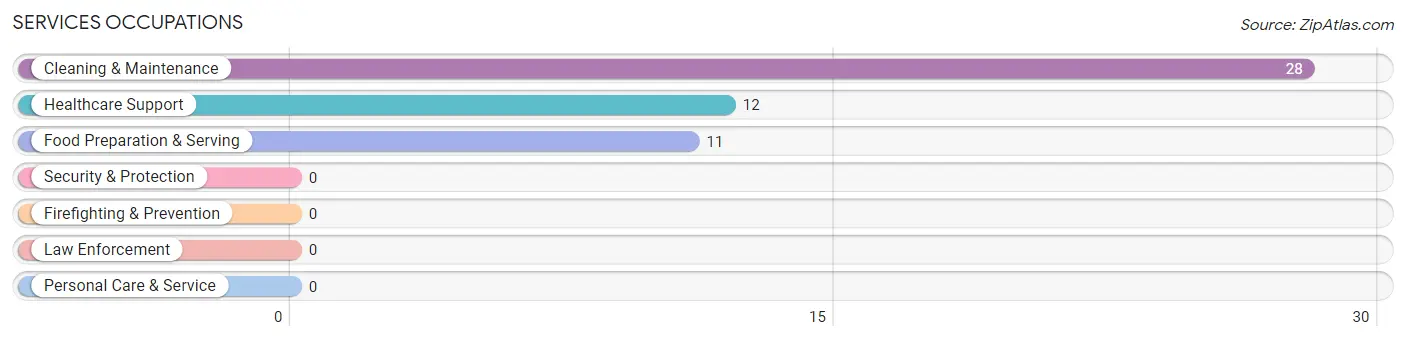
Services Occupations by Sex
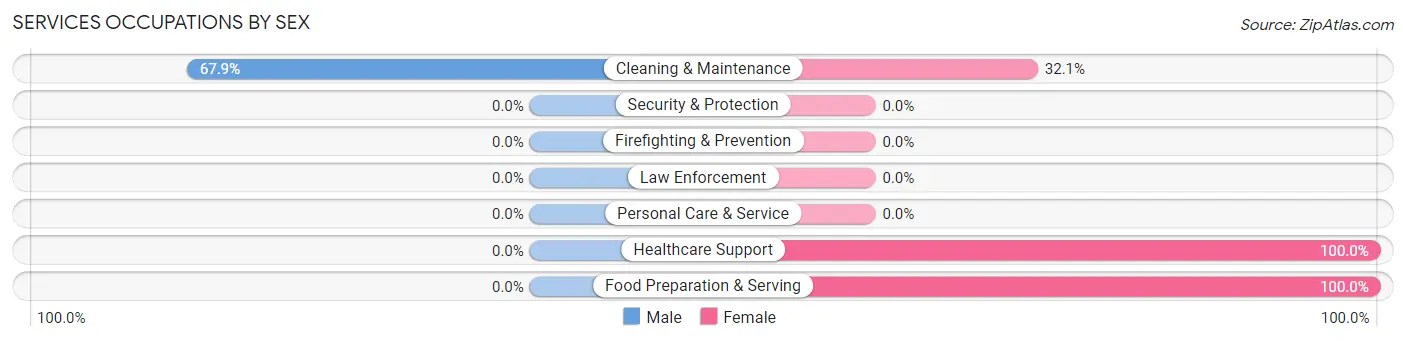
| Occupation | Male | Female |
| Healthcare Support | 0 (0.0%) | 12 (100.0%) |
| Security & Protection | 0 (0.0%) | 0 (0.0%) |
| Firefighting & Prevention | 0 (0.0%) | 0 (0.0%) |
| Law Enforcement | 0 (0.0%) | 0 (0.0%) |
| Food Preparation & Serving | 0 (0.0%) | 11 (100.0%) |
| Cleaning & Maintenance | 19 (67.9%) | 9 (32.1%) |
| Personal Care & Service | 0 (0.0%) | 0 (0.0%) |
| Total (Category) | 19 (37.2%) | 32 (62.7%) |
| Total (Overall) | 166 (50.3%) | 164 (49.7%) |
Sales and Office Occupations
The most common Sales and Office occupations in Kreamer are Office & Administration (27 | 8.2%), and Sales & Related (13 | 3.9%).
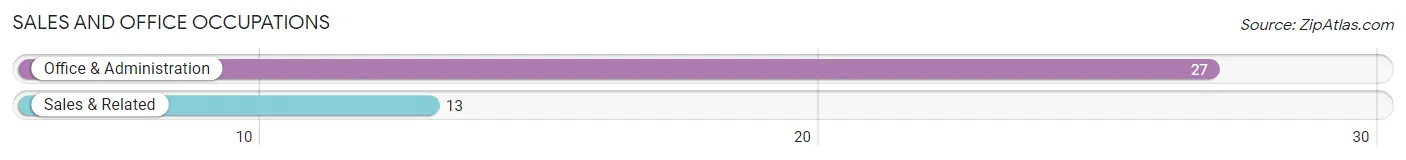
Sales and Office Occupations by Sex
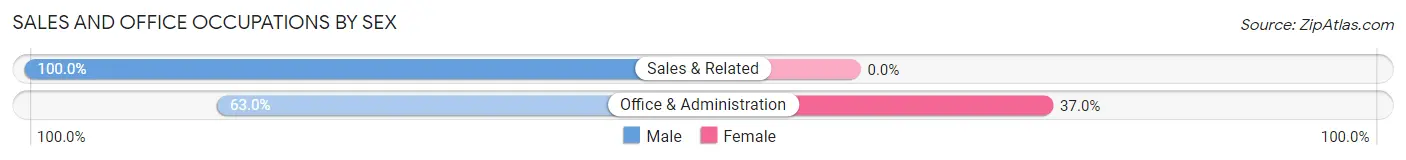
| Occupation | Male | Female |
| Sales & Related | 13 (100.0%) | 0 (0.0%) |
| Office & Administration | 17 (63.0%) | 10 (37.0%) |
| Total (Category) | 30 (75.0%) | 10 (25.0%) |
| Total (Overall) | 166 (50.3%) | 164 (49.7%) |
Natural Resources, Construction and Maintenance Occupations
The most common Natural Resources, Construction and Maintenance occupations in Kreamer are Construction & Extraction (14 | 4.2%), and Installation, Maintenance & Repair (11 | 3.3%).
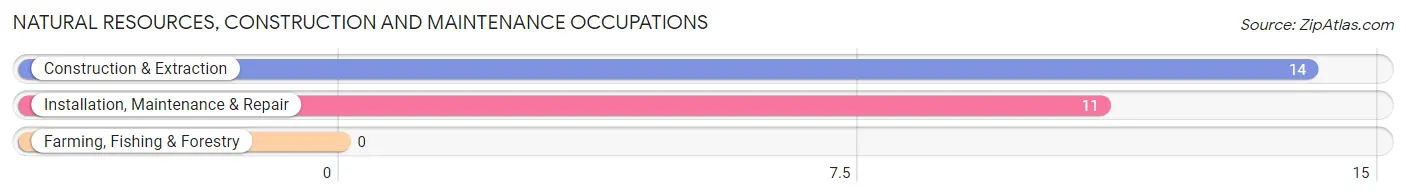
Natural Resources, Construction and Maintenance Occupations by Sex
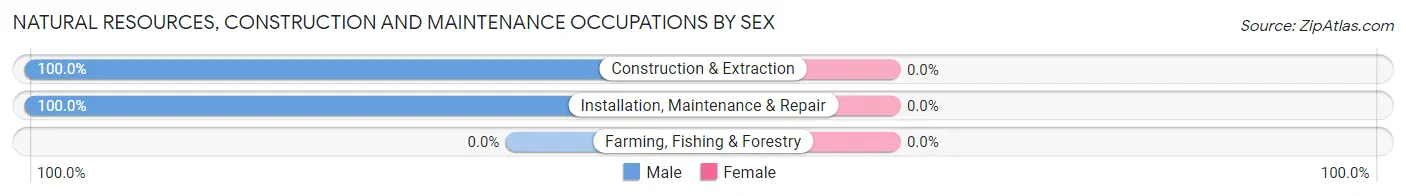
| Occupation | Male | Female |
| Farming, Fishing & Forestry | 0 (0.0%) | 0 (0.0%) |
| Construction & Extraction | 14 (100.0%) | 0 (0.0%) |
| Installation, Maintenance & Repair | 11 (100.0%) | 0 (0.0%) |
| Total (Category) | 25 (100.0%) | 0 (0.0%) |
| Total (Overall) | 166 (50.3%) | 164 (49.7%) |
Production, Transportation and Moving Occupations
The most common Production, Transportation and Moving occupations in Kreamer are Material Moving (65 | 19.7%), Transportation (21 | 6.4%), and Production (14 | 4.2%).
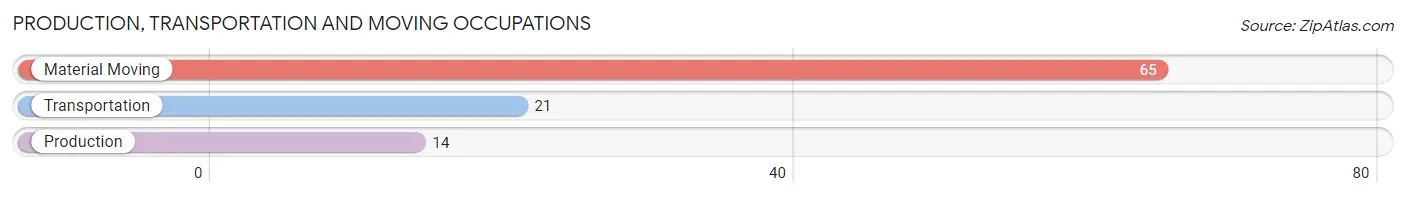
Production, Transportation and Moving Occupations by Sex
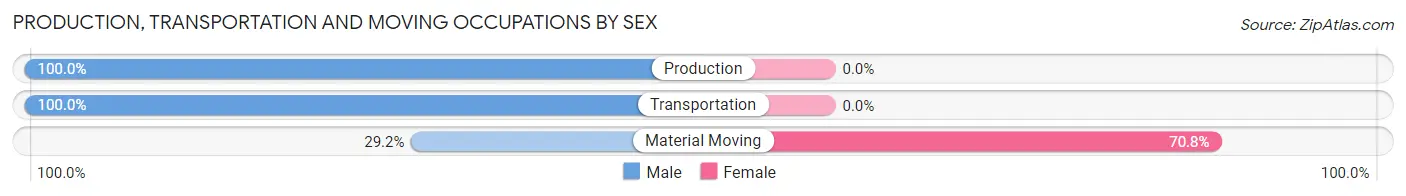
| Occupation | Male | Female |
| Production | 14 (100.0%) | 0 (0.0%) |
| Transportation | 21 (100.0%) | 0 (0.0%) |
| Material Moving | 19 (29.2%) | 46 (70.8%) |
| Total (Category) | 54 (54.0%) | 46 (46.0%) |
| Total (Overall) | 166 (50.3%) | 164 (49.7%) |
Employment Industries by Sex in Kreamer
Employment Industries in Kreamer
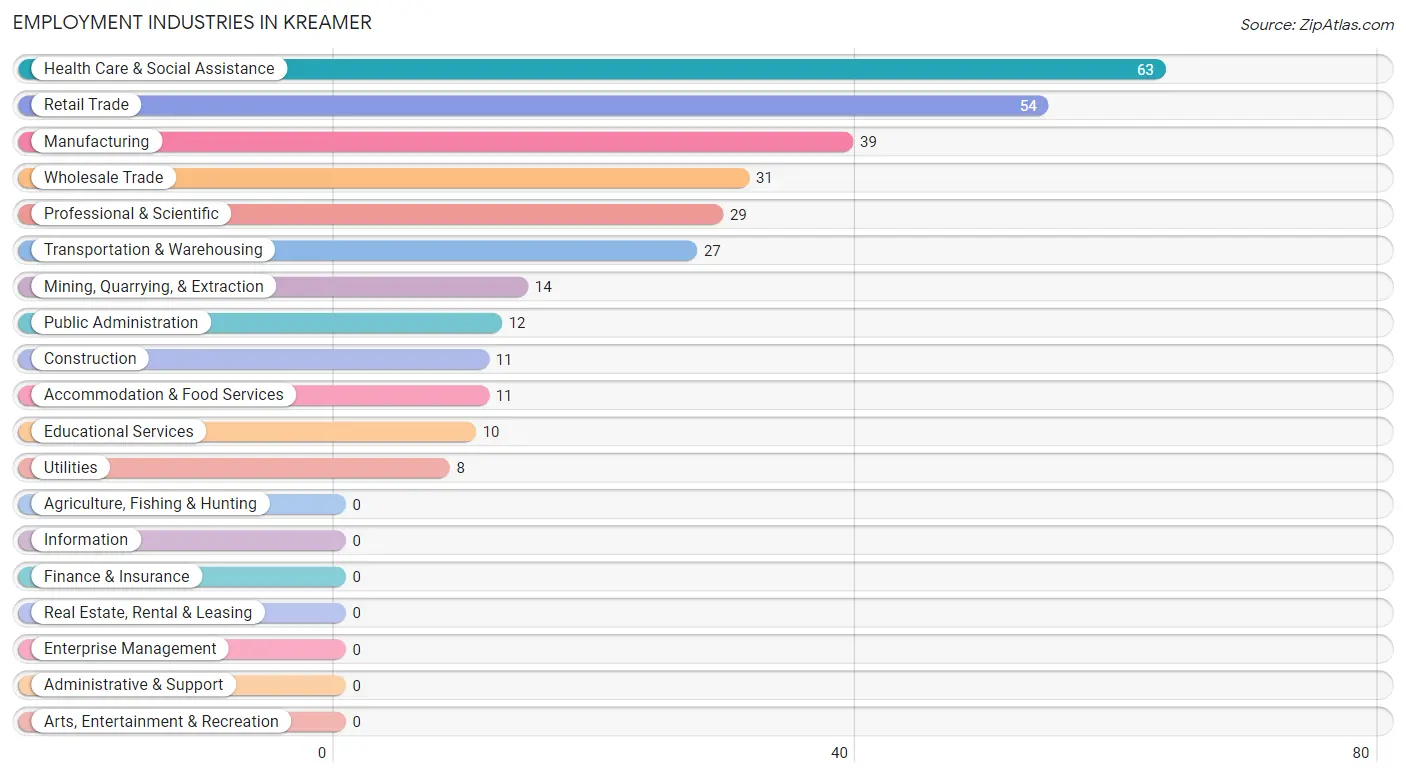
The major employment industries in Kreamer include Health Care & Social Assistance (63 | 19.1%), Retail Trade (54 | 16.4%), Manufacturing (39 | 11.8%), Wholesale Trade (31 | 9.4%), and Professional & Scientific (29 | 8.8%).
Employment Industries by Sex in Kreamer
The Kreamer industries that see more men than women are Construction (100.0%), Wholesale Trade (100.0%), and Utilities (100.0%), whereas the industries that tend to have a higher number of women are Health Care & Social Assistance (100.0%), Accommodation & Food Services (100.0%), and Public Administration (100.0%).
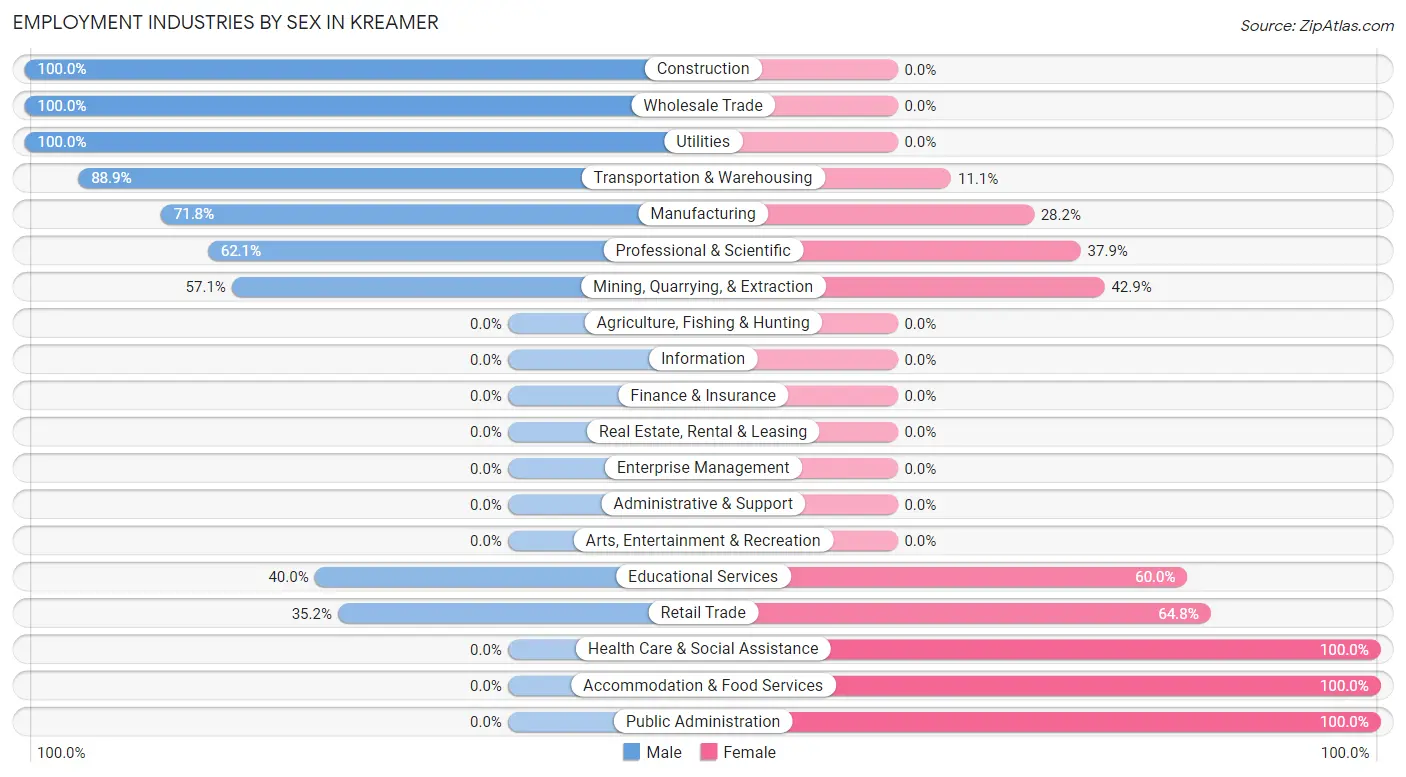
| Industry | Male | Female |
| Agriculture, Fishing & Hunting | 0 (0.0%) | 0 (0.0%) |
| Mining, Quarrying, & Extraction | 8 (57.1%) | 6 (42.9%) |
| Construction | 11 (100.0%) | 0 (0.0%) |
| Manufacturing | 28 (71.8%) | 11 (28.2%) |
| Wholesale Trade | 31 (100.0%) | 0 (0.0%) |
| Retail Trade | 19 (35.2%) | 35 (64.8%) |
| Transportation & Warehousing | 24 (88.9%) | 3 (11.1%) |
| Utilities | 8 (100.0%) | 0 (0.0%) |
| Information | 0 (0.0%) | 0 (0.0%) |
| Finance & Insurance | 0 (0.0%) | 0 (0.0%) |
| Real Estate, Rental & Leasing | 0 (0.0%) | 0 (0.0%) |
| Professional & Scientific | 18 (62.1%) | 11 (37.9%) |
| Enterprise Management | 0 (0.0%) | 0 (0.0%) |
| Administrative & Support | 0 (0.0%) | 0 (0.0%) |
| Educational Services | 4 (40.0%) | 6 (60.0%) |
| Health Care & Social Assistance | 0 (0.0%) | 63 (100.0%) |
| Arts, Entertainment & Recreation | 0 (0.0%) | 0 (0.0%) |
| Accommodation & Food Services | 0 (0.0%) | 11 (100.0%) |
| Public Administration | 0 (0.0%) | 12 (100.0%) |
| Total | 166 (50.3%) | 164 (49.7%) |
Education in Kreamer
School Enrollment in Kreamer
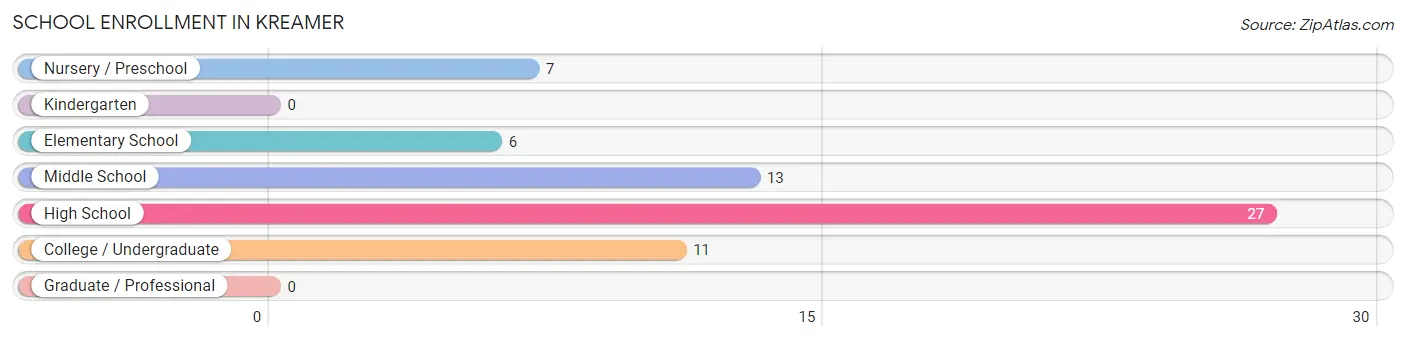
The most common levels of schooling among the 64 students in Kreamer are high school (27 | 42.2%), middle school (13 | 20.3%), and college / undergraduate (11 | 17.2%).
| School Level | # Students | % Students |
| Nursery / Preschool | 7 | 10.9% |
| Kindergarten | 0 | 0.0% |
| Elementary School | 6 | 9.4% |
| Middle School | 13 | 20.3% |
| High School | 27 | 42.2% |
| College / Undergraduate | 11 | 17.2% |
| Graduate / Professional | 0 | 0.0% |
| Total | 64 | 100.0% |
School Enrollment by Age by Funding Source in Kreamer
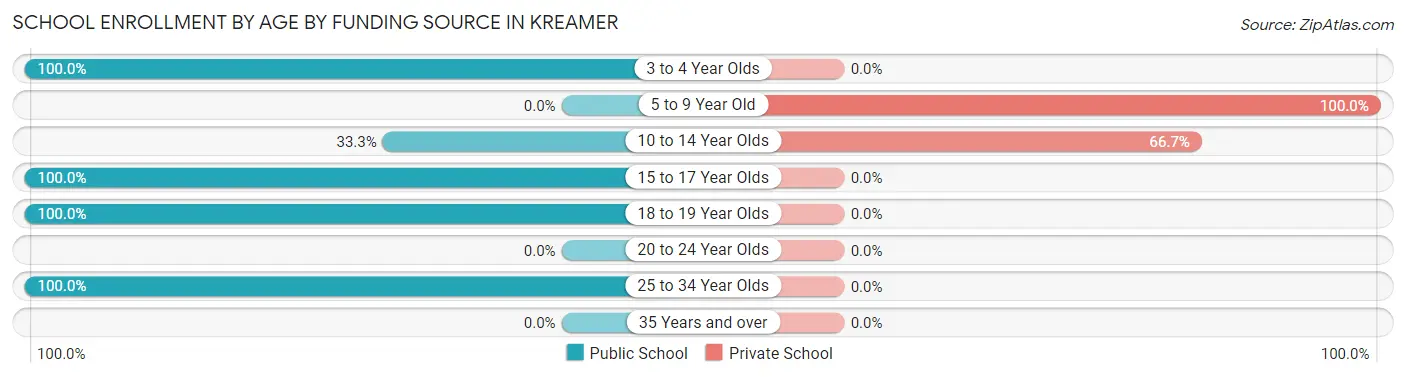
Out of a total of 64 students who are enrolled in schools in Kreamer, 22 (34.4%) attend a private institution, while the remaining 42 (65.6%) are enrolled in public schools. The age group of 5 to 9 year old has the highest likelihood of being enrolled in private schools, with 6 (100.0% in the age bracket) enrolled. Conversely, the age group of 3 to 4 year olds has the lowest likelihood of being enrolled in a private school, with 7 (100.0% in the age bracket) attending a public institution.
| Age Bracket | Public School | Private School |
| 3 to 4 Year Olds | 7 (100.0%) | 0 (0.0%) |
| 5 to 9 Year Old | 0 (0.0%) | 6 (100.0%) |
| 10 to 14 Year Olds | 8 (33.3%) | 16 (66.7%) |
| 15 to 17 Year Olds | 16 (100.0%) | 0 (0.0%) |
| 18 to 19 Year Olds | 5 (100.0%) | 0 (0.0%) |
| 20 to 24 Year Olds | 0 (0.0%) | 0 (0.0%) |
| 25 to 34 Year Olds | 6 (100.0%) | 0 (0.0%) |
| 35 Years and over | 0 (0.0%) | 0 (0.0%) |
| Total | 42 (65.6%) | 22 (34.4%) |
Educational Attainment by Field of Study in Kreamer
Education (41 | 27.0%), business (32 | 21.0%), physical & health sciences (28 | 18.4%), multidisciplinary studies (13 | 8.6%), and social sciences (12 | 7.9%) are the most common fields of study among 152 individuals in Kreamer who have obtained a bachelor's degree or higher.
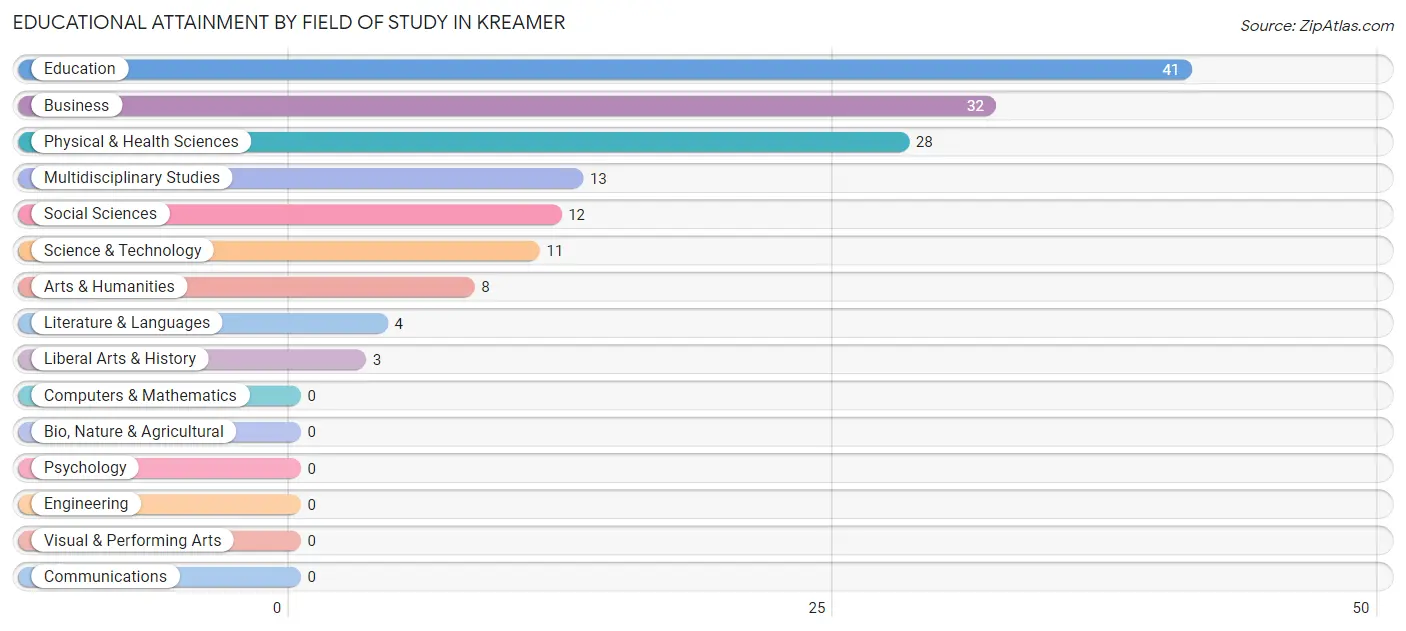
| Field of Study | # Graduates | % Graduates |
| Computers & Mathematics | 0 | 0.0% |
| Bio, Nature & Agricultural | 0 | 0.0% |
| Physical & Health Sciences | 28 | 18.4% |
| Psychology | 0 | 0.0% |
| Social Sciences | 12 | 7.9% |
| Engineering | 0 | 0.0% |
| Multidisciplinary Studies | 13 | 8.6% |
| Science & Technology | 11 | 7.2% |
| Business | 32 | 21.0% |
| Education | 41 | 27.0% |
| Literature & Languages | 4 | 2.6% |
| Liberal Arts & History | 3 | 2.0% |
| Visual & Performing Arts | 0 | 0.0% |
| Communications | 0 | 0.0% |
| Arts & Humanities | 8 | 5.3% |
| Total | 152 | 100.0% |
Transportation & Commute in Kreamer
Vehicle Availability by Sex in Kreamer
The most prevalent vehicle ownership categories in Kreamer are males with 2 vehicles (77, accounting for 46.4%) and females with 2 vehicles (105, making up 46.9%).
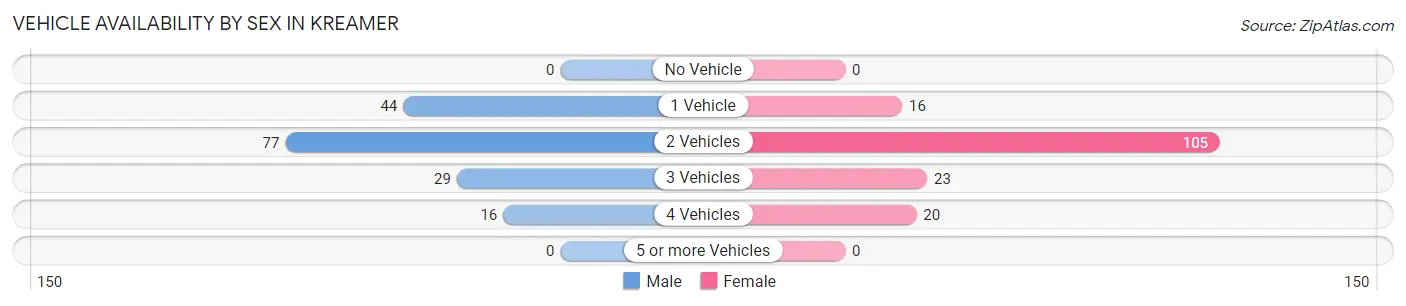
| Vehicles Available | Male | Female |
| No Vehicle | 0 (0.0%) | 0 (0.0%) |
| 1 Vehicle | 44 (26.5%) | 16 (9.8%) |
| 2 Vehicles | 77 (46.4%) | 105 (64.0%) |
| 3 Vehicles | 29 (17.5%) | 23 (14.0%) |
| 4 Vehicles | 16 (9.6%) | 20 (12.2%) |
| 5 or more Vehicles | 0 (0.0%) | 0 (0.0%) |
| Total | 166 (100.0%) | 164 (100.0%) |
Commute Time in Kreamer
The most frequently occuring commute durations in Kreamer are 15 to 19 minutes (50 commuters, 16.0%), 10 to 14 minutes (47 commuters, 15.0%), and 45 to 59 minutes (45 commuters, 14.4%).
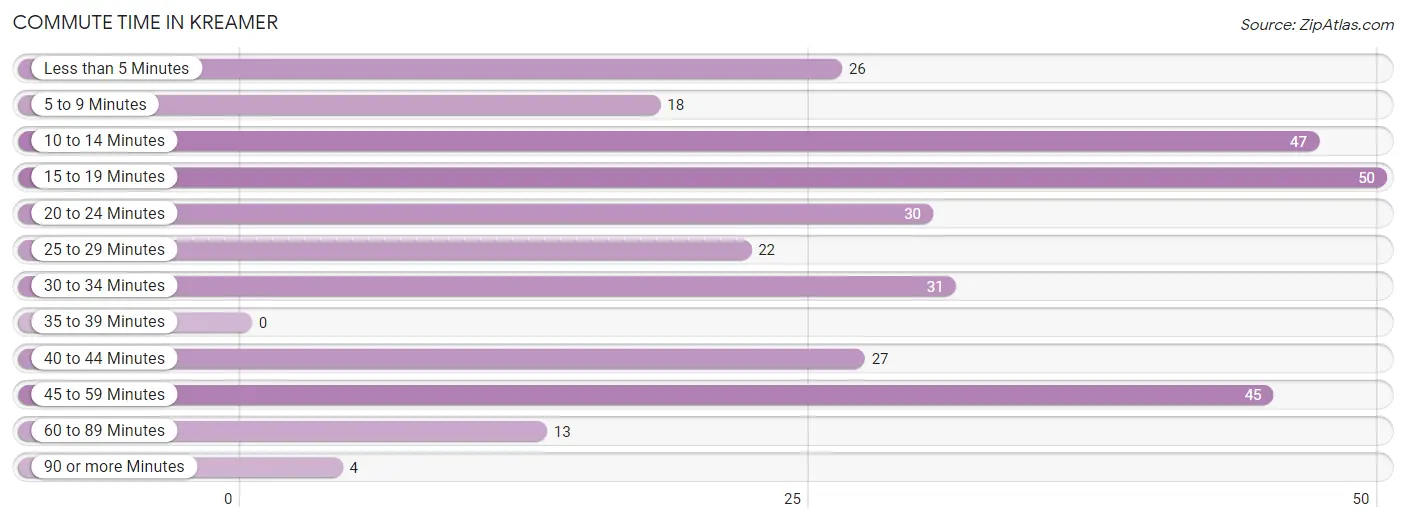
| Commute Time | # Commuters | % Commuters |
| Less than 5 Minutes | 26 | 8.3% |
| 5 to 9 Minutes | 18 | 5.8% |
| 10 to 14 Minutes | 47 | 15.0% |
| 15 to 19 Minutes | 50 | 16.0% |
| 20 to 24 Minutes | 30 | 9.6% |
| 25 to 29 Minutes | 22 | 7.0% |
| 30 to 34 Minutes | 31 | 9.9% |
| 35 to 39 Minutes | 0 | 0.0% |
| 40 to 44 Minutes | 27 | 8.6% |
| 45 to 59 Minutes | 45 | 14.4% |
| 60 to 89 Minutes | 13 | 4.2% |
| 90 or more Minutes | 4 | 1.3% |
Commute Time by Sex in Kreamer
The most common commute times in Kreamer are 10 to 14 minutes (30 commuters, 20.1%) for males and 45 to 59 minutes (45 commuters, 27.4%) for females.
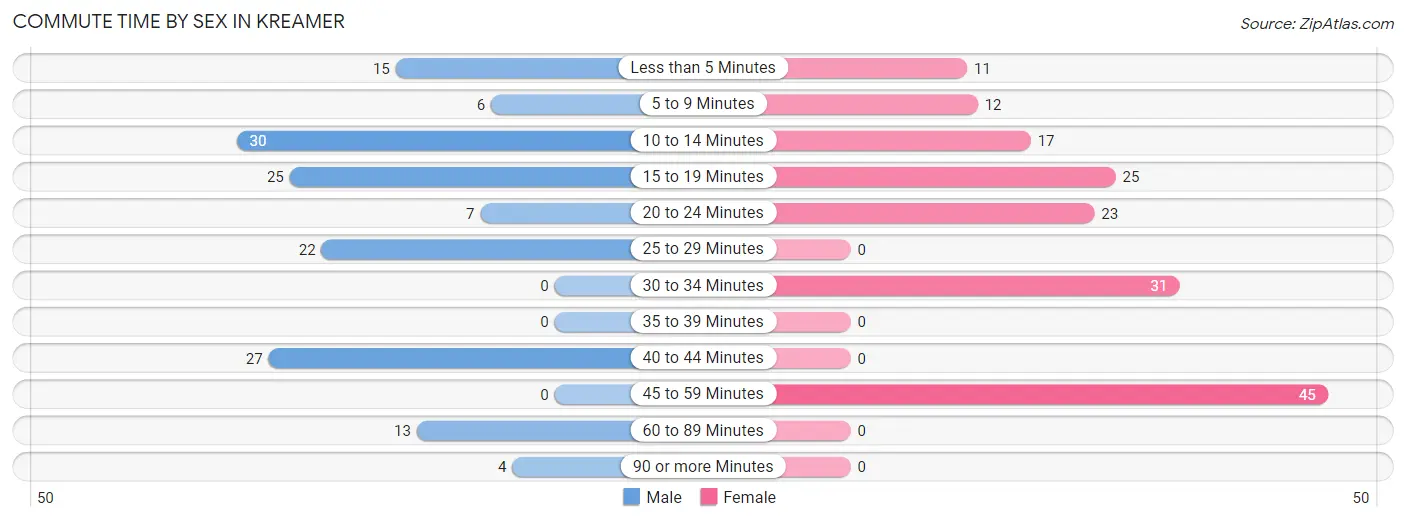
| Commute Time | Male | Female |
| Less than 5 Minutes | 15 (10.1%) | 11 (6.7%) |
| 5 to 9 Minutes | 6 (4.0%) | 12 (7.3%) |
| 10 to 14 Minutes | 30 (20.1%) | 17 (10.4%) |
| 15 to 19 Minutes | 25 (16.8%) | 25 (15.2%) |
| 20 to 24 Minutes | 7 (4.7%) | 23 (14.0%) |
| 25 to 29 Minutes | 22 (14.8%) | 0 (0.0%) |
| 30 to 34 Minutes | 0 (0.0%) | 31 (18.9%) |
| 35 to 39 Minutes | 0 (0.0%) | 0 (0.0%) |
| 40 to 44 Minutes | 27 (18.1%) | 0 (0.0%) |
| 45 to 59 Minutes | 0 (0.0%) | 45 (27.4%) |
| 60 to 89 Minutes | 13 (8.7%) | 0 (0.0%) |
| 90 or more Minutes | 4 (2.7%) | 0 (0.0%) |
Time of Departure to Work by Sex in Kreamer
The most frequent times of departure to work in Kreamer are 7:00 AM to 7:29 AM (29, 19.5%) for males and 9:00 AM to 9:59 AM (40, 24.4%) for females.
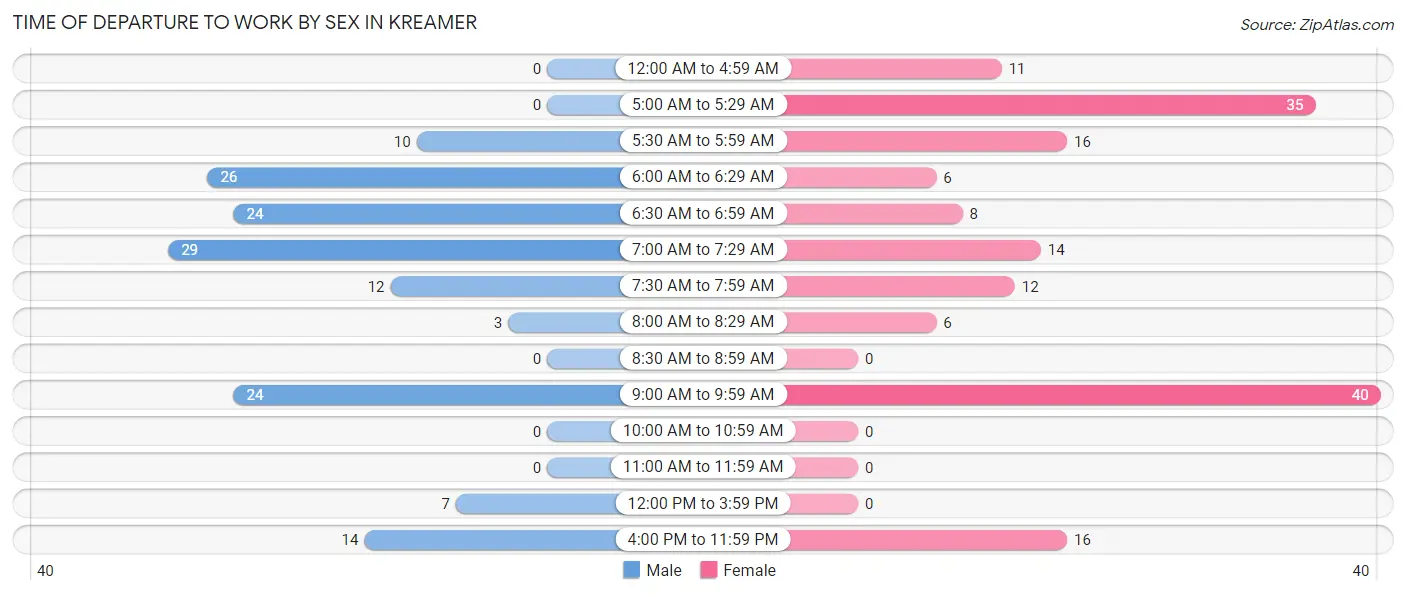
| Time of Departure | Male | Female |
| 12:00 AM to 4:59 AM | 0 (0.0%) | 11 (6.7%) |
| 5:00 AM to 5:29 AM | 0 (0.0%) | 35 (21.3%) |
| 5:30 AM to 5:59 AM | 10 (6.7%) | 16 (9.8%) |
| 6:00 AM to 6:29 AM | 26 (17.4%) | 6 (3.7%) |
| 6:30 AM to 6:59 AM | 24 (16.1%) | 8 (4.9%) |
| 7:00 AM to 7:29 AM | 29 (19.5%) | 14 (8.5%) |
| 7:30 AM to 7:59 AM | 12 (8.1%) | 12 (7.3%) |
| 8:00 AM to 8:29 AM | 3 (2.0%) | 6 (3.7%) |
| 8:30 AM to 8:59 AM | 0 (0.0%) | 0 (0.0%) |
| 9:00 AM to 9:59 AM | 24 (16.1%) | 40 (24.4%) |
| 10:00 AM to 10:59 AM | 0 (0.0%) | 0 (0.0%) |
| 11:00 AM to 11:59 AM | 0 (0.0%) | 0 (0.0%) |
| 12:00 PM to 3:59 PM | 7 (4.7%) | 0 (0.0%) |
| 4:00 PM to 11:59 PM | 14 (9.4%) | 16 (9.8%) |
| Total | 149 (100.0%) | 164 (100.0%) |
Housing Occupancy in Kreamer
Occupancy by Ownership in Kreamer
Of the total 264 dwellings in Kreamer, owner-occupied units account for 186 (70.5%), while renter-occupied units make up 78 (29.5%).
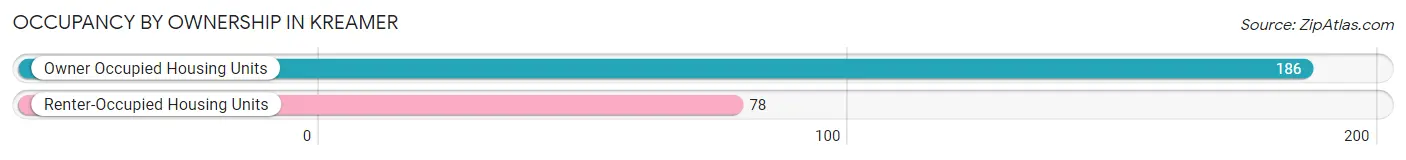
| Occupancy | # Housing Units | % Housing Units |
| Owner Occupied Housing Units | 186 | 70.5% |
| Renter-Occupied Housing Units | 78 | 29.5% |
| Total Occupied Housing Units | 264 | 100.0% |
Occupancy by Household Size in Kreamer
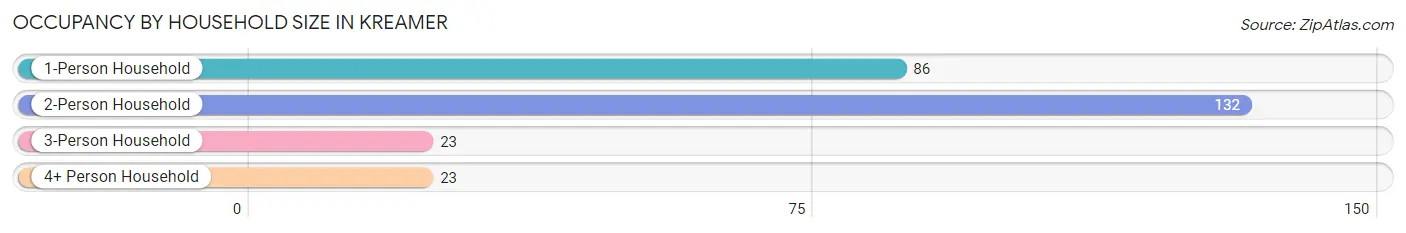
| Household Size | # Housing Units | % Housing Units |
| 1-Person Household | 86 | 32.6% |
| 2-Person Household | 132 | 50.0% |
| 3-Person Household | 23 | 8.7% |
| 4+ Person Household | 23 | 8.7% |
| Total Housing Units | 264 | 100.0% |
Occupancy by Ownership by Household Size in Kreamer
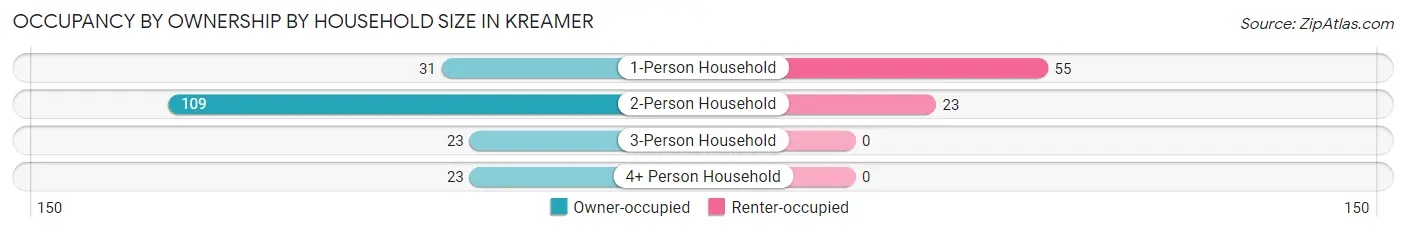
| Household Size | Owner-occupied | Renter-occupied |
| 1-Person Household | 31 (36.0%) | 55 (63.9%) |
| 2-Person Household | 109 (82.6%) | 23 (17.4%) |
| 3-Person Household | 23 (100.0%) | 0 (0.0%) |
| 4+ Person Household | 23 (100.0%) | 0 (0.0%) |
| Total Housing Units | 186 (70.5%) | 78 (29.5%) |
Occupancy by Educational Attainment in Kreamer
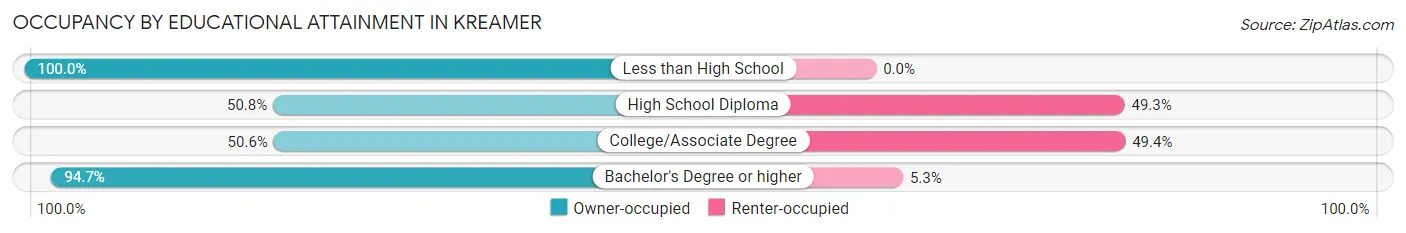
| Household Size | Owner-occupied | Renter-occupied |
| Less than High School | 22 (100.0%) | 0 (0.0%) |
| High School Diploma | 34 (50.7%) | 33 (49.2%) |
| College/Associate Degree | 41 (50.6%) | 40 (49.4%) |
| Bachelor's Degree or higher | 89 (94.7%) | 5 (5.3%) |
Occupancy by Age of Householder in Kreamer
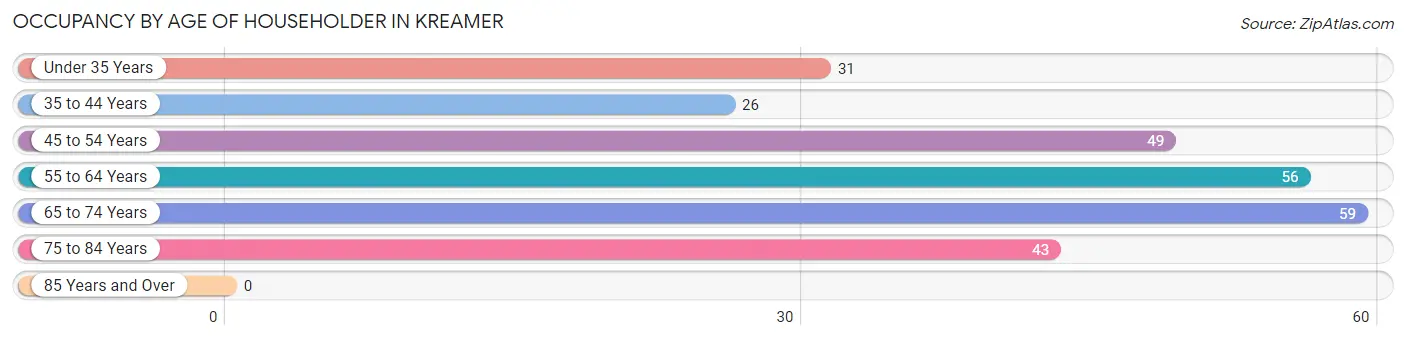
| Age Bracket | # Households | % Households |
| Under 35 Years | 31 | 11.7% |
| 35 to 44 Years | 26 | 9.9% |
| 45 to 54 Years | 49 | 18.6% |
| 55 to 64 Years | 56 | 21.2% |
| 65 to 74 Years | 59 | 22.4% |
| 75 to 84 Years | 43 | 16.3% |
| 85 Years and Over | 0 | 0.0% |
| Total | 264 | 100.0% |
Housing Finances in Kreamer
Median Income by Occupancy in Kreamer
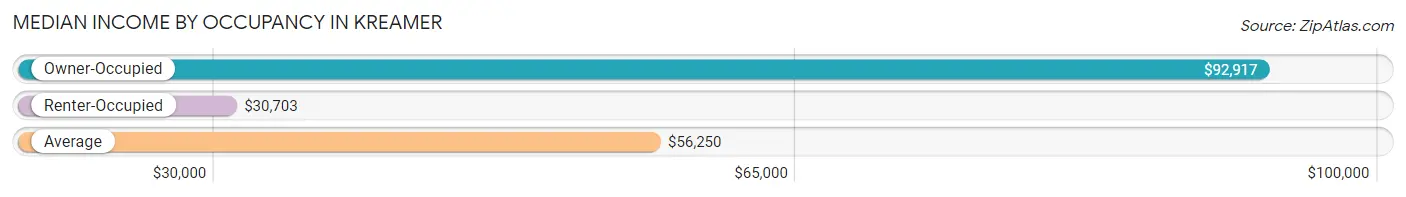
| Occupancy Type | # Households | Median Income |
| Owner-Occupied | 186 (70.5%) | $92,917 |
| Renter-Occupied | 78 (29.5%) | $30,703 |
| Average | 264 (100.0%) | $56,250 |
Occupancy by Householder Income Bracket in Kreamer
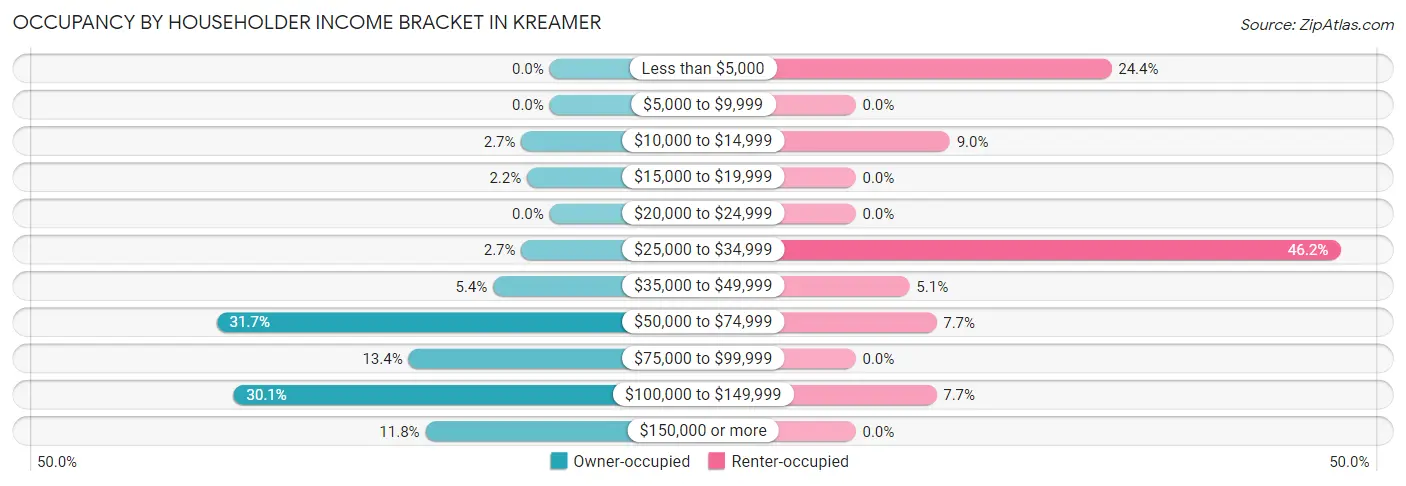
| Income Bracket | Owner-occupied | Renter-occupied |
| Less than $5,000 | 0 (0.0%) | 19 (24.4%) |
| $5,000 to $9,999 | 0 (0.0%) | 0 (0.0%) |
| $10,000 to $14,999 | 5 (2.7%) | 7 (9.0%) |
| $15,000 to $19,999 | 4 (2.1%) | 0 (0.0%) |
| $20,000 to $24,999 | 0 (0.0%) | 0 (0.0%) |
| $25,000 to $34,999 | 5 (2.7%) | 36 (46.2%) |
| $35,000 to $49,999 | 10 (5.4%) | 4 (5.1%) |
| $50,000 to $74,999 | 59 (31.7%) | 6 (7.7%) |
| $75,000 to $99,999 | 25 (13.4%) | 0 (0.0%) |
| $100,000 to $149,999 | 56 (30.1%) | 6 (7.7%) |
| $150,000 or more | 22 (11.8%) | 0 (0.0%) |
| Total | 186 (100.0%) | 78 (100.0%) |
Monthly Housing Cost Tiers in Kreamer
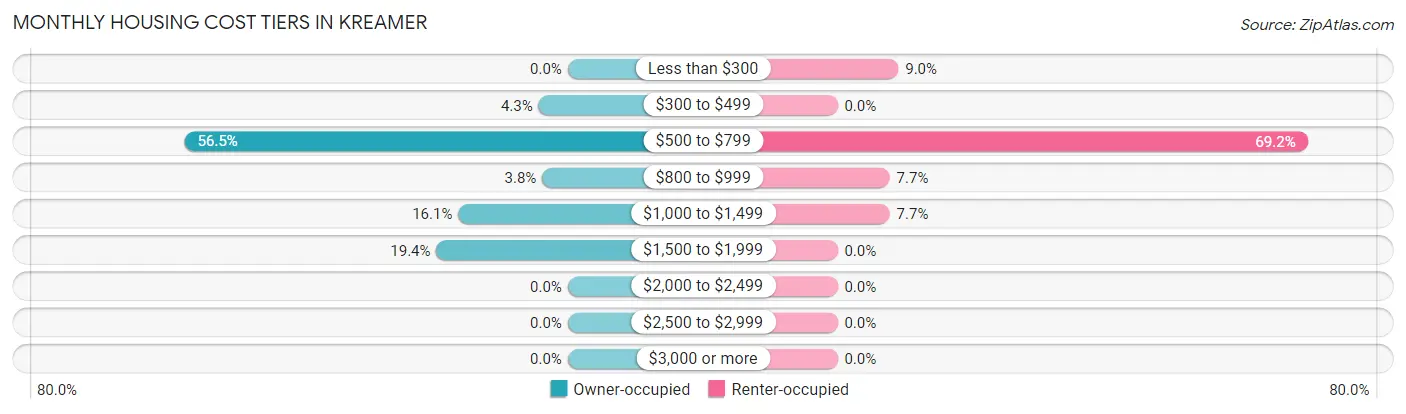
| Monthly Cost | Owner-occupied | Renter-occupied |
| Less than $300 | 0 (0.0%) | 7 (9.0%) |
| $300 to $499 | 8 (4.3%) | 0 (0.0%) |
| $500 to $799 | 105 (56.5%) | 54 (69.2%) |
| $800 to $999 | 7 (3.8%) | 6 (7.7%) |
| $1,000 to $1,499 | 30 (16.1%) | 6 (7.7%) |
| $1,500 to $1,999 | 36 (19.4%) | 0 (0.0%) |
| $2,000 to $2,499 | 0 (0.0%) | 0 (0.0%) |
| $2,500 to $2,999 | 0 (0.0%) | 0 (0.0%) |
| $3,000 or more | 0 (0.0%) | 0 (0.0%) |
| Total | 186 (100.0%) | 78 (100.0%) |
Physical Housing Characteristics in Kreamer
Housing Structures in Kreamer
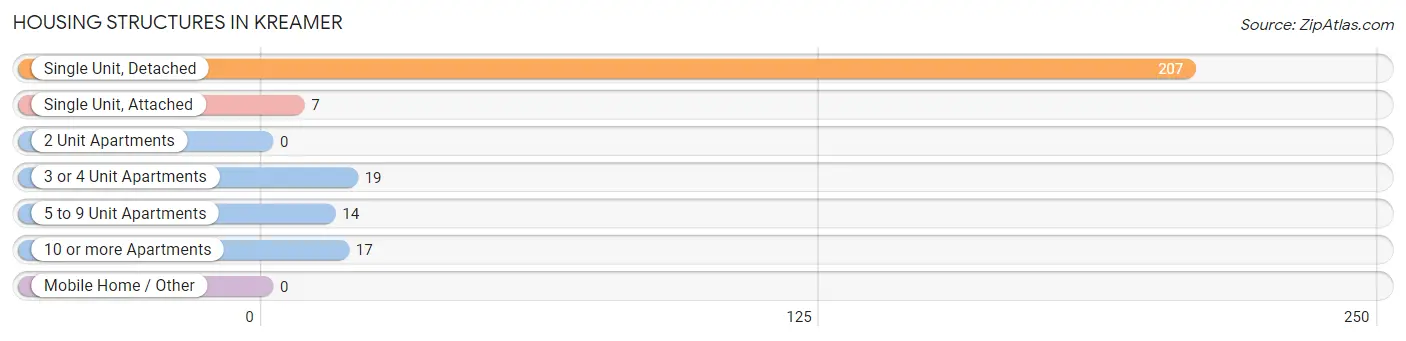
| Structure Type | # Housing Units | % Housing Units |
| Single Unit, Detached | 207 | 78.4% |
| Single Unit, Attached | 7 | 2.6% |
| 2 Unit Apartments | 0 | 0.0% |
| 3 or 4 Unit Apartments | 19 | 7.2% |
| 5 to 9 Unit Apartments | 14 | 5.3% |
| 10 or more Apartments | 17 | 6.4% |
| Mobile Home / Other | 0 | 0.0% |
| Total | 264 | 100.0% |
Housing Structures by Occupancy in Kreamer
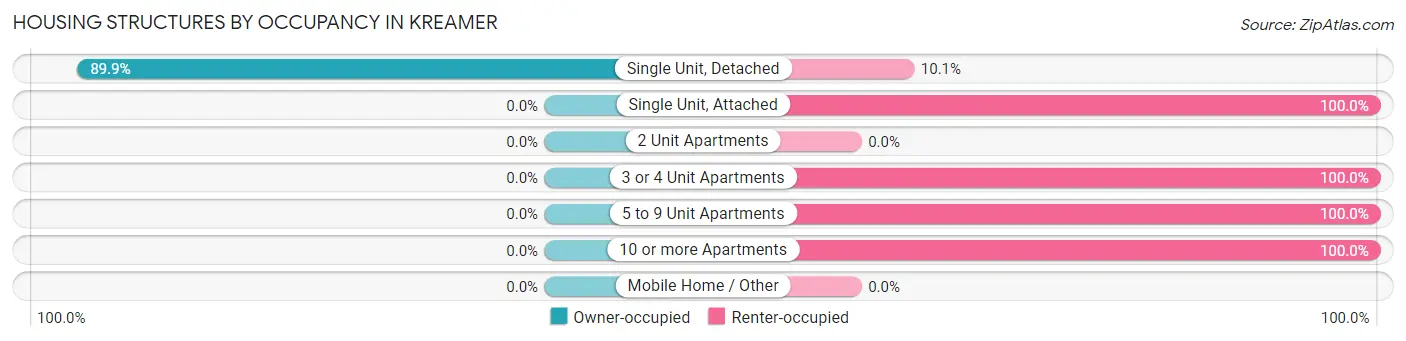
| Structure Type | Owner-occupied | Renter-occupied |
| Single Unit, Detached | 186 (89.9%) | 21 (10.1%) |
| Single Unit, Attached | 0 (0.0%) | 7 (100.0%) |
| 2 Unit Apartments | 0 (0.0%) | 0 (0.0%) |
| 3 or 4 Unit Apartments | 0 (0.0%) | 19 (100.0%) |
| 5 to 9 Unit Apartments | 0 (0.0%) | 14 (100.0%) |
| 10 or more Apartments | 0 (0.0%) | 17 (100.0%) |
| Mobile Home / Other | 0 (0.0%) | 0 (0.0%) |
| Total | 186 (70.5%) | 78 (29.5%) |
Housing Structures by Number of Rooms in Kreamer
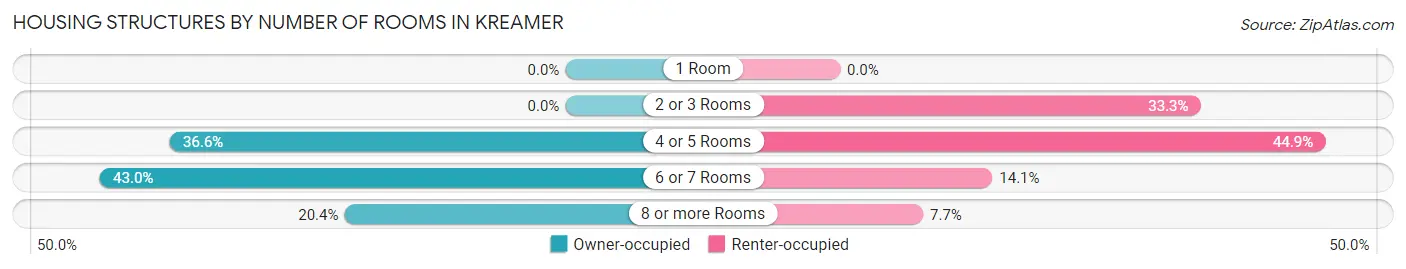
| Number of Rooms | Owner-occupied | Renter-occupied |
| 1 Room | 0 (0.0%) | 0 (0.0%) |
| 2 or 3 Rooms | 0 (0.0%) | 26 (33.3%) |
| 4 or 5 Rooms | 68 (36.6%) | 35 (44.9%) |
| 6 or 7 Rooms | 80 (43.0%) | 11 (14.1%) |
| 8 or more Rooms | 38 (20.4%) | 6 (7.7%) |
| Total | 186 (100.0%) | 78 (100.0%) |
Housing Structure by Heating Type in Kreamer
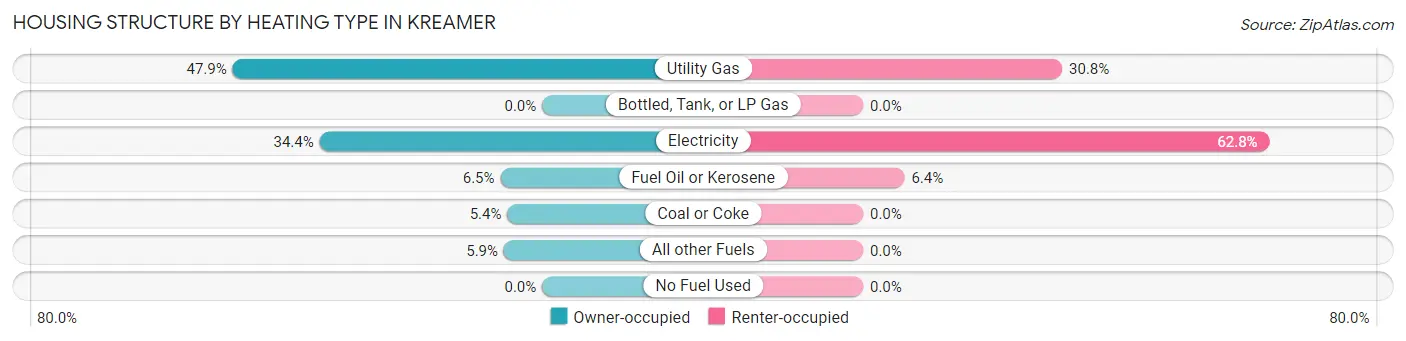
| Heating Type | Owner-occupied | Renter-occupied |
| Utility Gas | 89 (47.8%) | 24 (30.8%) |
| Bottled, Tank, or LP Gas | 0 (0.0%) | 0 (0.0%) |
| Electricity | 64 (34.4%) | 49 (62.8%) |
| Fuel Oil or Kerosene | 12 (6.5%) | 5 (6.4%) |
| Coal or Coke | 10 (5.4%) | 0 (0.0%) |
| All other Fuels | 11 (5.9%) | 0 (0.0%) |
| No Fuel Used | 0 (0.0%) | 0 (0.0%) |
| Total | 186 (100.0%) | 78 (100.0%) |
Household Vehicle Usage in Kreamer
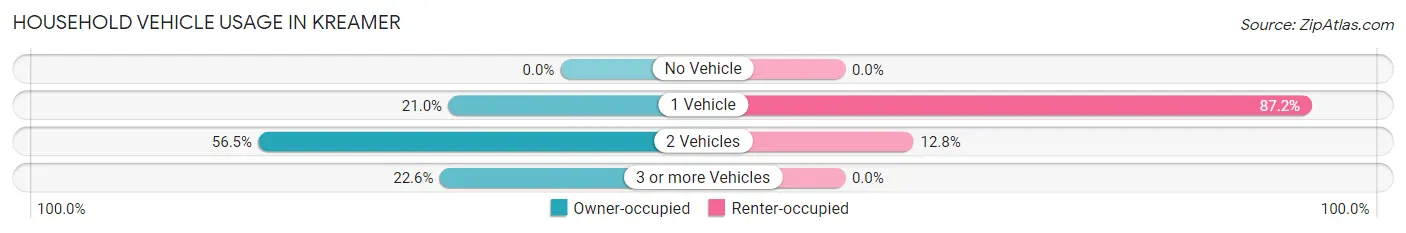
| Vehicles per Household | Owner-occupied | Renter-occupied |
| No Vehicle | 0 (0.0%) | 0 (0.0%) |
| 1 Vehicle | 39 (21.0%) | 68 (87.2%) |
| 2 Vehicles | 105 (56.5%) | 10 (12.8%) |
| 3 or more Vehicles | 42 (22.6%) | 0 (0.0%) |
| Total | 186 (100.0%) | 78 (100.0%) |
Real Estate & Mortgages in Kreamer
Real Estate and Mortgage Overview in Kreamer
| Characteristic | Without Mortgage | With Mortgage |
| Housing Units | 100 | 86 |
| Median Property Value | $233,300 | $192,500 |
| Median Household Income | $61,250 | $4 |
| Monthly Housing Costs | $622 | $0 |
| Real Estate Taxes | $3,000 | $0 |
Property Value by Mortgage Status in Kreamer
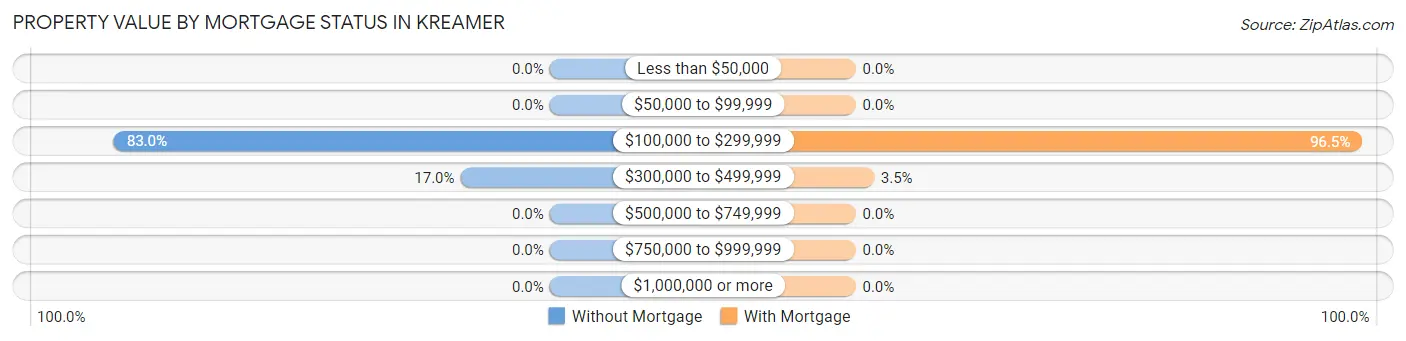
| Property Value | Without Mortgage | With Mortgage |
| Less than $50,000 | 0 (0.0%) | 0 (0.0%) |
| $50,000 to $99,999 | 0 (0.0%) | 0 (0.0%) |
| $100,000 to $299,999 | 83 (83.0%) | 83 (96.5%) |
| $300,000 to $499,999 | 17 (17.0%) | 3 (3.5%) |
| $500,000 to $749,999 | 0 (0.0%) | 0 (0.0%) |
| $750,000 to $999,999 | 0 (0.0%) | 0 (0.0%) |
| $1,000,000 or more | 0 (0.0%) | 0 (0.0%) |
| Total | 100 (100.0%) | 86 (100.0%) |
Household Income by Mortgage Status in Kreamer
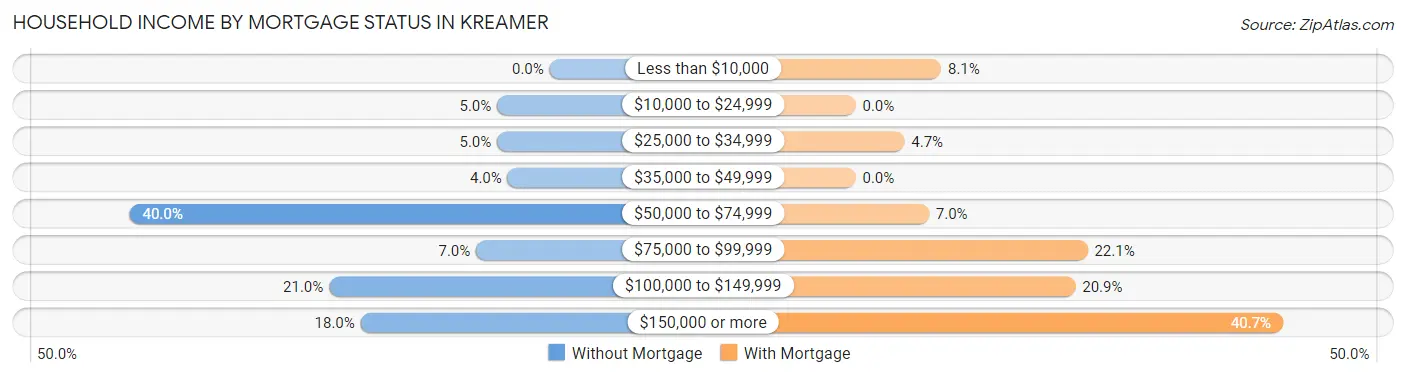
| Household Income | Without Mortgage | With Mortgage |
| Less than $10,000 | 0 (0.0%) | 7 (8.1%) |
| $10,000 to $24,999 | 5 (5.0%) | 0 (0.0%) |
| $25,000 to $34,999 | 5 (5.0%) | 4 (4.6%) |
| $35,000 to $49,999 | 4 (4.0%) | 0 (0.0%) |
| $50,000 to $74,999 | 40 (40.0%) | 6 (7.0%) |
| $75,000 to $99,999 | 7 (7.0%) | 19 (22.1%) |
| $100,000 to $149,999 | 21 (21.0%) | 18 (20.9%) |
| $150,000 or more | 18 (18.0%) | 35 (40.7%) |
| Total | 100 (100.0%) | 86 (100.0%) |
Property Value to Household Income Ratio in Kreamer
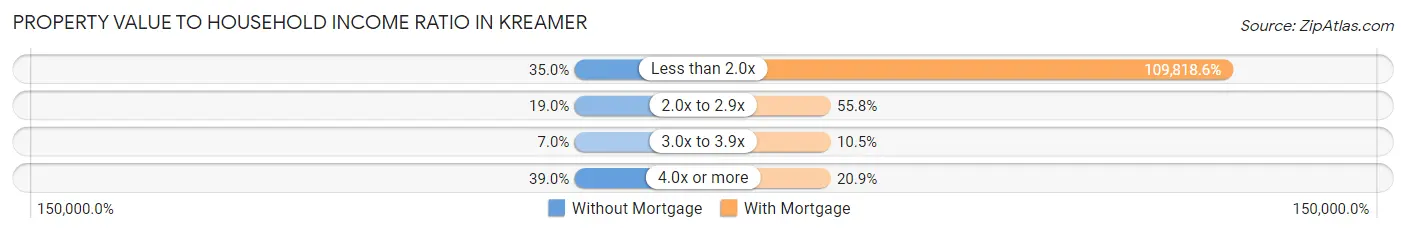
| Value-to-Income Ratio | Without Mortgage | With Mortgage |
| Less than 2.0x | 35 (35.0%) | 94,444 (109,818.6%) |
| 2.0x to 2.9x | 19 (19.0%) | 48 (55.8%) |
| 3.0x to 3.9x | 7 (7.0%) | 9 (10.5%) |
| 4.0x or more | 39 (39.0%) | 18 (20.9%) |
| Total | 100 (100.0%) | 86 (100.0%) |
Real Estate Taxes by Mortgage Status in Kreamer
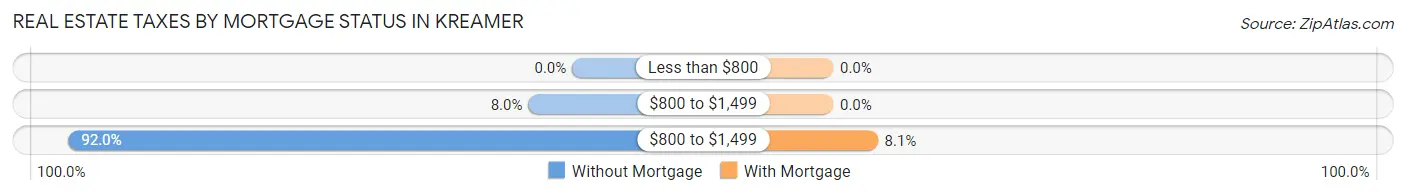
| Property Taxes | Without Mortgage | With Mortgage |
| Less than $800 | 0 (0.0%) | 0 (0.0%) |
| $800 to $1,499 | 8 (8.0%) | 0 (0.0%) |
| $800 to $1,499 | 92 (92.0%) | 7 (8.1%) |
| Total | 100 (100.0%) | 86 (100.0%) |
Health & Disability in Kreamer
Health Insurance Coverage by Age in Kreamer
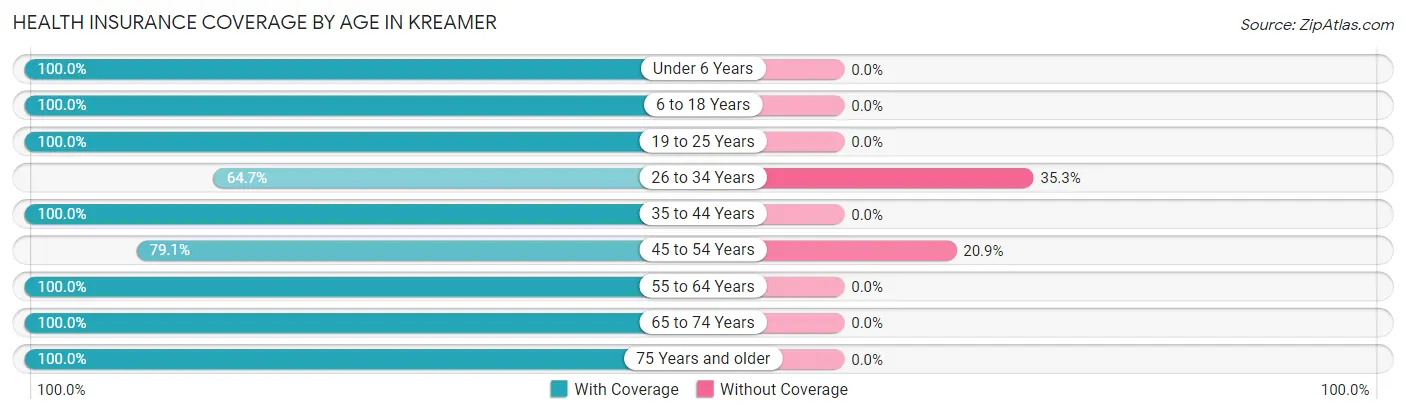
| Age Bracket | With Coverage | Without Coverage |
| Under 6 Years | 21 (100.0%) | 0 (0.0%) |
| 6 to 18 Years | 51 (100.0%) | 0 (0.0%) |
| 19 to 25 Years | 19 (100.0%) | 0 (0.0%) |
| 26 to 34 Years | 11 (64.7%) | 6 (35.3%) |
| 35 to 44 Years | 52 (100.0%) | 0 (0.0%) |
| 45 to 54 Years | 72 (79.1%) | 19 (20.9%) |
| 55 to 64 Years | 137 (100.0%) | 0 (0.0%) |
| 65 to 74 Years | 75 (100.0%) | 0 (0.0%) |
| 75 Years and older | 73 (100.0%) | 0 (0.0%) |
| Total | 511 (95.3%) | 25 (4.7%) |
Health Insurance Coverage by Citizenship Status in Kreamer
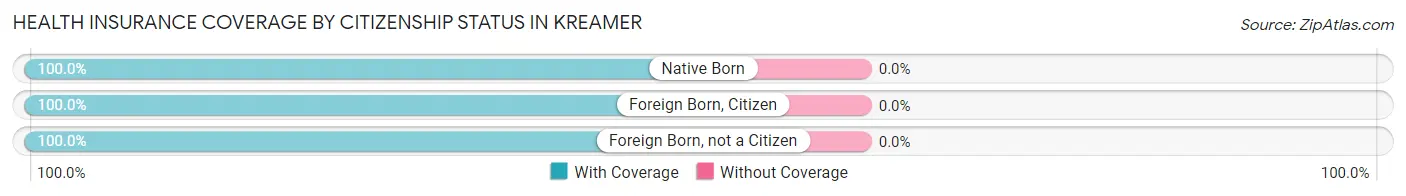
| Citizenship Status | With Coverage | Without Coverage |
| Native Born | 21 (100.0%) | 0 (0.0%) |
| Foreign Born, Citizen | 51 (100.0%) | 0 (0.0%) |
| Foreign Born, not a Citizen | 19 (100.0%) | 0 (0.0%) |
Health Insurance Coverage by Household Income in Kreamer
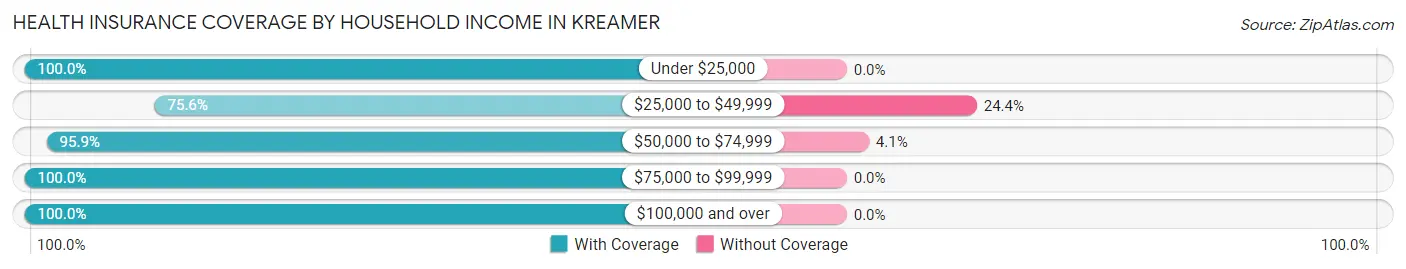
| Household Income | With Coverage | Without Coverage |
| Under $25,000 | 39 (100.0%) | 0 (0.0%) |
| $25,000 to $49,999 | 59 (75.6%) | 19 (24.4%) |
| $50,000 to $74,999 | 139 (95.9%) | 6 (4.1%) |
| $75,000 to $99,999 | 77 (100.0%) | 0 (0.0%) |
| $100,000 and over | 197 (100.0%) | 0 (0.0%) |
Public vs Private Health Insurance Coverage by Age in Kreamer
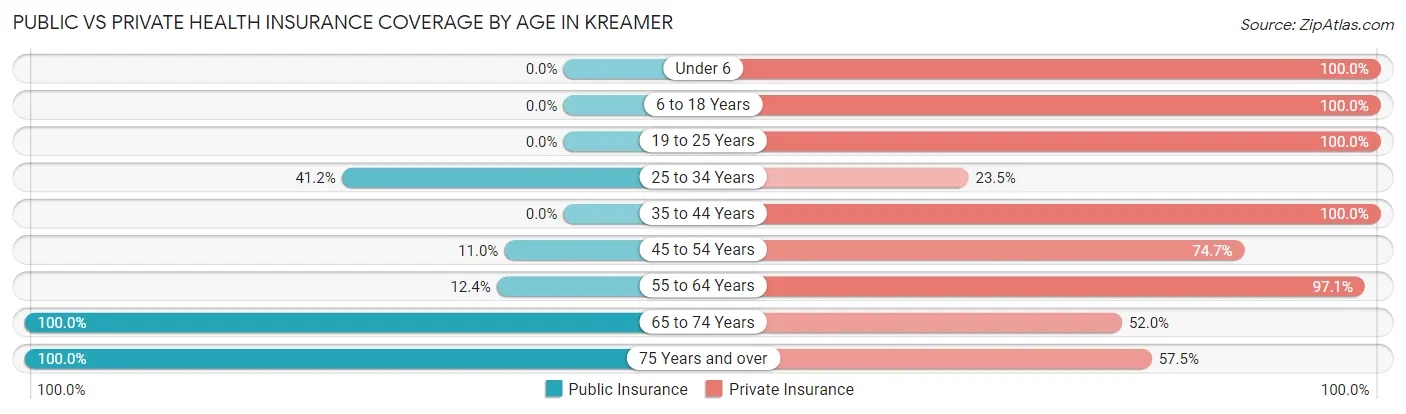
| Age Bracket | Public Insurance | Private Insurance |
| Under 6 | 0 (0.0%) | 21 (100.0%) |
| 6 to 18 Years | 0 (0.0%) | 51 (100.0%) |
| 19 to 25 Years | 0 (0.0%) | 19 (100.0%) |
| 25 to 34 Years | 7 (41.2%) | 4 (23.5%) |
| 35 to 44 Years | 0 (0.0%) | 52 (100.0%) |
| 45 to 54 Years | 10 (11.0%) | 68 (74.7%) |
| 55 to 64 Years | 17 (12.4%) | 133 (97.1%) |
| 65 to 74 Years | 75 (100.0%) | 39 (52.0%) |
| 75 Years and over | 73 (100.0%) | 42 (57.5%) |
| Total | 182 (34.0%) | 429 (80.0%) |
Disability Status by Sex by Age in Kreamer
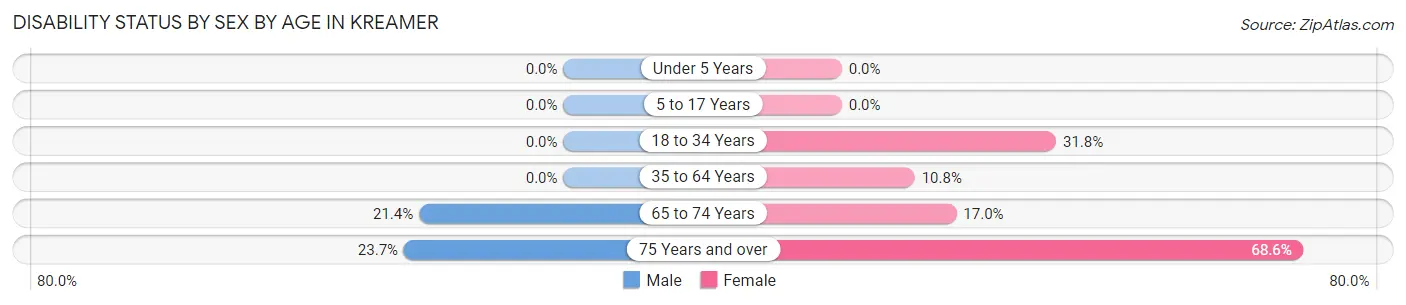
| Age Bracket | Male | Female |
| Under 5 Years | 0 (0.0%) | 0 (0.0%) |
| 5 to 17 Years | 0 (0.0%) | 0 (0.0%) |
| 18 to 34 Years | 0 (0.0%) | 7 (31.8%) |
| 35 to 64 Years | 0 (0.0%) | 17 (10.8%) |
| 65 to 74 Years | 6 (21.4%) | 8 (17.0%) |
| 75 Years and over | 9 (23.7%) | 24 (68.6%) |
Disability Class by Sex by Age in Kreamer
Disability Class: Hearing Difficulty
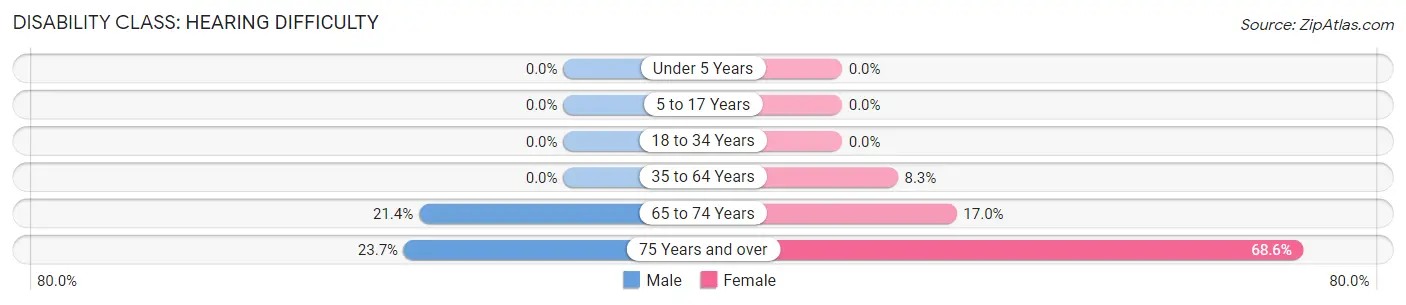
| Age Bracket | Male | Female |
| Under 5 Years | 0 (0.0%) | 0 (0.0%) |
| 5 to 17 Years | 0 (0.0%) | 0 (0.0%) |
| 18 to 34 Years | 0 (0.0%) | 0 (0.0%) |
| 35 to 64 Years | 0 (0.0%) | 13 (8.3%) |
| 65 to 74 Years | 6 (21.4%) | 8 (17.0%) |
| 75 Years and over | 9 (23.7%) | 24 (68.6%) |
Disability Class: Vision Difficulty
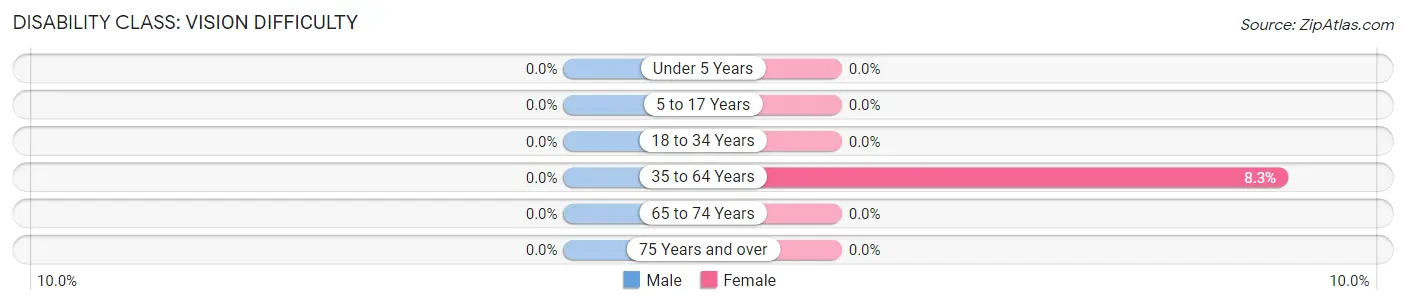
| Age Bracket | Male | Female |
| Under 5 Years | 0 (0.0%) | 0 (0.0%) |
| 5 to 17 Years | 0 (0.0%) | 0 (0.0%) |
| 18 to 34 Years | 0 (0.0%) | 0 (0.0%) |
| 35 to 64 Years | 0 (0.0%) | 13 (8.3%) |
| 65 to 74 Years | 0 (0.0%) | 0 (0.0%) |
| 75 Years and over | 0 (0.0%) | 0 (0.0%) |
Disability Class: Cognitive Difficulty
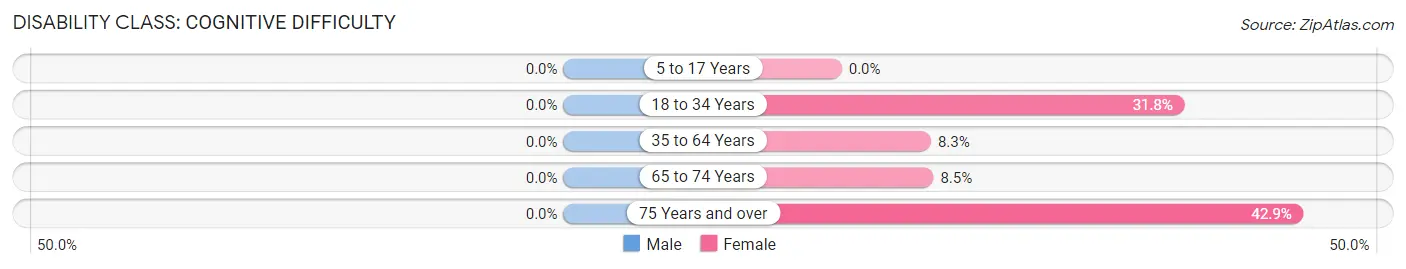
| Age Bracket | Male | Female |
| 5 to 17 Years | 0 (0.0%) | 0 (0.0%) |
| 18 to 34 Years | 0 (0.0%) | 7 (31.8%) |
| 35 to 64 Years | 0 (0.0%) | 13 (8.3%) |
| 65 to 74 Years | 0 (0.0%) | 4 (8.5%) |
| 75 Years and over | 0 (0.0%) | 15 (42.9%) |
Disability Class: Ambulatory Difficulty
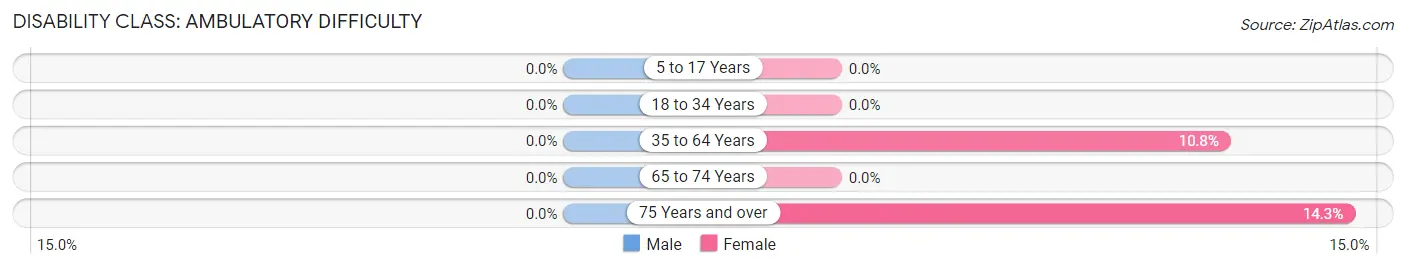
| Age Bracket | Male | Female |
| 5 to 17 Years | 0 (0.0%) | 0 (0.0%) |
| 18 to 34 Years | 0 (0.0%) | 0 (0.0%) |
| 35 to 64 Years | 0 (0.0%) | 17 (10.8%) |
| 65 to 74 Years | 0 (0.0%) | 0 (0.0%) |
| 75 Years and over | 0 (0.0%) | 5 (14.3%) |
Disability Class: Self-Care Difficulty
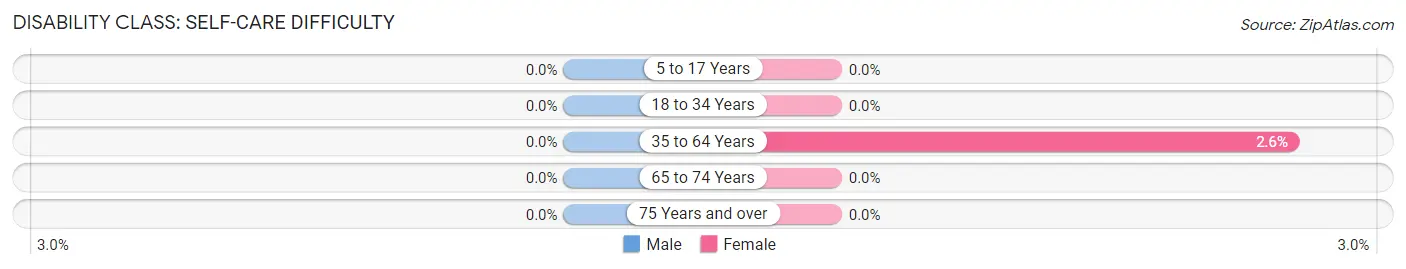
| Age Bracket | Male | Female |
| 5 to 17 Years | 0 (0.0%) | 0 (0.0%) |
| 18 to 34 Years | 0 (0.0%) | 0 (0.0%) |
| 35 to 64 Years | 0 (0.0%) | 4 (2.5%) |
| 65 to 74 Years | 0 (0.0%) | 0 (0.0%) |
| 75 Years and over | 0 (0.0%) | 0 (0.0%) |
Technology Access in Kreamer
Computing Device Access in Kreamer
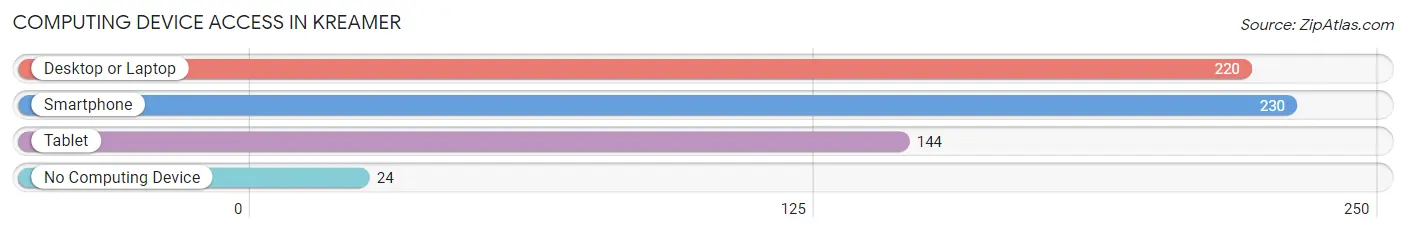
| Device Type | # Households | % Households |
| Desktop or Laptop | 220 | 83.3% |
| Smartphone | 230 | 87.1% |
| Tablet | 144 | 54.5% |
| No Computing Device | 24 | 9.1% |
| Total | 264 | 100.0% |
Internet Access in Kreamer
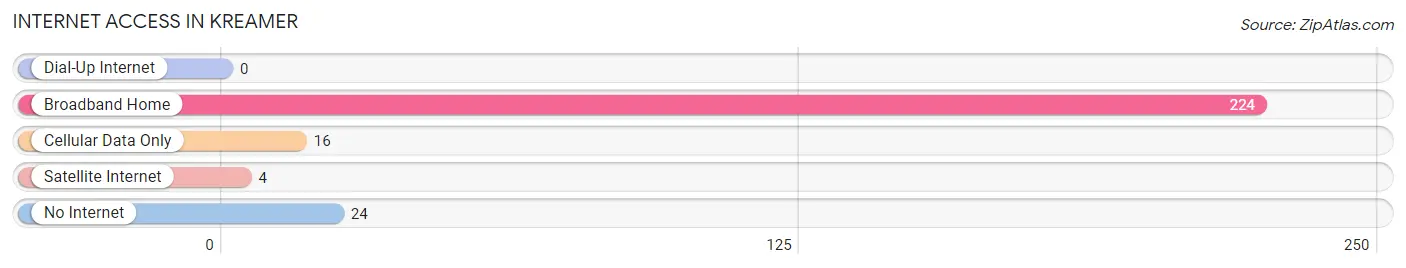
| Internet Type | # Households | % Households |
| Dial-Up Internet | 0 | 0.0% |
| Broadband Home | 224 | 84.9% |
| Cellular Data Only | 16 | 6.1% |
| Satellite Internet | 4 | 1.5% |
| No Internet | 24 | 9.1% |
| Total | 264 | 100.0% |
Kreamer Summary
Kreamer is a small borough located in Snyder County, Pennsylvania. It is situated in the Susquehanna Valley, approximately 10 miles south of Selinsgrove and 15 miles north of Lewisburg. The population of Kreamer was 545 at the 2010 census.
History
Kreamer was founded in 1845 by John Kreamer, a German immigrant. He purchased a tract of land from the local Native Americans and built a sawmill and gristmill. The town was originally known as Kreamer's Mill, but the name was changed to Kreamer in 1851.
The town grew rapidly in the late 19th century, with the construction of a railroad line and the opening of several businesses. The Kreamer Manufacturing Company was established in 1887 and produced a variety of products, including furniture, wagons, and carriages. The company was the largest employer in the area for many years.
Geography
Kreamer is located at 40°45'45" North, 76°51'45" West (40.7625, -76.8625). It is situated in the Susquehanna Valley, approximately 10 miles south of Selinsgrove and 15 miles north of Lewisburg. The borough is bordered by Middleburg to the north, Beaver Springs to the east, and Freeburg to the south.
The terrain of Kreamer is mostly flat, with some rolling hills in the surrounding area. The borough is located in the Appalachian Mountains and is part of the Ridge and Valley physiographic province. The climate is humid continental, with cold winters and hot, humid summers.
Economy
Kreamer's economy is largely based on agriculture and manufacturing. The borough is home to several small businesses, including a sawmill, a furniture factory, and a machine shop. The Kreamer Manufacturing Company is the largest employer in the area, with over 200 employees.
The borough also has a small tourism industry, with several bed and breakfasts and a few restaurants. The nearby Susquehanna River is popular for fishing and boating.
Demographics
As of the 2010 census, the population of Kreamer was 545. The racial makeup of the borough was 97.3% White, 0.7% African American, 0.2% Native American, 0.2% Asian, and 1.6% from other races. The median household income was $41,250, and the median family income was $50,000.
The population of Kreamer is largely Christian, with the majority of residents belonging to the Lutheran and Methodist denominations. The borough is served by two churches, St. John's Lutheran Church and Kreamer United Methodist Church.
Conclusion
Kreamer is a small borough located in Snyder County, Pennsylvania. It was founded in 1845 by John Kreamer and has a population of 545 as of the 2010 census. The economy of Kreamer is largely based on agriculture and manufacturing, with the Kreamer Manufacturing Company being the largest employer in the area. The borough is largely Christian, with the majority of residents belonging to the Lutheran and Methodist denominations. Kreamer is a small, rural community with a rich history and a bright future.
Common Questions
What is Per Capita Income in Kreamer?
Per Capita income in Kreamer is $38,575.
What is the Median Family Income in Kreamer?
Median Family Income in Kreamer is $89,000.
What is the Median Household income in Kreamer?
Median Household Income in Kreamer is $56,250.
What is Income or Wage Gap in Kreamer?
Income or Wage Gap in Kreamer is 31.3%.
Women in Kreamer earn 68.7 cents for every dollar earned by a man.
What is Inequality or Gini Index in Kreamer?
Inequality or Gini Index in Kreamer is 0.39.
What is the Total Population of Kreamer?
Total Population of Kreamer is 536.
What is the Total Male Population of Kreamer?
Total Male Population of Kreamer is 229.
What is the Total Female Population of Kreamer?
Total Female Population of Kreamer is 307.
What is the Ratio of Males per 100 Females in Kreamer?
There are 74.59 Males per 100 Females in Kreamer.
What is the Ratio of Females per 100 Males in Kreamer?
There are 134.06 Females per 100 Males in Kreamer.
What is the Median Population Age in Kreamer?
Median Population Age in Kreamer is 57.3 Years.
What is the Average Family Size in Kreamer
Average Family Size in Kreamer is 2.5 People.
What is the Average Household Size in Kreamer
Average Household Size in Kreamer is 2.0 People.
How Large is the Labor Force in Kreamer?
There are 330 People in the Labor Forcein in Kreamer.
What is the Percentage of People in the Labor Force in Kreamer?
69.5% of People are in the Labor Force in Kreamer.