Ohioville borough, PA Map & Demographics
Ohioville borough Overview
$35,258
PER CAPITA INCOME
$72,431
AVG FAMILY INCOME
$78,070
AVG HOUSEHOLD INCOME
32.8%
WAGE / INCOME GAP [ % ]
67.2¢/ $1
WAGE / INCOME GAP [ $ ]
0.37
INEQUALITY / GINI INDEX
3,344
TOTAL POPULATION
1,757
MALE POPULATION
1,587
FEMALE POPULATION
110.71
MALES / 100 FEMALES
90.32
FEMALES / 100 MALES
39.8
MEDIAN AGE
2.9
AVG FAMILY SIZE
2.6
AVG HOUSEHOLD SIZE
1,611
LABOR FORCE [ PEOPLE ]
62.3%
PERCENT IN LABOR FORCE
1.7%
UNEMPLOYMENT RATE
Income in Ohioville borough
Income Overview in Ohioville borough
Per Capita Income in Ohioville borough is $35,258, while median incomes of families and households are $72,431 and $78,070 respectively.
| Characteristic | Number | Measure |
| Per Capita Income | 3,344 | $35,258 |
| Median Family Income | 972 | $72,431 |
| Mean Family Income | 972 | $92,721 |
| Median Household Income | 1,272 | $78,070 |
| Mean Household Income | 1,272 | $91,076 |
| Income Deficit | 972 | $0 |
| Wage / Income Gap (%) | 3,344 | 32.76% |
| Wage / Income Gap ($) | 3,344 | 67.24¢ per $1 |
| Gini / Inequality Index | 3,344 | 0.37 |
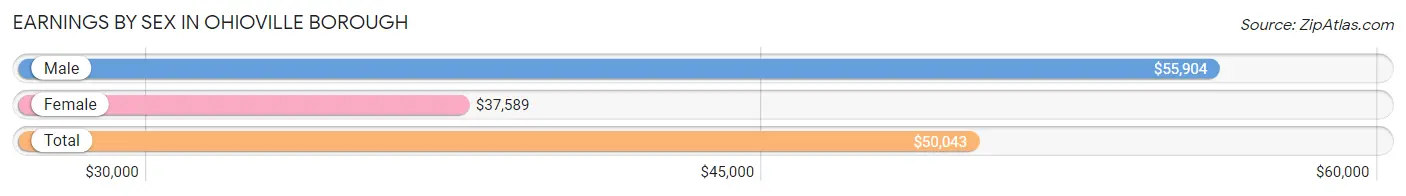
Earnings by Sex in Ohioville borough
Average Earnings in Ohioville borough are $50,043, $55,904 for men and $37,589 for women, a difference of 32.8%.
| Sex | Number | Average Earnings |
| Male | 891 (52.9%) | $55,904 |
| Female | 792 (47.1%) | $37,589 |
| Total | 1,683 (100.0%) | $50,043 |
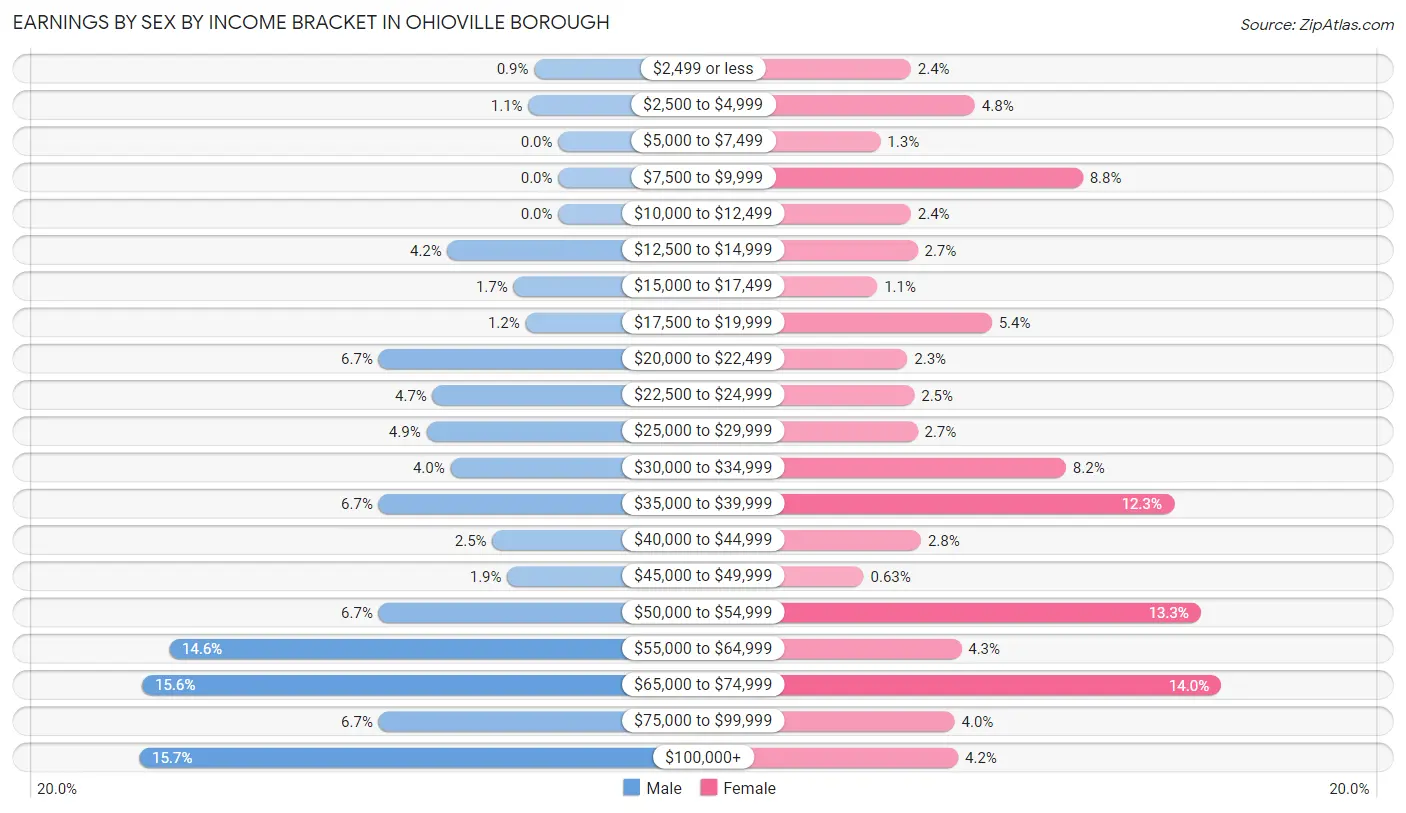
Earnings by Sex by Income Bracket in Ohioville borough
The most common earnings brackets in Ohioville borough are $100,000+ for men (140 | 15.7%) and $65,000 to $74,999 for women (111 | 14.0%).
| Income | Male | Female |
| $2,499 or less | 8 (0.9%) | 19 (2.4%) |
| $2,500 to $4,999 | 10 (1.1%) | 38 (4.8%) |
| $5,000 to $7,499 | 0 (0.0%) | 10 (1.3%) |
| $7,500 to $9,999 | 0 (0.0%) | 70 (8.8%) |
| $10,000 to $12,499 | 0 (0.0%) | 19 (2.4%) |
| $12,500 to $14,999 | 37 (4.2%) | 21 (2.6%) |
| $15,000 to $17,499 | 15 (1.7%) | 9 (1.1%) |
| $17,500 to $19,999 | 11 (1.2%) | 43 (5.4%) |
| $20,000 to $22,499 | 60 (6.7%) | 18 (2.3%) |
| $22,500 to $24,999 | 42 (4.7%) | 20 (2.5%) |
| $25,000 to $29,999 | 44 (4.9%) | 21 (2.6%) |
| $30,000 to $34,999 | 36 (4.0%) | 65 (8.2%) |
| $35,000 to $39,999 | 60 (6.7%) | 97 (12.2%) |
| $40,000 to $44,999 | 22 (2.5%) | 22 (2.8%) |
| $45,000 to $49,999 | 17 (1.9%) | 5 (0.6%) |
| $50,000 to $54,999 | 60 (6.7%) | 105 (13.3%) |
| $55,000 to $64,999 | 130 (14.6%) | 34 (4.3%) |
| $65,000 to $74,999 | 139 (15.6%) | 111 (14.0%) |
| $75,000 to $99,999 | 60 (6.7%) | 32 (4.0%) |
| $100,000+ | 140 (15.7%) | 33 (4.2%) |
| Total | 891 (100.0%) | 792 (100.0%) |
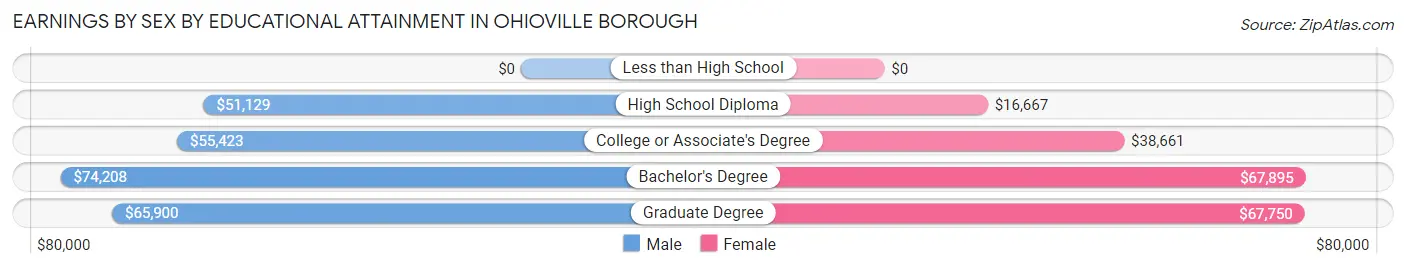
Earnings by Sex by Educational Attainment in Ohioville borough
Average earnings in Ohioville borough are $56,462 for men and $38,170 for women, a difference of 32.4%. Men with an educational attainment of bachelor's degree enjoy the highest average annual earnings of $74,208, while those with high school diploma education earn the least with $51,129. Women with an educational attainment of bachelor's degree earn the most with the average annual earnings of $67,895, while those with high school diploma education have the smallest earnings of $16,667.
| Educational Attainment | Male Income | Female Income |
| Less than High School | - | - |
| High School Diploma | $51,129 | $16,667 |
| College or Associate's Degree | $55,423 | $38,661 |
| Bachelor's Degree | $74,208 | $67,895 |
| Graduate Degree | $65,900 | $67,750 |
| Total | $56,462 | $38,170 |
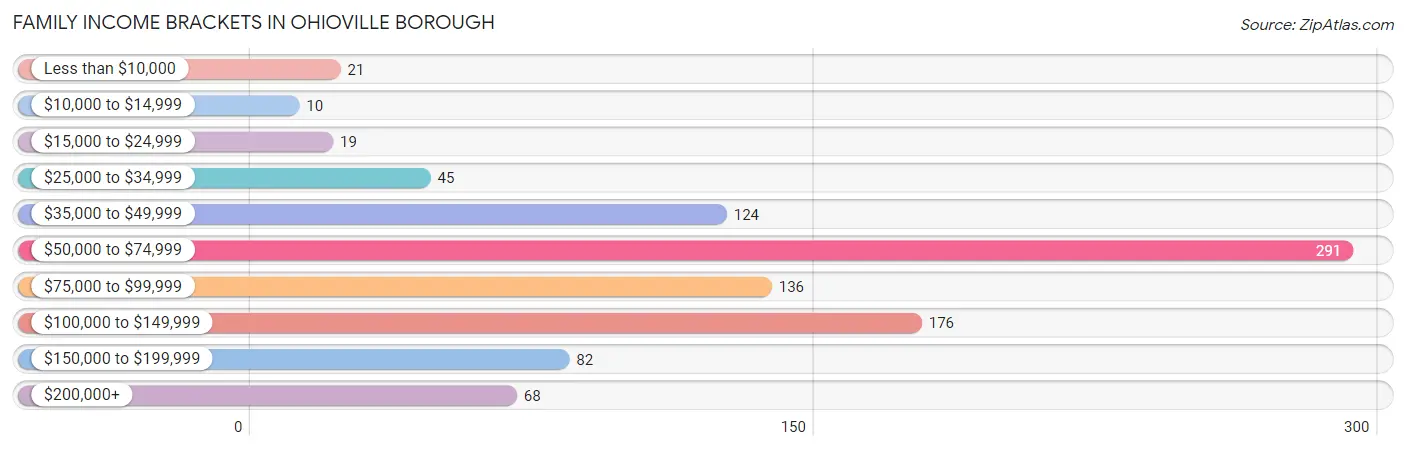
Family Income in Ohioville borough
Family Income Brackets in Ohioville borough
According to the Ohioville borough family income data, there are 291 families falling into the $50,000 to $74,999 income range, which is the most common income bracket and makes up 29.9% of all families. Conversely, the $10,000 to $14,999 income bracket is the least frequent group with only 10 families (1.0%) belonging to this category.
| Income Bracket | # Families | % Families |
| Less than $10,000 | 21 | 2.2% |
| $10,000 to $14,999 | 10 | 1.0% |
| $15,000 to $24,999 | 19 | 2.0% |
| $25,000 to $34,999 | 45 | 4.6% |
| $35,000 to $49,999 | 124 | 12.8% |
| $50,000 to $74,999 | 291 | 29.9% |
| $75,000 to $99,999 | 136 | 14.0% |
| $100,000 to $149,999 | 176 | 18.1% |
| $150,000 to $199,999 | 82 | 8.4% |
| $200,000+ | 68 | 7.0% |
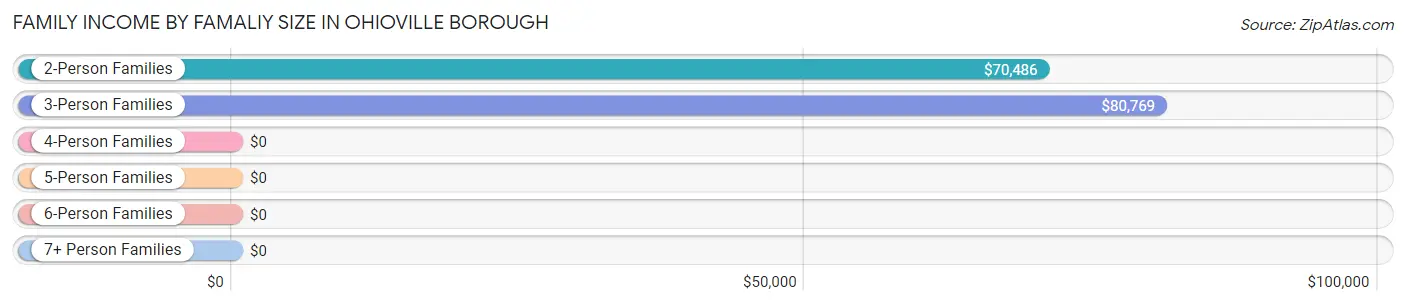
Family Income by Famaliy Size in Ohioville borough
3-person families (156 | 16.1%) account for the highest median family income in Ohioville borough with $80,769 per family, while 2-person families (554 | 57.0%) have the highest median income of $35,243 per family member.
| Income Bracket | # Families | Median Income |
| 2-Person Families | 554 (57.0%) | $70,486 |
| 3-Person Families | 156 (16.1%) | $80,769 |
| 4-Person Families | 197 (20.3%) | $0 |
| 5-Person Families | 53 (5.4%) | $0 |
| 6-Person Families | 5 (0.5%) | $0 |
| 7+ Person Families | 7 (0.7%) | $0 |
| Total | 972 (100.0%) | $72,431 |
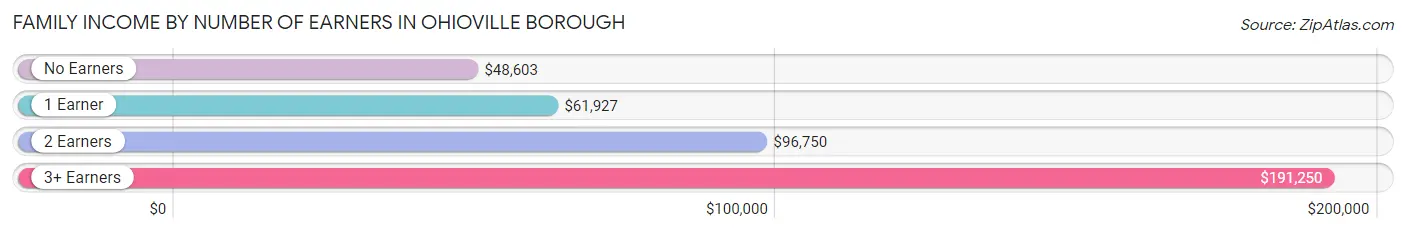
Family Income by Number of Earners in Ohioville borough
The median family income in Ohioville borough is $72,431, with families comprising 3+ earners (60) having the highest median family income of $191,250, while families with no earners (161) have the lowest median family income of $48,603, accounting for 6.2% and 16.6% of families, respectively.
| Number of Earners | # Families | Median Income |
| No Earners | 161 (16.6%) | $48,603 |
| 1 Earner | 413 (42.5%) | $61,927 |
| 2 Earners | 338 (34.8%) | $96,750 |
| 3+ Earners | 60 (6.2%) | $191,250 |
| Total | 972 (100.0%) | $72,431 |
Household Income in Ohioville borough
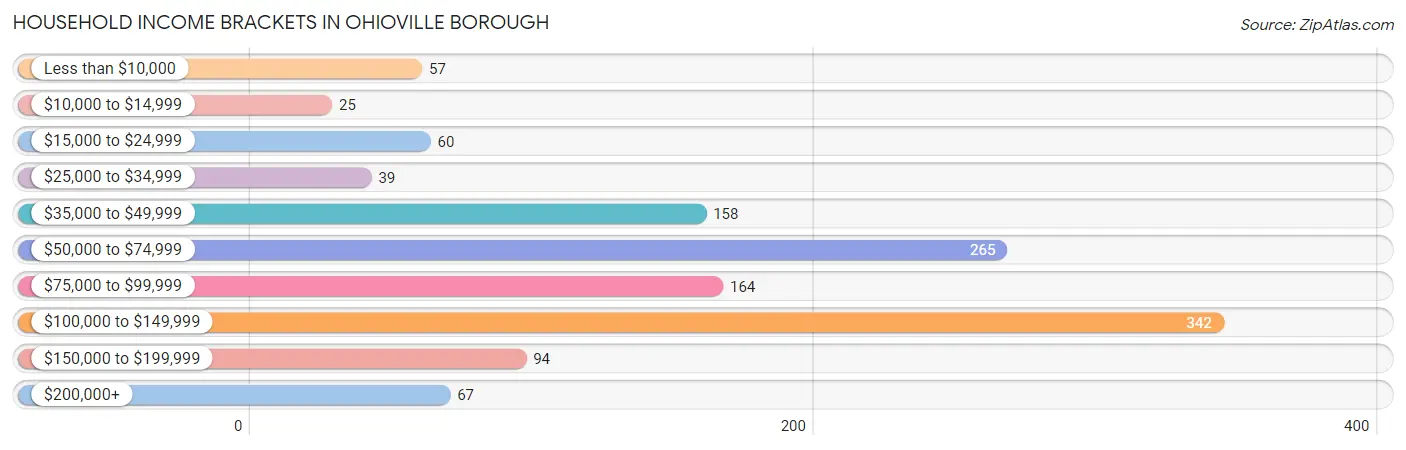
Household Income Brackets in Ohioville borough
With 342 households falling in the category, the $100,000 to $149,999 income range is the most frequent in Ohioville borough, accounting for 26.9% of all households. In contrast, only 25 households (2.0%) fall into the $10,000 to $14,999 income bracket, making it the least populous group.
| Income Bracket | # Households | % Households |
| Less than $10,000 | 57 | 4.5% |
| $10,000 to $14,999 | 25 | 2.0% |
| $15,000 to $24,999 | 60 | 4.7% |
| $25,000 to $34,999 | 39 | 3.1% |
| $35,000 to $49,999 | 158 | 12.4% |
| $50,000 to $74,999 | 265 | 20.8% |
| $75,000 to $99,999 | 164 | 12.9% |
| $100,000 to $149,999 | 342 | 26.9% |
| $150,000 to $199,999 | 94 | 7.4% |
| $200,000+ | 67 | 5.3% |
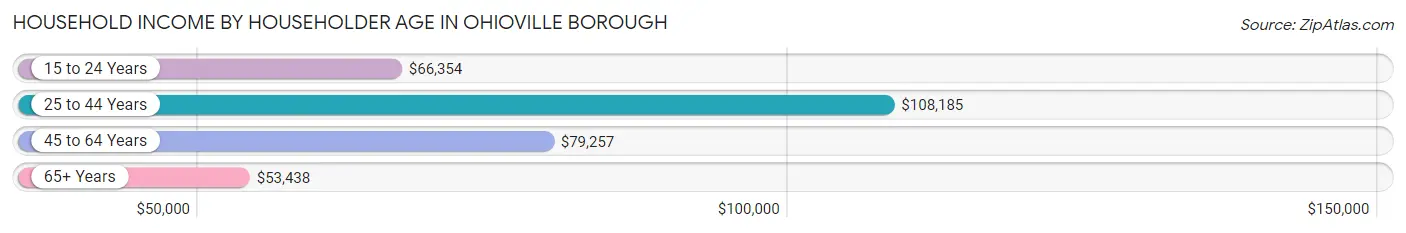
Household Income by Householder Age in Ohioville borough
The median household income in Ohioville borough is $78,070, with the highest median household income of $108,185 found in the 25 to 44 years age bracket for the primary householder. A total of 463 households (36.4%) fall into this category. Meanwhile, the 65+ years age bracket for the primary householder has the lowest median household income of $53,438, with 350 households (27.5%) in this group.
| Income Bracket | # Households | Median Income |
| 15 to 24 Years | 37 (2.9%) | $66,354 |
| 25 to 44 Years | 463 (36.4%) | $108,185 |
| 45 to 64 Years | 422 (33.2%) | $79,257 |
| 65+ Years | 350 (27.5%) | $53,438 |
| Total | 1,272 (100.0%) | $78,070 |
Poverty in Ohioville borough
Income Below Poverty by Sex and Age in Ohioville borough
With 9.0% poverty level for males and 7.1% for females among the residents of Ohioville borough, 18 to 24 year old males and 16 and 17 year old females are the most vulnerable to poverty, with 35 males (37.2%) and 10 females (27.0%) in their respective age groups living below the poverty level.
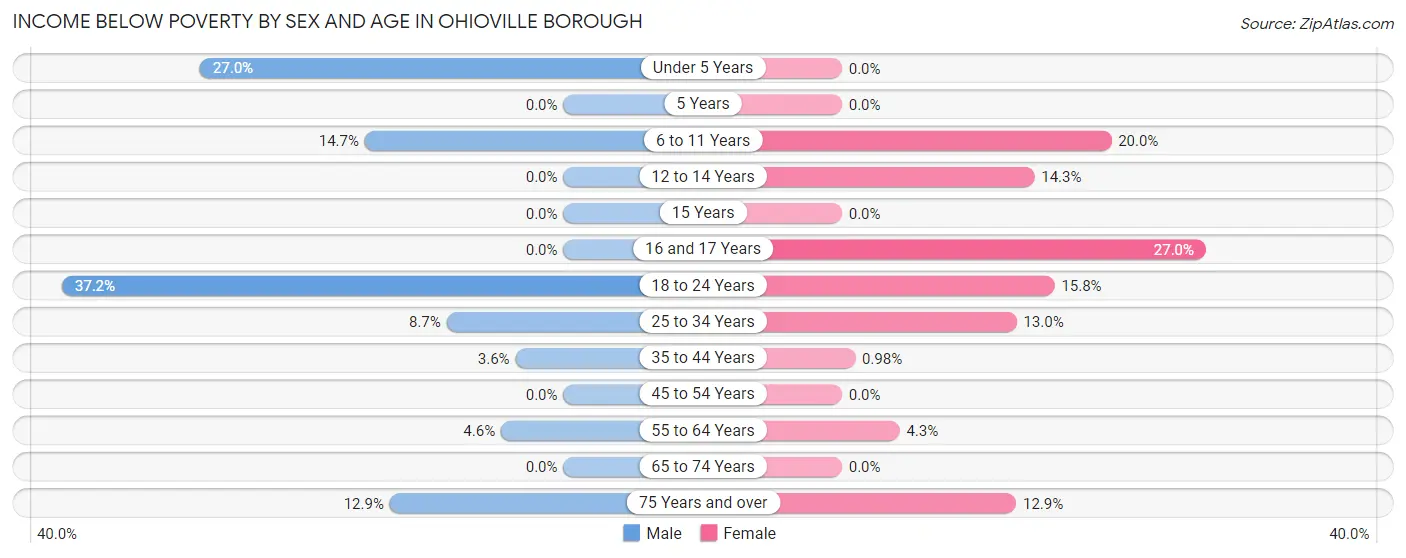
| Age Bracket | Male | Female |
| Under 5 Years | 17 (27.0%) | 0 (0.0%) |
| 5 Years | 0 (0.0%) | 0 (0.0%) |
| 6 to 11 Years | 42 (14.7%) | 13 (20.0%) |
| 12 to 14 Years | 0 (0.0%) | 10 (14.3%) |
| 15 Years | 0 (0.0%) | 0 (0.0%) |
| 16 and 17 Years | 0 (0.0%) | 10 (27.0%) |
| 18 to 24 Years | 35 (37.2%) | 12 (15.8%) |
| 25 to 34 Years | 17 (8.7%) | 31 (13.0%) |
| 35 to 44 Years | 10 (3.6%) | 2 (1.0%) |
| 45 to 54 Years | 0 (0.0%) | 0 (0.0%) |
| 55 to 64 Years | 13 (4.6%) | 11 (4.3%) |
| 65 to 74 Years | 0 (0.0%) | 0 (0.0%) |
| 75 Years and over | 25 (12.9%) | 22 (12.9%) |
| Total | 159 (9.0%) | 111 (7.1%) |
Income Above Poverty by Sex and Age in Ohioville borough
According to the poverty statistics in Ohioville borough, males aged 12 to 14 years and females aged under 5 years are the age groups that are most secure financially, with 100.0% of males and 100.0% of females in these age groups living above the poverty line.
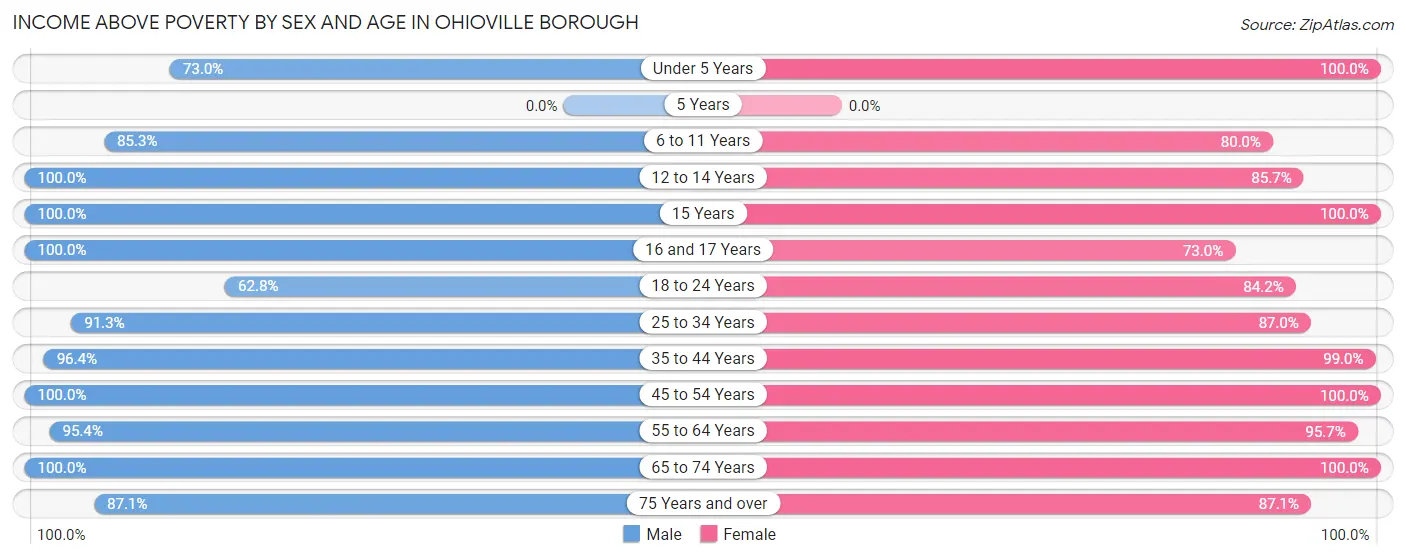
| Age Bracket | Male | Female |
| Under 5 Years | 46 (73.0%) | 168 (100.0%) |
| 5 Years | 0 (0.0%) | 0 (0.0%) |
| 6 to 11 Years | 243 (85.3%) | 52 (80.0%) |
| 12 to 14 Years | 46 (100.0%) | 60 (85.7%) |
| 15 Years | 21 (100.0%) | 17 (100.0%) |
| 16 and 17 Years | 86 (100.0%) | 27 (73.0%) |
| 18 to 24 Years | 59 (62.8%) | 64 (84.2%) |
| 25 to 34 Years | 179 (91.3%) | 208 (87.0%) |
| 35 to 44 Years | 271 (96.4%) | 203 (99.0%) |
| 45 to 54 Years | 114 (100.0%) | 121 (100.0%) |
| 55 to 64 Years | 268 (95.4%) | 246 (95.7%) |
| 65 to 74 Years | 96 (100.0%) | 139 (100.0%) |
| 75 Years and over | 169 (87.1%) | 148 (87.1%) |
| Total | 1,598 (90.9%) | 1,453 (92.9%) |
Income Below Poverty Among Married-Couple Families in Ohioville borough
The poverty statistics for married-couple families in Ohioville borough show that 4.3% or 30 of the total 698 families live below the poverty line. Families with 3 or 4 children have the highest poverty rate of 37.0%, comprising of 20 families. On the other hand, families with 1 or 2 children have the lowest poverty rate of 0.0%, which includes 0 families.
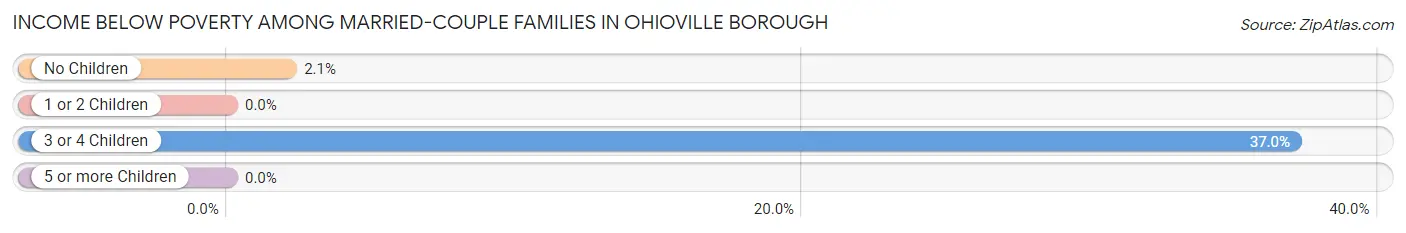
| Children | Above Poverty | Below Poverty |
| No Children | 476 (97.9%) | 10 (2.1%) |
| 1 or 2 Children | 158 (100.0%) | 0 (0.0%) |
| 3 or 4 Children | 34 (63.0%) | 20 (37.0%) |
| 5 or more Children | 0 (0.0%) | 0 (0.0%) |
| Total | 668 (95.7%) | 30 (4.3%) |
Income Below Poverty Among Single-Parent Households in Ohioville borough
According to the poverty data in Ohioville borough, 13.3% or 10 single-father households and 5.5% or 11 single-mother households are living below the poverty line. Among single-father households, those with 1 or 2 children have the highest poverty rate, with 10 households (47.6%) experiencing poverty. Likewise, among single-mother households, those with 1 or 2 children have the highest poverty rate, with 11 households (15.5%) falling below the poverty line.
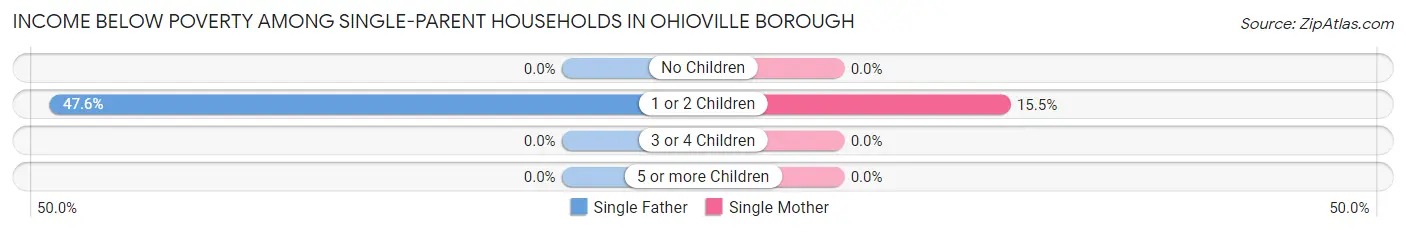
| Children | Single Father | Single Mother |
| No Children | 0 (0.0%) | 0 (0.0%) |
| 1 or 2 Children | 10 (47.6%) | 11 (15.5%) |
| 3 or 4 Children | 0 (0.0%) | 0 (0.0%) |
| 5 or more Children | 0 (0.0%) | 0 (0.0%) |
| Total | 10 (13.3%) | 11 (5.5%) |
Income Below Poverty Among Married-Couple vs Single-Parent Households in Ohioville borough
The poverty data for Ohioville borough shows that 30 of the married-couple family households (4.3%) and 21 of the single-parent households (7.7%) are living below the poverty level. Within the married-couple family households, those with 3 or 4 children have the highest poverty rate, with 20 households (37.0%) falling below the poverty line. Among the single-parent households, those with 1 or 2 children have the highest poverty rate, with 21 household (22.8%) living below poverty.
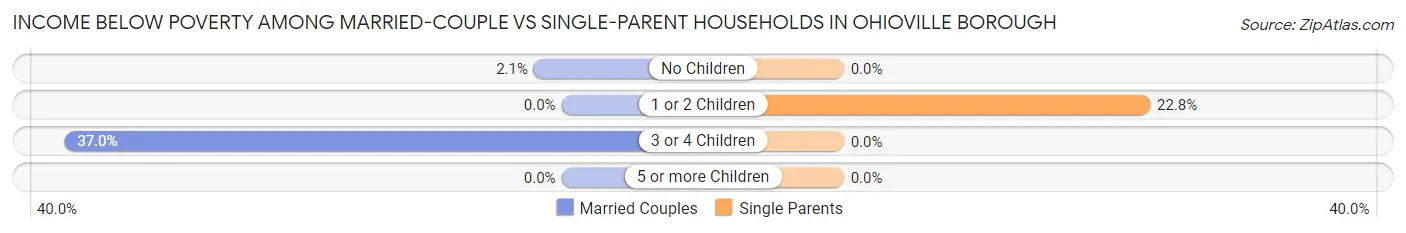
| Children | Married-Couple Families | Single-Parent Households |
| No Children | 10 (2.1%) | 0 (0.0%) |
| 1 or 2 Children | 0 (0.0%) | 21 (22.8%) |
| 3 or 4 Children | 20 (37.0%) | 0 (0.0%) |
| 5 or more Children | 0 (0.0%) | 0 (0.0%) |
| Total | 30 (4.3%) | 21 (7.7%) |
Race in Ohioville borough
The most populous races in Ohioville borough are White / Caucasian (3,278 | 98.0%), Two or more Races (40 | 1.2%), and Black / African American (18 | 0.5%).
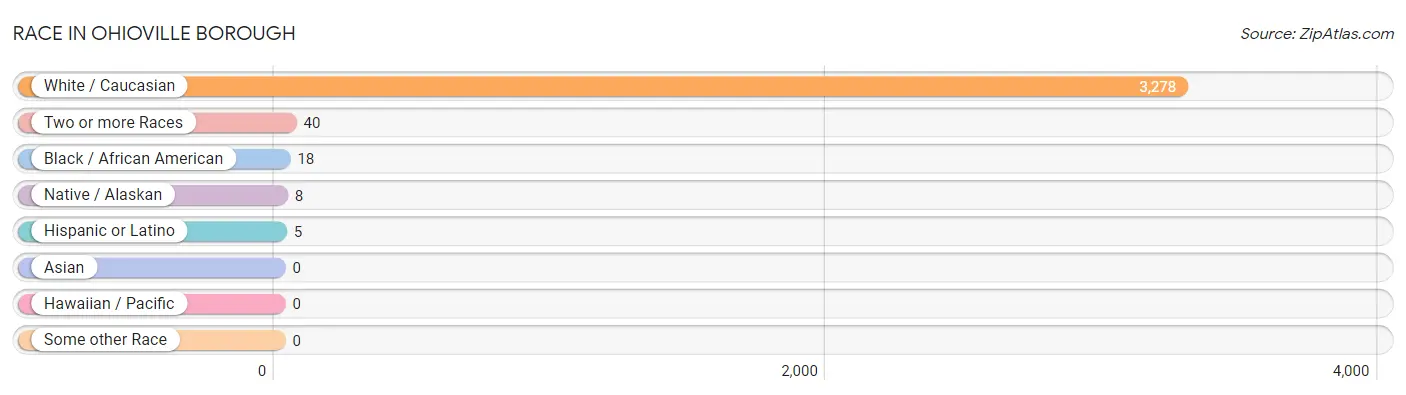
| Race | # Population | % Population |
| Asian | 0 | 0.0% |
| Black / African American | 18 | 0.5% |
| Hawaiian / Pacific | 0 | 0.0% |
| Hispanic or Latino | 5 | 0.2% |
| Native / Alaskan | 8 | 0.2% |
| White / Caucasian | 3,278 | 98.0% |
| Two or more Races | 40 | 1.2% |
| Some other Race | 0 | 0.0% |
| Total | 3,344 | 100.0% |
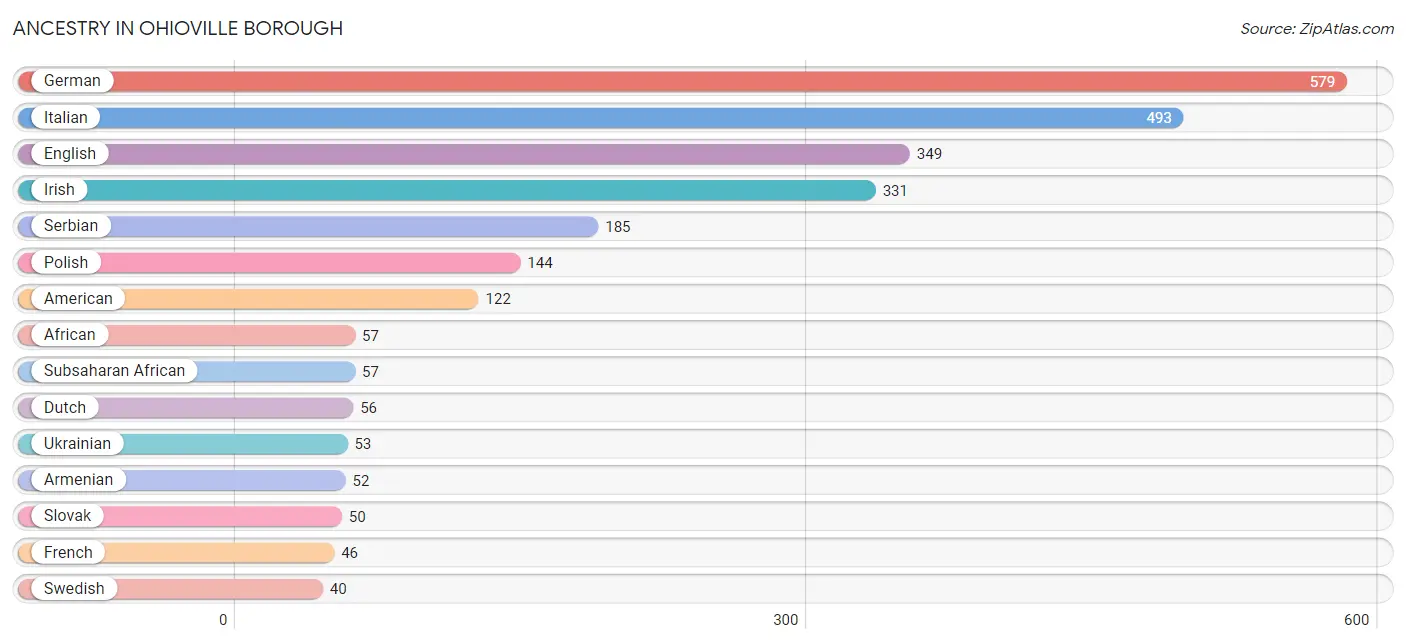
Ancestry in Ohioville borough
The most populous ancestries reported in Ohioville borough are German (579 | 17.3%), Italian (493 | 14.7%), English (349 | 10.4%), Irish (331 | 9.9%), and Serbian (185 | 5.5%), together accounting for 57.9% of all Ohioville borough residents.
| Ancestry | # Population | % Population |
| African | 57 | 1.7% |
| American | 122 | 3.6% |
| Arab | 16 | 0.5% |
| Armenian | 52 | 1.6% |
| British | 9 | 0.3% |
| Croatian | 38 | 1.1% |
| Czech | 16 | 0.5% |
| Danish | 11 | 0.3% |
| Dutch | 56 | 1.7% |
| Eastern European | 11 | 0.3% |
| English | 349 | 10.4% |
| European | 9 | 0.3% |
| French | 46 | 1.4% |
| French Canadian | 8 | 0.2% |
| German | 579 | 17.3% |
| Hungarian | 33 | 1.0% |
| Irish | 331 | 9.9% |
| Italian | 493 | 14.7% |
| Lebanese | 16 | 0.5% |
| Lithuanian | 7 | 0.2% |
| Mexican | 5 | 0.2% |
| Northern European | 24 | 0.7% |
| Pennsylvania German | 30 | 0.9% |
| Polish | 144 | 4.3% |
| Romanian | 37 | 1.1% |
| Scotch-Irish | 20 | 0.6% |
| Scottish | 27 | 0.8% |
| Serbian | 185 | 5.5% |
| Slavic | 5 | 0.2% |
| Slovak | 50 | 1.5% |
| Subsaharan African | 57 | 1.7% |
| Swedish | 40 | 1.2% |
| Ukrainian | 53 | 1.6% |
| Welsh | 24 | 0.7% | View All 34 Rows |
Immigrants in Ohioville borough
The most numerous immigrant groups reported in Ohioville borough came from Africa (19 | 0.6%), and South Africa (19 | 0.6%), together accounting for 1.1% of all Ohioville borough residents.
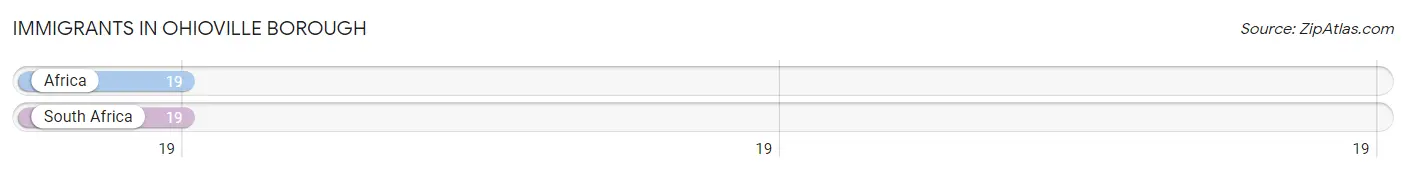
| Immigration Origin | # Population | % Population |
| Africa | 19 | 0.6% |
| South Africa | 19 | 0.6% | View All 2 Rows |
Sex and Age in Ohioville borough
Sex and Age in Ohioville borough
The most populous age groups in Ohioville borough are 10 to 14 Years (194 | 11.0%) for men and Under 5 Years (191 | 12.0%) for women.
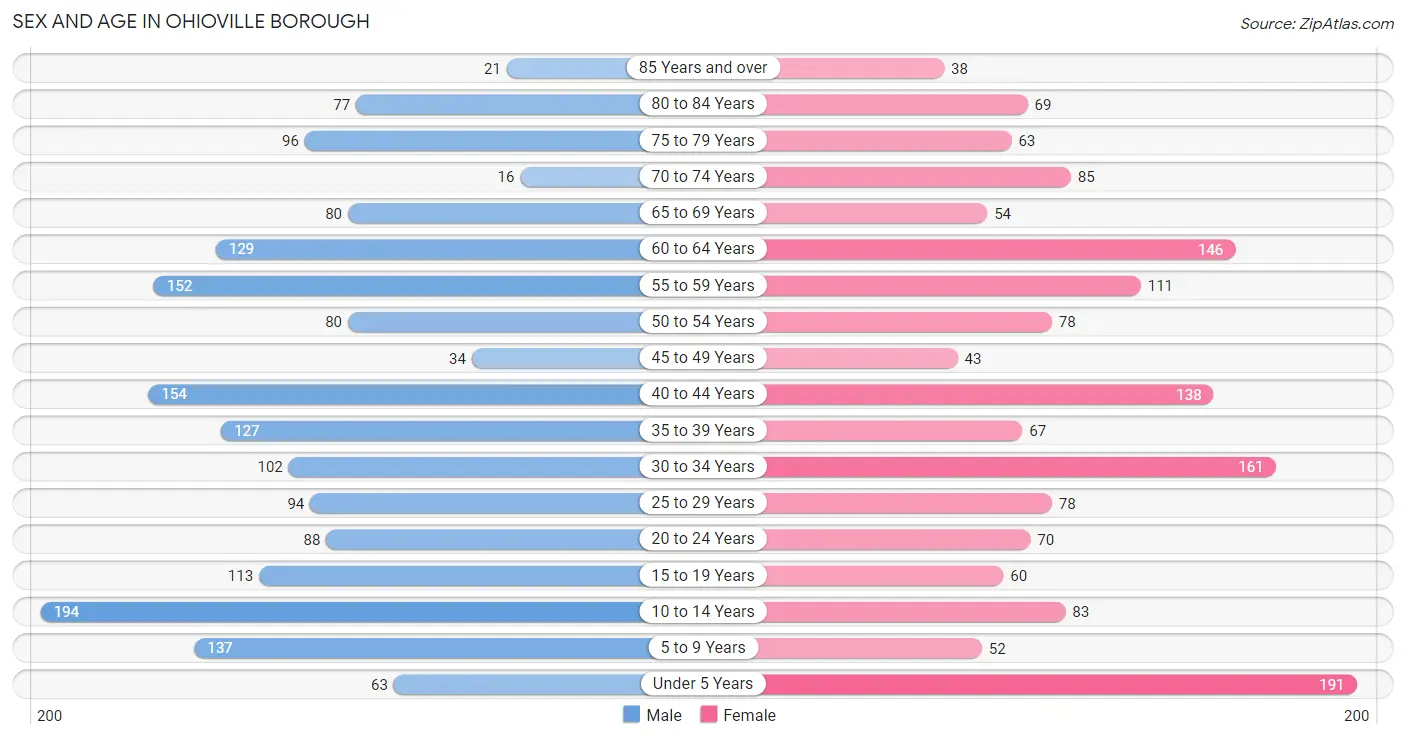
| Age Bracket | Male | Female |
| Under 5 Years | 63 (3.6%) | 191 (12.0%) |
| 5 to 9 Years | 137 (7.8%) | 52 (3.3%) |
| 10 to 14 Years | 194 (11.0%) | 83 (5.2%) |
| 15 to 19 Years | 113 (6.4%) | 60 (3.8%) |
| 20 to 24 Years | 88 (5.0%) | 70 (4.4%) |
| 25 to 29 Years | 94 (5.3%) | 78 (4.9%) |
| 30 to 34 Years | 102 (5.8%) | 161 (10.1%) |
| 35 to 39 Years | 127 (7.2%) | 67 (4.2%) |
| 40 to 44 Years | 154 (8.8%) | 138 (8.7%) |
| 45 to 49 Years | 34 (1.9%) | 43 (2.7%) |
| 50 to 54 Years | 80 (4.5%) | 78 (4.9%) |
| 55 to 59 Years | 152 (8.6%) | 111 (7.0%) |
| 60 to 64 Years | 129 (7.3%) | 146 (9.2%) |
| 65 to 69 Years | 80 (4.5%) | 54 (3.4%) |
| 70 to 74 Years | 16 (0.9%) | 85 (5.4%) |
| 75 to 79 Years | 96 (5.5%) | 63 (4.0%) |
| 80 to 84 Years | 77 (4.4%) | 69 (4.3%) |
| 85 Years and over | 21 (1.2%) | 38 (2.4%) |
| Total | 1,757 (100.0%) | 1,587 (100.0%) |
Families and Households in Ohioville borough
Median Family Size in Ohioville borough
The median family size in Ohioville borough is 2.90 persons per family, with single female/mother families (199 | 20.5%) accounting for the largest median family size of 3.34 persons per family. On the other hand, single male/father families (75 | 7.7%) represent the smallest median family size with 2.36 persons per family.
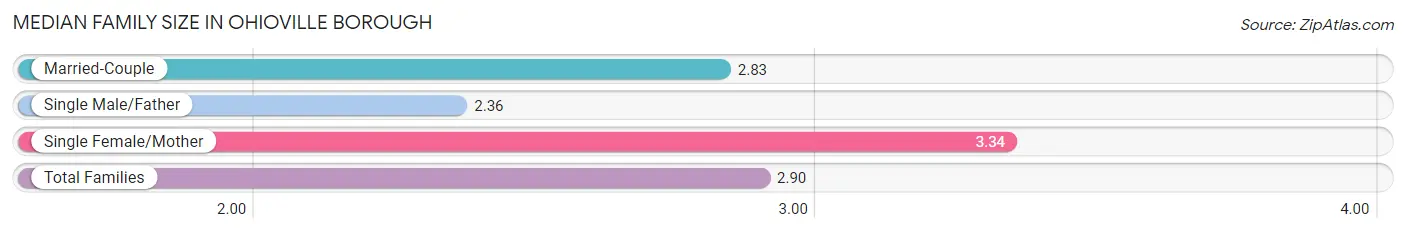
| Family Type | # Families | Family Size |
| Married-Couple | 698 (71.8%) | 2.83 |
| Single Male/Father | 75 (7.7%) | 2.36 |
| Single Female/Mother | 199 (20.5%) | 3.34 |
| Total Families | 972 (100.0%) | 2.90 |
Median Household Size in Ohioville borough
The median household size in Ohioville borough is 2.63 persons per household, with single female/mother households (199 | 15.6%) accounting for the largest median household size of 3.7 persons per household. non-family households (300 | 23.6%) represent the smallest median household size with 1.32 persons per household.
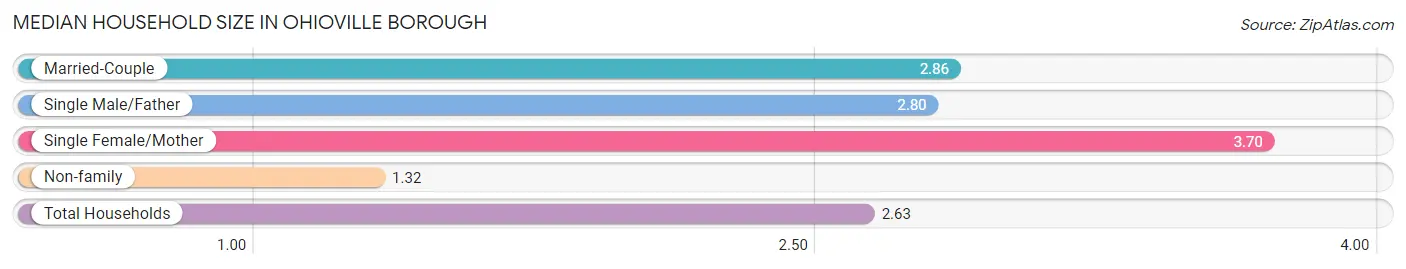
| Household Type | # Households | Household Size |
| Married-Couple | 698 (54.9%) | 2.86 |
| Single Male/Father | 75 (5.9%) | 2.80 |
| Single Female/Mother | 199 (15.6%) | 3.70 |
| Non-family | 300 (23.6%) | 1.32 |
| Total Households | 1,272 (100.0%) | 2.63 |
Household Size by Marriage Status in Ohioville borough
Out of a total of 1,272 households in Ohioville borough, 972 (76.4%) are family households, while 300 (23.6%) are nonfamily households. The most numerous type of family households are 2-person households, comprising 515, and the most common type of nonfamily households are 1-person households, comprising 226.
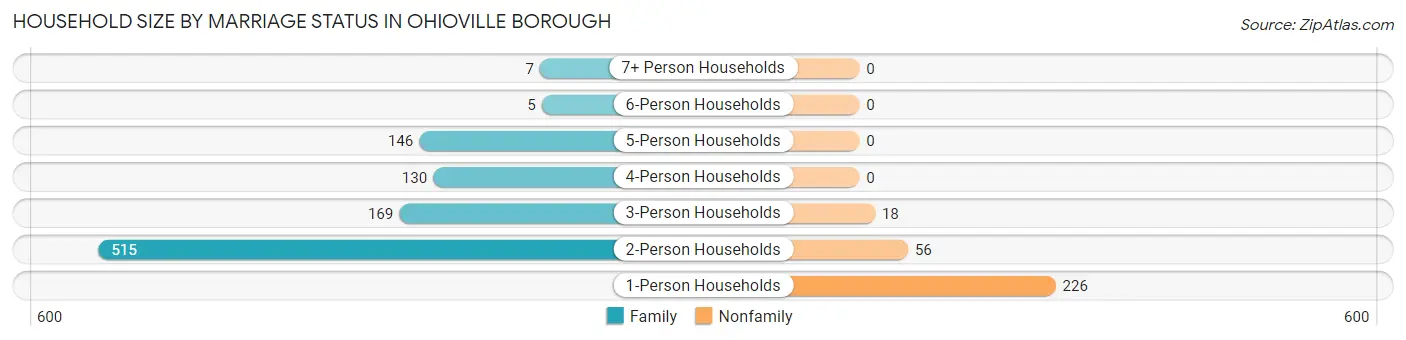
| Household Size | Family Households | Nonfamily Households |
| 1-Person Households | - | 226 (17.8%) |
| 2-Person Households | 515 (40.5%) | 56 (4.4%) |
| 3-Person Households | 169 (13.3%) | 18 (1.4%) |
| 4-Person Households | 130 (10.2%) | 0 (0.0%) |
| 5-Person Households | 146 (11.5%) | 0 (0.0%) |
| 6-Person Households | 5 (0.4%) | 0 (0.0%) |
| 7+ Person Households | 7 (0.5%) | 0 (0.0%) |
| Total | 972 (76.4%) | 300 (23.6%) |
Female Fertility in Ohioville borough
Fertility by Age in Ohioville borough
Average fertility rate in Ohioville borough is 8.0 births per 1,000 women. Women in the age bracket of 20 to 34 years have the highest fertility rate with 16.0 births per 1,000 women. Women in the age bracket of 20 to 34 years acount for 100.0% of all women with births.
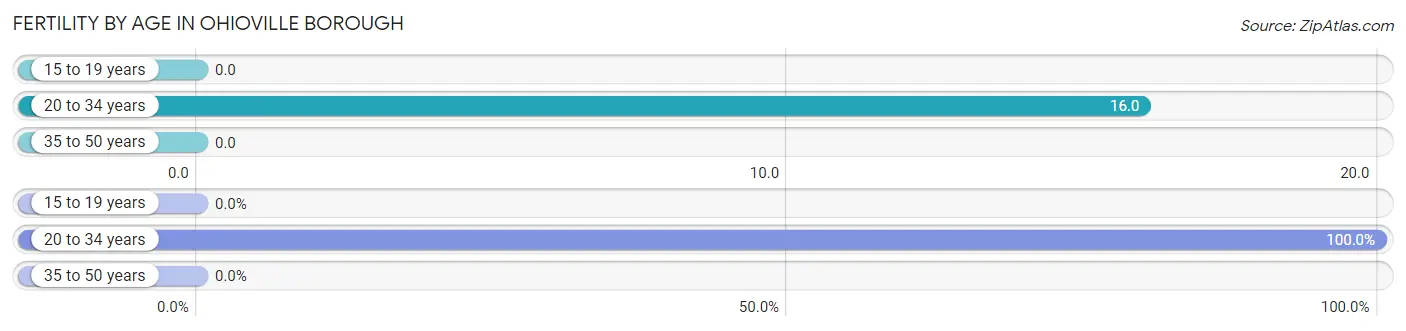
| Age Bracket | Women with Births | Births / 1,000 Women |
| 15 to 19 years | 0 (0.0%) | 0.0 |
| 20 to 34 years | 5 (100.0%) | 16.0 |
| 35 to 50 years | 0 (0.0%) | 0.0 |
| Total | 5 (100.0%) | 8.0 |
Fertility by Age by Marriage Status in Ohioville borough
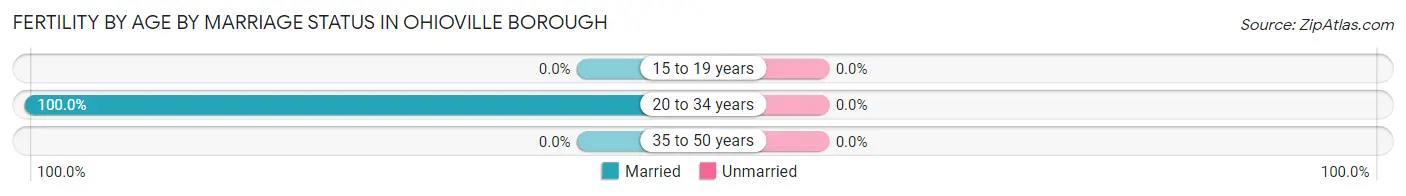
| Age Bracket | Married | Unmarried |
| 15 to 19 years | 0 (0.0%) | 0 (0.0%) |
| 20 to 34 years | 5 (100.0%) | 0 (0.0%) |
| 35 to 50 years | 0 (0.0%) | 0 (0.0%) |
| Total | 5 (100.0%) | 0 (0.0%) |
Fertility by Education in Ohioville borough
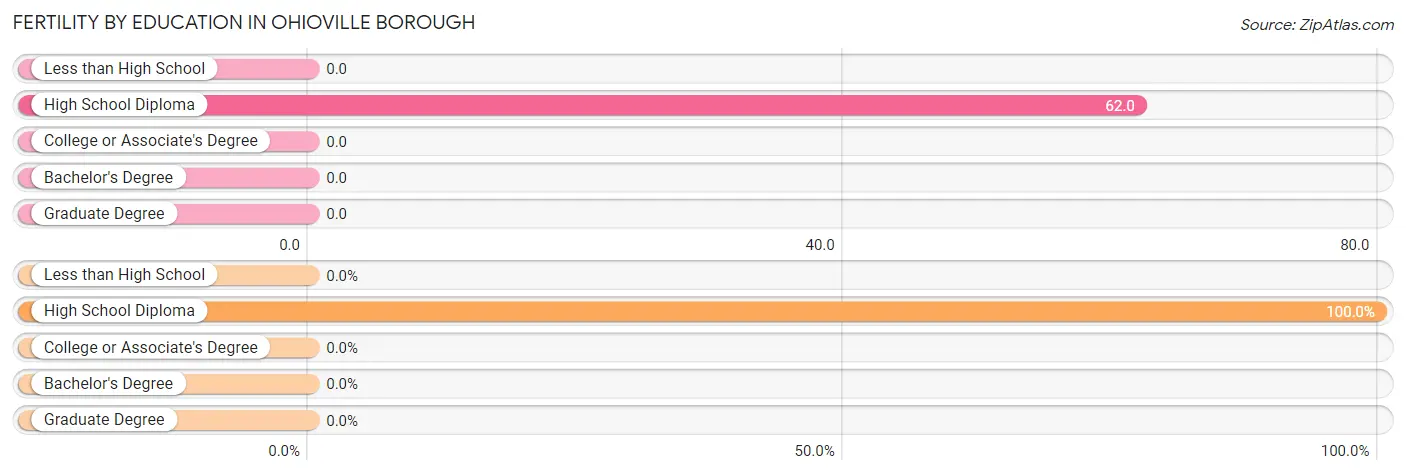
| Educational Attainment | Women with Births | Births / 1,000 Women |
| Less than High School | 0 (0.0%) | 0.0 |
| High School Diploma | 5 (100.0%) | 62.0 |
| College or Associate's Degree | 0 (0.0%) | 0.0 |
| Bachelor's Degree | 0 (0.0%) | 0.0 |
| Graduate Degree | 0 (0.0%) | 0.0 |
| Total | 5 (100.0%) | 8.0 |
Fertility by Education by Marriage Status in Ohioville borough
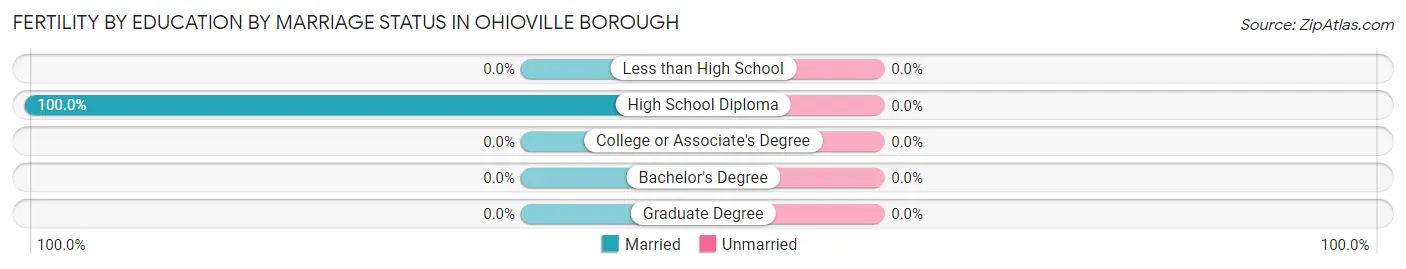
| Educational Attainment | Married | Unmarried |
| Less than High School | 0 (0.0%) | 0 (0.0%) |
| High School Diploma | 5 (100.0%) | 0 (0.0%) |
| College or Associate's Degree | 0 (0.0%) | 0 (0.0%) |
| Bachelor's Degree | 0 (0.0%) | 0 (0.0%) |
| Graduate Degree | 0 (0.0%) | 0 (0.0%) |
| Total | 5 (100.0%) | 0 (0.0%) |
Employment Characteristics in Ohioville borough
Employment by Class of Employer in Ohioville borough
Among the 1,566 employed individuals in Ohioville borough, private company employees (1,211 | 77.3%), not-for-profit organizations (152 | 9.7%), and self-employed (not incorporated) (71 | 4.5%) make up the most common classes of employment.
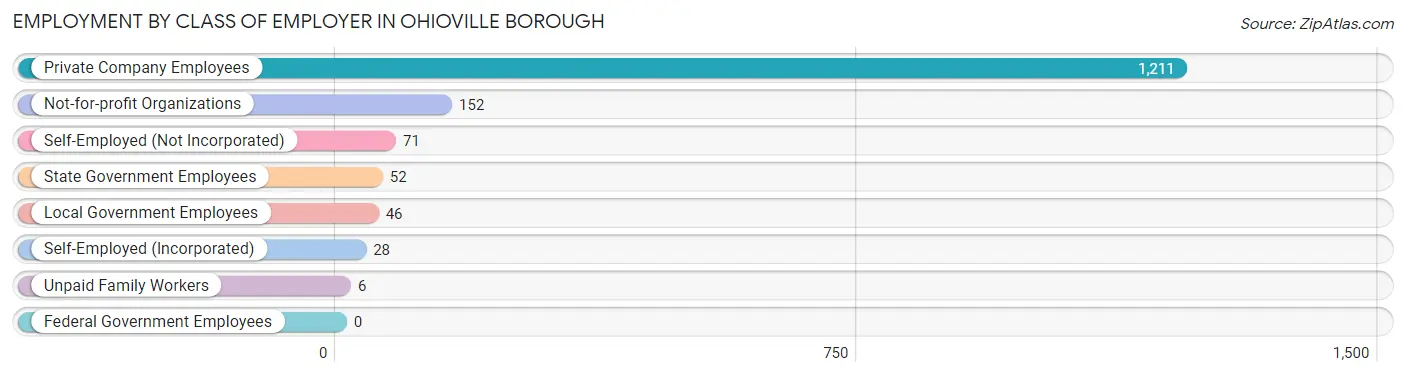
| Employer Class | # Employees | % Employees |
| Private Company Employees | 1,211 | 77.3% |
| Self-Employed (Incorporated) | 28 | 1.8% |
| Self-Employed (Not Incorporated) | 71 | 4.5% |
| Not-for-profit Organizations | 152 | 9.7% |
| Local Government Employees | 46 | 2.9% |
| State Government Employees | 52 | 3.3% |
| Federal Government Employees | 0 | 0.0% |
| Unpaid Family Workers | 6 | 0.4% |
| Total | 1,566 | 100.0% |
Employment Status by Age in Ohioville borough
According to the labor force statistics for Ohioville borough, out of the total population over 16 years of age (2,586), 62.3% or 1,611 individuals are in the labor force, with 1.7% or 27 of them unemployed. The age group with the highest labor force participation rate is 30 to 34 years, with 94.3% or 248 individuals in the labor force. Within the labor force, the 20 to 24 years age range has the highest percentage of unemployed individuals, with 5.3% or 6 of them being unemployed.
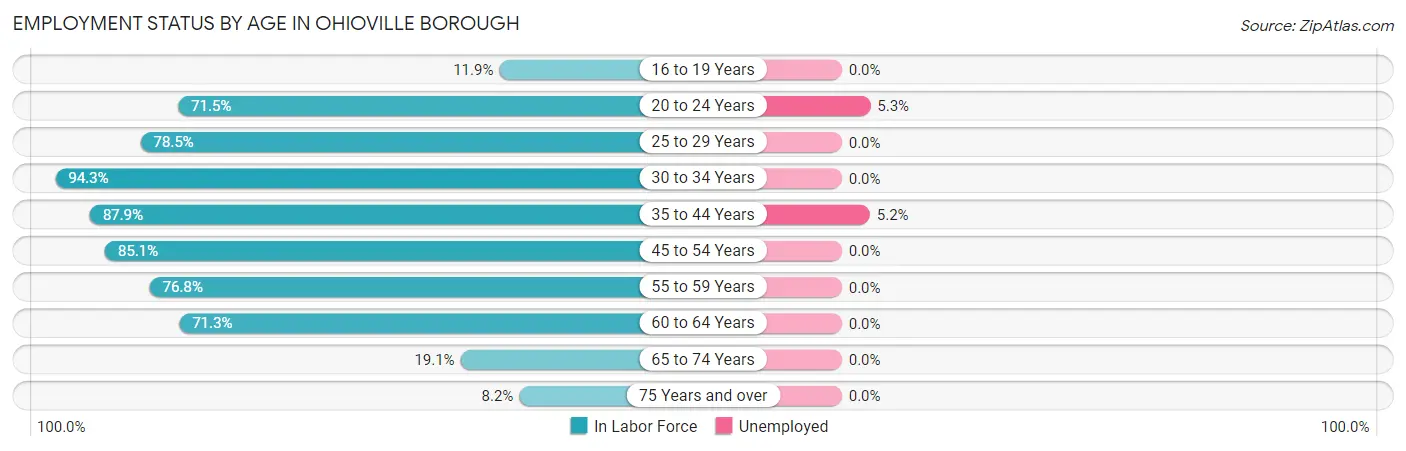
| Age Bracket | In Labor Force | Unemployed |
| 16 to 19 Years | 16 (11.9%) | 0 (0.0%) |
| 20 to 24 Years | 113 (71.5%) | 6 (5.3%) |
| 25 to 29 Years | 135 (78.5%) | 0 (0.0%) |
| 30 to 34 Years | 248 (94.3%) | 0 (0.0%) |
| 35 to 44 Years | 427 (87.9%) | 22 (5.2%) |
| 45 to 54 Years | 200 (85.1%) | 0 (0.0%) |
| 55 to 59 Years | 202 (76.8%) | 0 (0.0%) |
| 60 to 64 Years | 196 (71.3%) | 0 (0.0%) |
| 65 to 74 Years | 45 (19.1%) | 0 (0.0%) |
| 75 Years and over | 30 (8.2%) | 0 (0.0%) |
| Total | 1,611 (62.3%) | 27 (1.7%) |
Employment Status by Educational Attainment in Ohioville borough
According to labor force statistics for Ohioville borough, 83.1% of individuals (1,408) out of the total population between 25 and 64 years of age (1,694) are in the labor force, with 1.6% or 23 of them being unemployed. The group with the highest labor force participation rate are those with the educational attainment of college / associate degree, with 94.1% or 680 individuals in the labor force. Within the labor force, individuals with high school diploma education have the highest percentage of unemployment, with 5.5% or 22 of them being unemployed.
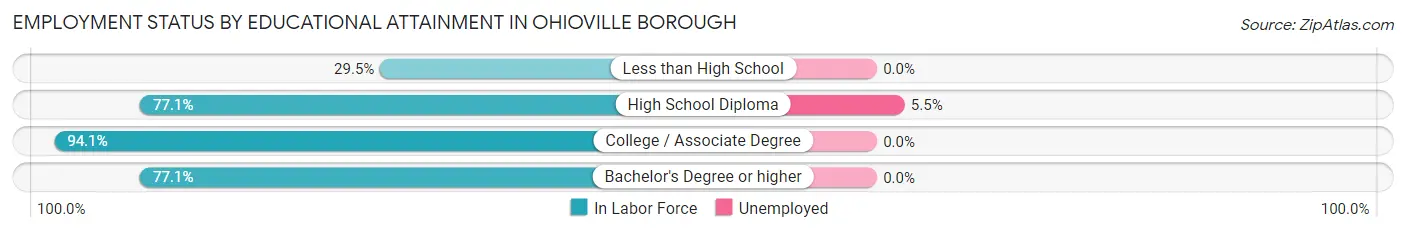
| Educational Attainment | In Labor Force | Unemployed |
| Less than High School | 13 (29.5%) | 0 (0.0%) |
| High School Diploma | 398 (77.1%) | 28 (5.5%) |
| College / Associate Degree | 680 (94.1%) | 0 (0.0%) |
| Bachelor's Degree or higher | 317 (77.1%) | 0 (0.0%) |
| Total | 1,408 (83.1%) | 27 (1.6%) |
Employment Occupations by Sex in Ohioville borough
Management, Business, Science and Arts Occupations
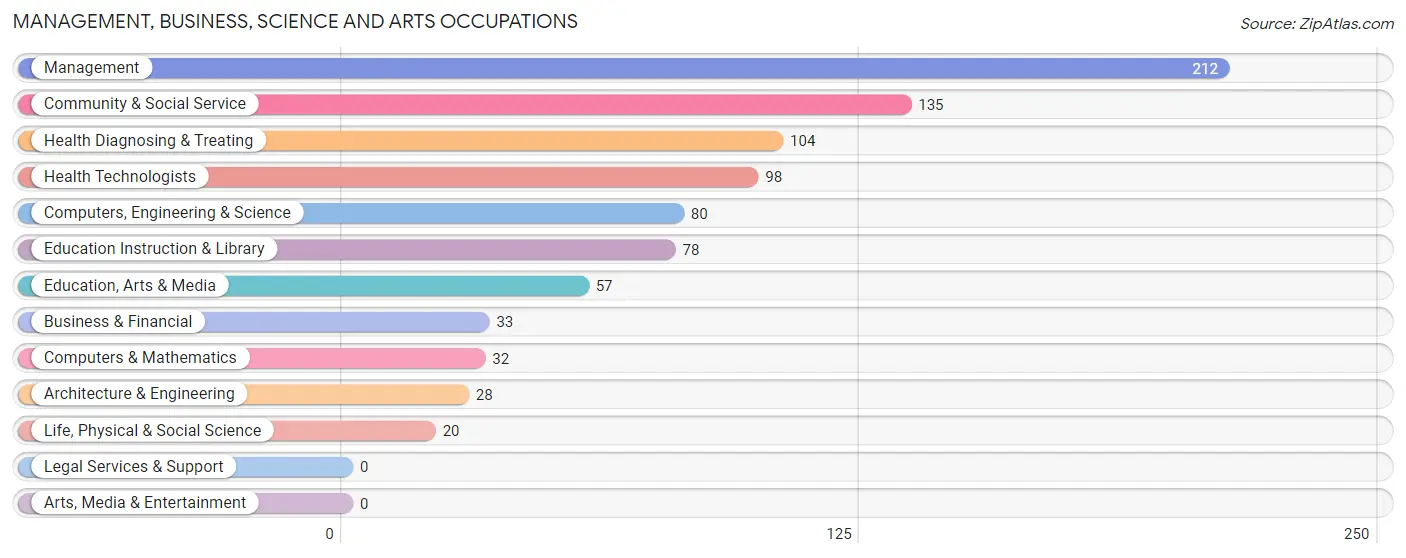
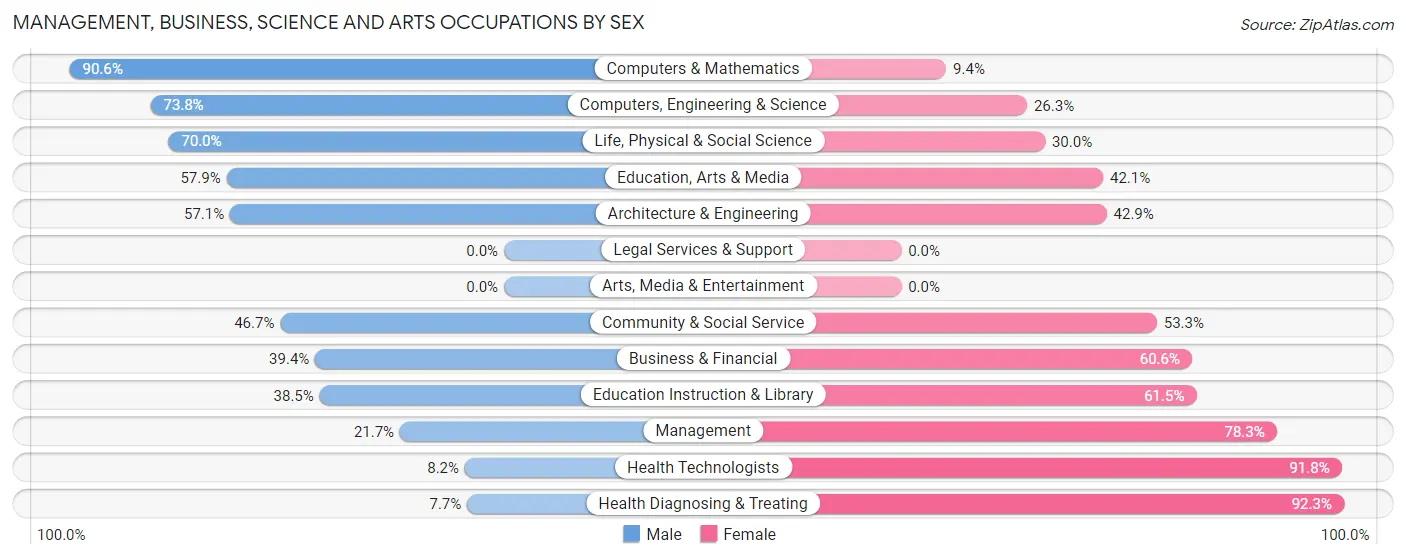
The most common Management, Business, Science and Arts occupations in Ohioville borough are Management (212 | 13.4%), Community & Social Service (135 | 8.5%), Health Diagnosing & Treating (104 | 6.6%), Health Technologists (98 | 6.2%), and Computers, Engineering & Science (80 | 5.1%).
Management, Business, Science and Arts Occupations by Sex
Within the Management, Business, Science and Arts occupations in Ohioville borough, the most male-oriented occupations are Computers & Mathematics (90.6%), Computers, Engineering & Science (73.8%), and Life, Physical & Social Science (70.0%), while the most female-oriented occupations are Health Diagnosing & Treating (92.3%), Health Technologists (91.8%), and Management (78.3%).
| Occupation | Male | Female |
| Management | 46 (21.7%) | 166 (78.3%) |
| Business & Financial | 13 (39.4%) | 20 (60.6%) |
| Computers, Engineering & Science | 59 (73.8%) | 21 (26.3%) |
| Computers & Mathematics | 29 (90.6%) | 3 (9.4%) |
| Architecture & Engineering | 16 (57.1%) | 12 (42.9%) |
| Life, Physical & Social Science | 14 (70.0%) | 6 (30.0%) |
| Community & Social Service | 63 (46.7%) | 72 (53.3%) |
| Education, Arts & Media | 33 (57.9%) | 24 (42.1%) |
| Legal Services & Support | 0 (0.0%) | 0 (0.0%) |
| Education Instruction & Library | 30 (38.5%) | 48 (61.5%) |
| Arts, Media & Entertainment | 0 (0.0%) | 0 (0.0%) |
| Health Diagnosing & Treating | 8 (7.7%) | 96 (92.3%) |
| Health Technologists | 8 (8.2%) | 90 (91.8%) |
| Total (Category) | 189 (33.5%) | 375 (66.5%) |
| Total (Overall) | 875 (55.2%) | 709 (44.8%) |
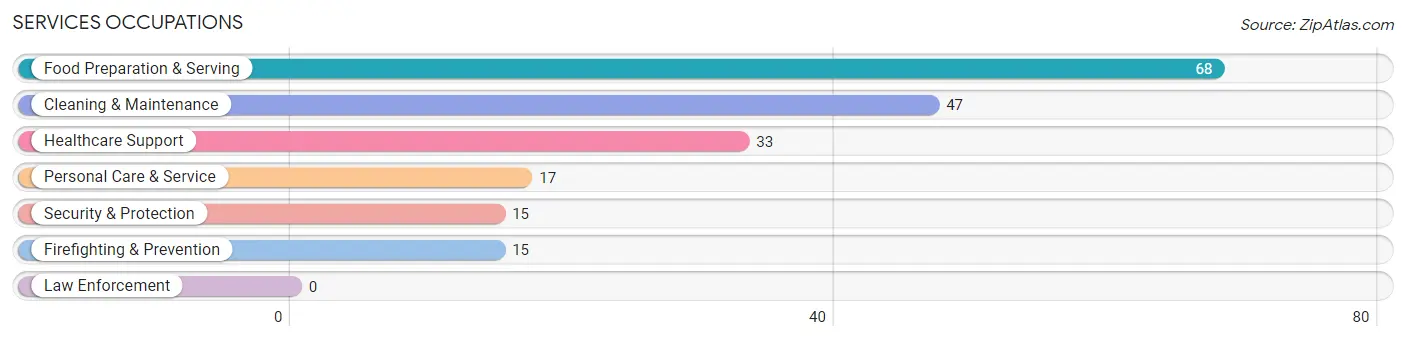
Services Occupations
The most common Services occupations in Ohioville borough are Food Preparation & Serving (68 | 4.3%), Cleaning & Maintenance (47 | 3.0%), Healthcare Support (33 | 2.1%), Personal Care & Service (17 | 1.1%), and Security & Protection (15 | 0.9%).
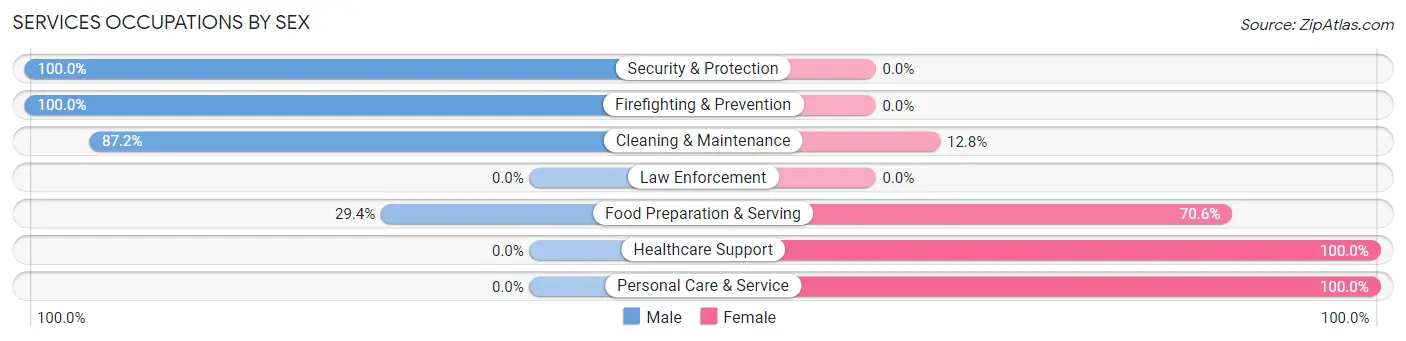
Services Occupations by Sex
Within the Services occupations in Ohioville borough, the most male-oriented occupations are Security & Protection (100.0%), Firefighting & Prevention (100.0%), and Cleaning & Maintenance (87.2%), while the most female-oriented occupations are Healthcare Support (100.0%), Personal Care & Service (100.0%), and Food Preparation & Serving (70.6%).
| Occupation | Male | Female |
| Healthcare Support | 0 (0.0%) | 33 (100.0%) |
| Security & Protection | 15 (100.0%) | 0 (0.0%) |
| Firefighting & Prevention | 15 (100.0%) | 0 (0.0%) |
| Law Enforcement | 0 (0.0%) | 0 (0.0%) |
| Food Preparation & Serving | 20 (29.4%) | 48 (70.6%) |
| Cleaning & Maintenance | 41 (87.2%) | 6 (12.8%) |
| Personal Care & Service | 0 (0.0%) | 17 (100.0%) |
| Total (Category) | 76 (42.2%) | 104 (57.8%) |
| Total (Overall) | 875 (55.2%) | 709 (44.8%) |
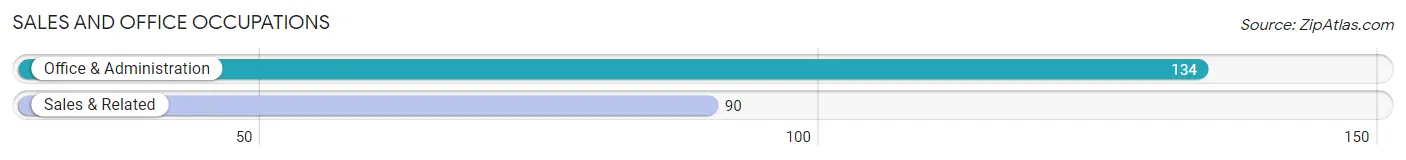
Sales and Office Occupations
The most common Sales and Office occupations in Ohioville borough are Office & Administration (134 | 8.5%), and Sales & Related (90 | 5.7%).
Sales and Office Occupations by Sex
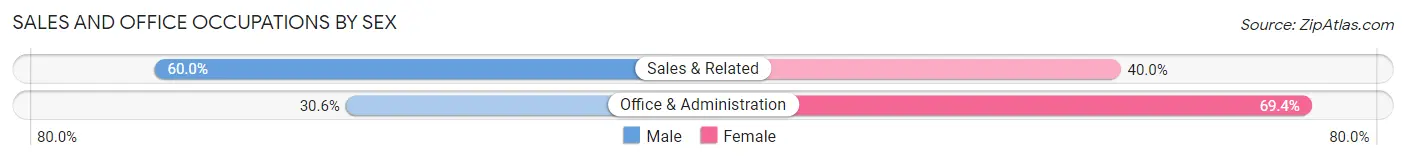
| Occupation | Male | Female |
| Sales & Related | 54 (60.0%) | 36 (40.0%) |
| Office & Administration | 41 (30.6%) | 93 (69.4%) |
| Total (Category) | 95 (42.4%) | 129 (57.6%) |
| Total (Overall) | 875 (55.2%) | 709 (44.8%) |
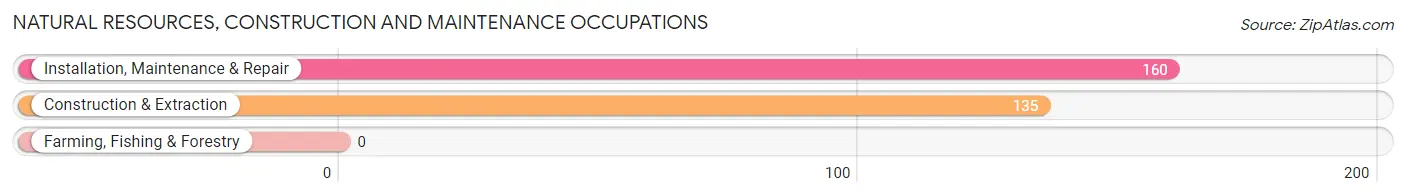
Natural Resources, Construction and Maintenance Occupations
The most common Natural Resources, Construction and Maintenance occupations in Ohioville borough are Installation, Maintenance & Repair (160 | 10.1%), and Construction & Extraction (135 | 8.5%).
Natural Resources, Construction and Maintenance Occupations by Sex
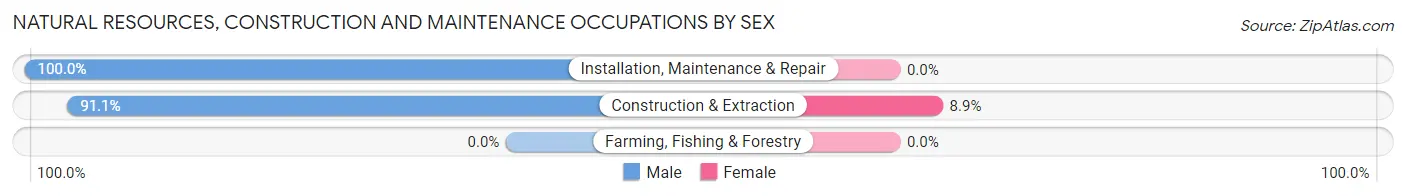
| Occupation | Male | Female |
| Farming, Fishing & Forestry | 0 (0.0%) | 0 (0.0%) |
| Construction & Extraction | 123 (91.1%) | 12 (8.9%) |
| Installation, Maintenance & Repair | 160 (100.0%) | 0 (0.0%) |
| Total (Category) | 283 (95.9%) | 12 (4.1%) |
| Total (Overall) | 875 (55.2%) | 709 (44.8%) |
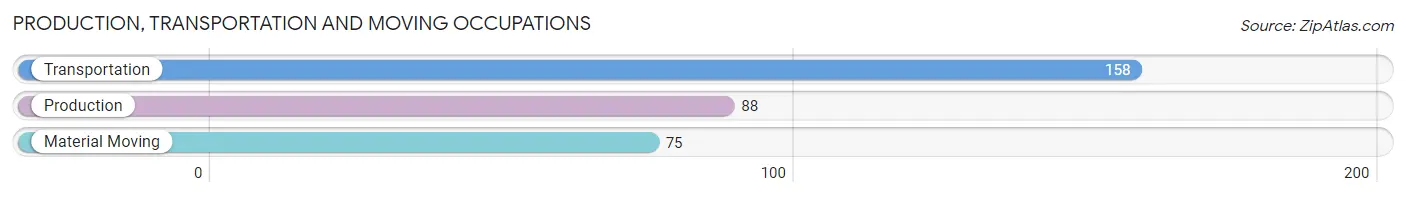
Production, Transportation and Moving Occupations
The most common Production, Transportation and Moving occupations in Ohioville borough are Transportation (158 | 10.0%), Production (88 | 5.6%), and Material Moving (75 | 4.7%).
Production, Transportation and Moving Occupations by Sex
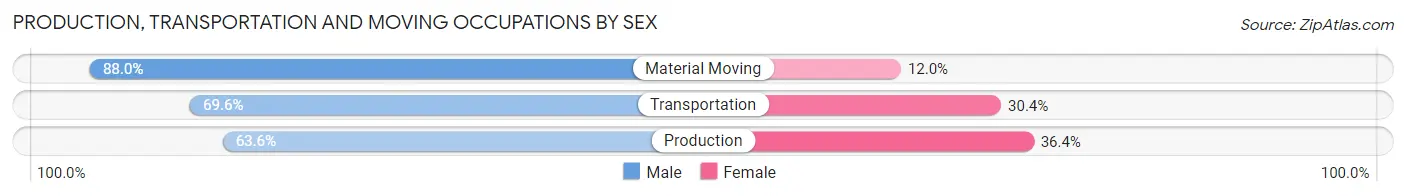
| Occupation | Male | Female |
| Production | 56 (63.6%) | 32 (36.4%) |
| Transportation | 110 (69.6%) | 48 (30.4%) |
| Material Moving | 66 (88.0%) | 9 (12.0%) |
| Total (Category) | 232 (72.3%) | 89 (27.7%) |
| Total (Overall) | 875 (55.2%) | 709 (44.8%) |
Employment Industries by Sex in Ohioville borough
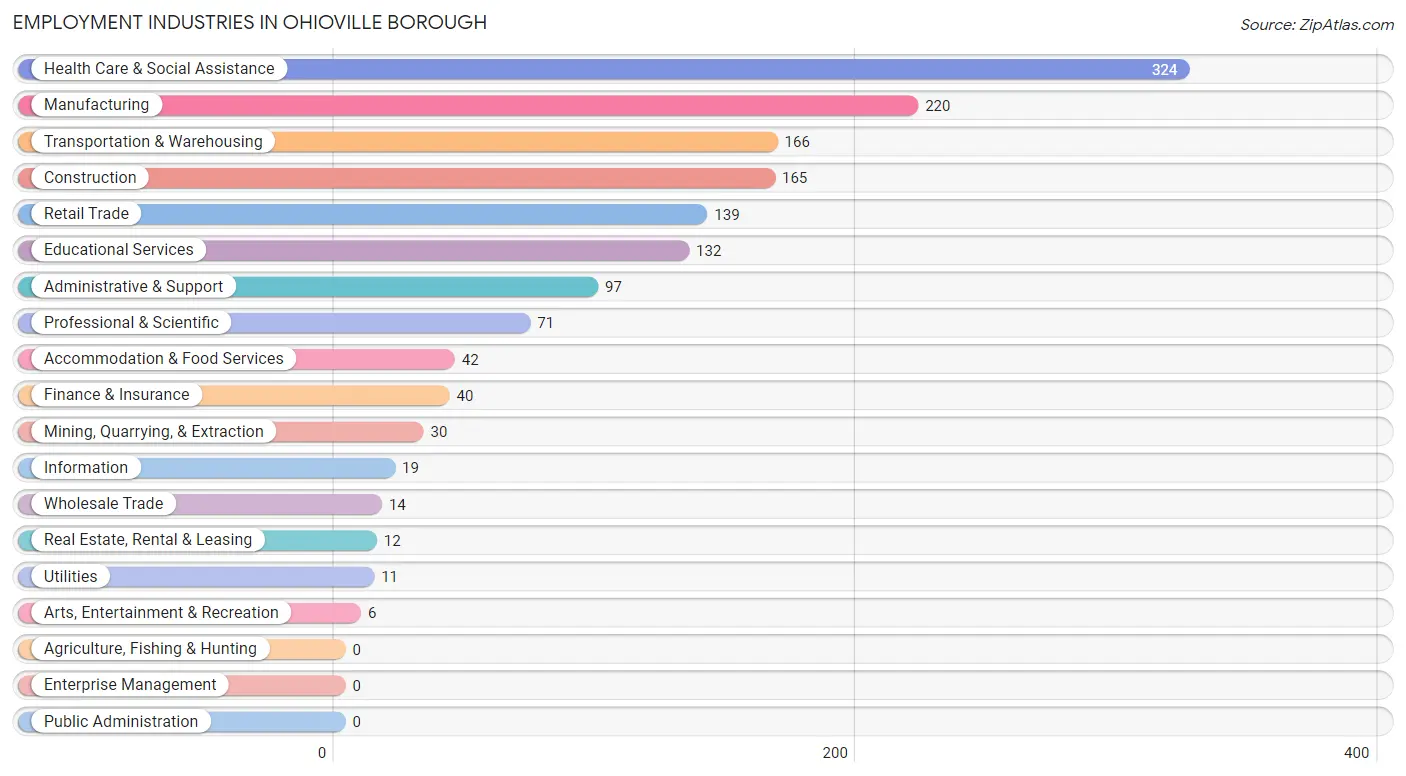
Employment Industries in Ohioville borough
The major employment industries in Ohioville borough include Health Care & Social Assistance (324 | 20.4%), Manufacturing (220 | 13.9%), Transportation & Warehousing (166 | 10.5%), Construction (165 | 10.4%), and Retail Trade (139 | 8.8%).
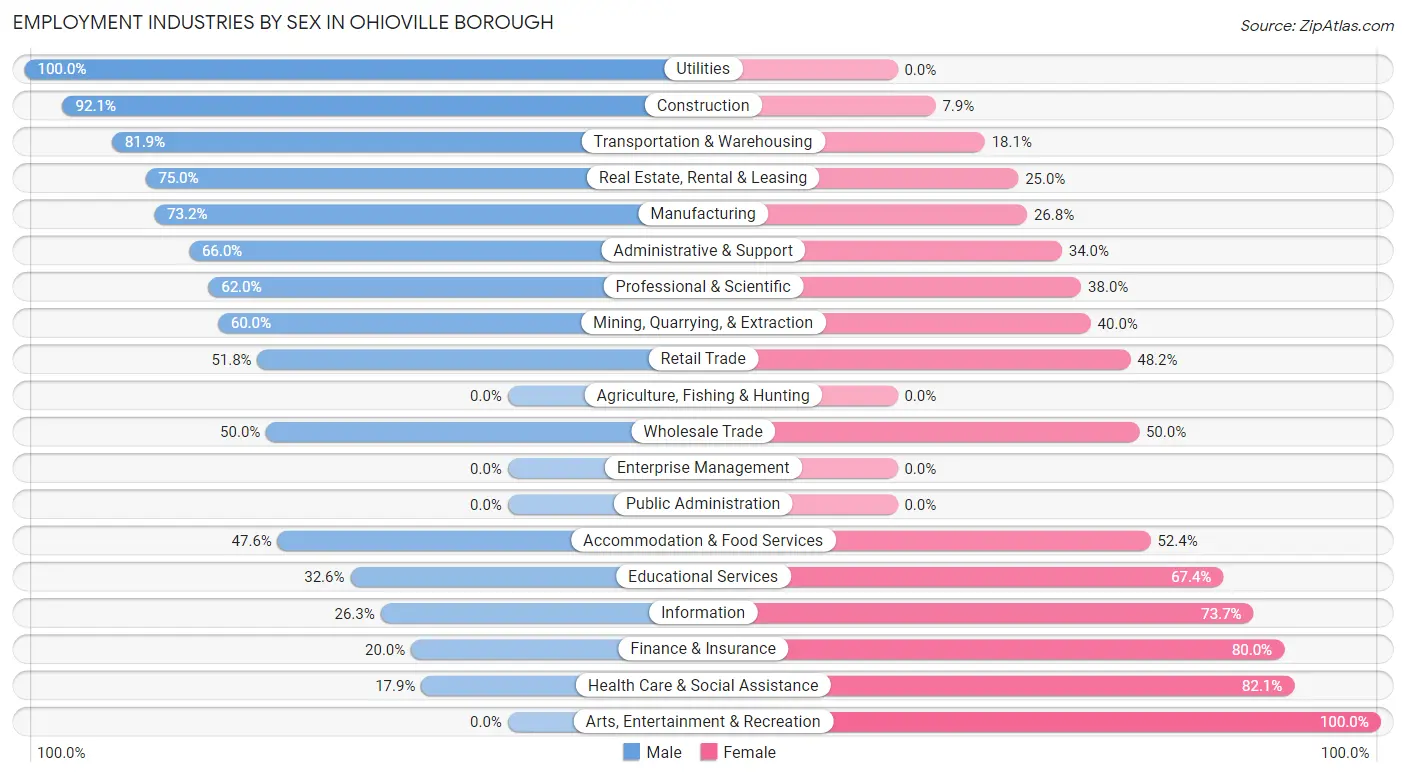
Employment Industries by Sex in Ohioville borough
The Ohioville borough industries that see more men than women are Utilities (100.0%), Construction (92.1%), and Transportation & Warehousing (81.9%), whereas the industries that tend to have a higher number of women are Arts, Entertainment & Recreation (100.0%), Health Care & Social Assistance (82.1%), and Finance & Insurance (80.0%).
| Industry | Male | Female |
| Agriculture, Fishing & Hunting | 0 (0.0%) | 0 (0.0%) |
| Mining, Quarrying, & Extraction | 18 (60.0%) | 12 (40.0%) |
| Construction | 152 (92.1%) | 13 (7.9%) |
| Manufacturing | 161 (73.2%) | 59 (26.8%) |
| Wholesale Trade | 7 (50.0%) | 7 (50.0%) |
| Retail Trade | 72 (51.8%) | 67 (48.2%) |
| Transportation & Warehousing | 136 (81.9%) | 30 (18.1%) |
| Utilities | 11 (100.0%) | 0 (0.0%) |
| Information | 5 (26.3%) | 14 (73.7%) |
| Finance & Insurance | 8 (20.0%) | 32 (80.0%) |
| Real Estate, Rental & Leasing | 9 (75.0%) | 3 (25.0%) |
| Professional & Scientific | 44 (62.0%) | 27 (38.0%) |
| Enterprise Management | 0 (0.0%) | 0 (0.0%) |
| Administrative & Support | 64 (66.0%) | 33 (34.0%) |
| Educational Services | 43 (32.6%) | 89 (67.4%) |
| Health Care & Social Assistance | 58 (17.9%) | 266 (82.1%) |
| Arts, Entertainment & Recreation | 0 (0.0%) | 6 (100.0%) |
| Accommodation & Food Services | 20 (47.6%) | 22 (52.4%) |
| Public Administration | 0 (0.0%) | 0 (0.0%) |
| Total | 875 (55.2%) | 709 (44.8%) |
Education in Ohioville borough
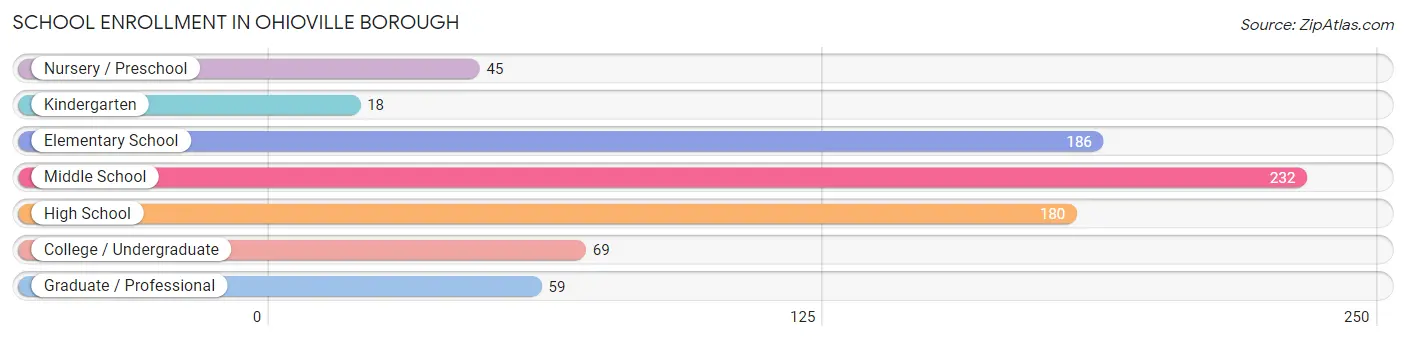
School Enrollment in Ohioville borough
The most common levels of schooling among the 789 students in Ohioville borough are middle school (232 | 29.4%), elementary school (186 | 23.6%), and high school (180 | 22.8%).
| School Level | # Students | % Students |
| Nursery / Preschool | 45 | 5.7% |
| Kindergarten | 18 | 2.3% |
| Elementary School | 186 | 23.6% |
| Middle School | 232 | 29.4% |
| High School | 180 | 22.8% |
| College / Undergraduate | 69 | 8.7% |
| Graduate / Professional | 59 | 7.5% |
| Total | 789 | 100.0% |
School Enrollment by Age by Funding Source in Ohioville borough
Out of a total of 789 students who are enrolled in schools in Ohioville borough, 117 (14.8%) attend a private institution, while the remaining 672 (85.2%) are enrolled in public schools. The age group of 3 to 4 year olds has the highest likelihood of being enrolled in private schools, with 35 (100.0% in the age bracket) enrolled. Conversely, the age group of 5 to 9 year old has the lowest likelihood of being enrolled in a private school, with 182 (100.0% in the age bracket) attending a public institution.
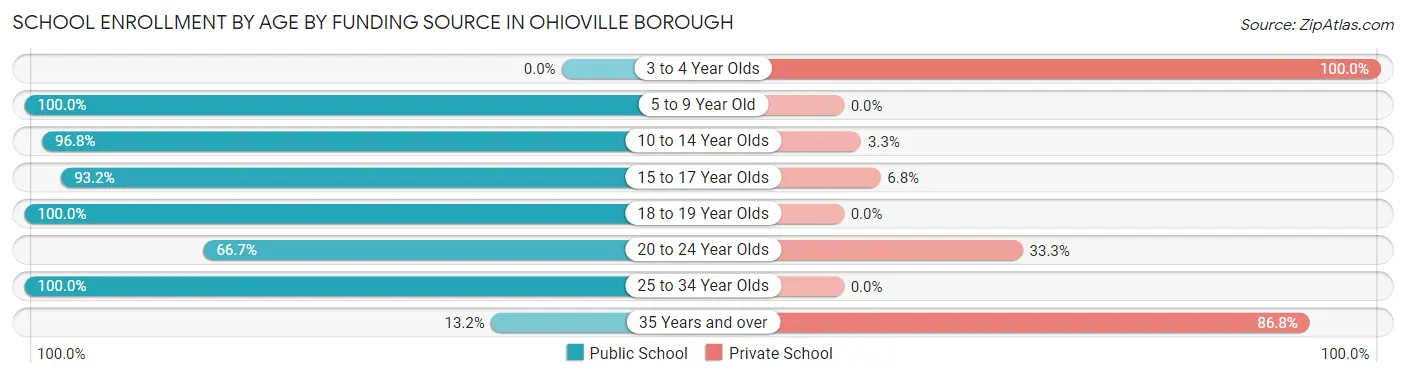
| Age Bracket | Public School | Private School |
| 3 to 4 Year Olds | 0 (0.0%) | 35 (100.0%) |
| 5 to 9 Year Old | 182 (100.0%) | 0 (0.0%) |
| 10 to 14 Year Olds | 268 (96.8%) | 9 (3.3%) |
| 15 to 17 Year Olds | 150 (93.2%) | 11 (6.8%) |
| 18 to 19 Year Olds | 6 (100.0%) | 0 (0.0%) |
| 20 to 24 Year Olds | 32 (66.7%) | 16 (33.3%) |
| 25 to 34 Year Olds | 27 (100.0%) | 0 (0.0%) |
| 35 Years and over | 7 (13.2%) | 46 (86.8%) |
| Total | 672 (85.2%) | 117 (14.8%) |
Educational Attainment by Field of Study in Ohioville borough
Science & technology (120 | 24.0%), business (101 | 20.2%), education (69 | 13.8%), bio, nature & agricultural (56 | 11.2%), and psychology (36 | 7.2%) are the most common fields of study among 499 individuals in Ohioville borough who have obtained a bachelor's degree or higher.
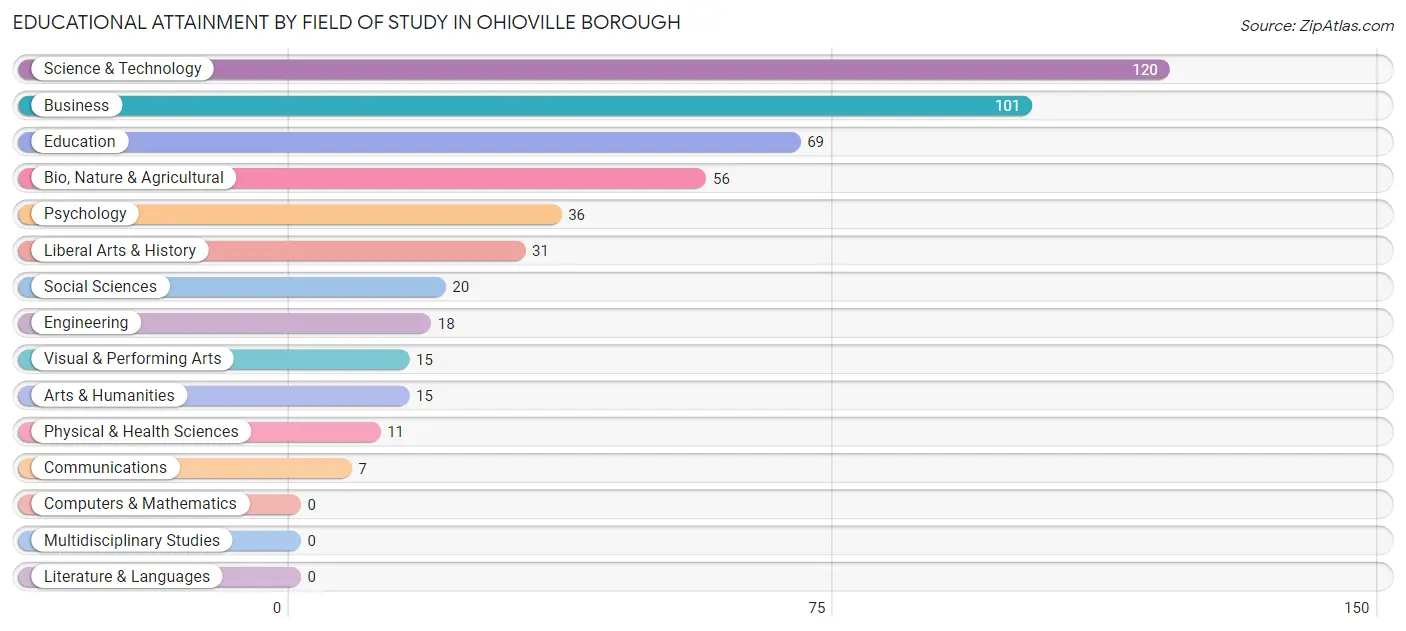
| Field of Study | # Graduates | % Graduates |
| Computers & Mathematics | 0 | 0.0% |
| Bio, Nature & Agricultural | 56 | 11.2% |
| Physical & Health Sciences | 11 | 2.2% |
| Psychology | 36 | 7.2% |
| Social Sciences | 20 | 4.0% |
| Engineering | 18 | 3.6% |
| Multidisciplinary Studies | 0 | 0.0% |
| Science & Technology | 120 | 24.0% |
| Business | 101 | 20.2% |
| Education | 69 | 13.8% |
| Literature & Languages | 0 | 0.0% |
| Liberal Arts & History | 31 | 6.2% |
| Visual & Performing Arts | 15 | 3.0% |
| Communications | 7 | 1.4% |
| Arts & Humanities | 15 | 3.0% |
| Total | 499 | 100.0% |
Transportation & Commute in Ohioville borough
Vehicle Availability by Sex in Ohioville borough
The most prevalent vehicle ownership categories in Ohioville borough are males with 2 vehicles (418, accounting for 48.8%) and females with 2 vehicles (277, making up 59.0%).
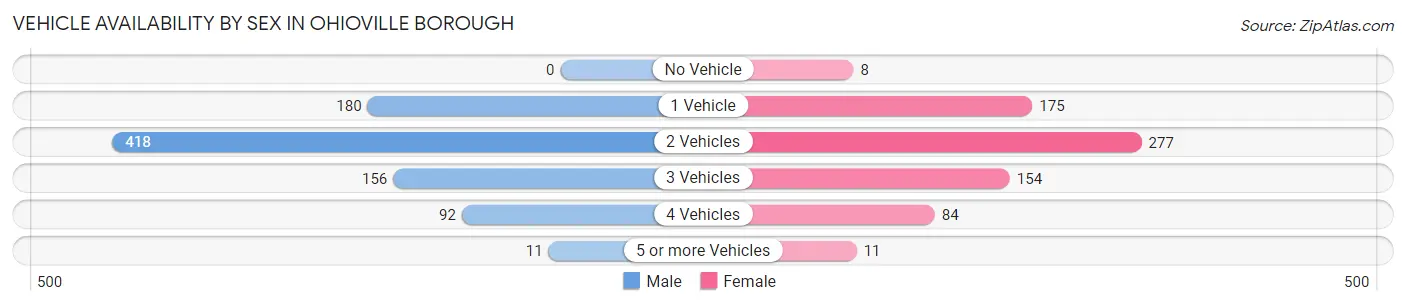
| Vehicles Available | Male | Female |
| No Vehicle | 0 (0.0%) | 8 (1.1%) |
| 1 Vehicle | 180 (21.0%) | 175 (24.7%) |
| 2 Vehicles | 418 (48.8%) | 277 (39.1%) |
| 3 Vehicles | 156 (18.2%) | 154 (21.7%) |
| 4 Vehicles | 92 (10.7%) | 84 (11.8%) |
| 5 or more Vehicles | 11 (1.3%) | 11 (1.5%) |
| Total | 857 (100.0%) | 709 (100.0%) |
Commute Time in Ohioville borough
The most frequently occuring commute durations in Ohioville borough are 30 to 34 minutes (309 commuters, 21.8%), 15 to 19 minutes (267 commuters, 18.9%), and 20 to 24 minutes (201 commuters, 14.2%).
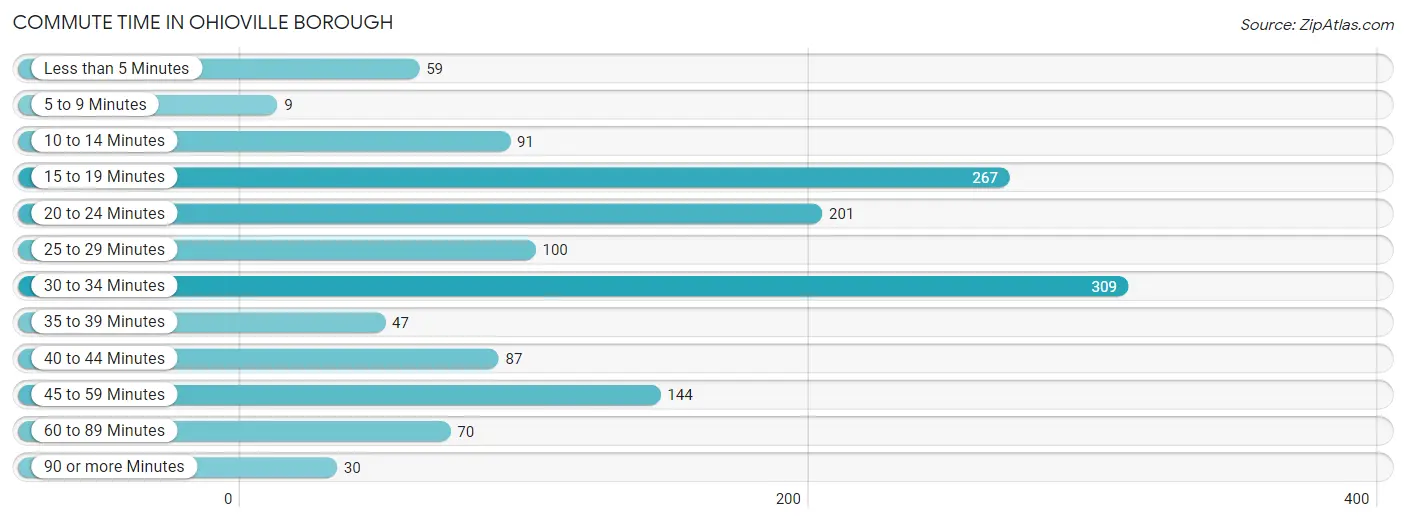
| Commute Time | # Commuters | % Commuters |
| Less than 5 Minutes | 59 | 4.2% |
| 5 to 9 Minutes | 9 | 0.6% |
| 10 to 14 Minutes | 91 | 6.4% |
| 15 to 19 Minutes | 267 | 18.9% |
| 20 to 24 Minutes | 201 | 14.2% |
| 25 to 29 Minutes | 100 | 7.1% |
| 30 to 34 Minutes | 309 | 21.8% |
| 35 to 39 Minutes | 47 | 3.3% |
| 40 to 44 Minutes | 87 | 6.1% |
| 45 to 59 Minutes | 144 | 10.2% |
| 60 to 89 Minutes | 70 | 5.0% |
| 90 or more Minutes | 30 | 2.1% |
Commute Time by Sex in Ohioville borough
The most common commute times in Ohioville borough are 30 to 34 minutes (217 commuters, 27.8%) for males and 15 to 19 minutes (223 commuters, 35.2%) for females.
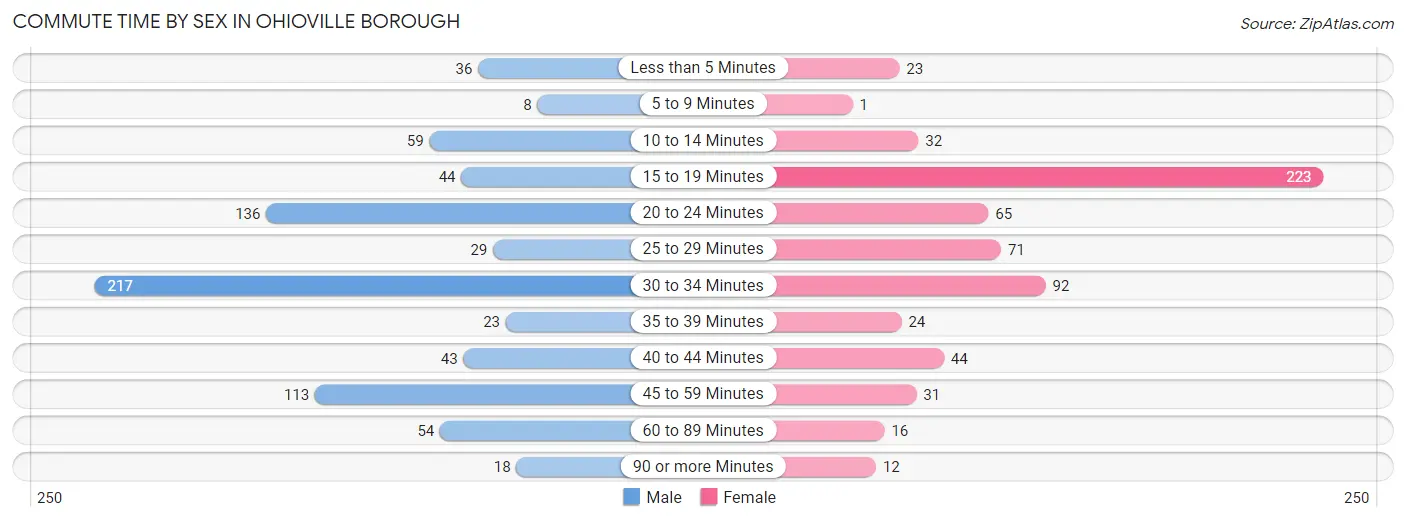
| Commute Time | Male | Female |
| Less than 5 Minutes | 36 (4.6%) | 23 (3.6%) |
| 5 to 9 Minutes | 8 (1.0%) | 1 (0.2%) |
| 10 to 14 Minutes | 59 (7.6%) | 32 (5.1%) |
| 15 to 19 Minutes | 44 (5.6%) | 223 (35.2%) |
| 20 to 24 Minutes | 136 (17.4%) | 65 (10.2%) |
| 25 to 29 Minutes | 29 (3.7%) | 71 (11.2%) |
| 30 to 34 Minutes | 217 (27.8%) | 92 (14.5%) |
| 35 to 39 Minutes | 23 (2.9%) | 24 (3.8%) |
| 40 to 44 Minutes | 43 (5.5%) | 44 (6.9%) |
| 45 to 59 Minutes | 113 (14.5%) | 31 (4.9%) |
| 60 to 89 Minutes | 54 (6.9%) | 16 (2.5%) |
| 90 or more Minutes | 18 (2.3%) | 12 (1.9%) |
Time of Departure to Work by Sex in Ohioville borough
The most frequent times of departure to work in Ohioville borough are 12:00 AM to 4:59 AM (143, 18.3%) for males and 6:00 AM to 6:29 AM (132, 20.8%) for females.
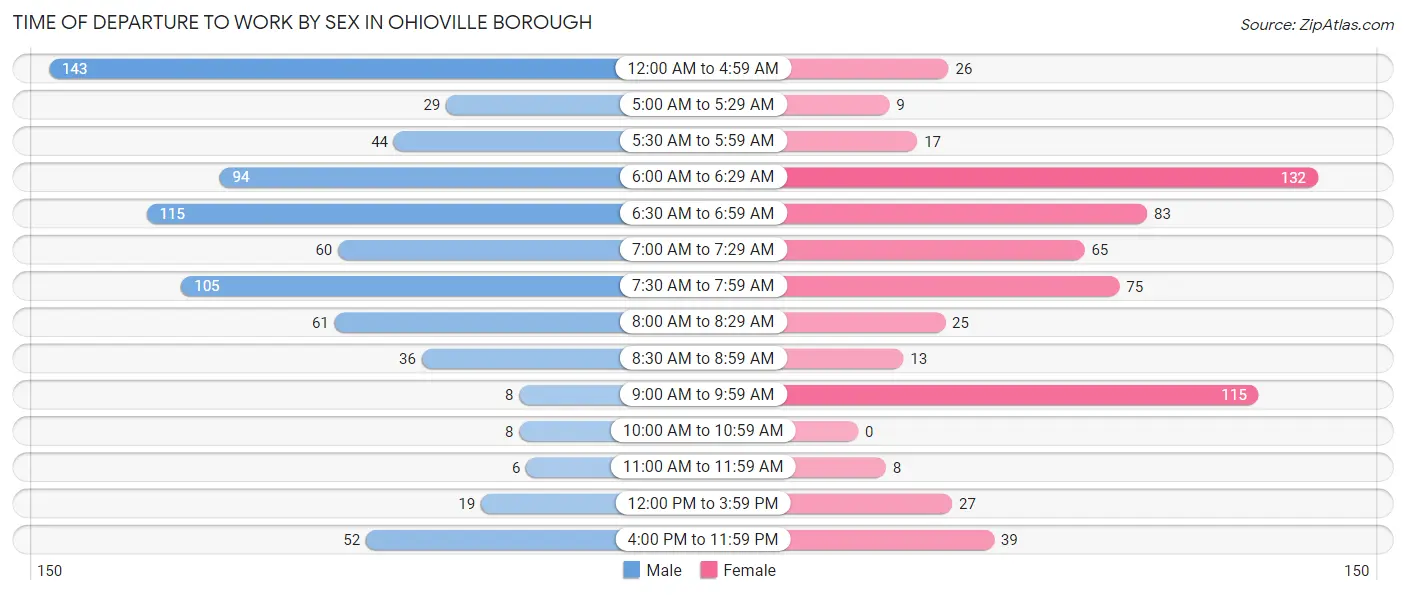
| Time of Departure | Male | Female |
| 12:00 AM to 4:59 AM | 143 (18.3%) | 26 (4.1%) |
| 5:00 AM to 5:29 AM | 29 (3.7%) | 9 (1.4%) |
| 5:30 AM to 5:59 AM | 44 (5.6%) | 17 (2.7%) |
| 6:00 AM to 6:29 AM | 94 (12.0%) | 132 (20.8%) |
| 6:30 AM to 6:59 AM | 115 (14.7%) | 83 (13.1%) |
| 7:00 AM to 7:29 AM | 60 (7.7%) | 65 (10.2%) |
| 7:30 AM to 7:59 AM | 105 (13.5%) | 75 (11.8%) |
| 8:00 AM to 8:29 AM | 61 (7.8%) | 25 (3.9%) |
| 8:30 AM to 8:59 AM | 36 (4.6%) | 13 (2.1%) |
| 9:00 AM to 9:59 AM | 8 (1.0%) | 115 (18.1%) |
| 10:00 AM to 10:59 AM | 8 (1.0%) | 0 (0.0%) |
| 11:00 AM to 11:59 AM | 6 (0.8%) | 8 (1.3%) |
| 12:00 PM to 3:59 PM | 19 (2.4%) | 27 (4.3%) |
| 4:00 PM to 11:59 PM | 52 (6.7%) | 39 (6.1%) |
| Total | 780 (100.0%) | 634 (100.0%) |
Housing Occupancy in Ohioville borough
Occupancy by Ownership in Ohioville borough
Of the total 1,272 dwellings in Ohioville borough, owner-occupied units account for 1,074 (84.4%), while renter-occupied units make up 198 (15.6%).
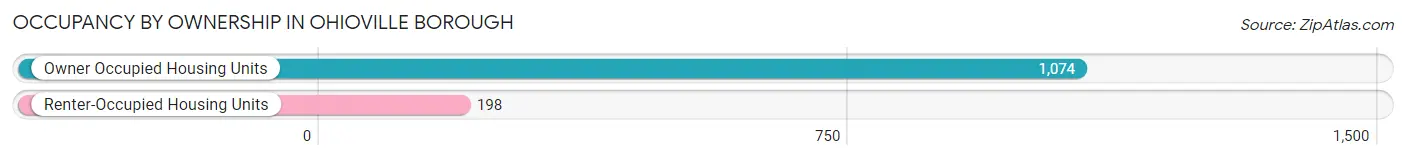
| Occupancy | # Housing Units | % Housing Units |
| Owner Occupied Housing Units | 1,074 | 84.4% |
| Renter-Occupied Housing Units | 198 | 15.6% |
| Total Occupied Housing Units | 1,272 | 100.0% |
Occupancy by Household Size in Ohioville borough
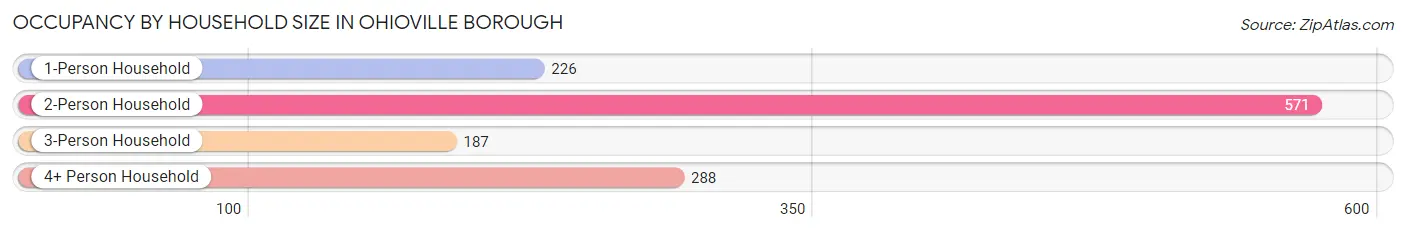
| Household Size | # Housing Units | % Housing Units |
| 1-Person Household | 226 | 17.8% |
| 2-Person Household | 571 | 44.9% |
| 3-Person Household | 187 | 14.7% |
| 4+ Person Household | 288 | 22.6% |
| Total Housing Units | 1,272 | 100.0% |
Occupancy by Ownership by Household Size in Ohioville borough
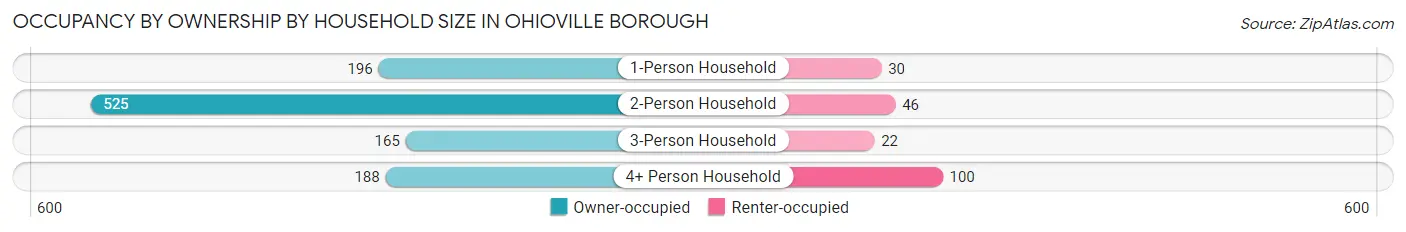
| Household Size | Owner-occupied | Renter-occupied |
| 1-Person Household | 196 (86.7%) | 30 (13.3%) |
| 2-Person Household | 525 (91.9%) | 46 (8.1%) |
| 3-Person Household | 165 (88.2%) | 22 (11.8%) |
| 4+ Person Household | 188 (65.3%) | 100 (34.7%) |
| Total Housing Units | 1,074 (84.4%) | 198 (15.6%) |
Occupancy by Educational Attainment in Ohioville borough
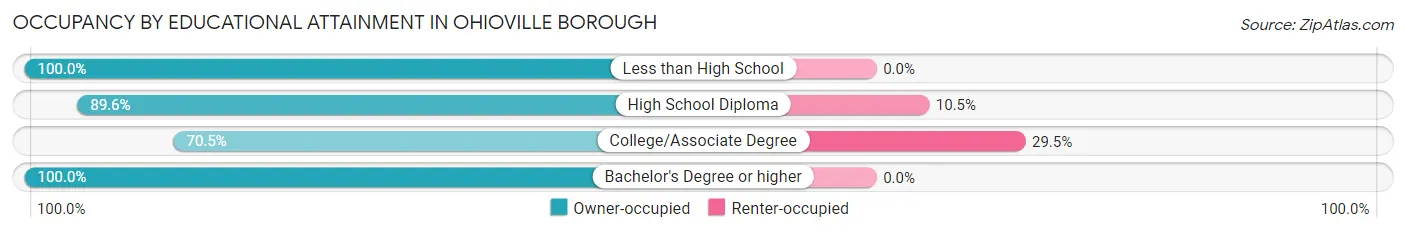
| Household Size | Owner-occupied | Renter-occupied |
| Less than High School | 37 (100.0%) | 0 (0.0%) |
| High School Diploma | 394 (89.5%) | 46 (10.4%) |
| College/Associate Degree | 363 (70.5%) | 152 (29.5%) |
| Bachelor's Degree or higher | 280 (100.0%) | 0 (0.0%) |
Occupancy by Age of Householder in Ohioville borough
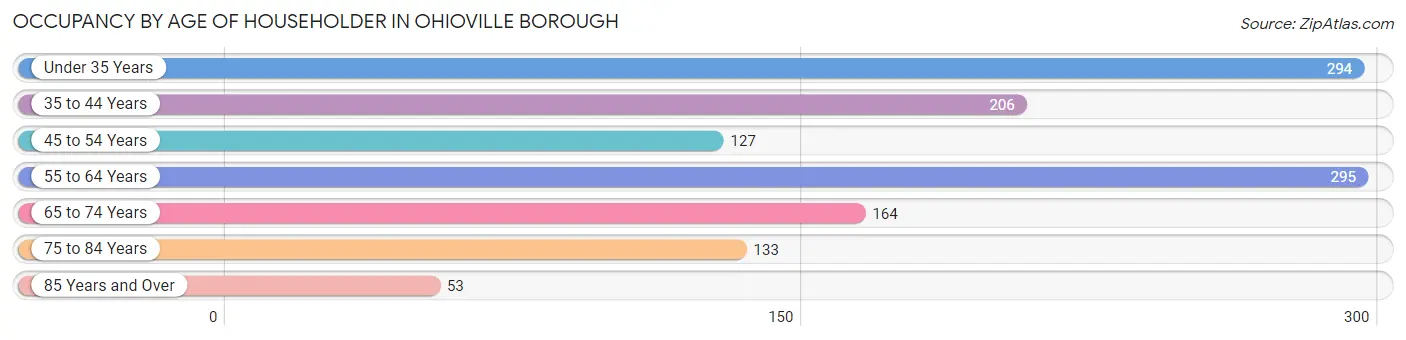
| Age Bracket | # Households | % Households |
| Under 35 Years | 294 | 23.1% |
| 35 to 44 Years | 206 | 16.2% |
| 45 to 54 Years | 127 | 10.0% |
| 55 to 64 Years | 295 | 23.2% |
| 65 to 74 Years | 164 | 12.9% |
| 75 to 84 Years | 133 | 10.5% |
| 85 Years and Over | 53 | 4.2% |
| Total | 1,272 | 100.0% |
Housing Finances in Ohioville borough
Median Income by Occupancy in Ohioville borough
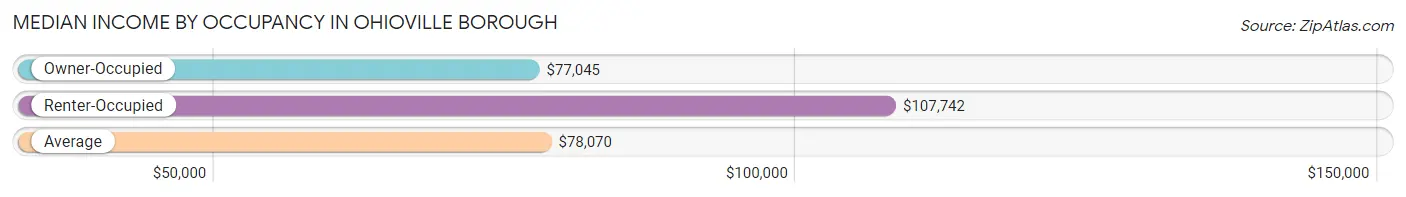
| Occupancy Type | # Households | Median Income |
| Owner-Occupied | 1,074 (84.4%) | $77,045 |
| Renter-Occupied | 198 (15.6%) | $107,742 |
| Average | 1,272 (100.0%) | $78,070 |
Occupancy by Householder Income Bracket in Ohioville borough
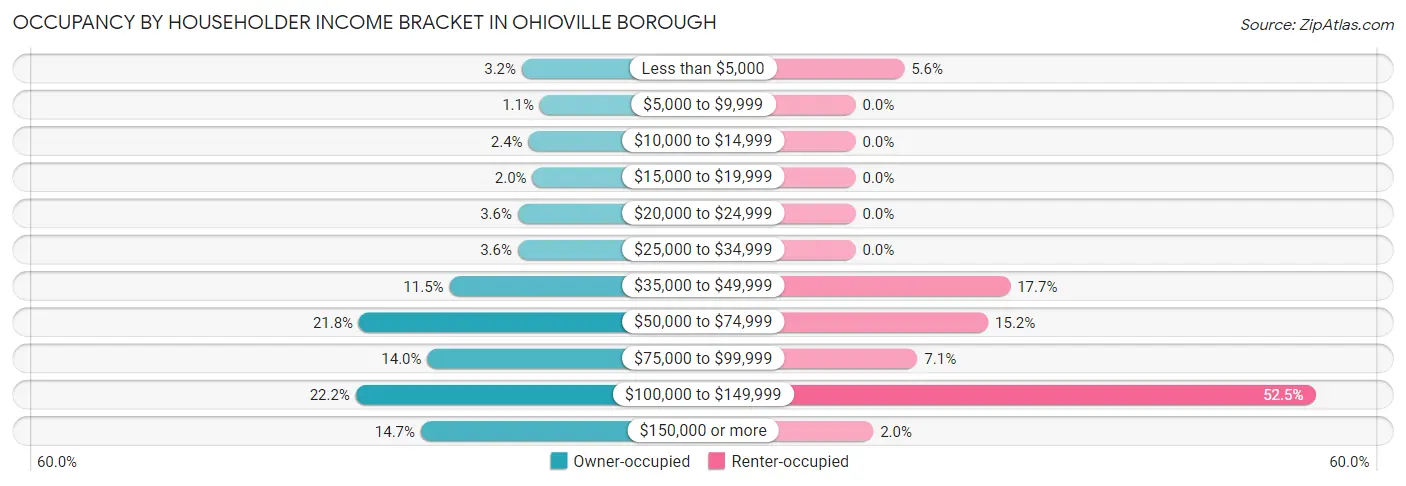
| Income Bracket | Owner-occupied | Renter-occupied |
| Less than $5,000 | 34 (3.2%) | 11 (5.6%) |
| $5,000 to $9,999 | 12 (1.1%) | 0 (0.0%) |
| $10,000 to $14,999 | 26 (2.4%) | 0 (0.0%) |
| $15,000 to $19,999 | 21 (2.0%) | 0 (0.0%) |
| $20,000 to $24,999 | 39 (3.6%) | 0 (0.0%) |
| $25,000 to $34,999 | 39 (3.6%) | 0 (0.0%) |
| $35,000 to $49,999 | 123 (11.5%) | 35 (17.7%) |
| $50,000 to $74,999 | 234 (21.8%) | 30 (15.1%) |
| $75,000 to $99,999 | 150 (14.0%) | 14 (7.1%) |
| $100,000 to $149,999 | 238 (22.2%) | 104 (52.5%) |
| $150,000 or more | 158 (14.7%) | 4 (2.0%) |
| Total | 1,074 (100.0%) | 198 (100.0%) |
Monthly Housing Cost Tiers in Ohioville borough
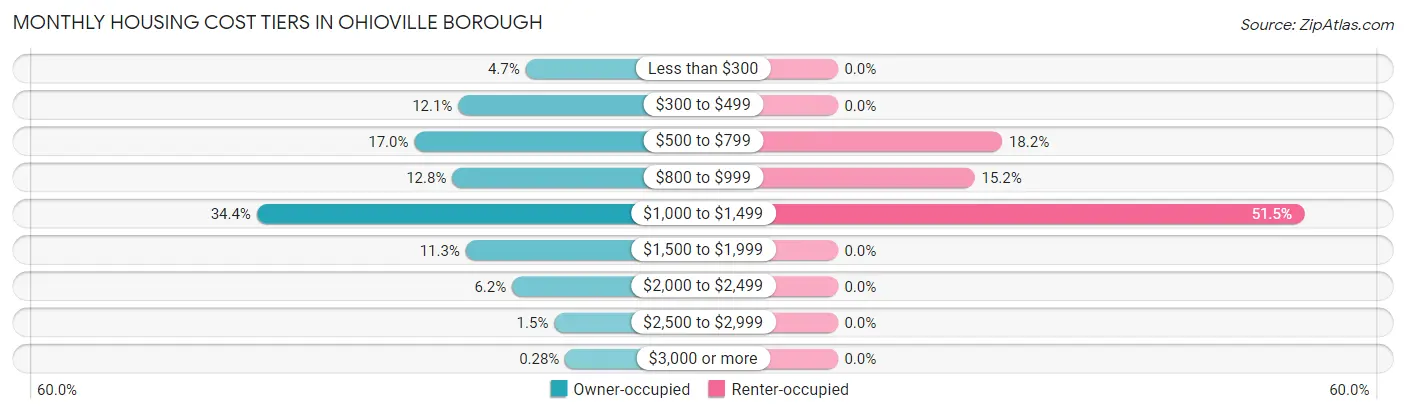
| Monthly Cost | Owner-occupied | Renter-occupied |
| Less than $300 | 50 (4.7%) | 0 (0.0%) |
| $300 to $499 | 130 (12.1%) | 0 (0.0%) |
| $500 to $799 | 182 (17.0%) | 36 (18.2%) |
| $800 to $999 | 137 (12.8%) | 30 (15.1%) |
| $1,000 to $1,499 | 369 (34.4%) | 102 (51.5%) |
| $1,500 to $1,999 | 121 (11.3%) | 0 (0.0%) |
| $2,000 to $2,499 | 66 (6.1%) | 0 (0.0%) |
| $2,500 to $2,999 | 16 (1.5%) | 0 (0.0%) |
| $3,000 or more | 3 (0.3%) | 0 (0.0%) |
| Total | 1,074 (100.0%) | 198 (100.0%) |
Physical Housing Characteristics in Ohioville borough
Housing Structures in Ohioville borough
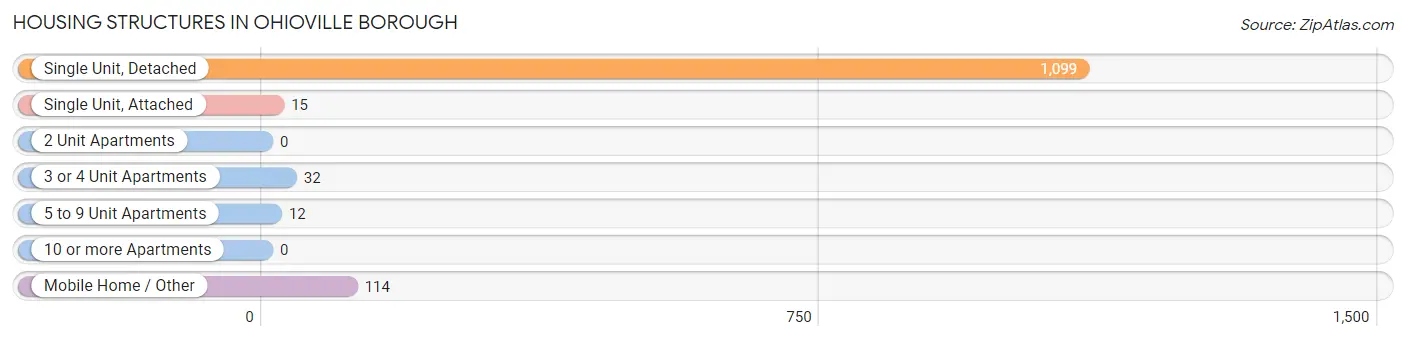
| Structure Type | # Housing Units | % Housing Units |
| Single Unit, Detached | 1,099 | 86.4% |
| Single Unit, Attached | 15 | 1.2% |
| 2 Unit Apartments | 0 | 0.0% |
| 3 or 4 Unit Apartments | 32 | 2.5% |
| 5 to 9 Unit Apartments | 12 | 0.9% |
| 10 or more Apartments | 0 | 0.0% |
| Mobile Home / Other | 114 | 9.0% |
| Total | 1,272 | 100.0% |
Housing Structures by Occupancy in Ohioville borough
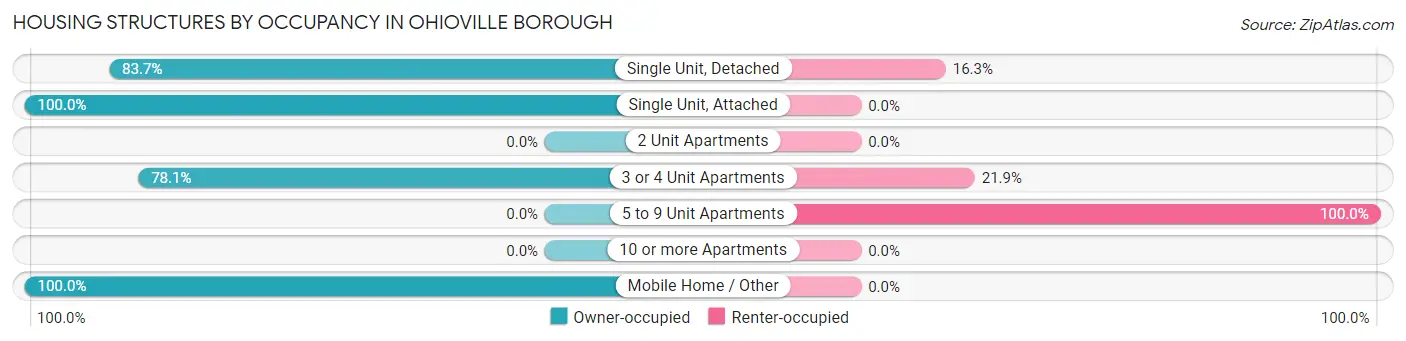
| Structure Type | Owner-occupied | Renter-occupied |
| Single Unit, Detached | 920 (83.7%) | 179 (16.3%) |
| Single Unit, Attached | 15 (100.0%) | 0 (0.0%) |
| 2 Unit Apartments | 0 (0.0%) | 0 (0.0%) |
| 3 or 4 Unit Apartments | 25 (78.1%) | 7 (21.9%) |
| 5 to 9 Unit Apartments | 0 (0.0%) | 12 (100.0%) |
| 10 or more Apartments | 0 (0.0%) | 0 (0.0%) |
| Mobile Home / Other | 114 (100.0%) | 0 (0.0%) |
| Total | 1,074 (84.4%) | 198 (15.6%) |
Housing Structures by Number of Rooms in Ohioville borough
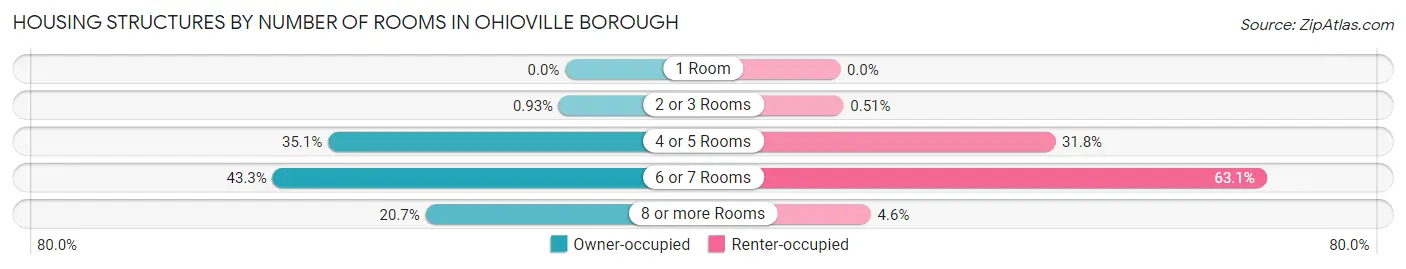
| Number of Rooms | Owner-occupied | Renter-occupied |
| 1 Room | 0 (0.0%) | 0 (0.0%) |
| 2 or 3 Rooms | 10 (0.9%) | 1 (0.5%) |
| 4 or 5 Rooms | 377 (35.1%) | 63 (31.8%) |
| 6 or 7 Rooms | 465 (43.3%) | 125 (63.1%) |
| 8 or more Rooms | 222 (20.7%) | 9 (4.5%) |
| Total | 1,074 (100.0%) | 198 (100.0%) |
Housing Structure by Heating Type in Ohioville borough
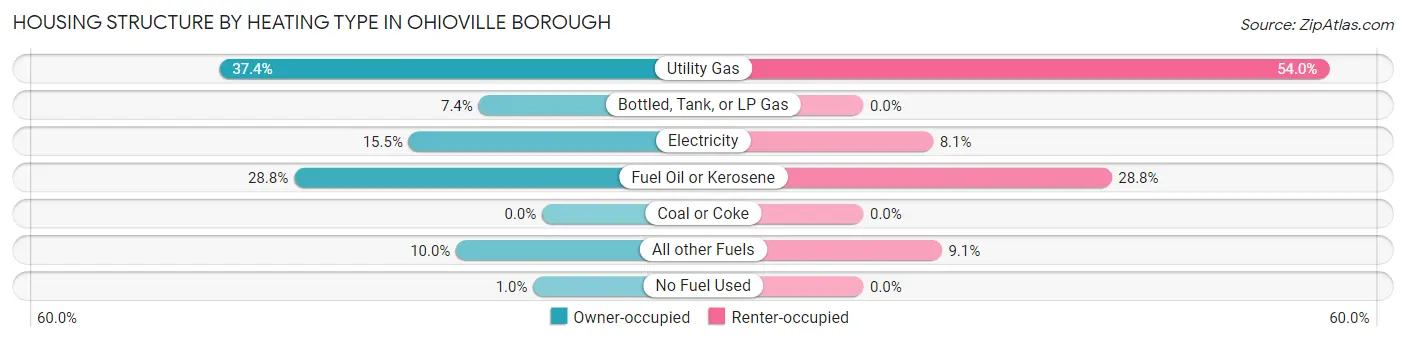
| Heating Type | Owner-occupied | Renter-occupied |
| Utility Gas | 402 (37.4%) | 107 (54.0%) |
| Bottled, Tank, or LP Gas | 79 (7.4%) | 0 (0.0%) |
| Electricity | 166 (15.5%) | 16 (8.1%) |
| Fuel Oil or Kerosene | 309 (28.8%) | 57 (28.8%) |
| Coal or Coke | 0 (0.0%) | 0 (0.0%) |
| All other Fuels | 107 (10.0%) | 18 (9.1%) |
| No Fuel Used | 11 (1.0%) | 0 (0.0%) |
| Total | 1,074 (100.0%) | 198 (100.0%) |
Household Vehicle Usage in Ohioville borough
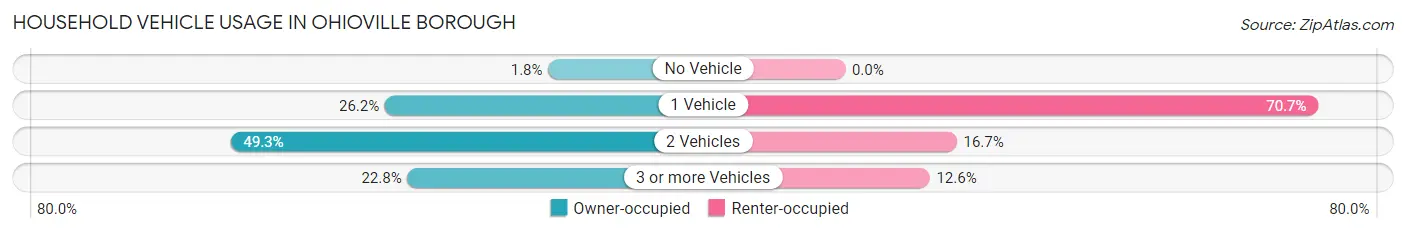
| Vehicles per Household | Owner-occupied | Renter-occupied |
| No Vehicle | 19 (1.8%) | 0 (0.0%) |
| 1 Vehicle | 281 (26.2%) | 140 (70.7%) |
| 2 Vehicles | 529 (49.3%) | 33 (16.7%) |
| 3 or more Vehicles | 245 (22.8%) | 25 (12.6%) |
| Total | 1,074 (100.0%) | 198 (100.0%) |
Real Estate & Mortgages in Ohioville borough
Real Estate and Mortgage Overview in Ohioville borough
| Characteristic | Without Mortgage | With Mortgage |
| Housing Units | 416 | 658 |
| Median Property Value | $158,300 | $178,200 |
| Median Household Income | $62,750 | $124 |
| Monthly Housing Costs | $550 | $3 |
| Real Estate Taxes | $1,574 | $30 |
Property Value by Mortgage Status in Ohioville borough
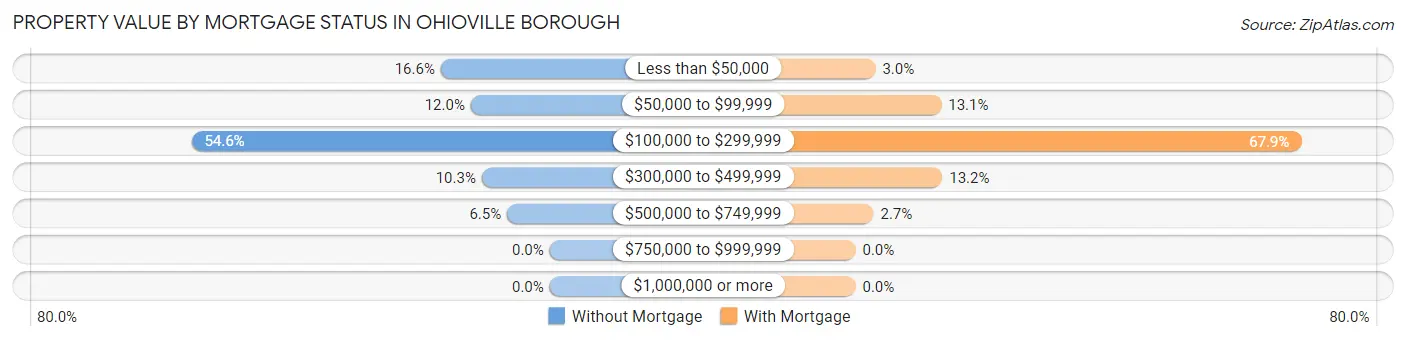
| Property Value | Without Mortgage | With Mortgage |
| Less than $50,000 | 69 (16.6%) | 20 (3.0%) |
| $50,000 to $99,999 | 50 (12.0%) | 86 (13.1%) |
| $100,000 to $299,999 | 227 (54.6%) | 447 (67.9%) |
| $300,000 to $499,999 | 43 (10.3%) | 87 (13.2%) |
| $500,000 to $749,999 | 27 (6.5%) | 18 (2.7%) |
| $750,000 to $999,999 | 0 (0.0%) | 0 (0.0%) |
| $1,000,000 or more | 0 (0.0%) | 0 (0.0%) |
| Total | 416 (100.0%) | 658 (100.0%) |
Household Income by Mortgage Status in Ohioville borough
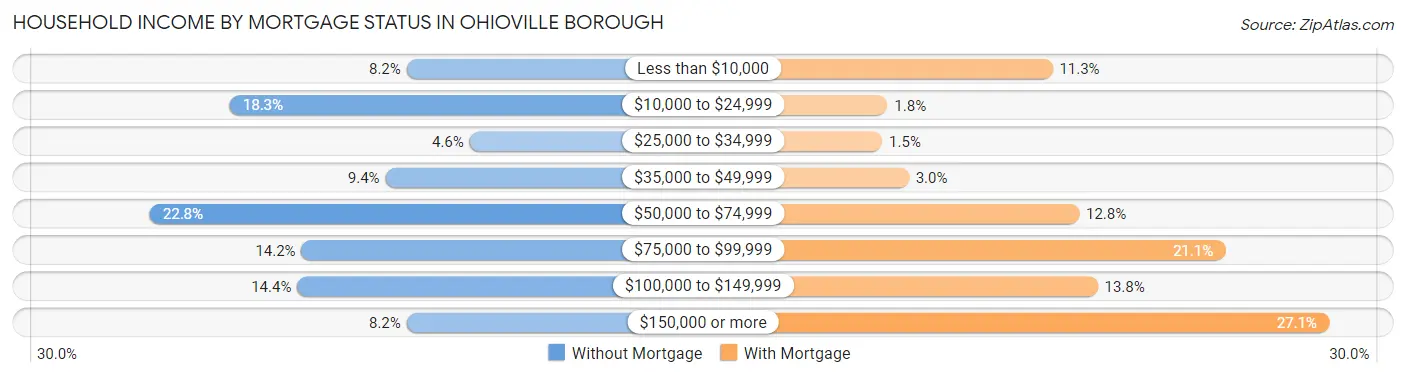
| Household Income | Without Mortgage | With Mortgage |
| Less than $10,000 | 34 (8.2%) | 74 (11.3%) |
| $10,000 to $24,999 | 76 (18.3%) | 12 (1.8%) |
| $25,000 to $34,999 | 19 (4.6%) | 10 (1.5%) |
| $35,000 to $49,999 | 39 (9.4%) | 20 (3.0%) |
| $50,000 to $74,999 | 95 (22.8%) | 84 (12.8%) |
| $75,000 to $99,999 | 59 (14.2%) | 139 (21.1%) |
| $100,000 to $149,999 | 60 (14.4%) | 91 (13.8%) |
| $150,000 or more | 34 (8.2%) | 178 (27.1%) |
| Total | 416 (100.0%) | 658 (100.0%) |
Property Value to Household Income Ratio in Ohioville borough
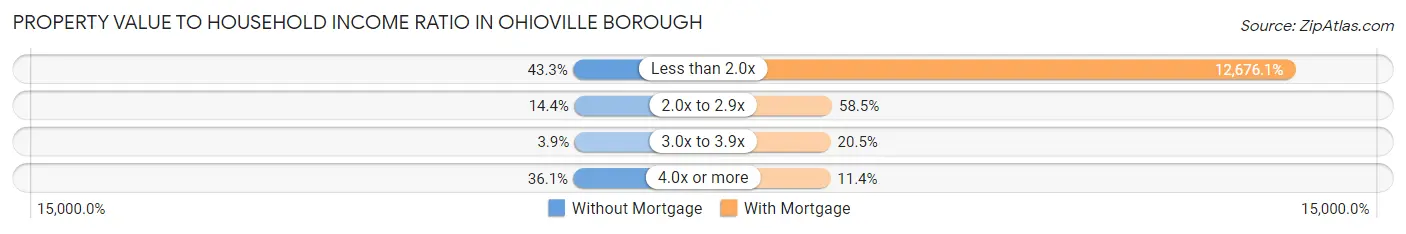
| Value-to-Income Ratio | Without Mortgage | With Mortgage |
| Less than 2.0x | 180 (43.3%) | 83,409 (12,676.1%) |
| 2.0x to 2.9x | 60 (14.4%) | 385 (58.5%) |
| 3.0x to 3.9x | 16 (3.8%) | 135 (20.5%) |
| 4.0x or more | 150 (36.1%) | 75 (11.4%) |
| Total | 416 (100.0%) | 658 (100.0%) |
Real Estate Taxes by Mortgage Status in Ohioville borough
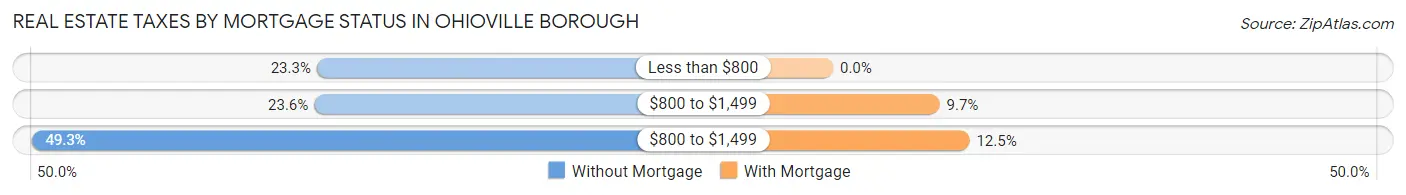
| Property Taxes | Without Mortgage | With Mortgage |
| Less than $800 | 97 (23.3%) | 0 (0.0%) |
| $800 to $1,499 | 98 (23.6%) | 64 (9.7%) |
| $800 to $1,499 | 205 (49.3%) | 82 (12.5%) |
| Total | 416 (100.0%) | 658 (100.0%) |
Health & Disability in Ohioville borough
Health Insurance Coverage by Age in Ohioville borough
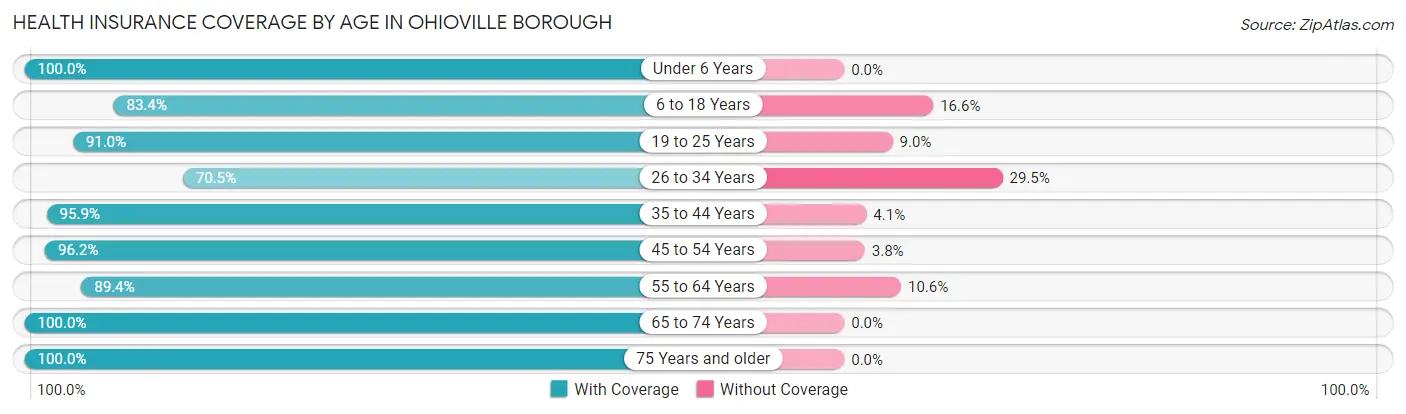
| Age Bracket | With Coverage | Without Coverage |
| Under 6 Years | 254 (100.0%) | 0 (0.0%) |
| 6 to 18 Years | 528 (83.4%) | 105 (16.6%) |
| 19 to 25 Years | 212 (91.0%) | 21 (9.0%) |
| 26 to 34 Years | 258 (70.5%) | 108 (29.5%) |
| 35 to 44 Years | 466 (95.9%) | 20 (4.1%) |
| 45 to 54 Years | 226 (96.2%) | 9 (3.8%) |
| 55 to 64 Years | 481 (89.4%) | 57 (10.6%) |
| 65 to 74 Years | 235 (100.0%) | 0 (0.0%) |
| 75 Years and older | 364 (100.0%) | 0 (0.0%) |
| Total | 3,024 (90.4%) | 320 (9.6%) |
Health Insurance Coverage by Citizenship Status in Ohioville borough
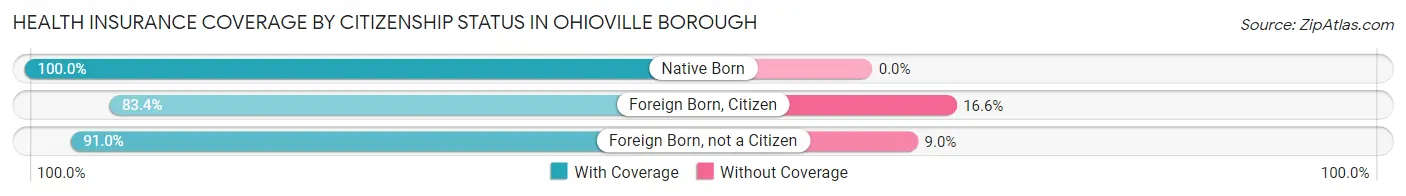
| Citizenship Status | With Coverage | Without Coverage |
| Native Born | 254 (100.0%) | 0 (0.0%) |
| Foreign Born, Citizen | 528 (83.4%) | 105 (16.6%) |
| Foreign Born, not a Citizen | 212 (91.0%) | 21 (9.0%) |
Health Insurance Coverage by Household Income in Ohioville borough
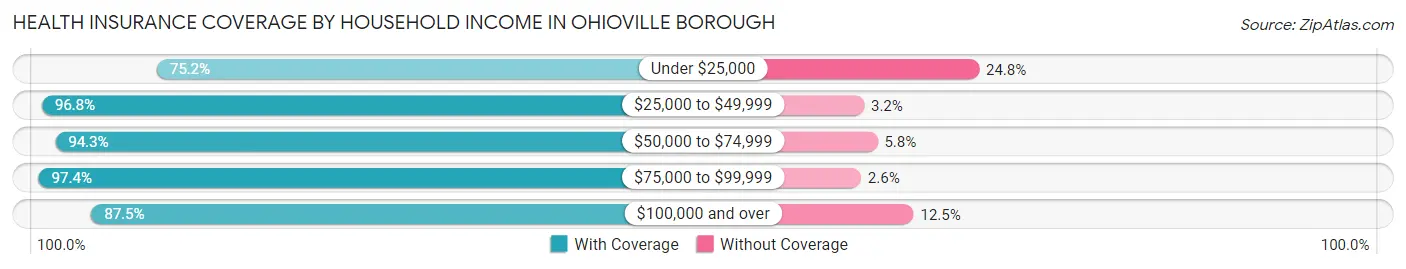
| Household Income | With Coverage | Without Coverage |
| Under $25,000 | 161 (75.2%) | 53 (24.8%) |
| $25,000 to $49,999 | 479 (96.8%) | 16 (3.2%) |
| $50,000 to $74,999 | 525 (94.3%) | 32 (5.8%) |
| $75,000 to $99,999 | 406 (97.4%) | 11 (2.6%) |
| $100,000 and over | 1,449 (87.5%) | 207 (12.5%) |
Public vs Private Health Insurance Coverage by Age in Ohioville borough
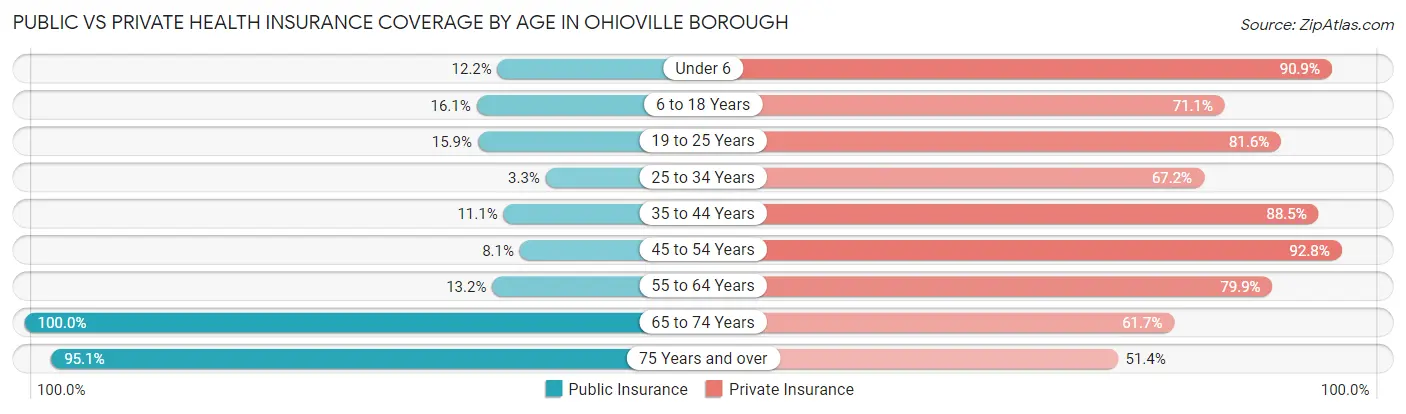
| Age Bracket | Public Insurance | Private Insurance |
| Under 6 | 31 (12.2%) | 231 (90.9%) |
| 6 to 18 Years | 102 (16.1%) | 450 (71.1%) |
| 19 to 25 Years | 37 (15.9%) | 190 (81.6%) |
| 25 to 34 Years | 12 (3.3%) | 246 (67.2%) |
| 35 to 44 Years | 54 (11.1%) | 430 (88.5%) |
| 45 to 54 Years | 19 (8.1%) | 218 (92.8%) |
| 55 to 64 Years | 71 (13.2%) | 430 (79.9%) |
| 65 to 74 Years | 235 (100.0%) | 145 (61.7%) |
| 75 Years and over | 346 (95.1%) | 187 (51.4%) |
| Total | 907 (27.1%) | 2,527 (75.6%) |
Disability Status by Sex by Age in Ohioville borough
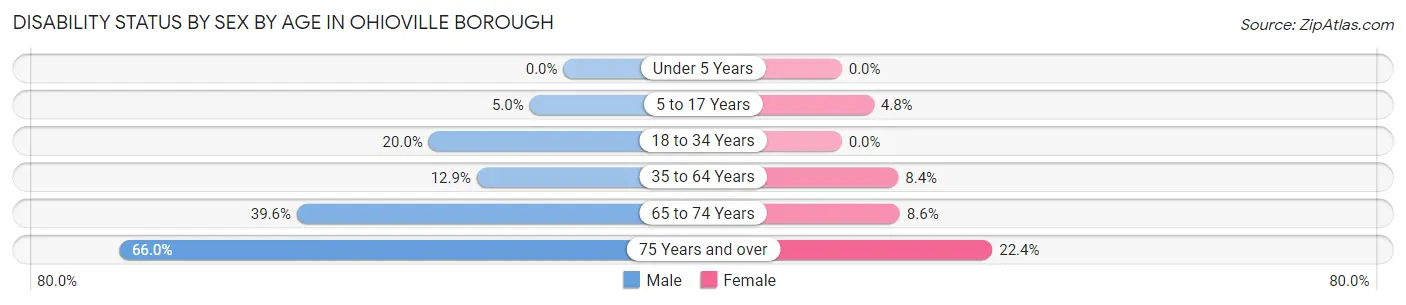
| Age Bracket | Male | Female |
| Under 5 Years | 0 (0.0%) | 0 (0.0%) |
| 5 to 17 Years | 22 (5.0%) | 9 (4.8%) |
| 18 to 34 Years | 58 (20.0%) | 0 (0.0%) |
| 35 to 64 Years | 87 (12.9%) | 49 (8.4%) |
| 65 to 74 Years | 38 (39.6%) | 12 (8.6%) |
| 75 Years and over | 128 (66.0%) | 38 (22.4%) |
Disability Class by Sex by Age in Ohioville borough
Disability Class: Hearing Difficulty
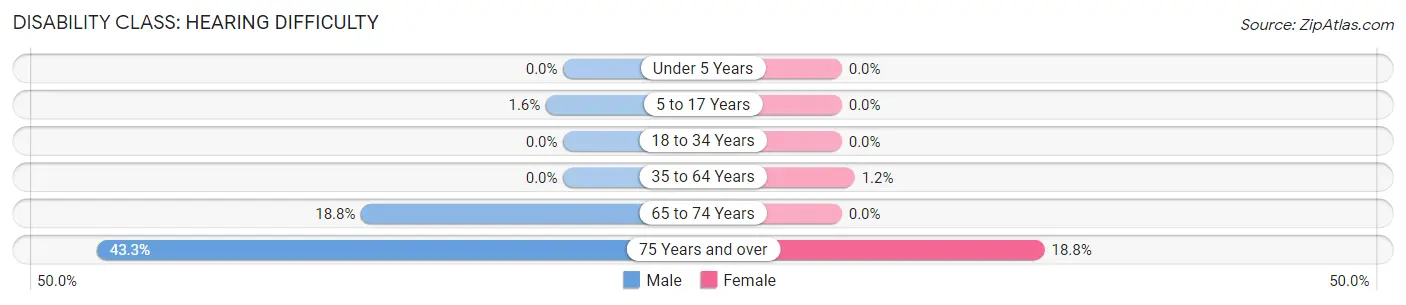
| Age Bracket | Male | Female |
| Under 5 Years | 0 (0.0%) | 0 (0.0%) |
| 5 to 17 Years | 7 (1.6%) | 0 (0.0%) |
| 18 to 34 Years | 0 (0.0%) | 0 (0.0%) |
| 35 to 64 Years | 0 (0.0%) | 7 (1.2%) |
| 65 to 74 Years | 18 (18.8%) | 0 (0.0%) |
| 75 Years and over | 84 (43.3%) | 32 (18.8%) |
Disability Class: Vision Difficulty
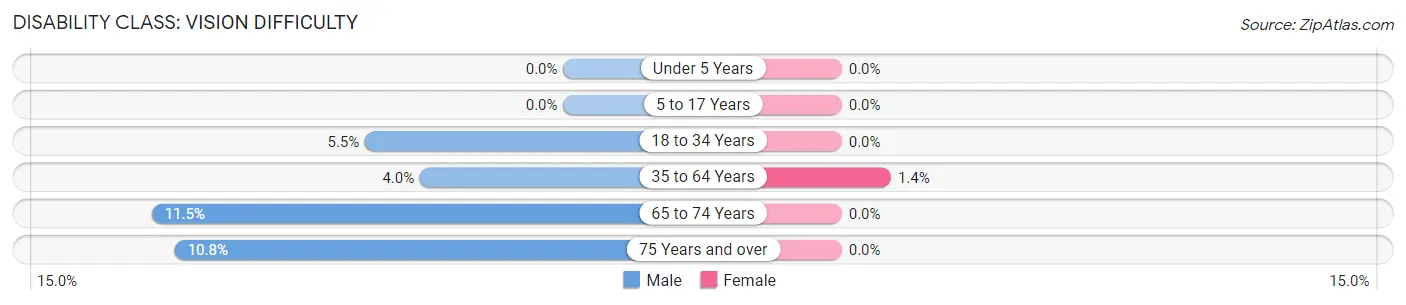
| Age Bracket | Male | Female |
| Under 5 Years | 0 (0.0%) | 0 (0.0%) |
| 5 to 17 Years | 0 (0.0%) | 0 (0.0%) |
| 18 to 34 Years | 16 (5.5%) | 0 (0.0%) |
| 35 to 64 Years | 27 (4.0%) | 8 (1.4%) |
| 65 to 74 Years | 11 (11.5%) | 0 (0.0%) |
| 75 Years and over | 21 (10.8%) | 0 (0.0%) |
Disability Class: Cognitive Difficulty
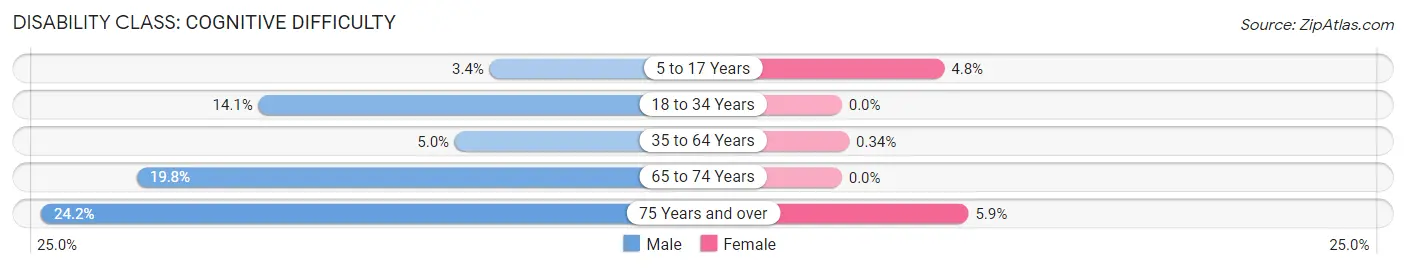
| Age Bracket | Male | Female |
| 5 to 17 Years | 15 (3.4%) | 9 (4.8%) |
| 18 to 34 Years | 41 (14.1%) | 0 (0.0%) |
| 35 to 64 Years | 34 (5.0%) | 2 (0.3%) |
| 65 to 74 Years | 19 (19.8%) | 0 (0.0%) |
| 75 Years and over | 47 (24.2%) | 10 (5.9%) |
Disability Class: Ambulatory Difficulty
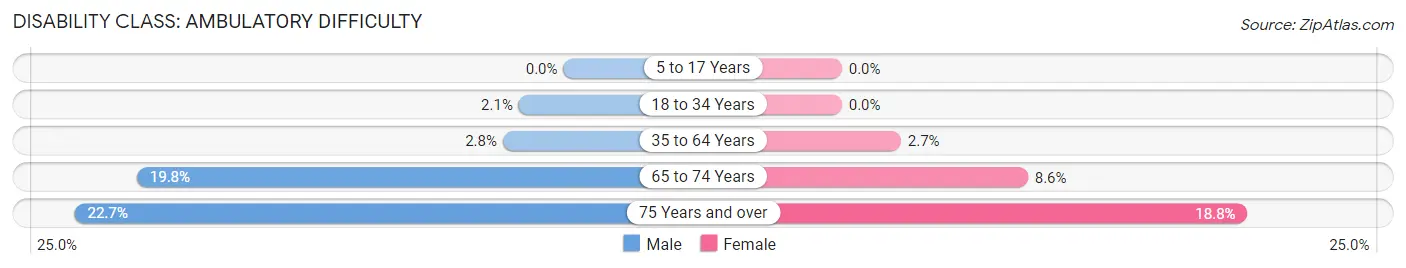
| Age Bracket | Male | Female |
| 5 to 17 Years | 0 (0.0%) | 0 (0.0%) |
| 18 to 34 Years | 6 (2.1%) | 0 (0.0%) |
| 35 to 64 Years | 19 (2.8%) | 16 (2.7%) |
| 65 to 74 Years | 19 (19.8%) | 12 (8.6%) |
| 75 Years and over | 44 (22.7%) | 32 (18.8%) |
Disability Class: Self-Care Difficulty
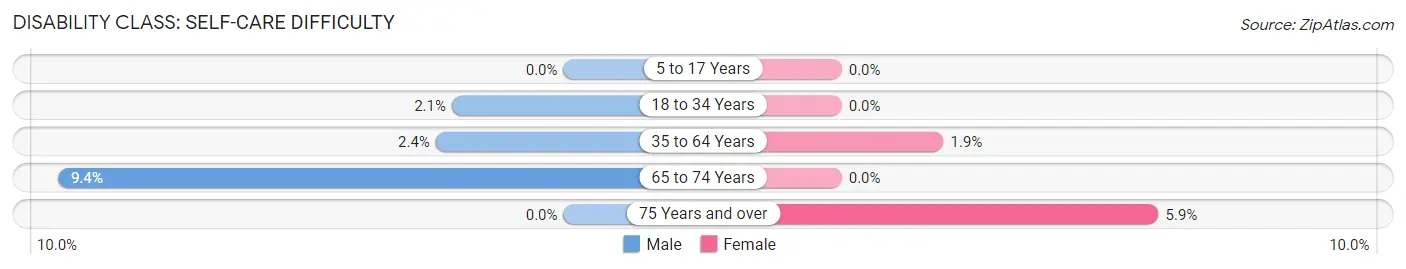
| Age Bracket | Male | Female |
| 5 to 17 Years | 0 (0.0%) | 0 (0.0%) |
| 18 to 34 Years | 6 (2.1%) | 0 (0.0%) |
| 35 to 64 Years | 16 (2.4%) | 11 (1.9%) |
| 65 to 74 Years | 9 (9.4%) | 0 (0.0%) |
| 75 Years and over | 0 (0.0%) | 10 (5.9%) |
Technology Access in Ohioville borough
Computing Device Access in Ohioville borough
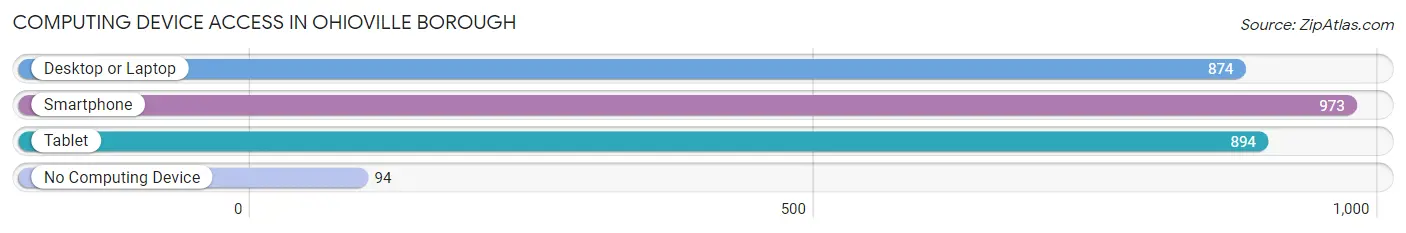
| Device Type | # Households | % Households |
| Desktop or Laptop | 874 | 68.7% |
| Smartphone | 973 | 76.5% |
| Tablet | 894 | 70.3% |
| No Computing Device | 94 | 7.4% |
| Total | 1,272 | 100.0% |
Internet Access in Ohioville borough
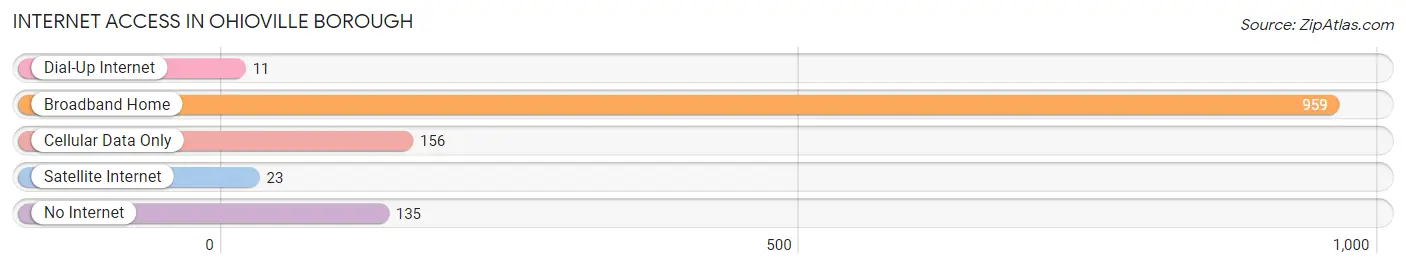
| Internet Type | # Households | % Households |
| Dial-Up Internet | 11 | 0.9% |
| Broadband Home | 959 | 75.4% |
| Cellular Data Only | 156 | 12.3% |
| Satellite Internet | 23 | 1.8% |
| No Internet | 135 | 10.6% |
| Total | 1,272 | 100.0% |
Ohioville borough Summary
Ohioville Borough is a small borough located in Beaver County, Pennsylvania. It is situated in the southwestern corner of the county, just north of the Ohio River. The borough is bordered by the townships of Brighton, Hanover, and Raccoon. As of the 2010 census, the population of Ohioville was 1,845.
History
Ohioville was founded in 1817 by a group of settlers from Ohio. The town was originally known as “Ohio Town”, but the name was changed to Ohioville in 1820. The town was incorporated as a borough in 1836.
The town was originally a farming community, but it soon developed into a small industrial center. The first industry in the town was a sawmill, which was built in 1820. This was followed by a gristmill in 1825, a tannery in 1827, and a distillery in 1829.
The town was also home to a number of other businesses, including a blacksmith shop, a general store, a hotel, and a post office. The town also had a school, which was built in 1837.
Geography
Ohioville is located at 40°37'N 80°20'W (40.6167, -80.3333). It is situated in the southwestern corner of Beaver County, just north of the Ohio River. The borough is bordered by the townships of Brighton, Hanover, and Raccoon.
The borough has a total area of 1.2 square miles, all of which is land. The terrain is mostly flat, with some rolling hills. The borough is located in the Appalachian Plateau region of Pennsylvania.
Economy
The economy of Ohioville is largely based on agriculture and manufacturing. The town is home to a number of small businesses, including a sawmill, a gristmill, a tannery, and a distillery.
The town is also home to a number of small retail stores, including a general store, a hardware store, and a grocery store. The town also has a post office and a bank.
Demographics
As of the 2010 census, the population of Ohioville was 1,845. The racial makeup of the borough was 97.3% White, 0.9% African American, 0.2% Native American, 0.2% Asian, 0.1% from other races, and 1.3% from two or more races. Hispanic or Latino of any race were 0.7% of the population.
The median income for a household in the borough was $41,250, and the median income for a family was $45,000. The per capita income for the borough was $18,945. About 8.3% of families and 10.2% of the population were below the poverty line, including 14.2% of those under age 18 and 6.2% of those age 65 or over.
Common Questions
What is Per Capita Income in Ohioville borough?
Per Capita income in Ohioville borough is $35,258.
What is the Median Family Income in Ohioville borough?
Median Family Income in Ohioville borough is $72,431.
What is the Median Household income in Ohioville borough?
Median Household Income in Ohioville borough is $78,070.
What is Income or Wage Gap in Ohioville borough?
Income or Wage Gap in Ohioville borough is 32.8%.
Women in Ohioville borough earn 67.2 cents for every dollar earned by a man.
What is Inequality or Gini Index in Ohioville borough?
Inequality or Gini Index in Ohioville borough is 0.37.
What is the Total Population of Ohioville borough?
Total Population of Ohioville borough is 3,344.
What is the Total Male Population of Ohioville borough?
Total Male Population of Ohioville borough is 1,757.
What is the Total Female Population of Ohioville borough?
Total Female Population of Ohioville borough is 1,587.
What is the Ratio of Males per 100 Females in Ohioville borough?
There are 110.71 Males per 100 Females in Ohioville borough.
What is the Ratio of Females per 100 Males in Ohioville borough?
There are 90.32 Females per 100 Males in Ohioville borough.
What is the Median Population Age in Ohioville borough?
Median Population Age in Ohioville borough is 39.8 Years.
What is the Average Family Size in Ohioville borough
Average Family Size in Ohioville borough is 2.9 People.
What is the Average Household Size in Ohioville borough
Average Household Size in Ohioville borough is 2.6 People.
How Large is the Labor Force in Ohioville borough?
There are 1,611 People in the Labor Forcein in Ohioville borough.
What is the Percentage of People in the Labor Force in Ohioville borough?
62.3% of People are in the Labor Force in Ohioville borough.
What is the Unemployment Rate in Ohioville borough?
Unemployment Rate in Ohioville borough is 1.7%.