Bonneauville borough, PA Map & Demographics
Bonneauville borough Overview
$35,205
PER CAPITA INCOME
$86,631
AVG FAMILY INCOME
$65,417
AVG HOUSEHOLD INCOME
29.7%
WAGE / INCOME GAP [ % ]
70.3¢/ $1
WAGE / INCOME GAP [ $ ]
0.43
INEQUALITY / GINI INDEX
1,857
TOTAL POPULATION
919
MALE POPULATION
938
FEMALE POPULATION
97.97
MALES / 100 FEMALES
102.07
FEMALES / 100 MALES
40.5
MEDIAN AGE
2.9
AVG FAMILY SIZE
2.5
AVG HOUSEHOLD SIZE
1,011
LABOR FORCE [ PEOPLE ]
69.6%
PERCENT IN LABOR FORCE
1.7%
UNEMPLOYMENT RATE
Income in Bonneauville borough
Income Overview in Bonneauville borough
Per Capita Income in Bonneauville borough is $35,205, while median incomes of families and households are $86,631 and $65,417 respectively.
| Characteristic | Number | Measure |
| Per Capita Income | 1,857 | $35,205 |
| Median Family Income | 509 | $86,631 |
| Mean Family Income | 509 | $98,399 |
| Median Household Income | 739 | $65,417 |
| Mean Household Income | 739 | $85,926 |
| Income Deficit | 509 | $0 |
| Wage / Income Gap (%) | 1,857 | 29.70% |
| Wage / Income Gap ($) | 1,857 | 70.30¢ per $1 |
| Gini / Inequality Index | 1,857 | 0.43 |
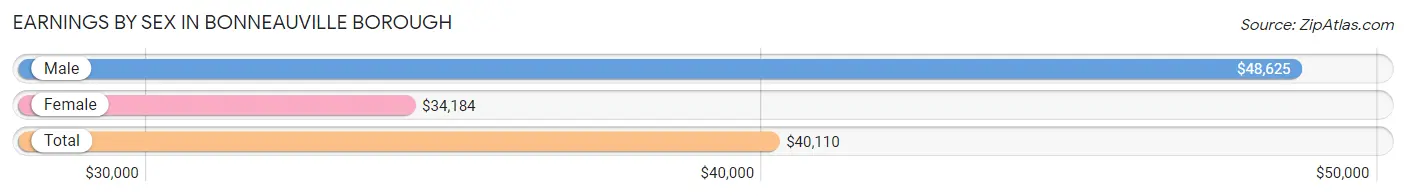
Earnings by Sex in Bonneauville borough
Average Earnings in Bonneauville borough are $40,110, $48,625 for men and $34,184 for women, a difference of 29.7%.
| Sex | Number | Average Earnings |
| Male | 547 (52.4%) | $48,625 |
| Female | 496 (47.6%) | $34,184 |
| Total | 1,043 (100.0%) | $40,110 |
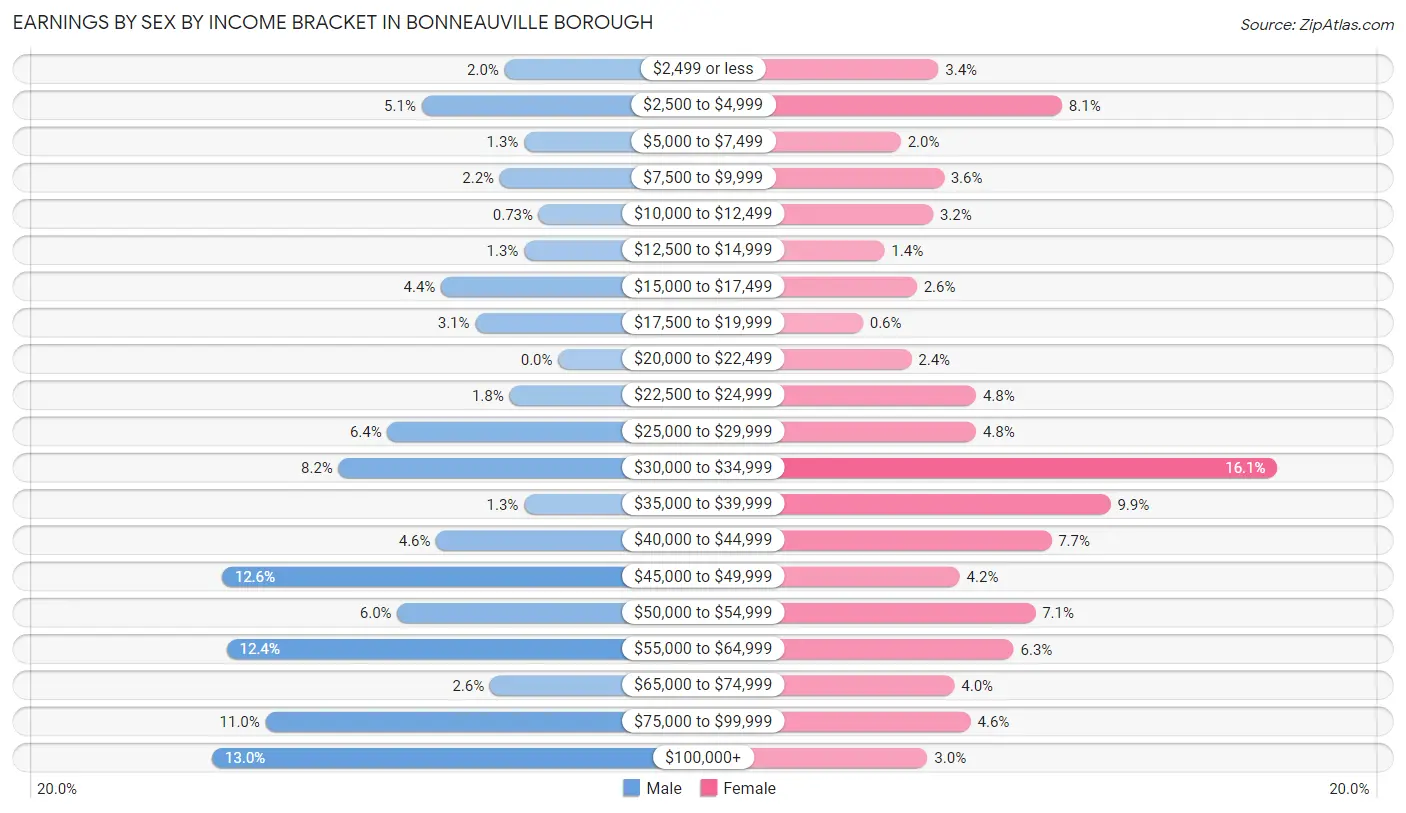
Earnings by Sex by Income Bracket in Bonneauville borough
The most common earnings brackets in Bonneauville borough are $100,000+ for men (71 | 13.0%) and $30,000 to $34,999 for women (80 | 16.1%).
| Income | Male | Female |
| $2,499 or less | 11 (2.0%) | 17 (3.4%) |
| $2,500 to $4,999 | 28 (5.1%) | 40 (8.1%) |
| $5,000 to $7,499 | 7 (1.3%) | 10 (2.0%) |
| $7,500 to $9,999 | 12 (2.2%) | 18 (3.6%) |
| $10,000 to $12,499 | 4 (0.7%) | 16 (3.2%) |
| $12,500 to $14,999 | 7 (1.3%) | 7 (1.4%) |
| $15,000 to $17,499 | 24 (4.4%) | 13 (2.6%) |
| $17,500 to $19,999 | 17 (3.1%) | 3 (0.6%) |
| $20,000 to $22,499 | 0 (0.0%) | 12 (2.4%) |
| $22,500 to $24,999 | 10 (1.8%) | 24 (4.8%) |
| $25,000 to $29,999 | 35 (6.4%) | 24 (4.8%) |
| $30,000 to $34,999 | 45 (8.2%) | 80 (16.1%) |
| $35,000 to $39,999 | 7 (1.3%) | 49 (9.9%) |
| $40,000 to $44,999 | 25 (4.6%) | 38 (7.7%) |
| $45,000 to $49,999 | 69 (12.6%) | 21 (4.2%) |
| $50,000 to $54,999 | 33 (6.0%) | 35 (7.1%) |
| $55,000 to $64,999 | 68 (12.4%) | 31 (6.2%) |
| $65,000 to $74,999 | 14 (2.6%) | 20 (4.0%) |
| $75,000 to $99,999 | 60 (11.0%) | 23 (4.6%) |
| $100,000+ | 71 (13.0%) | 15 (3.0%) |
| Total | 547 (100.0%) | 496 (100.0%) |
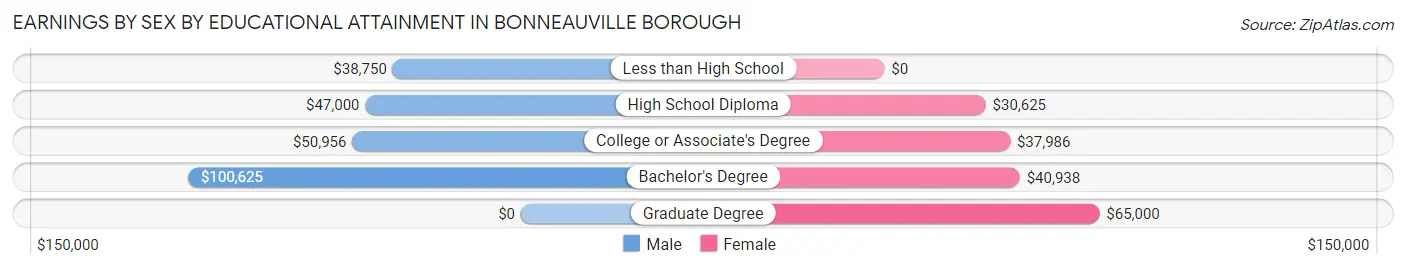
Earnings by Sex by Educational Attainment in Bonneauville borough
Average earnings in Bonneauville borough are $50,885 for men and $37,791 for women, a difference of 25.7%. Men with an educational attainment of bachelor's degree enjoy the highest average annual earnings of $100,625, while those with less than high school education earn the least with $38,750. Women with an educational attainment of graduate degree earn the most with the average annual earnings of $65,000, while those with high school diploma education have the smallest earnings of $30,625.
| Educational Attainment | Male Income | Female Income |
| Less than High School | $38,750 | $0 |
| High School Diploma | $47,000 | $30,625 |
| College or Associate's Degree | $50,956 | $37,986 |
| Bachelor's Degree | $100,625 | $40,938 |
| Graduate Degree | - | - |
| Total | $50,885 | $37,791 |
Family Income in Bonneauville borough
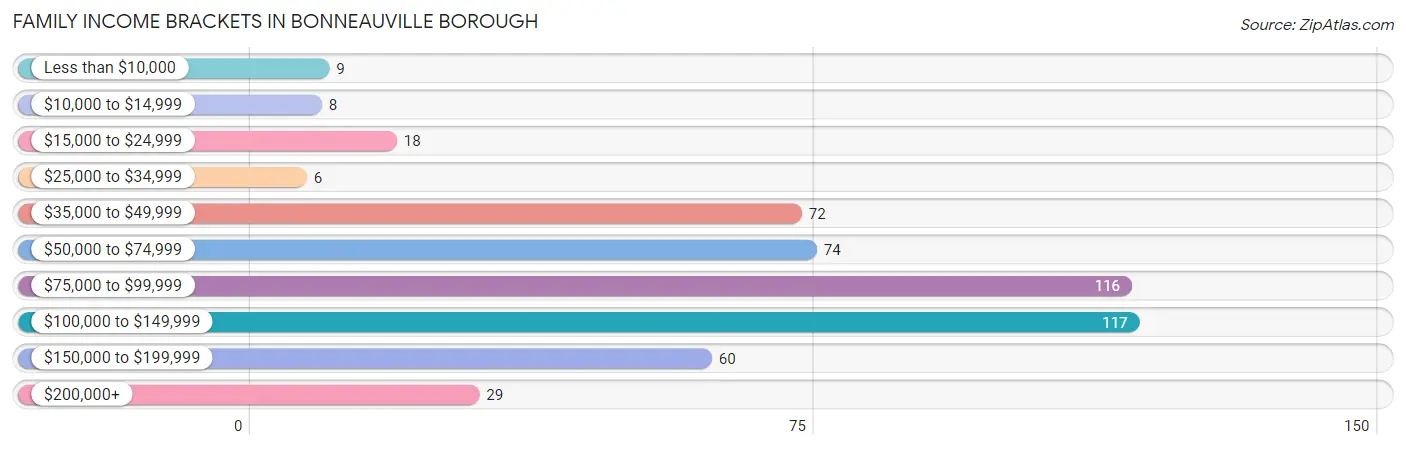
Family Income Brackets in Bonneauville borough
According to the Bonneauville borough family income data, there are 117 families falling into the $100,000 to $149,999 income range, which is the most common income bracket and makes up 23.0% of all families. Conversely, the $25,000 to $34,999 income bracket is the least frequent group with only 6 families (1.2%) belonging to this category.
| Income Bracket | # Families | % Families |
| Less than $10,000 | 9 | 1.8% |
| $10,000 to $14,999 | 8 | 1.6% |
| $15,000 to $24,999 | 18 | 3.5% |
| $25,000 to $34,999 | 6 | 1.2% |
| $35,000 to $49,999 | 72 | 14.1% |
| $50,000 to $74,999 | 74 | 14.5% |
| $75,000 to $99,999 | 116 | 22.8% |
| $100,000 to $149,999 | 117 | 23.0% |
| $150,000 to $199,999 | 60 | 11.8% |
| $200,000+ | 29 | 5.7% |
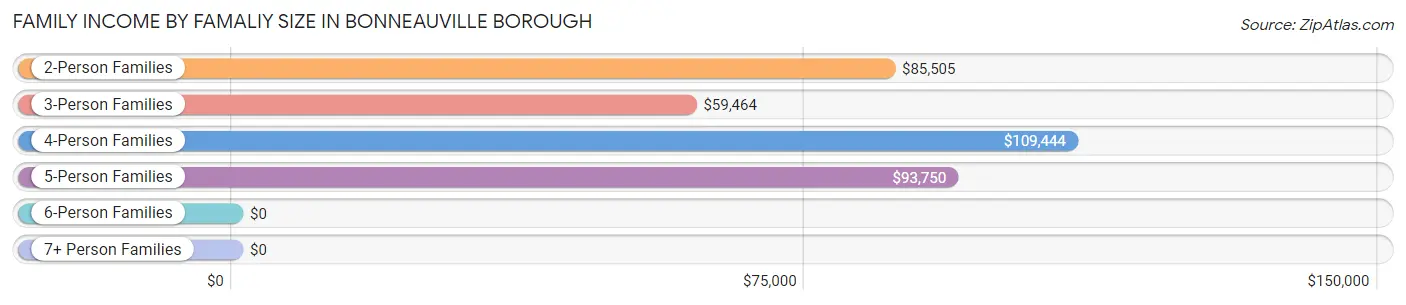
Family Income by Famaliy Size in Bonneauville borough
4-person families (100 | 19.7%) account for the highest median family income in Bonneauville borough with $109,444 per family, while 2-person families (249 | 48.9%) have the highest median income of $42,752 per family member.
| Income Bracket | # Families | Median Income |
| 2-Person Families | 249 (48.9%) | $85,505 |
| 3-Person Families | 121 (23.8%) | $59,464 |
| 4-Person Families | 100 (19.7%) | $109,444 |
| 5-Person Families | 31 (6.1%) | $93,750 |
| 6-Person Families | 4 (0.8%) | $0 |
| 7+ Person Families | 4 (0.8%) | $0 |
| Total | 509 (100.0%) | $86,631 |
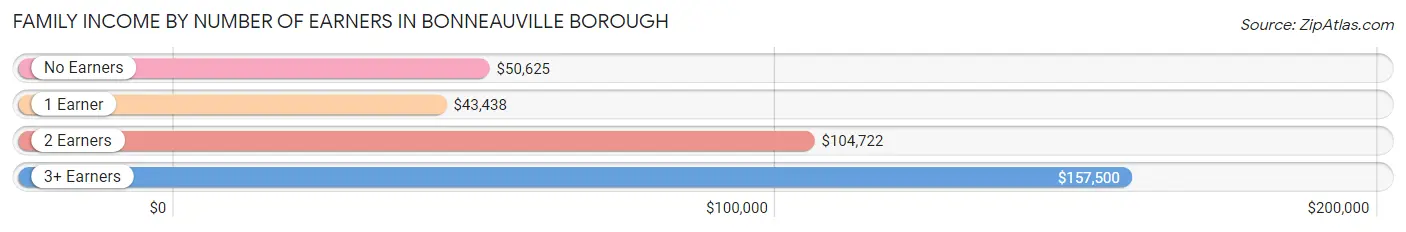
Family Income by Number of Earners in Bonneauville borough
The median family income in Bonneauville borough is $86,631, with families comprising 3+ earners (50) having the highest median family income of $157,500, while families with 1 earner (126) have the lowest median family income of $43,438, accounting for 9.8% and 24.7% of families, respectively.
| Number of Earners | # Families | Median Income |
| No Earners | 71 (14.0%) | $50,625 |
| 1 Earner | 126 (24.7%) | $43,438 |
| 2 Earners | 262 (51.5%) | $104,722 |
| 3+ Earners | 50 (9.8%) | $157,500 |
| Total | 509 (100.0%) | $86,631 |
Household Income in Bonneauville borough
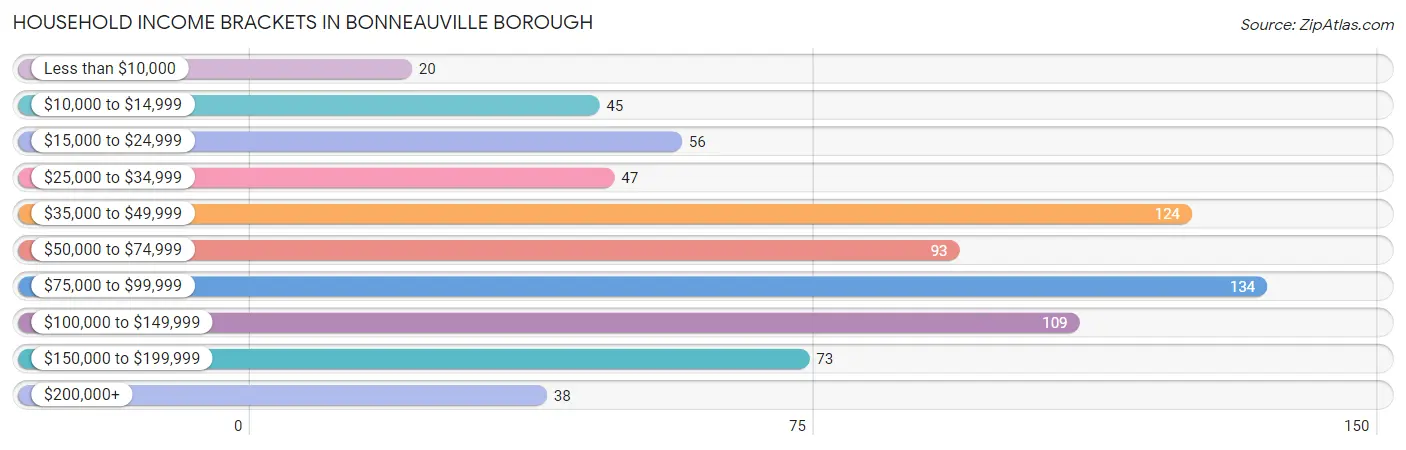
Household Income Brackets in Bonneauville borough
With 134 households falling in the category, the $75,000 to $99,999 income range is the most frequent in Bonneauville borough, accounting for 18.1% of all households. In contrast, only 20 households (2.7%) fall into the less than $10,000 income bracket, making it the least populous group.
| Income Bracket | # Households | % Households |
| Less than $10,000 | 20 | 2.7% |
| $10,000 to $14,999 | 45 | 6.1% |
| $15,000 to $24,999 | 56 | 7.6% |
| $25,000 to $34,999 | 47 | 6.4% |
| $35,000 to $49,999 | 124 | 16.8% |
| $50,000 to $74,999 | 93 | 12.6% |
| $75,000 to $99,999 | 134 | 18.1% |
| $100,000 to $149,999 | 109 | 14.7% |
| $150,000 to $199,999 | 73 | 9.9% |
| $200,000+ | 38 | 5.1% |
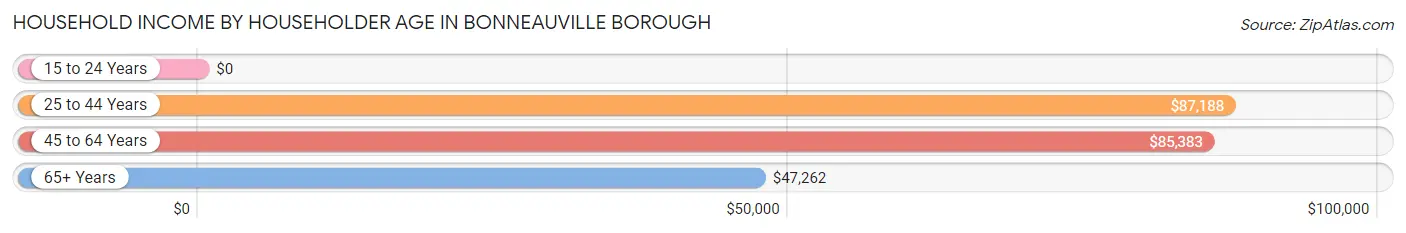
Household Income by Householder Age in Bonneauville borough
The median household income in Bonneauville borough is $65,417, with the highest median household income of $87,188 found in the 25 to 44 years age bracket for the primary householder. A total of 215 households (29.1%) fall into this category. Meanwhile, the 15 to 24 years age bracket for the primary householder has the lowest median household income of $0, with 7 households (0.9%) in this group.
| Income Bracket | # Households | Median Income |
| 15 to 24 Years | 7 (0.9%) | $0 |
| 25 to 44 Years | 215 (29.1%) | $87,188 |
| 45 to 64 Years | 299 (40.5%) | $85,383 |
| 65+ Years | 218 (29.5%) | $47,262 |
| Total | 739 (100.0%) | $65,417 |
Poverty in Bonneauville borough
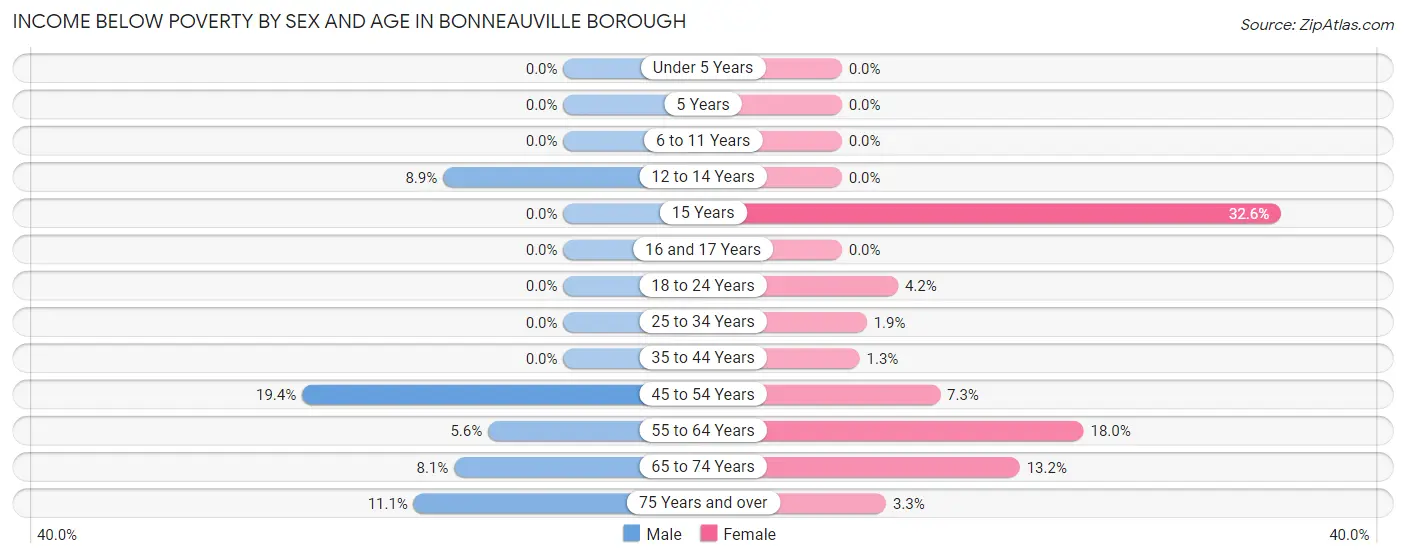
Income Below Poverty by Sex and Age in Bonneauville borough
With 5.8% poverty level for males and 6.7% for females among the residents of Bonneauville borough, 45 to 54 year old males and 15 year old females are the most vulnerable to poverty, with 26 males (19.4%) and 15 females (32.6%) in their respective age groups living below the poverty level.
| Age Bracket | Male | Female |
| Under 5 Years | 0 (0.0%) | 0 (0.0%) |
| 5 Years | 0 (0.0%) | 0 (0.0%) |
| 6 to 11 Years | 0 (0.0%) | 0 (0.0%) |
| 12 to 14 Years | 5 (8.9%) | 0 (0.0%) |
| 15 Years | 0 (0.0%) | 15 (32.6%) |
| 16 and 17 Years | 0 (0.0%) | 0 (0.0%) |
| 18 to 24 Years | 0 (0.0%) | 3 (4.2%) |
| 25 to 34 Years | 0 (0.0%) | 2 (1.8%) |
| 35 to 44 Years | 0 (0.0%) | 2 (1.3%) |
| 45 to 54 Years | 26 (19.4%) | 10 (7.3%) |
| 55 to 64 Years | 9 (5.6%) | 14 (17.9%) |
| 65 to 74 Years | 9 (8.1%) | 14 (13.2%) |
| 75 Years and over | 4 (11.1%) | 2 (3.3%) |
| Total | 53 (5.8%) | 62 (6.7%) |
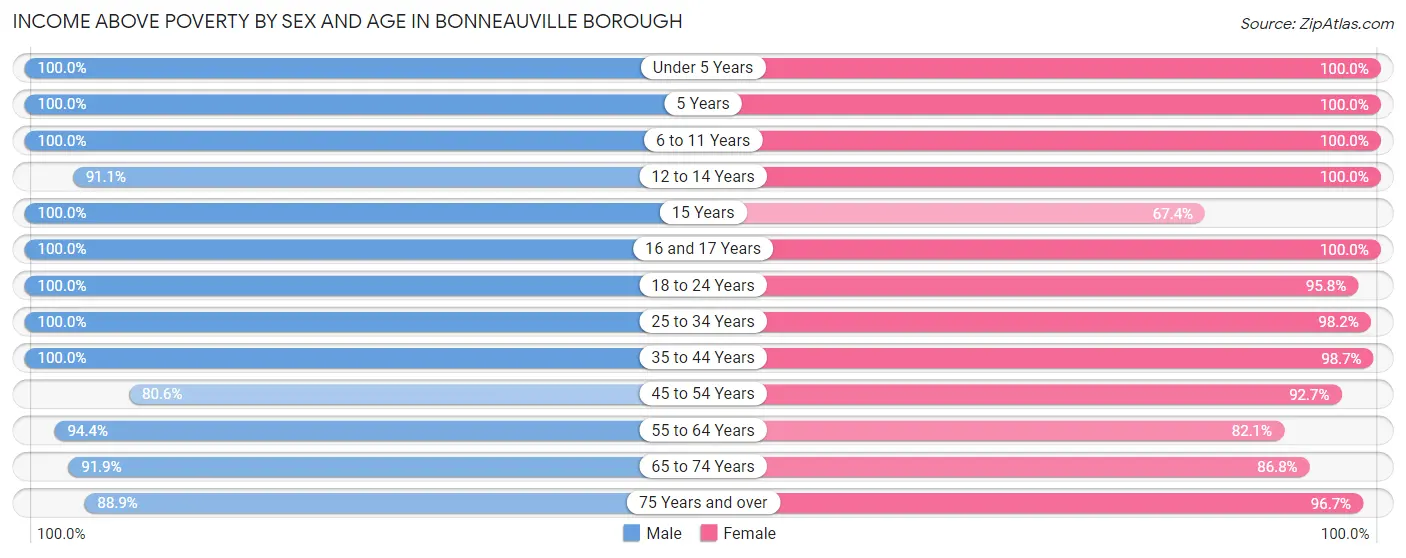
Income Above Poverty by Sex and Age in Bonneauville borough
According to the poverty statistics in Bonneauville borough, males aged under 5 years and females aged under 5 years are the age groups that are most secure financially, with 100.0% of males and 100.0% of females in these age groups living above the poverty line.
| Age Bracket | Male | Female |
| Under 5 Years | 39 (100.0%) | 12 (100.0%) |
| 5 Years | 26 (100.0%) | 3 (100.0%) |
| 6 to 11 Years | 59 (100.0%) | 92 (100.0%) |
| 12 to 14 Years | 51 (91.1%) | 36 (100.0%) |
| 15 Years | 7 (100.0%) | 31 (67.4%) |
| 16 and 17 Years | 38 (100.0%) | 19 (100.0%) |
| 18 to 24 Years | 53 (100.0%) | 69 (95.8%) |
| 25 to 34 Years | 107 (100.0%) | 106 (98.2%) |
| 35 to 44 Years | 81 (100.0%) | 149 (98.7%) |
| 45 to 54 Years | 108 (80.6%) | 127 (92.7%) |
| 55 to 64 Years | 152 (94.4%) | 64 (82.1%) |
| 65 to 74 Years | 102 (91.9%) | 92 (86.8%) |
| 75 Years and over | 32 (88.9%) | 59 (96.7%) |
| Total | 855 (94.2%) | 859 (93.3%) |
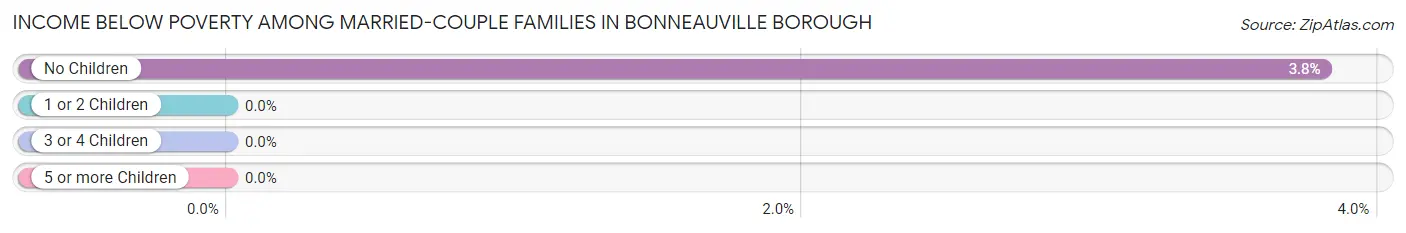
Income Below Poverty Among Married-Couple Families in Bonneauville borough
The poverty statistics for married-couple families in Bonneauville borough show that 2.3% or 9 of the total 393 families live below the poverty line. Families with no children have the highest poverty rate of 3.8%, comprising of 9 families. On the other hand, families with 1 or 2 children have the lowest poverty rate of 0.0%, which includes 0 families.
| Children | Above Poverty | Below Poverty |
| No Children | 227 (96.2%) | 9 (3.8%) |
| 1 or 2 Children | 129 (100.0%) | 0 (0.0%) |
| 3 or 4 Children | 28 (100.0%) | 0 (0.0%) |
| 5 or more Children | 0 (0.0%) | 0 (0.0%) |
| Total | 384 (97.7%) | 9 (2.3%) |
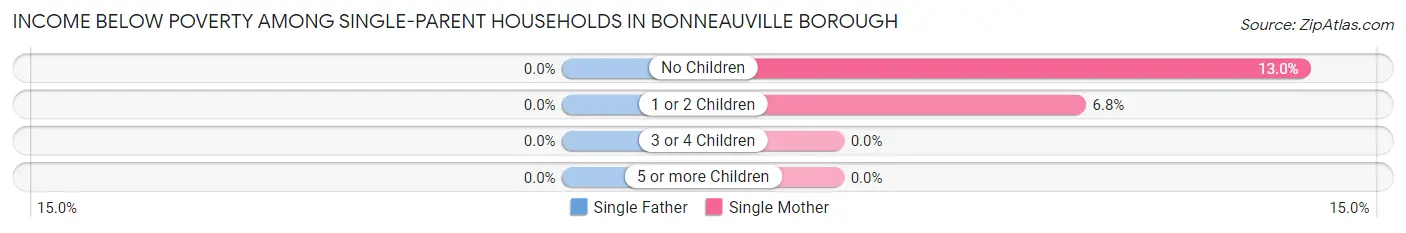
Income Below Poverty Among Single-Parent Households in Bonneauville borough
| Children | Single Father | Single Mother |
| No Children | 0 (0.0%) | 3 (13.0%) |
| 1 or 2 Children | 0 (0.0%) | 5 (6.8%) |
| 3 or 4 Children | 0 (0.0%) | 0 (0.0%) |
| 5 or more Children | 0 (0.0%) | 0 (0.0%) |
| Total | 0 (0.0%) | 8 (8.1%) |
Income Below Poverty Among Married-Couple vs Single-Parent Households in Bonneauville borough
The poverty data for Bonneauville borough shows that 9 of the married-couple family households (2.3%) and 8 of the single-parent households (6.9%) are living below the poverty level. Within the married-couple family households, those with no children have the highest poverty rate, with 9 households (3.8%) falling below the poverty line. Among the single-parent households, those with no children have the highest poverty rate, with 3 household (8.3%) living below poverty.
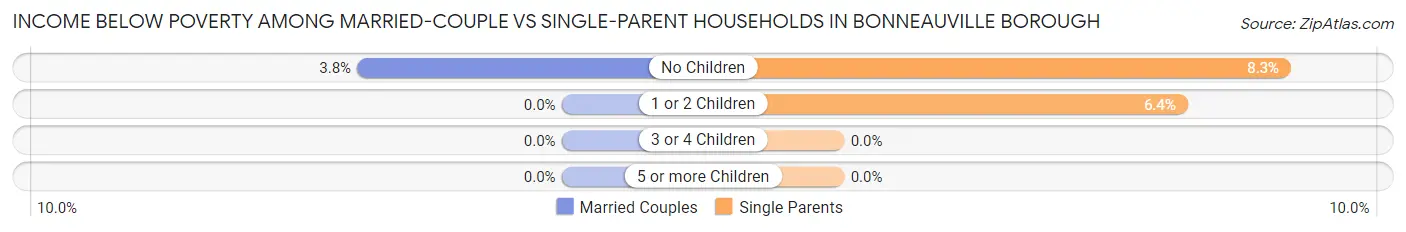
| Children | Married-Couple Families | Single-Parent Households |
| No Children | 9 (3.8%) | 3 (8.3%) |
| 1 or 2 Children | 0 (0.0%) | 5 (6.4%) |
| 3 or 4 Children | 0 (0.0%) | 0 (0.0%) |
| 5 or more Children | 0 (0.0%) | 0 (0.0%) |
| Total | 9 (2.3%) | 8 (6.9%) |
Race in Bonneauville borough
The most populous races in Bonneauville borough are White / Caucasian (1,667 | 89.8%), Hispanic or Latino (99 | 5.3%), and Two or more Races (91 | 4.9%).
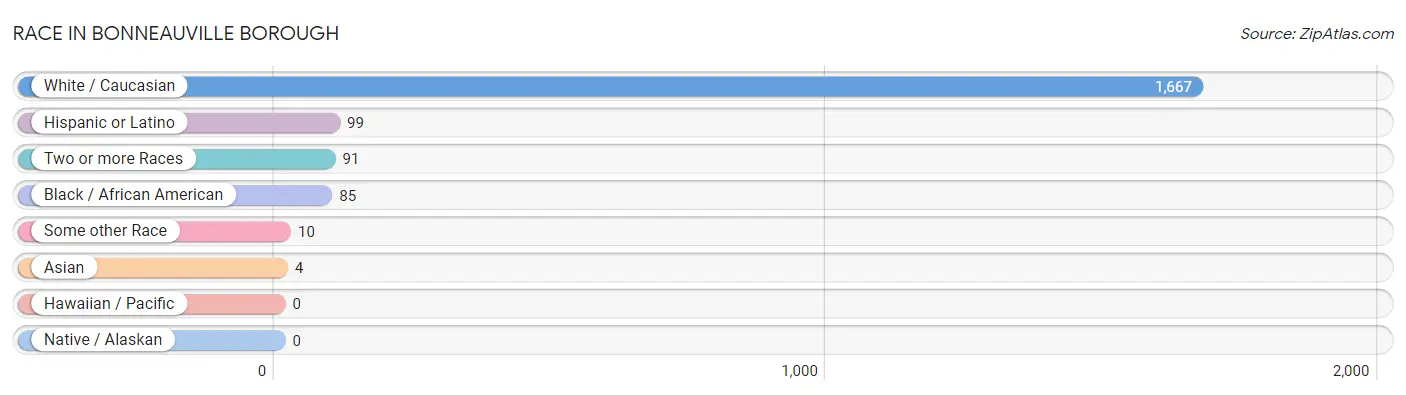
| Race | # Population | % Population |
| Asian | 4 | 0.2% |
| Black / African American | 85 | 4.6% |
| Hawaiian / Pacific | 0 | 0.0% |
| Hispanic or Latino | 99 | 5.3% |
| Native / Alaskan | 0 | 0.0% |
| White / Caucasian | 1,667 | 89.8% |
| Two or more Races | 91 | 4.9% |
| Some other Race | 10 | 0.5% |
| Total | 1,857 | 100.0% |
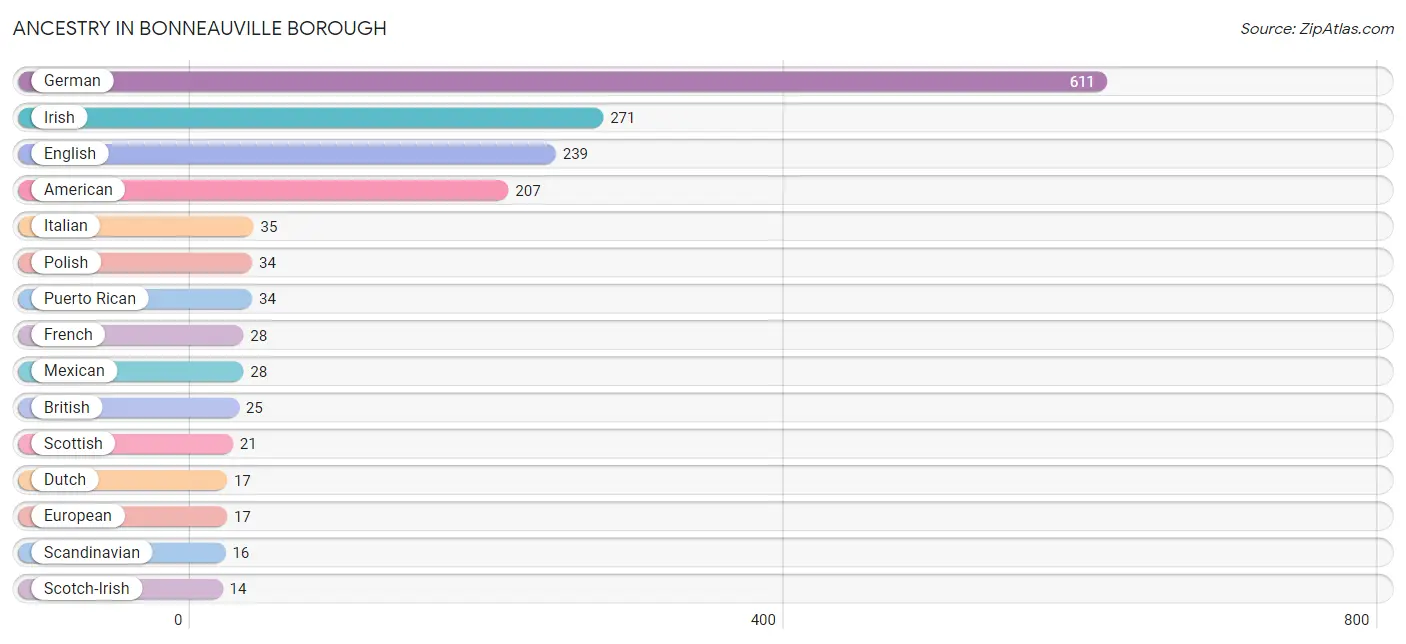
Ancestry in Bonneauville borough
The most populous ancestries reported in Bonneauville borough are German (611 | 32.9%), Irish (271 | 14.6%), English (239 | 12.9%), American (207 | 11.2%), and Italian (35 | 1.9%), together accounting for 73.4% of all Bonneauville borough residents.
| Ancestry | # Population | % Population |
| American | 207 | 11.2% |
| British | 25 | 1.3% |
| Central American | 11 | 0.6% |
| Cherokee | 6 | 0.3% |
| Czechoslovakian | 4 | 0.2% |
| Danish | 4 | 0.2% |
| Dutch | 17 | 0.9% |
| English | 239 | 12.9% |
| European | 17 | 0.9% |
| French | 28 | 1.5% |
| German | 611 | 32.9% |
| Guatemalan | 11 | 0.6% |
| Hungarian | 3 | 0.2% |
| Indian (Asian) | 4 | 0.2% |
| Irish | 271 | 14.6% |
| Italian | 35 | 1.9% |
| Mexican | 28 | 1.5% |
| Pennsylvania German | 8 | 0.4% |
| Polish | 34 | 1.8% |
| Puerto Rican | 34 | 1.8% |
| Romanian | 4 | 0.2% |
| Russian | 5 | 0.3% |
| Scandinavian | 16 | 0.9% |
| Scotch-Irish | 14 | 0.7% |
| Scottish | 21 | 1.1% |
| Slovak | 12 | 0.6% |
| Slovene | 4 | 0.2% |
| Spanish | 4 | 0.2% |
| Swedish | 3 | 0.2% |
| Tlingit-Haida | 3 | 0.2% |
| Welsh | 7 | 0.4% | View All 31 Rows |
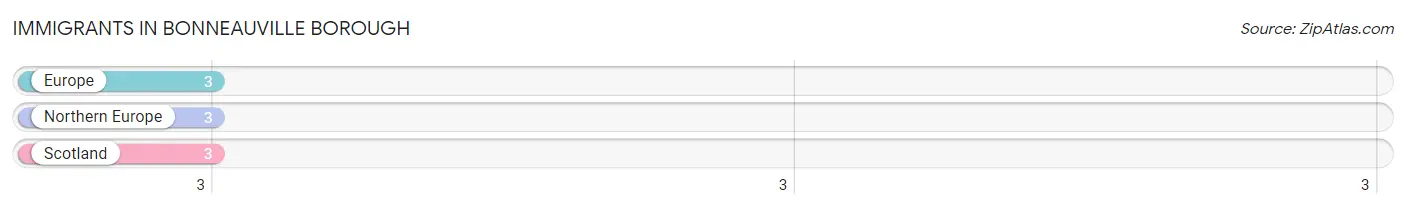
Immigrants in Bonneauville borough
The most numerous immigrant groups reported in Bonneauville borough came from Europe (3 | 0.2%), Northern Europe (3 | 0.2%), and Scotland (3 | 0.2%), together accounting for 0.5% of all Bonneauville borough residents.
| Immigration Origin | # Population | % Population |
| Europe | 3 | 0.2% |
| Northern Europe | 3 | 0.2% |
| Scotland | 3 | 0.2% | View All 3 Rows |
Sex and Age in Bonneauville borough
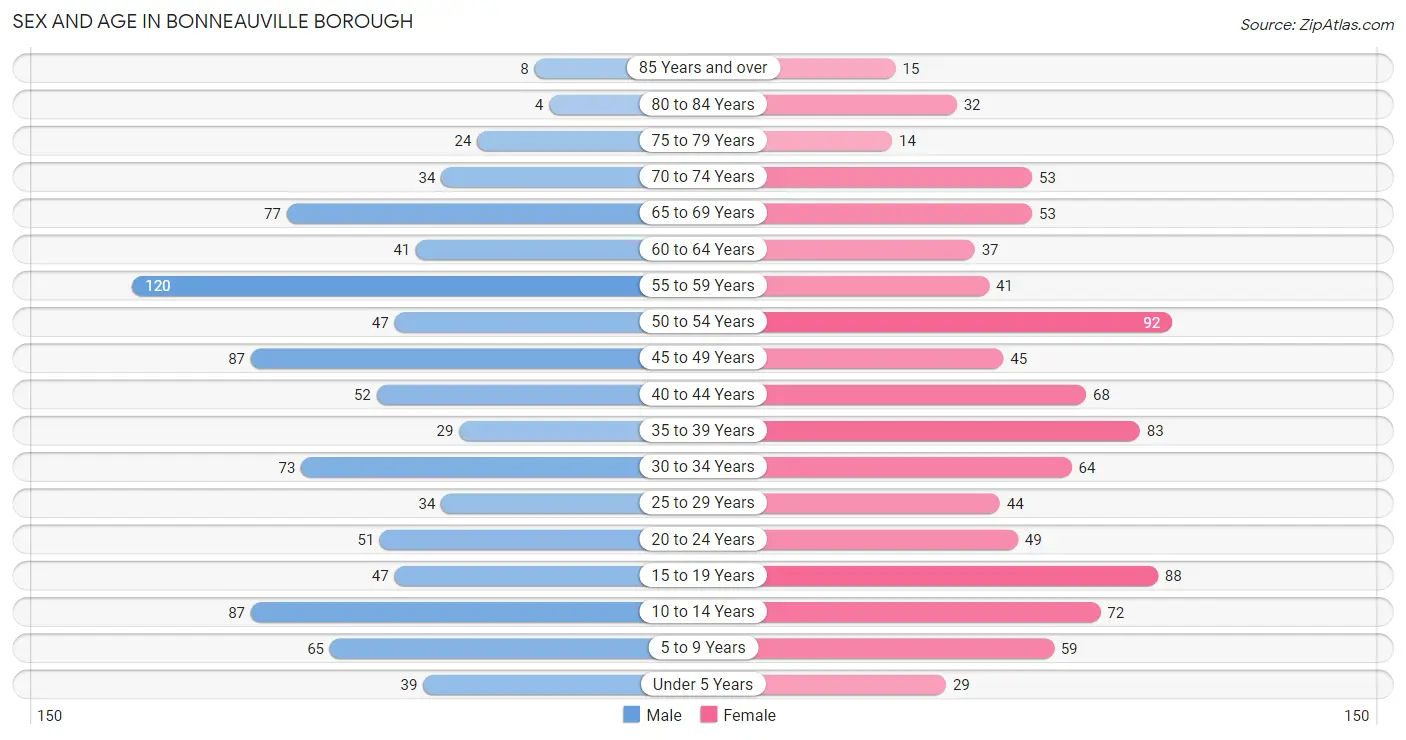
Sex and Age in Bonneauville borough
The most populous age groups in Bonneauville borough are 55 to 59 Years (120 | 13.1%) for men and 50 to 54 Years (92 | 9.8%) for women.
| Age Bracket | Male | Female |
| Under 5 Years | 39 (4.2%) | 29 (3.1%) |
| 5 to 9 Years | 65 (7.1%) | 59 (6.3%) |
| 10 to 14 Years | 87 (9.5%) | 72 (7.7%) |
| 15 to 19 Years | 47 (5.1%) | 88 (9.4%) |
| 20 to 24 Years | 51 (5.6%) | 49 (5.2%) |
| 25 to 29 Years | 34 (3.7%) | 44 (4.7%) |
| 30 to 34 Years | 73 (7.9%) | 64 (6.8%) |
| 35 to 39 Years | 29 (3.2%) | 83 (8.8%) |
| 40 to 44 Years | 52 (5.7%) | 68 (7.2%) |
| 45 to 49 Years | 87 (9.5%) | 45 (4.8%) |
| 50 to 54 Years | 47 (5.1%) | 92 (9.8%) |
| 55 to 59 Years | 120 (13.1%) | 41 (4.4%) |
| 60 to 64 Years | 41 (4.5%) | 37 (3.9%) |
| 65 to 69 Years | 77 (8.4%) | 53 (5.7%) |
| 70 to 74 Years | 34 (3.7%) | 53 (5.7%) |
| 75 to 79 Years | 24 (2.6%) | 14 (1.5%) |
| 80 to 84 Years | 4 (0.4%) | 32 (3.4%) |
| 85 Years and over | 8 (0.9%) | 15 (1.6%) |
| Total | 919 (100.0%) | 938 (100.0%) |
Families and Households in Bonneauville borough
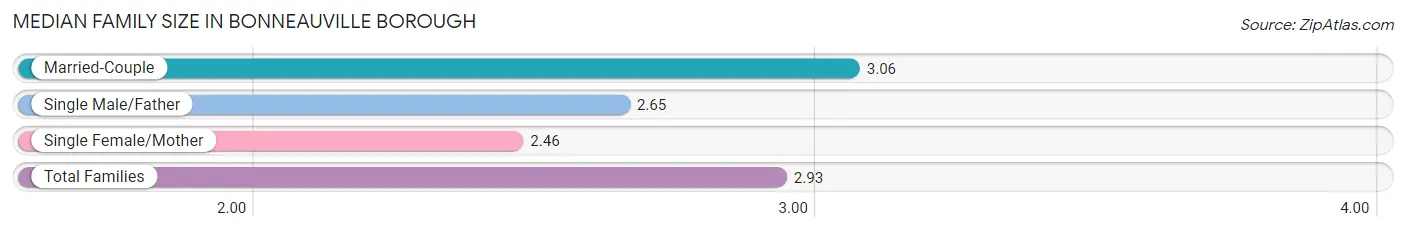
Median Family Size in Bonneauville borough
The median family size in Bonneauville borough is 2.93 persons per family, with married-couple families (393 | 77.2%) accounting for the largest median family size of 3.06 persons per family. On the other hand, single female/mother families (99 | 19.5%) represent the smallest median family size with 2.46 persons per family.
| Family Type | # Families | Family Size |
| Married-Couple | 393 (77.2%) | 3.06 |
| Single Male/Father | 17 (3.3%) | 2.65 |
| Single Female/Mother | 99 (19.5%) | 2.46 |
| Total Families | 509 (100.0%) | 2.93 |
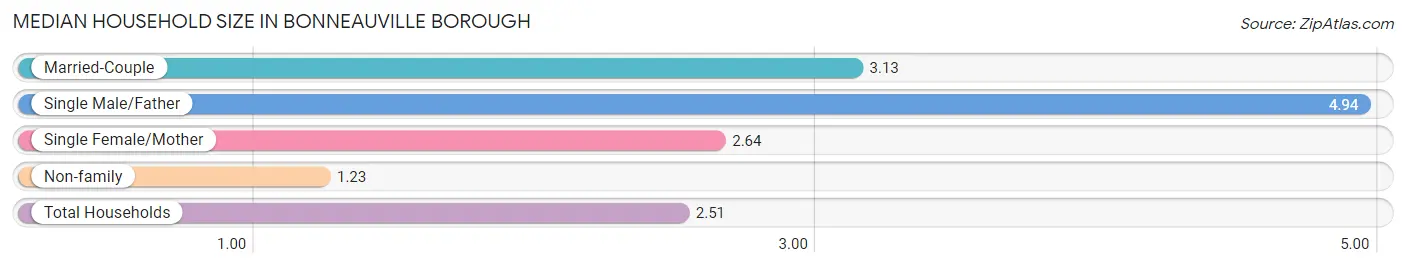
Median Household Size in Bonneauville borough
The median household size in Bonneauville borough is 2.51 persons per household, with single male/father households (17 | 2.3%) accounting for the largest median household size of 4.94 persons per household. non-family households (230 | 31.1%) represent the smallest median household size with 1.23 persons per household.
| Household Type | # Households | Household Size |
| Married-Couple | 393 (53.2%) | 3.13 |
| Single Male/Father | 17 (2.3%) | 4.94 |
| Single Female/Mother | 99 (13.4%) | 2.64 |
| Non-family | 230 (31.1%) | 1.23 |
| Total Households | 739 (100.0%) | 2.51 |
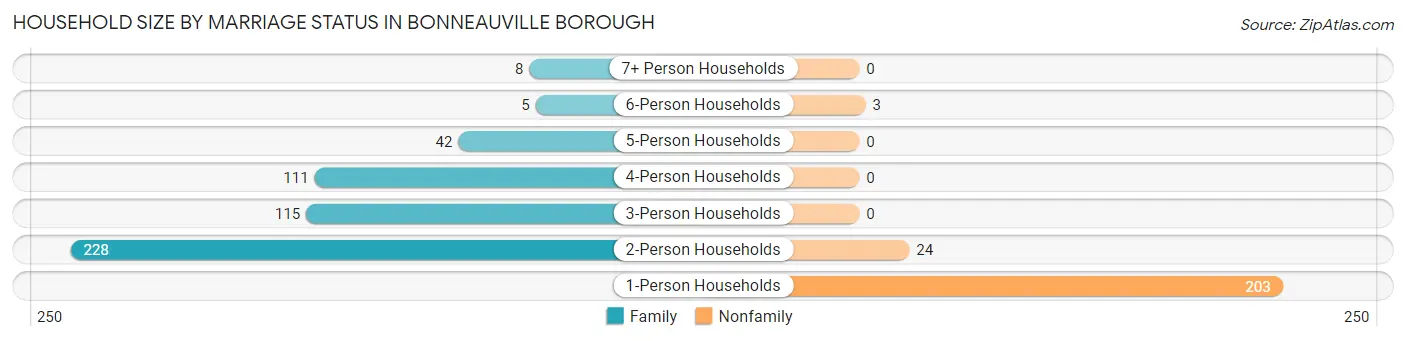
Household Size by Marriage Status in Bonneauville borough
Out of a total of 739 households in Bonneauville borough, 509 (68.9%) are family households, while 230 (31.1%) are nonfamily households. The most numerous type of family households are 2-person households, comprising 228, and the most common type of nonfamily households are 1-person households, comprising 203.
| Household Size | Family Households | Nonfamily Households |
| 1-Person Households | - | 203 (27.5%) |
| 2-Person Households | 228 (30.8%) | 24 (3.3%) |
| 3-Person Households | 115 (15.6%) | 0 (0.0%) |
| 4-Person Households | 111 (15.0%) | 0 (0.0%) |
| 5-Person Households | 42 (5.7%) | 0 (0.0%) |
| 6-Person Households | 5 (0.7%) | 3 (0.4%) |
| 7+ Person Households | 8 (1.1%) | 0 (0.0%) |
| Total | 509 (68.9%) | 230 (31.1%) |
Female Fertility in Bonneauville borough
Fertility by Age in Bonneauville borough
Average fertility rate in Bonneauville borough is 38.0 births per 1,000 women. Women in the age bracket of 20 to 34 years have the highest fertility rate with 96.0 births per 1,000 women. Women in the age bracket of 20 to 34 years acount for 88.2% of all women with births.
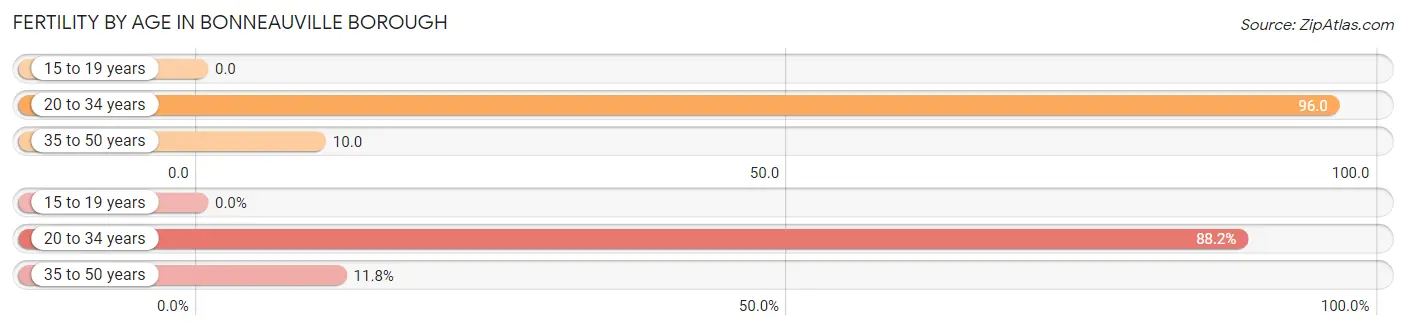
| Age Bracket | Women with Births | Births / 1,000 Women |
| 15 to 19 years | 0 (0.0%) | 0.0 |
| 20 to 34 years | 15 (88.2%) | 96.0 |
| 35 to 50 years | 2 (11.8%) | 10.0 |
| Total | 17 (100.0%) | 38.0 |
Fertility by Age by Marriage Status in Bonneauville borough
64.7% of women with births (17) in Bonneauville borough are married. The highest percentage of unmarried women with births falls into 20 to 34 years age bracket with 40.0% of them unmarried at the time of birth, while the lowest percentage of unmarried women with births belong to 35 to 50 years age bracket with 0.0% of them unmarried.
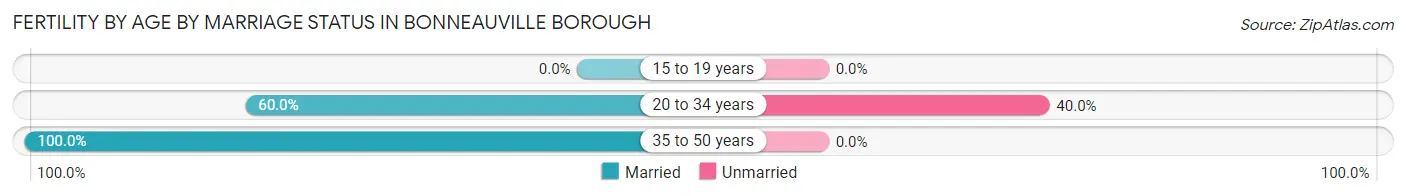
| Age Bracket | Married | Unmarried |
| 15 to 19 years | 0 (0.0%) | 0 (0.0%) |
| 20 to 34 years | 9 (60.0%) | 6 (40.0%) |
| 35 to 50 years | 2 (100.0%) | 0 (0.0%) |
| Total | 11 (64.7%) | 6 (35.3%) |
Fertility by Education in Bonneauville borough
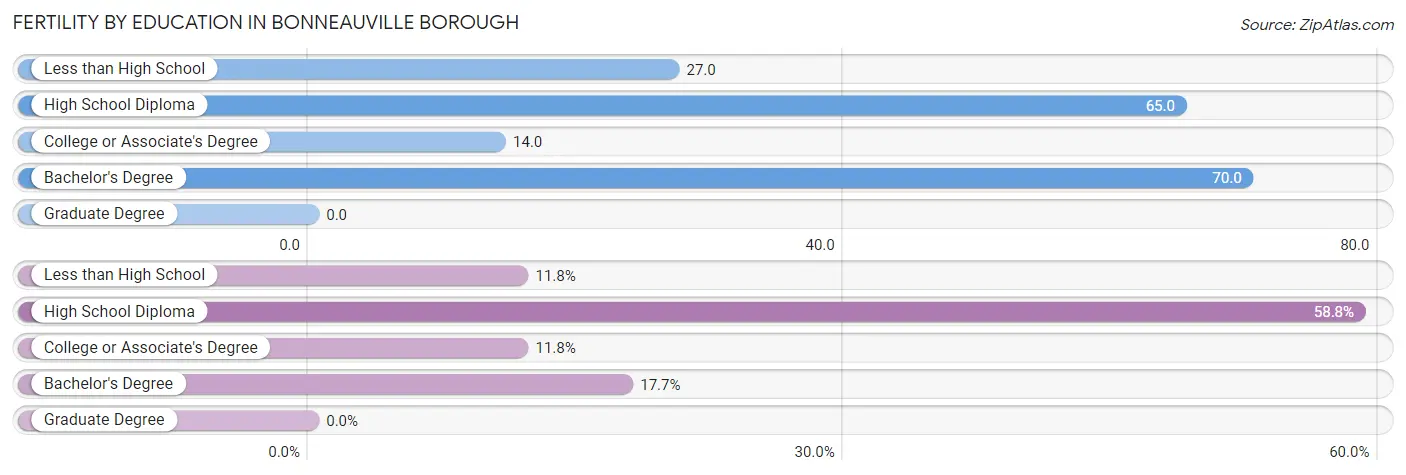
| Educational Attainment | Women with Births | Births / 1,000 Women |
| Less than High School | 2 (11.8%) | 27.0 |
| High School Diploma | 10 (58.8%) | 65.0 |
| College or Associate's Degree | 2 (11.8%) | 14.0 |
| Bachelor's Degree | 3 (17.6%) | 70.0 |
| Graduate Degree | 0 (0.0%) | 0.0 |
| Total | 17 (100.0%) | 38.0 |
Fertility by Education by Marriage Status in Bonneauville borough
35.3% of women with births in Bonneauville borough are unmarried. Women with the educational attainment of less than high school are most likely to be married with 100.0% of them married at childbirth, while women with the educational attainment of high school diploma are least likely to be married with 60.0% of them unmarried at childbirth.
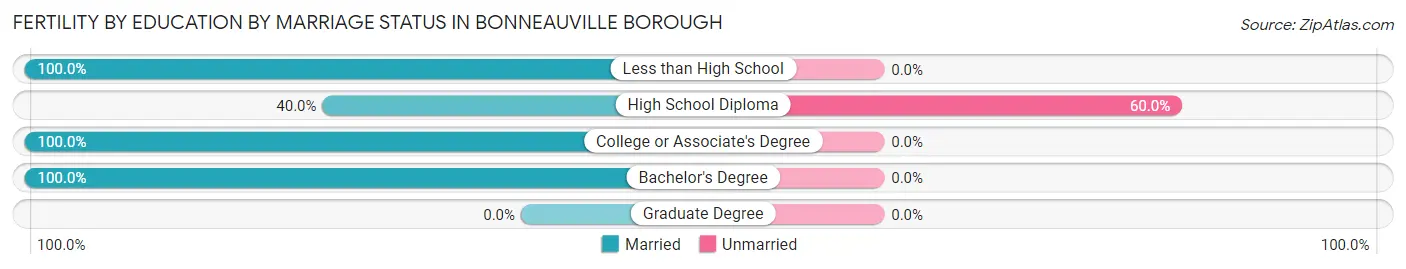
| Educational Attainment | Married | Unmarried |
| Less than High School | 2 (100.0%) | 0 (0.0%) |
| High School Diploma | 4 (40.0%) | 6 (60.0%) |
| College or Associate's Degree | 2 (100.0%) | 0 (0.0%) |
| Bachelor's Degree | 3 (100.0%) | 0 (0.0%) |
| Graduate Degree | 0 (0.0%) | 0 (0.0%) |
| Total | 11 (64.7%) | 6 (35.3%) |
Employment Characteristics in Bonneauville borough
Employment by Class of Employer in Bonneauville borough
Among the 955 employed individuals in Bonneauville borough, private company employees (674 | 70.6%), not-for-profit organizations (93 | 9.7%), and self-employed (not incorporated) (89 | 9.3%) make up the most common classes of employment.
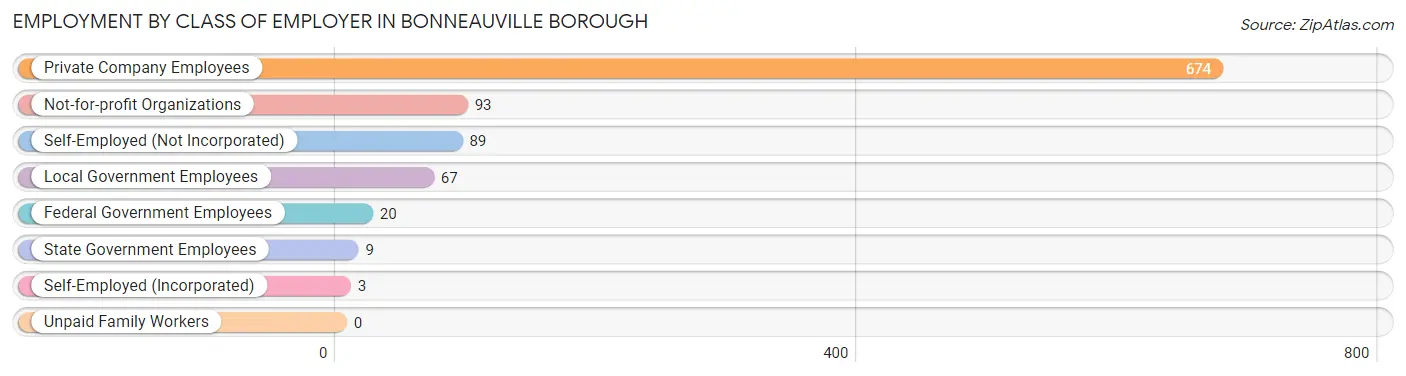
| Employer Class | # Employees | % Employees |
| Private Company Employees | 674 | 70.6% |
| Self-Employed (Incorporated) | 3 | 0.3% |
| Self-Employed (Not Incorporated) | 89 | 9.3% |
| Not-for-profit Organizations | 93 | 9.7% |
| Local Government Employees | 67 | 7.0% |
| State Government Employees | 9 | 0.9% |
| Federal Government Employees | 20 | 2.1% |
| Unpaid Family Workers | 0 | 0.0% |
| Total | 955 | 100.0% |
Employment Status by Age in Bonneauville borough
According to the labor force statistics for Bonneauville borough, out of the total population over 16 years of age (1,453), 69.6% or 1,011 individuals are in the labor force, with 1.7% or 17 of them unemployed. The age group with the highest labor force participation rate is 35 to 44 years, with 94.0% or 218 individuals in the labor force. Within the labor force, the 20 to 24 years age range has the highest percentage of unemployed individuals, with 8.7% or 6 of them being unemployed.
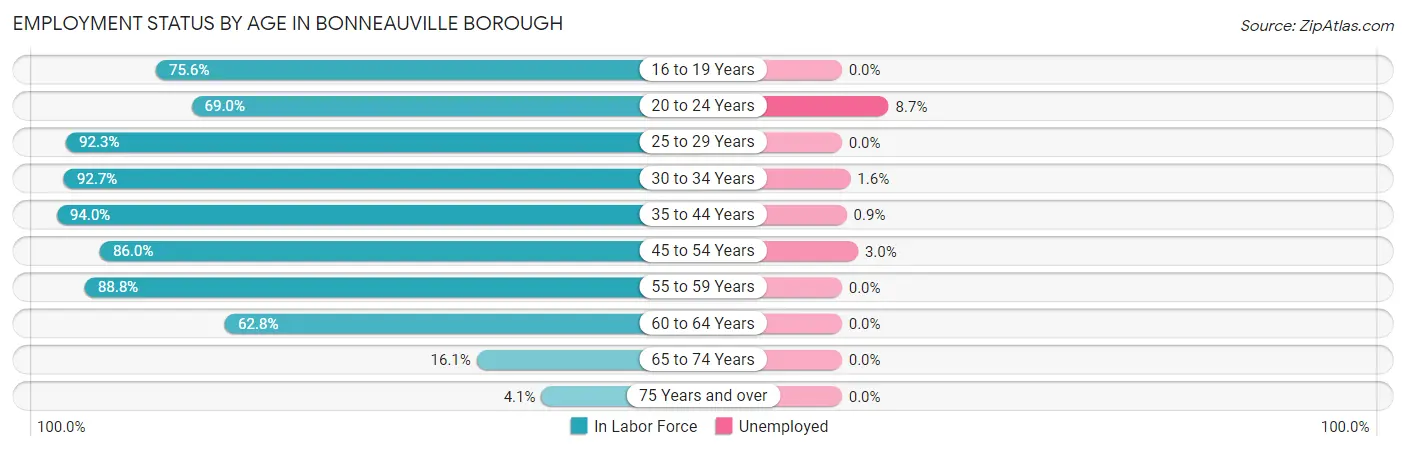
| Age Bracket | In Labor Force | Unemployed |
| 16 to 19 Years | 62 (75.6%) | 0 (0.0%) |
| 20 to 24 Years | 69 (69.0%) | 6 (8.7%) |
| 25 to 29 Years | 72 (92.3%) | 0 (0.0%) |
| 30 to 34 Years | 127 (92.7%) | 2 (1.6%) |
| 35 to 44 Years | 218 (94.0%) | 2 (0.9%) |
| 45 to 54 Years | 233 (86.0%) | 7 (3.0%) |
| 55 to 59 Years | 143 (88.8%) | 0 (0.0%) |
| 60 to 64 Years | 49 (62.8%) | 0 (0.0%) |
| 65 to 74 Years | 35 (16.1%) | 0 (0.0%) |
| 75 Years and over | 4 (4.1%) | 0 (0.0%) |
| Total | 1,011 (69.6%) | 17 (1.7%) |
Employment Status by Educational Attainment in Bonneauville borough
According to labor force statistics for Bonneauville borough, 88.0% of individuals (842) out of the total population between 25 and 64 years of age (957) are in the labor force, with 1.3% or 11 of them being unemployed. The group with the highest labor force participation rate are those with the educational attainment of bachelor's degree or higher, with 94.7% or 124 individuals in the labor force. Within the labor force, individuals with less than high school education have the highest percentage of unemployment, with 5.7% or 2 of them being unemployed.
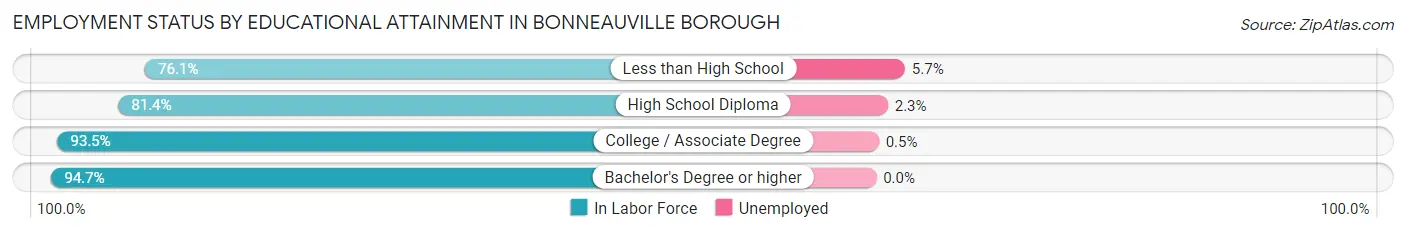
| Educational Attainment | In Labor Force | Unemployed |
| Less than High School | 35 (76.1%) | 3 (5.7%) |
| High School Diploma | 310 (81.4%) | 9 (2.3%) |
| College / Associate Degree | 373 (93.5%) | 2 (0.5%) |
| Bachelor's Degree or higher | 124 (94.7%) | 0 (0.0%) |
| Total | 842 (88.0%) | 12 (1.3%) |
Employment Occupations by Sex in Bonneauville borough
Management, Business, Science and Arts Occupations
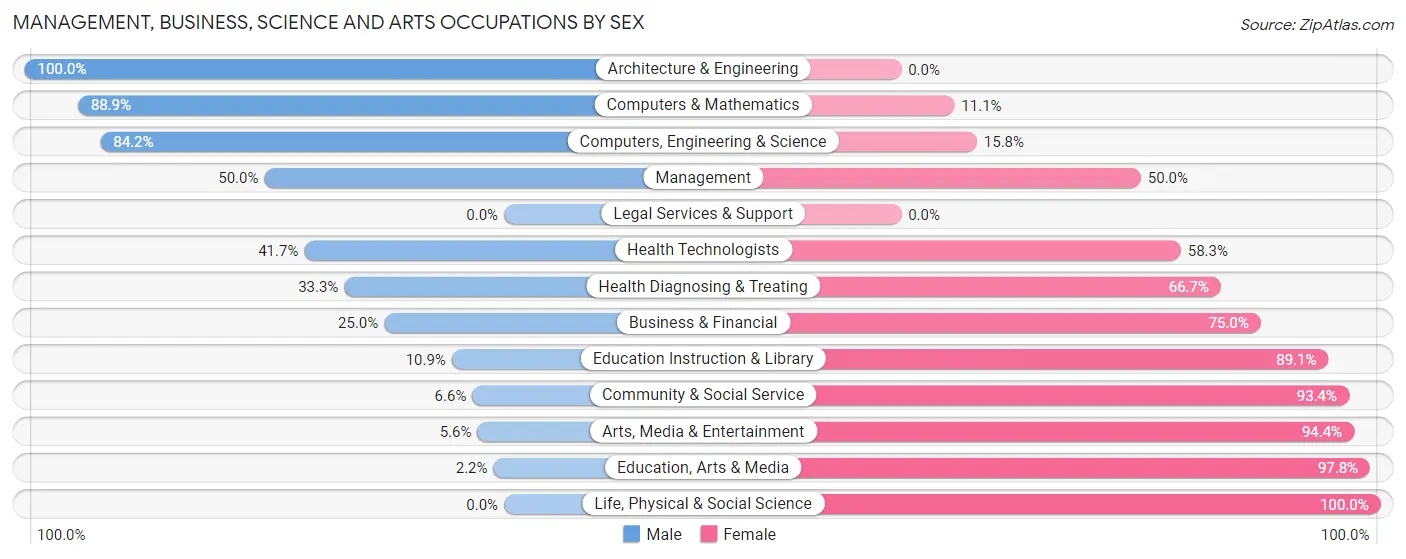
The most common Management, Business, Science and Arts occupations in Bonneauville borough are Community & Social Service (136 | 13.7%), Education Instruction & Library (55 | 5.5%), Management (48 | 4.8%), Education, Arts & Media (45 | 4.5%), and Computers, Engineering & Science (38 | 3.8%).
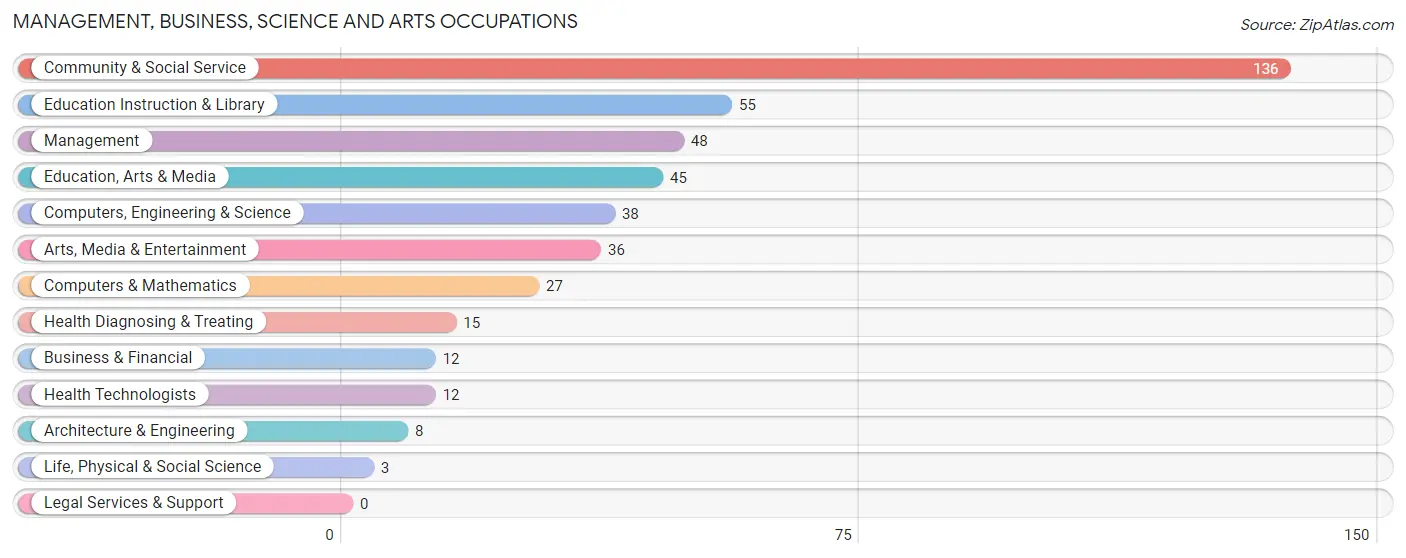
Management, Business, Science and Arts Occupations by Sex
Within the Management, Business, Science and Arts occupations in Bonneauville borough, the most male-oriented occupations are Architecture & Engineering (100.0%), Computers & Mathematics (88.9%), and Computers, Engineering & Science (84.2%), while the most female-oriented occupations are Life, Physical & Social Science (100.0%), Education, Arts & Media (97.8%), and Arts, Media & Entertainment (94.4%).
| Occupation | Male | Female |
| Management | 24 (50.0%) | 24 (50.0%) |
| Business & Financial | 3 (25.0%) | 9 (75.0%) |
| Computers, Engineering & Science | 32 (84.2%) | 6 (15.8%) |
| Computers & Mathematics | 24 (88.9%) | 3 (11.1%) |
| Architecture & Engineering | 8 (100.0%) | 0 (0.0%) |
| Life, Physical & Social Science | 0 (0.0%) | 3 (100.0%) |
| Community & Social Service | 9 (6.6%) | 127 (93.4%) |
| Education, Arts & Media | 1 (2.2%) | 44 (97.8%) |
| Legal Services & Support | 0 (0.0%) | 0 (0.0%) |
| Education Instruction & Library | 6 (10.9%) | 49 (89.1%) |
| Arts, Media & Entertainment | 2 (5.6%) | 34 (94.4%) |
| Health Diagnosing & Treating | 5 (33.3%) | 10 (66.7%) |
| Health Technologists | 5 (41.7%) | 7 (58.3%) |
| Total (Category) | 73 (29.3%) | 176 (70.7%) |
| Total (Overall) | 518 (52.1%) | 477 (47.9%) |
Services Occupations
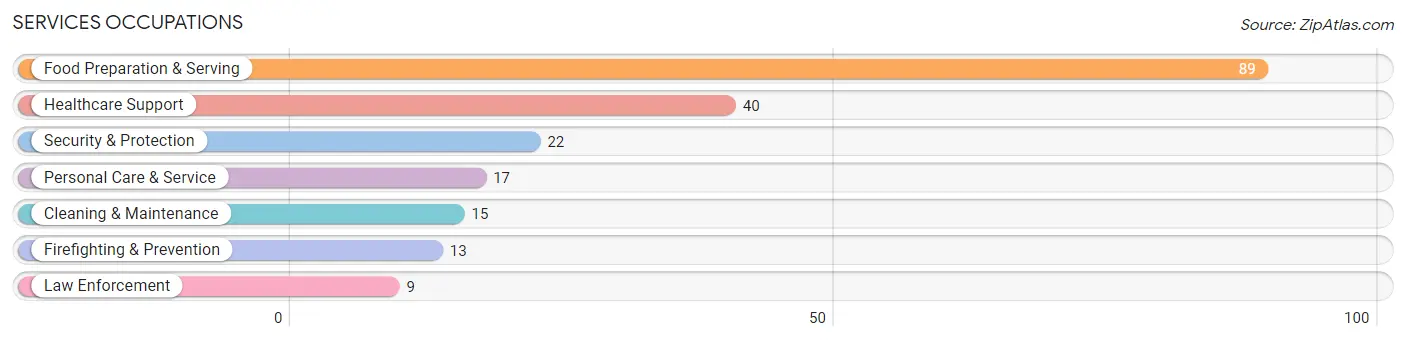
The most common Services occupations in Bonneauville borough are Food Preparation & Serving (89 | 8.9%), Healthcare Support (40 | 4.0%), Security & Protection (22 | 2.2%), Personal Care & Service (17 | 1.7%), and Cleaning & Maintenance (15 | 1.5%).
Services Occupations by Sex
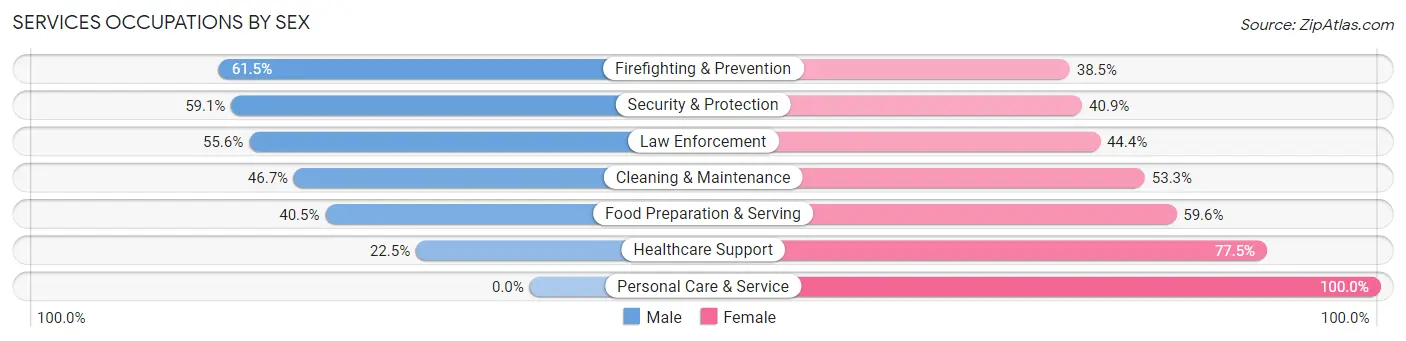
Within the Services occupations in Bonneauville borough, the most male-oriented occupations are Firefighting & Prevention (61.5%), Security & Protection (59.1%), and Law Enforcement (55.6%), while the most female-oriented occupations are Personal Care & Service (100.0%), Healthcare Support (77.5%), and Food Preparation & Serving (59.6%).
| Occupation | Male | Female |
| Healthcare Support | 9 (22.5%) | 31 (77.5%) |
| Security & Protection | 13 (59.1%) | 9 (40.9%) |
| Firefighting & Prevention | 8 (61.5%) | 5 (38.5%) |
| Law Enforcement | 5 (55.6%) | 4 (44.4%) |
| Food Preparation & Serving | 36 (40.5%) | 53 (59.6%) |
| Cleaning & Maintenance | 7 (46.7%) | 8 (53.3%) |
| Personal Care & Service | 0 (0.0%) | 17 (100.0%) |
| Total (Category) | 65 (35.5%) | 118 (64.5%) |
| Total (Overall) | 518 (52.1%) | 477 (47.9%) |
Sales and Office Occupations
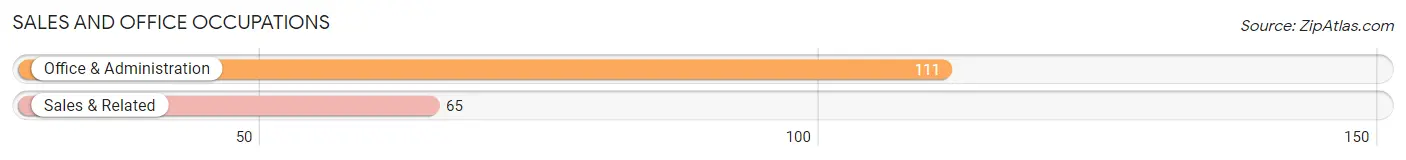
The most common Sales and Office occupations in Bonneauville borough are Office & Administration (111 | 11.2%), and Sales & Related (65 | 6.5%).
Sales and Office Occupations by Sex
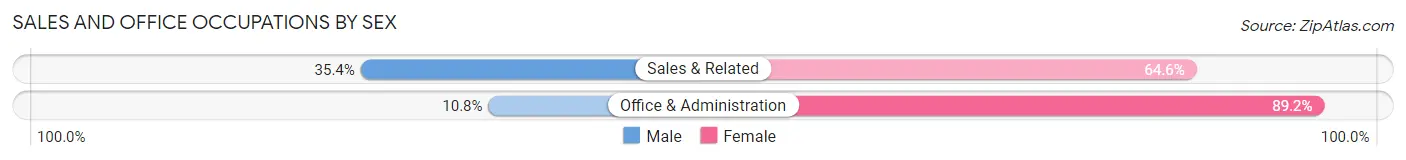
| Occupation | Male | Female |
| Sales & Related | 23 (35.4%) | 42 (64.6%) |
| Office & Administration | 12 (10.8%) | 99 (89.2%) |
| Total (Category) | 35 (19.9%) | 141 (80.1%) |
| Total (Overall) | 518 (52.1%) | 477 (47.9%) |
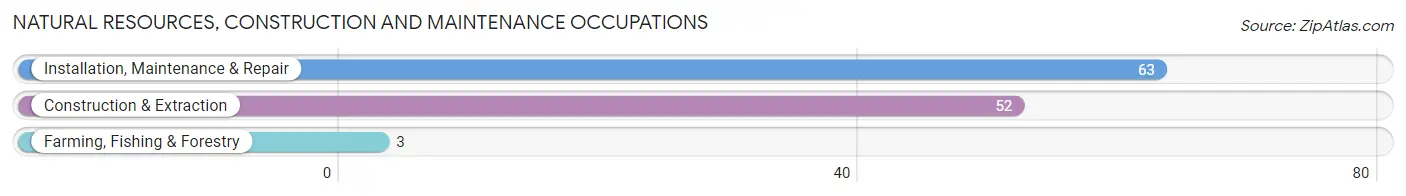
Natural Resources, Construction and Maintenance Occupations
The most common Natural Resources, Construction and Maintenance occupations in Bonneauville borough are Installation, Maintenance & Repair (63 | 6.3%), Construction & Extraction (52 | 5.2%), and Farming, Fishing & Forestry (3 | 0.3%).
Natural Resources, Construction and Maintenance Occupations by Sex
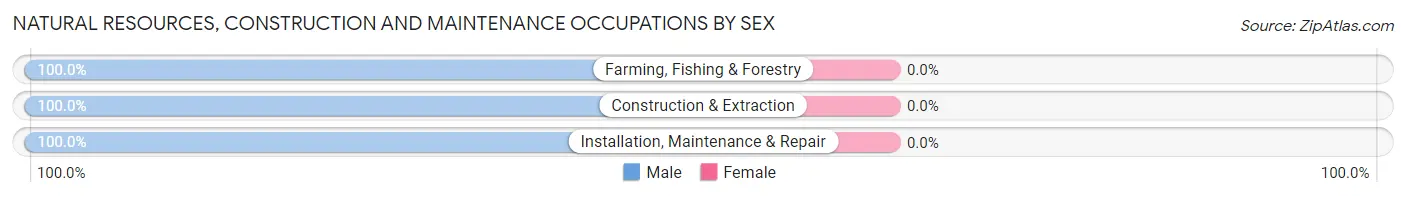
| Occupation | Male | Female |
| Farming, Fishing & Forestry | 3 (100.0%) | 0 (0.0%) |
| Construction & Extraction | 52 (100.0%) | 0 (0.0%) |
| Installation, Maintenance & Repair | 63 (100.0%) | 0 (0.0%) |
| Total (Category) | 118 (100.0%) | 0 (0.0%) |
| Total (Overall) | 518 (52.1%) | 477 (47.9%) |
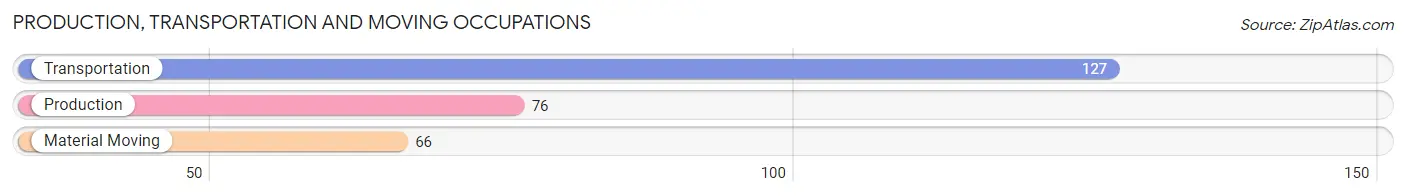
Production, Transportation and Moving Occupations
The most common Production, Transportation and Moving occupations in Bonneauville borough are Transportation (127 | 12.8%), Production (76 | 7.6%), and Material Moving (66 | 6.6%).
Production, Transportation and Moving Occupations by Sex
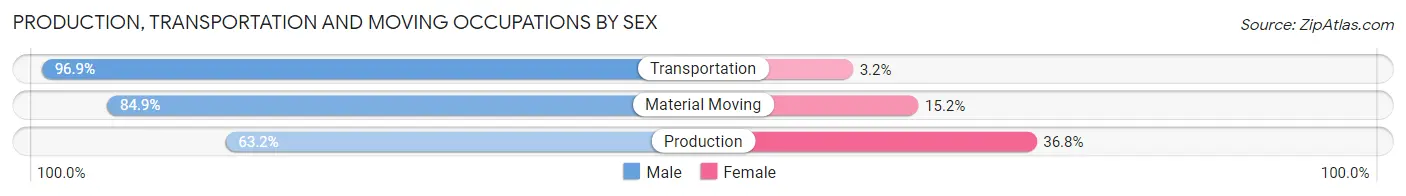
| Occupation | Male | Female |
| Production | 48 (63.2%) | 28 (36.8%) |
| Transportation | 123 (96.9%) | 4 (3.2%) |
| Material Moving | 56 (84.9%) | 10 (15.1%) |
| Total (Category) | 227 (84.4%) | 42 (15.6%) |
| Total (Overall) | 518 (52.1%) | 477 (47.9%) |
Employment Industries by Sex in Bonneauville borough
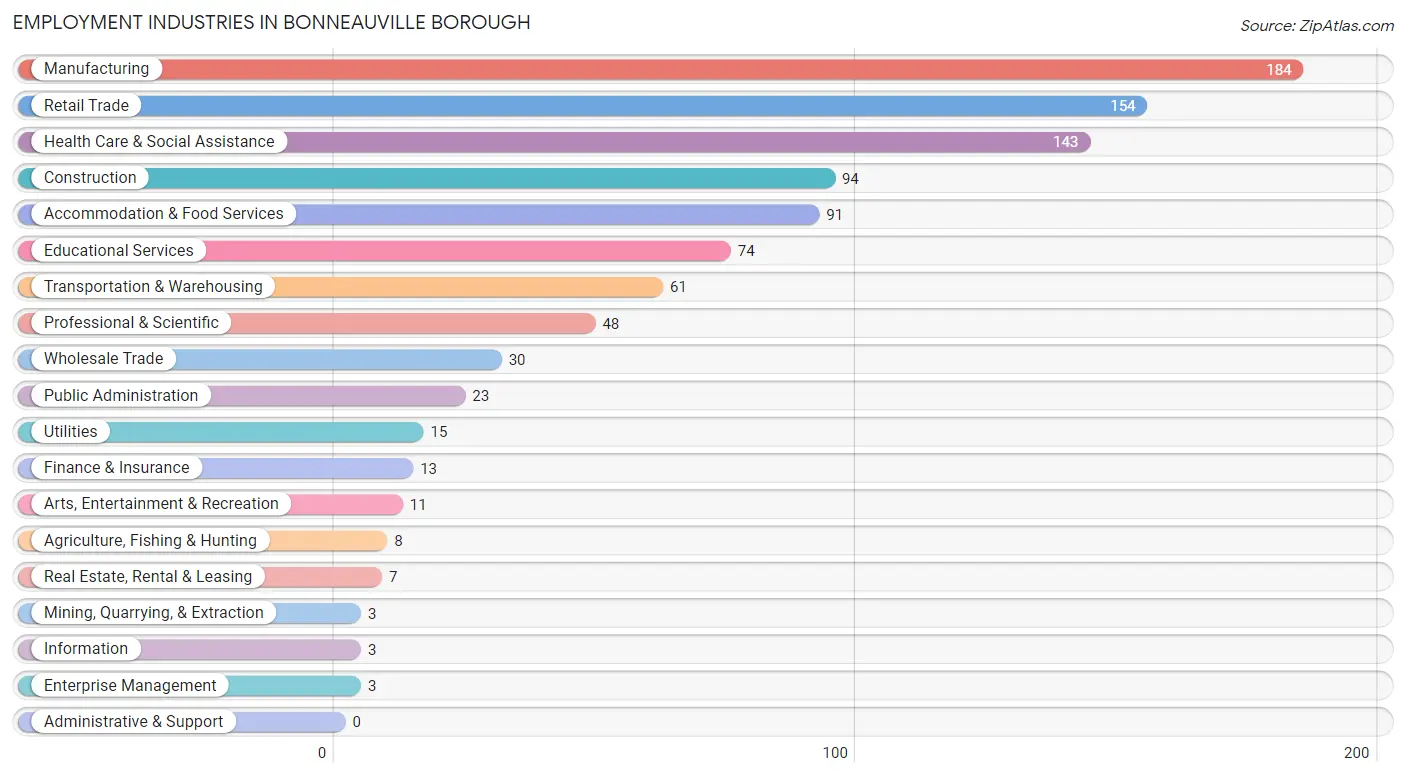
Employment Industries in Bonneauville borough
The major employment industries in Bonneauville borough include Manufacturing (184 | 18.5%), Retail Trade (154 | 15.5%), Health Care & Social Assistance (143 | 14.4%), Construction (94 | 9.5%), and Accommodation & Food Services (91 | 9.1%).
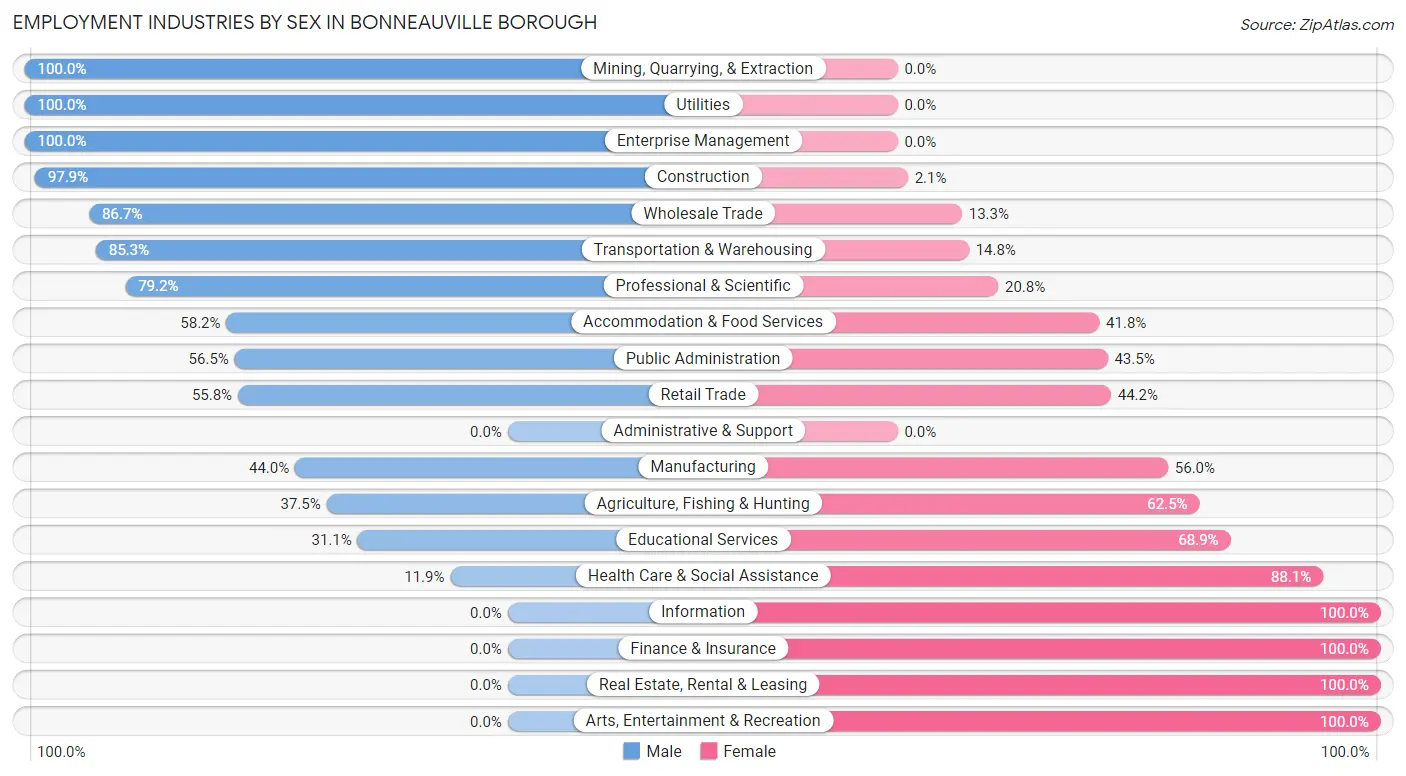
Employment Industries by Sex in Bonneauville borough
The Bonneauville borough industries that see more men than women are Mining, Quarrying, & Extraction (100.0%), Utilities (100.0%), and Enterprise Management (100.0%), whereas the industries that tend to have a higher number of women are Information (100.0%), Finance & Insurance (100.0%), and Real Estate, Rental & Leasing (100.0%).
| Industry | Male | Female |
| Agriculture, Fishing & Hunting | 3 (37.5%) | 5 (62.5%) |
| Mining, Quarrying, & Extraction | 3 (100.0%) | 0 (0.0%) |
| Construction | 92 (97.9%) | 2 (2.1%) |
| Manufacturing | 81 (44.0%) | 103 (56.0%) |
| Wholesale Trade | 26 (86.7%) | 4 (13.3%) |
| Retail Trade | 86 (55.8%) | 68 (44.2%) |
| Transportation & Warehousing | 52 (85.3%) | 9 (14.7%) |
| Utilities | 15 (100.0%) | 0 (0.0%) |
| Information | 0 (0.0%) | 3 (100.0%) |
| Finance & Insurance | 0 (0.0%) | 13 (100.0%) |
| Real Estate, Rental & Leasing | 0 (0.0%) | 7 (100.0%) |
| Professional & Scientific | 38 (79.2%) | 10 (20.8%) |
| Enterprise Management | 3 (100.0%) | 0 (0.0%) |
| Administrative & Support | 0 (0.0%) | 0 (0.0%) |
| Educational Services | 23 (31.1%) | 51 (68.9%) |
| Health Care & Social Assistance | 17 (11.9%) | 126 (88.1%) |
| Arts, Entertainment & Recreation | 0 (0.0%) | 11 (100.0%) |
| Accommodation & Food Services | 53 (58.2%) | 38 (41.8%) |
| Public Administration | 13 (56.5%) | 10 (43.5%) |
| Total | 518 (52.1%) | 477 (47.9%) |
Education in Bonneauville borough
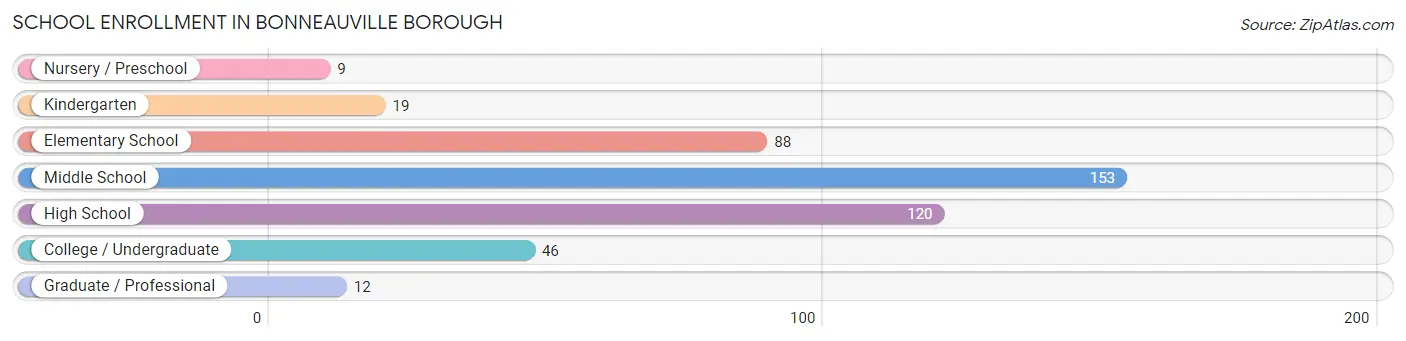
School Enrollment in Bonneauville borough
The most common levels of schooling among the 447 students in Bonneauville borough are middle school (153 | 34.2%), high school (120 | 26.9%), and elementary school (88 | 19.7%).
| School Level | # Students | % Students |
| Nursery / Preschool | 9 | 2.0% |
| Kindergarten | 19 | 4.3% |
| Elementary School | 88 | 19.7% |
| Middle School | 153 | 34.2% |
| High School | 120 | 26.9% |
| College / Undergraduate | 46 | 10.3% |
| Graduate / Professional | 12 | 2.7% |
| Total | 447 | 100.0% |
School Enrollment by Age by Funding Source in Bonneauville borough
Out of a total of 447 students who are enrolled in schools in Bonneauville borough, 64 (14.3%) attend a private institution, while the remaining 383 (85.7%) are enrolled in public schools. The age group of 3 to 4 year olds has the highest likelihood of being enrolled in private schools, with 6 (100.0% in the age bracket) enrolled. Conversely, the age group of 25 to 34 year olds has the lowest likelihood of being enrolled in a private school, with 2 (100.0% in the age bracket) attending a public institution.
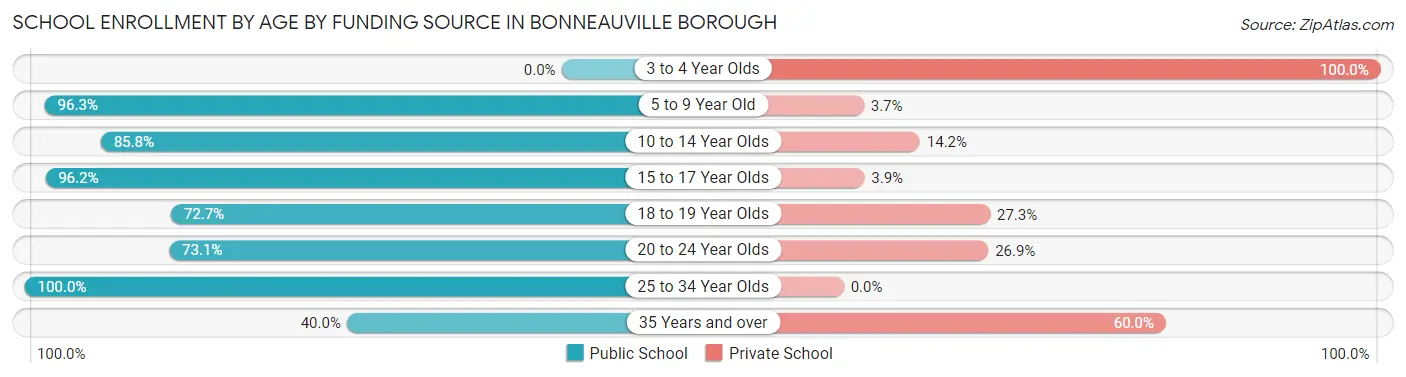
| Age Bracket | Public School | Private School |
| 3 to 4 Year Olds | 0 (0.0%) | 6 (100.0%) |
| 5 to 9 Year Old | 103 (96.3%) | 4 (3.7%) |
| 10 to 14 Year Olds | 133 (85.8%) | 22 (14.2%) |
| 15 to 17 Year Olds | 100 (96.2%) | 4 (3.8%) |
| 18 to 19 Year Olds | 16 (72.7%) | 6 (27.3%) |
| 20 to 24 Year Olds | 19 (73.1%) | 7 (26.9%) |
| 25 to 34 Year Olds | 2 (100.0%) | 0 (0.0%) |
| 35 Years and over | 10 (40.0%) | 15 (60.0%) |
| Total | 383 (85.7%) | 64 (14.3%) |
Educational Attainment by Field of Study in Bonneauville borough
Business (48 | 26.5%), education (46 | 25.4%), science & technology (29 | 16.0%), arts & humanities (22 | 12.1%), and psychology (9 | 5.0%) are the most common fields of study among 181 individuals in Bonneauville borough who have obtained a bachelor's degree or higher.
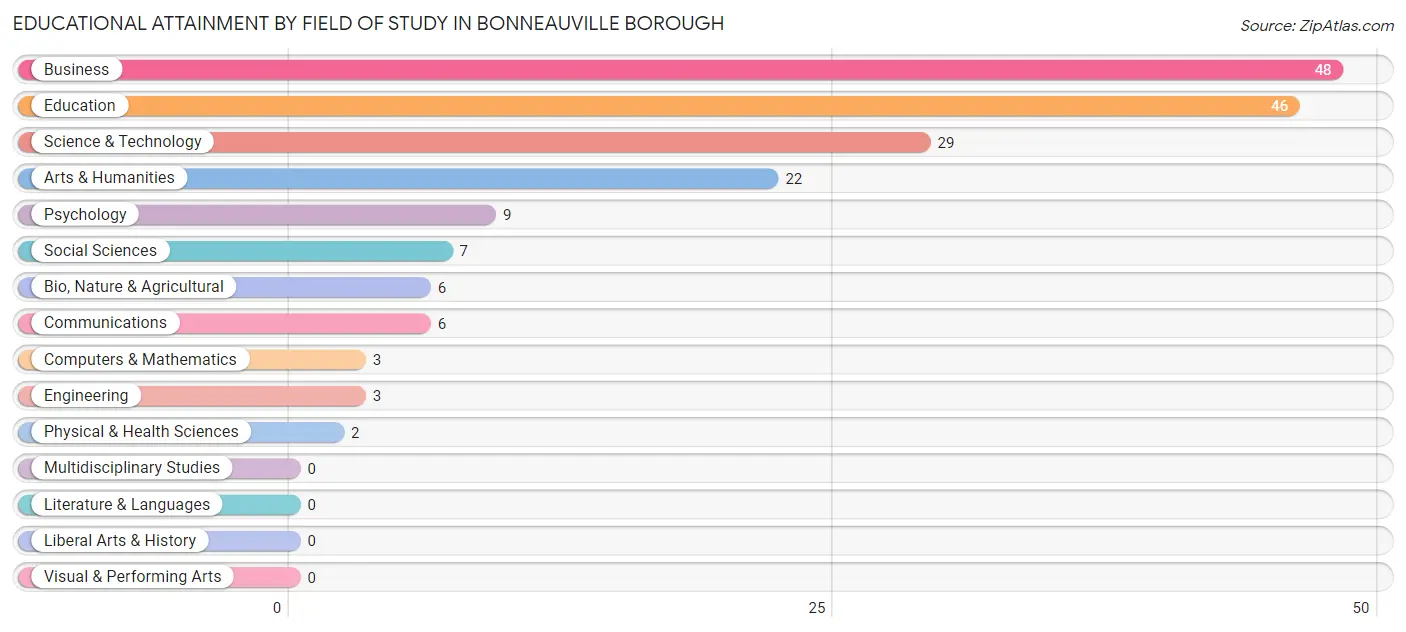
| Field of Study | # Graduates | % Graduates |
| Computers & Mathematics | 3 | 1.7% |
| Bio, Nature & Agricultural | 6 | 3.3% |
| Physical & Health Sciences | 2 | 1.1% |
| Psychology | 9 | 5.0% |
| Social Sciences | 7 | 3.9% |
| Engineering | 3 | 1.7% |
| Multidisciplinary Studies | 0 | 0.0% |
| Science & Technology | 29 | 16.0% |
| Business | 48 | 26.5% |
| Education | 46 | 25.4% |
| Literature & Languages | 0 | 0.0% |
| Liberal Arts & History | 0 | 0.0% |
| Visual & Performing Arts | 0 | 0.0% |
| Communications | 6 | 3.3% |
| Arts & Humanities | 22 | 12.1% |
| Total | 181 | 100.0% |
Transportation & Commute in Bonneauville borough
Vehicle Availability by Sex in Bonneauville borough
The most prevalent vehicle ownership categories in Bonneauville borough are males with 2 vehicles (208, accounting for 42.4%) and females with 2 vehicles (201, making up 44.8%).
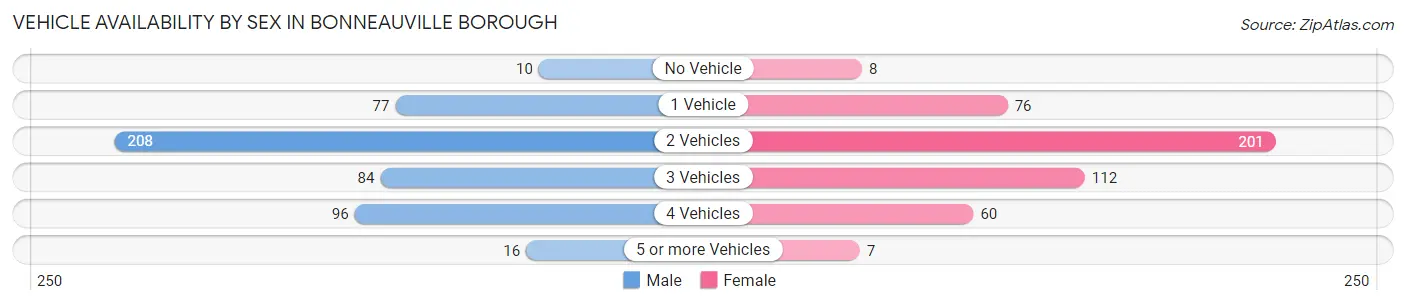
| Vehicles Available | Male | Female |
| No Vehicle | 10 (2.0%) | 8 (1.7%) |
| 1 Vehicle | 77 (15.7%) | 76 (16.4%) |
| 2 Vehicles | 208 (42.4%) | 201 (43.3%) |
| 3 Vehicles | 84 (17.1%) | 112 (24.1%) |
| 4 Vehicles | 96 (19.6%) | 60 (12.9%) |
| 5 or more Vehicles | 16 (3.3%) | 7 (1.5%) |
| Total | 491 (100.0%) | 464 (100.0%) |
Commute Time in Bonneauville borough
The most frequently occuring commute durations in Bonneauville borough are 15 to 19 minutes (201 commuters, 21.4%), 10 to 14 minutes (146 commuters, 15.5%), and 45 to 59 minutes (132 commuters, 14.1%).
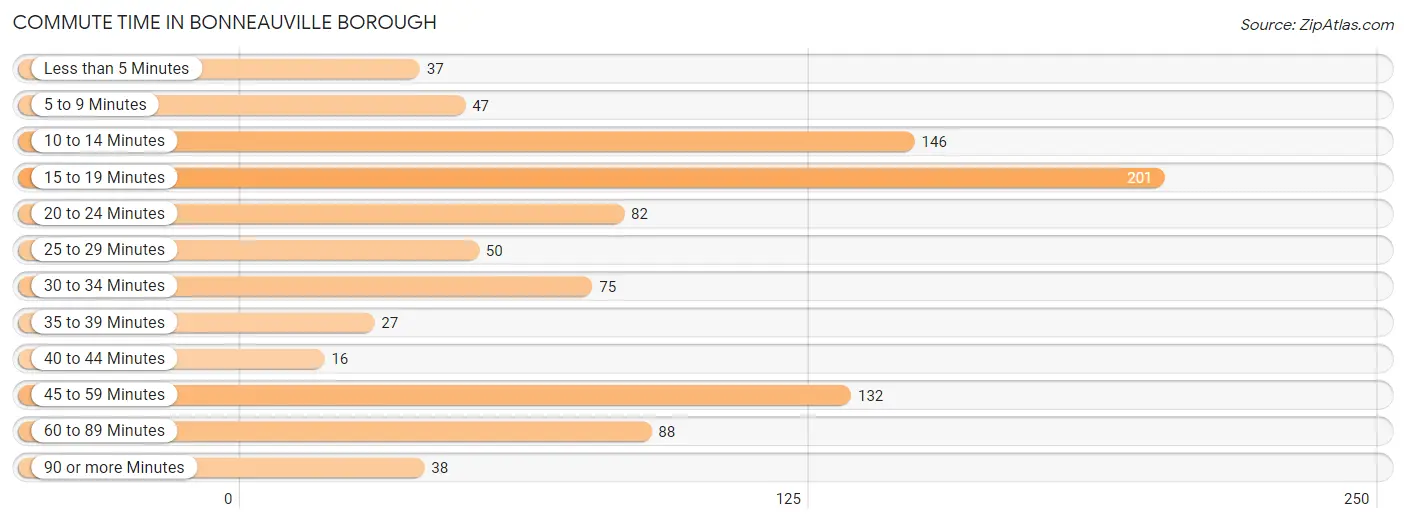
| Commute Time | # Commuters | % Commuters |
| Less than 5 Minutes | 37 | 3.9% |
| 5 to 9 Minutes | 47 | 5.0% |
| 10 to 14 Minutes | 146 | 15.5% |
| 15 to 19 Minutes | 201 | 21.4% |
| 20 to 24 Minutes | 82 | 8.7% |
| 25 to 29 Minutes | 50 | 5.3% |
| 30 to 34 Minutes | 75 | 8.0% |
| 35 to 39 Minutes | 27 | 2.9% |
| 40 to 44 Minutes | 16 | 1.7% |
| 45 to 59 Minutes | 132 | 14.1% |
| 60 to 89 Minutes | 88 | 9.4% |
| 90 or more Minutes | 38 | 4.1% |
Commute Time by Sex in Bonneauville borough
The most common commute times in Bonneauville borough are 45 to 59 minutes (86 commuters, 17.5%) for males and 15 to 19 minutes (126 commuters, 28.1%) for females.
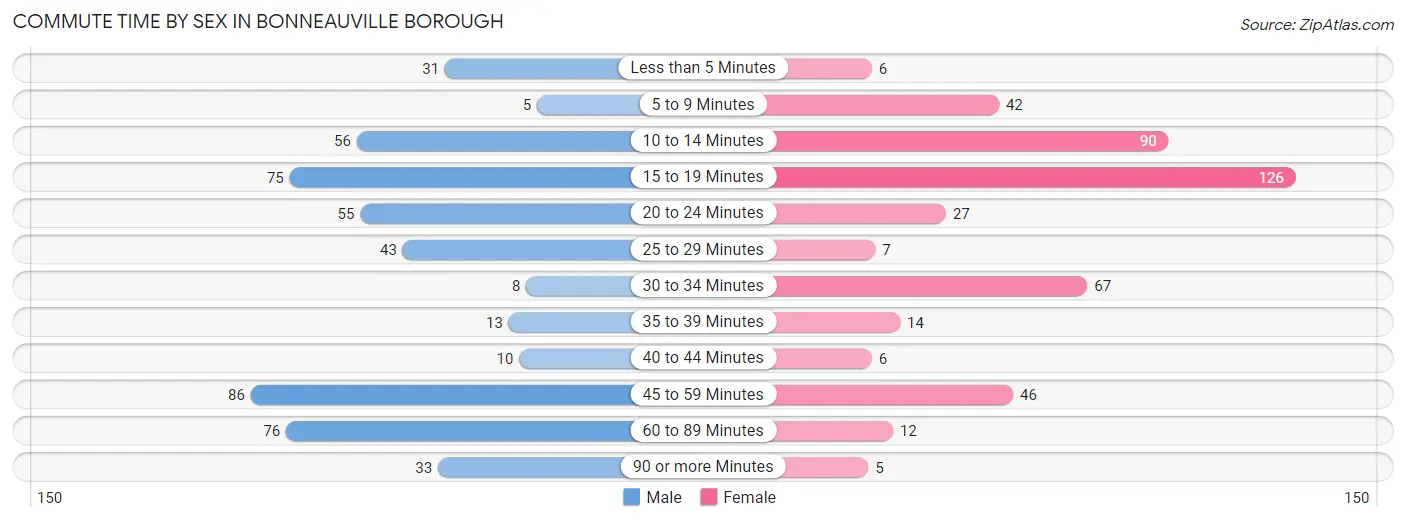
| Commute Time | Male | Female |
| Less than 5 Minutes | 31 (6.3%) | 6 (1.3%) |
| 5 to 9 Minutes | 5 (1.0%) | 42 (9.4%) |
| 10 to 14 Minutes | 56 (11.4%) | 90 (20.1%) |
| 15 to 19 Minutes | 75 (15.3%) | 126 (28.1%) |
| 20 to 24 Minutes | 55 (11.2%) | 27 (6.0%) |
| 25 to 29 Minutes | 43 (8.8%) | 7 (1.6%) |
| 30 to 34 Minutes | 8 (1.6%) | 67 (15.0%) |
| 35 to 39 Minutes | 13 (2.6%) | 14 (3.1%) |
| 40 to 44 Minutes | 10 (2.0%) | 6 (1.3%) |
| 45 to 59 Minutes | 86 (17.5%) | 46 (10.3%) |
| 60 to 89 Minutes | 76 (15.5%) | 12 (2.7%) |
| 90 or more Minutes | 33 (6.7%) | 5 (1.1%) |
Time of Departure to Work by Sex in Bonneauville borough
The most frequent times of departure to work in Bonneauville borough are 4:00 PM to 11:59 PM (103, 21.0%) for males and 8:30 AM to 8:59 AM (90, 20.1%) for females.
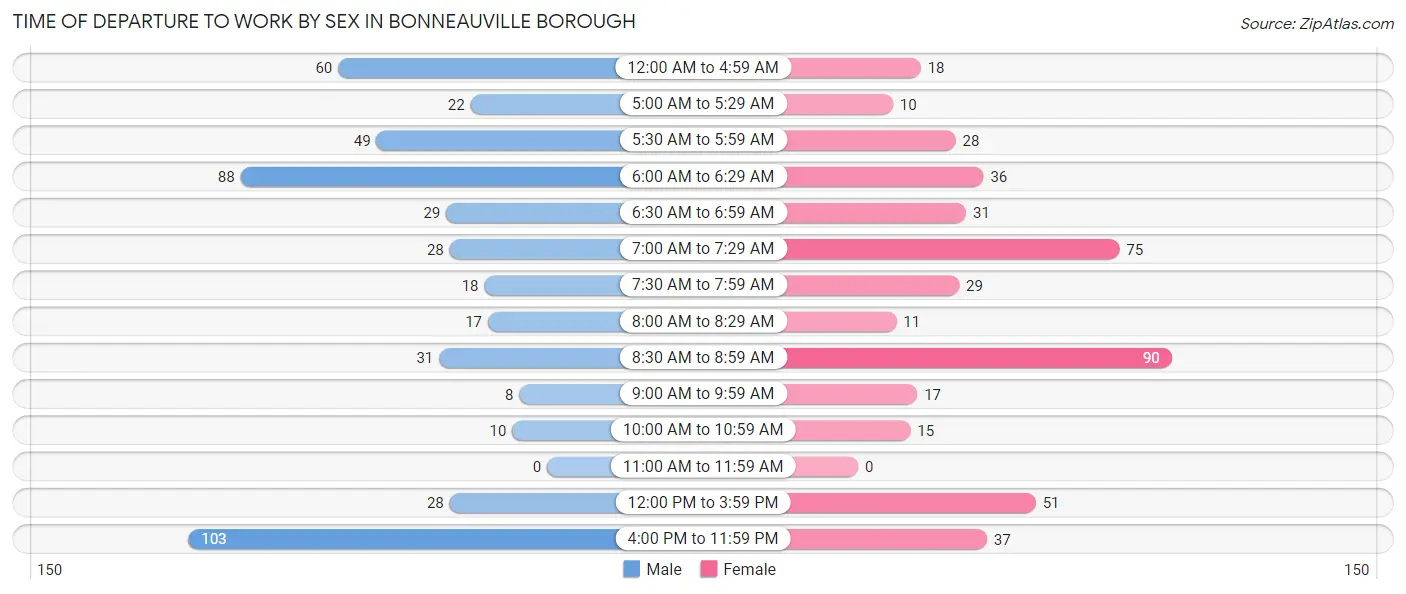
| Time of Departure | Male | Female |
| 12:00 AM to 4:59 AM | 60 (12.2%) | 18 (4.0%) |
| 5:00 AM to 5:29 AM | 22 (4.5%) | 10 (2.2%) |
| 5:30 AM to 5:59 AM | 49 (10.0%) | 28 (6.2%) |
| 6:00 AM to 6:29 AM | 88 (17.9%) | 36 (8.0%) |
| 6:30 AM to 6:59 AM | 29 (5.9%) | 31 (6.9%) |
| 7:00 AM to 7:29 AM | 28 (5.7%) | 75 (16.7%) |
| 7:30 AM to 7:59 AM | 18 (3.7%) | 29 (6.5%) |
| 8:00 AM to 8:29 AM | 17 (3.5%) | 11 (2.5%) |
| 8:30 AM to 8:59 AM | 31 (6.3%) | 90 (20.1%) |
| 9:00 AM to 9:59 AM | 8 (1.6%) | 17 (3.8%) |
| 10:00 AM to 10:59 AM | 10 (2.0%) | 15 (3.4%) |
| 11:00 AM to 11:59 AM | 0 (0.0%) | 0 (0.0%) |
| 12:00 PM to 3:59 PM | 28 (5.7%) | 51 (11.4%) |
| 4:00 PM to 11:59 PM | 103 (21.0%) | 37 (8.3%) |
| Total | 491 (100.0%) | 448 (100.0%) |
Housing Occupancy in Bonneauville borough
Occupancy by Ownership in Bonneauville borough
Of the total 739 dwellings in Bonneauville borough, owner-occupied units account for 500 (67.7%), while renter-occupied units make up 239 (32.3%).
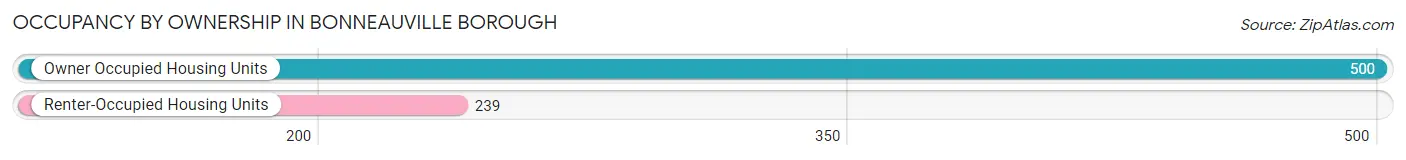
| Occupancy | # Housing Units | % Housing Units |
| Owner Occupied Housing Units | 500 | 67.7% |
| Renter-Occupied Housing Units | 239 | 32.3% |
| Total Occupied Housing Units | 739 | 100.0% |
Occupancy by Household Size in Bonneauville borough
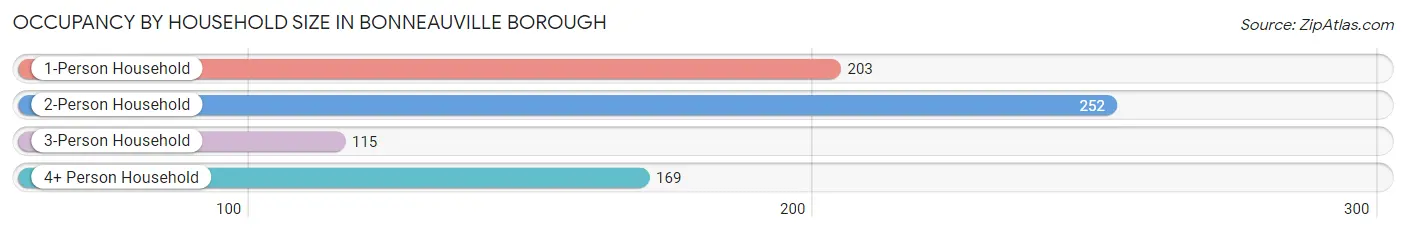
| Household Size | # Housing Units | % Housing Units |
| 1-Person Household | 203 | 27.5% |
| 2-Person Household | 252 | 34.1% |
| 3-Person Household | 115 | 15.6% |
| 4+ Person Household | 169 | 22.9% |
| Total Housing Units | 739 | 100.0% |
Occupancy by Ownership by Household Size in Bonneauville borough
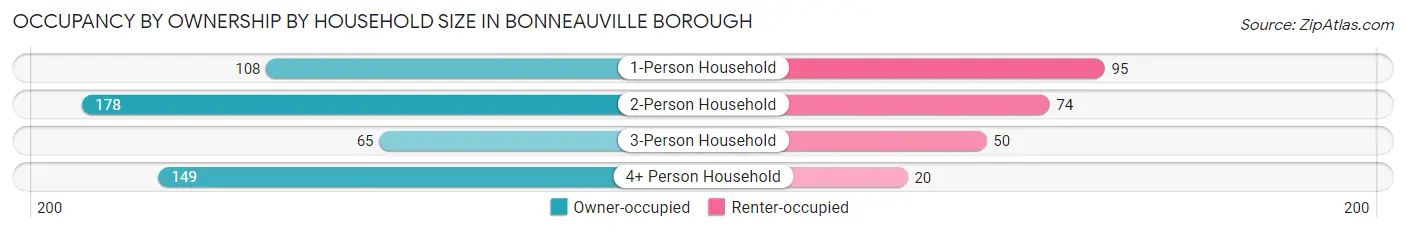
| Household Size | Owner-occupied | Renter-occupied |
| 1-Person Household | 108 (53.2%) | 95 (46.8%) |
| 2-Person Household | 178 (70.6%) | 74 (29.4%) |
| 3-Person Household | 65 (56.5%) | 50 (43.5%) |
| 4+ Person Household | 149 (88.2%) | 20 (11.8%) |
| Total Housing Units | 500 (67.7%) | 239 (32.3%) |
Occupancy by Educational Attainment in Bonneauville borough
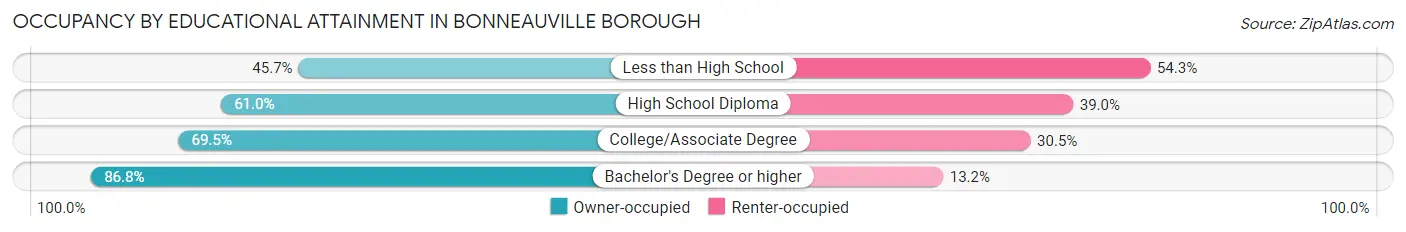
| Household Size | Owner-occupied | Renter-occupied |
| Less than High School | 16 (45.7%) | 19 (54.3%) |
| High School Diploma | 169 (61.0%) | 108 (39.0%) |
| College/Associate Degree | 223 (69.5%) | 98 (30.5%) |
| Bachelor's Degree or higher | 92 (86.8%) | 14 (13.2%) |
Occupancy by Age of Householder in Bonneauville borough
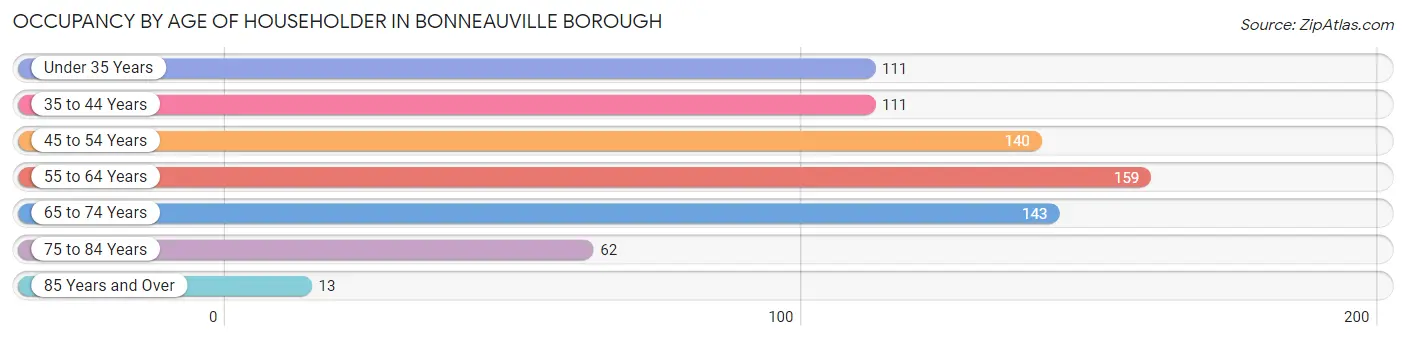
| Age Bracket | # Households | % Households |
| Under 35 Years | 111 | 15.0% |
| 35 to 44 Years | 111 | 15.0% |
| 45 to 54 Years | 140 | 18.9% |
| 55 to 64 Years | 159 | 21.5% |
| 65 to 74 Years | 143 | 19.4% |
| 75 to 84 Years | 62 | 8.4% |
| 85 Years and Over | 13 | 1.8% |
| Total | 739 | 100.0% |
Housing Finances in Bonneauville borough
Median Income by Occupancy in Bonneauville borough
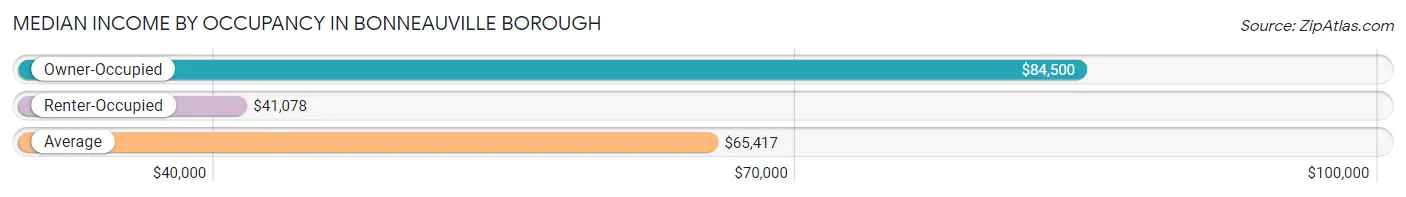
| Occupancy Type | # Households | Median Income |
| Owner-Occupied | 500 (67.7%) | $84,500 |
| Renter-Occupied | 239 (32.3%) | $41,078 |
| Average | 739 (100.0%) | $65,417 |
Occupancy by Householder Income Bracket in Bonneauville borough
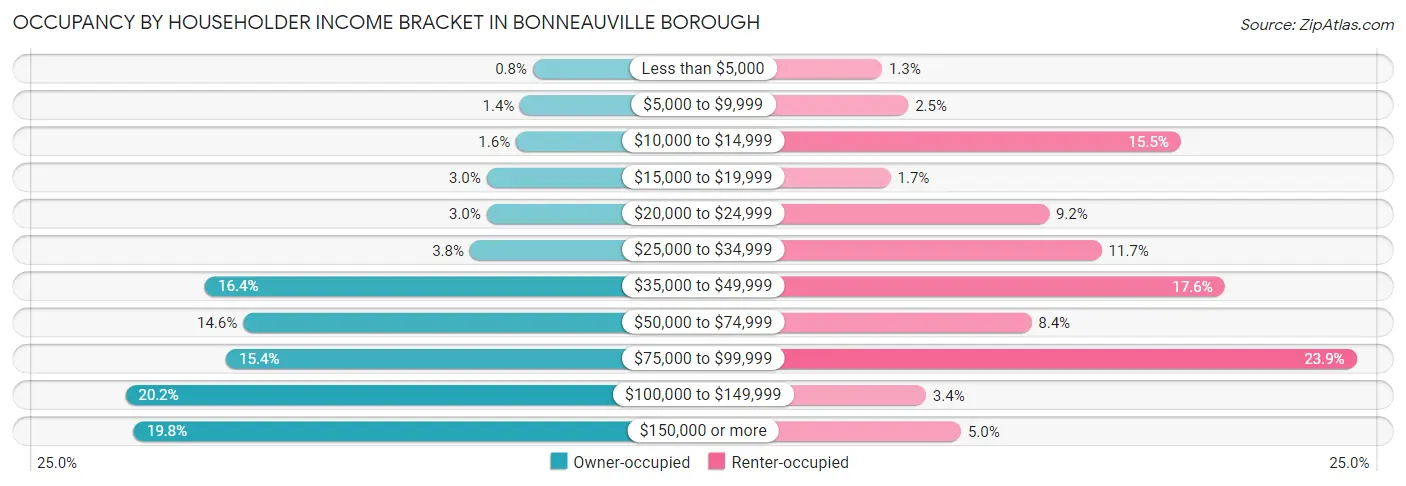
| Income Bracket | Owner-occupied | Renter-occupied |
| Less than $5,000 | 4 (0.8%) | 3 (1.3%) |
| $5,000 to $9,999 | 7 (1.4%) | 6 (2.5%) |
| $10,000 to $14,999 | 8 (1.6%) | 37 (15.5%) |
| $15,000 to $19,999 | 15 (3.0%) | 4 (1.7%) |
| $20,000 to $24,999 | 15 (3.0%) | 22 (9.2%) |
| $25,000 to $34,999 | 19 (3.8%) | 28 (11.7%) |
| $35,000 to $49,999 | 82 (16.4%) | 42 (17.6%) |
| $50,000 to $74,999 | 73 (14.6%) | 20 (8.4%) |
| $75,000 to $99,999 | 77 (15.4%) | 57 (23.8%) |
| $100,000 to $149,999 | 101 (20.2%) | 8 (3.4%) |
| $150,000 or more | 99 (19.8%) | 12 (5.0%) |
| Total | 500 (100.0%) | 239 (100.0%) |
Monthly Housing Cost Tiers in Bonneauville borough
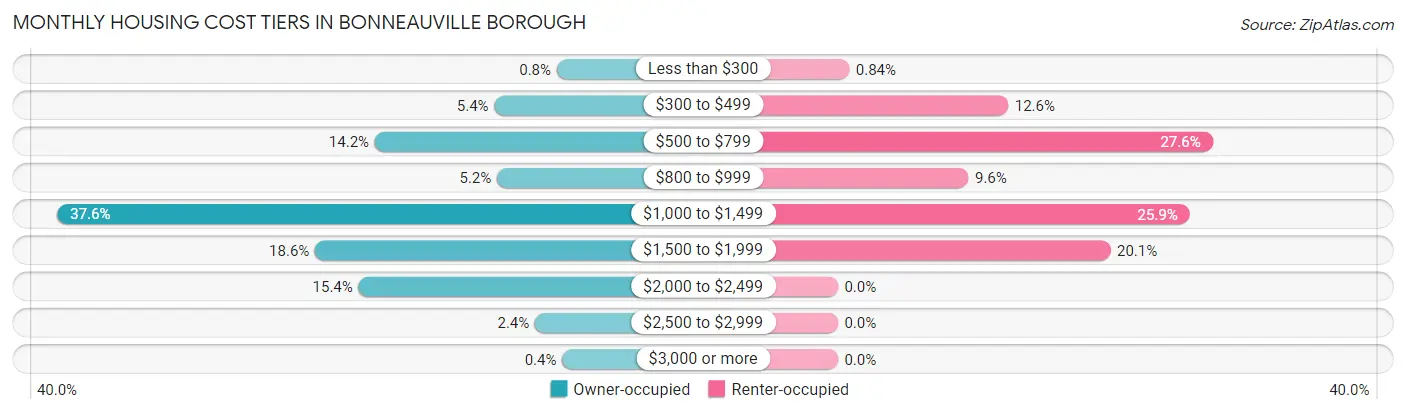
| Monthly Cost | Owner-occupied | Renter-occupied |
| Less than $300 | 4 (0.8%) | 2 (0.8%) |
| $300 to $499 | 27 (5.4%) | 30 (12.6%) |
| $500 to $799 | 71 (14.2%) | 66 (27.6%) |
| $800 to $999 | 26 (5.2%) | 23 (9.6%) |
| $1,000 to $1,499 | 188 (37.6%) | 62 (25.9%) |
| $1,500 to $1,999 | 93 (18.6%) | 48 (20.1%) |
| $2,000 to $2,499 | 77 (15.4%) | 0 (0.0%) |
| $2,500 to $2,999 | 12 (2.4%) | 0 (0.0%) |
| $3,000 or more | 2 (0.4%) | 0 (0.0%) |
| Total | 500 (100.0%) | 239 (100.0%) |
Physical Housing Characteristics in Bonneauville borough
Housing Structures in Bonneauville borough
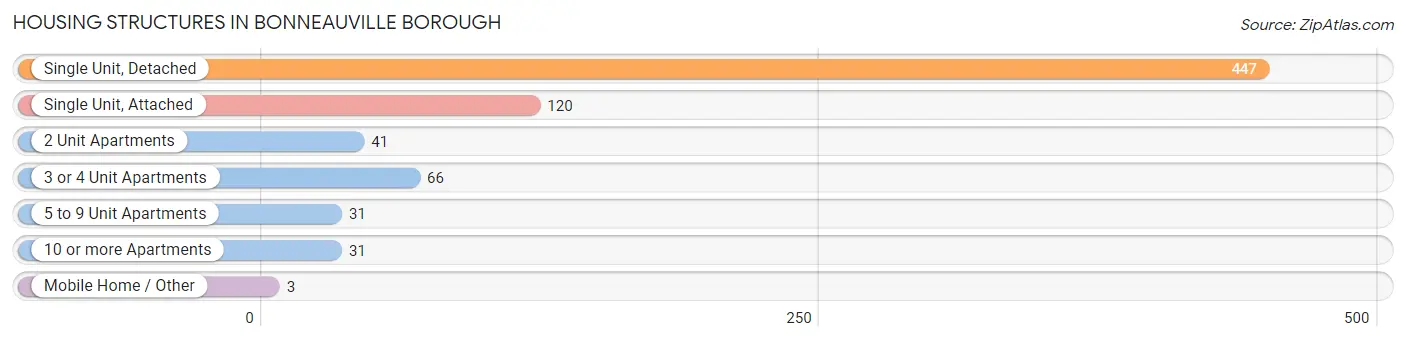
| Structure Type | # Housing Units | % Housing Units |
| Single Unit, Detached | 447 | 60.5% |
| Single Unit, Attached | 120 | 16.2% |
| 2 Unit Apartments | 41 | 5.6% |
| 3 or 4 Unit Apartments | 66 | 8.9% |
| 5 to 9 Unit Apartments | 31 | 4.2% |
| 10 or more Apartments | 31 | 4.2% |
| Mobile Home / Other | 3 | 0.4% |
| Total | 739 | 100.0% |
Housing Structures by Occupancy in Bonneauville borough
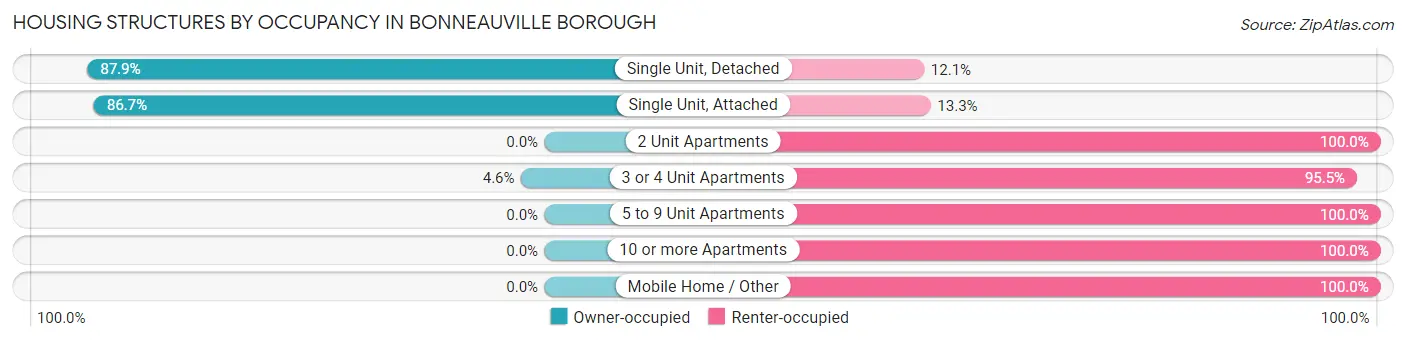
| Structure Type | Owner-occupied | Renter-occupied |
| Single Unit, Detached | 393 (87.9%) | 54 (12.1%) |
| Single Unit, Attached | 104 (86.7%) | 16 (13.3%) |
| 2 Unit Apartments | 0 (0.0%) | 41 (100.0%) |
| 3 or 4 Unit Apartments | 3 (4.5%) | 63 (95.5%) |
| 5 to 9 Unit Apartments | 0 (0.0%) | 31 (100.0%) |
| 10 or more Apartments | 0 (0.0%) | 31 (100.0%) |
| Mobile Home / Other | 0 (0.0%) | 3 (100.0%) |
| Total | 500 (67.7%) | 239 (32.3%) |
Housing Structures by Number of Rooms in Bonneauville borough
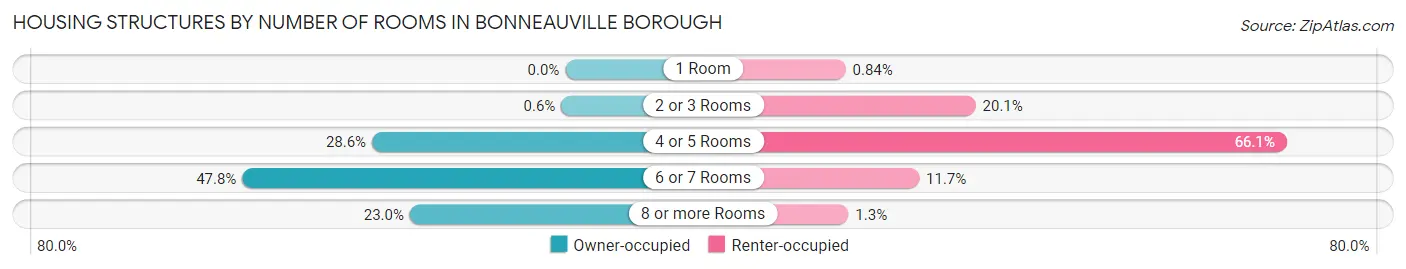
| Number of Rooms | Owner-occupied | Renter-occupied |
| 1 Room | 0 (0.0%) | 2 (0.8%) |
| 2 or 3 Rooms | 3 (0.6%) | 48 (20.1%) |
| 4 or 5 Rooms | 143 (28.6%) | 158 (66.1%) |
| 6 or 7 Rooms | 239 (47.8%) | 28 (11.7%) |
| 8 or more Rooms | 115 (23.0%) | 3 (1.3%) |
| Total | 500 (100.0%) | 239 (100.0%) |
Housing Structure by Heating Type in Bonneauville borough
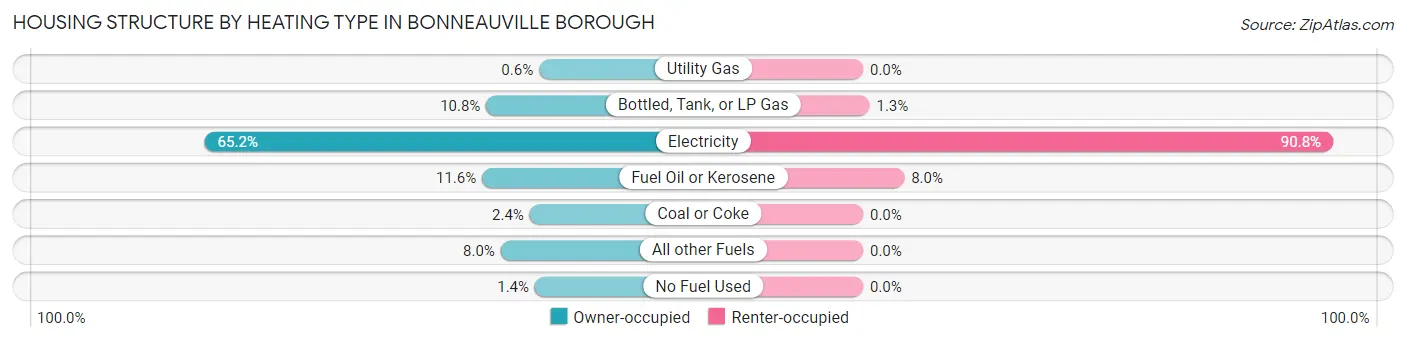
| Heating Type | Owner-occupied | Renter-occupied |
| Utility Gas | 3 (0.6%) | 0 (0.0%) |
| Bottled, Tank, or LP Gas | 54 (10.8%) | 3 (1.3%) |
| Electricity | 326 (65.2%) | 217 (90.8%) |
| Fuel Oil or Kerosene | 58 (11.6%) | 19 (8.0%) |
| Coal or Coke | 12 (2.4%) | 0 (0.0%) |
| All other Fuels | 40 (8.0%) | 0 (0.0%) |
| No Fuel Used | 7 (1.4%) | 0 (0.0%) |
| Total | 500 (100.0%) | 239 (100.0%) |
Household Vehicle Usage in Bonneauville borough
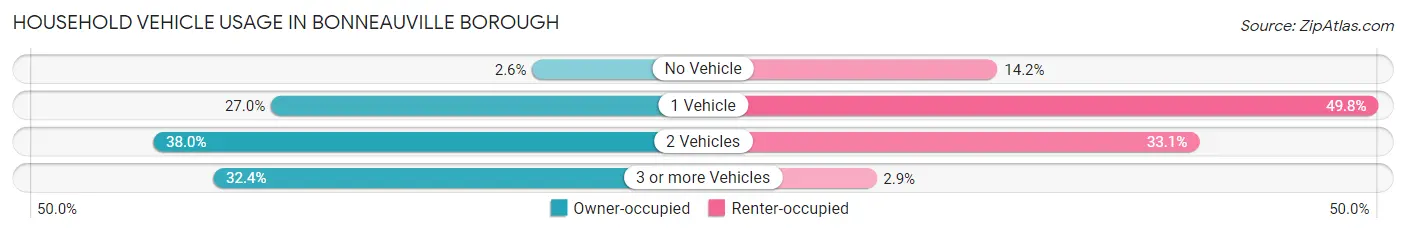
| Vehicles per Household | Owner-occupied | Renter-occupied |
| No Vehicle | 13 (2.6%) | 34 (14.2%) |
| 1 Vehicle | 135 (27.0%) | 119 (49.8%) |
| 2 Vehicles | 190 (38.0%) | 79 (33.1%) |
| 3 or more Vehicles | 162 (32.4%) | 7 (2.9%) |
| Total | 500 (100.0%) | 239 (100.0%) |
Real Estate & Mortgages in Bonneauville borough
Real Estate and Mortgage Overview in Bonneauville borough
| Characteristic | Without Mortgage | With Mortgage |
| Housing Units | 130 | 370 |
| Median Property Value | $217,600 | $208,400 |
| Median Household Income | $53,571 | $85 |
| Monthly Housing Costs | $634 | $2 |
| Real Estate Taxes | $3,262 | $13 |
Property Value by Mortgage Status in Bonneauville borough
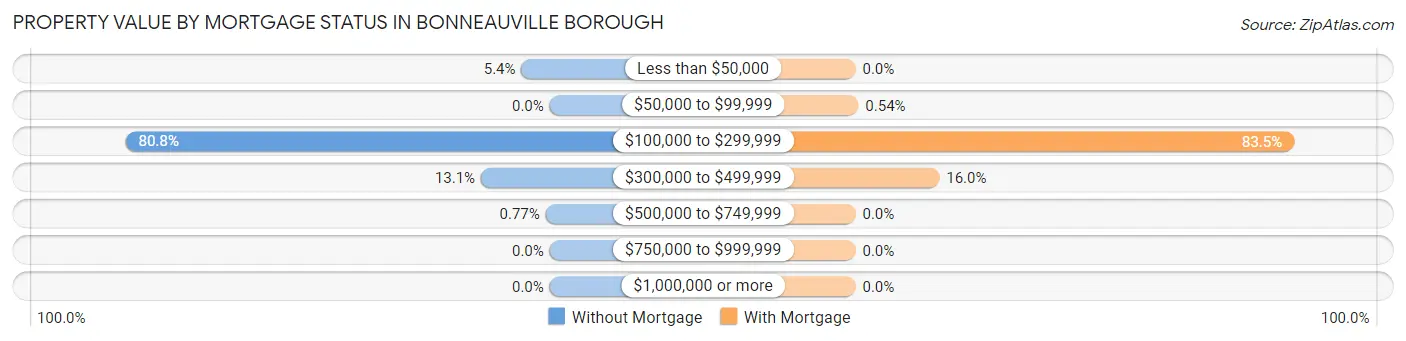
| Property Value | Without Mortgage | With Mortgage |
| Less than $50,000 | 7 (5.4%) | 0 (0.0%) |
| $50,000 to $99,999 | 0 (0.0%) | 2 (0.5%) |
| $100,000 to $299,999 | 105 (80.8%) | 309 (83.5%) |
| $300,000 to $499,999 | 17 (13.1%) | 59 (16.0%) |
| $500,000 to $749,999 | 1 (0.8%) | 0 (0.0%) |
| $750,000 to $999,999 | 0 (0.0%) | 0 (0.0%) |
| $1,000,000 or more | 0 (0.0%) | 0 (0.0%) |
| Total | 130 (100.0%) | 370 (100.0%) |
Household Income by Mortgage Status in Bonneauville borough
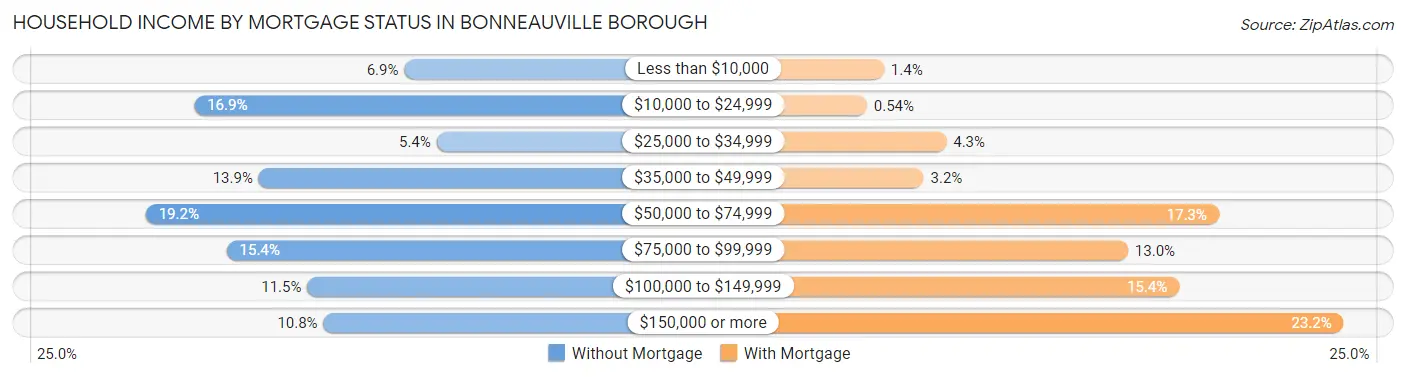
| Household Income | Without Mortgage | With Mortgage |
| Less than $10,000 | 9 (6.9%) | 5 (1.3%) |
| $10,000 to $24,999 | 22 (16.9%) | 2 (0.5%) |
| $25,000 to $34,999 | 7 (5.4%) | 16 (4.3%) |
| $35,000 to $49,999 | 18 (13.9%) | 12 (3.2%) |
| $50,000 to $74,999 | 25 (19.2%) | 64 (17.3%) |
| $75,000 to $99,999 | 20 (15.4%) | 48 (13.0%) |
| $100,000 to $149,999 | 15 (11.5%) | 57 (15.4%) |
| $150,000 or more | 14 (10.8%) | 86 (23.2%) |
| Total | 130 (100.0%) | 370 (100.0%) |
Property Value to Household Income Ratio in Bonneauville borough
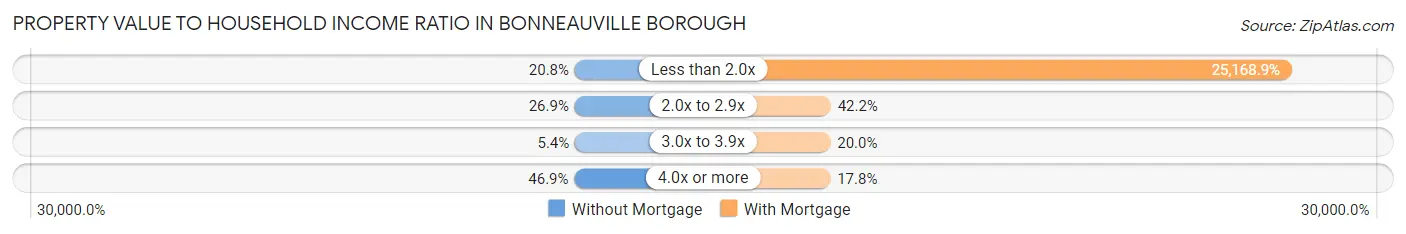
| Value-to-Income Ratio | Without Mortgage | With Mortgage |
| Less than 2.0x | 27 (20.8%) | 93,125 (25,168.9%) |
| 2.0x to 2.9x | 35 (26.9%) | 156 (42.2%) |
| 3.0x to 3.9x | 7 (5.4%) | 74 (20.0%) |
| 4.0x or more | 61 (46.9%) | 66 (17.8%) |
| Total | 130 (100.0%) | 370 (100.0%) |
Real Estate Taxes by Mortgage Status in Bonneauville borough
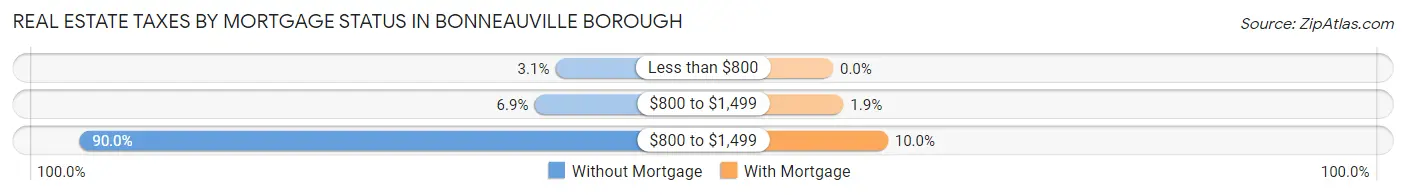
| Property Taxes | Without Mortgage | With Mortgage |
| Less than $800 | 4 (3.1%) | 0 (0.0%) |
| $800 to $1,499 | 9 (6.9%) | 7 (1.9%) |
| $800 to $1,499 | 117 (90.0%) | 37 (10.0%) |
| Total | 130 (100.0%) | 370 (100.0%) |
Health & Disability in Bonneauville borough
Health Insurance Coverage by Age in Bonneauville borough
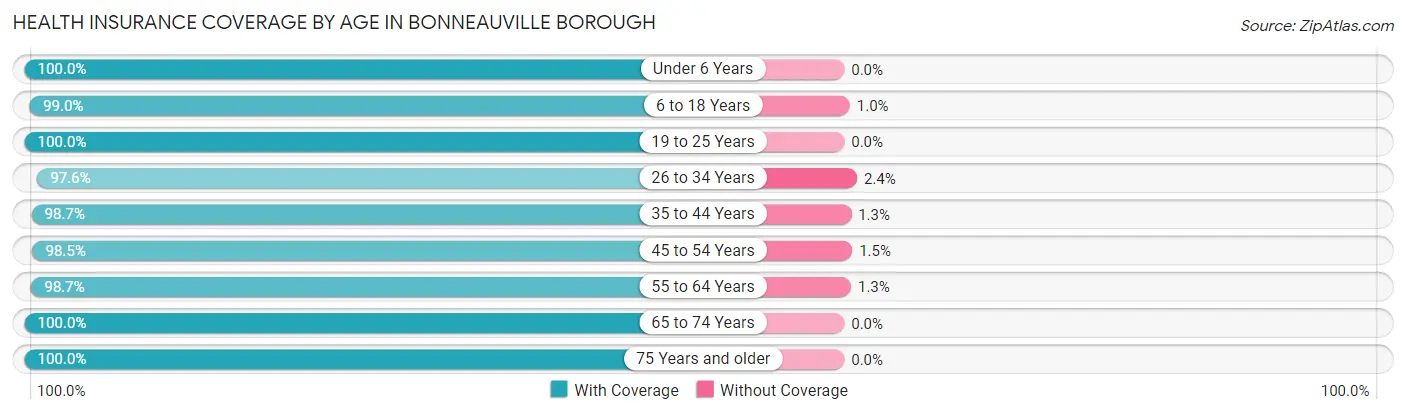
| Age Bracket | With Coverage | Without Coverage |
| Under 6 Years | 97 (100.0%) | 0 (0.0%) |
| 6 to 18 Years | 381 (99.0%) | 4 (1.0%) |
| 19 to 25 Years | 108 (100.0%) | 0 (0.0%) |
| 26 to 34 Years | 206 (97.6%) | 5 (2.4%) |
| 35 to 44 Years | 229 (98.7%) | 3 (1.3%) |
| 45 to 54 Years | 267 (98.5%) | 4 (1.5%) |
| 55 to 64 Years | 236 (98.7%) | 3 (1.3%) |
| 65 to 74 Years | 217 (100.0%) | 0 (0.0%) |
| 75 Years and older | 97 (100.0%) | 0 (0.0%) |
| Total | 1,838 (99.0%) | 19 (1.0%) |
Health Insurance Coverage by Citizenship Status in Bonneauville borough
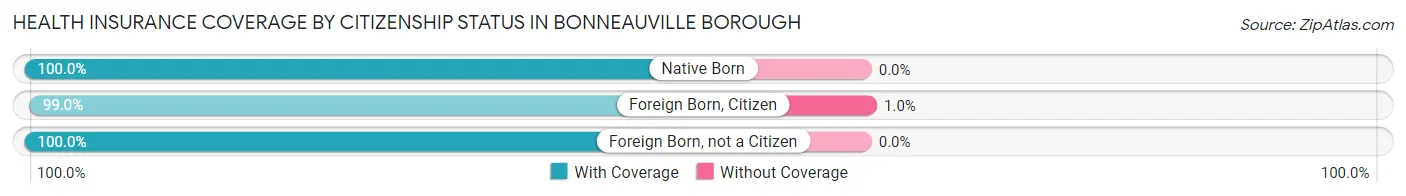
| Citizenship Status | With Coverage | Without Coverage |
| Native Born | 97 (100.0%) | 0 (0.0%) |
| Foreign Born, Citizen | 381 (99.0%) | 4 (1.0%) |
| Foreign Born, not a Citizen | 108 (100.0%) | 0 (0.0%) |
Health Insurance Coverage by Household Income in Bonneauville borough
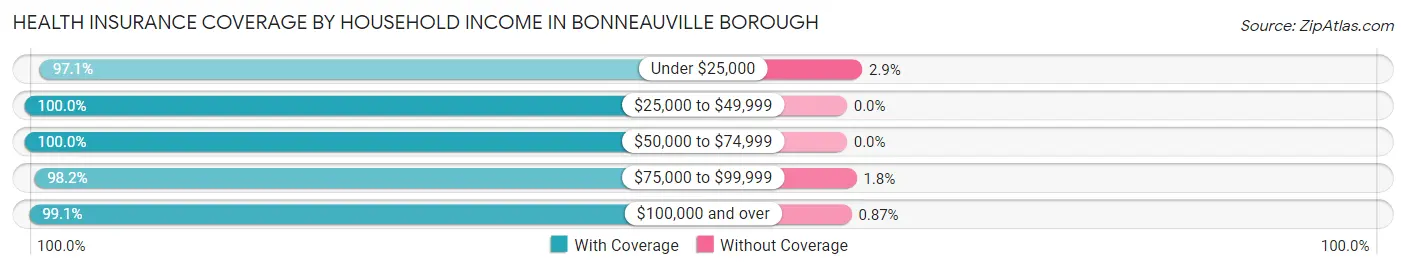
| Household Income | With Coverage | Without Coverage |
| Under $25,000 | 170 (97.1%) | 5 (2.9%) |
| $25,000 to $49,999 | 259 (100.0%) | 0 (0.0%) |
| $50,000 to $74,999 | 231 (100.0%) | 0 (0.0%) |
| $75,000 to $99,999 | 379 (98.2%) | 7 (1.8%) |
| $100,000 and over | 799 (99.1%) | 7 (0.9%) |
Public vs Private Health Insurance Coverage by Age in Bonneauville borough
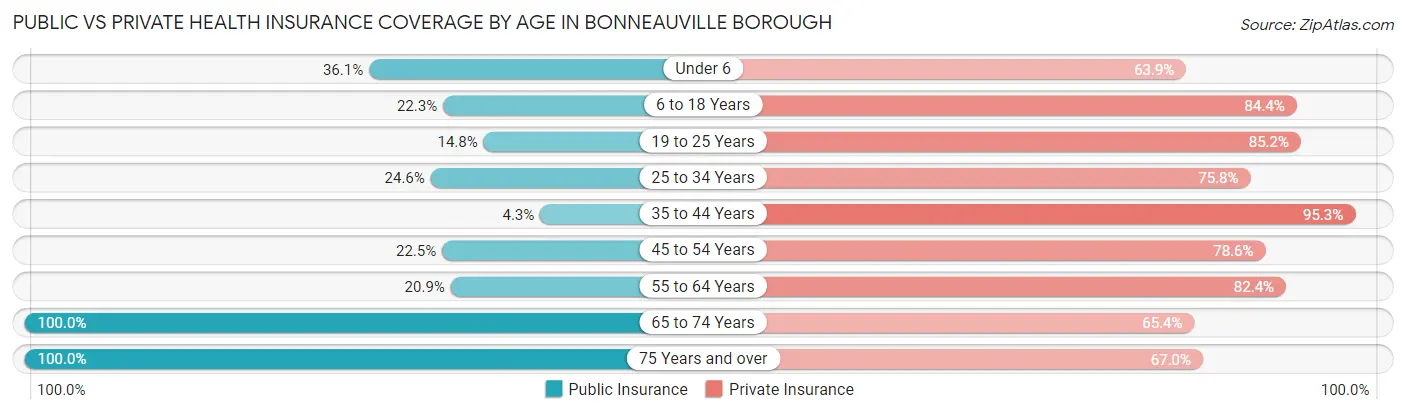
| Age Bracket | Public Insurance | Private Insurance |
| Under 6 | 35 (36.1%) | 62 (63.9%) |
| 6 to 18 Years | 86 (22.3%) | 325 (84.4%) |
| 19 to 25 Years | 16 (14.8%) | 92 (85.2%) |
| 25 to 34 Years | 52 (24.6%) | 160 (75.8%) |
| 35 to 44 Years | 10 (4.3%) | 221 (95.3%) |
| 45 to 54 Years | 61 (22.5%) | 213 (78.6%) |
| 55 to 64 Years | 50 (20.9%) | 197 (82.4%) |
| 65 to 74 Years | 217 (100.0%) | 142 (65.4%) |
| 75 Years and over | 97 (100.0%) | 65 (67.0%) |
| Total | 624 (33.6%) | 1,477 (79.5%) |
Disability Status by Sex by Age in Bonneauville borough
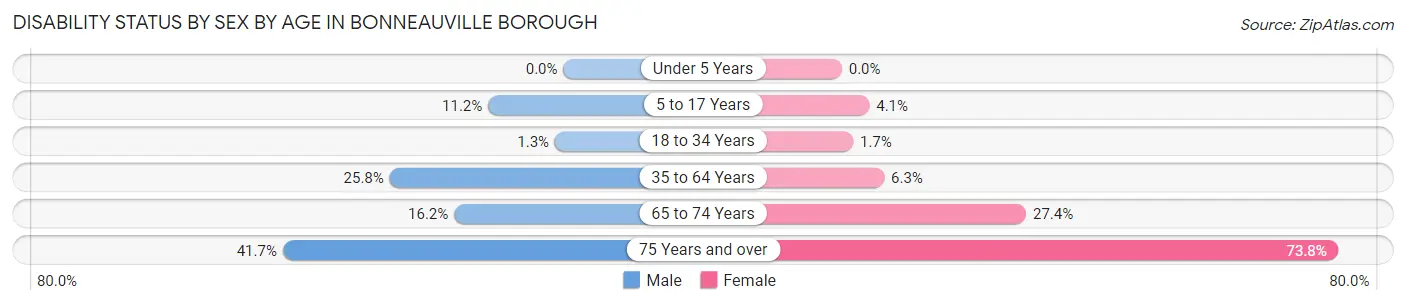
| Age Bracket | Male | Female |
| Under 5 Years | 0 (0.0%) | 0 (0.0%) |
| 5 to 17 Years | 22 (11.2%) | 8 (4.1%) |
| 18 to 34 Years | 2 (1.3%) | 3 (1.7%) |
| 35 to 64 Years | 97 (25.8%) | 23 (6.3%) |
| 65 to 74 Years | 18 (16.2%) | 29 (27.4%) |
| 75 Years and over | 15 (41.7%) | 45 (73.8%) |
Disability Class by Sex by Age in Bonneauville borough
Disability Class: Hearing Difficulty
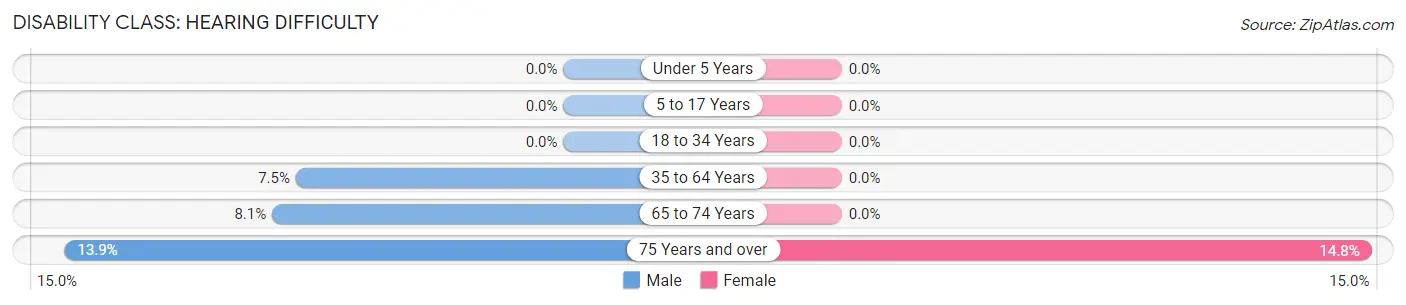
| Age Bracket | Male | Female |
| Under 5 Years | 0 (0.0%) | 0 (0.0%) |
| 5 to 17 Years | 0 (0.0%) | 0 (0.0%) |
| 18 to 34 Years | 0 (0.0%) | 0 (0.0%) |
| 35 to 64 Years | 28 (7.4%) | 0 (0.0%) |
| 65 to 74 Years | 9 (8.1%) | 0 (0.0%) |
| 75 Years and over | 5 (13.9%) | 9 (14.7%) |
Disability Class: Vision Difficulty
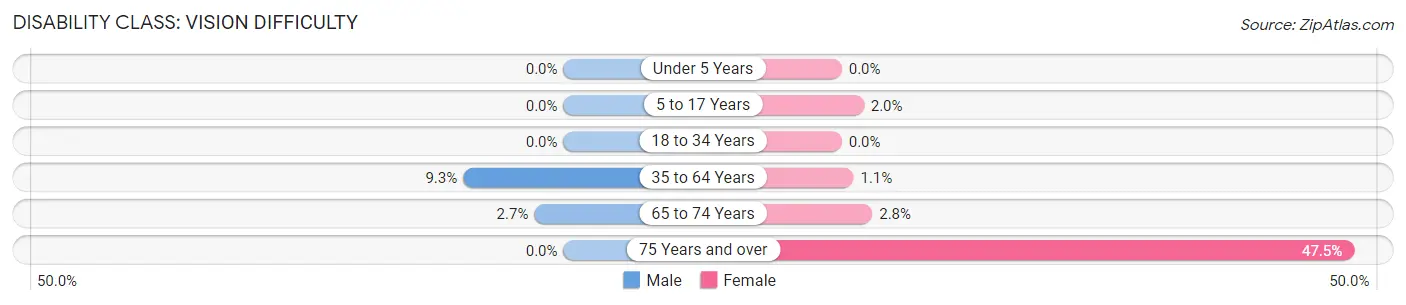
| Age Bracket | Male | Female |
| Under 5 Years | 0 (0.0%) | 0 (0.0%) |
| 5 to 17 Years | 0 (0.0%) | 4 (2.0%) |
| 18 to 34 Years | 0 (0.0%) | 0 (0.0%) |
| 35 to 64 Years | 35 (9.3%) | 4 (1.1%) |
| 65 to 74 Years | 3 (2.7%) | 3 (2.8%) |
| 75 Years and over | 0 (0.0%) | 29 (47.5%) |
Disability Class: Cognitive Difficulty
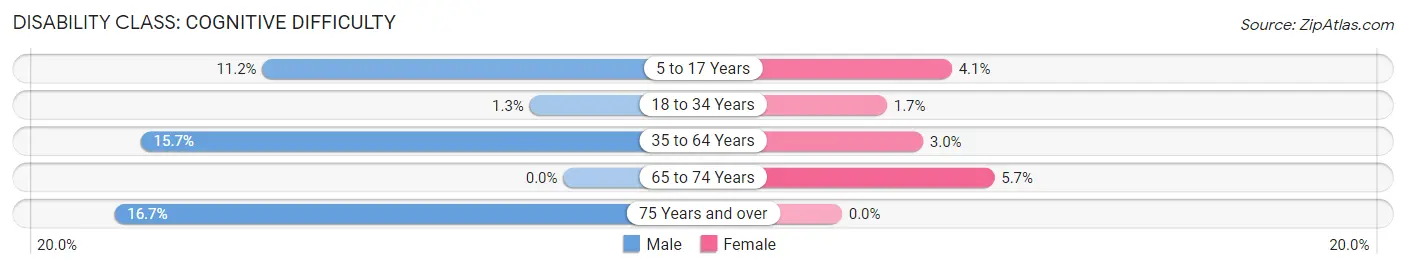
| Age Bracket | Male | Female |
| 5 to 17 Years | 22 (11.2%) | 8 (4.1%) |
| 18 to 34 Years | 2 (1.3%) | 3 (1.7%) |
| 35 to 64 Years | 59 (15.7%) | 11 (3.0%) |
| 65 to 74 Years | 0 (0.0%) | 6 (5.7%) |
| 75 Years and over | 6 (16.7%) | 0 (0.0%) |
Disability Class: Ambulatory Difficulty
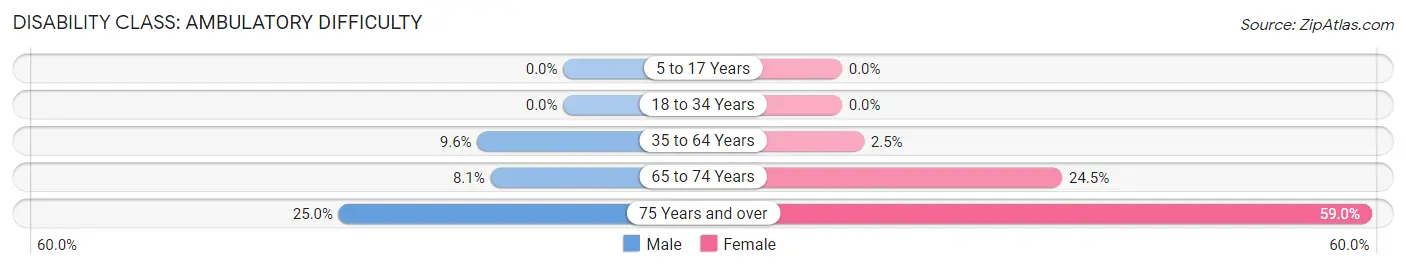
| Age Bracket | Male | Female |
| 5 to 17 Years | 0 (0.0%) | 0 (0.0%) |
| 18 to 34 Years | 0 (0.0%) | 0 (0.0%) |
| 35 to 64 Years | 36 (9.6%) | 9 (2.5%) |
| 65 to 74 Years | 9 (8.1%) | 26 (24.5%) |
| 75 Years and over | 9 (25.0%) | 36 (59.0%) |
Disability Class: Self-Care Difficulty
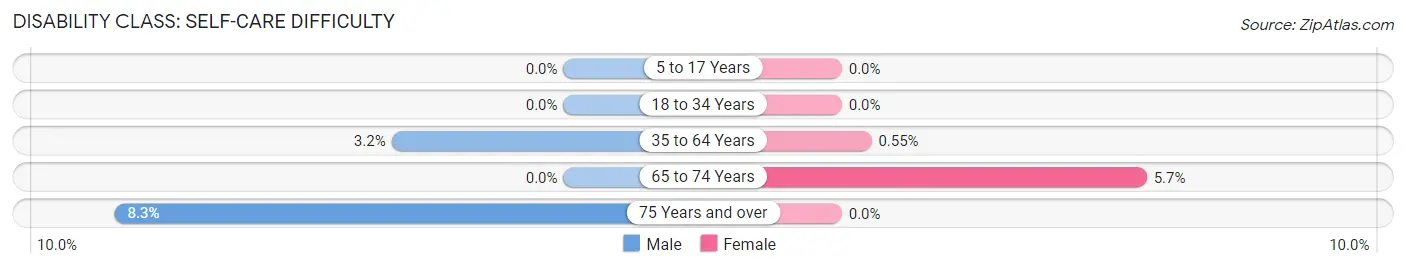
| Age Bracket | Male | Female |
| 5 to 17 Years | 0 (0.0%) | 0 (0.0%) |
| 18 to 34 Years | 0 (0.0%) | 0 (0.0%) |
| 35 to 64 Years | 12 (3.2%) | 2 (0.5%) |
| 65 to 74 Years | 0 (0.0%) | 6 (5.7%) |
| 75 Years and over | 3 (8.3%) | 0 (0.0%) |
Technology Access in Bonneauville borough
Computing Device Access in Bonneauville borough
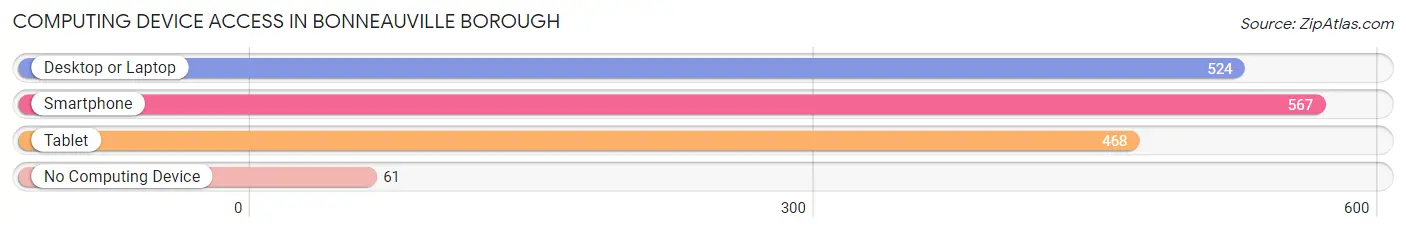
| Device Type | # Households | % Households |
| Desktop or Laptop | 524 | 70.9% |
| Smartphone | 567 | 76.7% |
| Tablet | 468 | 63.3% |
| No Computing Device | 61 | 8.3% |
| Total | 739 | 100.0% |
Internet Access in Bonneauville borough
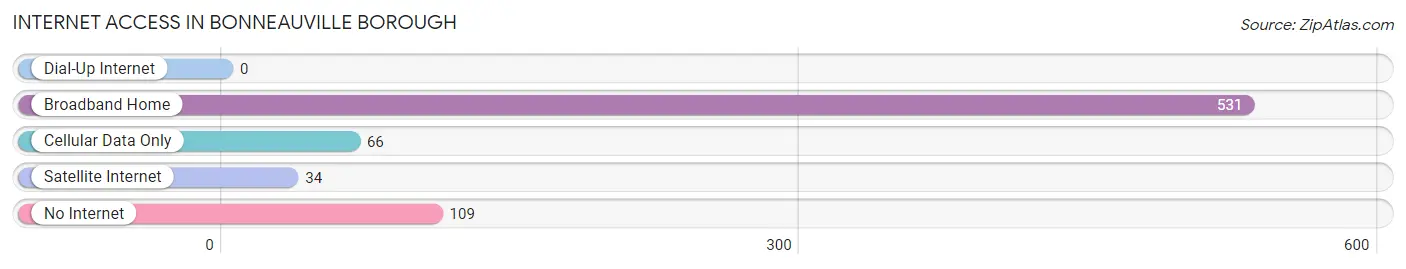
| Internet Type | # Households | % Households |
| Dial-Up Internet | 0 | 0.0% |
| Broadband Home | 531 | 71.9% |
| Cellular Data Only | 66 | 8.9% |
| Satellite Internet | 34 | 4.6% |
| No Internet | 109 | 14.7% |
| Total | 739 | 100.0% |
Bonneauville borough Summary
Bonneauville Borough is a small borough located in Adams County, Pennsylvania. It is situated in the south-central part of the state, approximately 20 miles west of the state capital of Harrisburg. The borough is bordered by Straban Township to the north, Mount Joy Township to the east, and Mount Pleasant Township to the south and west. As of the 2010 census, the population of Bonneauville Borough was 1,092.
History
Bonneauville Borough was founded in 1851 by John Bonneau, a local landowner. The borough was named after him and was incorporated in 1872. Bonneauville was originally a farming community, but in the late 19th century, it became a popular summer resort destination. The borough was home to several hotels, a golf course, and a racetrack.
In the early 20th century, Bonneauville began to transition from a resort town to a residential community. The borough was home to several factories, including a paper mill, a canning factory, and a brickyard. The borough also had a trolley line that connected it to nearby towns.
Geography
Bonneauville Borough is located at 39°51'N 77°2'W. It has a total area of 0.7 square miles, all of which is land. The borough is situated in the Appalachian Mountains and is surrounded by rolling hills and farmland. The borough is located in the Conewago Creek watershed.
Economy
The economy of Bonneauville Borough is largely based on agriculture and tourism. The borough is home to several farms, including a dairy farm, a beef farm, and a vegetable farm. The borough also has several wineries and breweries.
Tourism is an important part of the borough's economy. Bonneauville is home to several historic sites, including the Bonneauville Hotel, the Bonneauville Racetrack, and the Bonneauville Golf Course. The borough also has several parks and recreational areas, including the Bonneauville Community Park and the Bonneauville Nature Preserve.
Demographics
As of the 2010 census, the population of Bonneauville Borough was 1,092. The racial makeup of the borough was 97.2% White, 0.7% African American, 0.2% Native American, 0.7% Asian, and 1.2% from other races. Hispanic or Latino of any race were 1.2% of the population.
The median household income in Bonneauville Borough was $50,938, and the median family income was $60,000. The per capita income was $25,938. About 8.2% of families and 10.2% of the population were below the poverty line.
Common Questions
What is Per Capita Income in Bonneauville borough?
Per Capita income in Bonneauville borough is $35,205.
What is the Median Family Income in Bonneauville borough?
Median Family Income in Bonneauville borough is $86,631.
What is the Median Household income in Bonneauville borough?
Median Household Income in Bonneauville borough is $65,417.
What is Income or Wage Gap in Bonneauville borough?
Income or Wage Gap in Bonneauville borough is 29.7%.
Women in Bonneauville borough earn 70.3 cents for every dollar earned by a man.
What is Inequality or Gini Index in Bonneauville borough?
Inequality or Gini Index in Bonneauville borough is 0.43.
What is the Total Population of Bonneauville borough?
Total Population of Bonneauville borough is 1,857.
What is the Total Male Population of Bonneauville borough?
Total Male Population of Bonneauville borough is 919.
What is the Total Female Population of Bonneauville borough?
Total Female Population of Bonneauville borough is 938.
What is the Ratio of Males per 100 Females in Bonneauville borough?
There are 97.97 Males per 100 Females in Bonneauville borough.
What is the Ratio of Females per 100 Males in Bonneauville borough?
There are 102.07 Females per 100 Males in Bonneauville borough.
What is the Median Population Age in Bonneauville borough?
Median Population Age in Bonneauville borough is 40.5 Years.
What is the Average Family Size in Bonneauville borough
Average Family Size in Bonneauville borough is 2.9 People.
What is the Average Household Size in Bonneauville borough
Average Household Size in Bonneauville borough is 2.5 People.
How Large is the Labor Force in Bonneauville borough?
There are 1,011 People in the Labor Forcein in Bonneauville borough.
What is the Percentage of People in the Labor Force in Bonneauville borough?
69.6% of People are in the Labor Force in Bonneauville borough.
What is the Unemployment Rate in Bonneauville borough?
Unemployment Rate in Bonneauville borough is 1.7%.