Apollo borough, PA Map & Demographics
Apollo borough Overview
$26,375
PER CAPITA INCOME
$67,250
AVG FAMILY INCOME
$52,273
AVG HOUSEHOLD INCOME
42.3%
WAGE / INCOME GAP [ % ]
57.7¢/ $1
WAGE / INCOME GAP [ $ ]
0.42
INEQUALITY / GINI INDEX
1,247
TOTAL POPULATION
636
MALE POPULATION
611
FEMALE POPULATION
104.09
MALES / 100 FEMALES
96.07
FEMALES / 100 MALES
41.4
MEDIAN AGE
3.4
AVG FAMILY SIZE
2.3
AVG HOUSEHOLD SIZE
657
LABOR FORCE [ PEOPLE ]
64.9%
PERCENT IN LABOR FORCE
8.1%
UNEMPLOYMENT RATE
Income in Apollo borough
Income Overview in Apollo borough
Per Capita Income in Apollo borough is $26,375, while median incomes of families and households are $67,250 and $52,273 respectively.
| Characteristic | Number | Measure |
| Per Capita Income | 1,247 | $26,375 |
| Median Family Income | 271 | $67,250 |
| Mean Family Income | 271 | $74,535 |
| Median Household Income | 530 | $52,273 |
| Mean Household Income | 530 | $59,513 |
| Income Deficit | 271 | $0 |
| Wage / Income Gap (%) | 1,247 | 42.33% |
| Wage / Income Gap ($) | 1,247 | 57.67¢ per $1 |
| Gini / Inequality Index | 1,247 | 0.42 |
Earnings by Sex in Apollo borough
Average Earnings in Apollo borough are $35,574, $42,625 for men and $24,583 for women, a difference of 42.3%.

| Sex | Number | Average Earnings |
| Male | 356 (53.8%) | $42,625 |
| Female | 306 (46.2%) | $24,583 |
| Total | 662 (100.0%) | $35,574 |
Earnings by Sex by Income Bracket in Apollo borough
The most common earnings brackets in Apollo borough are $35,000 to $39,999 for men (54 | 15.2%) and $40,000 to $44,999 for women (38 | 12.4%).
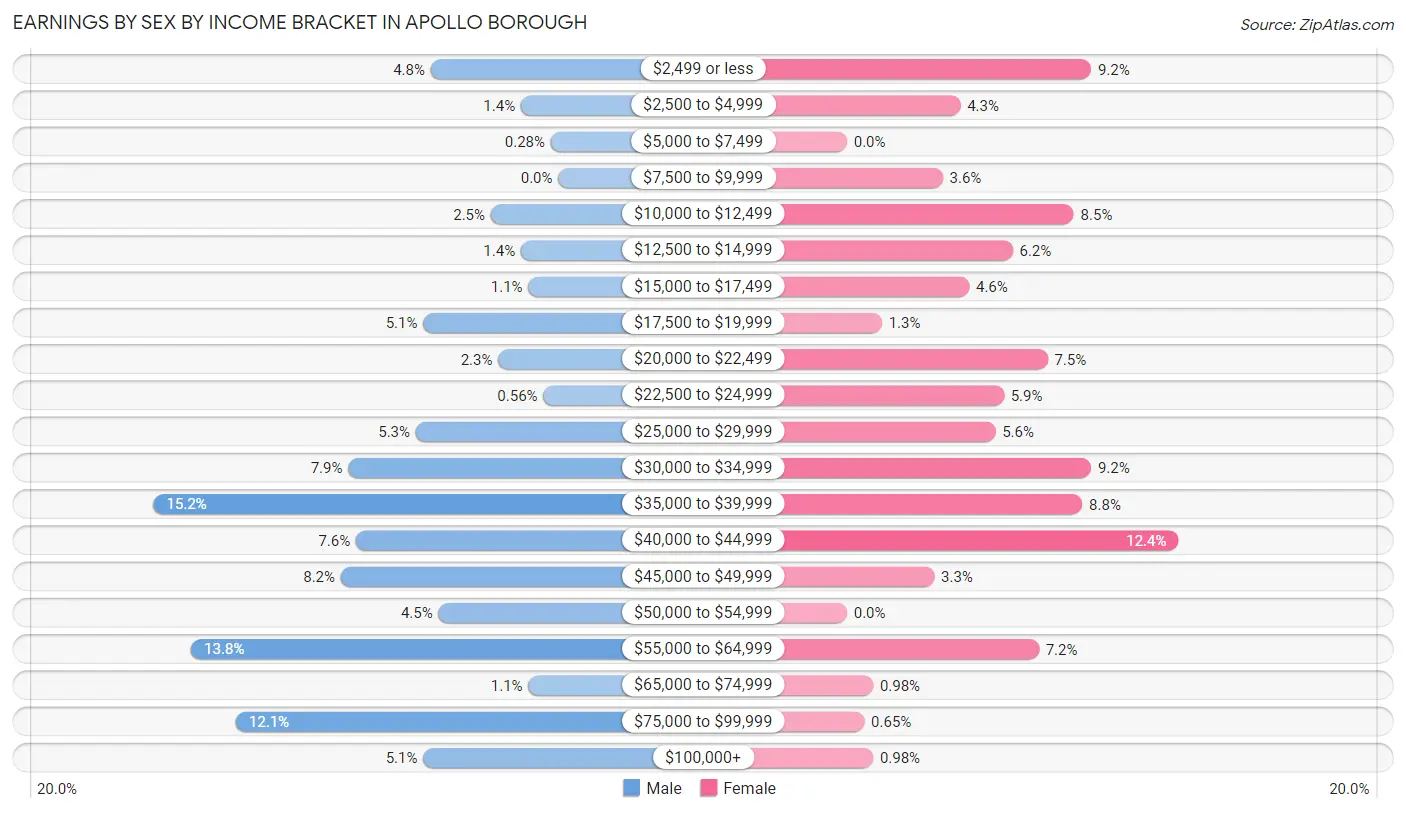
| Income | Male | Female |
| $2,499 or less | 17 (4.8%) | 28 (9.1%) |
| $2,500 to $4,999 | 5 (1.4%) | 13 (4.3%) |
| $5,000 to $7,499 | 1 (0.3%) | 0 (0.0%) |
| $7,500 to $9,999 | 0 (0.0%) | 11 (3.6%) |
| $10,000 to $12,499 | 9 (2.5%) | 26 (8.5%) |
| $12,500 to $14,999 | 5 (1.4%) | 19 (6.2%) |
| $15,000 to $17,499 | 4 (1.1%) | 14 (4.6%) |
| $17,500 to $19,999 | 18 (5.1%) | 4 (1.3%) |
| $20,000 to $22,499 | 8 (2.2%) | 23 (7.5%) |
| $22,500 to $24,999 | 2 (0.6%) | 18 (5.9%) |
| $25,000 to $29,999 | 19 (5.3%) | 17 (5.6%) |
| $30,000 to $34,999 | 28 (7.9%) | 28 (9.1%) |
| $35,000 to $39,999 | 54 (15.2%) | 27 (8.8%) |
| $40,000 to $44,999 | 27 (7.6%) | 38 (12.4%) |
| $45,000 to $49,999 | 29 (8.2%) | 10 (3.3%) |
| $50,000 to $54,999 | 16 (4.5%) | 0 (0.0%) |
| $55,000 to $64,999 | 49 (13.8%) | 22 (7.2%) |
| $65,000 to $74,999 | 4 (1.1%) | 3 (1.0%) |
| $75,000 to $99,999 | 43 (12.1%) | 2 (0.6%) |
| $100,000+ | 18 (5.1%) | 3 (1.0%) |
| Total | 356 (100.0%) | 306 (100.0%) |
Earnings by Sex by Educational Attainment in Apollo borough
Average earnings in Apollo borough are $48,056 for men and $30,441 for women, a difference of 36.7%. Men with an educational attainment of college or associate's degree enjoy the highest average annual earnings of $55,114, while those with high school diploma education earn the least with $44,250. Women with an educational attainment of bachelor's degree earn the most with the average annual earnings of $39,250, while those with high school diploma education have the smallest earnings of $22,813.
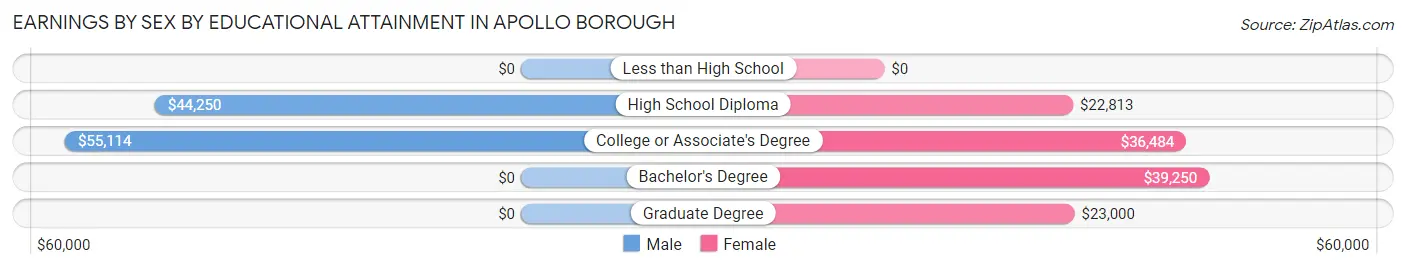
| Educational Attainment | Male Income | Female Income |
| Less than High School | - | - |
| High School Diploma | $44,250 | $22,813 |
| College or Associate's Degree | $55,114 | $36,484 |
| Bachelor's Degree | - | - |
| Graduate Degree | - | - |
| Total | $48,056 | $30,441 |
Family Income in Apollo borough
Family Income Brackets in Apollo borough
According to the Apollo borough family income data, there are 91 families falling into the $50,000 to $74,999 income range, which is the most common income bracket and makes up 33.6% of all families. Conversely, the less than $10,000 income bracket is the least frequent group with only 4 families (1.5%) belonging to this category.
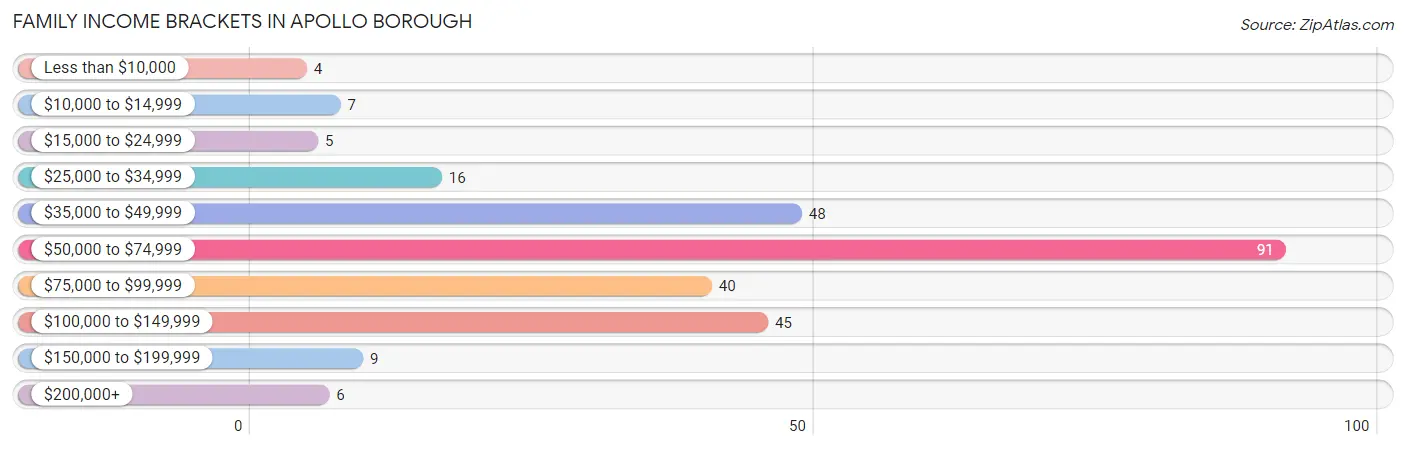
| Income Bracket | # Families | % Families |
| Less than $10,000 | 4 | 1.5% |
| $10,000 to $14,999 | 7 | 2.6% |
| $15,000 to $24,999 | 5 | 1.8% |
| $25,000 to $34,999 | 16 | 5.9% |
| $35,000 to $49,999 | 48 | 17.7% |
| $50,000 to $74,999 | 91 | 33.6% |
| $75,000 to $99,999 | 40 | 14.8% |
| $100,000 to $149,999 | 45 | 16.6% |
| $150,000 to $199,999 | 9 | 3.3% |
| $200,000+ | 6 | 2.2% |
Family Income by Famaliy Size in Apollo borough
5-person families (19 | 7.0%) account for the highest median family income in Apollo borough with $135,875 per family, while 2-person families (128 | 47.2%) have the highest median income of $30,416 per family member.
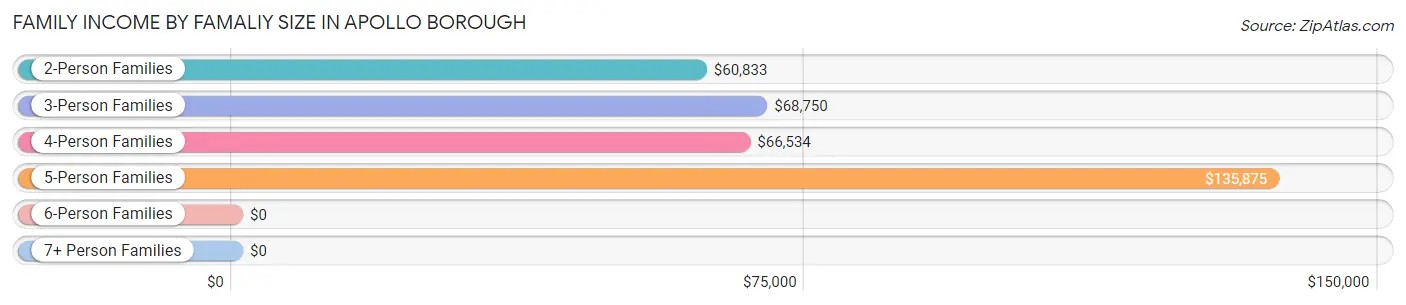
| Income Bracket | # Families | Median Income |
| 2-Person Families | 128 (47.2%) | $60,833 |
| 3-Person Families | 52 (19.2%) | $68,750 |
| 4-Person Families | 55 (20.3%) | $66,534 |
| 5-Person Families | 19 (7.0%) | $135,875 |
| 6-Person Families | 3 (1.1%) | $0 |
| 7+ Person Families | 14 (5.2%) | $0 |
| Total | 271 (100.0%) | $67,250 |
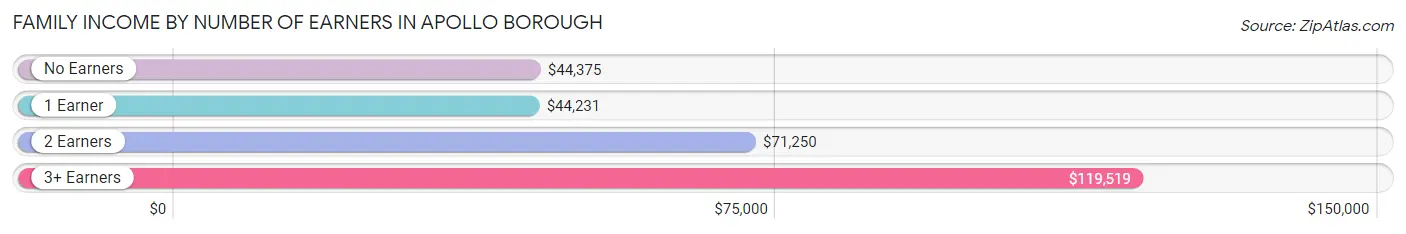
Family Income by Number of Earners in Apollo borough
The median family income in Apollo borough is $67,250, with families comprising 3+ earners (45) having the highest median family income of $119,519, while families with 1 earner (70) have the lowest median family income of $44,231, accounting for 16.6% and 25.8% of families, respectively.
| Number of Earners | # Families | Median Income |
| No Earners | 34 (12.6%) | $44,375 |
| 1 Earner | 70 (25.8%) | $44,231 |
| 2 Earners | 122 (45.0%) | $71,250 |
| 3+ Earners | 45 (16.6%) | $119,519 |
| Total | 271 (100.0%) | $67,250 |
Household Income in Apollo borough
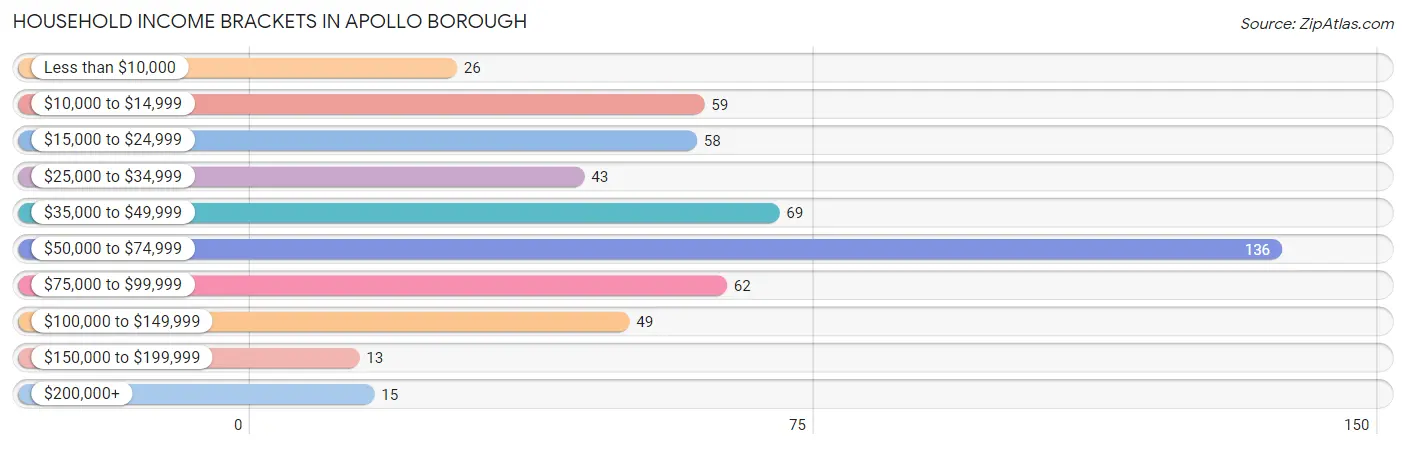
Household Income Brackets in Apollo borough
With 136 households falling in the category, the $50,000 to $74,999 income range is the most frequent in Apollo borough, accounting for 25.7% of all households. In contrast, only 13 households (2.5%) fall into the $150,000 to $199,999 income bracket, making it the least populous group.
| Income Bracket | # Households | % Households |
| Less than $10,000 | 26 | 4.9% |
| $10,000 to $14,999 | 59 | 11.1% |
| $15,000 to $24,999 | 58 | 10.9% |
| $25,000 to $34,999 | 43 | 8.1% |
| $35,000 to $49,999 | 69 | 13.0% |
| $50,000 to $74,999 | 136 | 25.7% |
| $75,000 to $99,999 | 62 | 11.7% |
| $100,000 to $149,999 | 49 | 9.2% |
| $150,000 to $199,999 | 13 | 2.5% |
| $200,000+ | 15 | 2.8% |
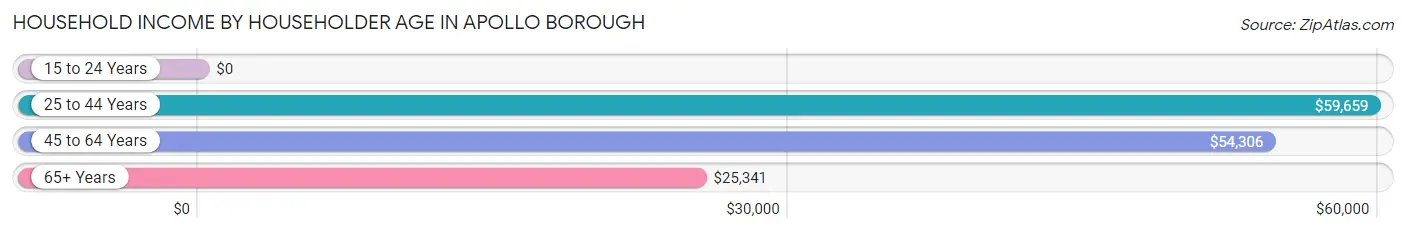
Household Income by Householder Age in Apollo borough
The median household income in Apollo borough is $52,273, with the highest median household income of $59,659 found in the 25 to 44 years age bracket for the primary householder. A total of 140 households (26.4%) fall into this category. Meanwhile, the 15 to 24 years age bracket for the primary householder has the lowest median household income of $0, with 10 households (1.9%) in this group.
| Income Bracket | # Households | Median Income |
| 15 to 24 Years | 10 (1.9%) | $0 |
| 25 to 44 Years | 140 (26.4%) | $59,659 |
| 45 to 64 Years | 229 (43.2%) | $54,306 |
| 65+ Years | 151 (28.5%) | $25,341 |
| Total | 530 (100.0%) | $52,273 |
Poverty in Apollo borough
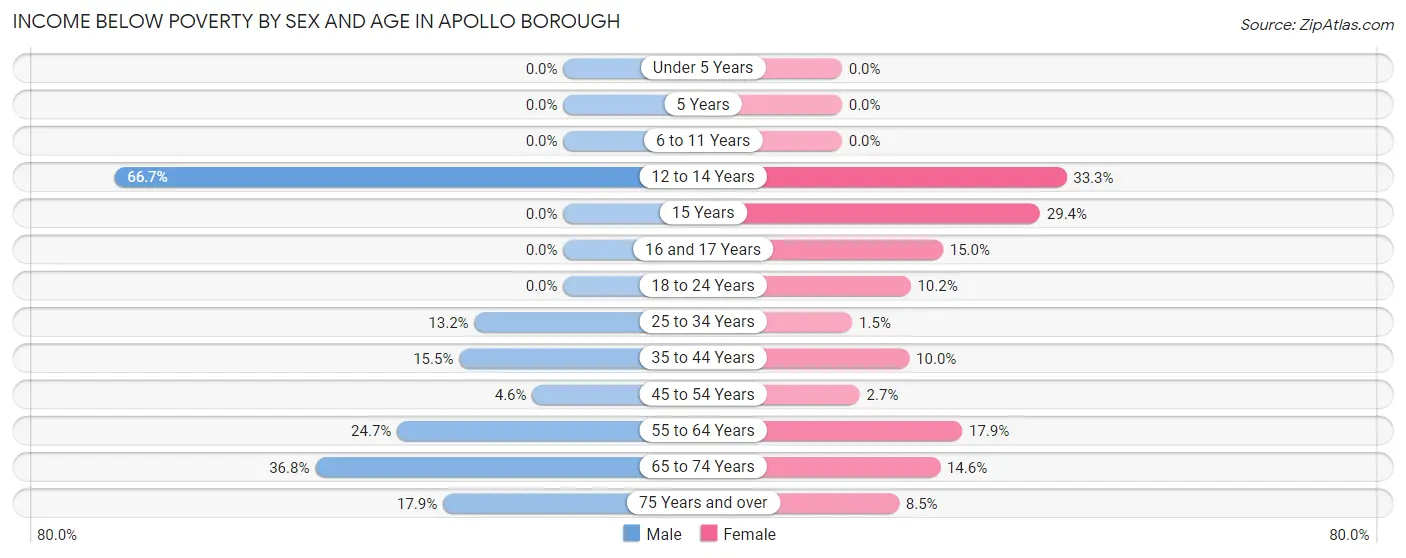
Income Below Poverty by Sex and Age in Apollo borough
With 11.9% poverty level for males and 9.1% for females among the residents of Apollo borough, 12 to 14 year old males and 12 to 14 year old females are the most vulnerable to poverty, with 4 males (66.7%) and 5 females (33.3%) in their respective age groups living below the poverty level.
| Age Bracket | Male | Female |
| Under 5 Years | 0 (0.0%) | 0 (0.0%) |
| 5 Years | 0 (0.0%) | 0 (0.0%) |
| 6 to 11 Years | 0 (0.0%) | 0 (0.0%) |
| 12 to 14 Years | 4 (66.7%) | 5 (33.3%) |
| 15 Years | 0 (0.0%) | 5 (29.4%) |
| 16 and 17 Years | 0 (0.0%) | 3 (15.0%) |
| 18 to 24 Years | 0 (0.0%) | 5 (10.2%) |
| 25 to 34 Years | 7 (13.2%) | 1 (1.5%) |
| 35 to 44 Years | 15 (15.5%) | 6 (10.0%) |
| 45 to 54 Years | 4 (4.6%) | 3 (2.6%) |
| 55 to 64 Years | 19 (24.7%) | 15 (17.9%) |
| 65 to 74 Years | 21 (36.8%) | 7 (14.6%) |
| 75 Years and over | 5 (17.9%) | 5 (8.5%) |
| Total | 75 (11.9%) | 55 (9.1%) |
Income Above Poverty by Sex and Age in Apollo borough
According to the poverty statistics in Apollo borough, males aged under 5 years and females aged under 5 years are the age groups that are most secure financially, with 100.0% of males and 100.0% of females in these age groups living above the poverty line.
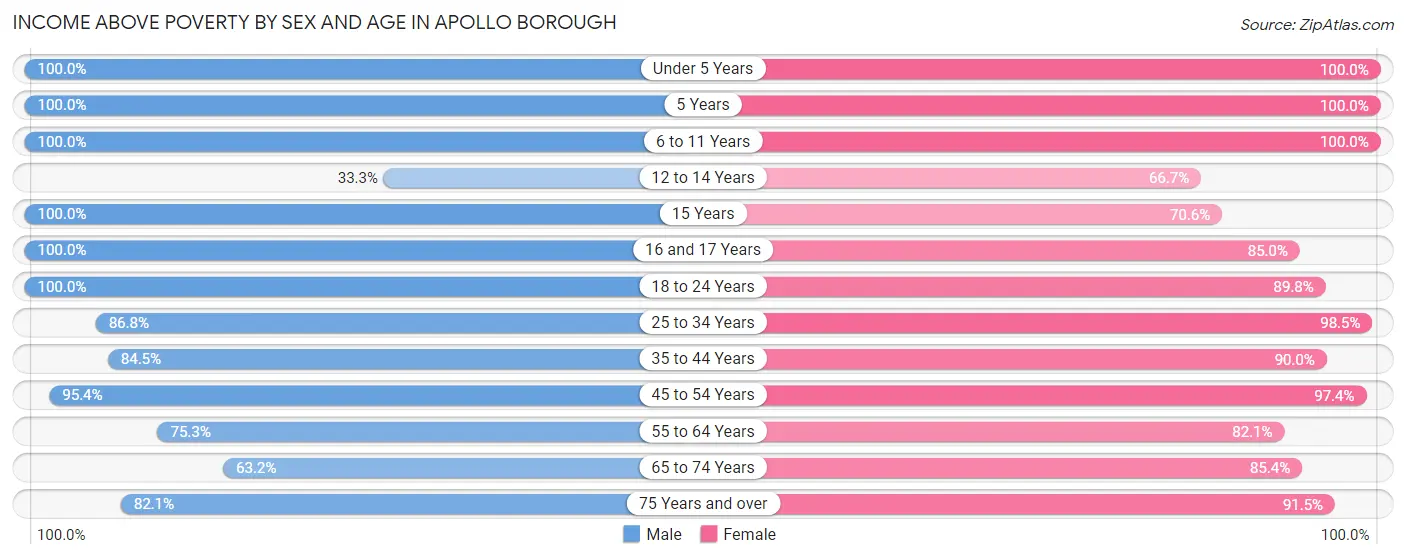
| Age Bracket | Male | Female |
| Under 5 Years | 37 (100.0%) | 16 (100.0%) |
| 5 Years | 4 (100.0%) | 3 (100.0%) |
| 6 to 11 Years | 68 (100.0%) | 53 (100.0%) |
| 12 to 14 Years | 2 (33.3%) | 10 (66.7%) |
| 15 Years | 7 (100.0%) | 12 (70.6%) |
| 16 and 17 Years | 11 (100.0%) | 17 (85.0%) |
| 18 to 24 Years | 97 (100.0%) | 44 (89.8%) |
| 25 to 34 Years | 46 (86.8%) | 64 (98.5%) |
| 35 to 44 Years | 82 (84.5%) | 54 (90.0%) |
| 45 to 54 Years | 83 (95.4%) | 110 (97.4%) |
| 55 to 64 Years | 58 (75.3%) | 69 (82.1%) |
| 65 to 74 Years | 36 (63.2%) | 41 (85.4%) |
| 75 Years and over | 23 (82.1%) | 54 (91.5%) |
| Total | 554 (88.1%) | 547 (90.9%) |
Income Below Poverty Among Married-Couple Families in Apollo borough
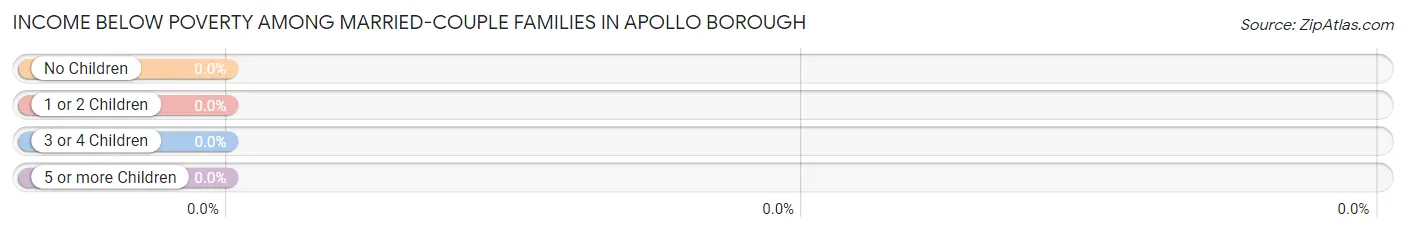
| Children | Above Poverty | Below Poverty |
| No Children | 90 (100.0%) | 0 (0.0%) |
| 1 or 2 Children | 63 (100.0%) | 0 (0.0%) |
| 3 or 4 Children | 6 (100.0%) | 0 (0.0%) |
| 5 or more Children | 14 (100.0%) | 0 (0.0%) |
| Total | 173 (100.0%) | 0 (0.0%) |
Income Below Poverty Among Single-Parent Households in Apollo borough
According to the poverty data in Apollo borough, 36.4% or 8 single-father households and 10.5% or 8 single-mother households are living below the poverty line. Among single-father households, those with 1 or 2 children have the highest poverty rate, with 8 households (100.0%) experiencing poverty. Likewise, among single-mother households, those with no children have the highest poverty rate, with 7 households (11.3%) falling below the poverty line.
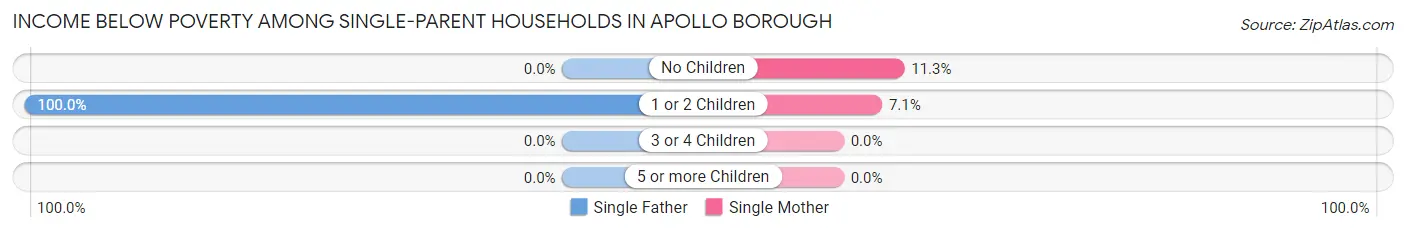
| Children | Single Father | Single Mother |
| No Children | 0 (0.0%) | 7 (11.3%) |
| 1 or 2 Children | 8 (100.0%) | 1 (7.1%) |
| 3 or 4 Children | 0 (0.0%) | 0 (0.0%) |
| 5 or more Children | 0 (0.0%) | 0 (0.0%) |
| Total | 8 (36.4%) | 8 (10.5%) |
Income Below Poverty Among Married-Couple vs Single-Parent Households in Apollo borough
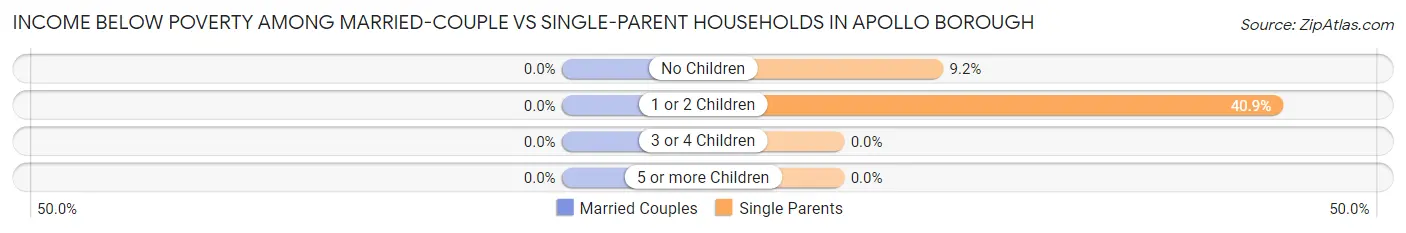
| Children | Married-Couple Families | Single-Parent Households |
| No Children | 0 (0.0%) | 7 (9.2%) |
| 1 or 2 Children | 0 (0.0%) | 9 (40.9%) |
| 3 or 4 Children | 0 (0.0%) | 0 (0.0%) |
| 5 or more Children | 0 (0.0%) | 0 (0.0%) |
| Total | 0 (0.0%) | 16 (16.3%) |
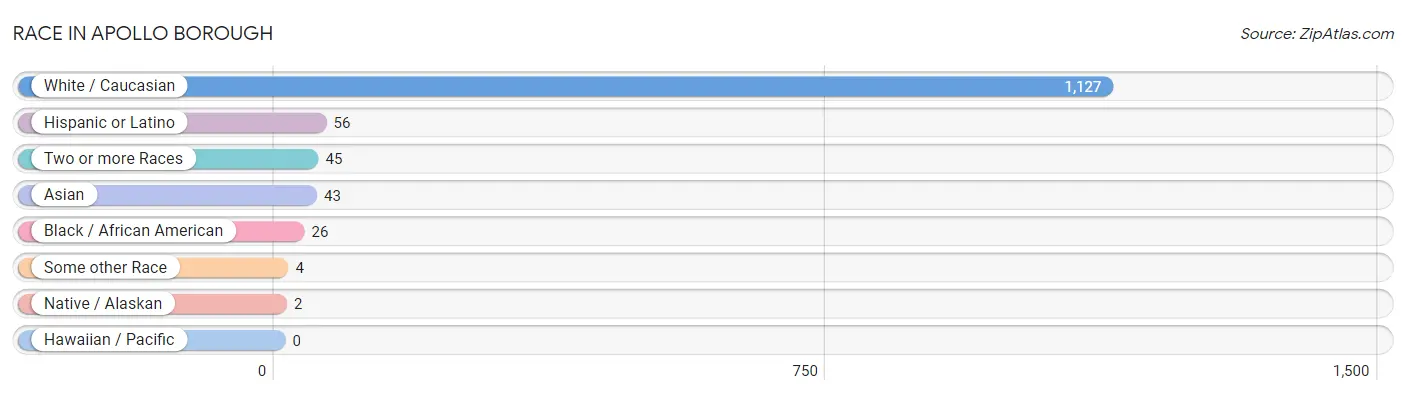
Race in Apollo borough
The most populous races in Apollo borough are White / Caucasian (1,127 | 90.4%), Hispanic or Latino (56 | 4.5%), and Two or more Races (45 | 3.6%).
| Race | # Population | % Population |
| Asian | 43 | 3.5% |
| Black / African American | 26 | 2.1% |
| Hawaiian / Pacific | 0 | 0.0% |
| Hispanic or Latino | 56 | 4.5% |
| Native / Alaskan | 2 | 0.2% |
| White / Caucasian | 1,127 | 90.4% |
| Two or more Races | 45 | 3.6% |
| Some other Race | 4 | 0.3% |
| Total | 1,247 | 100.0% |
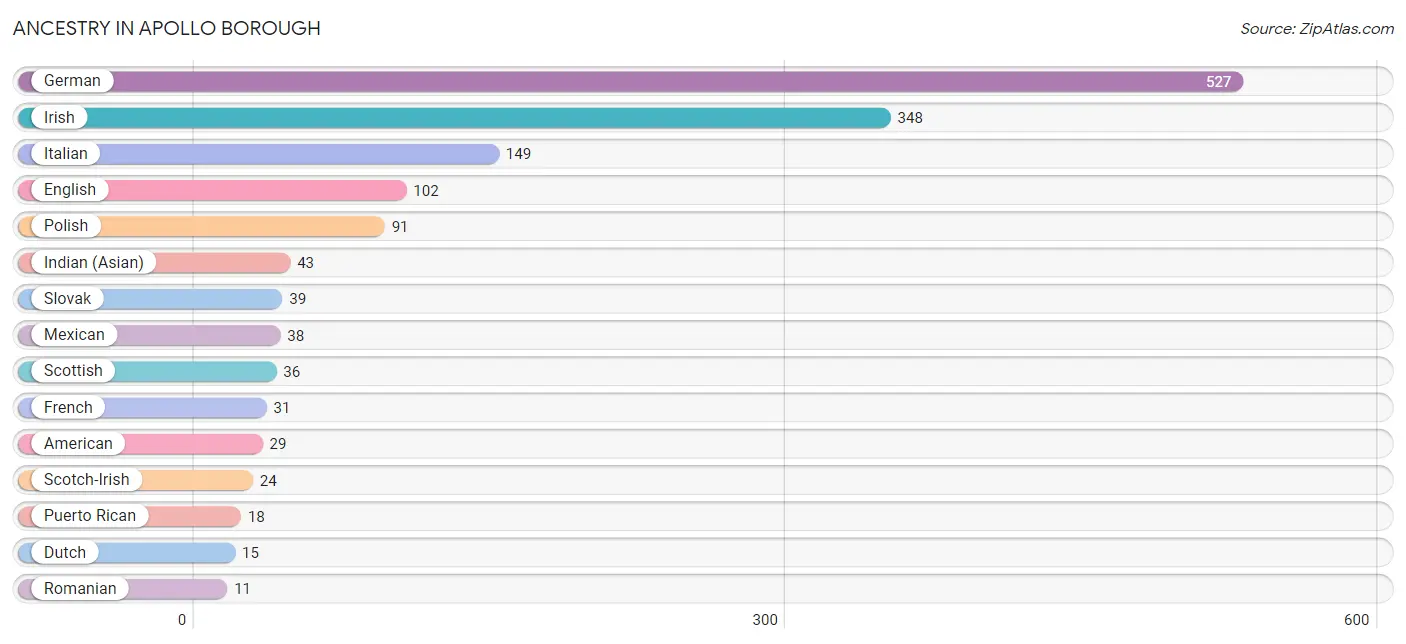
Ancestry in Apollo borough
The most populous ancestries reported in Apollo borough are German (527 | 42.3%), Irish (348 | 27.9%), Italian (149 | 11.9%), English (102 | 8.2%), and Polish (91 | 7.3%), together accounting for 97.6% of all Apollo borough residents.
| Ancestry | # Population | % Population |
| African | 1 | 0.1% |
| American | 29 | 2.3% |
| Croatian | 7 | 0.6% |
| Czech | 4 | 0.3% |
| Czechoslovakian | 3 | 0.2% |
| Dutch | 15 | 1.2% |
| Eastern European | 2 | 0.2% |
| English | 102 | 8.2% |
| European | 3 | 0.2% |
| French | 31 | 2.5% |
| French Canadian | 8 | 0.6% |
| German | 527 | 42.3% |
| Hungarian | 2 | 0.2% |
| Indian (Asian) | 43 | 3.5% |
| Irish | 348 | 27.9% |
| Italian | 149 | 11.9% |
| Luxembourger | 2 | 0.2% |
| Mexican | 38 | 3.0% |
| Norwegian | 9 | 0.7% |
| Pennsylvania German | 7 | 0.6% |
| Polish | 91 | 7.3% |
| Puerto Rican | 18 | 1.4% |
| Romanian | 11 | 0.9% |
| Russian | 4 | 0.3% |
| Scandinavian | 6 | 0.5% |
| Scotch-Irish | 24 | 1.9% |
| Scottish | 36 | 2.9% |
| Sioux | 4 | 0.3% |
| Slavic | 7 | 0.6% |
| Slovak | 39 | 3.1% |
| Slovene | 3 | 0.2% |
| Subsaharan African | 1 | 0.1% |
| Swedish | 10 | 0.8% |
| Welsh | 5 | 0.4% | View All 34 Rows |
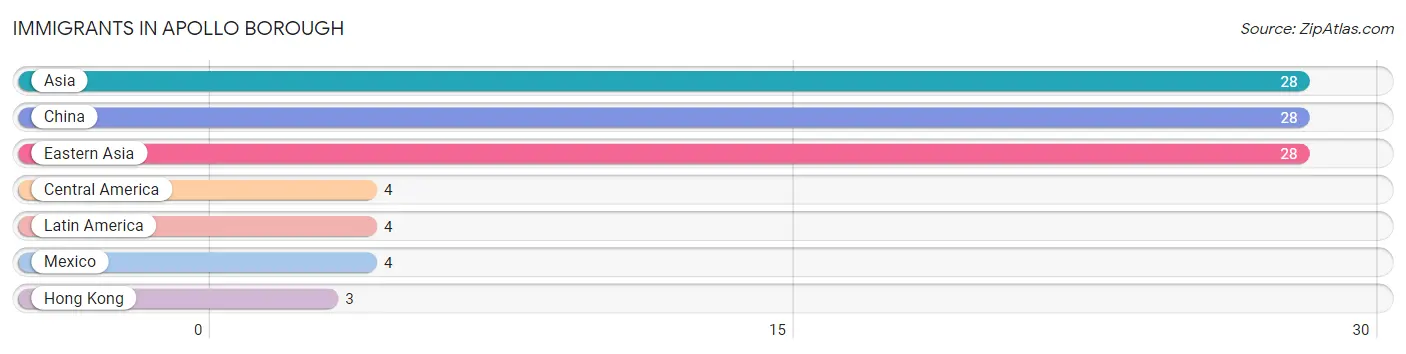
Immigrants in Apollo borough
The most numerous immigrant groups reported in Apollo borough came from Asia (28 | 2.2%), China (28 | 2.2%), Eastern Asia (28 | 2.2%), Central America (4 | 0.3%), and Latin America (4 | 0.3%), together accounting for 7.4% of all Apollo borough residents.
| Immigration Origin | # Population | % Population |
| Asia | 28 | 2.2% |
| Central America | 4 | 0.3% |
| China | 28 | 2.2% |
| Eastern Asia | 28 | 2.2% |
| Hong Kong | 3 | 0.2% |
| Latin America | 4 | 0.3% |
| Mexico | 4 | 0.3% | View All 7 Rows |
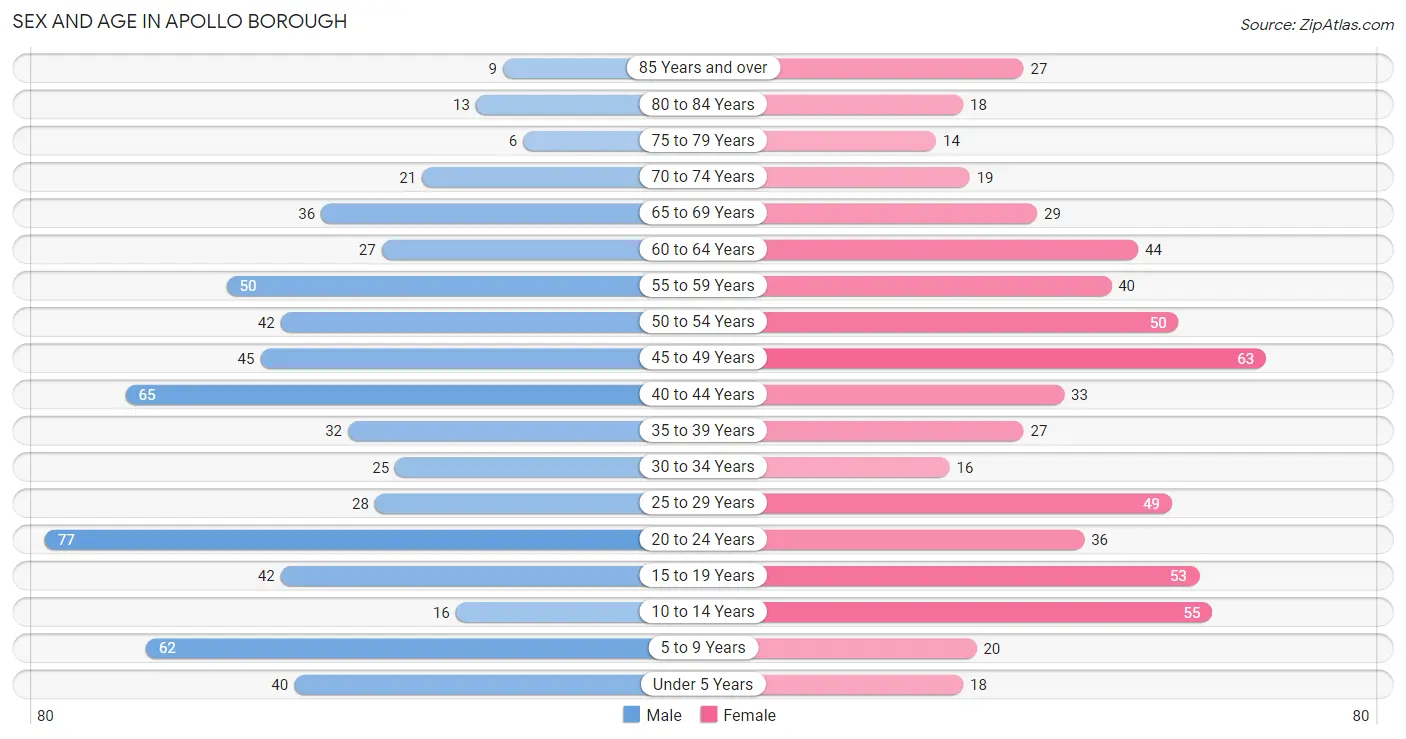
Sex and Age in Apollo borough
Sex and Age in Apollo borough
The most populous age groups in Apollo borough are 20 to 24 Years (77 | 12.1%) for men and 45 to 49 Years (63 | 10.3%) for women.
| Age Bracket | Male | Female |
| Under 5 Years | 40 (6.3%) | 18 (2.9%) |
| 5 to 9 Years | 62 (9.8%) | 20 (3.3%) |
| 10 to 14 Years | 16 (2.5%) | 55 (9.0%) |
| 15 to 19 Years | 42 (6.6%) | 53 (8.7%) |
| 20 to 24 Years | 77 (12.1%) | 36 (5.9%) |
| 25 to 29 Years | 28 (4.4%) | 49 (8.0%) |
| 30 to 34 Years | 25 (3.9%) | 16 (2.6%) |
| 35 to 39 Years | 32 (5.0%) | 27 (4.4%) |
| 40 to 44 Years | 65 (10.2%) | 33 (5.4%) |
| 45 to 49 Years | 45 (7.1%) | 63 (10.3%) |
| 50 to 54 Years | 42 (6.6%) | 50 (8.2%) |
| 55 to 59 Years | 50 (7.9%) | 40 (6.6%) |
| 60 to 64 Years | 27 (4.3%) | 44 (7.2%) |
| 65 to 69 Years | 36 (5.7%) | 29 (4.8%) |
| 70 to 74 Years | 21 (3.3%) | 19 (3.1%) |
| 75 to 79 Years | 6 (0.9%) | 14 (2.3%) |
| 80 to 84 Years | 13 (2.0%) | 18 (2.9%) |
| 85 Years and over | 9 (1.4%) | 27 (4.4%) |
| Total | 636 (100.0%) | 611 (100.0%) |
Families and Households in Apollo borough
Median Family Size in Apollo borough
The median family size in Apollo borough is 3.35 persons per family, with married-couple families (173 | 63.8%) accounting for the largest median family size of 3.69 persons per family. On the other hand, single male/father families (22 | 8.1%) represent the smallest median family size with 2.36 persons per family.
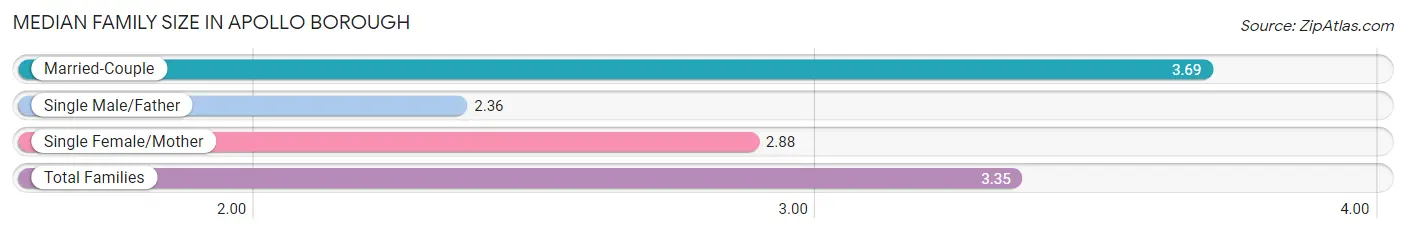
| Family Type | # Families | Family Size |
| Married-Couple | 173 (63.8%) | 3.69 |
| Single Male/Father | 22 (8.1%) | 2.36 |
| Single Female/Mother | 76 (28.0%) | 2.88 |
| Total Families | 271 (100.0%) | 3.35 |
Median Household Size in Apollo borough
The median household size in Apollo borough is 2.32 persons per household, with married-couple households (173 | 32.6%) accounting for the largest median household size of 3.76 persons per household. non-family households (259 | 48.9%) represent the smallest median household size with 1.13 persons per household.
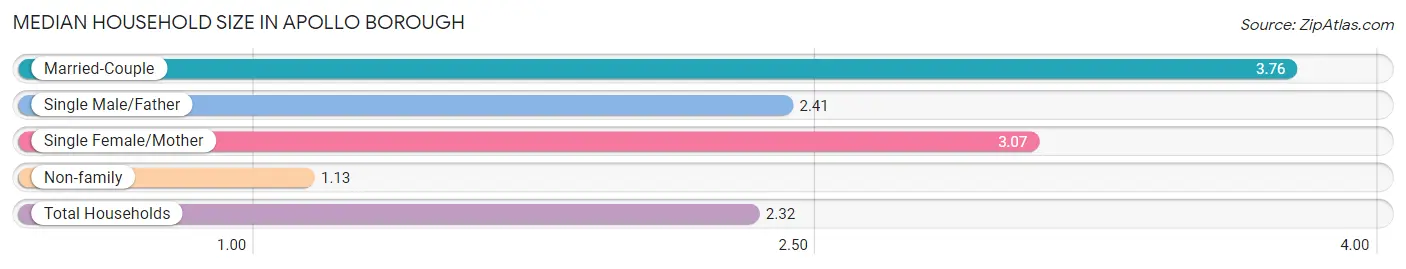
| Household Type | # Households | Household Size |
| Married-Couple | 173 (32.6%) | 3.76 |
| Single Male/Father | 22 (4.2%) | 2.41 |
| Single Female/Mother | 76 (14.3%) | 3.07 |
| Non-family | 259 (48.9%) | 1.13 |
| Total Households | 530 (100.0%) | 2.32 |
Household Size by Marriage Status in Apollo borough
Out of a total of 530 households in Apollo borough, 271 (51.1%) are family households, while 259 (48.9%) are nonfamily households. The most numerous type of family households are 2-person households, comprising 120, and the most common type of nonfamily households are 1-person households, comprising 235.
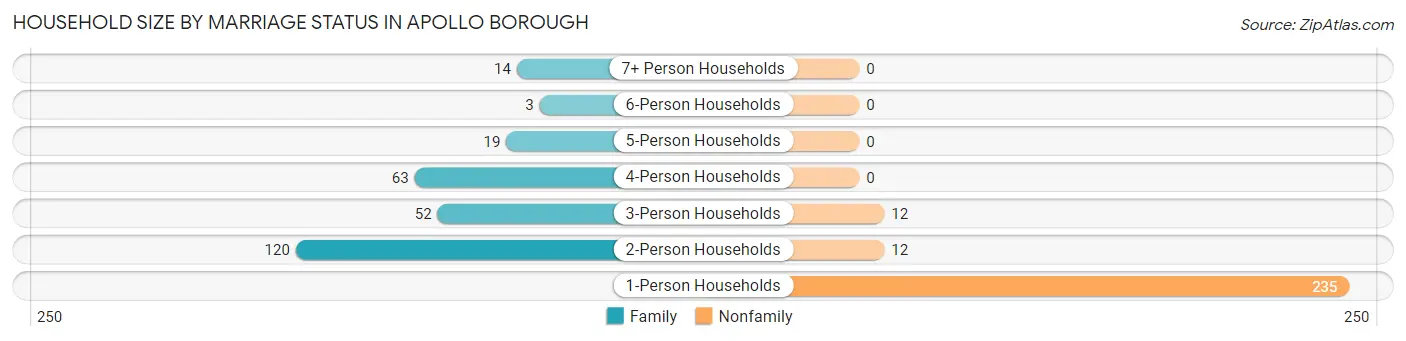
| Household Size | Family Households | Nonfamily Households |
| 1-Person Households | - | 235 (44.3%) |
| 2-Person Households | 120 (22.6%) | 12 (2.3%) |
| 3-Person Households | 52 (9.8%) | 12 (2.3%) |
| 4-Person Households | 63 (11.9%) | 0 (0.0%) |
| 5-Person Households | 19 (3.6%) | 0 (0.0%) |
| 6-Person Households | 3 (0.6%) | 0 (0.0%) |
| 7+ Person Households | 14 (2.6%) | 0 (0.0%) |
| Total | 271 (51.1%) | 259 (48.9%) |
Female Fertility in Apollo borough
Fertility by Age in Apollo borough
Average fertility rate in Apollo borough is 35.0 births per 1,000 women. Women in the age bracket of 20 to 34 years have the highest fertility rate with 99.0 births per 1,000 women. Women in the age bracket of 20 to 34 years acount for 100.0% of all women with births.
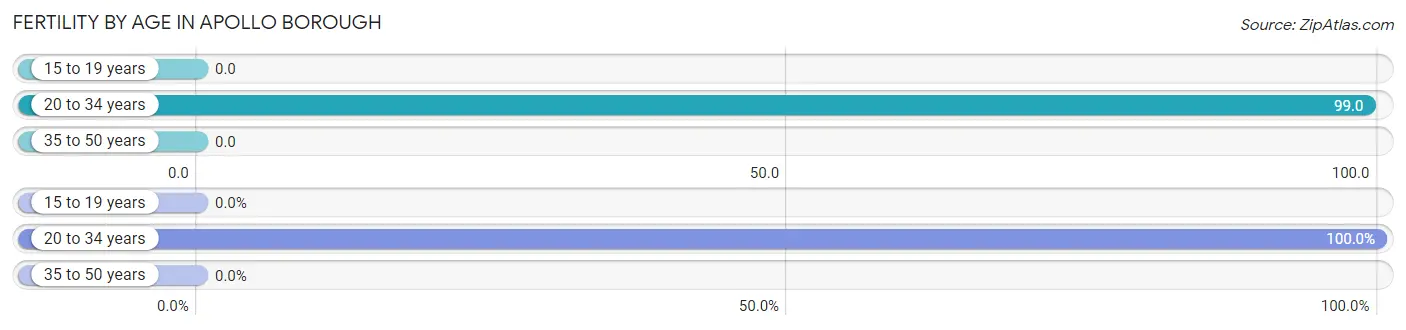
| Age Bracket | Women with Births | Births / 1,000 Women |
| 15 to 19 years | 0 (0.0%) | 0.0 |
| 20 to 34 years | 10 (100.0%) | 99.0 |
| 35 to 50 years | 0 (0.0%) | 0.0 |
| Total | 10 (100.0%) | 35.0 |
Fertility by Age by Marriage Status in Apollo borough
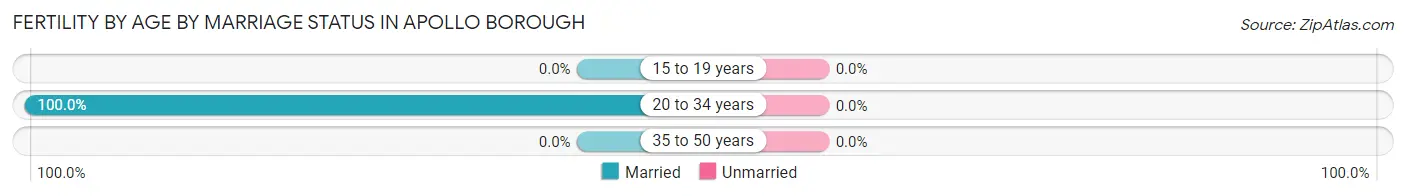
| Age Bracket | Married | Unmarried |
| 15 to 19 years | 0 (0.0%) | 0 (0.0%) |
| 20 to 34 years | 10 (100.0%) | 0 (0.0%) |
| 35 to 50 years | 0 (0.0%) | 0 (0.0%) |
| Total | 10 (100.0%) | 0 (0.0%) |
Fertility by Education in Apollo borough
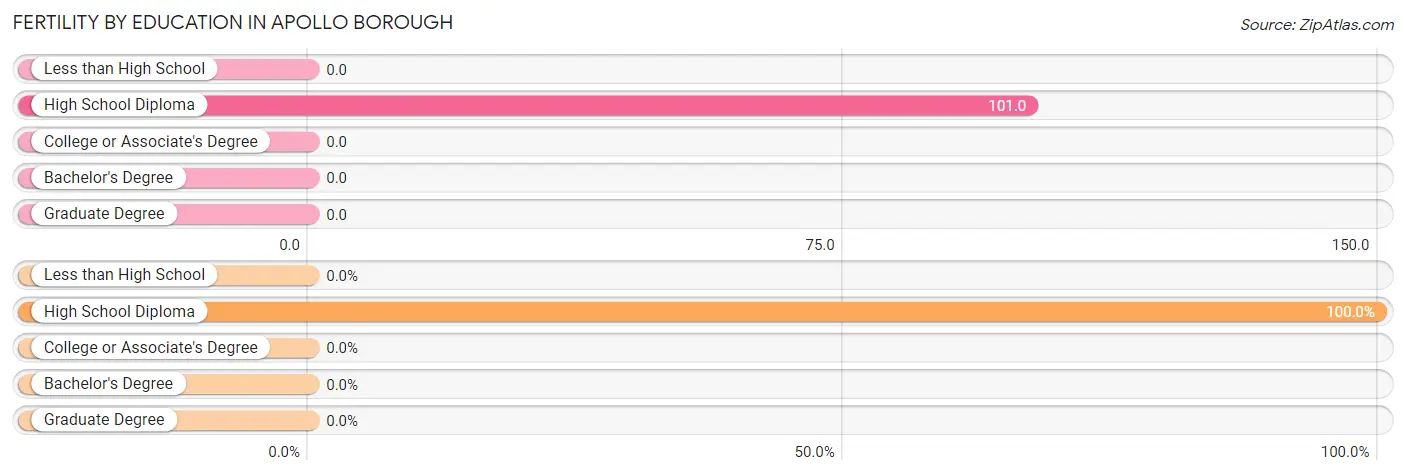
| Educational Attainment | Women with Births | Births / 1,000 Women |
| Less than High School | 0 (0.0%) | 0.0 |
| High School Diploma | 10 (100.0%) | 101.0 |
| College or Associate's Degree | 0 (0.0%) | 0.0 |
| Bachelor's Degree | 0 (0.0%) | 0.0 |
| Graduate Degree | 0 (0.0%) | 0.0 |
| Total | 10 (100.0%) | 35.0 |
Fertility by Education by Marriage Status in Apollo borough
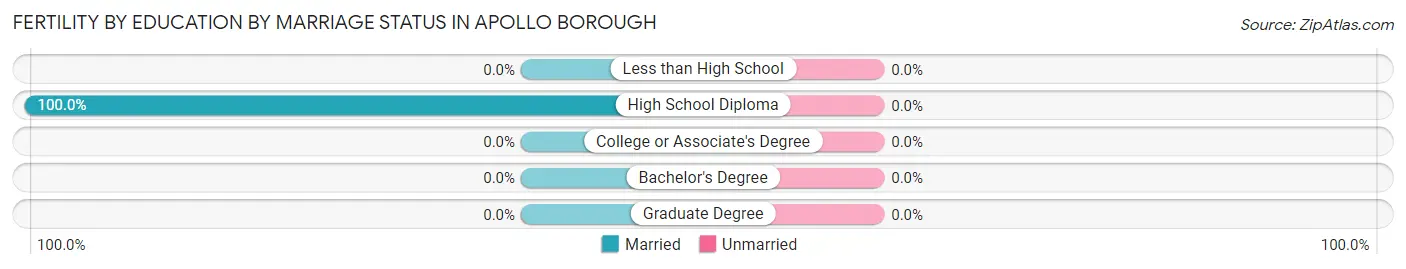
| Educational Attainment | Married | Unmarried |
| Less than High School | 0 (0.0%) | 0 (0.0%) |
| High School Diploma | 10 (100.0%) | 0 (0.0%) |
| College or Associate's Degree | 0 (0.0%) | 0 (0.0%) |
| Bachelor's Degree | 0 (0.0%) | 0 (0.0%) |
| Graduate Degree | 0 (0.0%) | 0 (0.0%) |
| Total | 10 (100.0%) | 0 (0.0%) |
Employment Characteristics in Apollo borough
Employment by Class of Employer in Apollo borough
Among the 599 employed individuals in Apollo borough, private company employees (446 | 74.5%), not-for-profit organizations (64 | 10.7%), and local government employees (33 | 5.5%) make up the most common classes of employment.

| Employer Class | # Employees | % Employees |
| Private Company Employees | 446 | 74.5% |
| Self-Employed (Incorporated) | 13 | 2.2% |
| Self-Employed (Not Incorporated) | 21 | 3.5% |
| Not-for-profit Organizations | 64 | 10.7% |
| Local Government Employees | 33 | 5.5% |
| State Government Employees | 17 | 2.8% |
| Federal Government Employees | 5 | 0.8% |
| Unpaid Family Workers | 0 | 0.0% |
| Total | 599 | 100.0% |
Employment Status by Age in Apollo borough
According to the labor force statistics for Apollo borough, out of the total population over 16 years of age (1,012), 64.9% or 657 individuals are in the labor force, with 8.1% or 53 of them unemployed. The age group with the highest labor force participation rate is 20 to 24 years, with 89.4% or 101 individuals in the labor force. Within the labor force, the 16 to 19 years age range has the highest percentage of unemployed individuals, with 40.7% or 11 of them being unemployed.
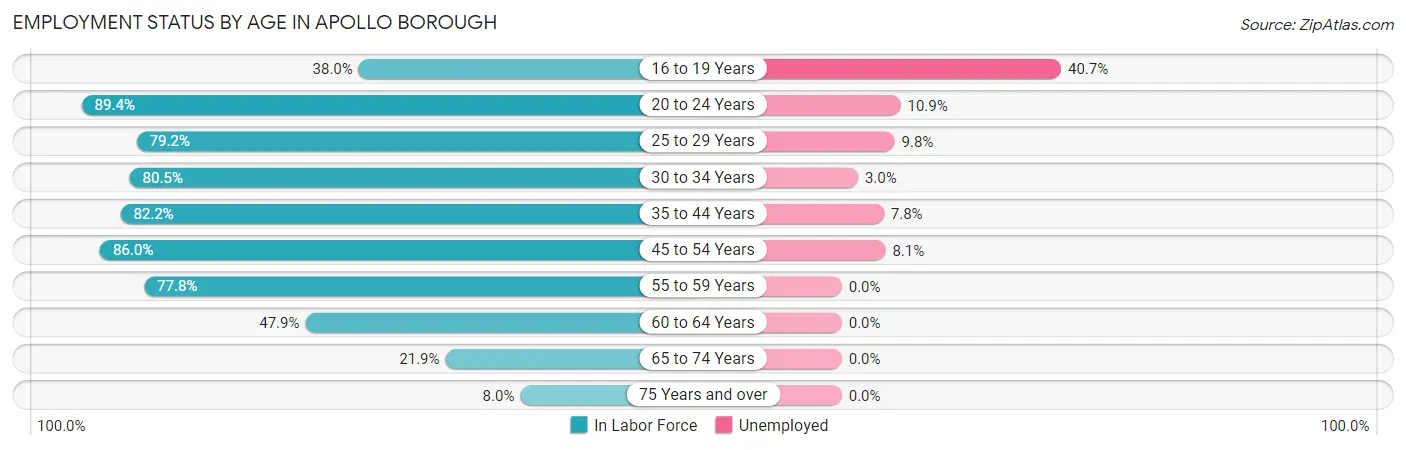
| Age Bracket | In Labor Force | Unemployed |
| 16 to 19 Years | 27 (38.0%) | 11 (40.7%) |
| 20 to 24 Years | 101 (89.4%) | 11 (10.9%) |
| 25 to 29 Years | 61 (79.2%) | 6 (9.8%) |
| 30 to 34 Years | 33 (80.5%) | 1 (3.0%) |
| 35 to 44 Years | 129 (82.2%) | 10 (7.8%) |
| 45 to 54 Years | 172 (86.0%) | 14 (8.1%) |
| 55 to 59 Years | 70 (77.8%) | 0 (0.0%) |
| 60 to 64 Years | 34 (47.9%) | 0 (0.0%) |
| 65 to 74 Years | 23 (21.9%) | 0 (0.0%) |
| 75 Years and over | 7 (8.0%) | 0 (0.0%) |
| Total | 657 (64.9%) | 53 (8.1%) |
Employment Status by Educational Attainment in Apollo borough
According to labor force statistics for Apollo borough, 78.5% of individuals (499) out of the total population between 25 and 64 years of age (636) are in the labor force, with 6.2% or 31 of them being unemployed. The group with the highest labor force participation rate are those with the educational attainment of college / associate degree, with 92.9% or 222 individuals in the labor force. Within the labor force, individuals with college / associate degree education have the highest percentage of unemployment, with 9.0% or 20 of them being unemployed.
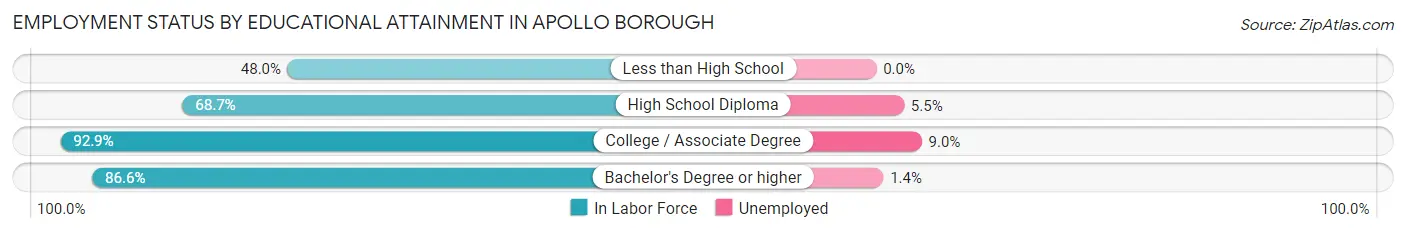
| Educational Attainment | In Labor Force | Unemployed |
| Less than High School | 24 (48.0%) | 0 (0.0%) |
| High School Diploma | 182 (68.7%) | 15 (5.5%) |
| College / Associate Degree | 222 (92.9%) | 22 (9.0%) |
| Bachelor's Degree or higher | 71 (86.6%) | 1 (1.4%) |
| Total | 499 (78.5%) | 39 (6.2%) |
Employment Occupations by Sex in Apollo borough
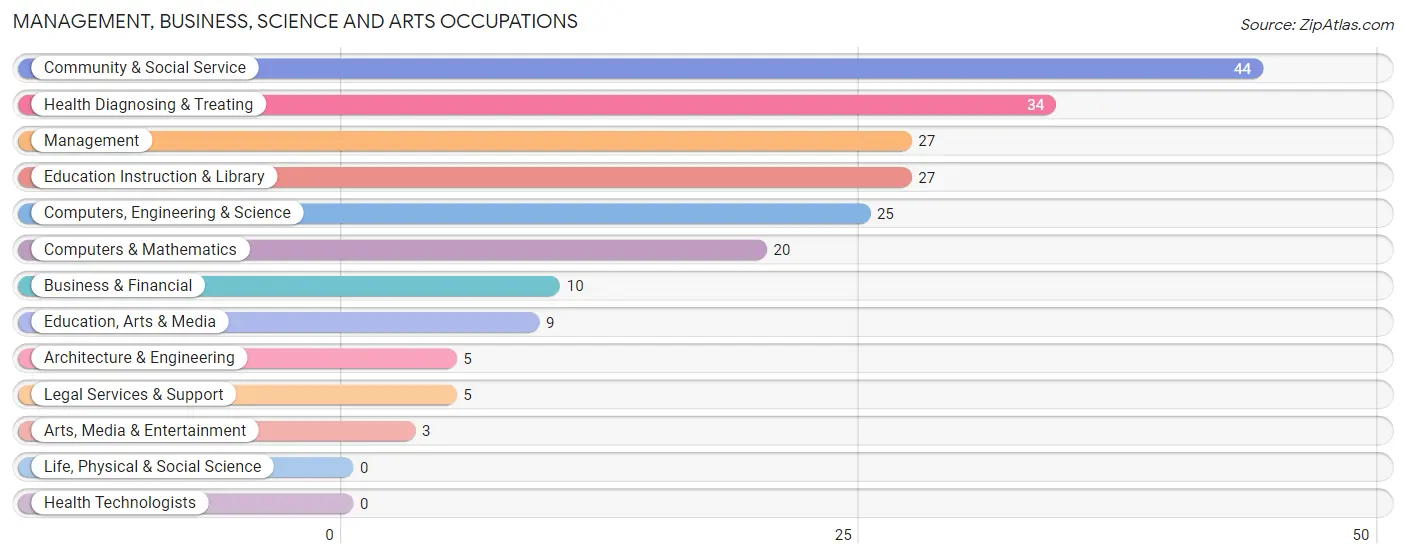
Management, Business, Science and Arts Occupations
The most common Management, Business, Science and Arts occupations in Apollo borough are Community & Social Service (44 | 7.3%), Health Diagnosing & Treating (34 | 5.6%), Management (27 | 4.5%), Education Instruction & Library (27 | 4.5%), and Computers, Engineering & Science (25 | 4.1%).
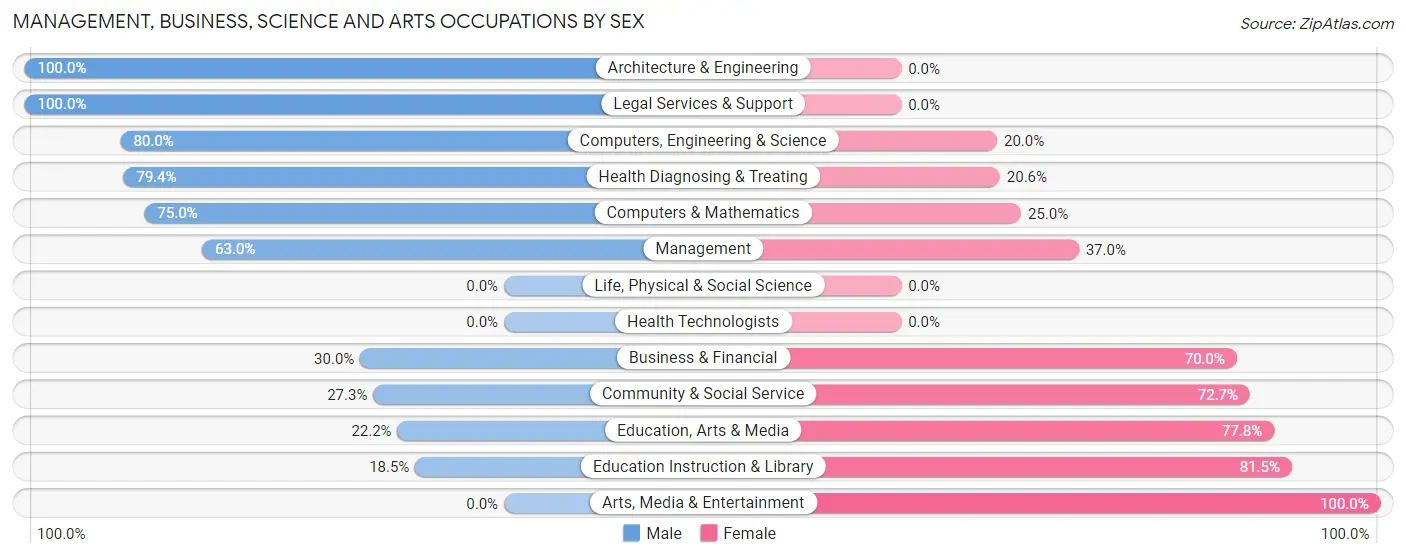
Management, Business, Science and Arts Occupations by Sex
Within the Management, Business, Science and Arts occupations in Apollo borough, the most male-oriented occupations are Architecture & Engineering (100.0%), Legal Services & Support (100.0%), and Computers, Engineering & Science (80.0%), while the most female-oriented occupations are Arts, Media & Entertainment (100.0%), Education Instruction & Library (81.5%), and Education, Arts & Media (77.8%).
| Occupation | Male | Female |
| Management | 17 (63.0%) | 10 (37.0%) |
| Business & Financial | 3 (30.0%) | 7 (70.0%) |
| Computers, Engineering & Science | 20 (80.0%) | 5 (20.0%) |
| Computers & Mathematics | 15 (75.0%) | 5 (25.0%) |
| Architecture & Engineering | 5 (100.0%) | 0 (0.0%) |
| Life, Physical & Social Science | 0 (0.0%) | 0 (0.0%) |
| Community & Social Service | 12 (27.3%) | 32 (72.7%) |
| Education, Arts & Media | 2 (22.2%) | 7 (77.8%) |
| Legal Services & Support | 5 (100.0%) | 0 (0.0%) |
| Education Instruction & Library | 5 (18.5%) | 22 (81.5%) |
| Arts, Media & Entertainment | 0 (0.0%) | 3 (100.0%) |
| Health Diagnosing & Treating | 27 (79.4%) | 7 (20.6%) |
| Health Technologists | 0 (0.0%) | 0 (0.0%) |
| Total (Category) | 79 (56.4%) | 61 (43.6%) |
| Total (Overall) | 317 (52.5%) | 287 (47.5%) |
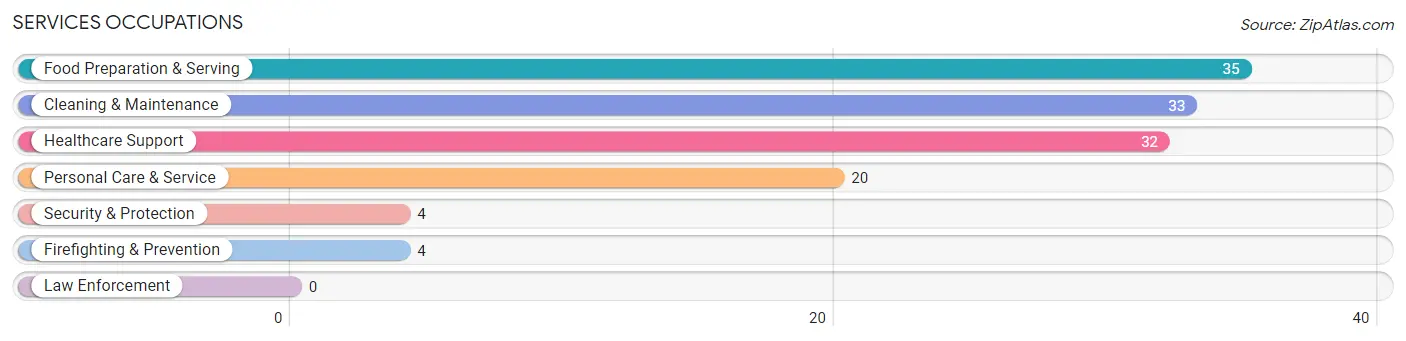
Services Occupations
The most common Services occupations in Apollo borough are Food Preparation & Serving (35 | 5.8%), Cleaning & Maintenance (33 | 5.5%), Healthcare Support (32 | 5.3%), Personal Care & Service (20 | 3.3%), and Security & Protection (4 | 0.7%).
Services Occupations by Sex
Within the Services occupations in Apollo borough, the most male-oriented occupations are Security & Protection (100.0%), Firefighting & Prevention (100.0%), and Cleaning & Maintenance (45.5%), while the most female-oriented occupations are Personal Care & Service (100.0%), Food Preparation & Serving (97.1%), and Healthcare Support (68.8%).
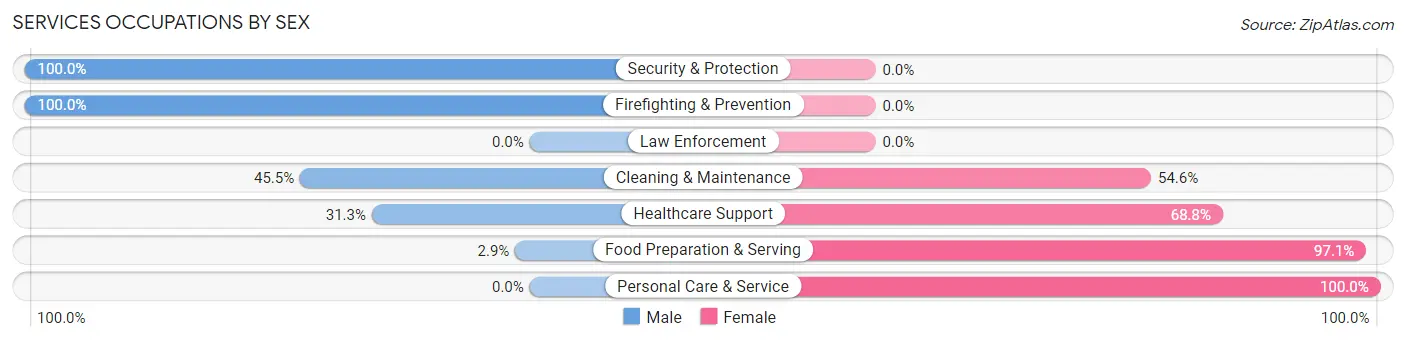
| Occupation | Male | Female |
| Healthcare Support | 10 (31.2%) | 22 (68.8%) |
| Security & Protection | 4 (100.0%) | 0 (0.0%) |
| Firefighting & Prevention | 4 (100.0%) | 0 (0.0%) |
| Law Enforcement | 0 (0.0%) | 0 (0.0%) |
| Food Preparation & Serving | 1 (2.9%) | 34 (97.1%) |
| Cleaning & Maintenance | 15 (45.5%) | 18 (54.5%) |
| Personal Care & Service | 0 (0.0%) | 20 (100.0%) |
| Total (Category) | 30 (24.2%) | 94 (75.8%) |
| Total (Overall) | 317 (52.5%) | 287 (47.5%) |
Sales and Office Occupations
The most common Sales and Office occupations in Apollo borough are Office & Administration (84 | 13.9%), and Sales & Related (51 | 8.4%).

Sales and Office Occupations by Sex

| Occupation | Male | Female |
| Sales & Related | 26 (51.0%) | 25 (49.0%) |
| Office & Administration | 9 (10.7%) | 75 (89.3%) |
| Total (Category) | 35 (25.9%) | 100 (74.1%) |
| Total (Overall) | 317 (52.5%) | 287 (47.5%) |
Natural Resources, Construction and Maintenance Occupations
The most common Natural Resources, Construction and Maintenance occupations in Apollo borough are Construction & Extraction (23 | 3.8%), Installation, Maintenance & Repair (14 | 2.3%), and Farming, Fishing & Forestry (3 | 0.5%).

Natural Resources, Construction and Maintenance Occupations by Sex

| Occupation | Male | Female |
| Farming, Fishing & Forestry | 3 (100.0%) | 0 (0.0%) |
| Construction & Extraction | 23 (100.0%) | 0 (0.0%) |
| Installation, Maintenance & Repair | 14 (100.0%) | 0 (0.0%) |
| Total (Category) | 40 (100.0%) | 0 (0.0%) |
| Total (Overall) | 317 (52.5%) | 287 (47.5%) |
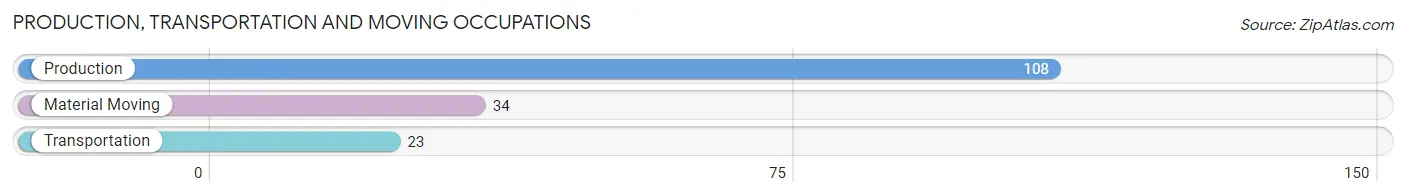
Production, Transportation and Moving Occupations
The most common Production, Transportation and Moving occupations in Apollo borough are Production (108 | 17.9%), Material Moving (34 | 5.6%), and Transportation (23 | 3.8%).
Production, Transportation and Moving Occupations by Sex
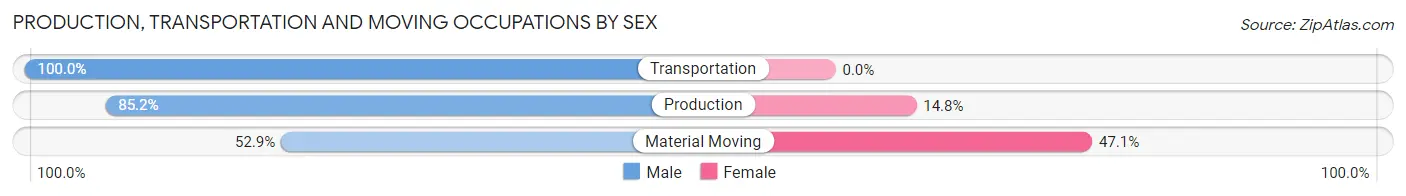
| Occupation | Male | Female |
| Production | 92 (85.2%) | 16 (14.8%) |
| Transportation | 23 (100.0%) | 0 (0.0%) |
| Material Moving | 18 (52.9%) | 16 (47.1%) |
| Total (Category) | 133 (80.6%) | 32 (19.4%) |
| Total (Overall) | 317 (52.5%) | 287 (47.5%) |
Employment Industries by Sex in Apollo borough
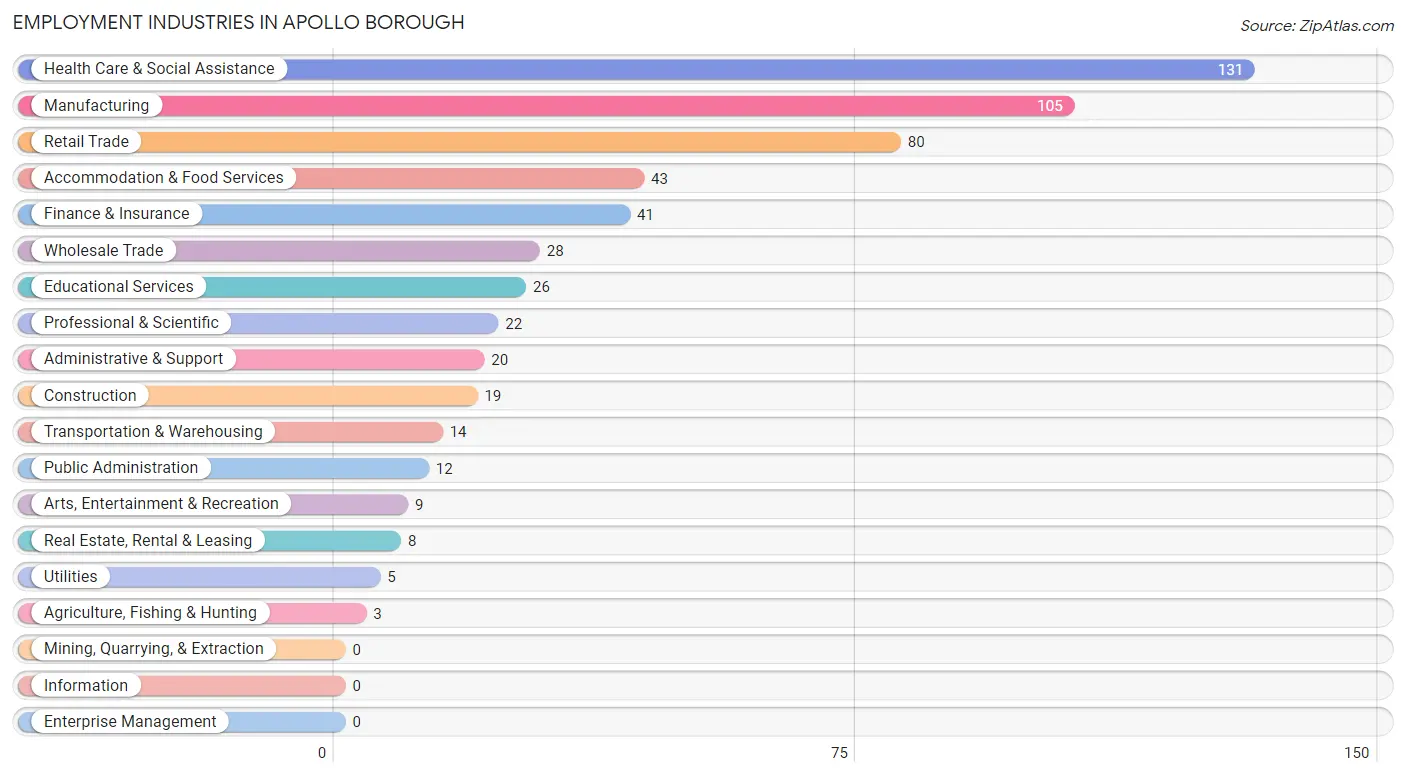
Employment Industries in Apollo borough
The major employment industries in Apollo borough include Health Care & Social Assistance (131 | 21.7%), Manufacturing (105 | 17.4%), Retail Trade (80 | 13.3%), Accommodation & Food Services (43 | 7.1%), and Finance & Insurance (41 | 6.8%).
Employment Industries by Sex in Apollo borough
The Apollo borough industries that see more men than women are Agriculture, Fishing & Hunting (100.0%), Construction (100.0%), and Transportation & Warehousing (100.0%), whereas the industries that tend to have a higher number of women are Public Administration (100.0%), Educational Services (80.8%), and Finance & Insurance (78.0%).
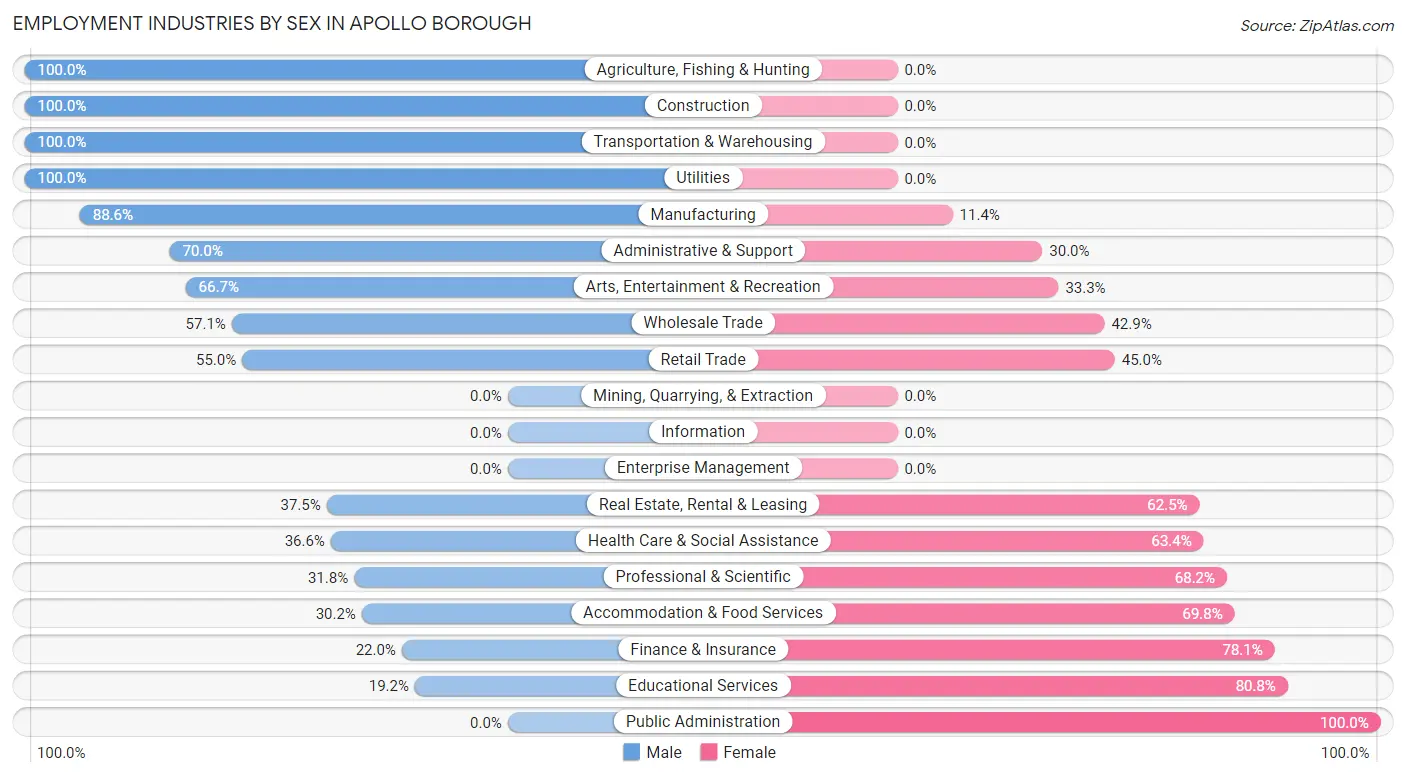
| Industry | Male | Female |
| Agriculture, Fishing & Hunting | 3 (100.0%) | 0 (0.0%) |
| Mining, Quarrying, & Extraction | 0 (0.0%) | 0 (0.0%) |
| Construction | 19 (100.0%) | 0 (0.0%) |
| Manufacturing | 93 (88.6%) | 12 (11.4%) |
| Wholesale Trade | 16 (57.1%) | 12 (42.9%) |
| Retail Trade | 44 (55.0%) | 36 (45.0%) |
| Transportation & Warehousing | 14 (100.0%) | 0 (0.0%) |
| Utilities | 5 (100.0%) | 0 (0.0%) |
| Information | 0 (0.0%) | 0 (0.0%) |
| Finance & Insurance | 9 (22.0%) | 32 (78.0%) |
| Real Estate, Rental & Leasing | 3 (37.5%) | 5 (62.5%) |
| Professional & Scientific | 7 (31.8%) | 15 (68.2%) |
| Enterprise Management | 0 (0.0%) | 0 (0.0%) |
| Administrative & Support | 14 (70.0%) | 6 (30.0%) |
| Educational Services | 5 (19.2%) | 21 (80.8%) |
| Health Care & Social Assistance | 48 (36.6%) | 83 (63.4%) |
| Arts, Entertainment & Recreation | 6 (66.7%) | 3 (33.3%) |
| Accommodation & Food Services | 13 (30.2%) | 30 (69.8%) |
| Public Administration | 0 (0.0%) | 12 (100.0%) |
| Total | 317 (52.5%) | 287 (47.5%) |
Education in Apollo borough
School Enrollment in Apollo borough
The most common levels of schooling among the 289 students in Apollo borough are high school (76 | 26.3%), middle school (63 | 21.8%), and elementary school (60 | 20.8%).
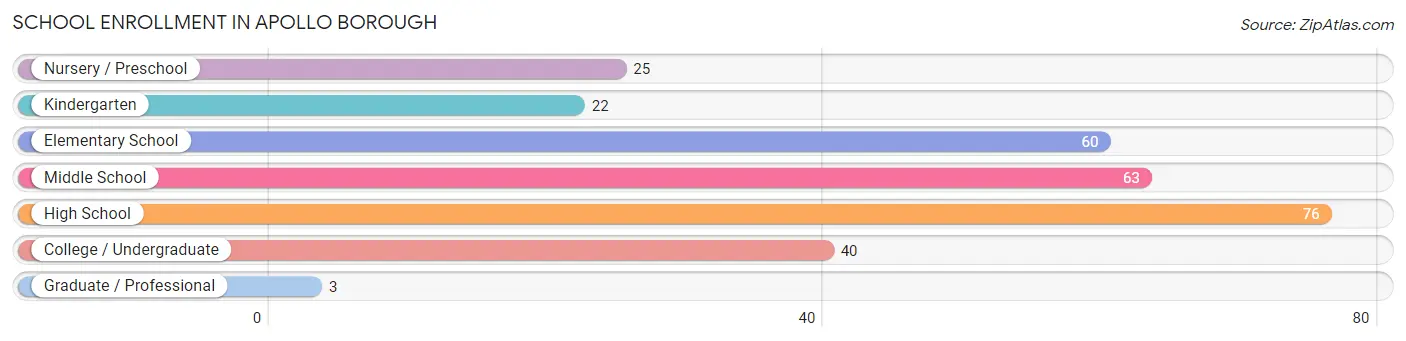
| School Level | # Students | % Students |
| Nursery / Preschool | 25 | 8.6% |
| Kindergarten | 22 | 7.6% |
| Elementary School | 60 | 20.8% |
| Middle School | 63 | 21.8% |
| High School | 76 | 26.3% |
| College / Undergraduate | 40 | 13.8% |
| Graduate / Professional | 3 | 1.0% |
| Total | 289 | 100.0% |
School Enrollment by Age by Funding Source in Apollo borough
Out of a total of 289 students who are enrolled in schools in Apollo borough, 19 (6.6%) attend a private institution, while the remaining 270 (93.4%) are enrolled in public schools. The age group of 18 to 19 year olds has the highest likelihood of being enrolled in private schools, with 11 (42.3% in the age bracket) enrolled. Conversely, the age group of 3 to 4 year olds has the lowest likelihood of being enrolled in a private school, with 21 (100.0% in the age bracket) attending a public institution.
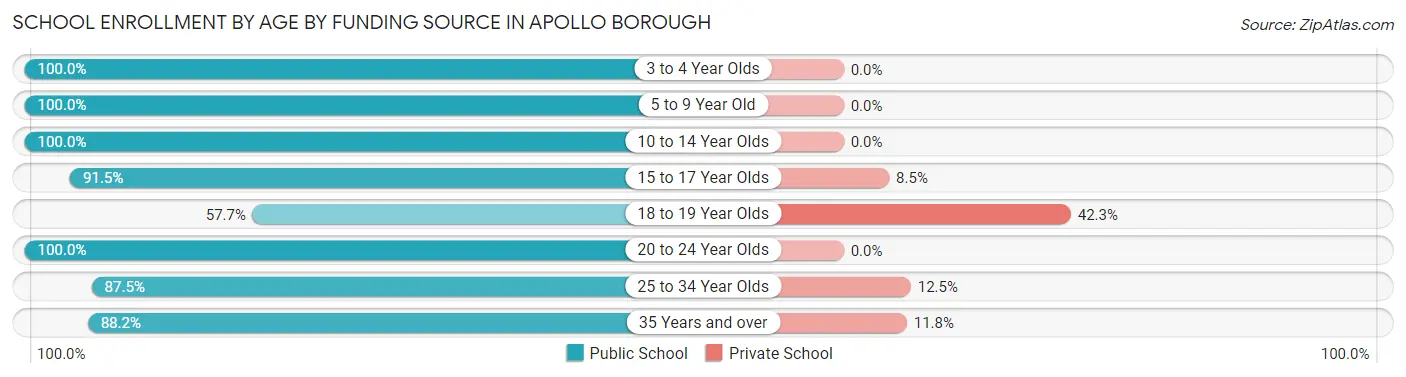
| Age Bracket | Public School | Private School |
| 3 to 4 Year Olds | 21 (100.0%) | 0 (0.0%) |
| 5 to 9 Year Old | 75 (100.0%) | 0 (0.0%) |
| 10 to 14 Year Olds | 71 (100.0%) | 0 (0.0%) |
| 15 to 17 Year Olds | 54 (91.5%) | 5 (8.5%) |
| 18 to 19 Year Olds | 15 (57.7%) | 11 (42.3%) |
| 20 to 24 Year Olds | 12 (100.0%) | 0 (0.0%) |
| 25 to 34 Year Olds | 7 (87.5%) | 1 (12.5%) |
| 35 Years and over | 15 (88.2%) | 2 (11.8%) |
| Total | 270 (93.4%) | 19 (6.6%) |
Educational Attainment by Field of Study in Apollo borough
Science & technology (21 | 18.9%), education (18 | 16.2%), bio, nature & agricultural (12 | 10.8%), business (12 | 10.8%), and psychology (8 | 7.2%) are the most common fields of study among 111 individuals in Apollo borough who have obtained a bachelor's degree or higher.
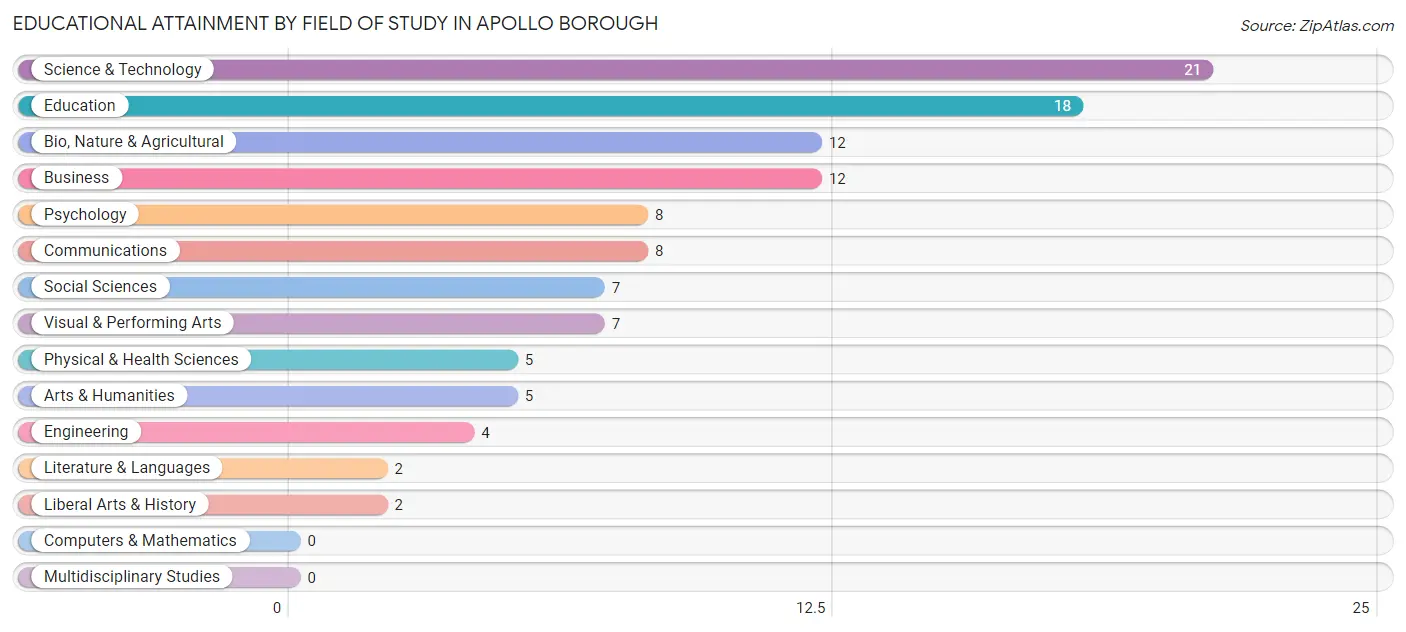
| Field of Study | # Graduates | % Graduates |
| Computers & Mathematics | 0 | 0.0% |
| Bio, Nature & Agricultural | 12 | 10.8% |
| Physical & Health Sciences | 5 | 4.5% |
| Psychology | 8 | 7.2% |
| Social Sciences | 7 | 6.3% |
| Engineering | 4 | 3.6% |
| Multidisciplinary Studies | 0 | 0.0% |
| Science & Technology | 21 | 18.9% |
| Business | 12 | 10.8% |
| Education | 18 | 16.2% |
| Literature & Languages | 2 | 1.8% |
| Liberal Arts & History | 2 | 1.8% |
| Visual & Performing Arts | 7 | 6.3% |
| Communications | 8 | 7.2% |
| Arts & Humanities | 5 | 4.5% |
| Total | 111 | 100.0% |
Transportation & Commute in Apollo borough
Vehicle Availability by Sex in Apollo borough
The most prevalent vehicle ownership categories in Apollo borough are males with 2 vehicles (186, accounting for 59.4%) and females with 2 vehicles (146, making up 66.0%).
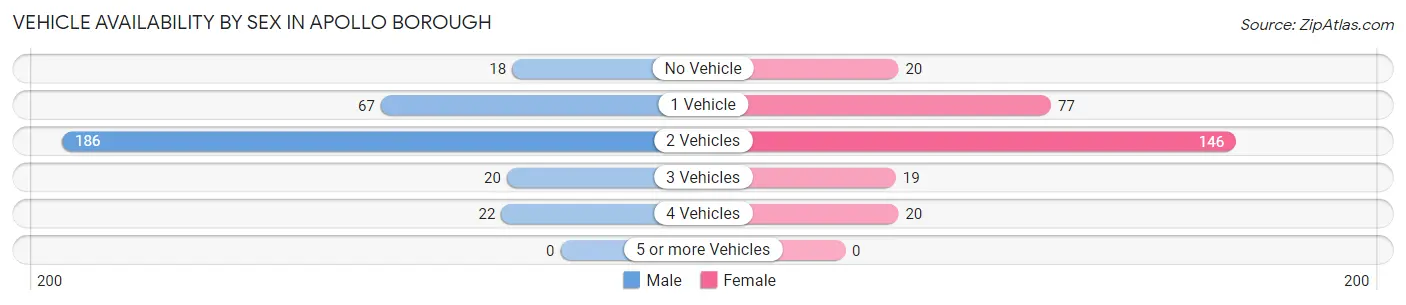
| Vehicles Available | Male | Female |
| No Vehicle | 18 (5.8%) | 20 (7.1%) |
| 1 Vehicle | 67 (21.4%) | 77 (27.3%) |
| 2 Vehicles | 186 (59.4%) | 146 (51.8%) |
| 3 Vehicles | 20 (6.4%) | 19 (6.7%) |
| 4 Vehicles | 22 (7.0%) | 20 (7.1%) |
| 5 or more Vehicles | 0 (0.0%) | 0 (0.0%) |
| Total | 313 (100.0%) | 282 (100.0%) |
Commute Time in Apollo borough
The most frequently occuring commute durations in Apollo borough are 10 to 14 minutes (114 commuters, 21.1%), 45 to 59 minutes (92 commuters, 17.0%), and less than 5 minutes (75 commuters, 13.9%).
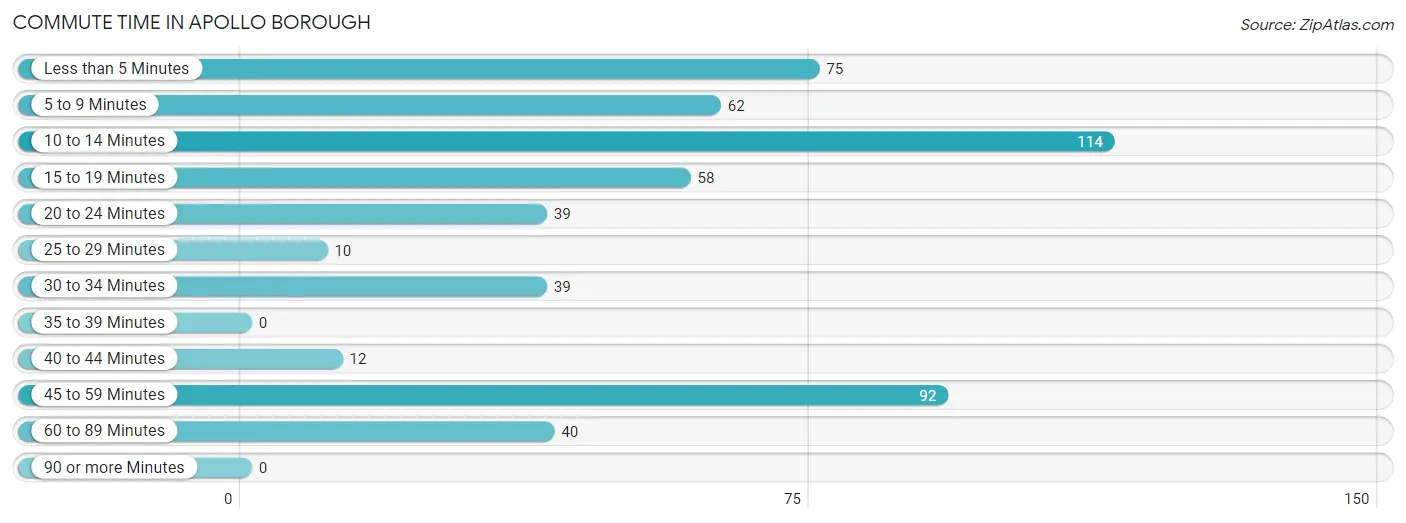
| Commute Time | # Commuters | % Commuters |
| Less than 5 Minutes | 75 | 13.9% |
| 5 to 9 Minutes | 62 | 11.5% |
| 10 to 14 Minutes | 114 | 21.1% |
| 15 to 19 Minutes | 58 | 10.7% |
| 20 to 24 Minutes | 39 | 7.2% |
| 25 to 29 Minutes | 10 | 1.8% |
| 30 to 34 Minutes | 39 | 7.2% |
| 35 to 39 Minutes | 0 | 0.0% |
| 40 to 44 Minutes | 12 | 2.2% |
| 45 to 59 Minutes | 92 | 17.0% |
| 60 to 89 Minutes | 40 | 7.4% |
| 90 or more Minutes | 0 | 0.0% |
Commute Time by Sex in Apollo borough
The most common commute times in Apollo borough are 10 to 14 minutes (80 commuters, 26.8%) for males and 45 to 59 minutes (50 commuters, 20.7%) for females.
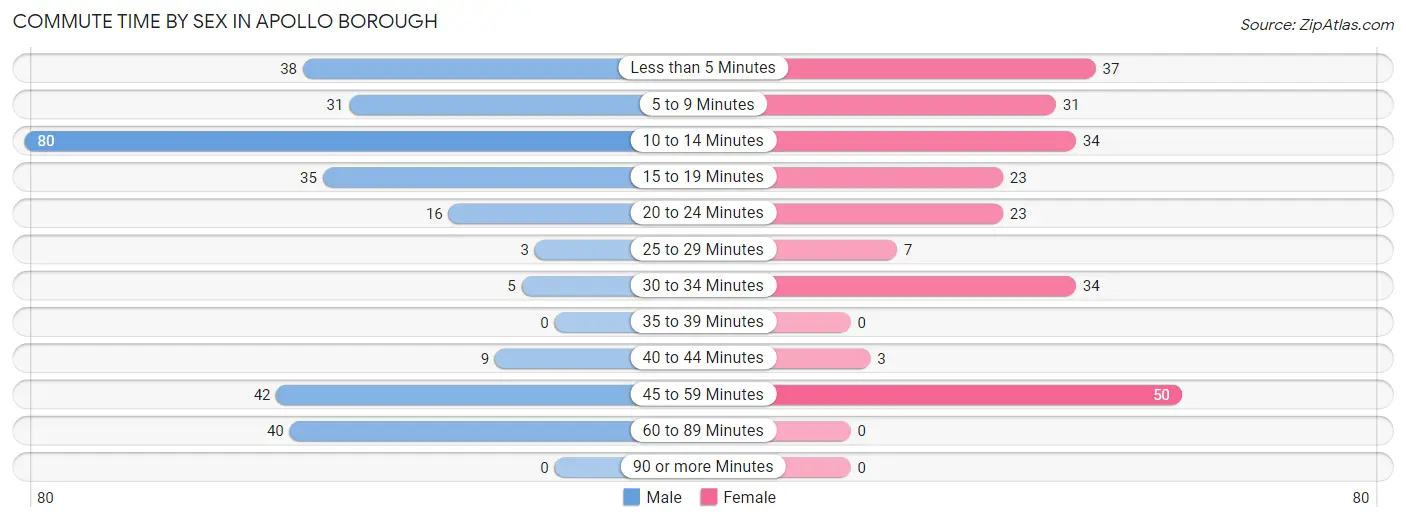
| Commute Time | Male | Female |
| Less than 5 Minutes | 38 (12.7%) | 37 (15.3%) |
| 5 to 9 Minutes | 31 (10.4%) | 31 (12.8%) |
| 10 to 14 Minutes | 80 (26.8%) | 34 (14.1%) |
| 15 to 19 Minutes | 35 (11.7%) | 23 (9.5%) |
| 20 to 24 Minutes | 16 (5.3%) | 23 (9.5%) |
| 25 to 29 Minutes | 3 (1.0%) | 7 (2.9%) |
| 30 to 34 Minutes | 5 (1.7%) | 34 (14.1%) |
| 35 to 39 Minutes | 0 (0.0%) | 0 (0.0%) |
| 40 to 44 Minutes | 9 (3.0%) | 3 (1.2%) |
| 45 to 59 Minutes | 42 (14.1%) | 50 (20.7%) |
| 60 to 89 Minutes | 40 (13.4%) | 0 (0.0%) |
| 90 or more Minutes | 0 (0.0%) | 0 (0.0%) |
Time of Departure to Work by Sex in Apollo borough
The most frequent times of departure to work in Apollo borough are 6:30 AM to 6:59 AM (40, 13.4%) for males and 7:00 AM to 7:29 AM (62, 25.6%) for females.
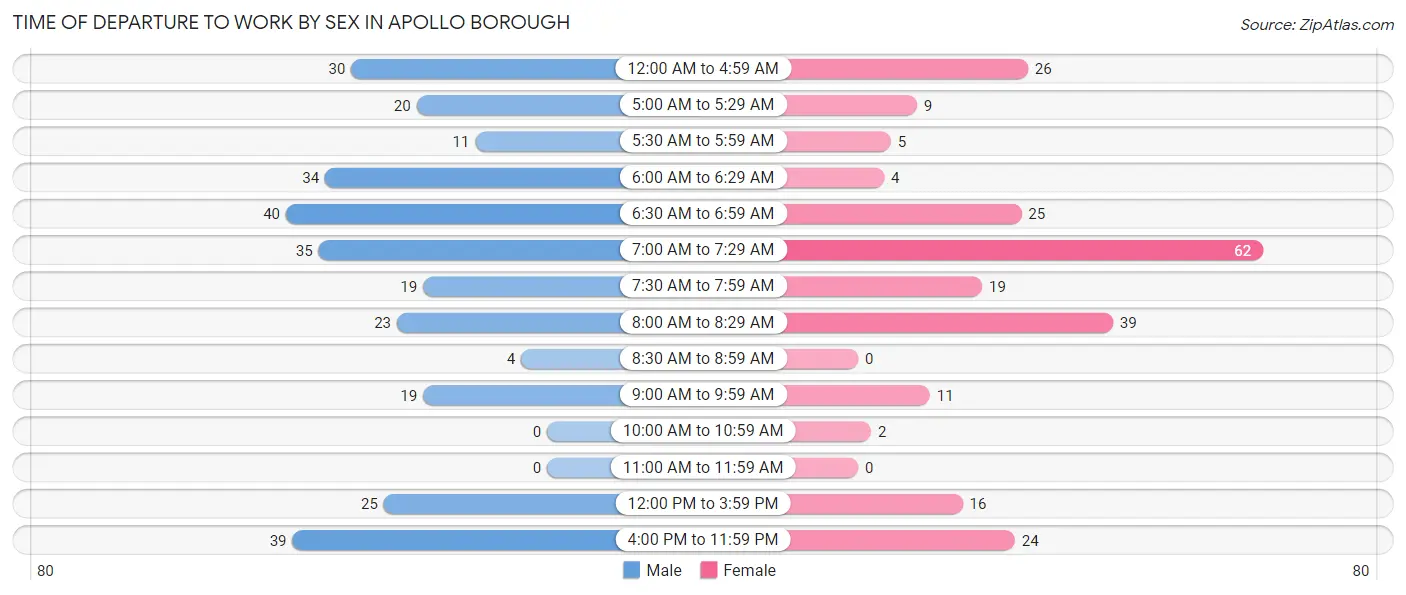
| Time of Departure | Male | Female |
| 12:00 AM to 4:59 AM | 30 (10.0%) | 26 (10.7%) |
| 5:00 AM to 5:29 AM | 20 (6.7%) | 9 (3.7%) |
| 5:30 AM to 5:59 AM | 11 (3.7%) | 5 (2.1%) |
| 6:00 AM to 6:29 AM | 34 (11.4%) | 4 (1.7%) |
| 6:30 AM to 6:59 AM | 40 (13.4%) | 25 (10.3%) |
| 7:00 AM to 7:29 AM | 35 (11.7%) | 62 (25.6%) |
| 7:30 AM to 7:59 AM | 19 (6.4%) | 19 (7.9%) |
| 8:00 AM to 8:29 AM | 23 (7.7%) | 39 (16.1%) |
| 8:30 AM to 8:59 AM | 4 (1.3%) | 0 (0.0%) |
| 9:00 AM to 9:59 AM | 19 (6.4%) | 11 (4.5%) |
| 10:00 AM to 10:59 AM | 0 (0.0%) | 2 (0.8%) |
| 11:00 AM to 11:59 AM | 0 (0.0%) | 0 (0.0%) |
| 12:00 PM to 3:59 PM | 25 (8.4%) | 16 (6.6%) |
| 4:00 PM to 11:59 PM | 39 (13.0%) | 24 (9.9%) |
| Total | 299 (100.0%) | 242 (100.0%) |
Housing Occupancy in Apollo borough
Occupancy by Ownership in Apollo borough
Of the total 530 dwellings in Apollo borough, owner-occupied units account for 326 (61.5%), while renter-occupied units make up 204 (38.5%).
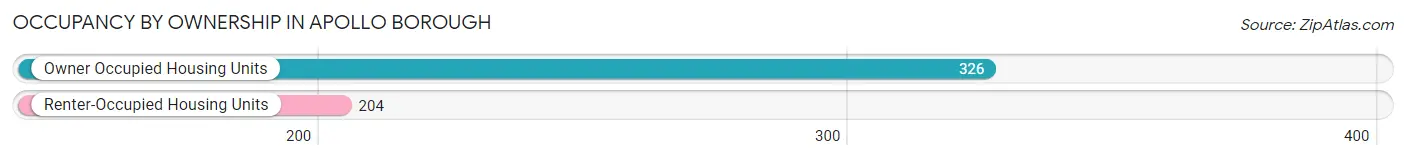
| Occupancy | # Housing Units | % Housing Units |
| Owner Occupied Housing Units | 326 | 61.5% |
| Renter-Occupied Housing Units | 204 | 38.5% |
| Total Occupied Housing Units | 530 | 100.0% |
Occupancy by Household Size in Apollo borough
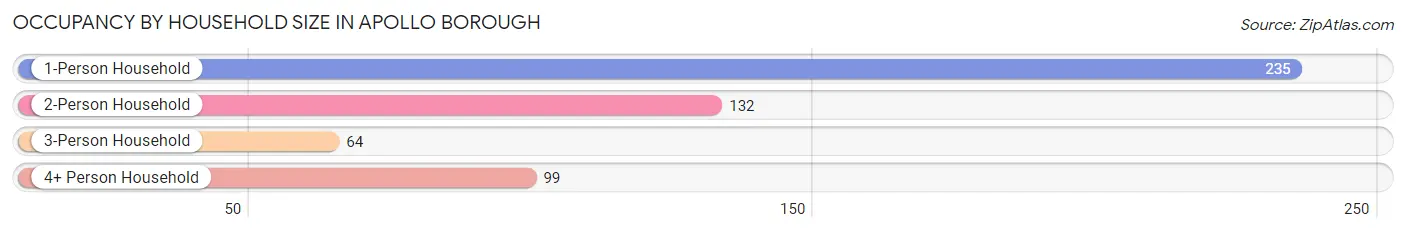
| Household Size | # Housing Units | % Housing Units |
| 1-Person Household | 235 | 44.3% |
| 2-Person Household | 132 | 24.9% |
| 3-Person Household | 64 | 12.1% |
| 4+ Person Household | 99 | 18.7% |
| Total Housing Units | 530 | 100.0% |
Occupancy by Ownership by Household Size in Apollo borough
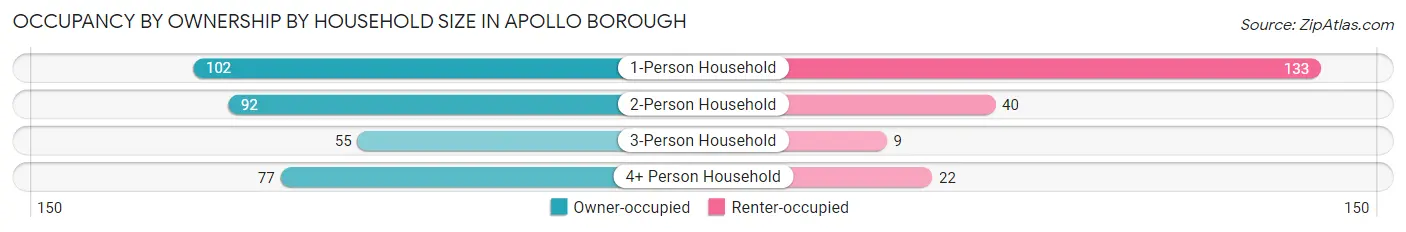
| Household Size | Owner-occupied | Renter-occupied |
| 1-Person Household | 102 (43.4%) | 133 (56.6%) |
| 2-Person Household | 92 (69.7%) | 40 (30.3%) |
| 3-Person Household | 55 (85.9%) | 9 (14.1%) |
| 4+ Person Household | 77 (77.8%) | 22 (22.2%) |
| Total Housing Units | 326 (61.5%) | 204 (38.5%) |
Occupancy by Educational Attainment in Apollo borough
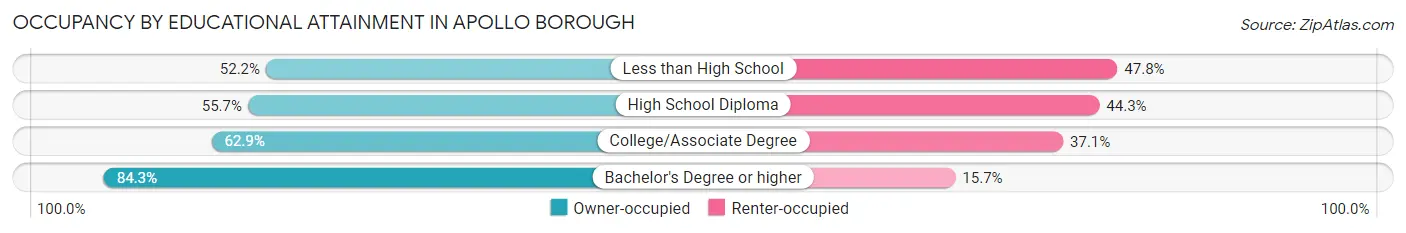
| Household Size | Owner-occupied | Renter-occupied |
| Less than High School | 24 (52.2%) | 22 (47.8%) |
| High School Diploma | 136 (55.7%) | 108 (44.3%) |
| College/Associate Degree | 107 (62.9%) | 63 (37.1%) |
| Bachelor's Degree or higher | 59 (84.3%) | 11 (15.7%) |
Occupancy by Age of Householder in Apollo borough
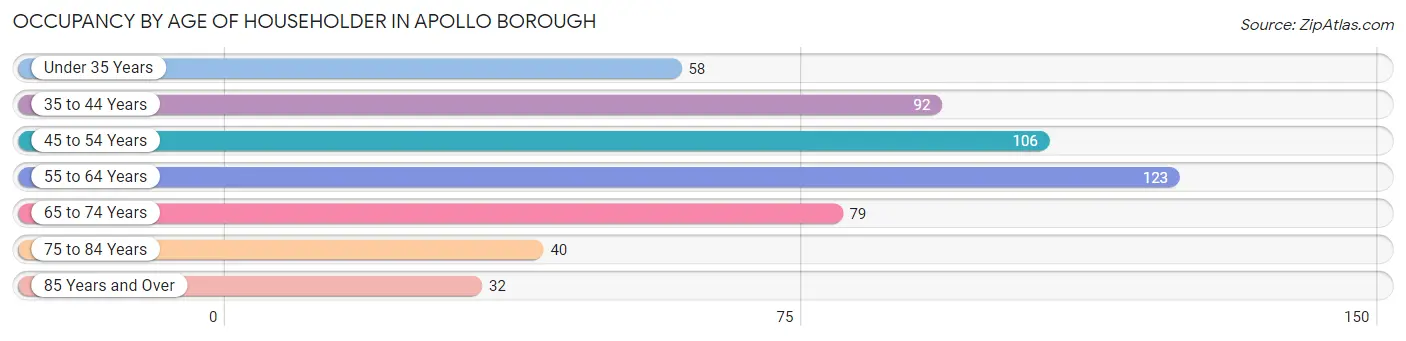
| Age Bracket | # Households | % Households |
| Under 35 Years | 58 | 10.9% |
| 35 to 44 Years | 92 | 17.4% |
| 45 to 54 Years | 106 | 20.0% |
| 55 to 64 Years | 123 | 23.2% |
| 65 to 74 Years | 79 | 14.9% |
| 75 to 84 Years | 40 | 7.5% |
| 85 Years and Over | 32 | 6.0% |
| Total | 530 | 100.0% |
Housing Finances in Apollo borough
Median Income by Occupancy in Apollo borough
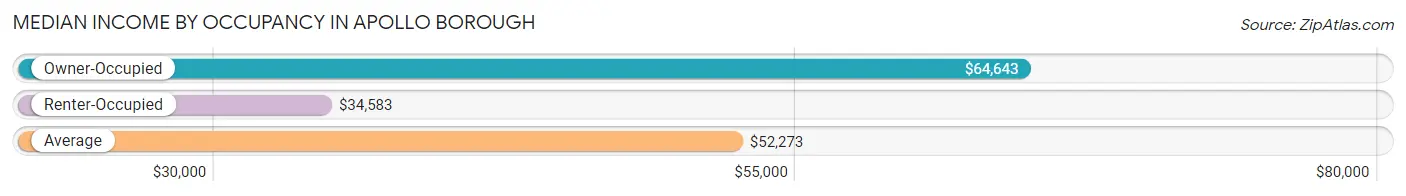
| Occupancy Type | # Households | Median Income |
| Owner-Occupied | 326 (61.5%) | $64,643 |
| Renter-Occupied | 204 (38.5%) | $34,583 |
| Average | 530 (100.0%) | $52,273 |
Occupancy by Householder Income Bracket in Apollo borough
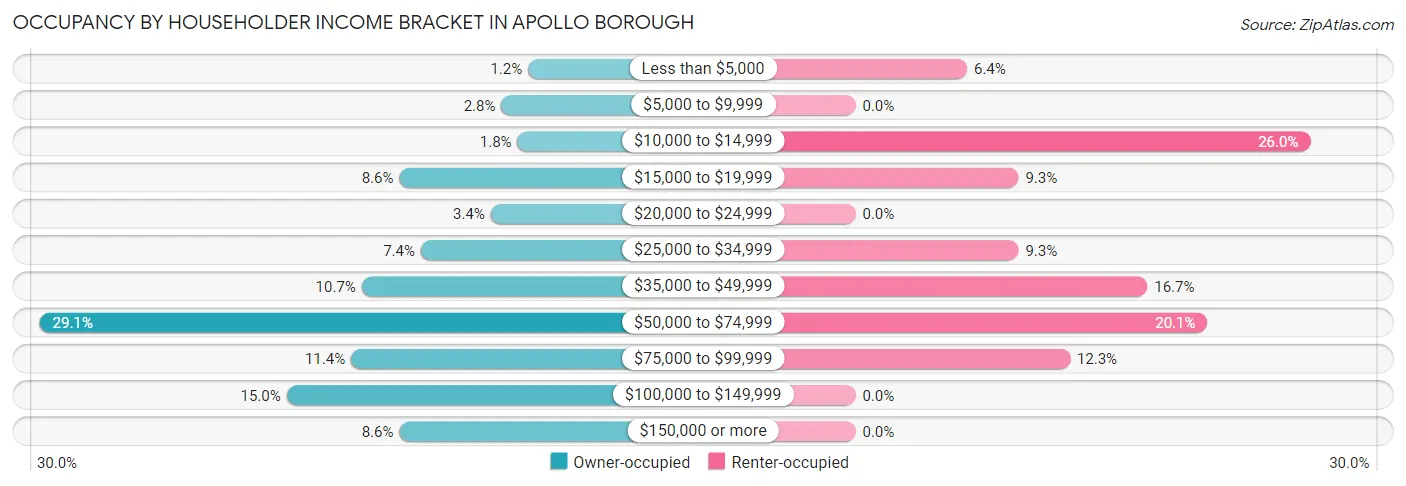
| Income Bracket | Owner-occupied | Renter-occupied |
| Less than $5,000 | 4 (1.2%) | 13 (6.4%) |
| $5,000 to $9,999 | 9 (2.8%) | 0 (0.0%) |
| $10,000 to $14,999 | 6 (1.8%) | 53 (26.0%) |
| $15,000 to $19,999 | 28 (8.6%) | 19 (9.3%) |
| $20,000 to $24,999 | 11 (3.4%) | 0 (0.0%) |
| $25,000 to $34,999 | 24 (7.4%) | 19 (9.3%) |
| $35,000 to $49,999 | 35 (10.7%) | 34 (16.7%) |
| $50,000 to $74,999 | 95 (29.1%) | 41 (20.1%) |
| $75,000 to $99,999 | 37 (11.4%) | 25 (12.2%) |
| $100,000 to $149,999 | 49 (15.0%) | 0 (0.0%) |
| $150,000 or more | 28 (8.6%) | 0 (0.0%) |
| Total | 326 (100.0%) | 204 (100.0%) |
Monthly Housing Cost Tiers in Apollo borough
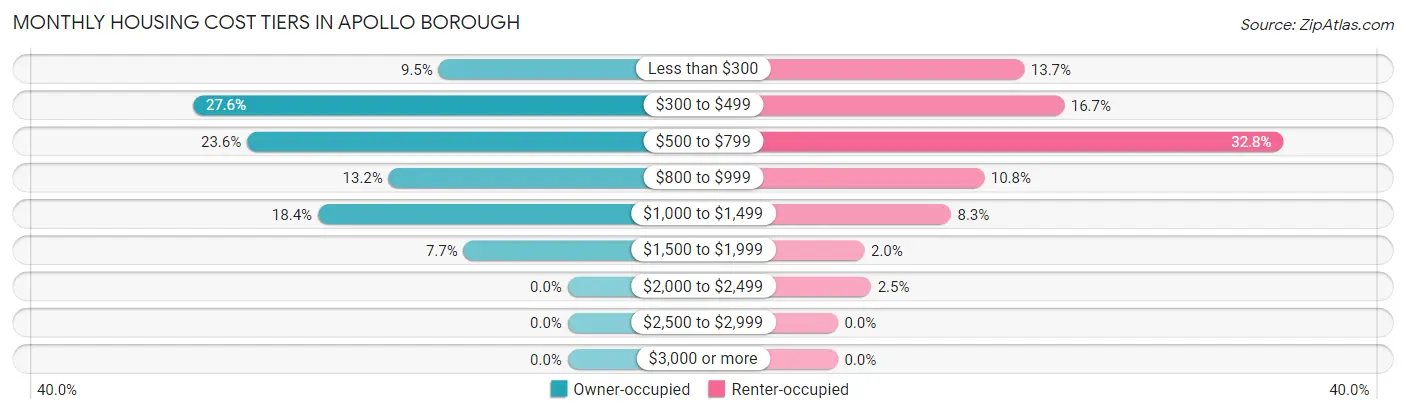
| Monthly Cost | Owner-occupied | Renter-occupied |
| Less than $300 | 31 (9.5%) | 28 (13.7%) |
| $300 to $499 | 90 (27.6%) | 34 (16.7%) |
| $500 to $799 | 77 (23.6%) | 67 (32.8%) |
| $800 to $999 | 43 (13.2%) | 22 (10.8%) |
| $1,000 to $1,499 | 60 (18.4%) | 17 (8.3%) |
| $1,500 to $1,999 | 25 (7.7%) | 4 (2.0%) |
| $2,000 to $2,499 | 0 (0.0%) | 5 (2.5%) |
| $2,500 to $2,999 | 0 (0.0%) | 0 (0.0%) |
| $3,000 or more | 0 (0.0%) | 0 (0.0%) |
| Total | 326 (100.0%) | 204 (100.0%) |
Physical Housing Characteristics in Apollo borough
Housing Structures in Apollo borough
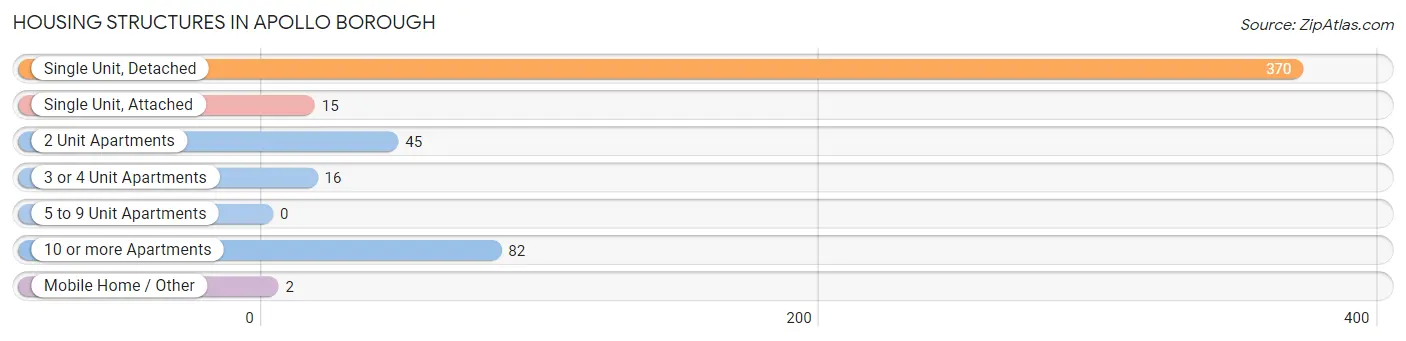
| Structure Type | # Housing Units | % Housing Units |
| Single Unit, Detached | 370 | 69.8% |
| Single Unit, Attached | 15 | 2.8% |
| 2 Unit Apartments | 45 | 8.5% |
| 3 or 4 Unit Apartments | 16 | 3.0% |
| 5 to 9 Unit Apartments | 0 | 0.0% |
| 10 or more Apartments | 82 | 15.5% |
| Mobile Home / Other | 2 | 0.4% |
| Total | 530 | 100.0% |
Housing Structures by Occupancy in Apollo borough
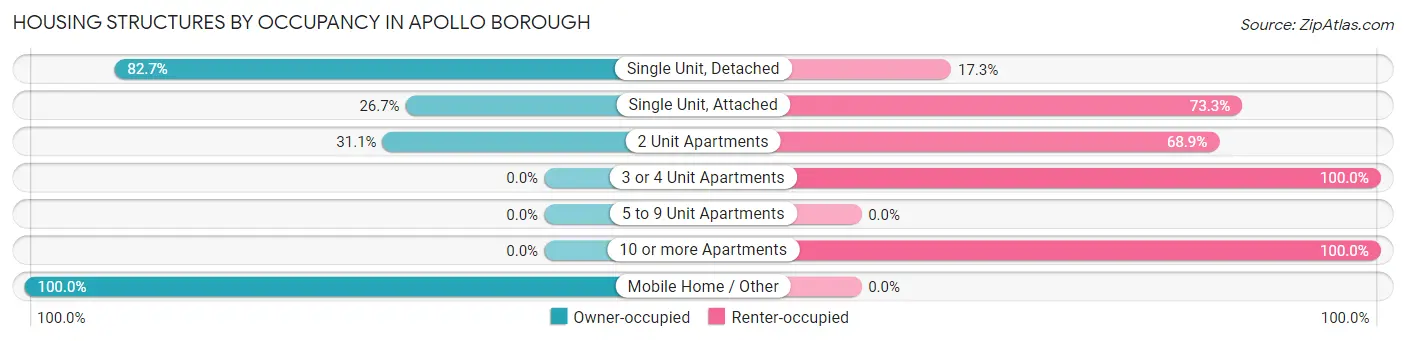
| Structure Type | Owner-occupied | Renter-occupied |
| Single Unit, Detached | 306 (82.7%) | 64 (17.3%) |
| Single Unit, Attached | 4 (26.7%) | 11 (73.3%) |
| 2 Unit Apartments | 14 (31.1%) | 31 (68.9%) |
| 3 or 4 Unit Apartments | 0 (0.0%) | 16 (100.0%) |
| 5 to 9 Unit Apartments | 0 (0.0%) | 0 (0.0%) |
| 10 or more Apartments | 0 (0.0%) | 82 (100.0%) |
| Mobile Home / Other | 2 (100.0%) | 0 (0.0%) |
| Total | 326 (61.5%) | 204 (38.5%) |
Housing Structures by Number of Rooms in Apollo borough
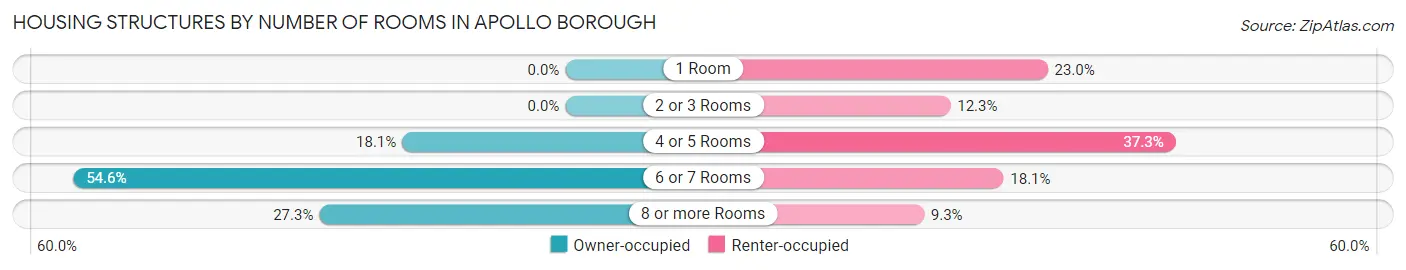
| Number of Rooms | Owner-occupied | Renter-occupied |
| 1 Room | 0 (0.0%) | 47 (23.0%) |
| 2 or 3 Rooms | 0 (0.0%) | 25 (12.2%) |
| 4 or 5 Rooms | 59 (18.1%) | 76 (37.2%) |
| 6 or 7 Rooms | 178 (54.6%) | 37 (18.1%) |
| 8 or more Rooms | 89 (27.3%) | 19 (9.3%) |
| Total | 326 (100.0%) | 204 (100.0%) |
Housing Structure by Heating Type in Apollo borough
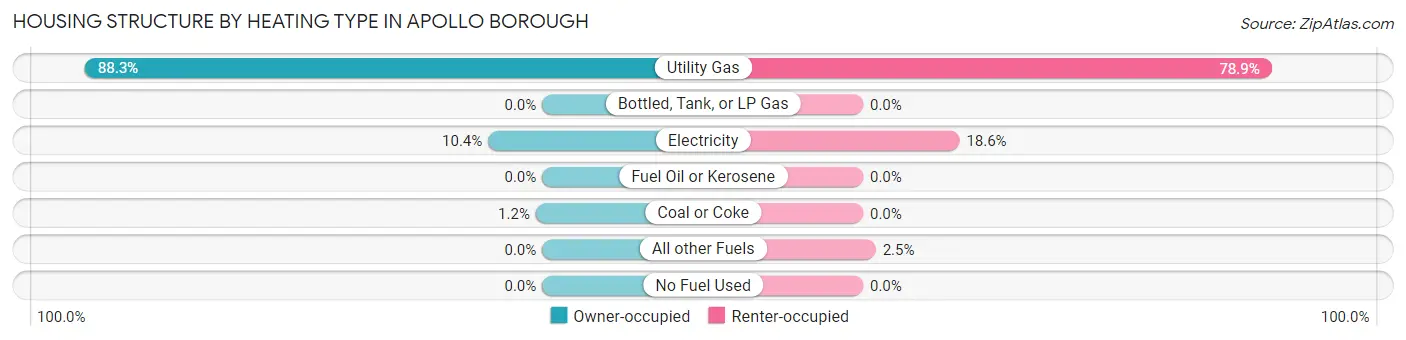
| Heating Type | Owner-occupied | Renter-occupied |
| Utility Gas | 288 (88.3%) | 161 (78.9%) |
| Bottled, Tank, or LP Gas | 0 (0.0%) | 0 (0.0%) |
| Electricity | 34 (10.4%) | 38 (18.6%) |
| Fuel Oil or Kerosene | 0 (0.0%) | 0 (0.0%) |
| Coal or Coke | 4 (1.2%) | 0 (0.0%) |
| All other Fuels | 0 (0.0%) | 5 (2.5%) |
| No Fuel Used | 0 (0.0%) | 0 (0.0%) |
| Total | 326 (100.0%) | 204 (100.0%) |
Household Vehicle Usage in Apollo borough
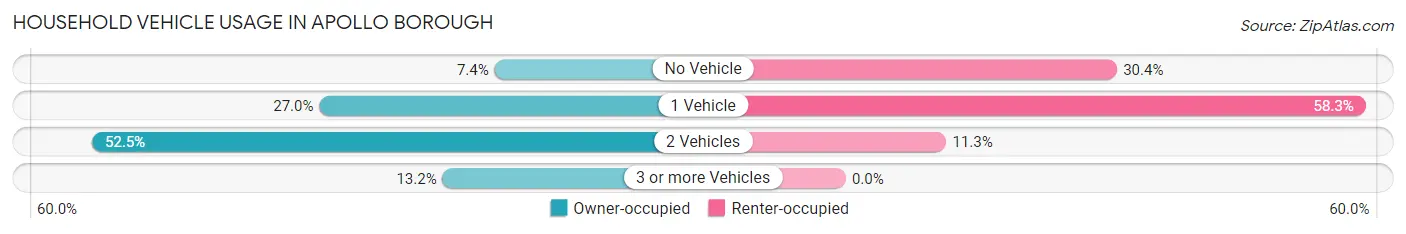
| Vehicles per Household | Owner-occupied | Renter-occupied |
| No Vehicle | 24 (7.4%) | 62 (30.4%) |
| 1 Vehicle | 88 (27.0%) | 119 (58.3%) |
| 2 Vehicles | 171 (52.4%) | 23 (11.3%) |
| 3 or more Vehicles | 43 (13.2%) | 0 (0.0%) |
| Total | 326 (100.0%) | 204 (100.0%) |
Real Estate & Mortgages in Apollo borough
Real Estate and Mortgage Overview in Apollo borough
| Characteristic | Without Mortgage | With Mortgage |
| Housing Units | 163 | 163 |
| Median Property Value | $68,400 | $84,400 |
| Median Household Income | $53,750 | $16 |
| Monthly Housing Costs | $393 | $0 |
| Real Estate Taxes | $1,244 | $0 |
Property Value by Mortgage Status in Apollo borough
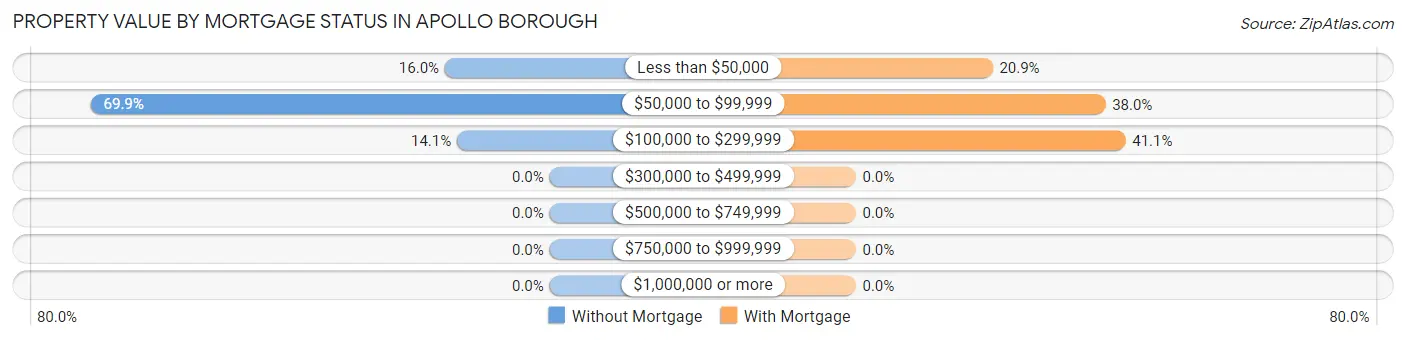
| Property Value | Without Mortgage | With Mortgage |
| Less than $50,000 | 26 (16.0%) | 34 (20.9%) |
| $50,000 to $99,999 | 114 (69.9%) | 62 (38.0%) |
| $100,000 to $299,999 | 23 (14.1%) | 67 (41.1%) |
| $300,000 to $499,999 | 0 (0.0%) | 0 (0.0%) |
| $500,000 to $749,999 | 0 (0.0%) | 0 (0.0%) |
| $750,000 to $999,999 | 0 (0.0%) | 0 (0.0%) |
| $1,000,000 or more | 0 (0.0%) | 0 (0.0%) |
| Total | 163 (100.0%) | 163 (100.0%) |
Household Income by Mortgage Status in Apollo borough
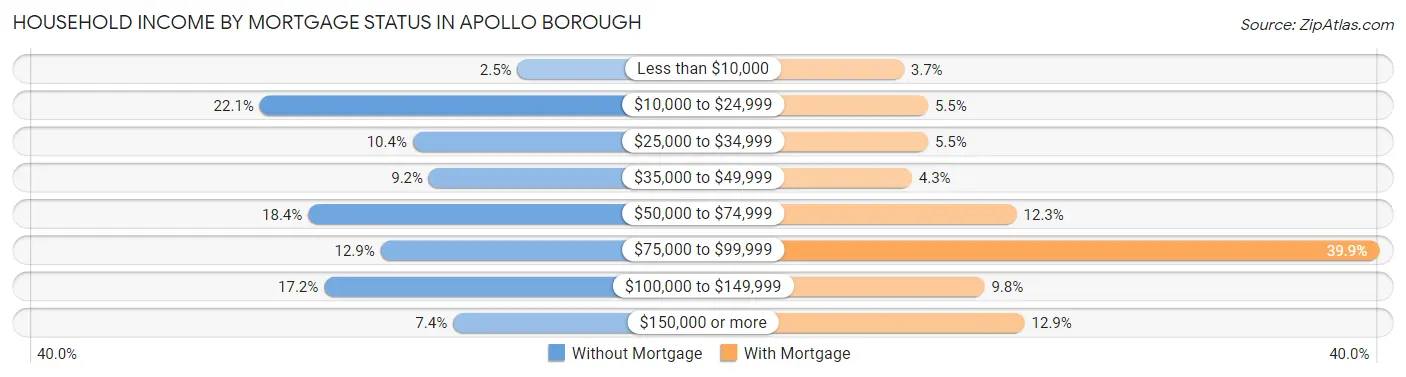
| Household Income | Without Mortgage | With Mortgage |
| Less than $10,000 | 4 (2.5%) | 6 (3.7%) |
| $10,000 to $24,999 | 36 (22.1%) | 9 (5.5%) |
| $25,000 to $34,999 | 17 (10.4%) | 9 (5.5%) |
| $35,000 to $49,999 | 15 (9.2%) | 7 (4.3%) |
| $50,000 to $74,999 | 30 (18.4%) | 20 (12.3%) |
| $75,000 to $99,999 | 21 (12.9%) | 65 (39.9%) |
| $100,000 to $149,999 | 28 (17.2%) | 16 (9.8%) |
| $150,000 or more | 12 (7.4%) | 21 (12.9%) |
| Total | 163 (100.0%) | 163 (100.0%) |
Property Value to Household Income Ratio in Apollo borough
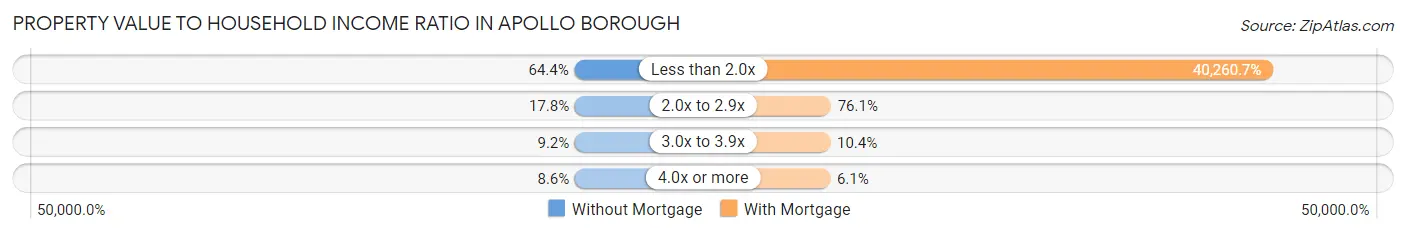
| Value-to-Income Ratio | Without Mortgage | With Mortgage |
| Less than 2.0x | 105 (64.4%) | 65,625 (40,260.7%) |
| 2.0x to 2.9x | 29 (17.8%) | 124 (76.1%) |
| 3.0x to 3.9x | 15 (9.2%) | 17 (10.4%) |
| 4.0x or more | 14 (8.6%) | 10 (6.1%) |
| Total | 163 (100.0%) | 163 (100.0%) |
Real Estate Taxes by Mortgage Status in Apollo borough
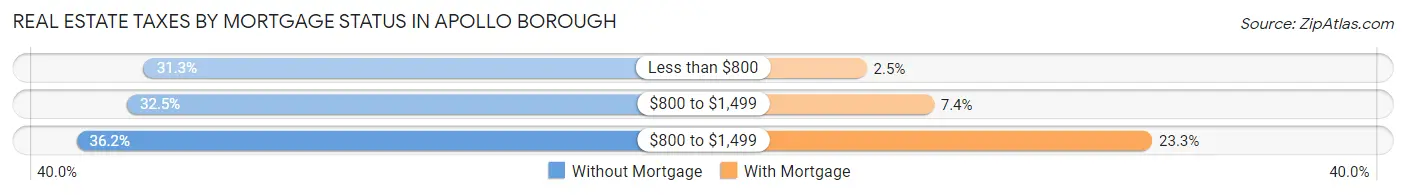
| Property Taxes | Without Mortgage | With Mortgage |
| Less than $800 | 51 (31.3%) | 4 (2.5%) |
| $800 to $1,499 | 53 (32.5%) | 12 (7.4%) |
| $800 to $1,499 | 59 (36.2%) | 38 (23.3%) |
| Total | 163 (100.0%) | 163 (100.0%) |
Health & Disability in Apollo borough
Health Insurance Coverage by Age in Apollo borough
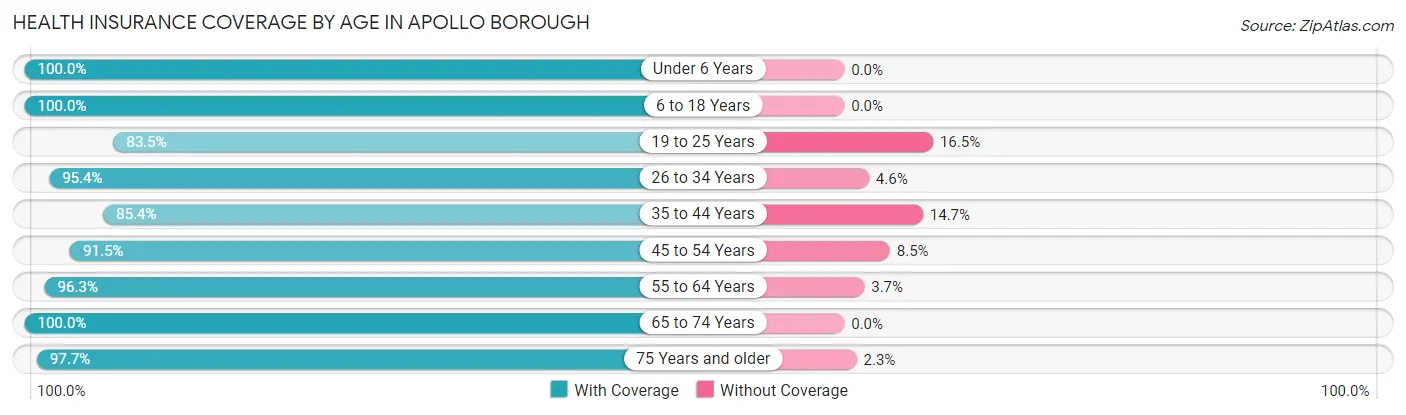
| Age Bracket | With Coverage | Without Coverage |
| Under 6 Years | 69 (100.0%) | 0 (0.0%) |
| 6 to 18 Years | 219 (100.0%) | 0 (0.0%) |
| 19 to 25 Years | 111 (83.5%) | 22 (16.5%) |
| 26 to 34 Years | 104 (95.4%) | 5 (4.6%) |
| 35 to 44 Years | 134 (85.4%) | 23 (14.6%) |
| 45 to 54 Years | 183 (91.5%) | 17 (8.5%) |
| 55 to 64 Years | 155 (96.3%) | 6 (3.7%) |
| 65 to 74 Years | 105 (100.0%) | 0 (0.0%) |
| 75 Years and older | 85 (97.7%) | 2 (2.3%) |
| Total | 1,165 (94.0%) | 75 (6.0%) |
Health Insurance Coverage by Citizenship Status in Apollo borough

| Citizenship Status | With Coverage | Without Coverage |
| Native Born | 69 (100.0%) | 0 (0.0%) |
| Foreign Born, Citizen | 219 (100.0%) | 0 (0.0%) |
| Foreign Born, not a Citizen | 111 (83.5%) | 22 (16.5%) |
Health Insurance Coverage by Household Income in Apollo borough
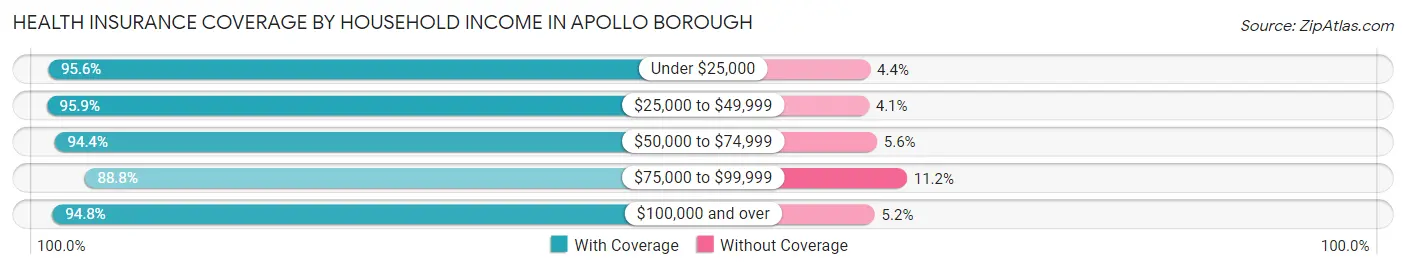
| Household Income | With Coverage | Without Coverage |
| Under $25,000 | 153 (95.6%) | 7 (4.4%) |
| $25,000 to $49,999 | 233 (95.9%) | 10 (4.1%) |
| $50,000 to $74,999 | 402 (94.4%) | 24 (5.6%) |
| $75,000 to $99,999 | 150 (88.8%) | 19 (11.2%) |
| $100,000 and over | 218 (94.8%) | 12 (5.2%) |
Public vs Private Health Insurance Coverage by Age in Apollo borough
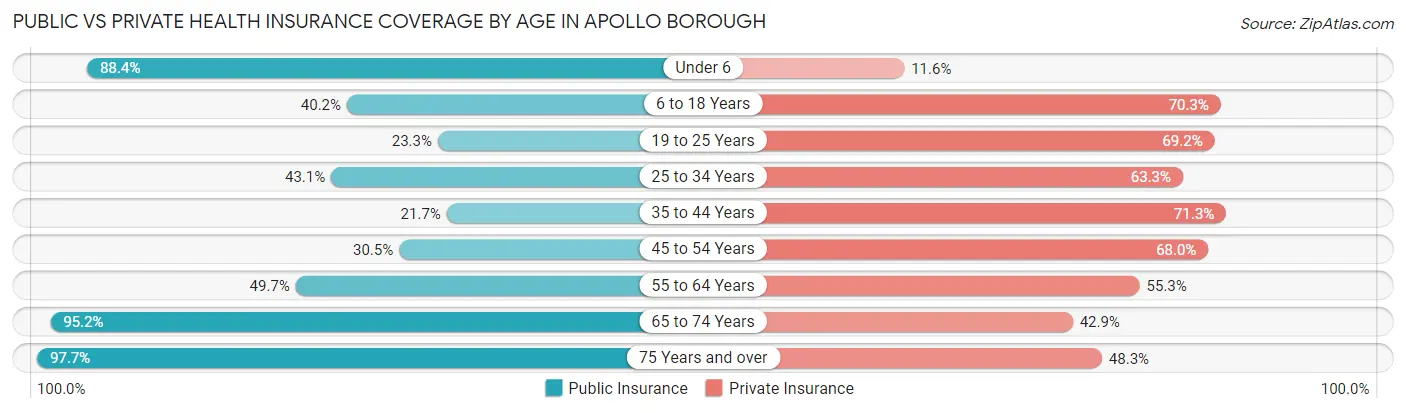
| Age Bracket | Public Insurance | Private Insurance |
| Under 6 | 61 (88.4%) | 8 (11.6%) |
| 6 to 18 Years | 88 (40.2%) | 154 (70.3%) |
| 19 to 25 Years | 31 (23.3%) | 92 (69.2%) |
| 25 to 34 Years | 47 (43.1%) | 69 (63.3%) |
| 35 to 44 Years | 34 (21.7%) | 112 (71.3%) |
| 45 to 54 Years | 61 (30.5%) | 136 (68.0%) |
| 55 to 64 Years | 80 (49.7%) | 89 (55.3%) |
| 65 to 74 Years | 100 (95.2%) | 45 (42.9%) |
| 75 Years and over | 85 (97.7%) | 42 (48.3%) |
| Total | 587 (47.3%) | 747 (60.2%) |
Disability Status by Sex by Age in Apollo borough
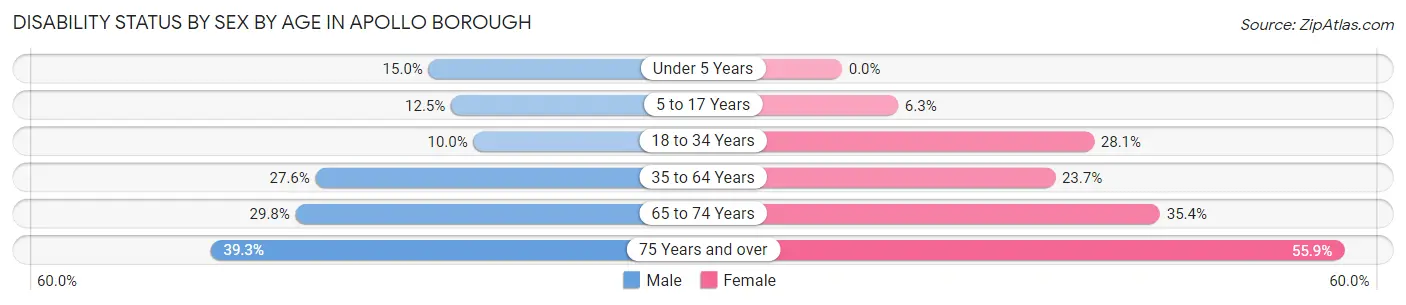
| Age Bracket | Male | Female |
| Under 5 Years | 6 (15.0%) | 0 (0.0%) |
| 5 to 17 Years | 12 (12.5%) | 7 (6.2%) |
| 18 to 34 Years | 15 (10.0%) | 32 (28.1%) |
| 35 to 64 Years | 72 (27.6%) | 61 (23.7%) |
| 65 to 74 Years | 17 (29.8%) | 17 (35.4%) |
| 75 Years and over | 11 (39.3%) | 33 (55.9%) |
Disability Class by Sex by Age in Apollo borough
Disability Class: Hearing Difficulty
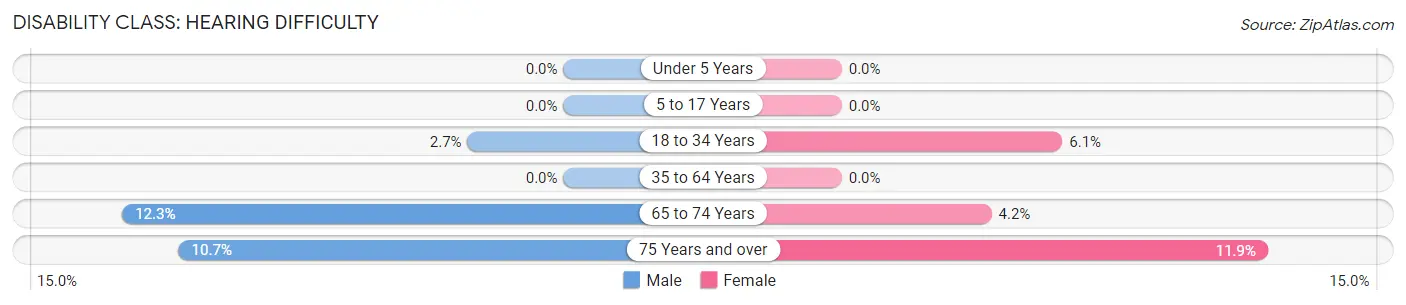
| Age Bracket | Male | Female |
| Under 5 Years | 0 (0.0%) | 0 (0.0%) |
| 5 to 17 Years | 0 (0.0%) | 0 (0.0%) |
| 18 to 34 Years | 4 (2.7%) | 7 (6.1%) |
| 35 to 64 Years | 0 (0.0%) | 0 (0.0%) |
| 65 to 74 Years | 7 (12.3%) | 2 (4.2%) |
| 75 Years and over | 3 (10.7%) | 7 (11.9%) |
Disability Class: Vision Difficulty

| Age Bracket | Male | Female |
| Under 5 Years | 6 (15.0%) | 0 (0.0%) |
| 5 to 17 Years | 4 (4.2%) | 4 (3.6%) |
| 18 to 34 Years | 0 (0.0%) | 11 (9.7%) |
| 35 to 64 Years | 7 (2.7%) | 16 (6.2%) |
| 65 to 74 Years | 0 (0.0%) | 0 (0.0%) |
| 75 Years and over | 6 (21.4%) | 3 (5.1%) |
Disability Class: Cognitive Difficulty
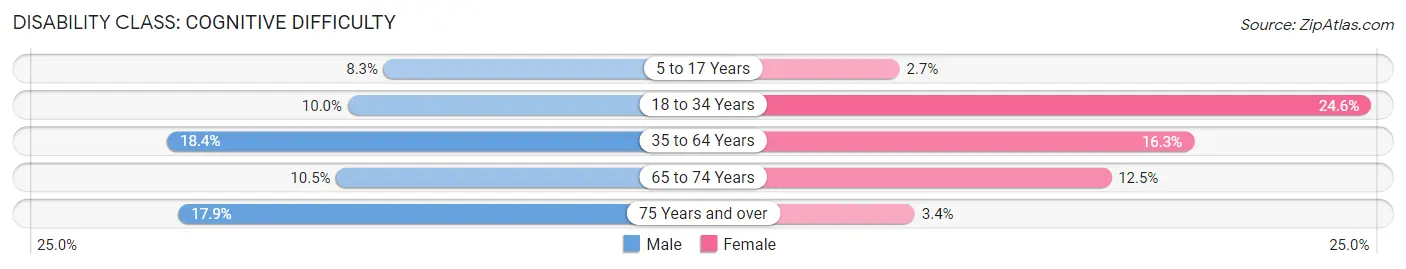
| Age Bracket | Male | Female |
| 5 to 17 Years | 8 (8.3%) | 3 (2.7%) |
| 18 to 34 Years | 15 (10.0%) | 28 (24.6%) |
| 35 to 64 Years | 48 (18.4%) | 42 (16.3%) |
| 65 to 74 Years | 6 (10.5%) | 6 (12.5%) |
| 75 Years and over | 5 (17.9%) | 2 (3.4%) |
Disability Class: Ambulatory Difficulty
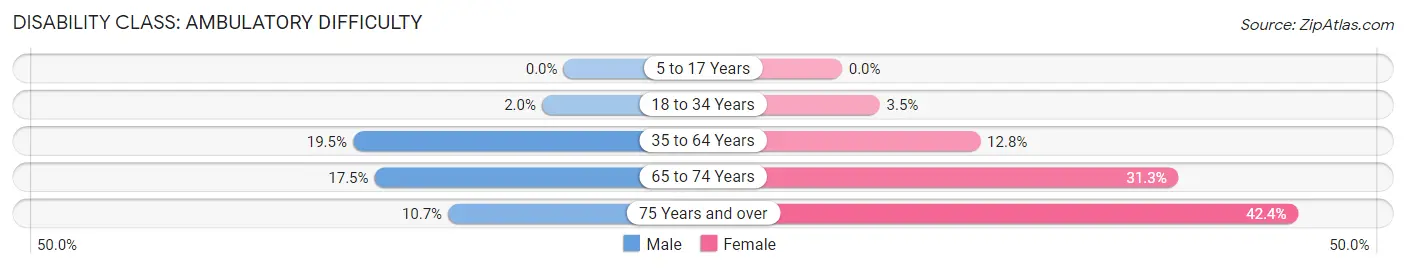
| Age Bracket | Male | Female |
| 5 to 17 Years | 0 (0.0%) | 0 (0.0%) |
| 18 to 34 Years | 3 (2.0%) | 4 (3.5%) |
| 35 to 64 Years | 51 (19.5%) | 33 (12.8%) |
| 65 to 74 Years | 10 (17.5%) | 15 (31.2%) |
| 75 Years and over | 3 (10.7%) | 25 (42.4%) |
Disability Class: Self-Care Difficulty
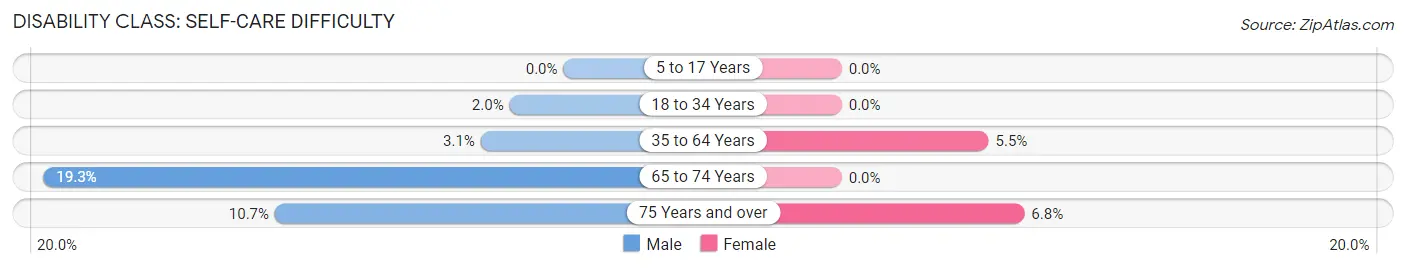
| Age Bracket | Male | Female |
| 5 to 17 Years | 0 (0.0%) | 0 (0.0%) |
| 18 to 34 Years | 3 (2.0%) | 0 (0.0%) |
| 35 to 64 Years | 8 (3.1%) | 14 (5.4%) |
| 65 to 74 Years | 11 (19.3%) | 0 (0.0%) |
| 75 Years and over | 3 (10.7%) | 4 (6.8%) |
Technology Access in Apollo borough
Computing Device Access in Apollo borough
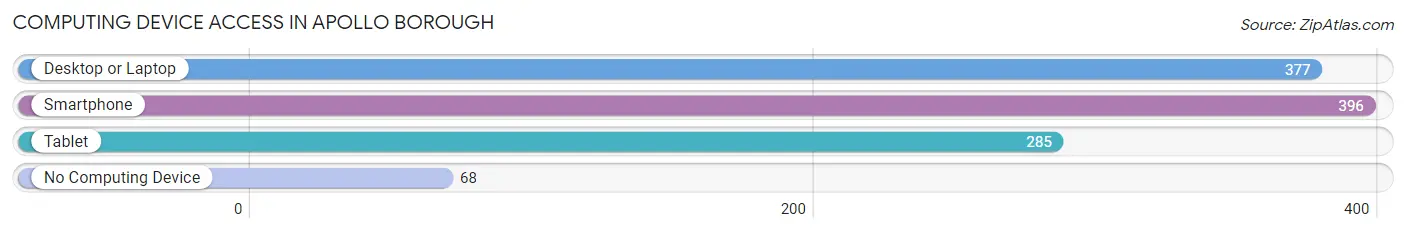
| Device Type | # Households | % Households |
| Desktop or Laptop | 377 | 71.1% |
| Smartphone | 396 | 74.7% |
| Tablet | 285 | 53.8% |
| No Computing Device | 68 | 12.8% |
| Total | 530 | 100.0% |
Internet Access in Apollo borough
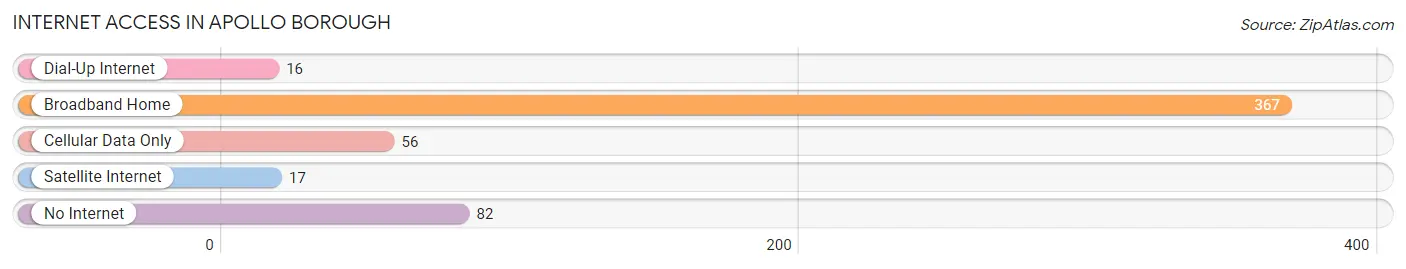
| Internet Type | # Households | % Households |
| Dial-Up Internet | 16 | 3.0% |
| Broadband Home | 367 | 69.3% |
| Cellular Data Only | 56 | 10.6% |
| Satellite Internet | 17 | 3.2% |
| No Internet | 82 | 15.5% |
| Total | 530 | 100.0% |
Apollo borough Summary
Apollo Borough is a small borough located in Armstrong County, Pennsylvania. It is situated in the Allegheny Valley, approximately 30 miles northeast of Pittsburgh. The borough has a population of approximately 2,000 people and covers an area of 0.6 square miles.
History
The area that is now Apollo Borough was first settled in the late 1700s by German immigrants. The town was originally known as “Krebs”, after the family that owned the land. In 1836, the town was renamed “Apollo” after the Greek god of the sun. The town was officially incorporated as a borough in 1876.
In the late 1800s, Apollo Borough was a thriving industrial center. The Apollo Iron Works, which was founded in 1872, was the largest employer in the area. The iron works produced a variety of products, including stoves, boilers, and other metal products. The Apollo Iron Works closed in the early 1900s, but the town continued to be a center of industry. The Apollo Carriage Works, which produced carriages and wagons, was the largest employer in the area until it closed in the 1950s.
Geography
Apollo Borough is located in the Allegheny Valley, approximately 30 miles northeast of Pittsburgh. The borough is situated on the banks of the Kiskiminetas River. The terrain is mostly flat, with some rolling hills in the northern part of the borough. The climate is humid continental, with cold winters and hot, humid summers.
Economy
The economy of Apollo Borough is largely based on manufacturing and services. The largest employers in the area are the Apollo Foundry, which produces cast iron products, and the Apollo Machine Works, which produces machine parts. Other major employers include the Apollo Carpet Company, the Apollo Glass Company, and the Apollo Plastics Company.
The borough also has a number of small businesses, including restaurants, retail stores, and professional services. The Apollo Borough Chamber of Commerce promotes local businesses and provides resources to help them succeed.
Demographics
As of the 2010 census, the population of Apollo Borough was 2,000. The racial makeup of the borough was 97.2% White, 0.7% African American, 0.3% Native American, 0.3% Asian, and 1.5% from other races. The median household income was $37,500, and the median family income was $45,000.
The population of Apollo Borough is largely made up of families. Approximately 60% of households have children under the age of 18. The borough has a low crime rate and a high rate of homeownership.
Conclusion
Apollo Borough is a small borough located in Armstrong County, Pennsylvania. It has a population of approximately 2,000 people and covers an area of 0.6 square miles. The borough has a long history of industry and is home to a number of small businesses. The population is largely made up of families, and the borough has a low crime rate and a high rate of homeownership.
Common Questions
What is Per Capita Income in Apollo borough?
Per Capita income in Apollo borough is $26,375.
What is the Median Family Income in Apollo borough?
Median Family Income in Apollo borough is $67,250.
What is the Median Household income in Apollo borough?
Median Household Income in Apollo borough is $52,273.
What is Income or Wage Gap in Apollo borough?
Income or Wage Gap in Apollo borough is 42.3%.
Women in Apollo borough earn 57.7 cents for every dollar earned by a man.
What is Inequality or Gini Index in Apollo borough?
Inequality or Gini Index in Apollo borough is 0.42.
What is the Total Population of Apollo borough?
Total Population of Apollo borough is 1,247.
What is the Total Male Population of Apollo borough?
Total Male Population of Apollo borough is 636.
What is the Total Female Population of Apollo borough?
Total Female Population of Apollo borough is 611.
What is the Ratio of Males per 100 Females in Apollo borough?
There are 104.09 Males per 100 Females in Apollo borough.
What is the Ratio of Females per 100 Males in Apollo borough?
There are 96.07 Females per 100 Males in Apollo borough.
What is the Median Population Age in Apollo borough?
Median Population Age in Apollo borough is 41.4 Years.
What is the Average Family Size in Apollo borough
Average Family Size in Apollo borough is 3.4 People.
What is the Average Household Size in Apollo borough
Average Household Size in Apollo borough is 2.3 People.
How Large is the Labor Force in Apollo borough?
There are 657 People in the Labor Forcein in Apollo borough.
What is the Percentage of People in the Labor Force in Apollo borough?
64.9% of People are in the Labor Force in Apollo borough.
What is the Unemployment Rate in Apollo borough?
Unemployment Rate in Apollo borough is 8.1%.