Wellsboro borough, PA Map & Demographics
Wellsboro borough Overview
$35,846
PER CAPITA INCOME
$85,809
AVG FAMILY INCOME
$54,559
AVG HOUSEHOLD INCOME
17.4%
WAGE / INCOME GAP [ % ]
82.6¢/ $1
WAGE / INCOME GAP [ $ ]
0.47
INEQUALITY / GINI INDEX
3,459
TOTAL POPULATION
1,717
MALE POPULATION
1,742
FEMALE POPULATION
98.56
MALES / 100 FEMALES
101.46
FEMALES / 100 MALES
41.9
MEDIAN AGE
3.0
AVG FAMILY SIZE
2.2
AVG HOUSEHOLD SIZE
1,668
LABOR FORCE [ PEOPLE ]
59.3%
PERCENT IN LABOR FORCE
4.7%
UNEMPLOYMENT RATE
Income in Wellsboro borough
Income Overview in Wellsboro borough
Per Capita Income in Wellsboro borough is $35,846, while median incomes of families and households are $85,809 and $54,559 respectively.
| Characteristic | Number | Measure |
| Per Capita Income | 3,459 | $35,846 |
| Median Family Income | 819 | $85,809 |
| Mean Family Income | 819 | $111,558 |
| Median Household Income | 1,508 | $54,559 |
| Mean Household Income | 1,508 | $79,940 |
| Income Deficit | 819 | $0 |
| Wage / Income Gap (%) | 3,459 | 17.40% |
| Wage / Income Gap ($) | 3,459 | 82.60¢ per $1 |
| Gini / Inequality Index | 3,459 | 0.47 |
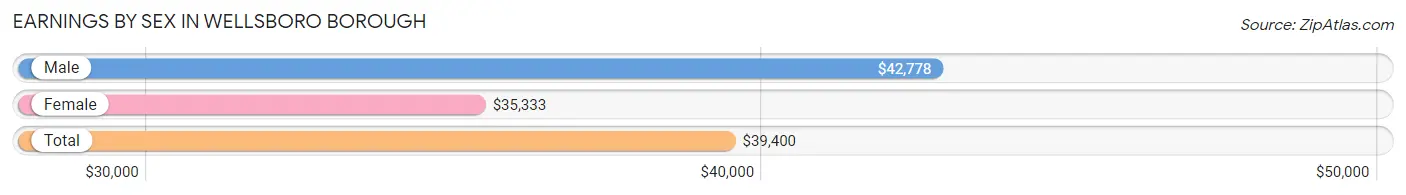
Earnings by Sex in Wellsboro borough
Average Earnings in Wellsboro borough are $39,400, $42,778 for men and $35,333 for women, a difference of 17.4%.
| Sex | Number | Average Earnings |
| Male | 834 (48.4%) | $42,778 |
| Female | 888 (51.6%) | $35,333 |
| Total | 1,722 (100.0%) | $39,400 |
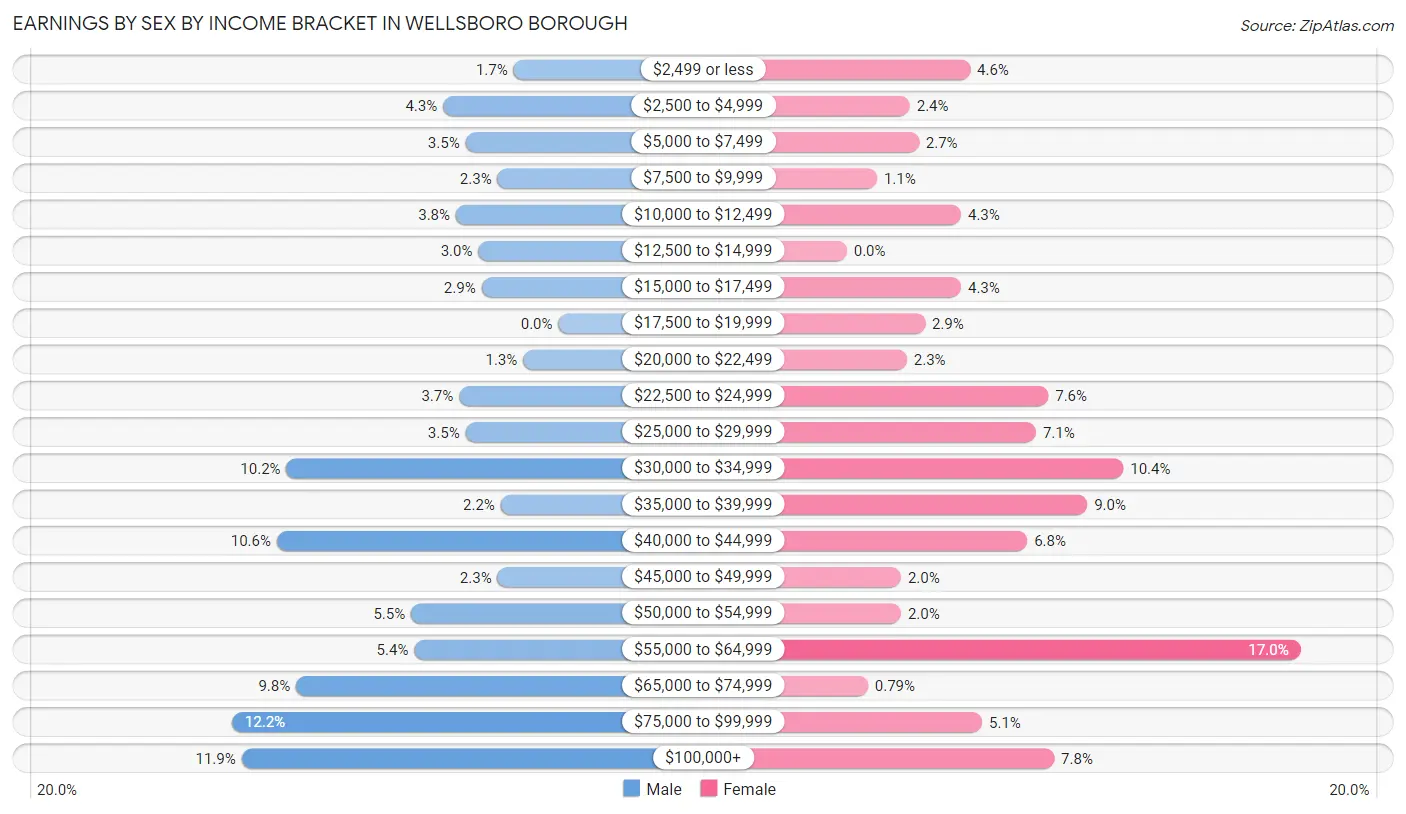
Earnings by Sex by Income Bracket in Wellsboro borough
The most common earnings brackets in Wellsboro borough are $75,000 to $99,999 for men (102 | 12.2%) and $55,000 to $64,999 for women (151 | 17.0%).
| Income | Male | Female |
| $2,499 or less | 14 (1.7%) | 41 (4.6%) |
| $2,500 to $4,999 | 36 (4.3%) | 21 (2.4%) |
| $5,000 to $7,499 | 29 (3.5%) | 24 (2.7%) |
| $7,500 to $9,999 | 19 (2.3%) | 10 (1.1%) |
| $10,000 to $12,499 | 32 (3.8%) | 38 (4.3%) |
| $12,500 to $14,999 | 25 (3.0%) | 0 (0.0%) |
| $15,000 to $17,499 | 24 (2.9%) | 38 (4.3%) |
| $17,500 to $19,999 | 0 (0.0%) | 26 (2.9%) |
| $20,000 to $22,499 | 11 (1.3%) | 20 (2.2%) |
| $22,500 to $24,999 | 31 (3.7%) | 67 (7.5%) |
| $25,000 to $29,999 | 29 (3.5%) | 63 (7.1%) |
| $30,000 to $34,999 | 85 (10.2%) | 92 (10.4%) |
| $35,000 to $39,999 | 18 (2.2%) | 80 (9.0%) |
| $40,000 to $44,999 | 88 (10.5%) | 60 (6.8%) |
| $45,000 to $49,999 | 19 (2.3%) | 18 (2.0%) |
| $50,000 to $54,999 | 46 (5.5%) | 18 (2.0%) |
| $55,000 to $64,999 | 45 (5.4%) | 151 (17.0%) |
| $65,000 to $74,999 | 82 (9.8%) | 7 (0.8%) |
| $75,000 to $99,999 | 102 (12.2%) | 45 (5.1%) |
| $100,000+ | 99 (11.9%) | 69 (7.8%) |
| Total | 834 (100.0%) | 888 (100.0%) |
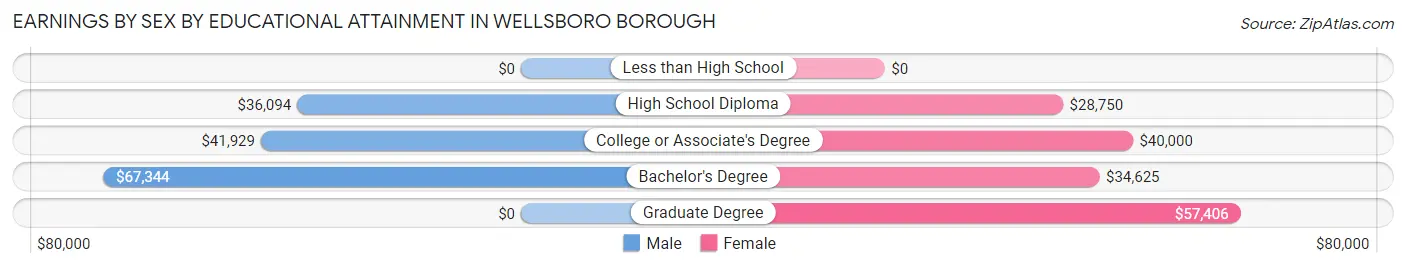
Earnings by Sex by Educational Attainment in Wellsboro borough
Average earnings in Wellsboro borough are $50,296 for men and $39,800 for women, a difference of 20.9%. Men with an educational attainment of bachelor's degree enjoy the highest average annual earnings of $67,344, while those with high school diploma education earn the least with $36,094. Women with an educational attainment of graduate degree earn the most with the average annual earnings of $57,406, while those with high school diploma education have the smallest earnings of $28,750.
| Educational Attainment | Male Income | Female Income |
| Less than High School | - | - |
| High School Diploma | $36,094 | $28,750 |
| College or Associate's Degree | $41,929 | $40,000 |
| Bachelor's Degree | $67,344 | $34,625 |
| Graduate Degree | - | - |
| Total | $50,296 | $39,800 |
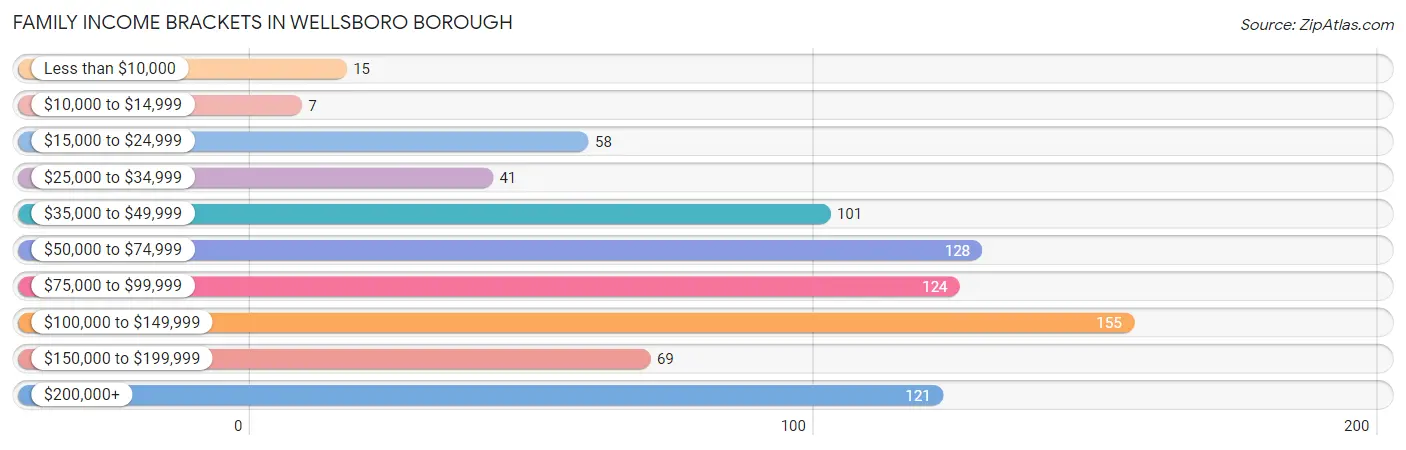
Family Income in Wellsboro borough
Family Income Brackets in Wellsboro borough
According to the Wellsboro borough family income data, there are 155 families falling into the $100,000 to $149,999 income range, which is the most common income bracket and makes up 18.9% of all families. Conversely, the $10,000 to $14,999 income bracket is the least frequent group with only 7 families (0.9%) belonging to this category.
| Income Bracket | # Families | % Families |
| Less than $10,000 | 15 | 1.8% |
| $10,000 to $14,999 | 7 | 0.9% |
| $15,000 to $24,999 | 58 | 7.1% |
| $25,000 to $34,999 | 41 | 5.0% |
| $35,000 to $49,999 | 101 | 12.3% |
| $50,000 to $74,999 | 128 | 15.6% |
| $75,000 to $99,999 | 124 | 15.1% |
| $100,000 to $149,999 | 155 | 18.9% |
| $150,000 to $199,999 | 69 | 8.4% |
| $200,000+ | 121 | 14.8% |
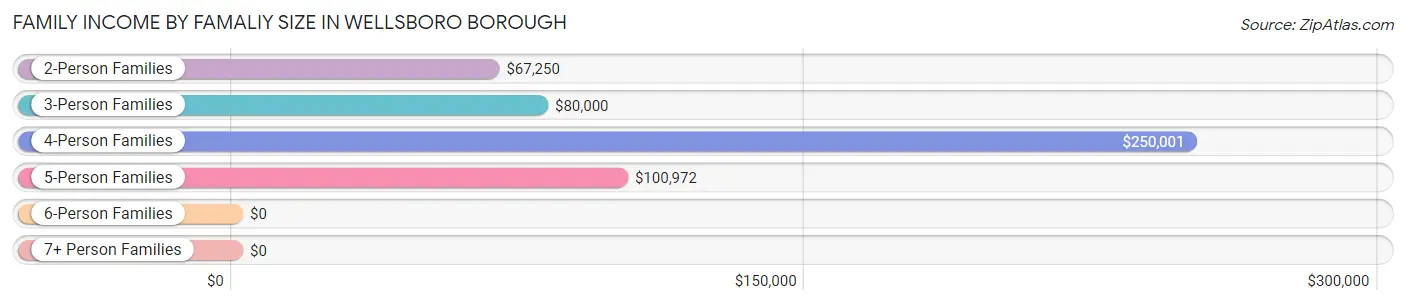
Family Income by Famaliy Size in Wellsboro borough
4-person families (126 | 15.4%) account for the highest median family income in Wellsboro borough with $250,001 per family, while 4-person families (126 | 15.4%) have the highest median income of $62,500 per family member.
| Income Bracket | # Families | Median Income |
| 2-Person Families | 377 (46.0%) | $67,250 |
| 3-Person Families | 248 (30.3%) | $80,000 |
| 4-Person Families | 126 (15.4%) | $250,001 |
| 5-Person Families | 47 (5.7%) | $100,972 |
| 6-Person Families | 21 (2.6%) | $0 |
| 7+ Person Families | 0 (0.0%) | $0 |
| Total | 819 (100.0%) | $85,809 |
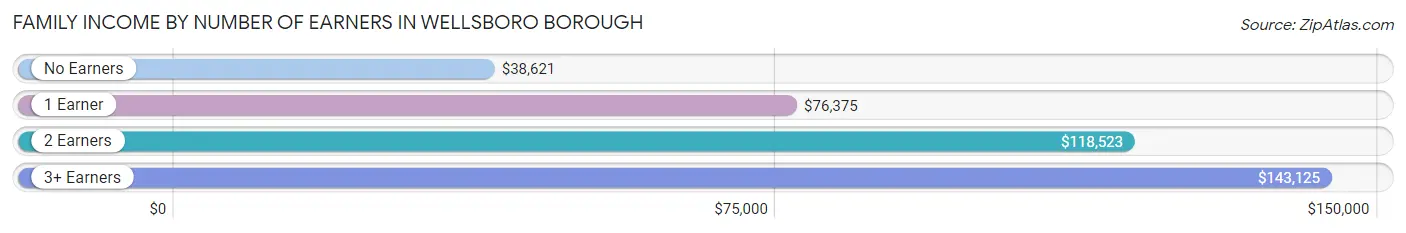
Family Income by Number of Earners in Wellsboro borough
The median family income in Wellsboro borough is $85,809, with families comprising 3+ earners (75) having the highest median family income of $143,125, while families with no earners (202) have the lowest median family income of $38,621, accounting for 9.2% and 24.7% of families, respectively.
| Number of Earners | # Families | Median Income |
| No Earners | 202 (24.7%) | $38,621 |
| 1 Earner | 127 (15.5%) | $76,375 |
| 2 Earners | 415 (50.7%) | $118,523 |
| 3+ Earners | 75 (9.2%) | $143,125 |
| Total | 819 (100.0%) | $85,809 |
Household Income in Wellsboro borough
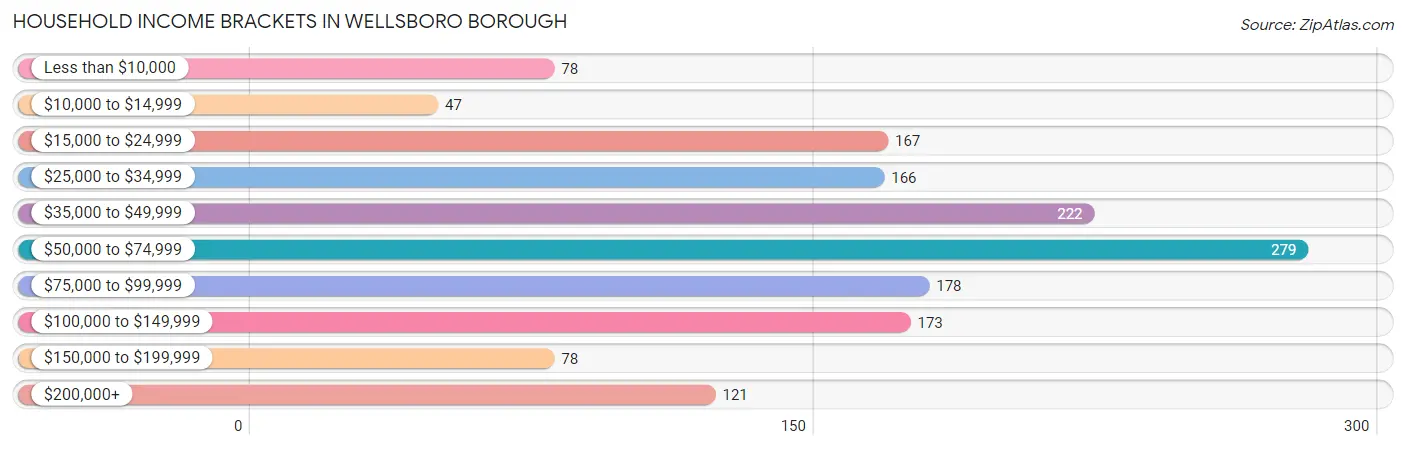
Household Income Brackets in Wellsboro borough
With 279 households falling in the category, the $50,000 to $74,999 income range is the most frequent in Wellsboro borough, accounting for 18.5% of all households. In contrast, only 47 households (3.1%) fall into the $10,000 to $14,999 income bracket, making it the least populous group.
| Income Bracket | # Households | % Households |
| Less than $10,000 | 78 | 5.2% |
| $10,000 to $14,999 | 47 | 3.1% |
| $15,000 to $24,999 | 167 | 11.1% |
| $25,000 to $34,999 | 166 | 11.0% |
| $35,000 to $49,999 | 222 | 14.7% |
| $50,000 to $74,999 | 279 | 18.5% |
| $75,000 to $99,999 | 178 | 11.8% |
| $100,000 to $149,999 | 173 | 11.5% |
| $150,000 to $199,999 | 78 | 5.2% |
| $200,000+ | 121 | 8.0% |
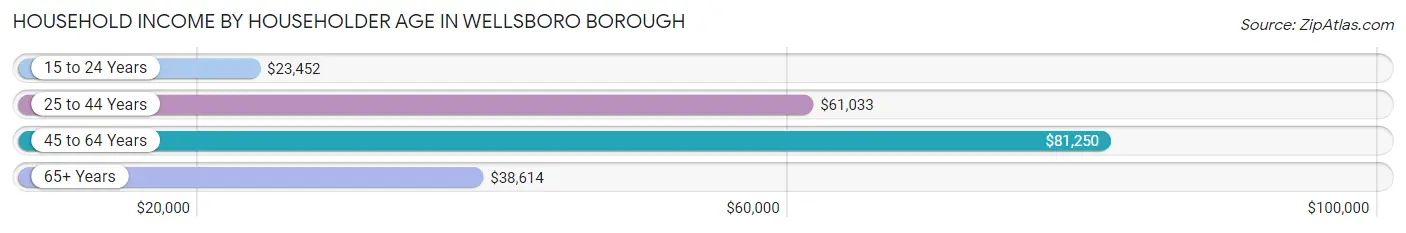
Household Income by Householder Age in Wellsboro borough
The median household income in Wellsboro borough is $54,559, with the highest median household income of $81,250 found in the 45 to 64 years age bracket for the primary householder. A total of 382 households (25.3%) fall into this category. Meanwhile, the 15 to 24 years age bracket for the primary householder has the lowest median household income of $23,452, with 50 households (3.3%) in this group.
| Income Bracket | # Households | Median Income |
| 15 to 24 Years | 50 (3.3%) | $23,452 |
| 25 to 44 Years | 535 (35.5%) | $61,033 |
| 45 to 64 Years | 382 (25.3%) | $81,250 |
| 65+ Years | 541 (35.9%) | $38,614 |
| Total | 1,508 (100.0%) | $54,559 |
Poverty in Wellsboro borough
Income Below Poverty by Sex and Age in Wellsboro borough
With 12.7% poverty level for males and 9.9% for females among the residents of Wellsboro borough, 16 and 17 year old males and 25 to 34 year old females are the most vulnerable to poverty, with 54 males (87.1%) and 52 females (32.3%) in their respective age groups living below the poverty level.
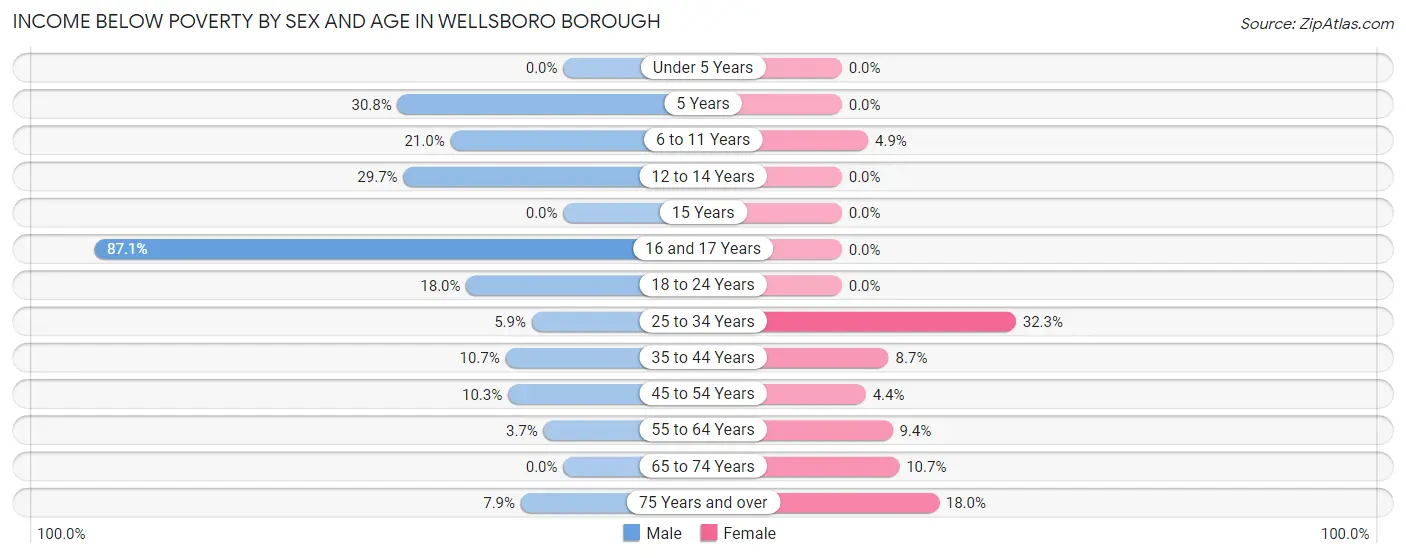
| Age Bracket | Male | Female |
| Under 5 Years | 0 (0.0%) | 0 (0.0%) |
| 5 Years | 8 (30.8%) | 0 (0.0%) |
| 6 to 11 Years | 31 (20.9%) | 8 (4.9%) |
| 12 to 14 Years | 19 (29.7%) | 0 (0.0%) |
| 15 Years | 0 (0.0%) | 0 (0.0%) |
| 16 and 17 Years | 54 (87.1%) | 0 (0.0%) |
| 18 to 24 Years | 27 (18.0%) | 0 (0.0%) |
| 25 to 34 Years | 12 (5.9%) | 52 (32.3%) |
| 35 to 44 Years | 25 (10.7%) | 24 (8.7%) |
| 45 to 54 Years | 20 (10.3%) | 8 (4.4%) |
| 55 to 64 Years | 3 (3.7%) | 19 (9.4%) |
| 65 to 74 Years | 0 (0.0%) | 29 (10.7%) |
| 75 Years and over | 9 (7.9%) | 27 (18.0%) |
| Total | 208 (12.7%) | 167 (9.9%) |
Income Above Poverty by Sex and Age in Wellsboro borough
According to the poverty statistics in Wellsboro borough, males aged under 5 years and females aged under 5 years are the age groups that are most secure financially, with 100.0% of males and 100.0% of females in these age groups living above the poverty line.
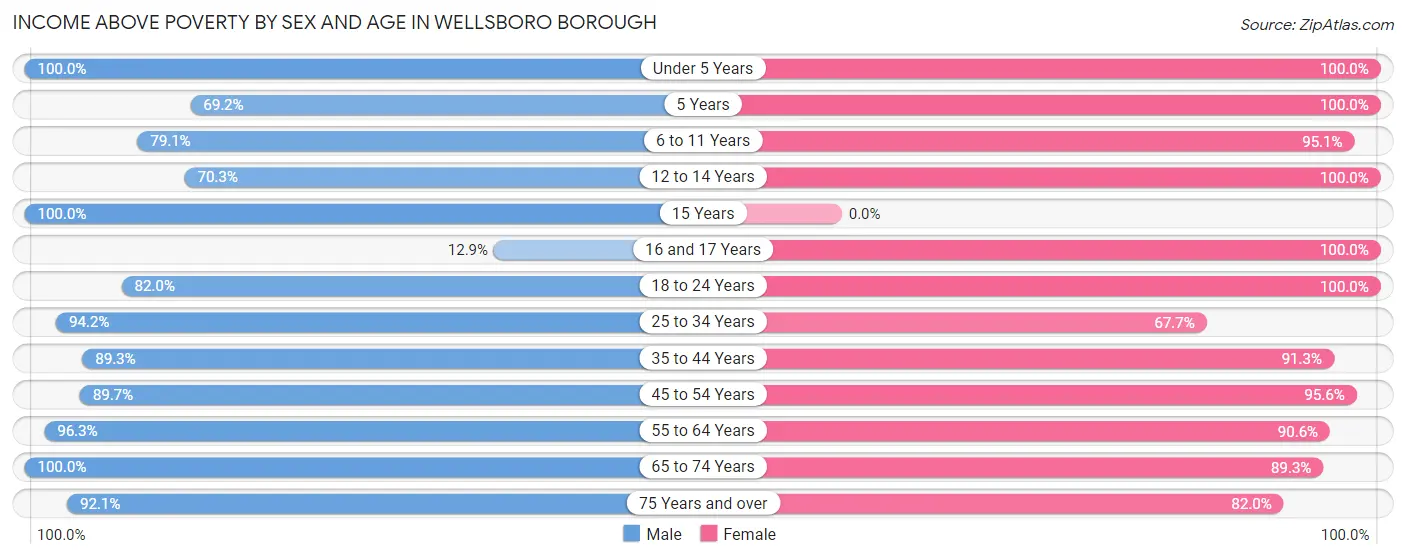
| Age Bracket | Male | Female |
| Under 5 Years | 97 (100.0%) | 58 (100.0%) |
| 5 Years | 18 (69.2%) | 10 (100.0%) |
| 6 to 11 Years | 117 (79.0%) | 156 (95.1%) |
| 12 to 14 Years | 45 (70.3%) | 38 (100.0%) |
| 15 Years | 41 (100.0%) | 0 (0.0%) |
| 16 and 17 Years | 8 (12.9%) | 33 (100.0%) |
| 18 to 24 Years | 123 (82.0%) | 137 (100.0%) |
| 25 to 34 Years | 193 (94.2%) | 109 (67.7%) |
| 35 to 44 Years | 208 (89.3%) | 252 (91.3%) |
| 45 to 54 Years | 175 (89.7%) | 172 (95.6%) |
| 55 to 64 Years | 79 (96.3%) | 183 (90.6%) |
| 65 to 74 Years | 219 (100.0%) | 243 (89.3%) |
| 75 Years and over | 105 (92.1%) | 123 (82.0%) |
| Total | 1,428 (87.3%) | 1,514 (90.1%) |
Income Below Poverty Among Married-Couple Families in Wellsboro borough
The poverty statistics for married-couple families in Wellsboro borough show that 1.3% or 8 of the total 629 families live below the poverty line. Families with 1 or 2 children have the highest poverty rate of 4.6%, comprising of 8 families. On the other hand, families with no children have the lowest poverty rate of 0.0%, which includes 0 families.
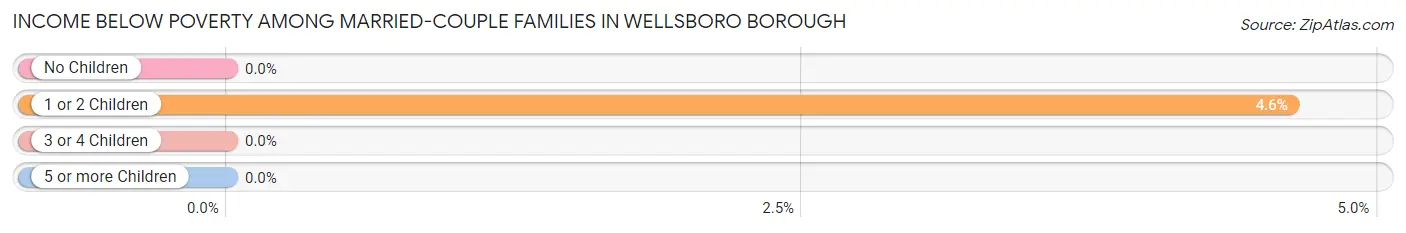
| Children | Above Poverty | Below Poverty |
| No Children | 388 (100.0%) | 0 (0.0%) |
| 1 or 2 Children | 165 (95.4%) | 8 (4.6%) |
| 3 or 4 Children | 68 (100.0%) | 0 (0.0%) |
| 5 or more Children | 0 (0.0%) | 0 (0.0%) |
| Total | 621 (98.7%) | 8 (1.3%) |
Income Below Poverty Among Single-Parent Households in Wellsboro borough
According to the poverty data in Wellsboro borough, 40.3% or 25 single-father households and 28.9% or 37 single-mother households are living below the poverty line. Among single-father households, those with 1 or 2 children have the highest poverty rate, with 25 households (40.3%) experiencing poverty. Likewise, among single-mother households, those with 3 or 4 children have the highest poverty rate, with 6 households (100.0%) falling below the poverty line.
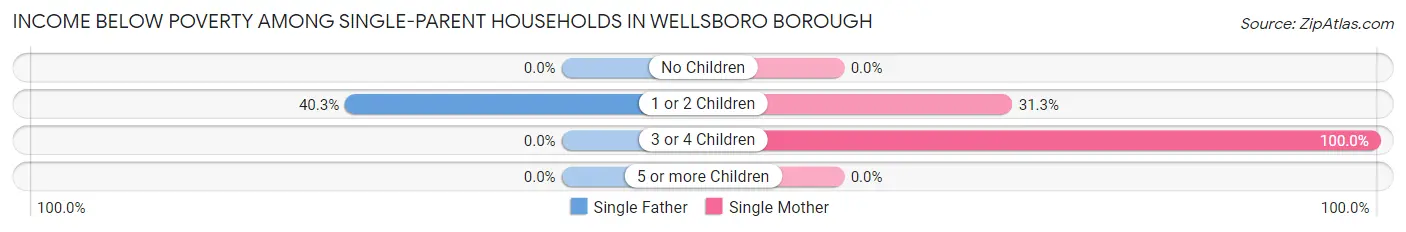
| Children | Single Father | Single Mother |
| No Children | 0 (0.0%) | 0 (0.0%) |
| 1 or 2 Children | 25 (40.3%) | 31 (31.3%) |
| 3 or 4 Children | 0 (0.0%) | 6 (100.0%) |
| 5 or more Children | 0 (0.0%) | 0 (0.0%) |
| Total | 25 (40.3%) | 37 (28.9%) |
Income Below Poverty Among Married-Couple vs Single-Parent Households in Wellsboro borough
The poverty data for Wellsboro borough shows that 8 of the married-couple family households (1.3%) and 62 of the single-parent households (32.6%) are living below the poverty level. Within the married-couple family households, those with 1 or 2 children have the highest poverty rate, with 8 households (4.6%) falling below the poverty line. Among the single-parent households, those with 3 or 4 children have the highest poverty rate, with 6 household (100.0%) living below poverty.
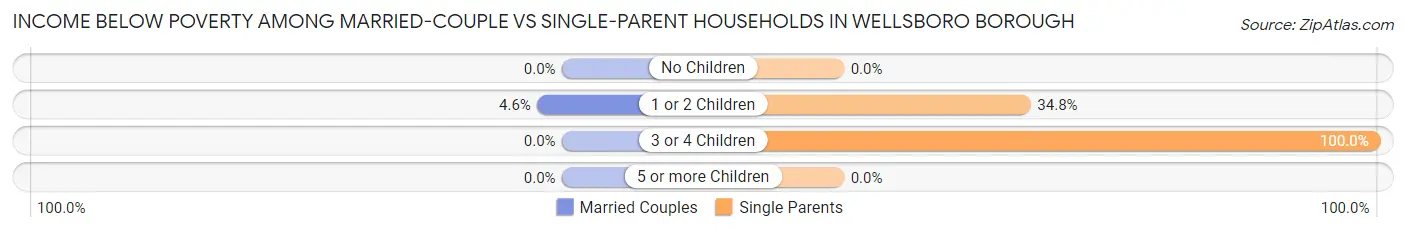
| Children | Married-Couple Families | Single-Parent Households |
| No Children | 0 (0.0%) | 0 (0.0%) |
| 1 or 2 Children | 8 (4.6%) | 56 (34.8%) |
| 3 or 4 Children | 0 (0.0%) | 6 (100.0%) |
| 5 or more Children | 0 (0.0%) | 0 (0.0%) |
| Total | 8 (1.3%) | 62 (32.6%) |
Race in Wellsboro borough
The most populous races in Wellsboro borough are White / Caucasian (3,299 | 95.4%), Two or more Races (65 | 1.9%), and Hispanic or Latino (62 | 1.8%).
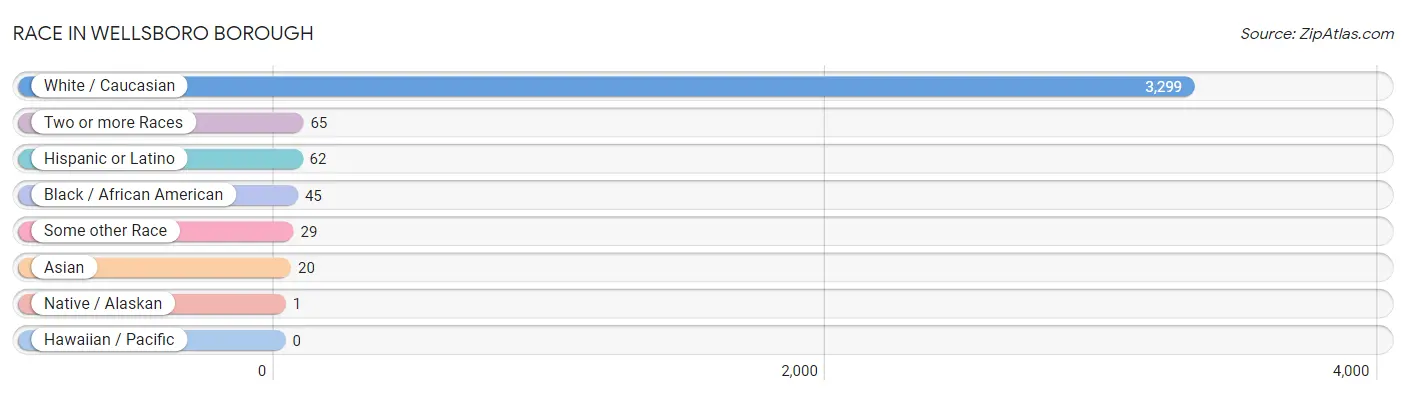
| Race | # Population | % Population |
| Asian | 20 | 0.6% |
| Black / African American | 45 | 1.3% |
| Hawaiian / Pacific | 0 | 0.0% |
| Hispanic or Latino | 62 | 1.8% |
| Native / Alaskan | 1 | 0.0% |
| White / Caucasian | 3,299 | 95.4% |
| Two or more Races | 65 | 1.9% |
| Some other Race | 29 | 0.8% |
| Total | 3,459 | 100.0% |
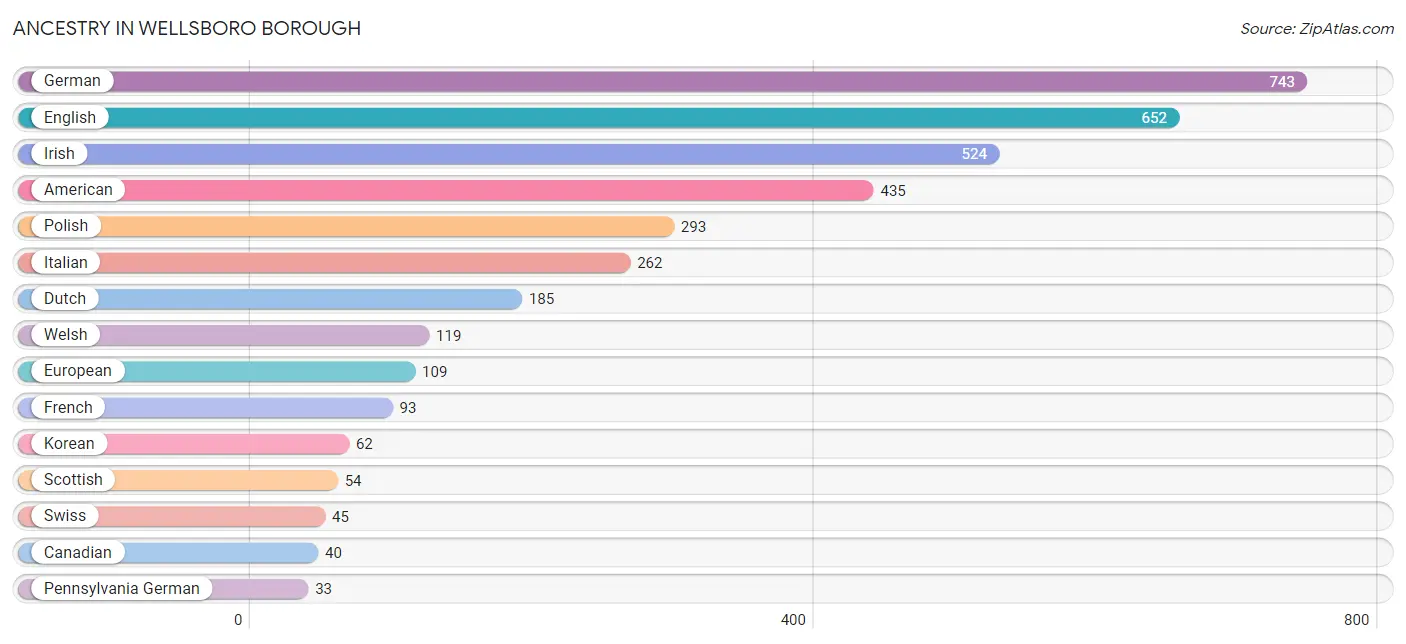
Ancestry in Wellsboro borough
The most populous ancestries reported in Wellsboro borough are German (743 | 21.5%), English (652 | 18.9%), Irish (524 | 15.1%), American (435 | 12.6%), and Polish (293 | 8.5%), together accounting for 76.5% of all Wellsboro borough residents.
| Ancestry | # Population | % Population |
| African | 11 | 0.3% |
| American | 435 | 12.6% |
| Austrian | 20 | 0.6% |
| British | 5 | 0.1% |
| Canadian | 40 | 1.2% |
| Central American | 12 | 0.4% |
| Central American Indian | 1 | 0.0% |
| Dominican | 1 | 0.0% |
| Dutch | 185 | 5.3% |
| English | 652 | 18.9% |
| European | 109 | 3.2% |
| Finnish | 7 | 0.2% |
| French | 93 | 2.7% |
| French Canadian | 22 | 0.6% |
| German | 743 | 21.5% |
| Honduran | 12 | 0.4% |
| Hungarian | 7 | 0.2% |
| Indian (Asian) | 6 | 0.2% |
| Irish | 524 | 15.1% |
| Italian | 262 | 7.6% |
| Korean | 62 | 1.8% |
| Mexican | 8 | 0.2% |
| Norwegian | 7 | 0.2% |
| Pennsylvania German | 33 | 0.9% |
| Polish | 293 | 8.5% |
| Russian | 5 | 0.1% |
| Scandinavian | 28 | 0.8% |
| Scotch-Irish | 19 | 0.5% |
| Scottish | 54 | 1.6% |
| Slavic | 17 | 0.5% |
| Slovak | 8 | 0.2% |
| Subsaharan African | 11 | 0.3% |
| Swedish | 7 | 0.2% |
| Swiss | 45 | 1.3% |
| Ukrainian | 7 | 0.2% |
| Welsh | 119 | 3.4% | View All 36 Rows |
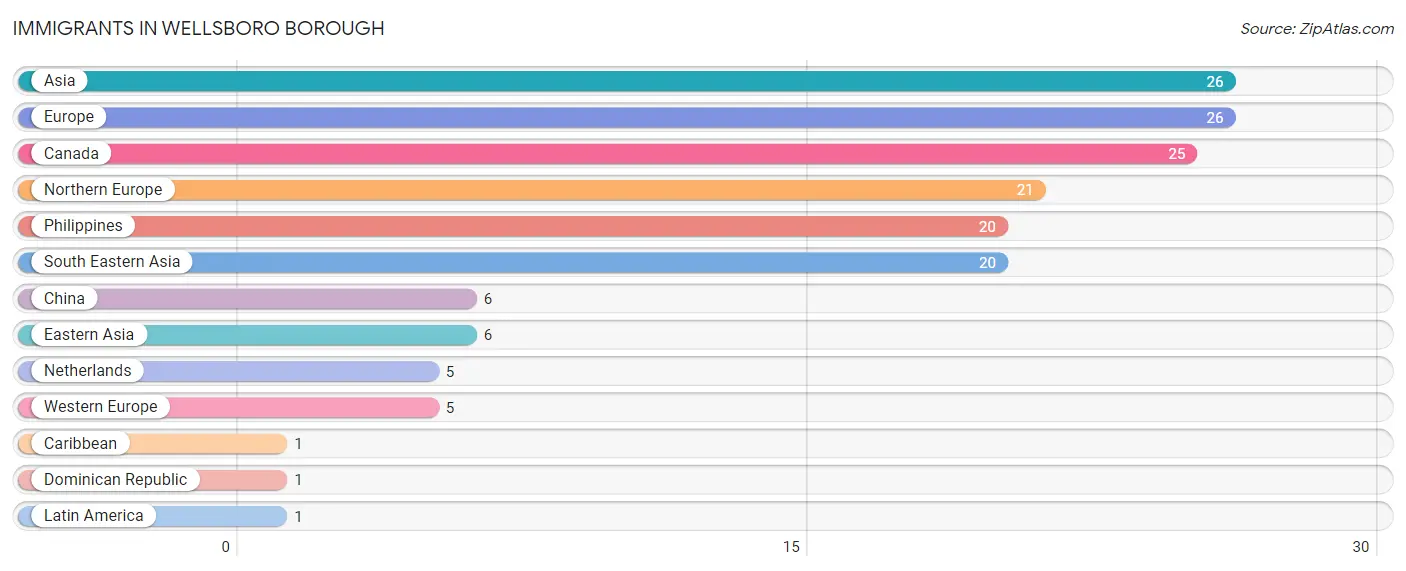
Immigrants in Wellsboro borough
The most numerous immigrant groups reported in Wellsboro borough came from Asia (26 | 0.7%), Europe (26 | 0.7%), Canada (25 | 0.7%), Northern Europe (21 | 0.6%), and Philippines (20 | 0.6%), together accounting for 3.4% of all Wellsboro borough residents.
| Immigration Origin | # Population | % Population |
| Asia | 26 | 0.7% |
| Canada | 25 | 0.7% |
| Caribbean | 1 | 0.0% |
| China | 6 | 0.2% |
| Dominican Republic | 1 | 0.0% |
| Eastern Asia | 6 | 0.2% |
| Europe | 26 | 0.7% |
| Latin America | 1 | 0.0% |
| Netherlands | 5 | 0.1% |
| Northern Europe | 21 | 0.6% |
| Philippines | 20 | 0.6% |
| South Eastern Asia | 20 | 0.6% |
| Western Europe | 5 | 0.1% | View All 13 Rows |
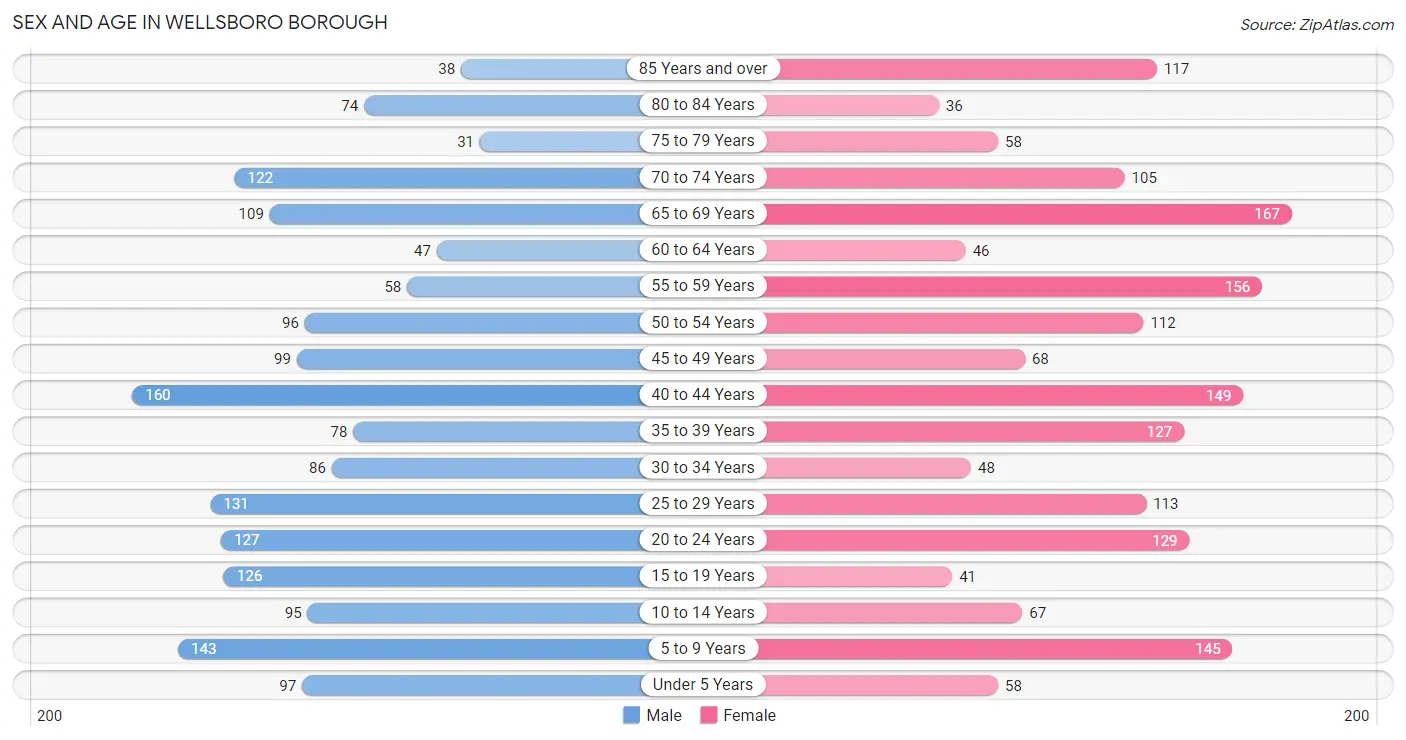
Sex and Age in Wellsboro borough
Sex and Age in Wellsboro borough
The most populous age groups in Wellsboro borough are 40 to 44 Years (160 | 9.3%) for men and 65 to 69 Years (167 | 9.6%) for women.
| Age Bracket | Male | Female |
| Under 5 Years | 97 (5.7%) | 58 (3.3%) |
| 5 to 9 Years | 143 (8.3%) | 145 (8.3%) |
| 10 to 14 Years | 95 (5.5%) | 67 (3.8%) |
| 15 to 19 Years | 126 (7.3%) | 41 (2.4%) |
| 20 to 24 Years | 127 (7.4%) | 129 (7.4%) |
| 25 to 29 Years | 131 (7.6%) | 113 (6.5%) |
| 30 to 34 Years | 86 (5.0%) | 48 (2.8%) |
| 35 to 39 Years | 78 (4.5%) | 127 (7.3%) |
| 40 to 44 Years | 160 (9.3%) | 149 (8.6%) |
| 45 to 49 Years | 99 (5.8%) | 68 (3.9%) |
| 50 to 54 Years | 96 (5.6%) | 112 (6.4%) |
| 55 to 59 Years | 58 (3.4%) | 156 (9.0%) |
| 60 to 64 Years | 47 (2.7%) | 46 (2.6%) |
| 65 to 69 Years | 109 (6.4%) | 167 (9.6%) |
| 70 to 74 Years | 122 (7.1%) | 105 (6.0%) |
| 75 to 79 Years | 31 (1.8%) | 58 (3.3%) |
| 80 to 84 Years | 74 (4.3%) | 36 (2.1%) |
| 85 Years and over | 38 (2.2%) | 117 (6.7%) |
| Total | 1,717 (100.0%) | 1,742 (100.0%) |
Families and Households in Wellsboro borough
Median Family Size in Wellsboro borough
The median family size in Wellsboro borough is 3.00 persons per family, with single male/father families (62 | 7.6%) accounting for the largest median family size of 3.4 persons per family. On the other hand, single female/mother families (128 | 15.6%) represent the smallest median family size with 2.86 persons per family.
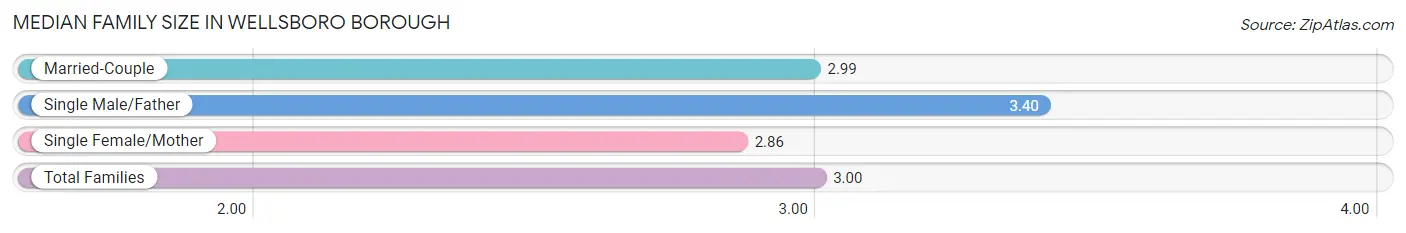
| Family Type | # Families | Family Size |
| Married-Couple | 629 (76.8%) | 2.99 |
| Single Male/Father | 62 (7.6%) | 3.40 |
| Single Female/Mother | 128 (15.6%) | 2.86 |
| Total Families | 819 (100.0%) | 3.00 |
Median Household Size in Wellsboro borough
The median household size in Wellsboro borough is 2.19 persons per household, with single male/father households (62 | 4.1%) accounting for the largest median household size of 3.4 persons per household. non-family households (689 | 45.7%) represent the smallest median household size with 1.23 persons per household.
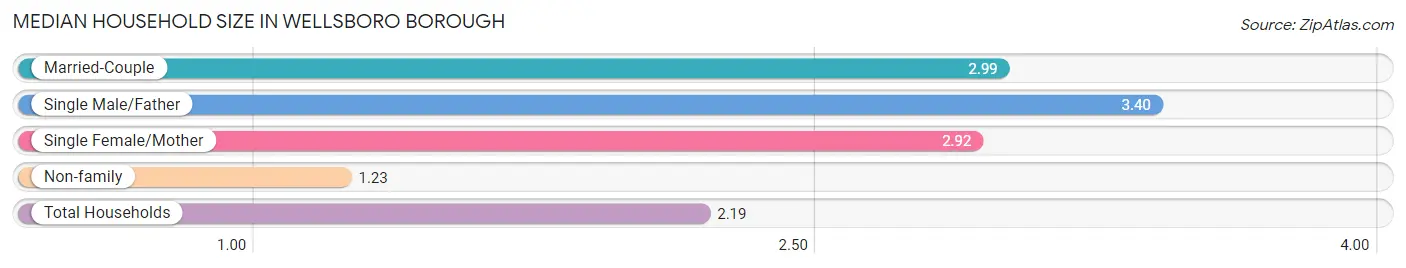
| Household Type | # Households | Household Size |
| Married-Couple | 629 (41.7%) | 2.99 |
| Single Male/Father | 62 (4.1%) | 3.40 |
| Single Female/Mother | 128 (8.5%) | 2.92 |
| Non-family | 689 (45.7%) | 1.23 |
| Total Households | 1,508 (100.0%) | 2.19 |
Household Size by Marriage Status in Wellsboro borough
Out of a total of 1,508 households in Wellsboro borough, 819 (54.3%) are family households, while 689 (45.7%) are nonfamily households. The most numerous type of family households are 2-person households, comprising 377, and the most common type of nonfamily households are 1-person households, comprising 542.
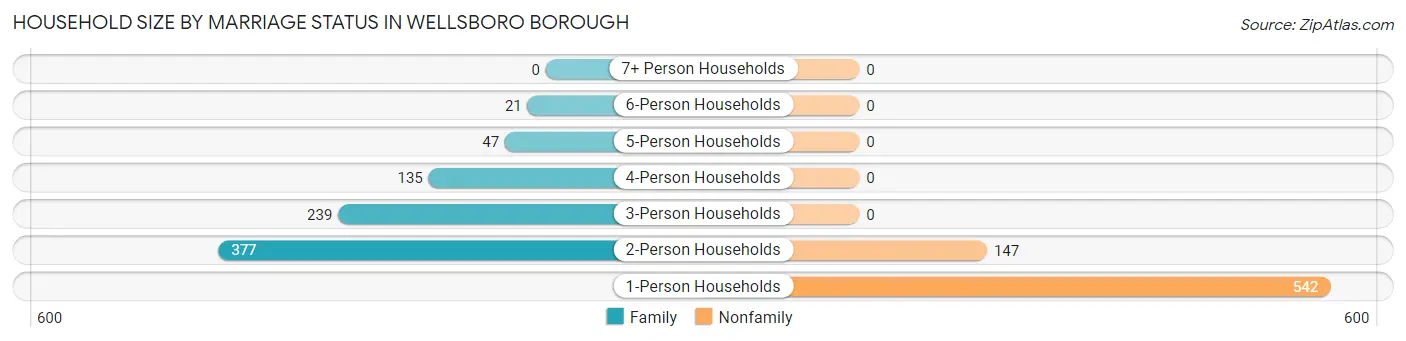
| Household Size | Family Households | Nonfamily Households |
| 1-Person Households | - | 542 (35.9%) |
| 2-Person Households | 377 (25.0%) | 147 (9.8%) |
| 3-Person Households | 239 (15.9%) | 0 (0.0%) |
| 4-Person Households | 135 (8.9%) | 0 (0.0%) |
| 5-Person Households | 47 (3.1%) | 0 (0.0%) |
| 6-Person Households | 21 (1.4%) | 0 (0.0%) |
| 7+ Person Households | 0 (0.0%) | 0 (0.0%) |
| Total | 819 (54.3%) | 689 (45.7%) |
Female Fertility in Wellsboro borough
Fertility by Age in Wellsboro borough
Average fertility rate in Wellsboro borough is 56.0 births per 1,000 women. Women in the age bracket of 20 to 34 years have the highest fertility rate with 103.0 births per 1,000 women. Women in the age bracket of 20 to 34 years acount for 75.0% of all women with births.
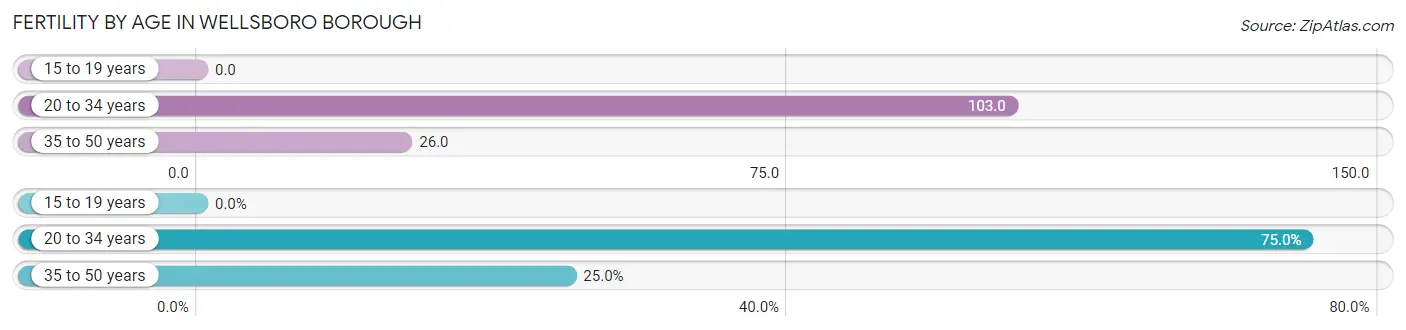
| Age Bracket | Women with Births | Births / 1,000 Women |
| 15 to 19 years | 0 (0.0%) | 0.0 |
| 20 to 34 years | 30 (75.0%) | 103.0 |
| 35 to 50 years | 10 (25.0%) | 26.0 |
| Total | 40 (100.0%) | 56.0 |
Fertility by Age by Marriage Status in Wellsboro borough
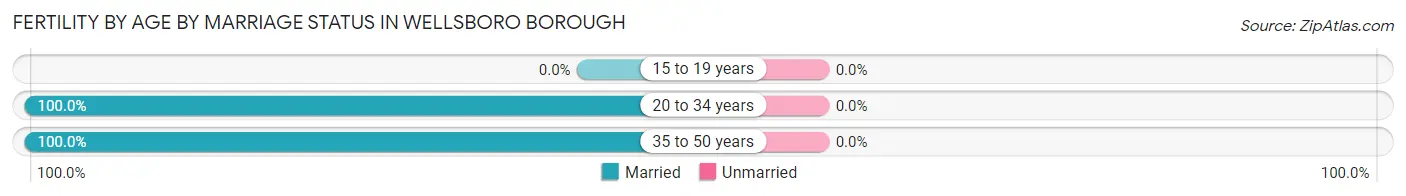
| Age Bracket | Married | Unmarried |
| 15 to 19 years | 0 (0.0%) | 0 (0.0%) |
| 20 to 34 years | 30 (100.0%) | 0 (0.0%) |
| 35 to 50 years | 10 (100.0%) | 0 (0.0%) |
| Total | 40 (100.0%) | 0 (0.0%) |
Fertility by Education in Wellsboro borough
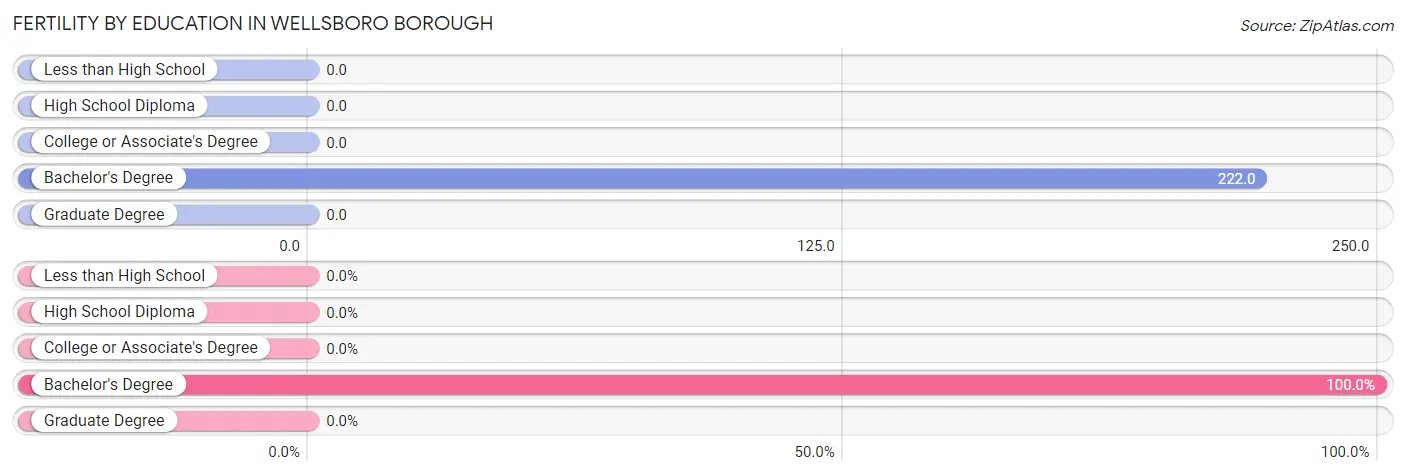
| Educational Attainment | Women with Births | Births / 1,000 Women |
| Less than High School | 0 (0.0%) | 0.0 |
| High School Diploma | 0 (0.0%) | 0.0 |
| College or Associate's Degree | 0 (0.0%) | 0.0 |
| Bachelor's Degree | 40 (100.0%) | 222.0 |
| Graduate Degree | 0 (0.0%) | 0.0 |
| Total | 40 (100.0%) | 56.0 |
Fertility by Education by Marriage Status in Wellsboro borough
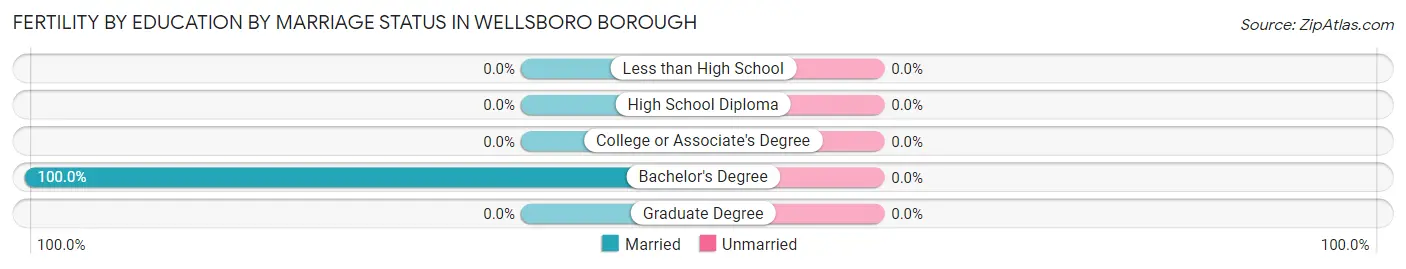
| Educational Attainment | Married | Unmarried |
| Less than High School | 0 (0.0%) | 0 (0.0%) |
| High School Diploma | 0 (0.0%) | 0 (0.0%) |
| College or Associate's Degree | 0 (0.0%) | 0 (0.0%) |
| Bachelor's Degree | 40 (100.0%) | 0 (0.0%) |
| Graduate Degree | 0 (0.0%) | 0 (0.0%) |
| Total | 40 (100.0%) | 0 (0.0%) |
Employment Characteristics in Wellsboro borough
Employment by Class of Employer in Wellsboro borough
Among the 1,581 employed individuals in Wellsboro borough, private company employees (974 | 61.6%), local government employees (218 | 13.8%), and not-for-profit organizations (207 | 13.1%) make up the most common classes of employment.
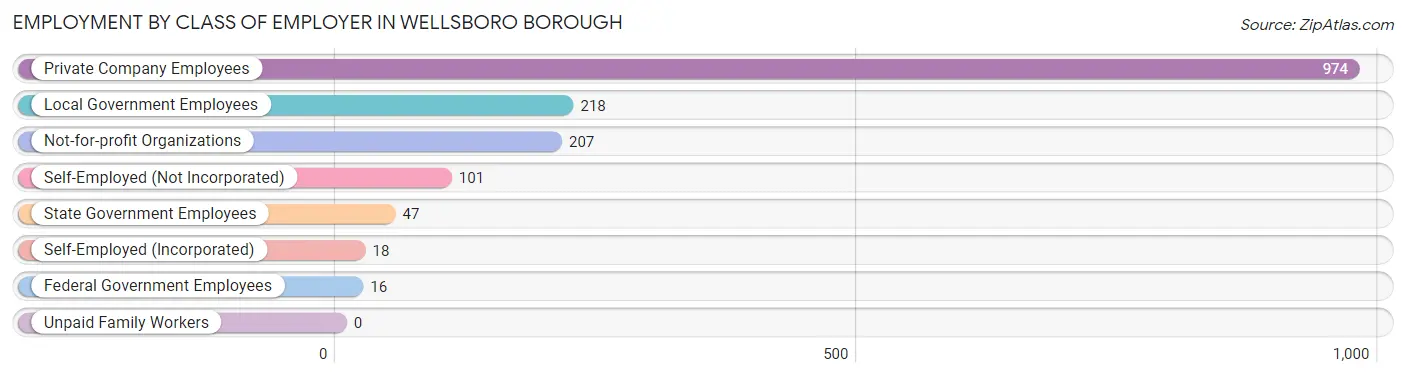
| Employer Class | # Employees | % Employees |
| Private Company Employees | 974 | 61.6% |
| Self-Employed (Incorporated) | 18 | 1.1% |
| Self-Employed (Not Incorporated) | 101 | 6.4% |
| Not-for-profit Organizations | 207 | 13.1% |
| Local Government Employees | 218 | 13.8% |
| State Government Employees | 47 | 3.0% |
| Federal Government Employees | 16 | 1.0% |
| Unpaid Family Workers | 0 | 0.0% |
| Total | 1,581 | 100.0% |
Employment Status by Age in Wellsboro borough
According to the labor force statistics for Wellsboro borough, out of the total population over 16 years of age (2,813), 59.3% or 1,668 individuals are in the labor force, with 4.7% or 78 of them unemployed. The age group with the highest labor force participation rate is 30 to 34 years, with 100.0% or 134 individuals in the labor force. Within the labor force, the 16 to 19 years age range has the highest percentage of unemployed individuals, with 30.2% or 16 of them being unemployed.
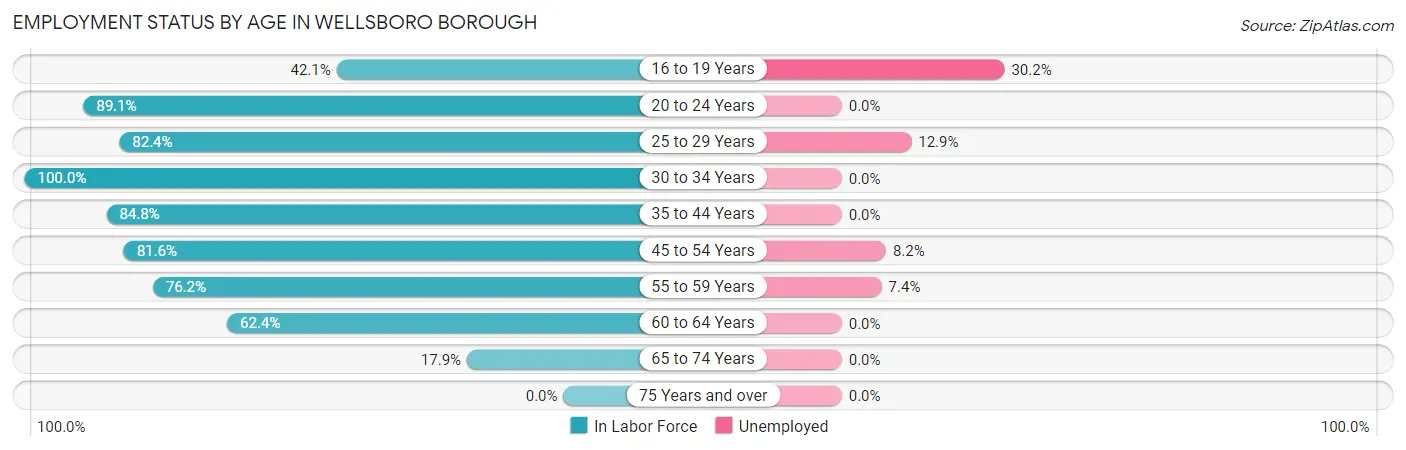
| Age Bracket | In Labor Force | Unemployed |
| 16 to 19 Years | 53 (42.1%) | 16 (30.2%) |
| 20 to 24 Years | 228 (89.1%) | 0 (0.0%) |
| 25 to 29 Years | 201 (82.4%) | 26 (12.9%) |
| 30 to 34 Years | 134 (100.0%) | 0 (0.0%) |
| 35 to 44 Years | 436 (84.8%) | 0 (0.0%) |
| 45 to 54 Years | 306 (81.6%) | 25 (8.2%) |
| 55 to 59 Years | 163 (76.2%) | 12 (7.4%) |
| 60 to 64 Years | 58 (62.4%) | 0 (0.0%) |
| 65 to 74 Years | 90 (17.9%) | 0 (0.0%) |
| 75 Years and over | 0 (0.0%) | 0 (0.0%) |
| Total | 1,668 (59.3%) | 78 (4.7%) |
Employment Status by Educational Attainment in Wellsboro borough
According to labor force statistics for Wellsboro borough, 82.5% of individuals (1,299) out of the total population between 25 and 64 years of age (1,574) are in the labor force, with 4.9% or 64 of them being unemployed. The group with the highest labor force participation rate are those with the educational attainment of bachelor's degree or higher, with 91.8% or 672 individuals in the labor force. Within the labor force, individuals with less than high school education have the highest percentage of unemployment, with 44.4% or 28 of them being unemployed.

| Educational Attainment | In Labor Force | Unemployed |
| Less than High School | 63 (56.8%) | 49 (44.4%) |
| High School Diploma | 293 (69.9%) | 1 (0.3%) |
| College / Associate Degree | 270 (86.5%) | 0 (0.0%) |
| Bachelor's Degree or higher | 672 (91.8%) | 37 (5.1%) |
| Total | 1,299 (82.5%) | 77 (4.9%) |
Employment Occupations by Sex in Wellsboro borough
Management, Business, Science and Arts Occupations
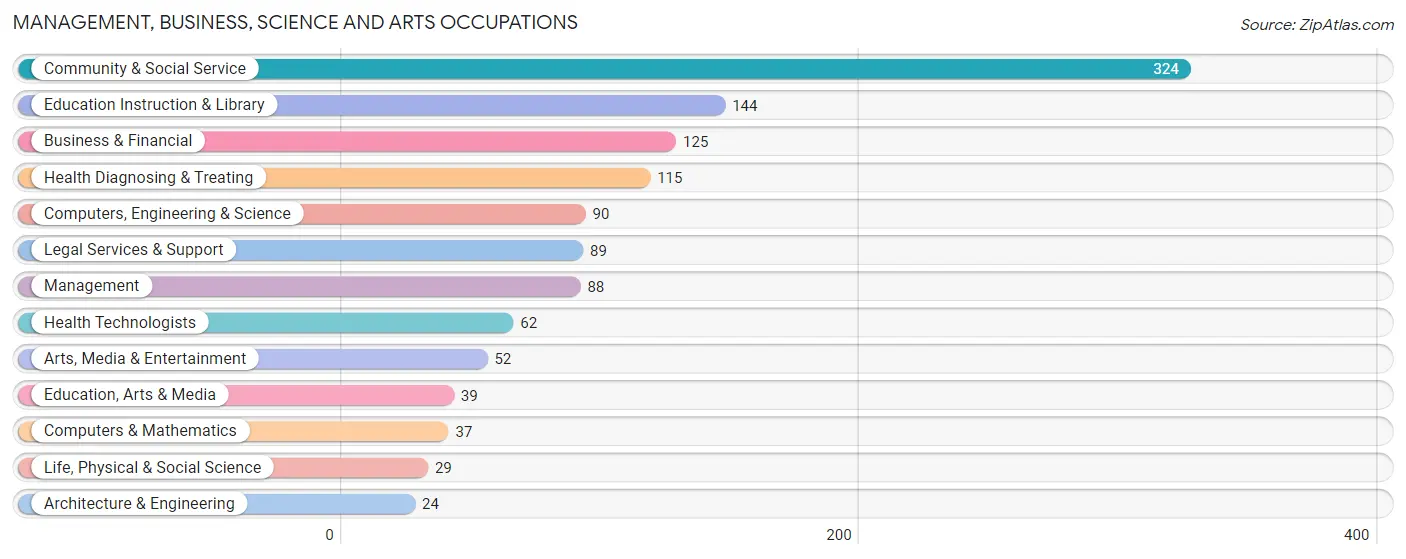
The most common Management, Business, Science and Arts occupations in Wellsboro borough are Community & Social Service (324 | 20.4%), Education Instruction & Library (144 | 9.1%), Business & Financial (125 | 7.9%), Health Diagnosing & Treating (115 | 7.2%), and Computers, Engineering & Science (90 | 5.7%).
Management, Business, Science and Arts Occupations by Sex
Within the Management, Business, Science and Arts occupations in Wellsboro borough, the most male-oriented occupations are Computers & Mathematics (100.0%), Arts, Media & Entertainment (82.7%), and Computers, Engineering & Science (75.6%), while the most female-oriented occupations are Education Instruction & Library (92.4%), Health Technologists (83.9%), and Health Diagnosing & Treating (81.7%).
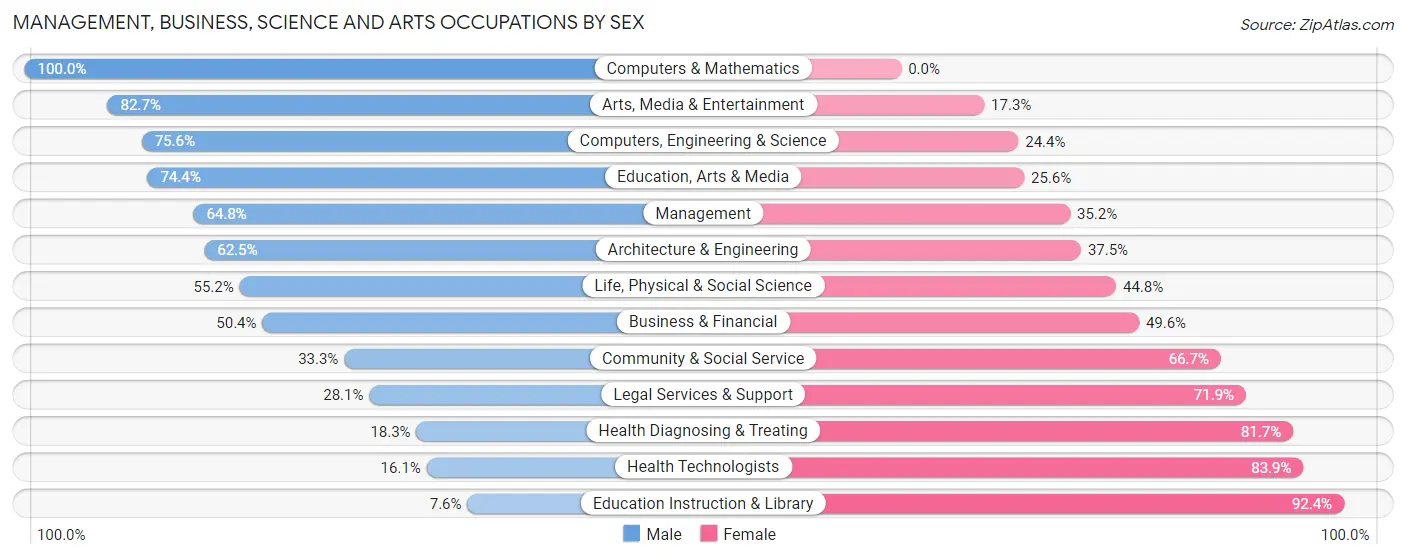
| Occupation | Male | Female |
| Management | 57 (64.8%) | 31 (35.2%) |
| Business & Financial | 63 (50.4%) | 62 (49.6%) |
| Computers, Engineering & Science | 68 (75.6%) | 22 (24.4%) |
| Computers & Mathematics | 37 (100.0%) | 0 (0.0%) |
| Architecture & Engineering | 15 (62.5%) | 9 (37.5%) |
| Life, Physical & Social Science | 16 (55.2%) | 13 (44.8%) |
| Community & Social Service | 108 (33.3%) | 216 (66.7%) |
| Education, Arts & Media | 29 (74.4%) | 10 (25.6%) |
| Legal Services & Support | 25 (28.1%) | 64 (71.9%) |
| Education Instruction & Library | 11 (7.6%) | 133 (92.4%) |
| Arts, Media & Entertainment | 43 (82.7%) | 9 (17.3%) |
| Health Diagnosing & Treating | 21 (18.3%) | 94 (81.7%) |
| Health Technologists | 10 (16.1%) | 52 (83.9%) |
| Total (Category) | 317 (42.7%) | 425 (57.3%) |
| Total (Overall) | 758 (47.7%) | 832 (52.3%) |
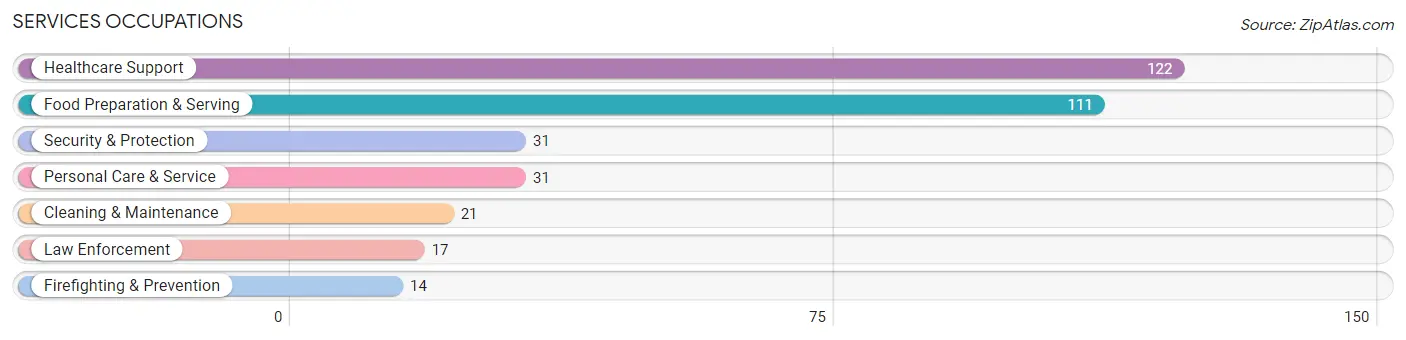
Services Occupations
The most common Services occupations in Wellsboro borough are Healthcare Support (122 | 7.7%), Food Preparation & Serving (111 | 7.0%), Security & Protection (31 | 1.9%), Personal Care & Service (31 | 1.9%), and Cleaning & Maintenance (21 | 1.3%).
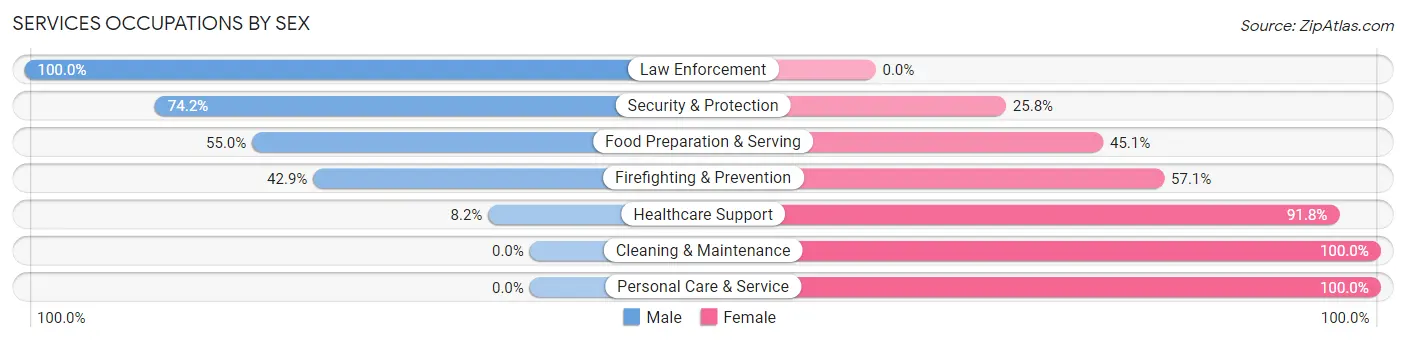
Services Occupations by Sex
Within the Services occupations in Wellsboro borough, the most male-oriented occupations are Law Enforcement (100.0%), Security & Protection (74.2%), and Food Preparation & Serving (54.9%), while the most female-oriented occupations are Cleaning & Maintenance (100.0%), Personal Care & Service (100.0%), and Healthcare Support (91.8%).
| Occupation | Male | Female |
| Healthcare Support | 10 (8.2%) | 112 (91.8%) |
| Security & Protection | 23 (74.2%) | 8 (25.8%) |
| Firefighting & Prevention | 6 (42.9%) | 8 (57.1%) |
| Law Enforcement | 17 (100.0%) | 0 (0.0%) |
| Food Preparation & Serving | 61 (54.9%) | 50 (45.1%) |
| Cleaning & Maintenance | 0 (0.0%) | 21 (100.0%) |
| Personal Care & Service | 0 (0.0%) | 31 (100.0%) |
| Total (Category) | 94 (29.7%) | 222 (70.3%) |
| Total (Overall) | 758 (47.7%) | 832 (52.3%) |
Sales and Office Occupations
The most common Sales and Office occupations in Wellsboro borough are Sales & Related (158 | 9.9%), and Office & Administration (103 | 6.5%).

Sales and Office Occupations by Sex

| Occupation | Male | Female |
| Sales & Related | 126 (79.7%) | 32 (20.3%) |
| Office & Administration | 27 (26.2%) | 76 (73.8%) |
| Total (Category) | 153 (58.6%) | 108 (41.4%) |
| Total (Overall) | 758 (47.7%) | 832 (52.3%) |
Natural Resources, Construction and Maintenance Occupations
The most common Natural Resources, Construction and Maintenance occupations in Wellsboro borough are Installation, Maintenance & Repair (47 | 3.0%), Construction & Extraction (25 | 1.6%), and Farming, Fishing & Forestry (16 | 1.0%).

Natural Resources, Construction and Maintenance Occupations by Sex

| Occupation | Male | Female |
| Farming, Fishing & Forestry | 16 (100.0%) | 0 (0.0%) |
| Construction & Extraction | 25 (100.0%) | 0 (0.0%) |
| Installation, Maintenance & Repair | 33 (70.2%) | 14 (29.8%) |
| Total (Category) | 74 (84.1%) | 14 (15.9%) |
| Total (Overall) | 758 (47.7%) | 832 (52.3%) |
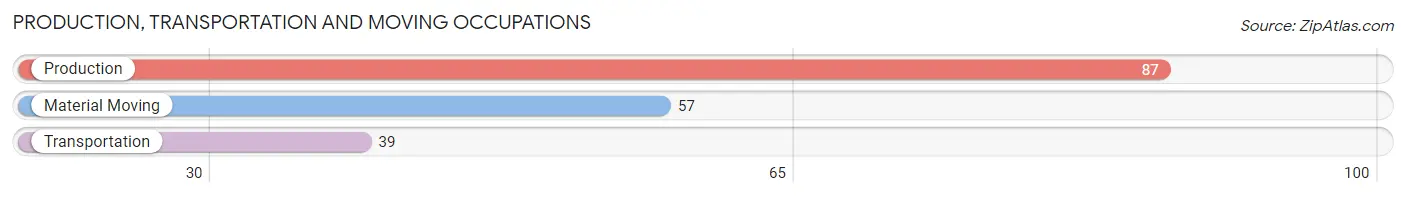
Production, Transportation and Moving Occupations
The most common Production, Transportation and Moving occupations in Wellsboro borough are Production (87 | 5.5%), Material Moving (57 | 3.6%), and Transportation (39 | 2.5%).
Production, Transportation and Moving Occupations by Sex

| Occupation | Male | Female |
| Production | 35 (40.2%) | 52 (59.8%) |
| Transportation | 39 (100.0%) | 0 (0.0%) |
| Material Moving | 46 (80.7%) | 11 (19.3%) |
| Total (Category) | 120 (65.6%) | 63 (34.4%) |
| Total (Overall) | 758 (47.7%) | 832 (52.3%) |
Employment Industries by Sex in Wellsboro borough
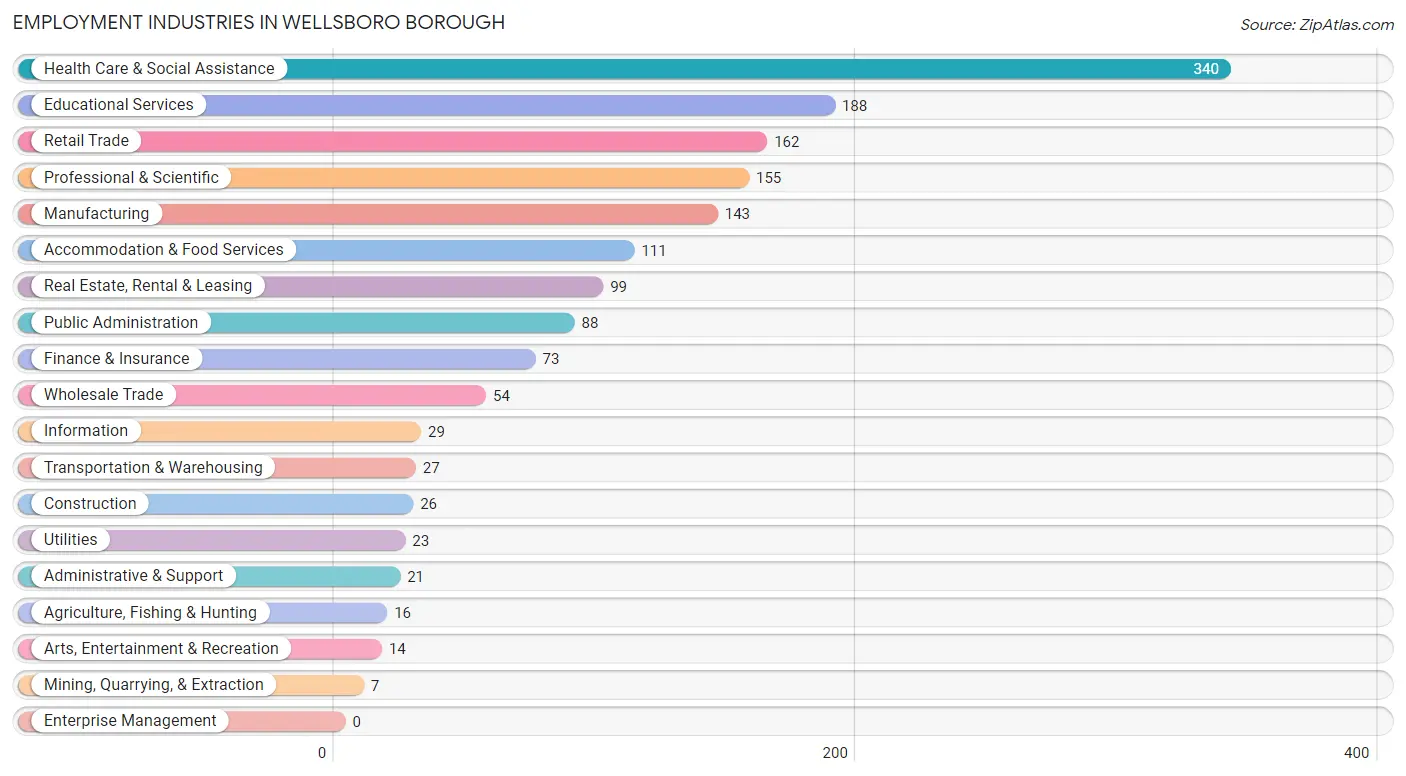
Employment Industries in Wellsboro borough
The major employment industries in Wellsboro borough include Health Care & Social Assistance (340 | 21.4%), Educational Services (188 | 11.8%), Retail Trade (162 | 10.2%), Professional & Scientific (155 | 9.8%), and Manufacturing (143 | 9.0%).
Employment Industries by Sex in Wellsboro borough
The Wellsboro borough industries that see more men than women are Agriculture, Fishing & Hunting (100.0%), Mining, Quarrying, & Extraction (100.0%), and Wholesale Trade (100.0%), whereas the industries that tend to have a higher number of women are Educational Services (84.6%), Health Care & Social Assistance (82.7%), and Professional & Scientific (65.2%).
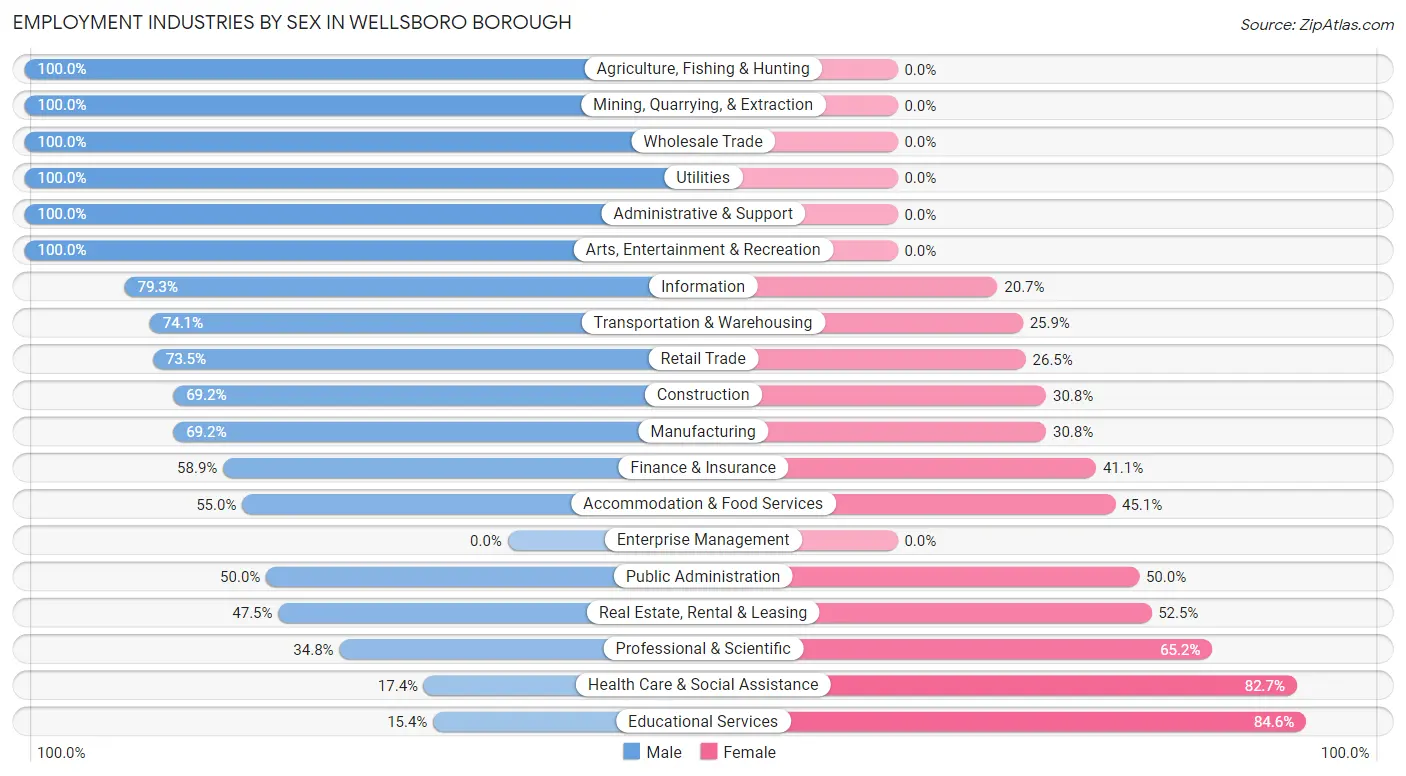
| Industry | Male | Female |
| Agriculture, Fishing & Hunting | 16 (100.0%) | 0 (0.0%) |
| Mining, Quarrying, & Extraction | 7 (100.0%) | 0 (0.0%) |
| Construction | 18 (69.2%) | 8 (30.8%) |
| Manufacturing | 99 (69.2%) | 44 (30.8%) |
| Wholesale Trade | 54 (100.0%) | 0 (0.0%) |
| Retail Trade | 119 (73.5%) | 43 (26.5%) |
| Transportation & Warehousing | 20 (74.1%) | 7 (25.9%) |
| Utilities | 23 (100.0%) | 0 (0.0%) |
| Information | 23 (79.3%) | 6 (20.7%) |
| Finance & Insurance | 43 (58.9%) | 30 (41.1%) |
| Real Estate, Rental & Leasing | 47 (47.5%) | 52 (52.5%) |
| Professional & Scientific | 54 (34.8%) | 101 (65.2%) |
| Enterprise Management | 0 (0.0%) | 0 (0.0%) |
| Administrative & Support | 21 (100.0%) | 0 (0.0%) |
| Educational Services | 29 (15.4%) | 159 (84.6%) |
| Health Care & Social Assistance | 59 (17.3%) | 281 (82.7%) |
| Arts, Entertainment & Recreation | 14 (100.0%) | 0 (0.0%) |
| Accommodation & Food Services | 61 (54.9%) | 50 (45.1%) |
| Public Administration | 44 (50.0%) | 44 (50.0%) |
| Total | 758 (47.7%) | 832 (52.3%) |
Education in Wellsboro borough
School Enrollment in Wellsboro borough
The most common levels of schooling among the 813 students in Wellsboro borough are elementary school (243 | 29.9%), middle school (155 | 19.1%), and high school (151 | 18.6%).
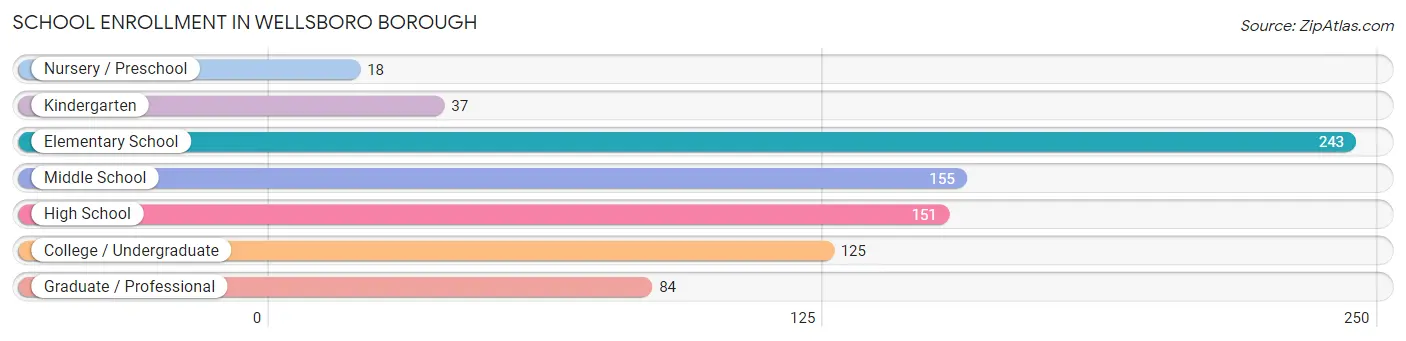
| School Level | # Students | % Students |
| Nursery / Preschool | 18 | 2.2% |
| Kindergarten | 37 | 4.5% |
| Elementary School | 243 | 29.9% |
| Middle School | 155 | 19.1% |
| High School | 151 | 18.6% |
| College / Undergraduate | 125 | 15.4% |
| Graduate / Professional | 84 | 10.3% |
| Total | 813 | 100.0% |
School Enrollment by Age by Funding Source in Wellsboro borough
Out of a total of 813 students who are enrolled in schools in Wellsboro borough, 161 (19.8%) attend a private institution, while the remaining 652 (80.2%) are enrolled in public schools. The age group of 3 to 4 year olds has the highest likelihood of being enrolled in private schools, with 10 (100.0% in the age bracket) enrolled. Conversely, the age group of 15 to 17 year olds has the lowest likelihood of being enrolled in a private school, with 136 (100.0% in the age bracket) attending a public institution.
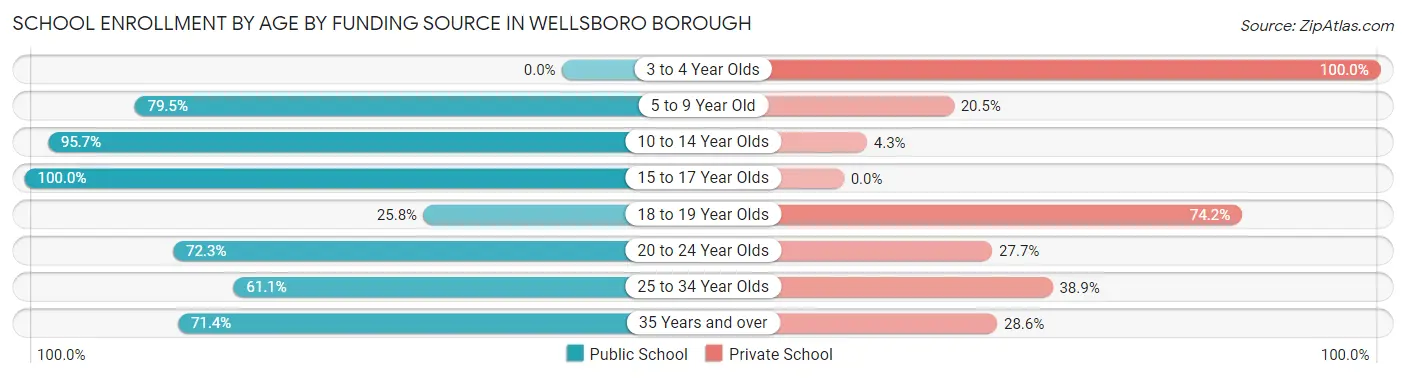
| Age Bracket | Public School | Private School |
| 3 to 4 Year Olds | 0 (0.0%) | 10 (100.0%) |
| 5 to 9 Year Old | 229 (79.5%) | 59 (20.5%) |
| 10 to 14 Year Olds | 155 (95.7%) | 7 (4.3%) |
| 15 to 17 Year Olds | 136 (100.0%) | 0 (0.0%) |
| 18 to 19 Year Olds | 8 (25.8%) | 23 (74.2%) |
| 20 to 24 Year Olds | 34 (72.3%) | 13 (27.7%) |
| 25 to 34 Year Olds | 55 (61.1%) | 35 (38.9%) |
| 35 Years and over | 35 (71.4%) | 14 (28.6%) |
| Total | 652 (80.2%) | 161 (19.8%) |
Educational Attainment by Field of Study in Wellsboro borough
Education (172 | 16.4%), science & technology (136 | 13.0%), business (96 | 9.1%), liberal arts & history (96 | 9.1%), and literature & languages (90 | 8.6%) are the most common fields of study among 1,049 individuals in Wellsboro borough who have obtained a bachelor's degree or higher.
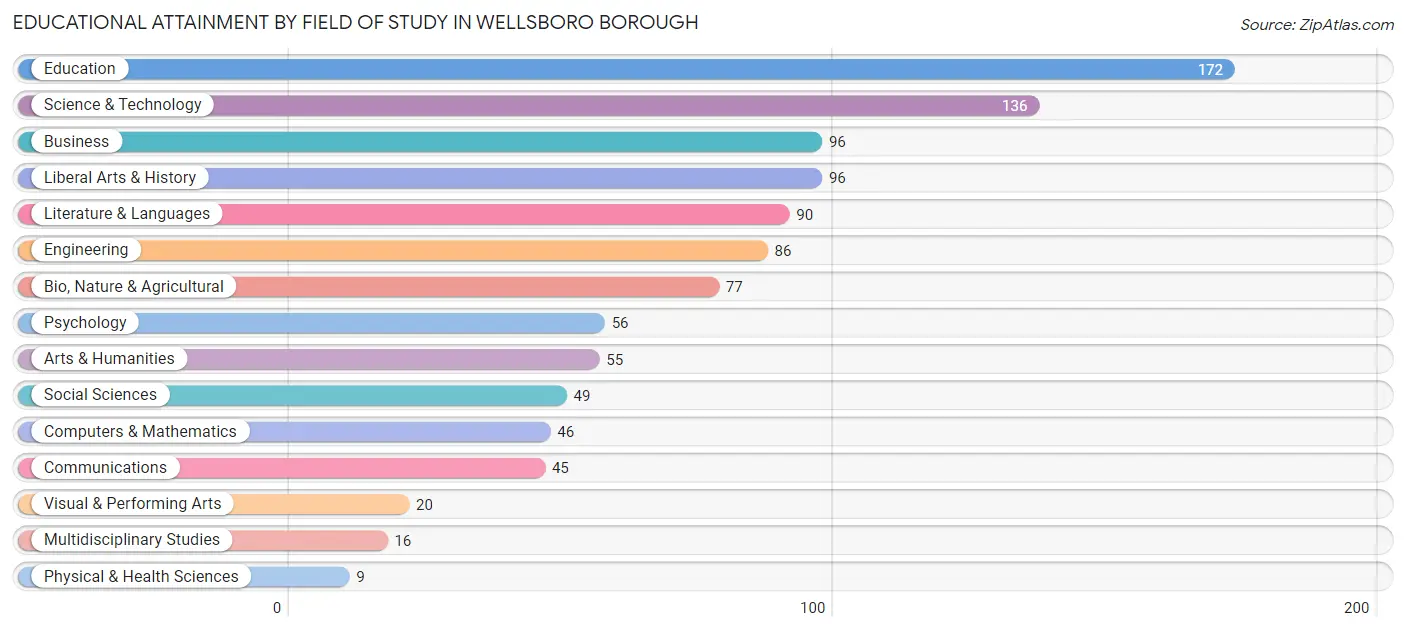
| Field of Study | # Graduates | % Graduates |
| Computers & Mathematics | 46 | 4.4% |
| Bio, Nature & Agricultural | 77 | 7.3% |
| Physical & Health Sciences | 9 | 0.9% |
| Psychology | 56 | 5.3% |
| Social Sciences | 49 | 4.7% |
| Engineering | 86 | 8.2% |
| Multidisciplinary Studies | 16 | 1.5% |
| Science & Technology | 136 | 13.0% |
| Business | 96 | 9.1% |
| Education | 172 | 16.4% |
| Literature & Languages | 90 | 8.6% |
| Liberal Arts & History | 96 | 9.1% |
| Visual & Performing Arts | 20 | 1.9% |
| Communications | 45 | 4.3% |
| Arts & Humanities | 55 | 5.2% |
| Total | 1,049 | 100.0% |
Transportation & Commute in Wellsboro borough
Vehicle Availability by Sex in Wellsboro borough
The most prevalent vehicle ownership categories in Wellsboro borough are males with 2 vehicles (373, accounting for 49.8%) and females with 2 vehicles (400, making up 44.8%).
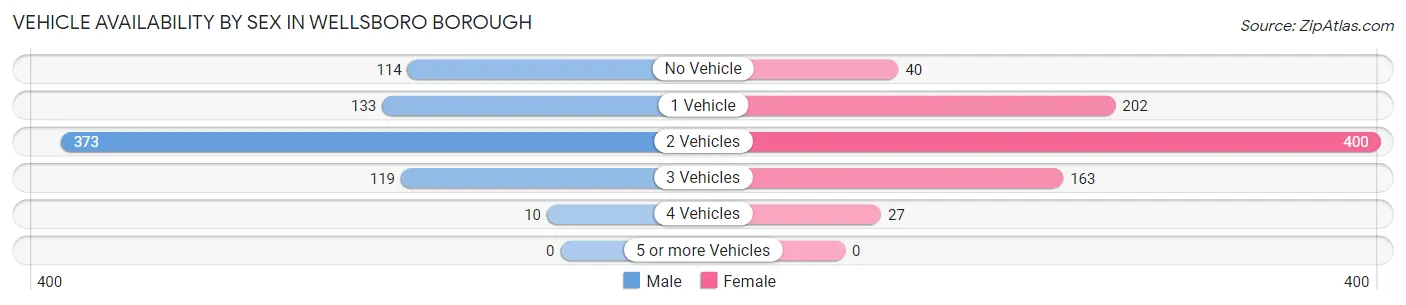
| Vehicles Available | Male | Female |
| No Vehicle | 114 (15.2%) | 40 (4.8%) |
| 1 Vehicle | 133 (17.8%) | 202 (24.3%) |
| 2 Vehicles | 373 (49.8%) | 400 (48.1%) |
| 3 Vehicles | 119 (15.9%) | 163 (19.6%) |
| 4 Vehicles | 10 (1.3%) | 27 (3.3%) |
| 5 or more Vehicles | 0 (0.0%) | 0 (0.0%) |
| Total | 749 (100.0%) | 832 (100.0%) |
Commute Time in Wellsboro borough
The most frequently occuring commute durations in Wellsboro borough are 5 to 9 minutes (368 commuters, 26.7%), 10 to 14 minutes (230 commuters, 16.7%), and less than 5 minutes (202 commuters, 14.7%).
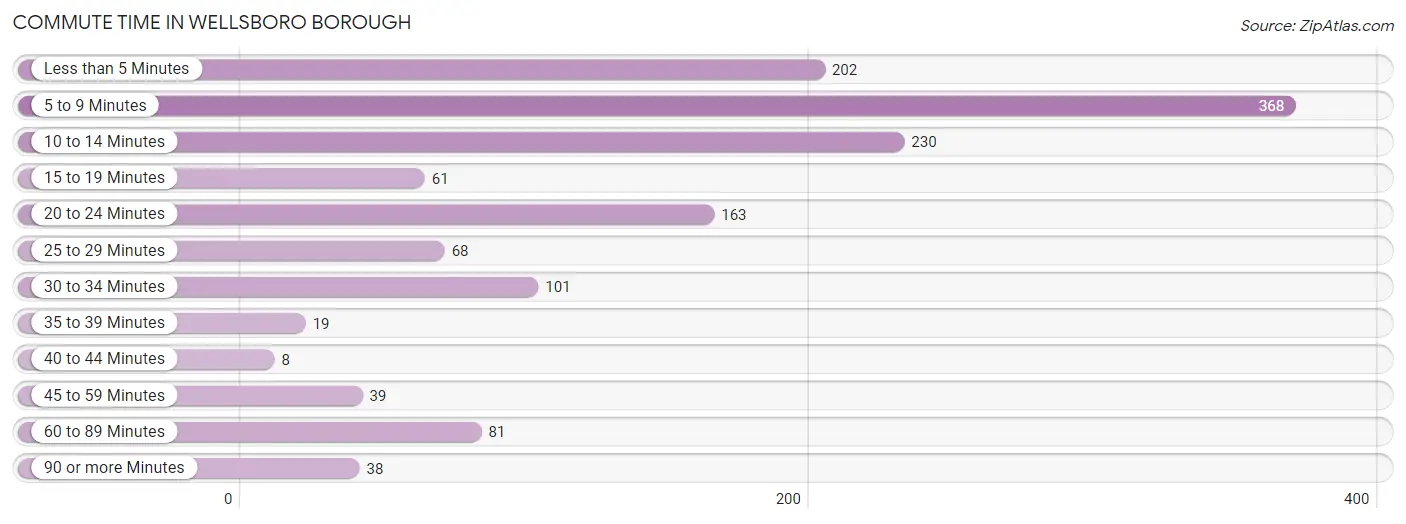
| Commute Time | # Commuters | % Commuters |
| Less than 5 Minutes | 202 | 14.7% |
| 5 to 9 Minutes | 368 | 26.7% |
| 10 to 14 Minutes | 230 | 16.7% |
| 15 to 19 Minutes | 61 | 4.4% |
| 20 to 24 Minutes | 163 | 11.8% |
| 25 to 29 Minutes | 68 | 4.9% |
| 30 to 34 Minutes | 101 | 7.3% |
| 35 to 39 Minutes | 19 | 1.4% |
| 40 to 44 Minutes | 8 | 0.6% |
| 45 to 59 Minutes | 39 | 2.8% |
| 60 to 89 Minutes | 81 | 5.9% |
| 90 or more Minutes | 38 | 2.8% |
Commute Time by Sex in Wellsboro borough
The most common commute times in Wellsboro borough are 5 to 9 minutes (156 commuters, 25.3%) for males and 5 to 9 minutes (212 commuters, 27.8%) for females.
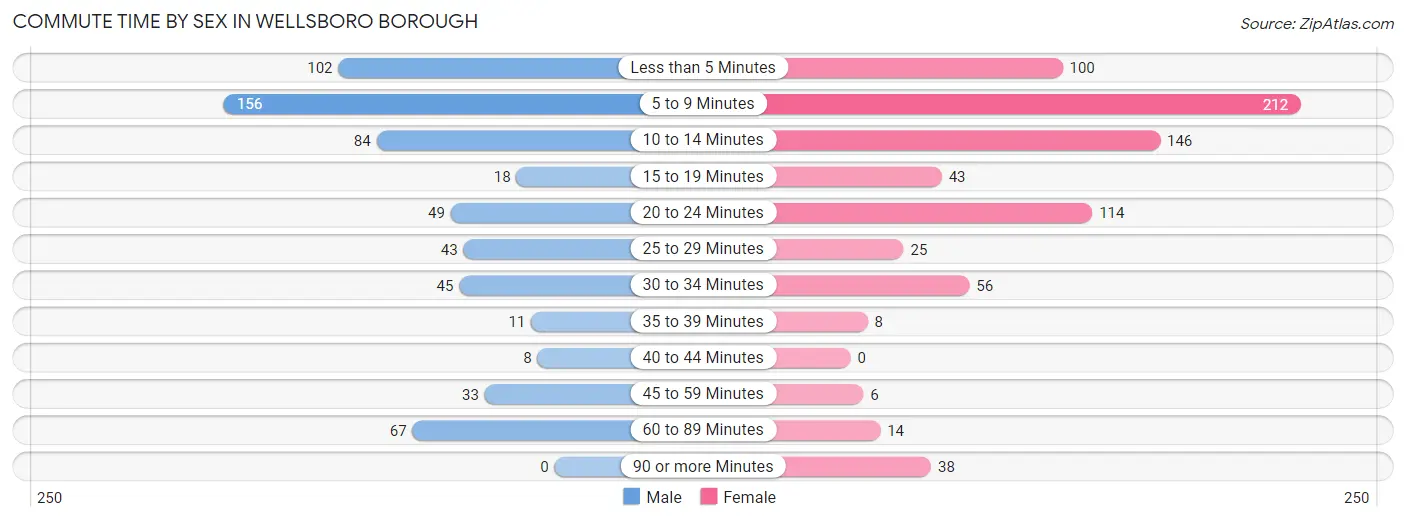
| Commute Time | Male | Female |
| Less than 5 Minutes | 102 (16.6%) | 100 (13.1%) |
| 5 to 9 Minutes | 156 (25.3%) | 212 (27.8%) |
| 10 to 14 Minutes | 84 (13.6%) | 146 (19.2%) |
| 15 to 19 Minutes | 18 (2.9%) | 43 (5.6%) |
| 20 to 24 Minutes | 49 (8.0%) | 114 (15.0%) |
| 25 to 29 Minutes | 43 (7.0%) | 25 (3.3%) |
| 30 to 34 Minutes | 45 (7.3%) | 56 (7.3%) |
| 35 to 39 Minutes | 11 (1.8%) | 8 (1.1%) |
| 40 to 44 Minutes | 8 (1.3%) | 0 (0.0%) |
| 45 to 59 Minutes | 33 (5.4%) | 6 (0.8%) |
| 60 to 89 Minutes | 67 (10.9%) | 14 (1.8%) |
| 90 or more Minutes | 0 (0.0%) | 38 (5.0%) |
Time of Departure to Work by Sex in Wellsboro borough
The most frequent times of departure to work in Wellsboro borough are 8:00 AM to 8:29 AM (106, 17.2%) for males and 7:30 AM to 7:59 AM (170, 22.3%) for females.
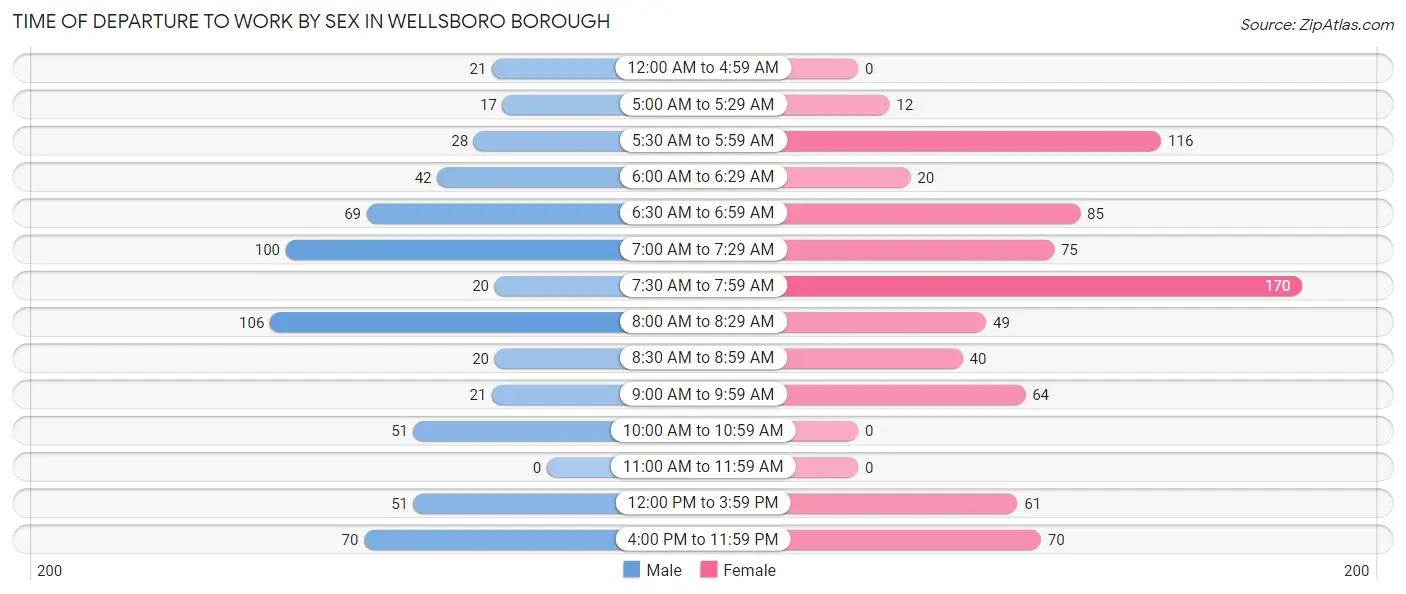
| Time of Departure | Male | Female |
| 12:00 AM to 4:59 AM | 21 (3.4%) | 0 (0.0%) |
| 5:00 AM to 5:29 AM | 17 (2.8%) | 12 (1.6%) |
| 5:30 AM to 5:59 AM | 28 (4.5%) | 116 (15.2%) |
| 6:00 AM to 6:29 AM | 42 (6.8%) | 20 (2.6%) |
| 6:30 AM to 6:59 AM | 69 (11.2%) | 85 (11.2%) |
| 7:00 AM to 7:29 AM | 100 (16.2%) | 75 (9.8%) |
| 7:30 AM to 7:59 AM | 20 (3.3%) | 170 (22.3%) |
| 8:00 AM to 8:29 AM | 106 (17.2%) | 49 (6.4%) |
| 8:30 AM to 8:59 AM | 20 (3.3%) | 40 (5.2%) |
| 9:00 AM to 9:59 AM | 21 (3.4%) | 64 (8.4%) |
| 10:00 AM to 10:59 AM | 51 (8.3%) | 0 (0.0%) |
| 11:00 AM to 11:59 AM | 0 (0.0%) | 0 (0.0%) |
| 12:00 PM to 3:59 PM | 51 (8.3%) | 61 (8.0%) |
| 4:00 PM to 11:59 PM | 70 (11.4%) | 70 (9.2%) |
| Total | 616 (100.0%) | 762 (100.0%) |
Housing Occupancy in Wellsboro borough
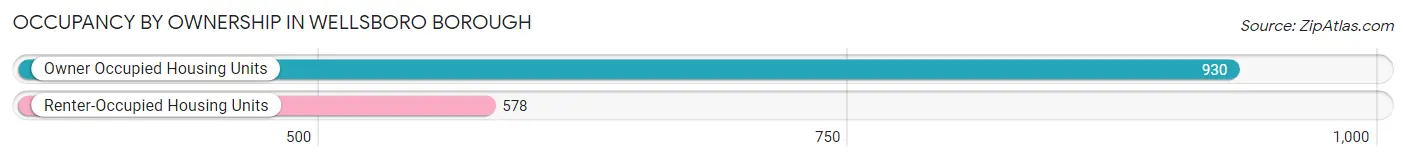
Occupancy by Ownership in Wellsboro borough
Of the total 1,508 dwellings in Wellsboro borough, owner-occupied units account for 930 (61.7%), while renter-occupied units make up 578 (38.3%).
| Occupancy | # Housing Units | % Housing Units |
| Owner Occupied Housing Units | 930 | 61.7% |
| Renter-Occupied Housing Units | 578 | 38.3% |
| Total Occupied Housing Units | 1,508 | 100.0% |
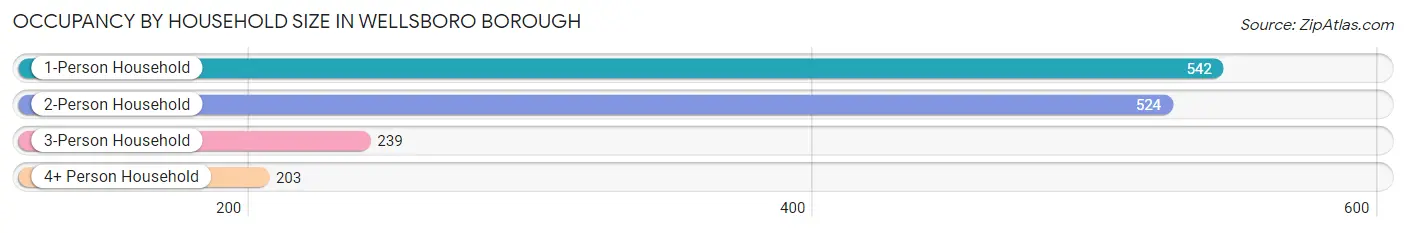
Occupancy by Household Size in Wellsboro borough
| Household Size | # Housing Units | % Housing Units |
| 1-Person Household | 542 | 35.9% |
| 2-Person Household | 524 | 34.7% |
| 3-Person Household | 239 | 15.9% |
| 4+ Person Household | 203 | 13.5% |
| Total Housing Units | 1,508 | 100.0% |
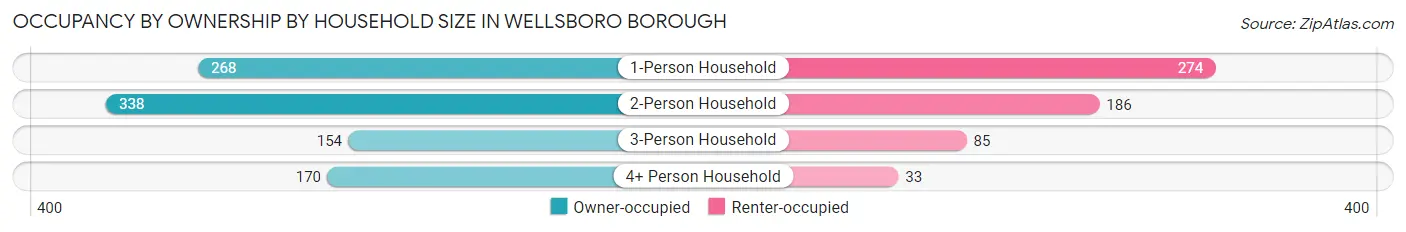
Occupancy by Ownership by Household Size in Wellsboro borough
| Household Size | Owner-occupied | Renter-occupied |
| 1-Person Household | 268 (49.4%) | 274 (50.5%) |
| 2-Person Household | 338 (64.5%) | 186 (35.5%) |
| 3-Person Household | 154 (64.4%) | 85 (35.6%) |
| 4+ Person Household | 170 (83.7%) | 33 (16.3%) |
| Total Housing Units | 930 (61.7%) | 578 (38.3%) |
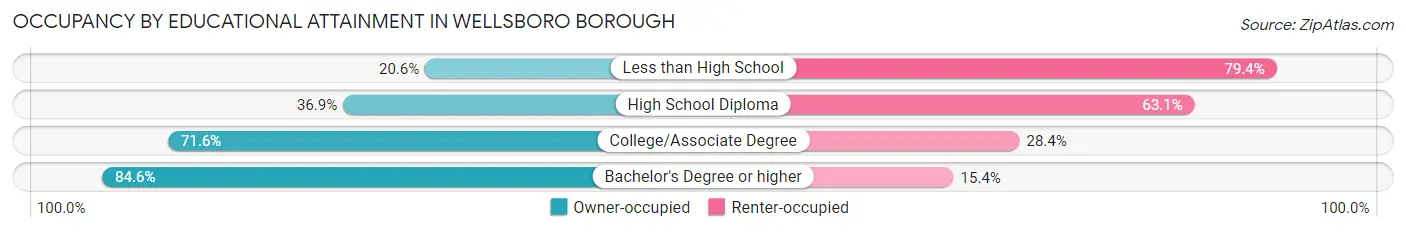
Occupancy by Educational Attainment in Wellsboro borough
| Household Size | Owner-occupied | Renter-occupied |
| Less than High School | 34 (20.6%) | 131 (79.4%) |
| High School Diploma | 149 (36.9%) | 255 (63.1%) |
| College/Associate Degree | 262 (71.6%) | 104 (28.4%) |
| Bachelor's Degree or higher | 485 (84.6%) | 88 (15.4%) |
Occupancy by Age of Householder in Wellsboro borough
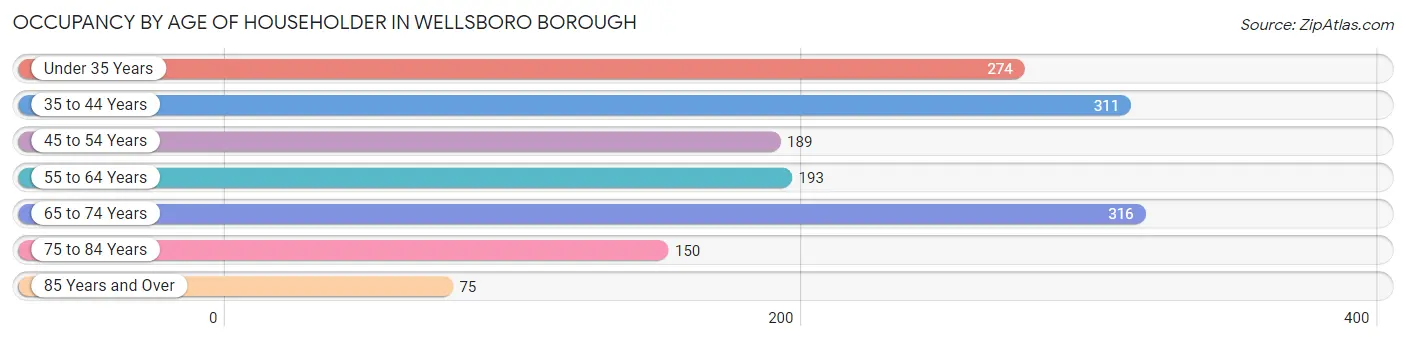
| Age Bracket | # Households | % Households |
| Under 35 Years | 274 | 18.2% |
| 35 to 44 Years | 311 | 20.6% |
| 45 to 54 Years | 189 | 12.5% |
| 55 to 64 Years | 193 | 12.8% |
| 65 to 74 Years | 316 | 20.9% |
| 75 to 84 Years | 150 | 10.0% |
| 85 Years and Over | 75 | 5.0% |
| Total | 1,508 | 100.0% |
Housing Finances in Wellsboro borough
Median Income by Occupancy in Wellsboro borough
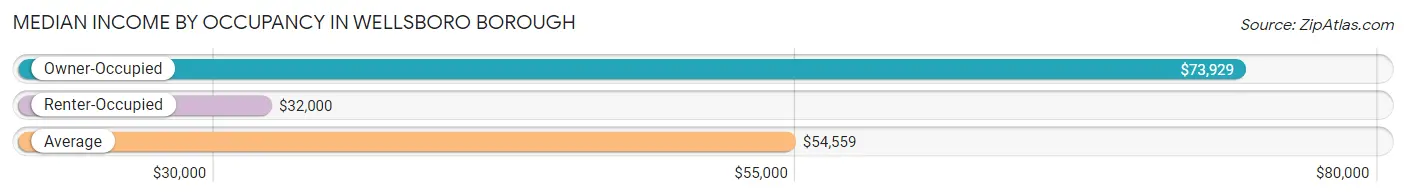
| Occupancy Type | # Households | Median Income |
| Owner-Occupied | 930 (61.7%) | $73,929 |
| Renter-Occupied | 578 (38.3%) | $32,000 |
| Average | 1,508 (100.0%) | $54,559 |
Occupancy by Householder Income Bracket in Wellsboro borough
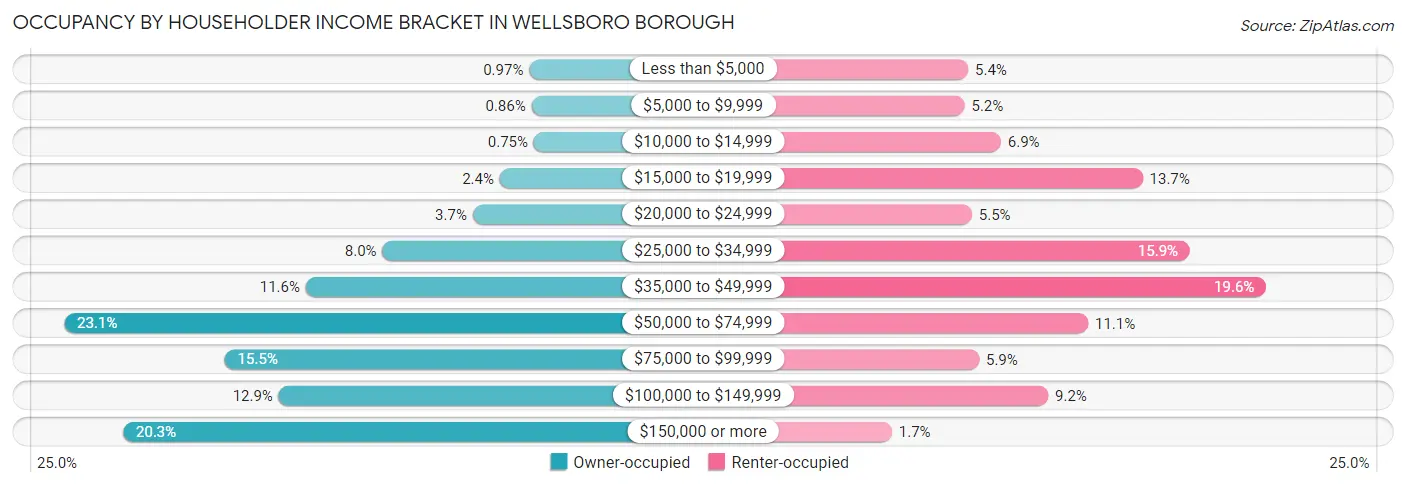
| Income Bracket | Owner-occupied | Renter-occupied |
| Less than $5,000 | 9 (1.0%) | 31 (5.4%) |
| $5,000 to $9,999 | 8 (0.9%) | 30 (5.2%) |
| $10,000 to $14,999 | 7 (0.7%) | 40 (6.9%) |
| $15,000 to $19,999 | 22 (2.4%) | 79 (13.7%) |
| $20,000 to $24,999 | 34 (3.7%) | 32 (5.5%) |
| $25,000 to $34,999 | 74 (8.0%) | 92 (15.9%) |
| $35,000 to $49,999 | 108 (11.6%) | 113 (19.6%) |
| $50,000 to $74,999 | 215 (23.1%) | 64 (11.1%) |
| $75,000 to $99,999 | 144 (15.5%) | 34 (5.9%) |
| $100,000 to $149,999 | 120 (12.9%) | 53 (9.2%) |
| $150,000 or more | 189 (20.3%) | 10 (1.7%) |
| Total | 930 (100.0%) | 578 (100.0%) |
Monthly Housing Cost Tiers in Wellsboro borough
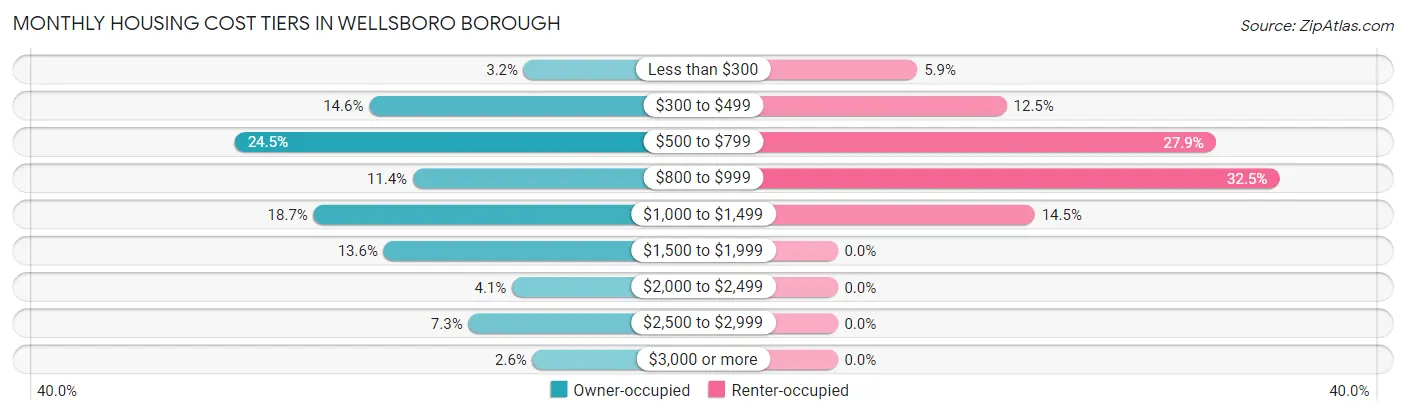
| Monthly Cost | Owner-occupied | Renter-occupied |
| Less than $300 | 30 (3.2%) | 34 (5.9%) |
| $300 to $499 | 136 (14.6%) | 72 (12.5%) |
| $500 to $799 | 228 (24.5%) | 161 (27.9%) |
| $800 to $999 | 106 (11.4%) | 188 (32.5%) |
| $1,000 to $1,499 | 174 (18.7%) | 84 (14.5%) |
| $1,500 to $1,999 | 126 (13.6%) | 0 (0.0%) |
| $2,000 to $2,499 | 38 (4.1%) | 0 (0.0%) |
| $2,500 to $2,999 | 68 (7.3%) | 0 (0.0%) |
| $3,000 or more | 24 (2.6%) | 0 (0.0%) |
| Total | 930 (100.0%) | 578 (100.0%) |
Physical Housing Characteristics in Wellsboro borough
Housing Structures in Wellsboro borough
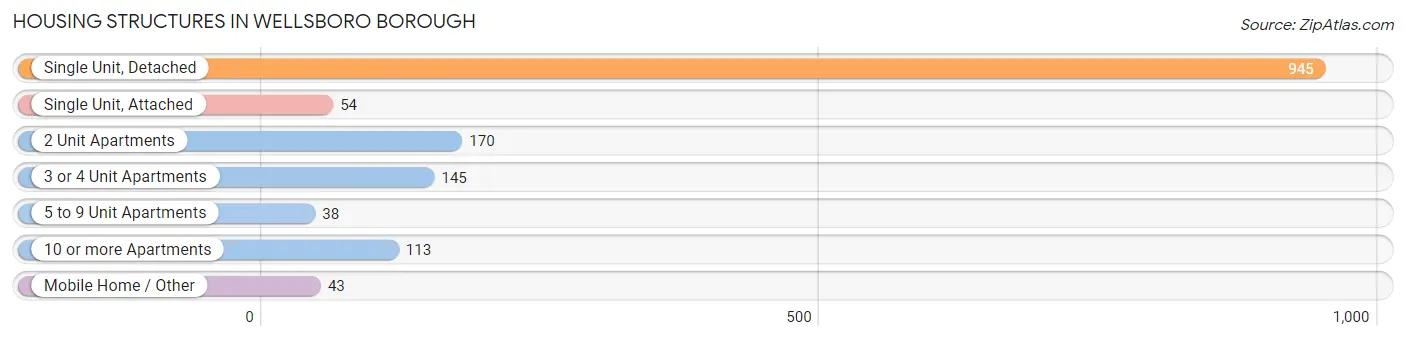
| Structure Type | # Housing Units | % Housing Units |
| Single Unit, Detached | 945 | 62.7% |
| Single Unit, Attached | 54 | 3.6% |
| 2 Unit Apartments | 170 | 11.3% |
| 3 or 4 Unit Apartments | 145 | 9.6% |
| 5 to 9 Unit Apartments | 38 | 2.5% |
| 10 or more Apartments | 113 | 7.5% |
| Mobile Home / Other | 43 | 2.9% |
| Total | 1,508 | 100.0% |
Housing Structures by Occupancy in Wellsboro borough
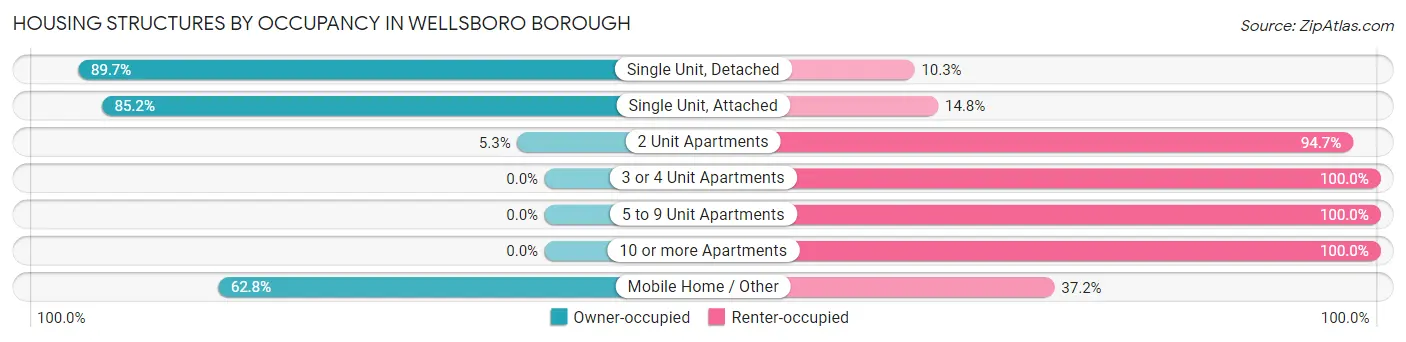
| Structure Type | Owner-occupied | Renter-occupied |
| Single Unit, Detached | 848 (89.7%) | 97 (10.3%) |
| Single Unit, Attached | 46 (85.2%) | 8 (14.8%) |
| 2 Unit Apartments | 9 (5.3%) | 161 (94.7%) |
| 3 or 4 Unit Apartments | 0 (0.0%) | 145 (100.0%) |
| 5 to 9 Unit Apartments | 0 (0.0%) | 38 (100.0%) |
| 10 or more Apartments | 0 (0.0%) | 113 (100.0%) |
| Mobile Home / Other | 27 (62.8%) | 16 (37.2%) |
| Total | 930 (61.7%) | 578 (38.3%) |
Housing Structures by Number of Rooms in Wellsboro borough
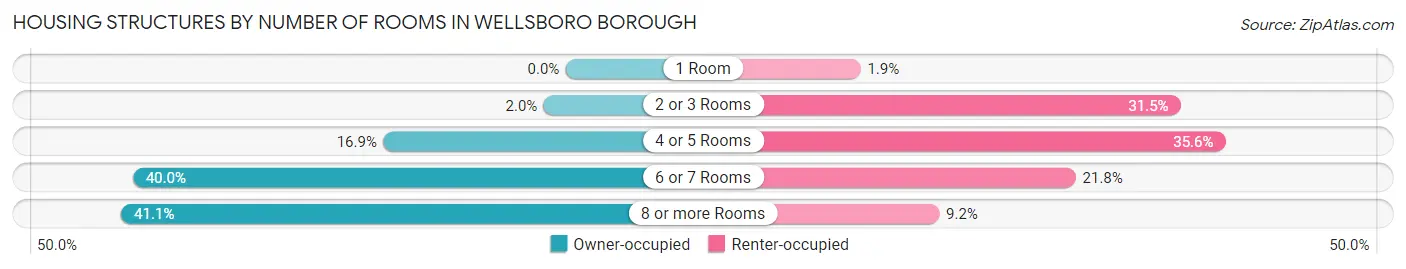
| Number of Rooms | Owner-occupied | Renter-occupied |
| 1 Room | 0 (0.0%) | 11 (1.9%) |
| 2 or 3 Rooms | 19 (2.0%) | 182 (31.5%) |
| 4 or 5 Rooms | 157 (16.9%) | 206 (35.6%) |
| 6 or 7 Rooms | 372 (40.0%) | 126 (21.8%) |
| 8 or more Rooms | 382 (41.1%) | 53 (9.2%) |
| Total | 930 (100.0%) | 578 (100.0%) |
Housing Structure by Heating Type in Wellsboro borough
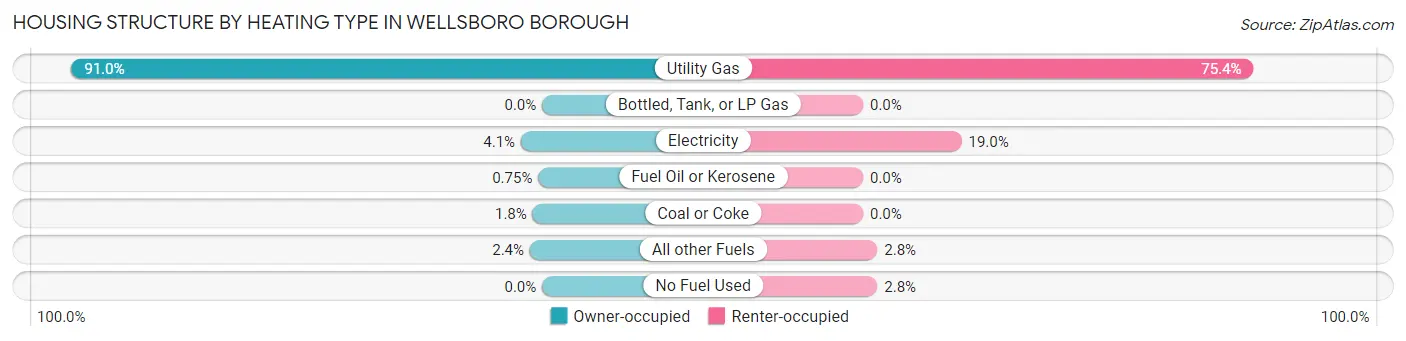
| Heating Type | Owner-occupied | Renter-occupied |
| Utility Gas | 846 (91.0%) | 436 (75.4%) |
| Bottled, Tank, or LP Gas | 0 (0.0%) | 0 (0.0%) |
| Electricity | 38 (4.1%) | 110 (19.0%) |
| Fuel Oil or Kerosene | 7 (0.7%) | 0 (0.0%) |
| Coal or Coke | 17 (1.8%) | 0 (0.0%) |
| All other Fuels | 22 (2.4%) | 16 (2.8%) |
| No Fuel Used | 0 (0.0%) | 16 (2.8%) |
| Total | 930 (100.0%) | 578 (100.0%) |
Household Vehicle Usage in Wellsboro borough
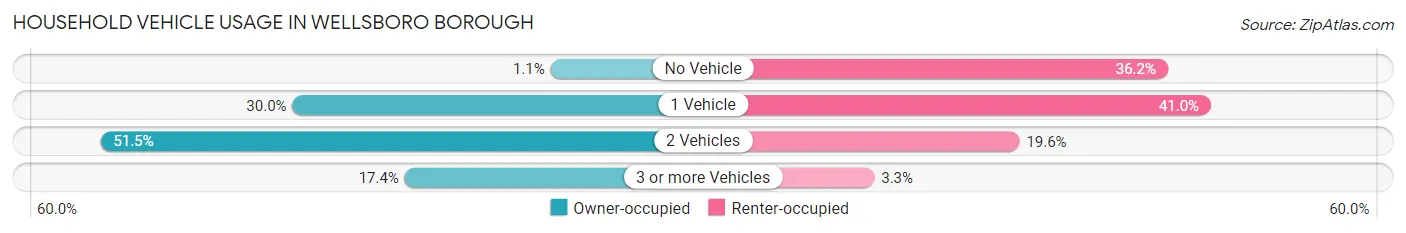
| Vehicles per Household | Owner-occupied | Renter-occupied |
| No Vehicle | 10 (1.1%) | 209 (36.2%) |
| 1 Vehicle | 279 (30.0%) | 237 (41.0%) |
| 2 Vehicles | 479 (51.5%) | 113 (19.6%) |
| 3 or more Vehicles | 162 (17.4%) | 19 (3.3%) |
| Total | 930 (100.0%) | 578 (100.0%) |
Real Estate & Mortgages in Wellsboro borough
Real Estate and Mortgage Overview in Wellsboro borough
| Characteristic | Without Mortgage | With Mortgage |
| Housing Units | 423 | 507 |
| Median Property Value | $174,300 | $193,800 |
| Median Household Income | $60,208 | $135 |
| Monthly Housing Costs | $580 | $24 |
| Real Estate Taxes | $2,712 | $0 |
Property Value by Mortgage Status in Wellsboro borough
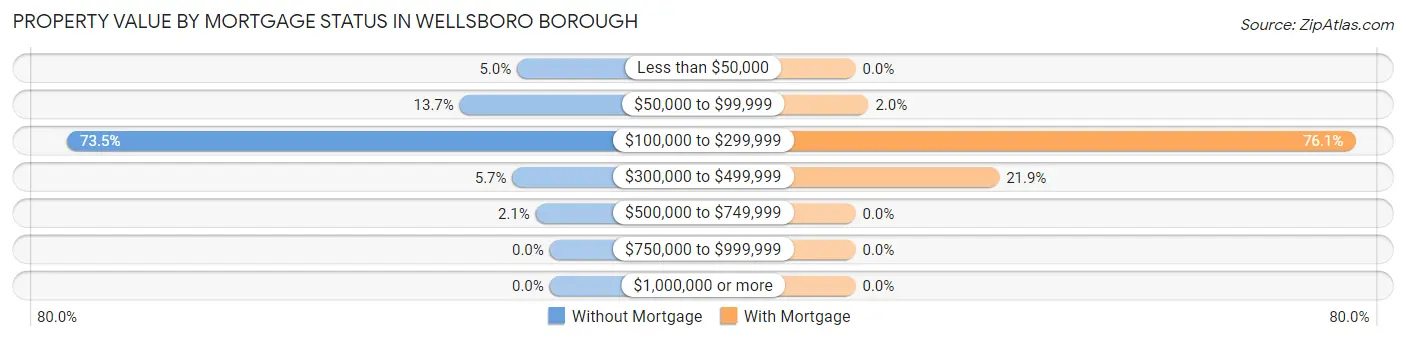
| Property Value | Without Mortgage | With Mortgage |
| Less than $50,000 | 21 (5.0%) | 0 (0.0%) |
| $50,000 to $99,999 | 58 (13.7%) | 10 (2.0%) |
| $100,000 to $299,999 | 311 (73.5%) | 386 (76.1%) |
| $300,000 to $499,999 | 24 (5.7%) | 111 (21.9%) |
| $500,000 to $749,999 | 9 (2.1%) | 0 (0.0%) |
| $750,000 to $999,999 | 0 (0.0%) | 0 (0.0%) |
| $1,000,000 or more | 0 (0.0%) | 0 (0.0%) |
| Total | 423 (100.0%) | 507 (100.0%) |
Household Income by Mortgage Status in Wellsboro borough
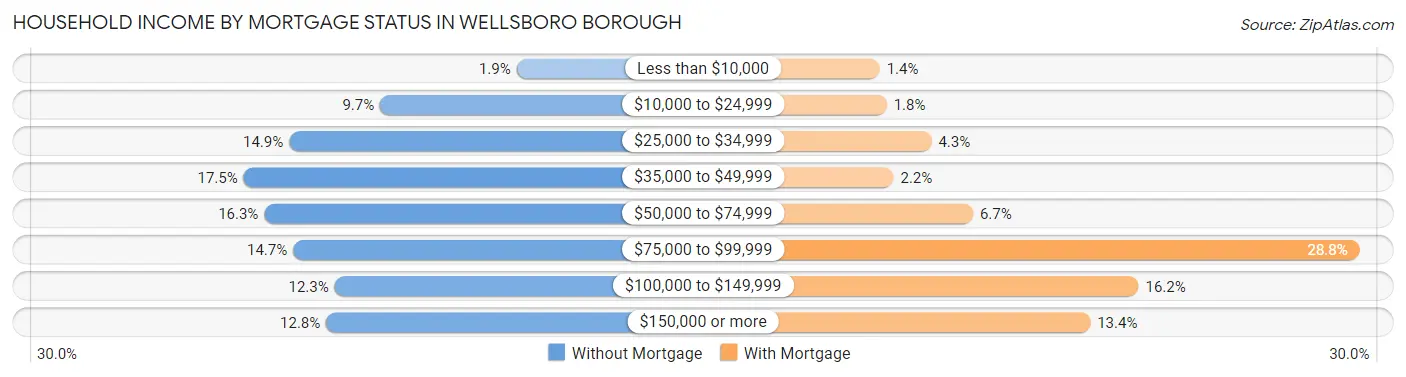
| Household Income | Without Mortgage | With Mortgage |
| Less than $10,000 | 8 (1.9%) | 7 (1.4%) |
| $10,000 to $24,999 | 41 (9.7%) | 9 (1.8%) |
| $25,000 to $34,999 | 63 (14.9%) | 22 (4.3%) |
| $35,000 to $49,999 | 74 (17.5%) | 11 (2.2%) |
| $50,000 to $74,999 | 69 (16.3%) | 34 (6.7%) |
| $75,000 to $99,999 | 62 (14.7%) | 146 (28.8%) |
| $100,000 to $149,999 | 52 (12.3%) | 82 (16.2%) |
| $150,000 or more | 54 (12.8%) | 68 (13.4%) |
| Total | 423 (100.0%) | 507 (100.0%) |
Property Value to Household Income Ratio in Wellsboro borough
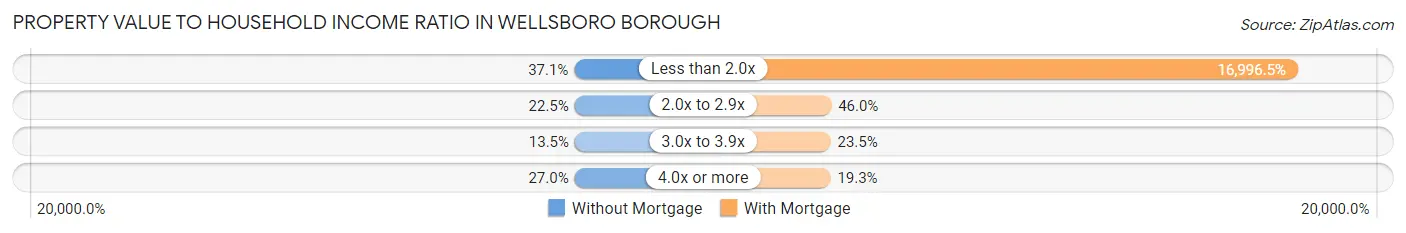
| Value-to-Income Ratio | Without Mortgage | With Mortgage |
| Less than 2.0x | 157 (37.1%) | 86,172 (16,996.4%) |
| 2.0x to 2.9x | 95 (22.5%) | 233 (46.0%) |
| 3.0x to 3.9x | 57 (13.5%) | 119 (23.5%) |
| 4.0x or more | 114 (27.0%) | 98 (19.3%) |
| Total | 423 (100.0%) | 507 (100.0%) |
Real Estate Taxes by Mortgage Status in Wellsboro borough
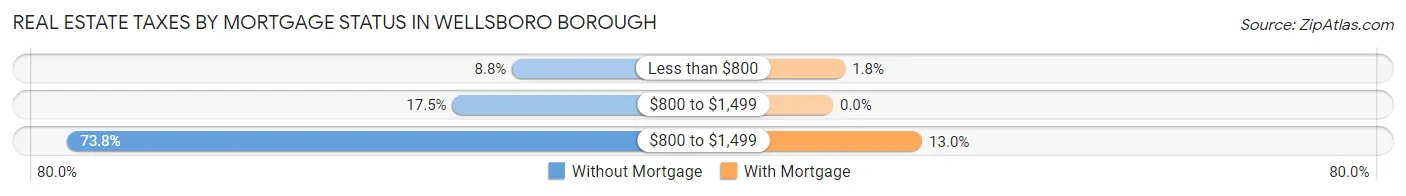
| Property Taxes | Without Mortgage | With Mortgage |
| Less than $800 | 37 (8.7%) | 9 (1.8%) |
| $800 to $1,499 | 74 (17.5%) | 0 (0.0%) |
| $800 to $1,499 | 312 (73.8%) | 66 (13.0%) |
| Total | 423 (100.0%) | 507 (100.0%) |
Health & Disability in Wellsboro borough
Health Insurance Coverage by Age in Wellsboro borough
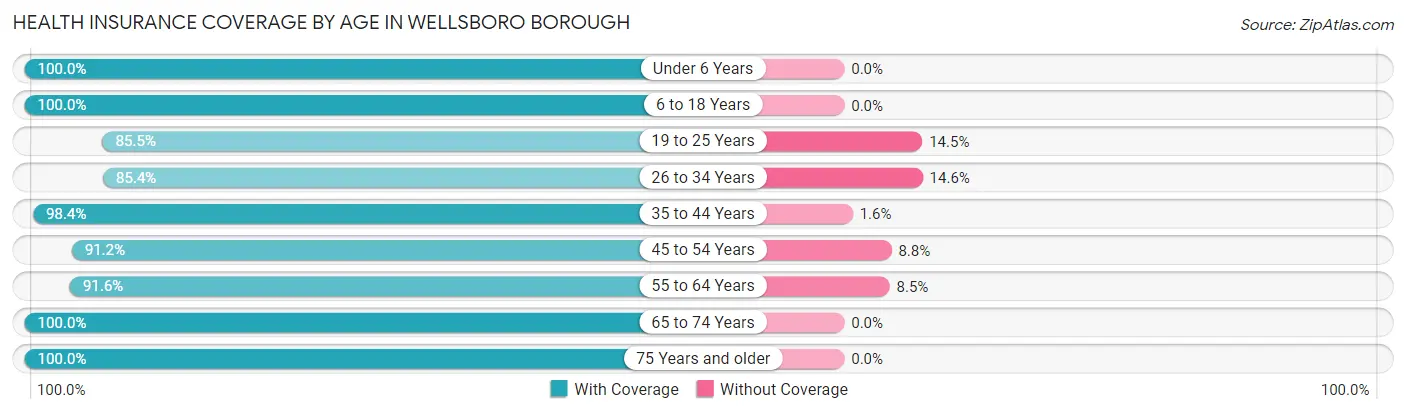
| Age Bracket | With Coverage | Without Coverage |
| Under 6 Years | 191 (100.0%) | 0 (0.0%) |
| 6 to 18 Years | 558 (100.0%) | 0 (0.0%) |
| 19 to 25 Years | 247 (85.5%) | 42 (14.5%) |
| 26 to 34 Years | 304 (85.4%) | 52 (14.6%) |
| 35 to 44 Years | 501 (98.4%) | 8 (1.6%) |
| 45 to 54 Years | 342 (91.2%) | 33 (8.8%) |
| 55 to 64 Years | 260 (91.5%) | 24 (8.5%) |
| 65 to 74 Years | 491 (100.0%) | 0 (0.0%) |
| 75 Years and older | 264 (100.0%) | 0 (0.0%) |
| Total | 3,158 (95.2%) | 159 (4.8%) |
Health Insurance Coverage by Citizenship Status in Wellsboro borough

| Citizenship Status | With Coverage | Without Coverage |
| Native Born | 191 (100.0%) | 0 (0.0%) |
| Foreign Born, Citizen | 558 (100.0%) | 0 (0.0%) |
| Foreign Born, not a Citizen | 247 (85.5%) | 42 (14.5%) |
Health Insurance Coverage by Household Income in Wellsboro borough
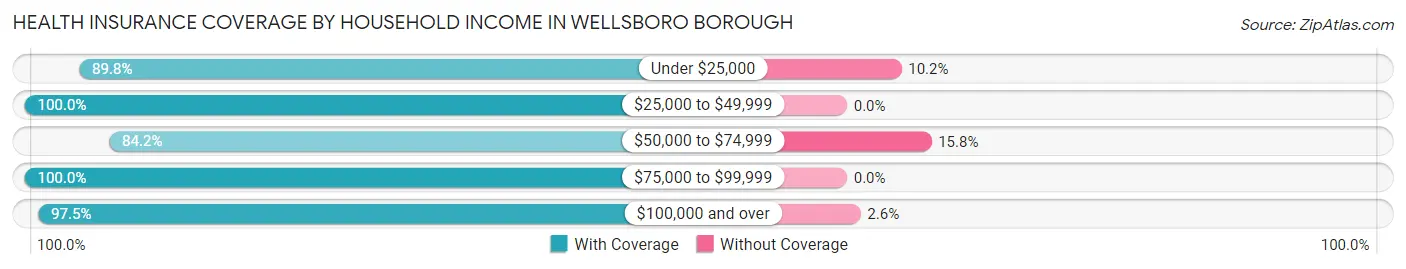
| Household Income | With Coverage | Without Coverage |
| Under $25,000 | 431 (89.8%) | 49 (10.2%) |
| $25,000 to $49,999 | 621 (100.0%) | 0 (0.0%) |
| $50,000 to $74,999 | 431 (84.2%) | 81 (15.8%) |
| $75,000 to $99,999 | 561 (100.0%) | 0 (0.0%) |
| $100,000 and over | 1,107 (97.5%) | 29 (2.5%) |
Public vs Private Health Insurance Coverage by Age in Wellsboro borough
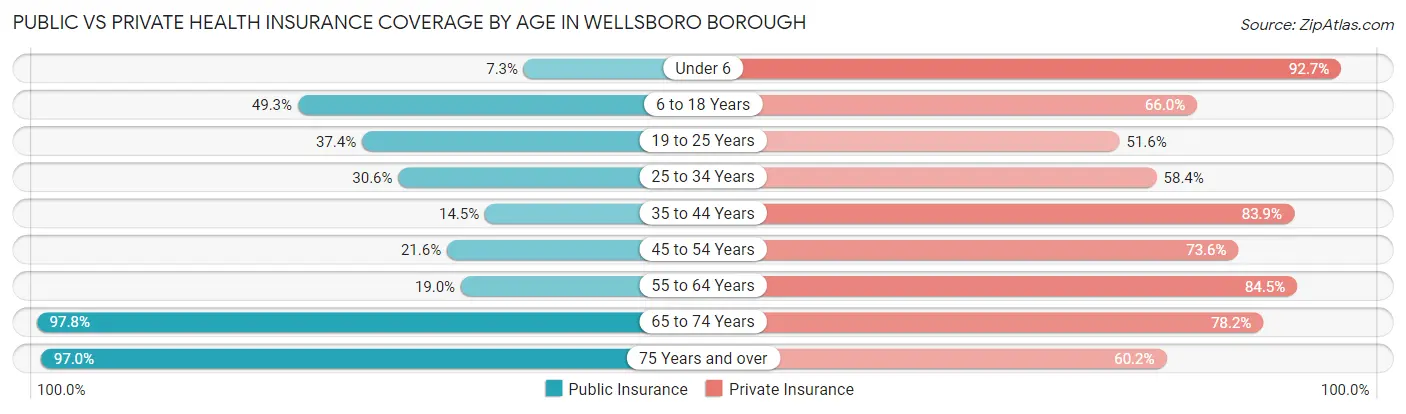
| Age Bracket | Public Insurance | Private Insurance |
| Under 6 | 14 (7.3%) | 177 (92.7%) |
| 6 to 18 Years | 275 (49.3%) | 368 (65.9%) |
| 19 to 25 Years | 108 (37.4%) | 149 (51.6%) |
| 25 to 34 Years | 109 (30.6%) | 208 (58.4%) |
| 35 to 44 Years | 74 (14.5%) | 427 (83.9%) |
| 45 to 54 Years | 81 (21.6%) | 276 (73.6%) |
| 55 to 64 Years | 54 (19.0%) | 240 (84.5%) |
| 65 to 74 Years | 480 (97.8%) | 384 (78.2%) |
| 75 Years and over | 256 (97.0%) | 159 (60.2%) |
| Total | 1,451 (43.7%) | 2,388 (72.0%) |
Disability Status by Sex by Age in Wellsboro borough
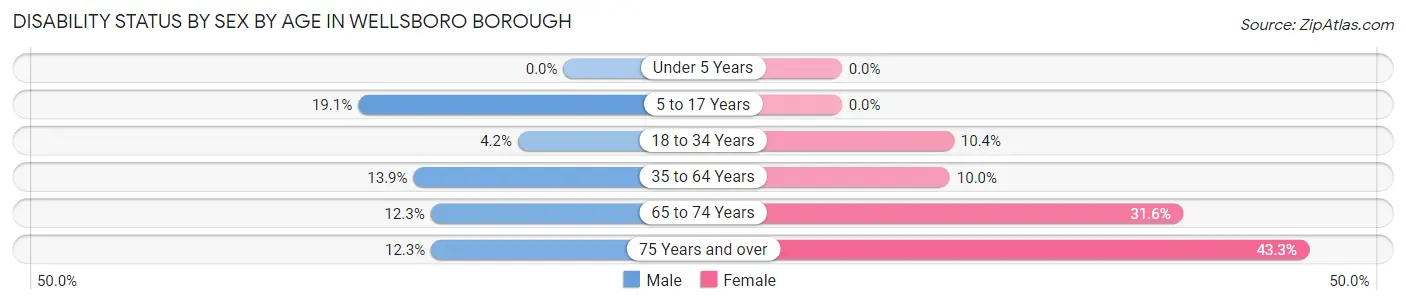
| Age Bracket | Male | Female |
| Under 5 Years | 0 (0.0%) | 0 (0.0%) |
| 5 to 17 Years | 65 (19.1%) | 0 (0.0%) |
| 18 to 34 Years | 15 (4.2%) | 31 (10.4%) |
| 35 to 64 Years | 71 (13.9%) | 66 (10.0%) |
| 65 to 74 Years | 27 (12.3%) | 86 (31.6%) |
| 75 Years and over | 14 (12.3%) | 65 (43.3%) |
Disability Class by Sex by Age in Wellsboro borough
Disability Class: Hearing Difficulty
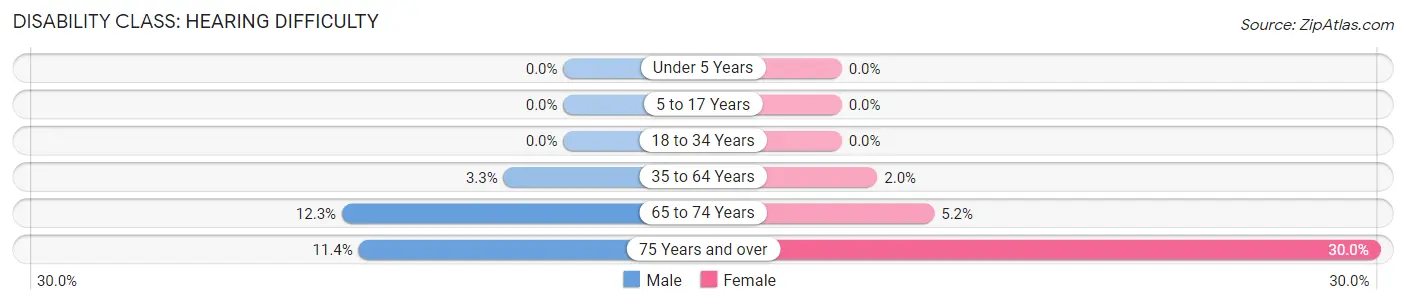
| Age Bracket | Male | Female |
| Under 5 Years | 0 (0.0%) | 0 (0.0%) |
| 5 to 17 Years | 0 (0.0%) | 0 (0.0%) |
| 18 to 34 Years | 0 (0.0%) | 0 (0.0%) |
| 35 to 64 Years | 17 (3.3%) | 13 (2.0%) |
| 65 to 74 Years | 27 (12.3%) | 14 (5.1%) |
| 75 Years and over | 13 (11.4%) | 45 (30.0%) |
Disability Class: Vision Difficulty
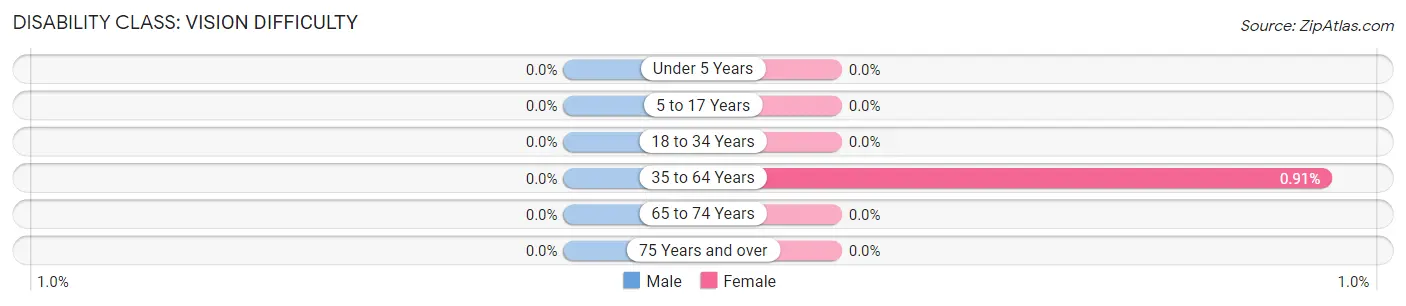
| Age Bracket | Male | Female |
| Under 5 Years | 0 (0.0%) | 0 (0.0%) |
| 5 to 17 Years | 0 (0.0%) | 0 (0.0%) |
| 18 to 34 Years | 0 (0.0%) | 0 (0.0%) |
| 35 to 64 Years | 0 (0.0%) | 6 (0.9%) |
| 65 to 74 Years | 0 (0.0%) | 0 (0.0%) |
| 75 Years and over | 0 (0.0%) | 0 (0.0%) |
Disability Class: Cognitive Difficulty
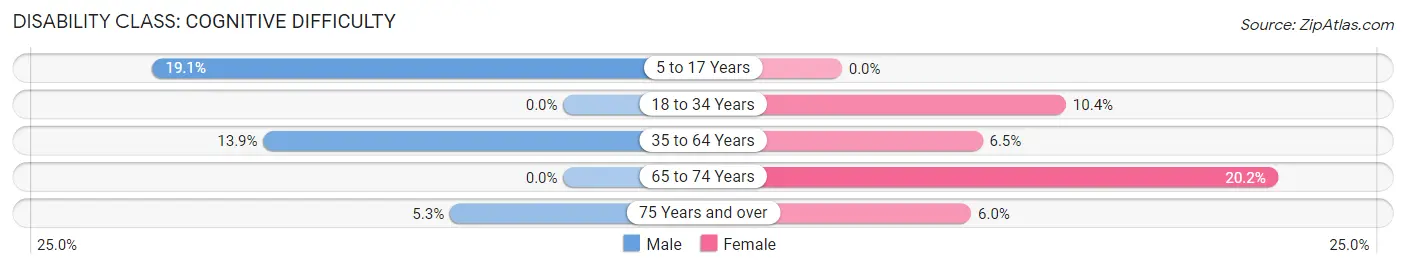
| Age Bracket | Male | Female |
| 5 to 17 Years | 65 (19.1%) | 0 (0.0%) |
| 18 to 34 Years | 0 (0.0%) | 31 (10.4%) |
| 35 to 64 Years | 71 (13.9%) | 43 (6.5%) |
| 65 to 74 Years | 0 (0.0%) | 55 (20.2%) |
| 75 Years and over | 6 (5.3%) | 9 (6.0%) |
Disability Class: Ambulatory Difficulty
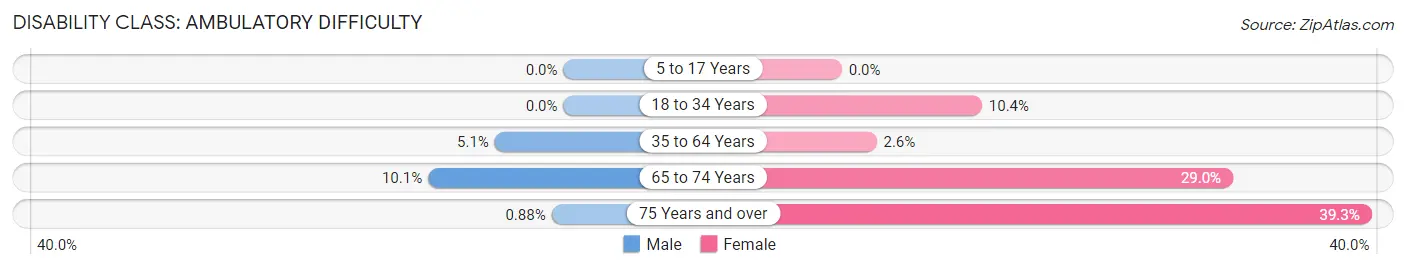
| Age Bracket | Male | Female |
| 5 to 17 Years | 0 (0.0%) | 0 (0.0%) |
| 18 to 34 Years | 0 (0.0%) | 31 (10.4%) |
| 35 to 64 Years | 26 (5.1%) | 17 (2.6%) |
| 65 to 74 Years | 22 (10.1%) | 79 (29.0%) |
| 75 Years and over | 1 (0.9%) | 59 (39.3%) |
Disability Class: Self-Care Difficulty
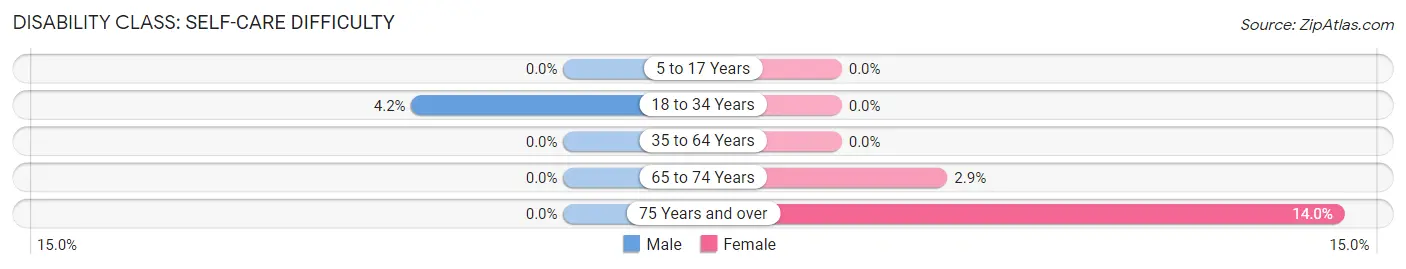
| Age Bracket | Male | Female |
| 5 to 17 Years | 0 (0.0%) | 0 (0.0%) |
| 18 to 34 Years | 15 (4.2%) | 0 (0.0%) |
| 35 to 64 Years | 0 (0.0%) | 0 (0.0%) |
| 65 to 74 Years | 0 (0.0%) | 8 (2.9%) |
| 75 Years and over | 0 (0.0%) | 21 (14.0%) |
Technology Access in Wellsboro borough
Computing Device Access in Wellsboro borough
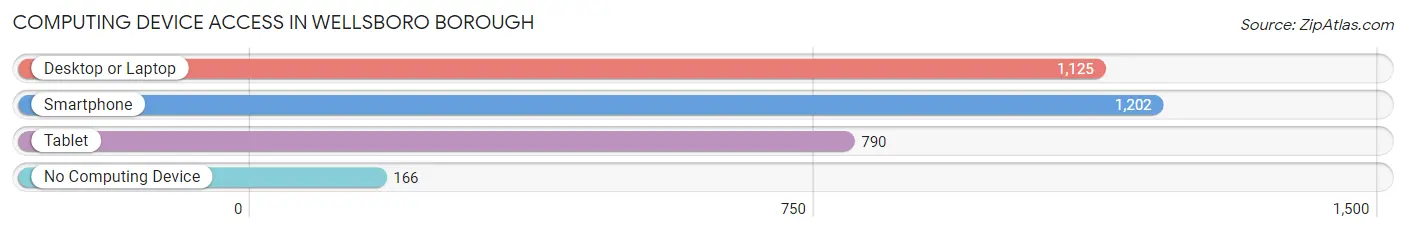
| Device Type | # Households | % Households |
| Desktop or Laptop | 1,125 | 74.6% |
| Smartphone | 1,202 | 79.7% |
| Tablet | 790 | 52.4% |
| No Computing Device | 166 | 11.0% |
| Total | 1,508 | 100.0% |
Internet Access in Wellsboro borough
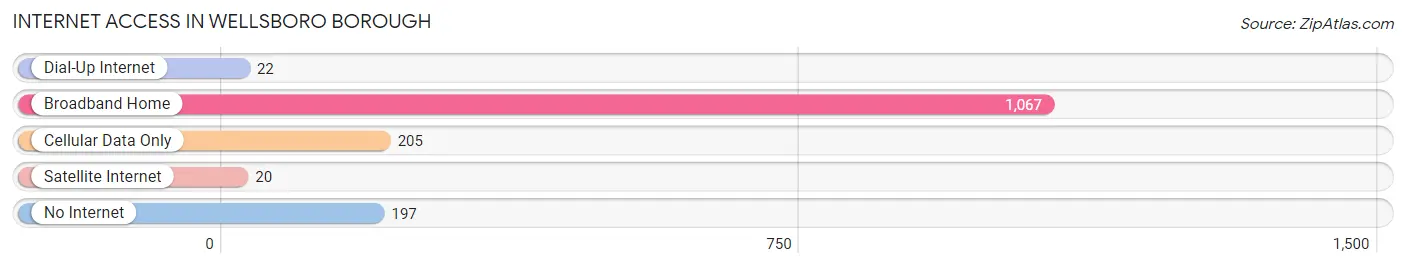
| Internet Type | # Households | % Households |
| Dial-Up Internet | 22 | 1.5% |
| Broadband Home | 1,067 | 70.8% |
| Cellular Data Only | 205 | 13.6% |
| Satellite Internet | 20 | 1.3% |
| No Internet | 197 | 13.1% |
| Total | 1,508 | 100.0% |
Wellsboro borough Summary
Wellsboro Borough is a borough located in Tioga County, Pennsylvania, United States. The population was 3,326 at the 2010 census. It is the county seat of Tioga County. Wellsboro is part of the Elmira, New York metropolitan area.
History
The area that is now Wellsboro was first settled in 1787 by settlers from Connecticut. The town was originally called Wellsborough, after Mary Wells, the wife of the first settler, William Wells. The town was incorporated as Wellsboro in 1806.
In the early 19th century, Wellsboro was a center of the lumber industry. The town was home to several sawmills and gristmills, and the lumber industry was the main source of income for the town. The lumber industry declined in the late 19th century, and the town shifted its focus to agriculture and tourism.
In the late 19th century, Wellsboro became a popular tourist destination. The town was home to several hotels and resorts, and it was a popular destination for outdoor activities such as hunting and fishing.
Geography
Wellsboro is located at 41°45'7" North, 77°10'25" West (41.7519, -77.1737). According to the United States Census Bureau, the borough has a total area of 1.3 square miles (3.4 km2), all of it land.
Economy
The economy of Wellsboro is largely based on tourism and agriculture. The town is home to several tourist attractions, including the Grand Canyon of Pennsylvania, the Pine Creek Gorge, and the Pennsylvania Lumber Museum. The town is also home to several farms, which produce a variety of crops, including corn, soybeans, and hay.
Demographics
As of the census of 2010, there were 3,326 people, 1,521 households, and 845 families residing in the borough. The population density was 2,541.5 people per square mile (982.2/km2). There were 1,717 housing units at an average density of 1,320.8 per square mile (509.7/km2). The racial makeup of the borough was 97.2% White, 0.7% African American, 0.2% Native American, 0.5% Asian, 0.2% from other races, and 1.2% from two or more races. Hispanic or Latino of any race were 1.2% of the population.
There were 1,521 households, out of which 24.2% had children under the age of 18 living with them, 43.2% were married couples living together, 11.3% had a female householder with no husband present, and 41.3% were non-families. 36.2% of all households were made up of individuals, and 17.2% had someone living alone who was 65 years of age or older. The average household size was 2.17 and the average family size was 2.81.
In the borough, the population was spread out, with 20.7% under the age of 18, 8.2% from 18 to 24, 24.3% from 25 to 44, 25.7% from 45 to 64, and 20.9% who were 65 years of age or older. The median age was 42 years. For every 100 females, there were 87.2 males. For every 100 females age 18 and over, there were 83.2 males.
The median income for a household in the borough was $31,250, and the median income for a family was $41,250. Males had a median income of $30,000 versus $21,250 for females. The per capita income for the borough was $17,945. About 8.2% of families and 11.2% of the population were below the poverty line, including 15.2% of those under age 18 and 8.2% of those age 65 or over.
Common Questions
What is Per Capita Income in Wellsboro borough?
Per Capita income in Wellsboro borough is $35,846.
What is the Median Family Income in Wellsboro borough?
Median Family Income in Wellsboro borough is $85,809.
What is the Median Household income in Wellsboro borough?
Median Household Income in Wellsboro borough is $54,559.
What is Income or Wage Gap in Wellsboro borough?
Income or Wage Gap in Wellsboro borough is 17.4%.
Women in Wellsboro borough earn 82.6 cents for every dollar earned by a man.
What is Inequality or Gini Index in Wellsboro borough?
Inequality or Gini Index in Wellsboro borough is 0.47.
What is the Total Population of Wellsboro borough?
Total Population of Wellsboro borough is 3,459.
What is the Total Male Population of Wellsboro borough?
Total Male Population of Wellsboro borough is 1,717.
What is the Total Female Population of Wellsboro borough?
Total Female Population of Wellsboro borough is 1,742.
What is the Ratio of Males per 100 Females in Wellsboro borough?
There are 98.56 Males per 100 Females in Wellsboro borough.
What is the Ratio of Females per 100 Males in Wellsboro borough?
There are 101.46 Females per 100 Males in Wellsboro borough.
What is the Median Population Age in Wellsboro borough?
Median Population Age in Wellsboro borough is 41.9 Years.
What is the Average Family Size in Wellsboro borough
Average Family Size in Wellsboro borough is 3.0 People.
What is the Average Household Size in Wellsboro borough
Average Household Size in Wellsboro borough is 2.2 People.
How Large is the Labor Force in Wellsboro borough?
There are 1,668 People in the Labor Forcein in Wellsboro borough.
What is the Percentage of People in the Labor Force in Wellsboro borough?
59.3% of People are in the Labor Force in Wellsboro borough.
What is the Unemployment Rate in Wellsboro borough?
Unemployment Rate in Wellsboro borough is 4.7%.