Factoryville borough, PA Map & Demographics
Factoryville borough Overview
$17,514
PER CAPITA INCOME
$93,000
AVG FAMILY INCOME
$54,375
AVG HOUSEHOLD INCOME
0.43
INEQUALITY / GINI INDEX
1,224
TOTAL POPULATION
526
MALE POPULATION
698
FEMALE POPULATION
75.36
MALES / 100 FEMALES
132.70
FEMALES / 100 MALES
21.3
MEDIAN AGE
3.5
AVG FAMILY SIZE
2.5
AVG HOUSEHOLD SIZE
447
LABOR FORCE [ PEOPLE ]
44.6%
PERCENT IN LABOR FORCE
17.0%
UNEMPLOYMENT RATE
Income in Factoryville borough
Income Overview in Factoryville borough
Per Capita Income in Factoryville borough is $17,514, while median incomes of families and households are $93,000 and $54,375 respectively.
| Characteristic | Number | Measure |
| Per Capita Income | 1,224 | $17,514 |
| Median Family Income | 180 | $93,000 |
| Mean Family Income | 180 | $87,298 |
| Median Household Income | 306 | $54,375 |
| Mean Household Income | 306 | $65,619 |
| Income Deficit | 180 | $0 |
| Wage / Income Gap (%) | 1,224 | 0.00% |
| Wage / Income Gap ($) | 1,224 | 100.00¢ per $1 |
| Gini / Inequality Index | 1,224 | 0.43 |
Earnings by Sex in Factoryville borough
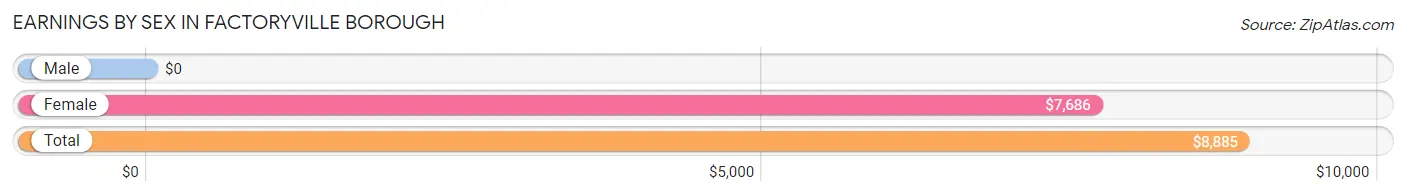
| Sex | Number | Average Earnings |
| Male | 283 (44.6%) | $0 |
| Female | 351 (55.4%) | $7,686 |
| Total | 634 (100.0%) | $8,885 |
Earnings by Sex by Income Bracket in Factoryville borough
The most common earnings brackets in Factoryville borough are $2,499 or less for men (64 | 22.6%) and $2,499 or less for women (92 | 26.2%).
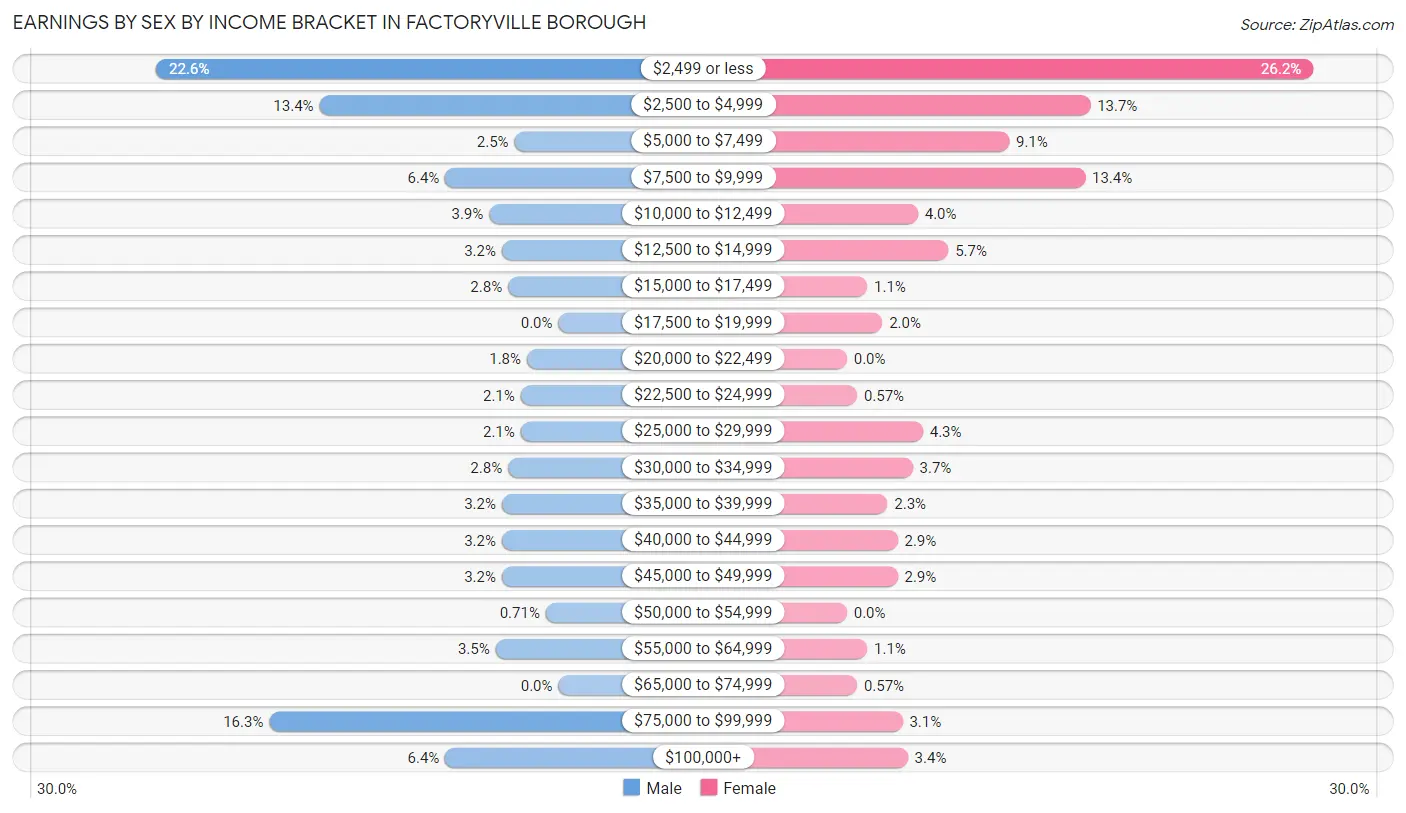
| Income | Male | Female |
| $2,499 or less | 64 (22.6%) | 92 (26.2%) |
| $2,500 to $4,999 | 38 (13.4%) | 48 (13.7%) |
| $5,000 to $7,499 | 7 (2.5%) | 32 (9.1%) |
| $7,500 to $9,999 | 18 (6.4%) | 47 (13.4%) |
| $10,000 to $12,499 | 11 (3.9%) | 14 (4.0%) |
| $12,500 to $14,999 | 9 (3.2%) | 20 (5.7%) |
| $15,000 to $17,499 | 8 (2.8%) | 4 (1.1%) |
| $17,500 to $19,999 | 0 (0.0%) | 7 (2.0%) |
| $20,000 to $22,499 | 5 (1.8%) | 0 (0.0%) |
| $22,500 to $24,999 | 6 (2.1%) | 2 (0.6%) |
| $25,000 to $29,999 | 6 (2.1%) | 15 (4.3%) |
| $30,000 to $34,999 | 8 (2.8%) | 13 (3.7%) |
| $35,000 to $39,999 | 9 (3.2%) | 8 (2.3%) |
| $40,000 to $44,999 | 9 (3.2%) | 10 (2.9%) |
| $45,000 to $49,999 | 9 (3.2%) | 10 (2.9%) |
| $50,000 to $54,999 | 2 (0.7%) | 0 (0.0%) |
| $55,000 to $64,999 | 10 (3.5%) | 4 (1.1%) |
| $65,000 to $74,999 | 0 (0.0%) | 2 (0.6%) |
| $75,000 to $99,999 | 46 (16.3%) | 11 (3.1%) |
| $100,000+ | 18 (6.4%) | 12 (3.4%) |
| Total | 283 (100.0%) | 351 (100.0%) |
Earnings by Sex by Educational Attainment in Factoryville borough
Average earnings in Factoryville borough are $53,750 for men and $14,438 for women, a difference of 73.1%. Men with an educational attainment of college or associate's degree enjoy the highest average annual earnings of $80,000, while those with high school diploma education earn the least with $40,833. Women with an educational attainment of bachelor's degree earn the most with the average annual earnings of $46,071, while those with bachelor's degree education have the smallest earnings of $46,071.
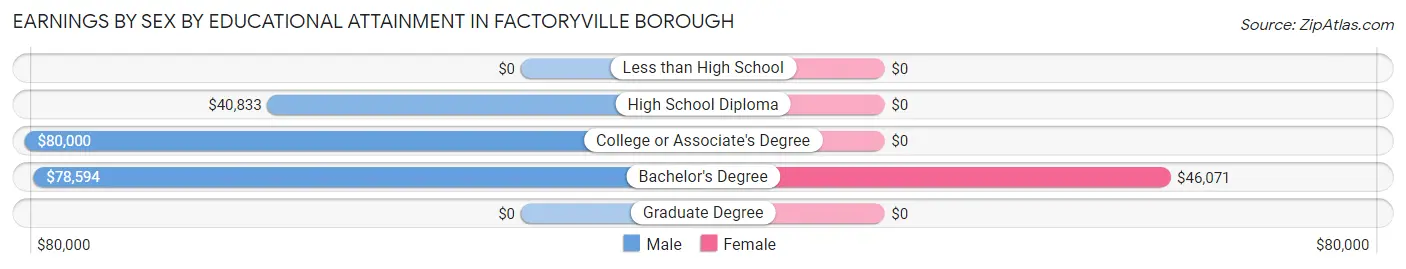
| Educational Attainment | Male Income | Female Income |
| Less than High School | - | - |
| High School Diploma | $40,833 | $0 |
| College or Associate's Degree | $80,000 | $0 |
| Bachelor's Degree | $78,594 | $46,071 |
| Graduate Degree | - | - |
| Total | $53,750 | $14,438 |
Family Income in Factoryville borough
Family Income Brackets in Factoryville borough
According to the Factoryville borough family income data, there are 42 families falling into the $100,000 to $149,999 income range, which is the most common income bracket and makes up 23.3% of all families.
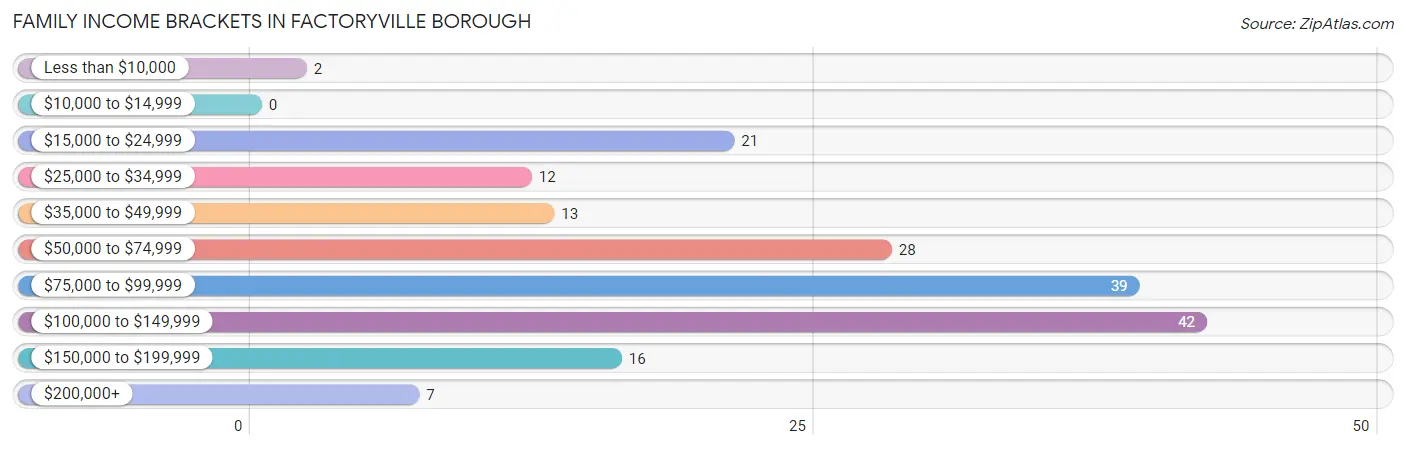
| Income Bracket | # Families | % Families |
| Less than $10,000 | 2 | 1.1% |
| $10,000 to $14,999 | 0 | 0.0% |
| $15,000 to $24,999 | 21 | 11.7% |
| $25,000 to $34,999 | 12 | 6.7% |
| $35,000 to $49,999 | 13 | 7.2% |
| $50,000 to $74,999 | 28 | 15.6% |
| $75,000 to $99,999 | 39 | 21.7% |
| $100,000 to $149,999 | 42 | 23.3% |
| $150,000 to $199,999 | 16 | 8.9% |
| $200,000+ | 7 | 3.9% |
Family Income by Famaliy Size in Factoryville borough
4-person families (10 | 5.6%) account for the highest median family income in Factoryville borough with $210,714 per family, while 4-person families (10 | 5.6%) have the highest median income of $52,678 per family member.
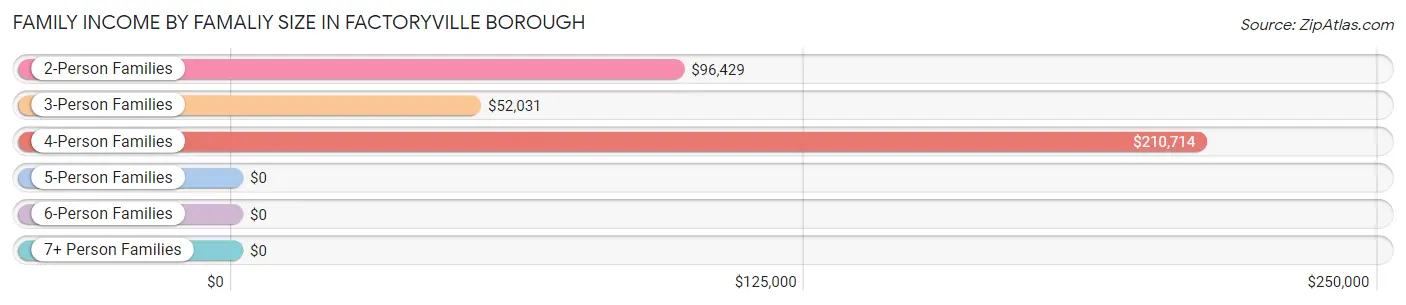
| Income Bracket | # Families | Median Income |
| 2-Person Families | 70 (38.9%) | $96,429 |
| 3-Person Families | 63 (35.0%) | $52,031 |
| 4-Person Families | 10 (5.6%) | $210,714 |
| 5-Person Families | 23 (12.8%) | $0 |
| 6-Person Families | 3 (1.7%) | $0 |
| 7+ Person Families | 11 (6.1%) | $0 |
| Total | 180 (100.0%) | $93,000 |
Family Income by Number of Earners in Factoryville borough
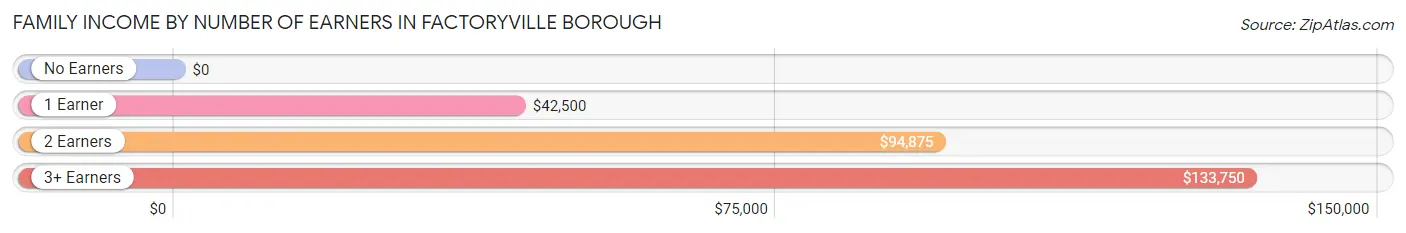
| Number of Earners | # Families | Median Income |
| No Earners | 24 (13.3%) | $0 |
| 1 Earner | 66 (36.7%) | $42,500 |
| 2 Earners | 68 (37.8%) | $94,875 |
| 3+ Earners | 22 (12.2%) | $133,750 |
| Total | 180 (100.0%) | $93,000 |
Household Income in Factoryville borough
Household Income Brackets in Factoryville borough
With 55 households falling in the category, the $75,000 to $99,999 income range is the most frequent in Factoryville borough, accounting for 18.0% of all households. In contrast, only 7 households (2.3%) fall into the $200,000+ income bracket, making it the least populous group.
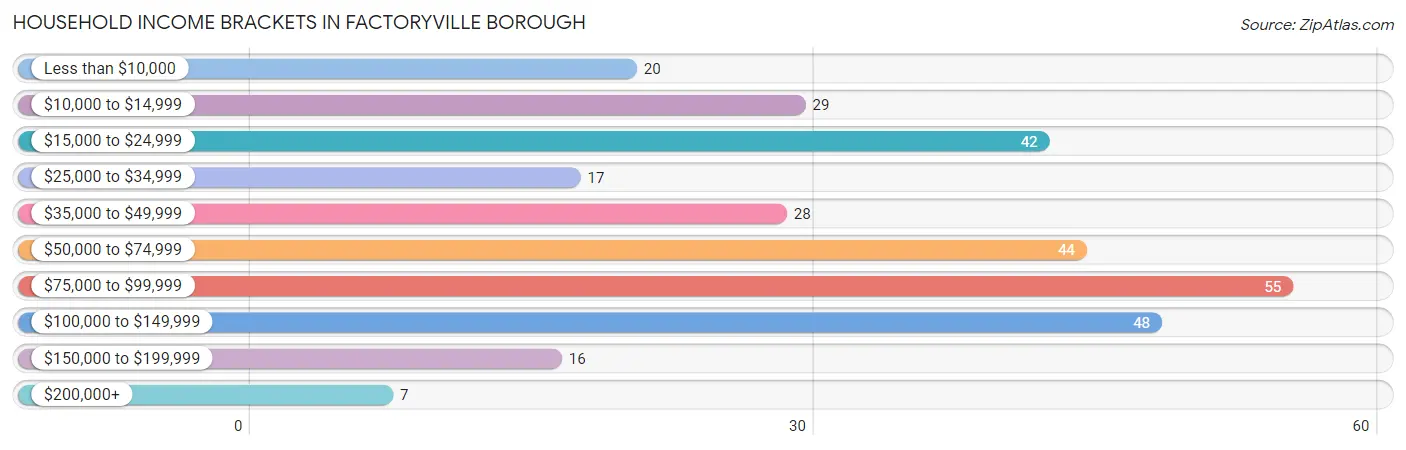
| Income Bracket | # Households | % Households |
| Less than $10,000 | 20 | 6.5% |
| $10,000 to $14,999 | 29 | 9.5% |
| $15,000 to $24,999 | 42 | 13.7% |
| $25,000 to $34,999 | 17 | 5.6% |
| $35,000 to $49,999 | 28 | 9.2% |
| $50,000 to $74,999 | 44 | 14.4% |
| $75,000 to $99,999 | 55 | 18.0% |
| $100,000 to $149,999 | 48 | 15.7% |
| $150,000 to $199,999 | 16 | 5.2% |
| $200,000+ | 7 | 2.3% |
Household Income by Householder Age in Factoryville borough
The median household income in Factoryville borough is $54,375, with the highest median household income of $96,750 found in the 45 to 64 years age bracket for the primary householder. A total of 105 households (34.3%) fall into this category. Meanwhile, the 15 to 24 years age bracket for the primary householder has the lowest median household income of $0, with 13 households (4.3%) in this group.
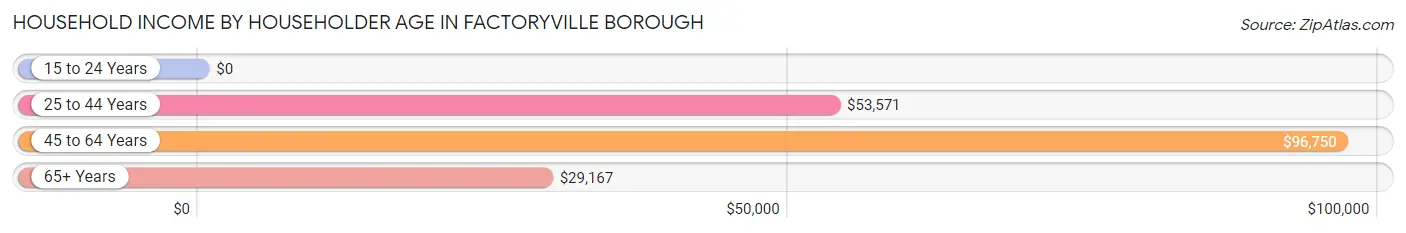
| Income Bracket | # Households | Median Income |
| 15 to 24 Years | 13 (4.3%) | $0 |
| 25 to 44 Years | 94 (30.7%) | $53,571 |
| 45 to 64 Years | 105 (34.3%) | $96,750 |
| 65+ Years | 94 (30.7%) | $29,167 |
| Total | 306 (100.0%) | $54,375 |
Poverty in Factoryville borough
Income Below Poverty by Sex and Age in Factoryville borough
With 13.5% poverty level for males and 7.1% for females among the residents of Factoryville borough, 5 year old males and 45 to 54 year old females are the most vulnerable to poverty, with 4 males (100.0%) and 6 females (21.4%) in their respective age groups living below the poverty level.
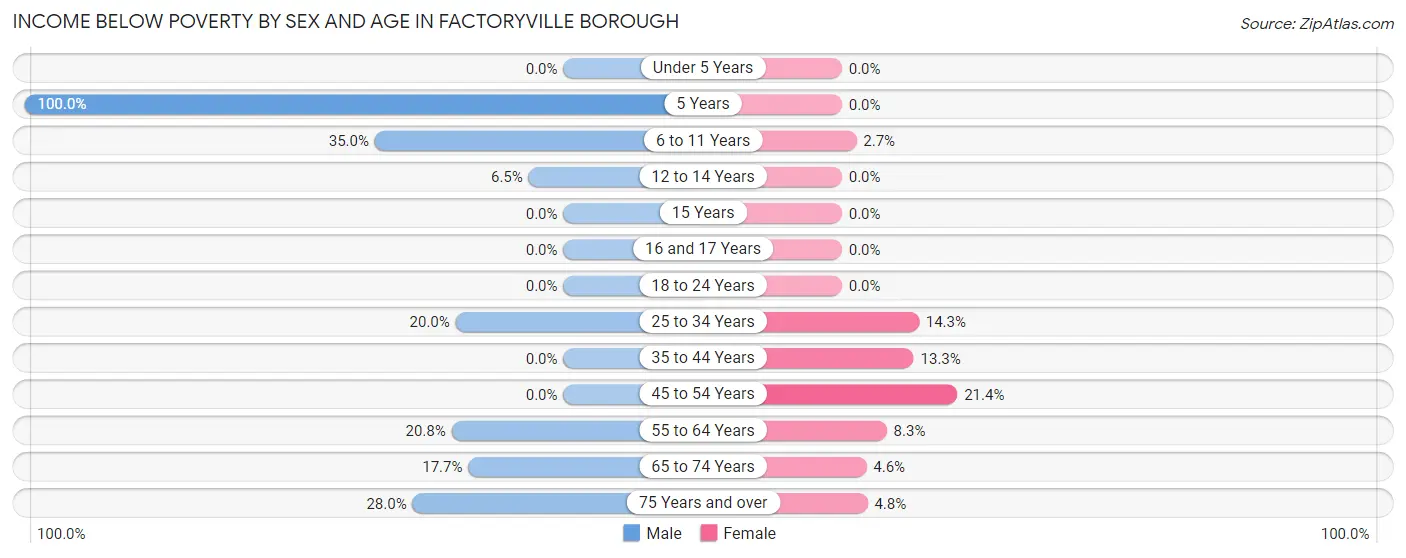
| Age Bracket | Male | Female |
| Under 5 Years | 0 (0.0%) | 0 (0.0%) |
| 5 Years | 4 (100.0%) | 0 (0.0%) |
| 6 to 11 Years | 7 (35.0%) | 2 (2.7%) |
| 12 to 14 Years | 2 (6.5%) | 0 (0.0%) |
| 15 Years | 0 (0.0%) | 0 (0.0%) |
| 16 and 17 Years | 0 (0.0%) | 0 (0.0%) |
| 18 to 24 Years | 0 (0.0%) | 0 (0.0%) |
| 25 to 34 Years | 7 (20.0%) | 2 (14.3%) |
| 35 to 44 Years | 0 (0.0%) | 12 (13.3%) |
| 45 to 54 Years | 0 (0.0%) | 6 (21.4%) |
| 55 to 64 Years | 11 (20.7%) | 6 (8.3%) |
| 65 to 74 Years | 6 (17.6%) | 2 (4.5%) |
| 75 Years and over | 7 (28.0%) | 2 (4.8%) |
| Total | 44 (13.5%) | 32 (7.1%) |
Income Above Poverty by Sex and Age in Factoryville borough
According to the poverty statistics in Factoryville borough, males aged under 5 years and females aged under 5 years are the age groups that are most secure financially, with 100.0% of males and 100.0% of females in these age groups living above the poverty line.
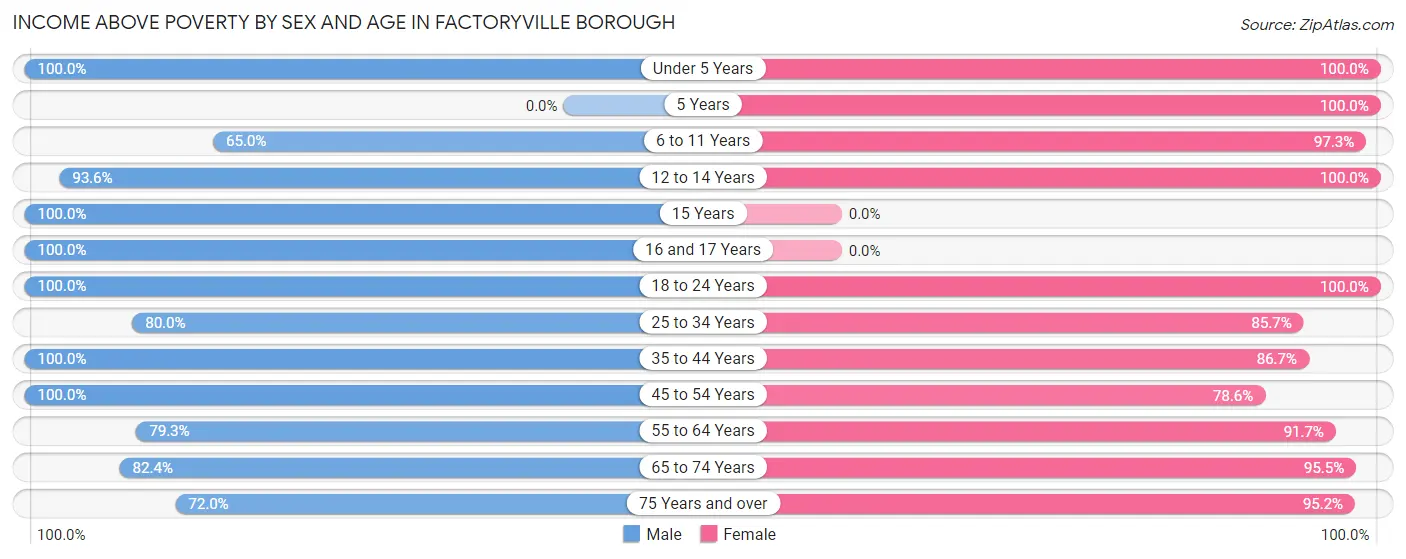
| Age Bracket | Male | Female |
| Under 5 Years | 12 (100.0%) | 50 (100.0%) |
| 5 Years | 0 (0.0%) | 10 (100.0%) |
| 6 to 11 Years | 13 (65.0%) | 72 (97.3%) |
| 12 to 14 Years | 29 (93.5%) | 11 (100.0%) |
| 15 Years | 9 (100.0%) | 0 (0.0%) |
| 16 and 17 Years | 7 (100.0%) | 0 (0.0%) |
| 18 to 24 Years | 21 (100.0%) | 18 (100.0%) |
| 25 to 34 Years | 28 (80.0%) | 12 (85.7%) |
| 35 to 44 Years | 50 (100.0%) | 78 (86.7%) |
| 45 to 54 Years | 25 (100.0%) | 22 (78.6%) |
| 55 to 64 Years | 42 (79.2%) | 66 (91.7%) |
| 65 to 74 Years | 28 (82.4%) | 42 (95.5%) |
| 75 Years and over | 18 (72.0%) | 40 (95.2%) |
| Total | 282 (86.5%) | 421 (92.9%) |
Income Below Poverty Among Married-Couple Families in Factoryville borough
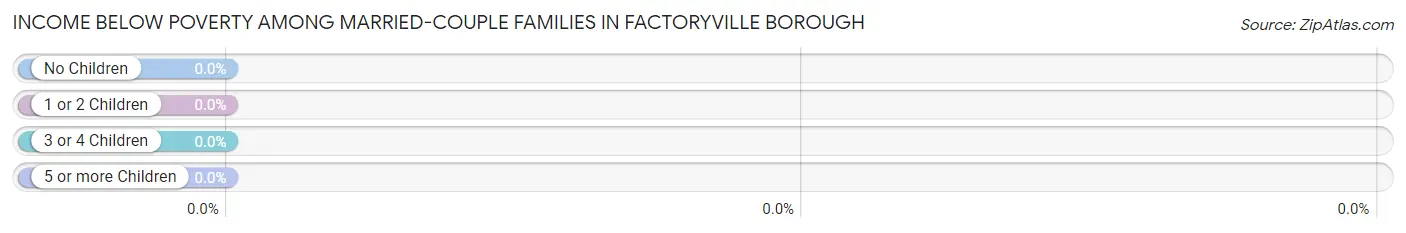
| Children | Above Poverty | Below Poverty |
| No Children | 75 (100.0%) | 0 (0.0%) |
| 1 or 2 Children | 24 (100.0%) | 0 (0.0%) |
| 3 or 4 Children | 23 (100.0%) | 0 (0.0%) |
| 5 or more Children | 5 (100.0%) | 0 (0.0%) |
| Total | 127 (100.0%) | 0 (0.0%) |
Income Below Poverty Among Single-Parent Households in Factoryville borough
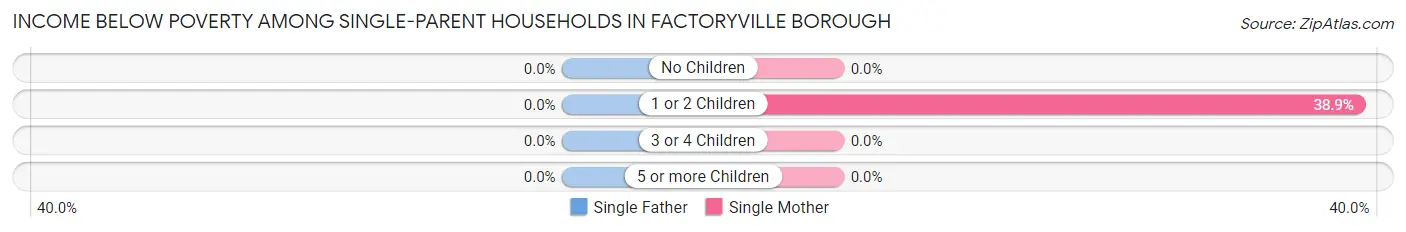
| Children | Single Father | Single Mother |
| No Children | 0 (0.0%) | 0 (0.0%) |
| 1 or 2 Children | 0 (0.0%) | 14 (38.9%) |
| 3 or 4 Children | 0 (0.0%) | 0 (0.0%) |
| 5 or more Children | 0 (0.0%) | 0 (0.0%) |
| Total | 0 (0.0%) | 14 (30.4%) |
Income Below Poverty Among Married-Couple vs Single-Parent Households in Factoryville borough
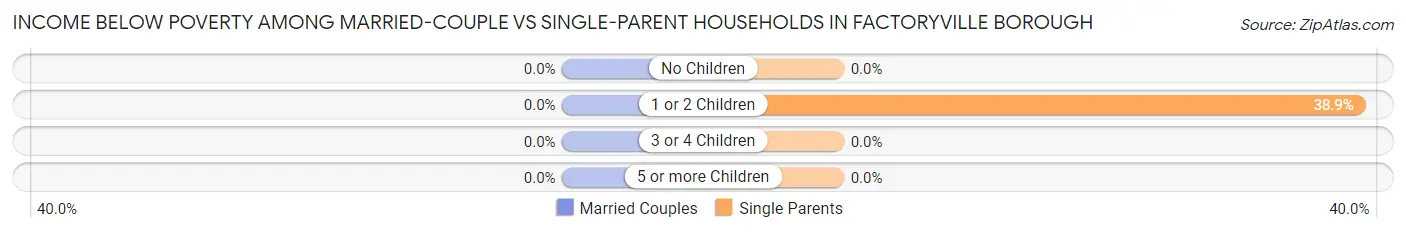
| Children | Married-Couple Families | Single-Parent Households |
| No Children | 0 (0.0%) | 0 (0.0%) |
| 1 or 2 Children | 0 (0.0%) | 14 (38.9%) |
| 3 or 4 Children | 0 (0.0%) | 0 (0.0%) |
| 5 or more Children | 0 (0.0%) | 0 (0.0%) |
| Total | 0 (0.0%) | 14 (26.4%) |
Race in Factoryville borough
The most populous races in Factoryville borough are White / Caucasian (923 | 75.4%), Two or more Races (159 | 13.0%), and Black / African American (124 | 10.1%).
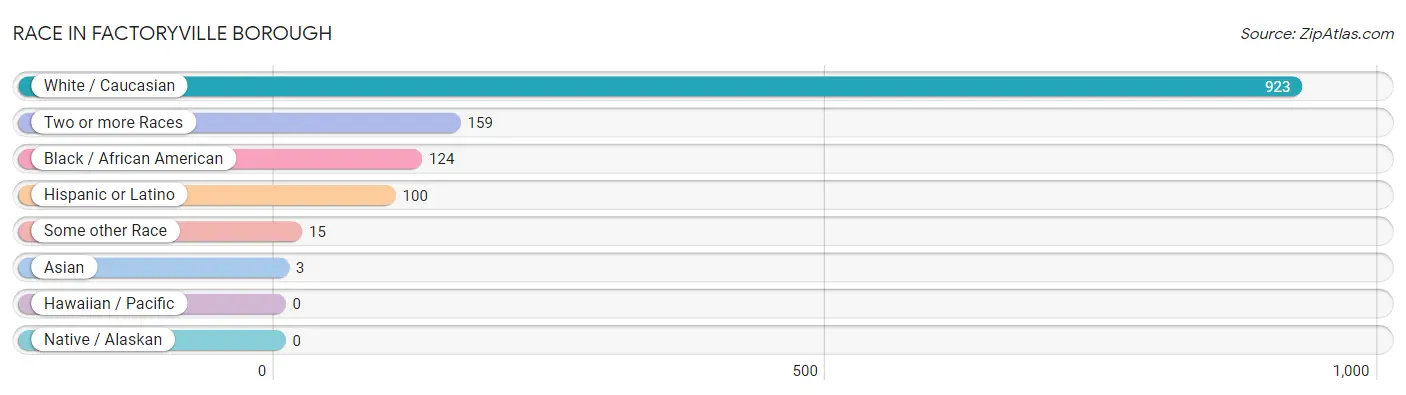
| Race | # Population | % Population |
| Asian | 3 | 0.3% |
| Black / African American | 124 | 10.1% |
| Hawaiian / Pacific | 0 | 0.0% |
| Hispanic or Latino | 100 | 8.2% |
| Native / Alaskan | 0 | 0.0% |
| White / Caucasian | 923 | 75.4% |
| Two or more Races | 159 | 13.0% |
| Some other Race | 15 | 1.2% |
| Total | 1,224 | 100.0% |
Ancestry in Factoryville borough
The most populous ancestries reported in Factoryville borough are German (306 | 25.0%), Irish (130 | 10.6%), Scottish (129 | 10.5%), Italian (112 | 9.1%), and English (111 | 9.1%), together accounting for 64.4% of all Factoryville borough residents.
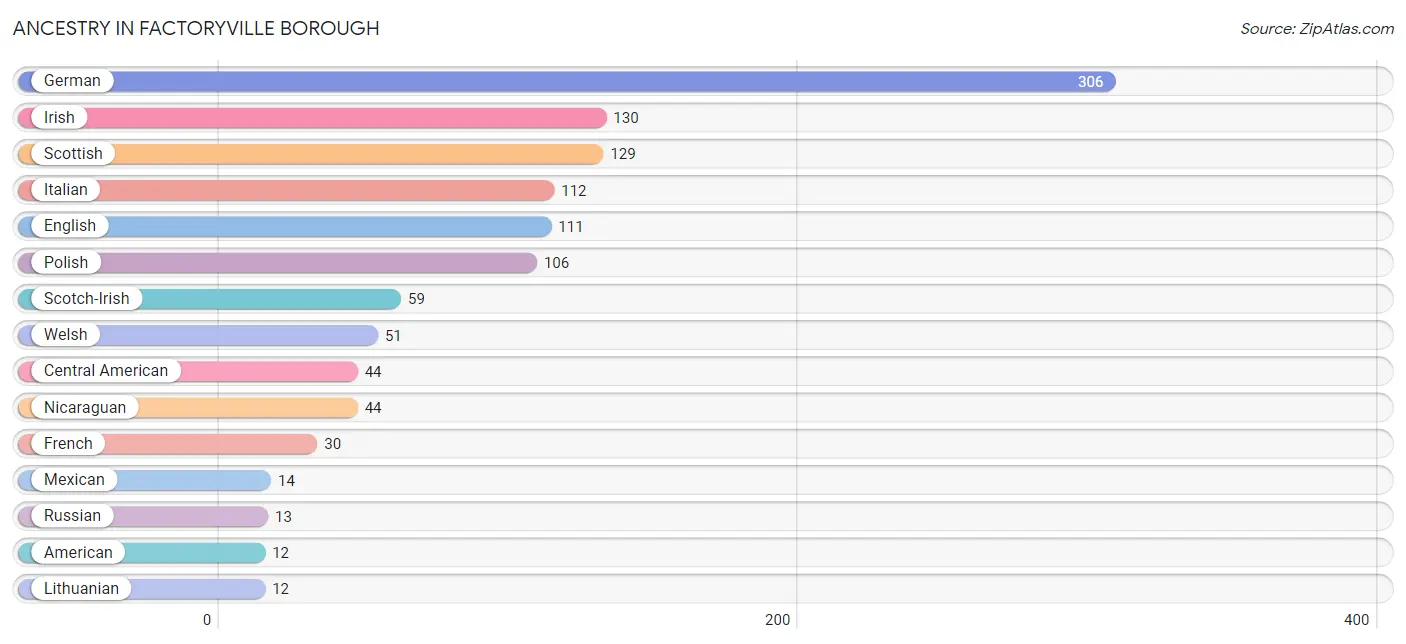
| Ancestry | # Population | % Population |
| African | 8 | 0.6% |
| American | 12 | 1.0% |
| Austrian | 2 | 0.2% |
| British | 10 | 0.8% |
| Central American | 44 | 3.6% |
| Cherokee | 1 | 0.1% |
| Czech | 3 | 0.3% |
| Dutch | 2 | 0.2% |
| Eastern European | 1 | 0.1% |
| English | 111 | 9.1% |
| French | 30 | 2.5% |
| German | 306 | 25.0% |
| Hungarian | 7 | 0.6% |
| Indian (Asian) | 2 | 0.2% |
| Irish | 130 | 10.6% |
| Italian | 112 | 9.1% |
| Korean | 3 | 0.3% |
| Lithuanian | 12 | 1.0% |
| Mexican | 14 | 1.1% |
| Nicaraguan | 44 | 3.6% |
| Nigerian | 2 | 0.2% |
| Pennsylvania German | 1 | 0.1% |
| Polish | 106 | 8.7% |
| Puerto Rican | 12 | 1.0% |
| Russian | 13 | 1.1% |
| Scotch-Irish | 59 | 4.8% |
| Scottish | 129 | 10.5% |
| Slovak | 2 | 0.2% |
| Spaniard | 2 | 0.2% |
| Subsaharan African | 10 | 0.8% |
| Swedish | 3 | 0.3% |
| Ukrainian | 9 | 0.7% |
| Welsh | 51 | 4.2% |
| Yugoslavian | 2 | 0.2% | View All 34 Rows |
Immigrants in Factoryville borough
The most numerous immigrant groups reported in Factoryville borough came from Europe (8 | 0.6%), Latin America (7 | 0.6%), Germany (6 | 0.5%), Western Europe (6 | 0.5%), and Central America (5 | 0.4%), together accounting for 2.6% of all Factoryville borough residents.
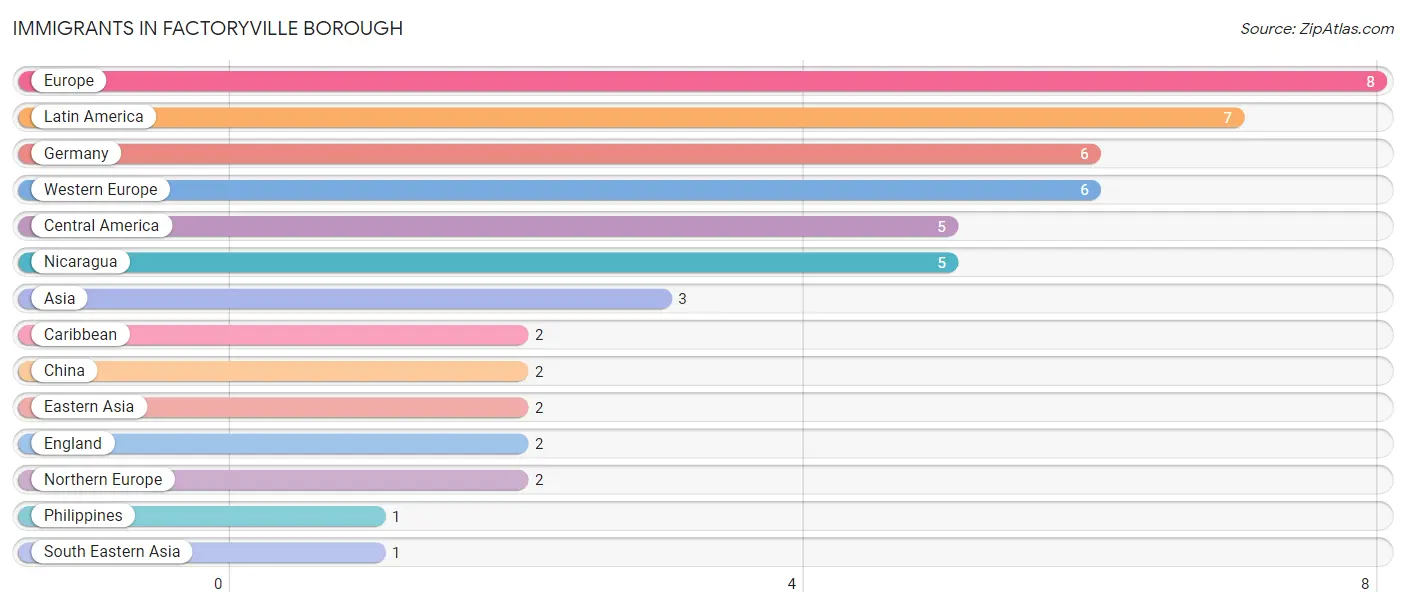
| Immigration Origin | # Population | % Population |
| Asia | 3 | 0.3% |
| Caribbean | 2 | 0.2% |
| Central America | 5 | 0.4% |
| China | 2 | 0.2% |
| Eastern Asia | 2 | 0.2% |
| England | 2 | 0.2% |
| Europe | 8 | 0.6% |
| Germany | 6 | 0.5% |
| Latin America | 7 | 0.6% |
| Nicaragua | 5 | 0.4% |
| Northern Europe | 2 | 0.2% |
| Philippines | 1 | 0.1% |
| South Eastern Asia | 1 | 0.1% |
| Western Europe | 6 | 0.5% | View All 14 Rows |
Sex and Age in Factoryville borough
Sex and Age in Factoryville borough
The most populous age groups in Factoryville borough are 15 to 19 Years (140 | 26.6%) for men and 15 to 19 Years (184 | 26.4%) for women.
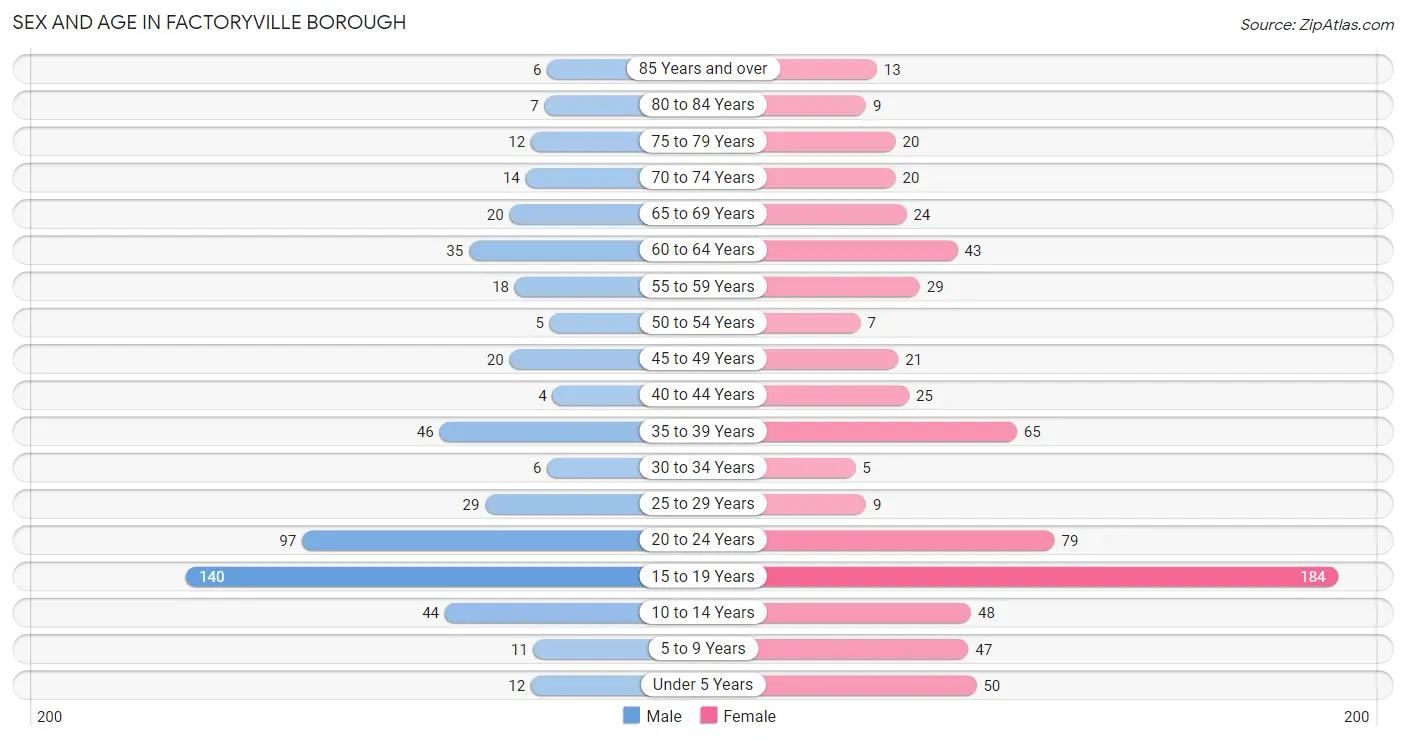
| Age Bracket | Male | Female |
| Under 5 Years | 12 (2.3%) | 50 (7.2%) |
| 5 to 9 Years | 11 (2.1%) | 47 (6.7%) |
| 10 to 14 Years | 44 (8.4%) | 48 (6.9%) |
| 15 to 19 Years | 140 (26.6%) | 184 (26.4%) |
| 20 to 24 Years | 97 (18.4%) | 79 (11.3%) |
| 25 to 29 Years | 29 (5.5%) | 9 (1.3%) |
| 30 to 34 Years | 6 (1.1%) | 5 (0.7%) |
| 35 to 39 Years | 46 (8.7%) | 65 (9.3%) |
| 40 to 44 Years | 4 (0.8%) | 25 (3.6%) |
| 45 to 49 Years | 20 (3.8%) | 21 (3.0%) |
| 50 to 54 Years | 5 (0.9%) | 7 (1.0%) |
| 55 to 59 Years | 18 (3.4%) | 29 (4.2%) |
| 60 to 64 Years | 35 (6.7%) | 43 (6.2%) |
| 65 to 69 Years | 20 (3.8%) | 24 (3.4%) |
| 70 to 74 Years | 14 (2.7%) | 20 (2.9%) |
| 75 to 79 Years | 12 (2.3%) | 20 (2.9%) |
| 80 to 84 Years | 7 (1.3%) | 9 (1.3%) |
| 85 Years and over | 6 (1.1%) | 13 (1.9%) |
| Total | 526 (100.0%) | 698 (100.0%) |
Families and Households in Factoryville borough
Median Family Size in Factoryville borough
The median family size in Factoryville borough is 3.54 persons per family, with married-couple families (127 | 70.6%) accounting for the largest median family size of 4.02 persons per family. On the other hand, single female/mother families (46 | 25.6%) represent the smallest median family size with 2.33 persons per family.
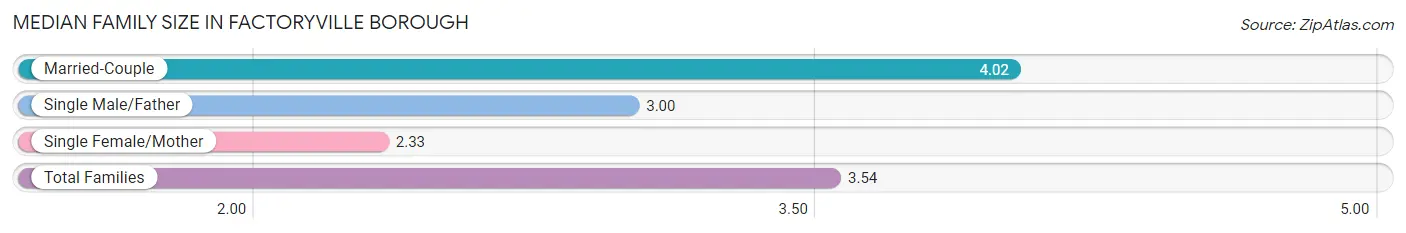
| Family Type | # Families | Family Size |
| Married-Couple | 127 (70.6%) | 4.02 |
| Single Male/Father | 7 (3.9%) | 3.00 |
| Single Female/Mother | 46 (25.6%) | 2.33 |
| Total Families | 180 (100.0%) | 3.54 |
Median Household Size in Factoryville borough
The median household size in Factoryville borough is 2.55 persons per household, with married-couple households (127 | 41.5%) accounting for the largest median household size of 4.02 persons per household. non-family households (126 | 41.2%) represent the smallest median household size with 1.10 persons per household.
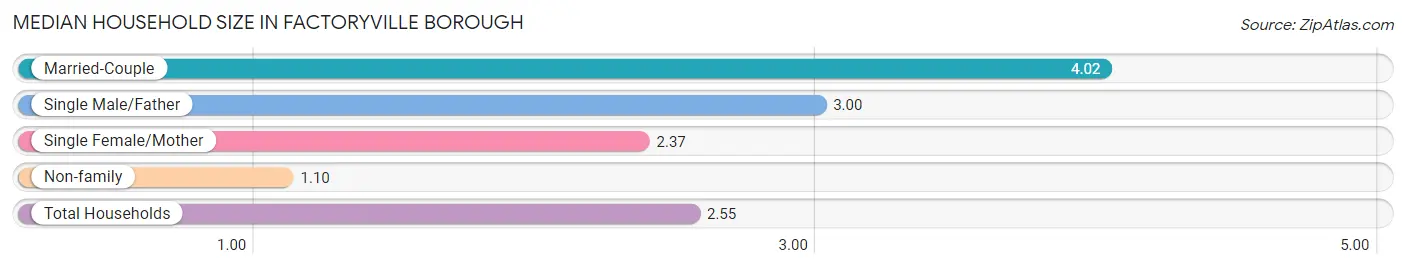
| Household Type | # Households | Household Size |
| Married-Couple | 127 (41.5%) | 4.02 |
| Single Male/Father | 7 (2.3%) | 3.00 |
| Single Female/Mother | 46 (15.0%) | 2.37 |
| Non-family | 126 (41.2%) | 1.10 |
| Total Households | 306 (100.0%) | 2.55 |
Household Size by Marriage Status in Factoryville borough
Out of a total of 306 households in Factoryville borough, 180 (58.8%) are family households, while 126 (41.2%) are nonfamily households. The most numerous type of family households are 3-person households, comprising 73, and the most common type of nonfamily households are 1-person households, comprising 110.
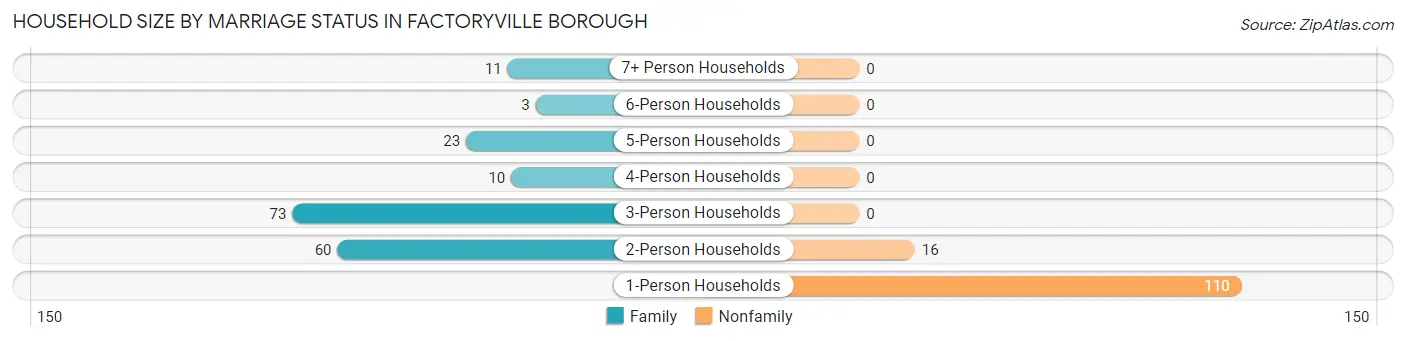
| Household Size | Family Households | Nonfamily Households |
| 1-Person Households | - | 110 (35.9%) |
| 2-Person Households | 60 (19.6%) | 16 (5.2%) |
| 3-Person Households | 73 (23.9%) | 0 (0.0%) |
| 4-Person Households | 10 (3.3%) | 0 (0.0%) |
| 5-Person Households | 23 (7.5%) | 0 (0.0%) |
| 6-Person Households | 3 (1.0%) | 0 (0.0%) |
| 7+ Person Households | 11 (3.6%) | 0 (0.0%) |
| Total | 180 (58.8%) | 126 (41.2%) |
Female Fertility in Factoryville borough
Fertility by Age in Factoryville borough
Average fertility rate in Factoryville borough is 13.0 births per 1,000 women. Women in the age bracket of 35 to 50 years have the highest fertility rate with 27.0 births per 1,000 women. Women in the age bracket of 35 to 50 years acount for 60.0% of all women with births.
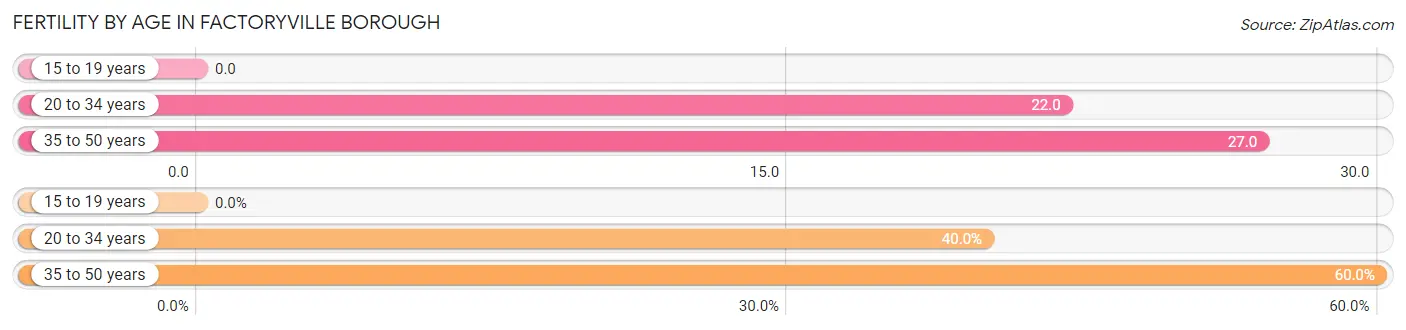
| Age Bracket | Women with Births | Births / 1,000 Women |
| 15 to 19 years | 0 (0.0%) | 0.0 |
| 20 to 34 years | 2 (40.0%) | 22.0 |
| 35 to 50 years | 3 (60.0%) | 27.0 |
| Total | 5 (100.0%) | 13.0 |
Fertility by Age by Marriage Status in Factoryville borough
60.0% of women with births (5) in Factoryville borough are married. The highest percentage of unmarried women with births falls into 20 to 34 years age bracket with 100.0% of them unmarried at the time of birth, while the lowest percentage of unmarried women with births belong to 35 to 50 years age bracket with 0.0% of them unmarried.
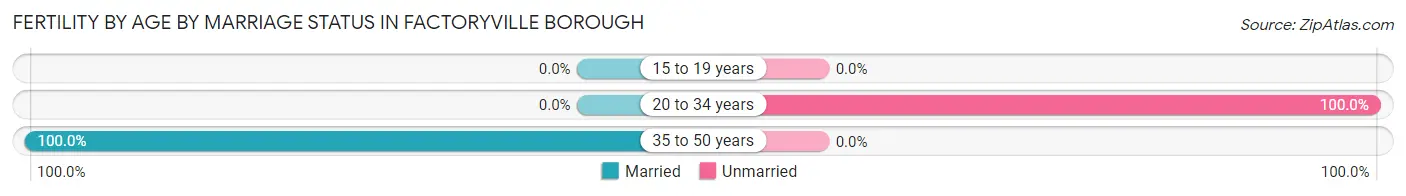
| Age Bracket | Married | Unmarried |
| 15 to 19 years | 0 (0.0%) | 0 (0.0%) |
| 20 to 34 years | 0 (0.0%) | 2 (100.0%) |
| 35 to 50 years | 3 (100.0%) | 0 (0.0%) |
| Total | 3 (60.0%) | 2 (40.0%) |
Fertility by Education in Factoryville borough
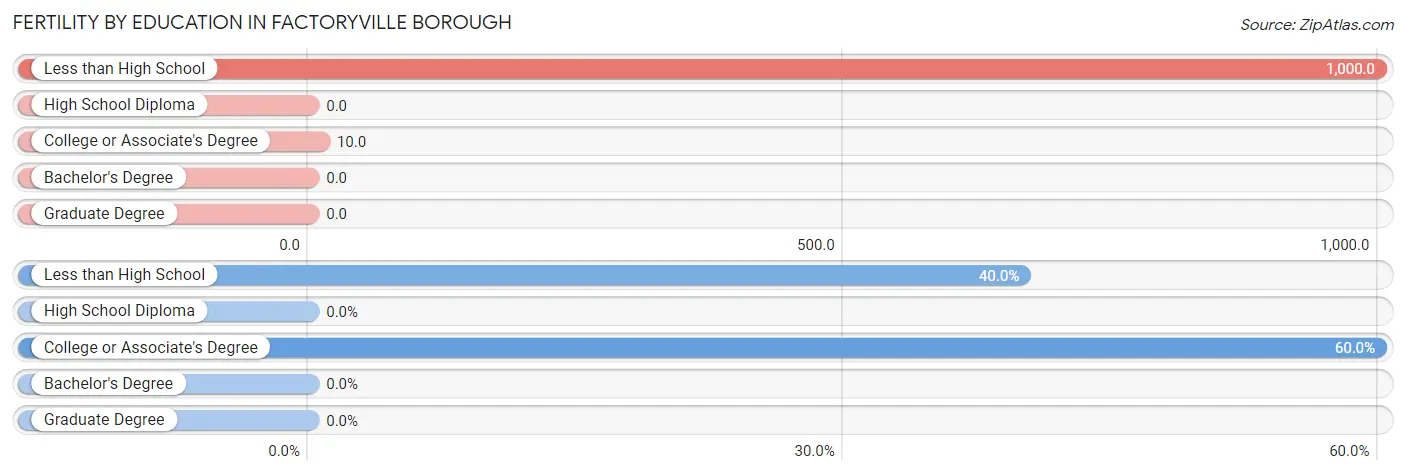
| Educational Attainment | Women with Births | Births / 1,000 Women |
| Less than High School | 2 (40.0%) | 1,000.0 |
| High School Diploma | 0 (0.0%) | 0.0 |
| College or Associate's Degree | 3 (60.0%) | 10.0 |
| Bachelor's Degree | 0 (0.0%) | 0.0 |
| Graduate Degree | 0 (0.0%) | 0.0 |
| Total | 5 (100.0%) | 13.0 |
Fertility by Education by Marriage Status in Factoryville borough
40.0% of women with births in Factoryville borough are unmarried. Women with the educational attainment of college or associate's degree are most likely to be married with 100.0% of them married at childbirth, while women with the educational attainment of less than high school are least likely to be married with 100.0% of them unmarried at childbirth.
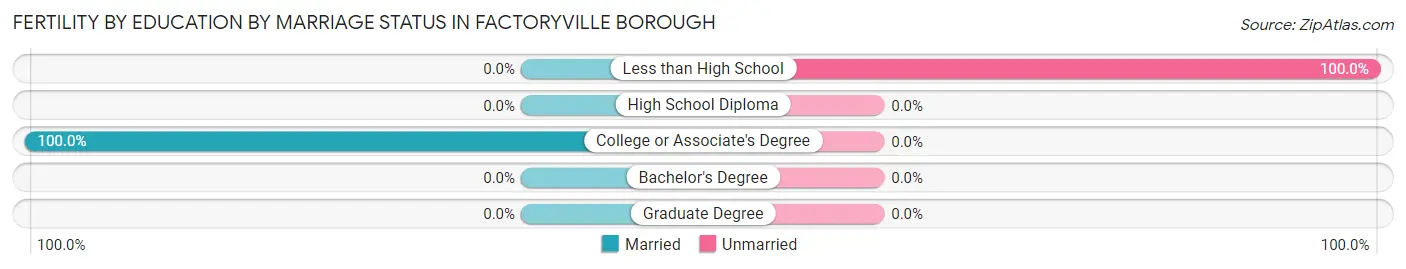
| Educational Attainment | Married | Unmarried |
| Less than High School | 0 (0.0%) | 2 (100.0%) |
| High School Diploma | 0 (0.0%) | 0 (0.0%) |
| College or Associate's Degree | 3 (100.0%) | 0 (0.0%) |
| Bachelor's Degree | 0 (0.0%) | 0 (0.0%) |
| Graduate Degree | 0 (0.0%) | 0 (0.0%) |
| Total | 3 (60.0%) | 2 (40.0%) |
Employment Characteristics in Factoryville borough
Employment by Class of Employer in Factoryville borough
Among the 368 employed individuals in Factoryville borough, private company employees (217 | 59.0%), not-for-profit organizations (77 | 20.9%), and state government employees (49 | 13.3%) make up the most common classes of employment.
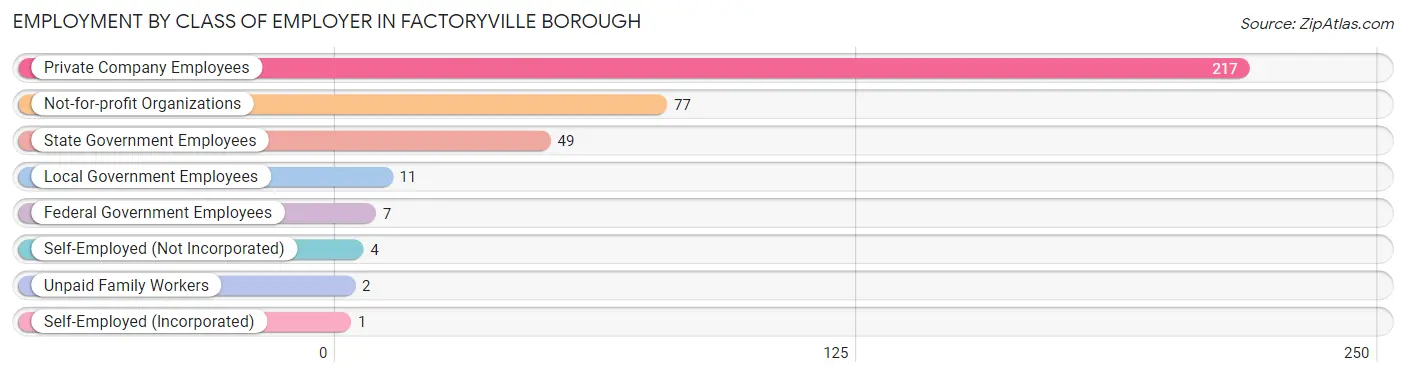
| Employer Class | # Employees | % Employees |
| Private Company Employees | 217 | 59.0% |
| Self-Employed (Incorporated) | 1 | 0.3% |
| Self-Employed (Not Incorporated) | 4 | 1.1% |
| Not-for-profit Organizations | 77 | 20.9% |
| Local Government Employees | 11 | 3.0% |
| State Government Employees | 49 | 13.3% |
| Federal Government Employees | 7 | 1.9% |
| Unpaid Family Workers | 2 | 0.5% |
| Total | 368 | 100.0% |
Employment Status by Age in Factoryville borough
According to the labor force statistics for Factoryville borough, out of the total population over 16 years of age (1,003), 44.6% or 447 individuals are in the labor force, with 17.0% or 76 of them unemployed. The age group with the highest labor force participation rate is 25 to 29 years, with 100.0% or 38 individuals in the labor force. Within the labor force, the 35 to 44 years age range has the highest percentage of unemployed individuals, with 38.8% or 47 of them being unemployed.
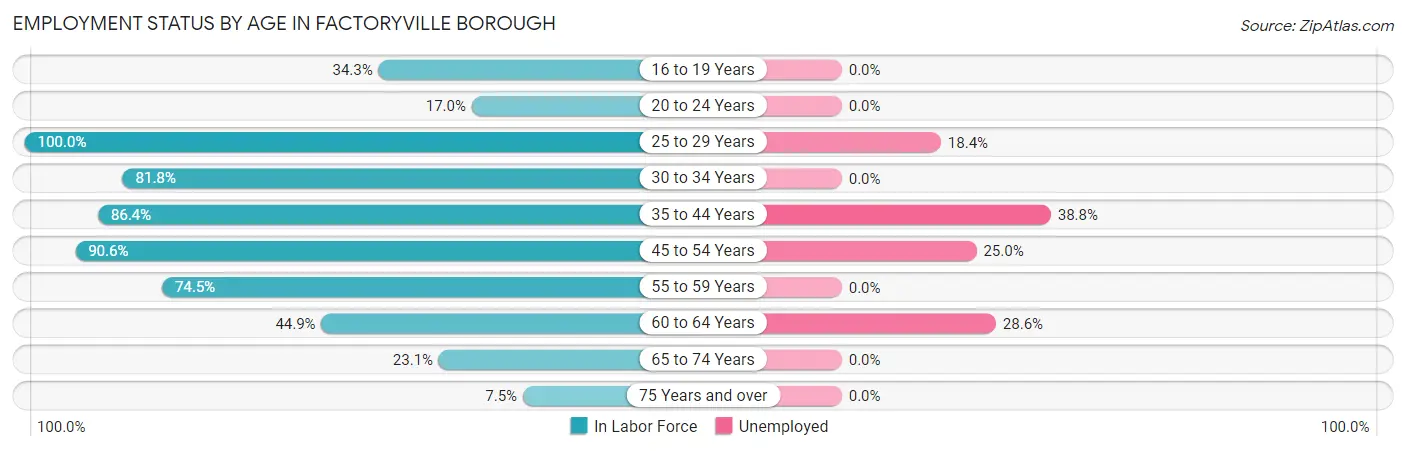
| Age Bracket | In Labor Force | Unemployed |
| 16 to 19 Years | 108 (34.3%) | 0 (0.0%) |
| 20 to 24 Years | 30 (17.0%) | 0 (0.0%) |
| 25 to 29 Years | 38 (100.0%) | 7 (18.4%) |
| 30 to 34 Years | 9 (81.8%) | 0 (0.0%) |
| 35 to 44 Years | 121 (86.4%) | 47 (38.8%) |
| 45 to 54 Years | 48 (90.6%) | 12 (25.0%) |
| 55 to 59 Years | 35 (74.5%) | 0 (0.0%) |
| 60 to 64 Years | 35 (44.9%) | 10 (28.6%) |
| 65 to 74 Years | 18 (23.1%) | 0 (0.0%) |
| 75 Years and over | 5 (7.5%) | 0 (0.0%) |
| Total | 447 (44.6%) | 76 (17.0%) |
Employment Status by Educational Attainment in Factoryville borough
According to labor force statistics for Factoryville borough, 77.9% of individuals (286) out of the total population between 25 and 64 years of age (367) are in the labor force, with 26.6% or 76 of them being unemployed. The group with the highest labor force participation rate are those with the educational attainment of bachelor's degree or higher, with 93.5% or 101 individuals in the labor force. Within the labor force, individuals with college / associate degree education have the highest percentage of unemployment, with 40.0% or 42 of them being unemployed.
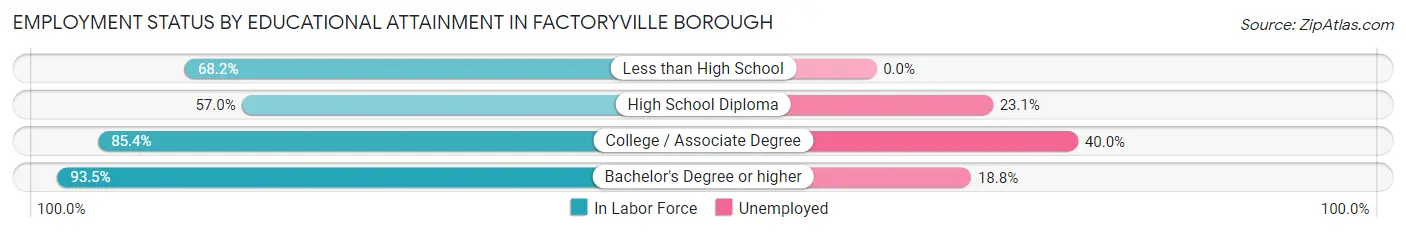
| Educational Attainment | In Labor Force | Unemployed |
| Less than High School | 15 (68.2%) | 0 (0.0%) |
| High School Diploma | 65 (57.0%) | 26 (23.1%) |
| College / Associate Degree | 105 (85.4%) | 49 (40.0%) |
| Bachelor's Degree or higher | 101 (93.5%) | 20 (18.8%) |
| Total | 286 (77.9%) | 98 (26.6%) |
Employment Occupations by Sex in Factoryville borough
Management, Business, Science and Arts Occupations
The most common Management, Business, Science and Arts occupations in Factoryville borough are Health Diagnosing & Treating (26 | 7.0%), Community & Social Service (24 | 6.5%), Education Instruction & Library (21 | 5.7%), Management (17 | 4.6%), and Health Technologists (10 | 2.7%).
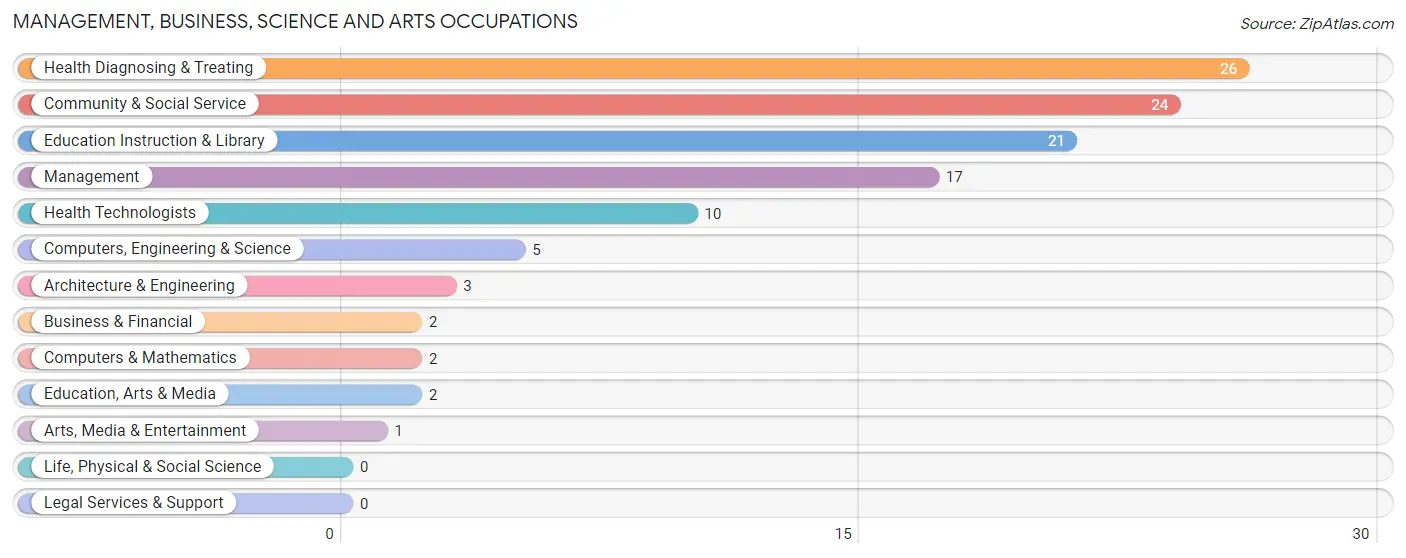
Management, Business, Science and Arts Occupations by Sex
Within the Management, Business, Science and Arts occupations in Factoryville borough, the most male-oriented occupations are Computers, Engineering & Science (100.0%), Computers & Mathematics (100.0%), and Architecture & Engineering (100.0%), while the most female-oriented occupations are Business & Financial (100.0%), Arts, Media & Entertainment (100.0%), and Health Diagnosing & Treating (100.0%).
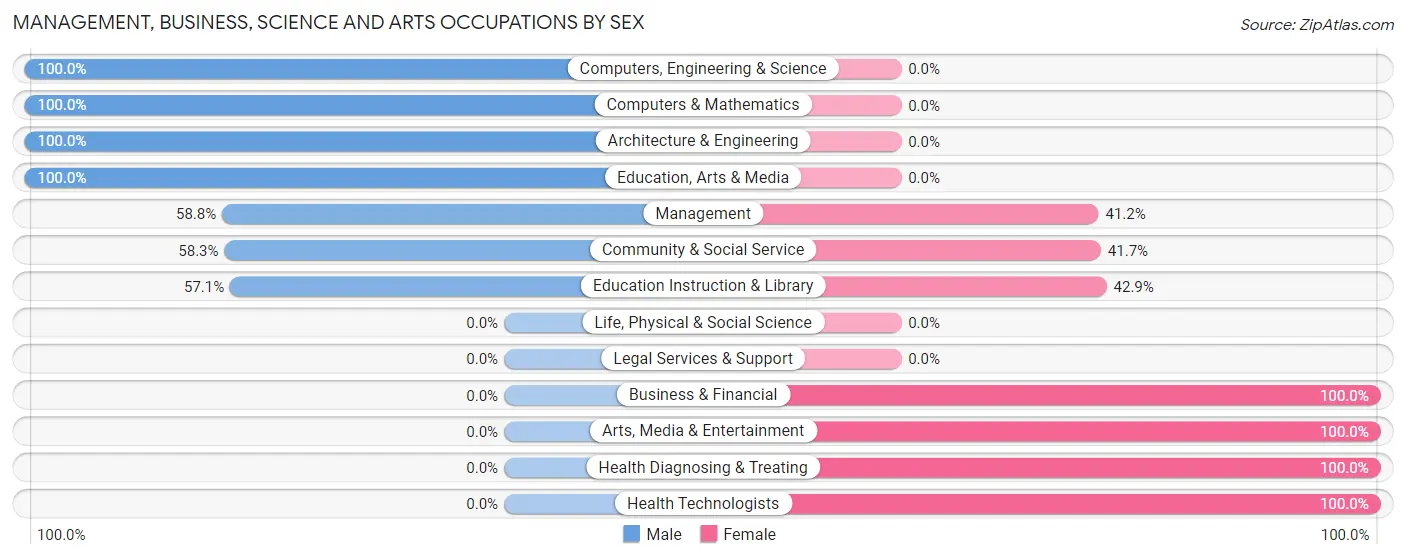
| Occupation | Male | Female |
| Management | 10 (58.8%) | 7 (41.2%) |
| Business & Financial | 0 (0.0%) | 2 (100.0%) |
| Computers, Engineering & Science | 5 (100.0%) | 0 (0.0%) |
| Computers & Mathematics | 2 (100.0%) | 0 (0.0%) |
| Architecture & Engineering | 3 (100.0%) | 0 (0.0%) |
| Life, Physical & Social Science | 0 (0.0%) | 0 (0.0%) |
| Community & Social Service | 14 (58.3%) | 10 (41.7%) |
| Education, Arts & Media | 2 (100.0%) | 0 (0.0%) |
| Legal Services & Support | 0 (0.0%) | 0 (0.0%) |
| Education Instruction & Library | 12 (57.1%) | 9 (42.9%) |
| Arts, Media & Entertainment | 0 (0.0%) | 1 (100.0%) |
| Health Diagnosing & Treating | 0 (0.0%) | 26 (100.0%) |
| Health Technologists | 0 (0.0%) | 10 (100.0%) |
| Total (Category) | 29 (39.2%) | 45 (60.8%) |
| Total (Overall) | 164 (44.2%) | 207 (55.8%) |
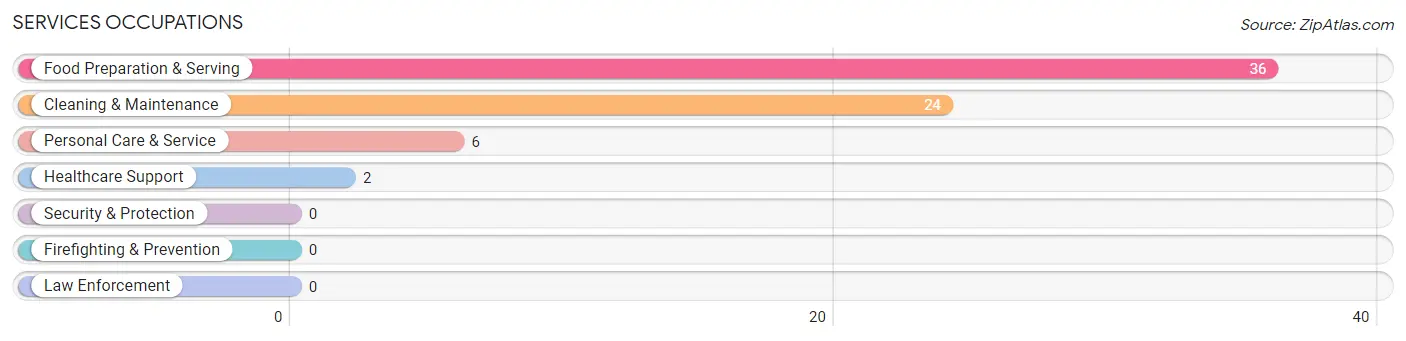
Services Occupations
The most common Services occupations in Factoryville borough are Food Preparation & Serving (36 | 9.7%), Cleaning & Maintenance (24 | 6.5%), Personal Care & Service (6 | 1.6%), and Healthcare Support (2 | 0.5%).
Services Occupations by Sex
Within the Services occupations in Factoryville borough, the most male-oriented occupations are Food Preparation & Serving (66.7%), and Cleaning & Maintenance (54.2%), while the most female-oriented occupations are Healthcare Support (100.0%), Personal Care & Service (100.0%), and Cleaning & Maintenance (45.8%).
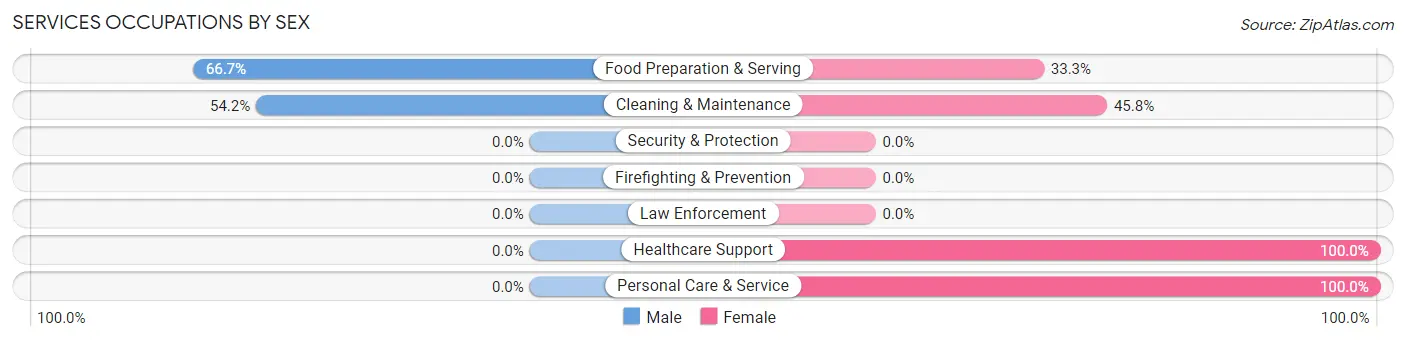
| Occupation | Male | Female |
| Healthcare Support | 0 (0.0%) | 2 (100.0%) |
| Security & Protection | 0 (0.0%) | 0 (0.0%) |
| Firefighting & Prevention | 0 (0.0%) | 0 (0.0%) |
| Law Enforcement | 0 (0.0%) | 0 (0.0%) |
| Food Preparation & Serving | 24 (66.7%) | 12 (33.3%) |
| Cleaning & Maintenance | 13 (54.2%) | 11 (45.8%) |
| Personal Care & Service | 0 (0.0%) | 6 (100.0%) |
| Total (Category) | 37 (54.4%) | 31 (45.6%) |
| Total (Overall) | 164 (44.2%) | 207 (55.8%) |
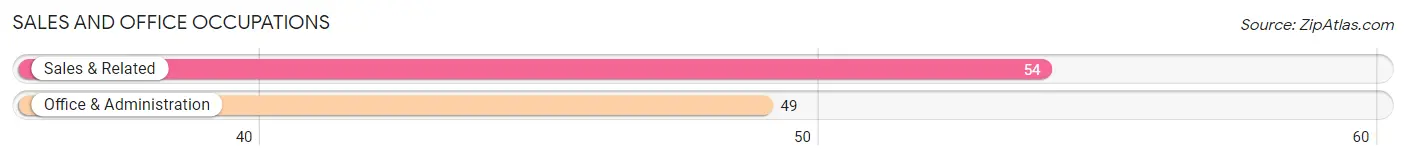
Sales and Office Occupations
The most common Sales and Office occupations in Factoryville borough are Sales & Related (54 | 14.6%), and Office & Administration (49 | 13.2%).
Sales and Office Occupations by Sex
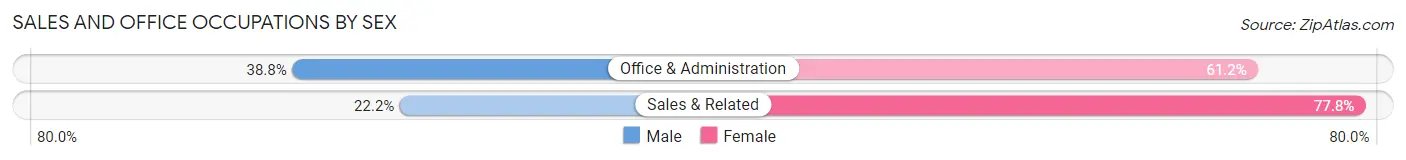
| Occupation | Male | Female |
| Sales & Related | 12 (22.2%) | 42 (77.8%) |
| Office & Administration | 19 (38.8%) | 30 (61.2%) |
| Total (Category) | 31 (30.1%) | 72 (69.9%) |
| Total (Overall) | 164 (44.2%) | 207 (55.8%) |
Natural Resources, Construction and Maintenance Occupations
The most common Natural Resources, Construction and Maintenance occupations in Factoryville borough are Installation, Maintenance & Repair (26 | 7.0%), and Construction & Extraction (16 | 4.3%).
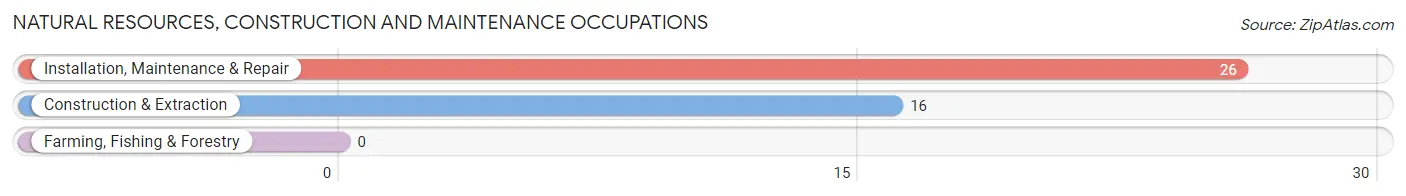
Natural Resources, Construction and Maintenance Occupations by Sex
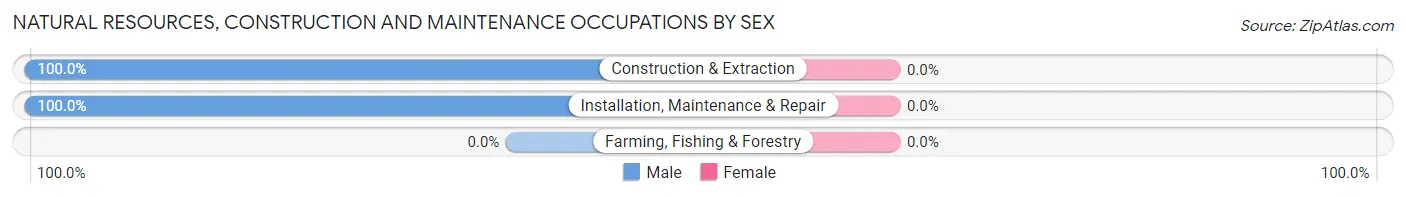
| Occupation | Male | Female |
| Farming, Fishing & Forestry | 0 (0.0%) | 0 (0.0%) |
| Construction & Extraction | 16 (100.0%) | 0 (0.0%) |
| Installation, Maintenance & Repair | 26 (100.0%) | 0 (0.0%) |
| Total (Category) | 42 (100.0%) | 0 (0.0%) |
| Total (Overall) | 164 (44.2%) | 207 (55.8%) |
Production, Transportation and Moving Occupations
The most common Production, Transportation and Moving occupations in Factoryville borough are Production (56 | 15.1%), Transportation (23 | 6.2%), and Material Moving (5 | 1.3%).
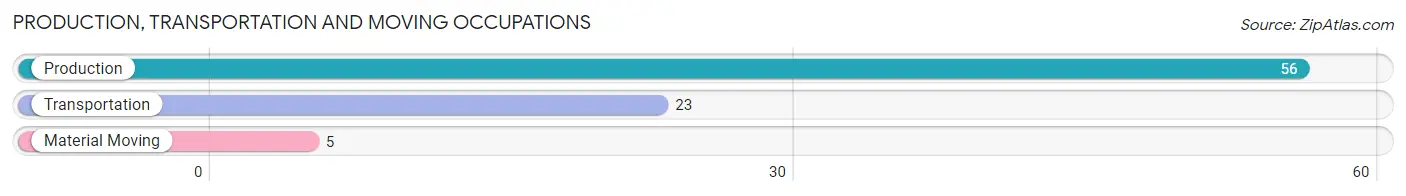
Production, Transportation and Moving Occupations by Sex
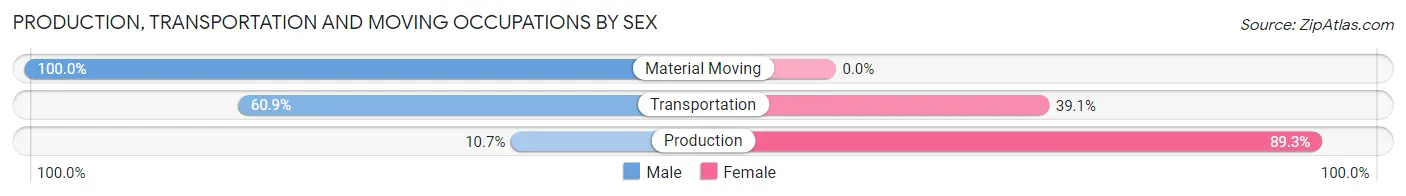
| Occupation | Male | Female |
| Production | 6 (10.7%) | 50 (89.3%) |
| Transportation | 14 (60.9%) | 9 (39.1%) |
| Material Moving | 5 (100.0%) | 0 (0.0%) |
| Total (Category) | 25 (29.8%) | 59 (70.2%) |
| Total (Overall) | 164 (44.2%) | 207 (55.8%) |
Employment Industries by Sex in Factoryville borough
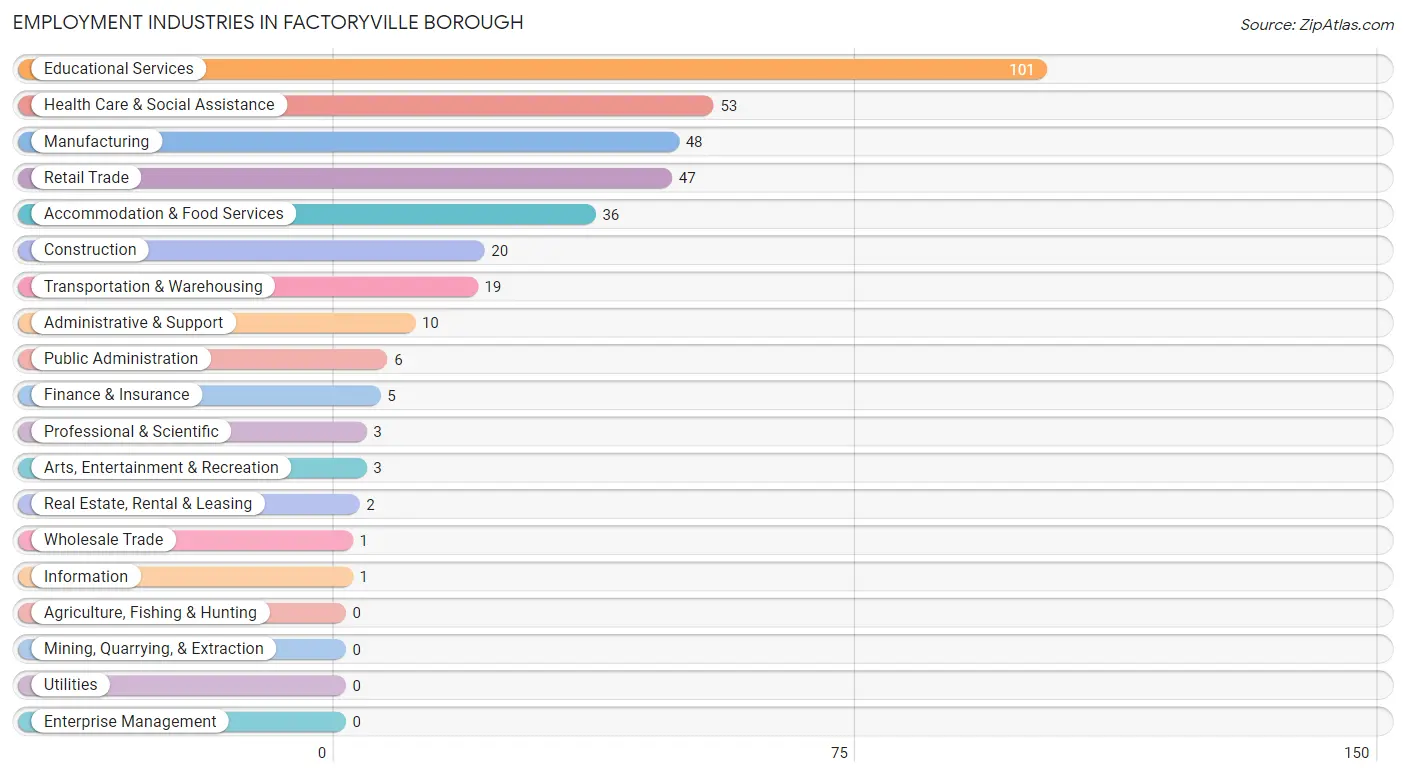
Employment Industries in Factoryville borough
The major employment industries in Factoryville borough include Educational Services (101 | 27.2%), Health Care & Social Assistance (53 | 14.3%), Manufacturing (48 | 12.9%), Retail Trade (47 | 12.7%), and Accommodation & Food Services (36 | 9.7%).
Employment Industries by Sex in Factoryville borough
The Factoryville borough industries that see more men than women are Construction (100.0%), Wholesale Trade (100.0%), and Real Estate, Rental & Leasing (100.0%), whereas the industries that tend to have a higher number of women are Information (100.0%), Health Care & Social Assistance (84.9%), and Educational Services (72.3%).
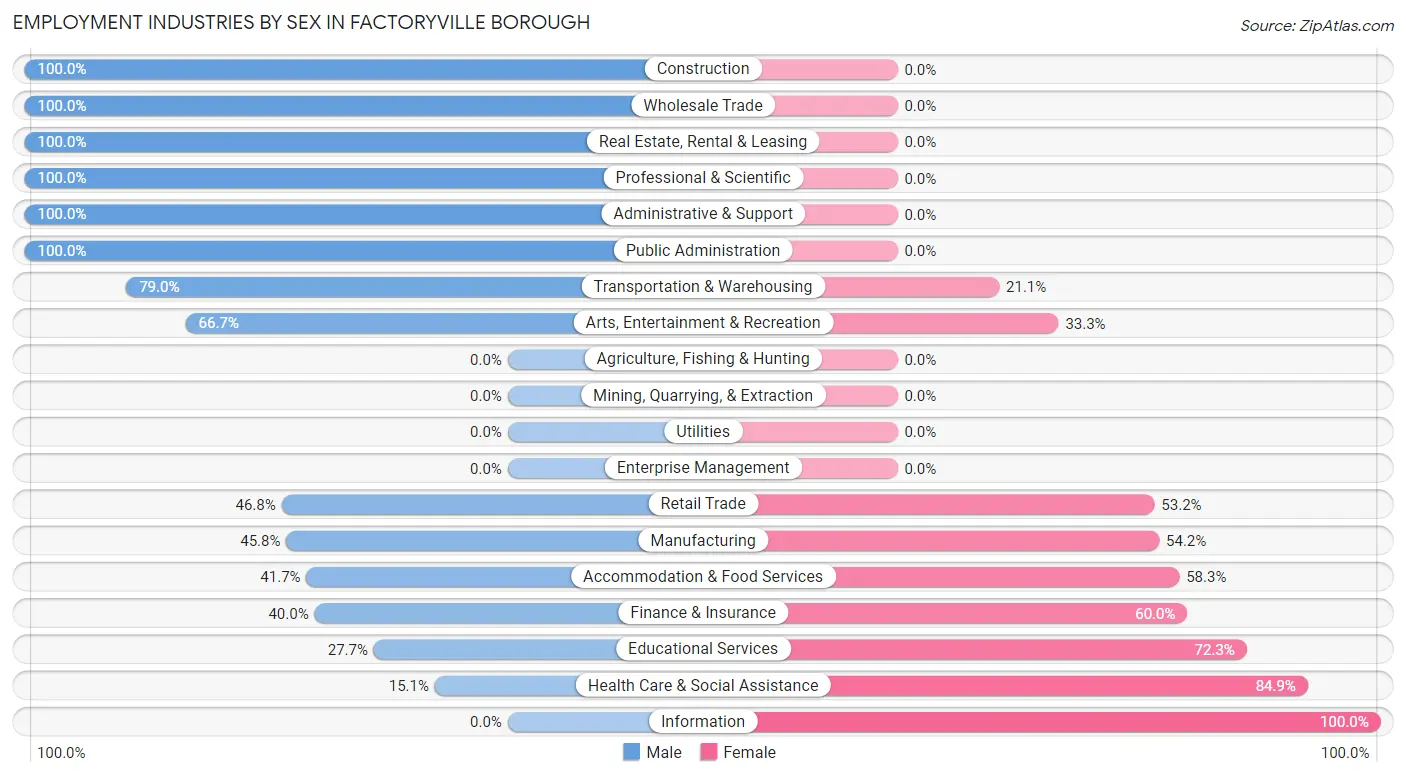
| Industry | Male | Female |
| Agriculture, Fishing & Hunting | 0 (0.0%) | 0 (0.0%) |
| Mining, Quarrying, & Extraction | 0 (0.0%) | 0 (0.0%) |
| Construction | 20 (100.0%) | 0 (0.0%) |
| Manufacturing | 22 (45.8%) | 26 (54.2%) |
| Wholesale Trade | 1 (100.0%) | 0 (0.0%) |
| Retail Trade | 22 (46.8%) | 25 (53.2%) |
| Transportation & Warehousing | 15 (78.9%) | 4 (21.0%) |
| Utilities | 0 (0.0%) | 0 (0.0%) |
| Information | 0 (0.0%) | 1 (100.0%) |
| Finance & Insurance | 2 (40.0%) | 3 (60.0%) |
| Real Estate, Rental & Leasing | 2 (100.0%) | 0 (0.0%) |
| Professional & Scientific | 3 (100.0%) | 0 (0.0%) |
| Enterprise Management | 0 (0.0%) | 0 (0.0%) |
| Administrative & Support | 10 (100.0%) | 0 (0.0%) |
| Educational Services | 28 (27.7%) | 73 (72.3%) |
| Health Care & Social Assistance | 8 (15.1%) | 45 (84.9%) |
| Arts, Entertainment & Recreation | 2 (66.7%) | 1 (33.3%) |
| Accommodation & Food Services | 15 (41.7%) | 21 (58.3%) |
| Public Administration | 6 (100.0%) | 0 (0.0%) |
| Total | 164 (44.2%) | 207 (55.8%) |
Education in Factoryville borough
School Enrollment in Factoryville borough
The most common levels of schooling among the 627 students in Factoryville borough are college / undergraduate (450 | 71.8%), middle school (85 | 13.6%), and elementary school (49 | 7.8%).
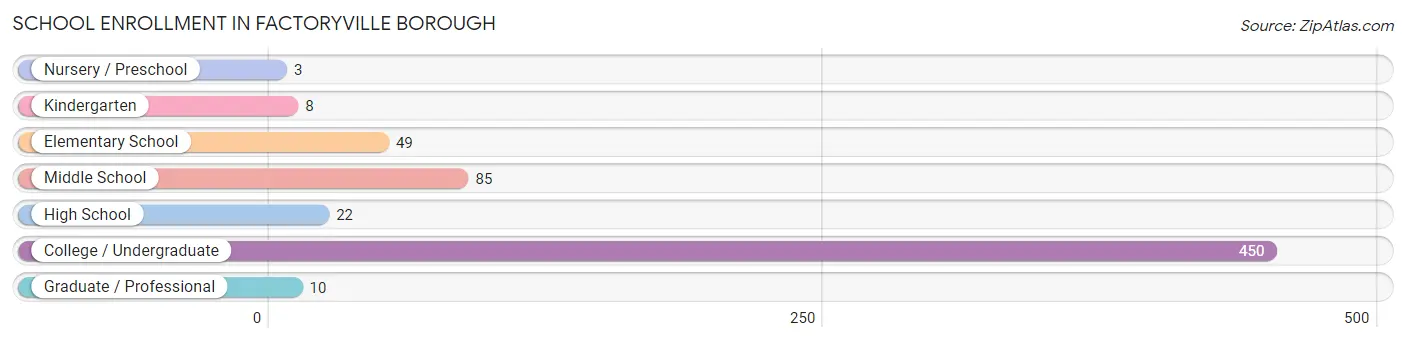
| School Level | # Students | % Students |
| Nursery / Preschool | 3 | 0.5% |
| Kindergarten | 8 | 1.3% |
| Elementary School | 49 | 7.8% |
| Middle School | 85 | 13.6% |
| High School | 22 | 3.5% |
| College / Undergraduate | 450 | 71.8% |
| Graduate / Professional | 10 | 1.6% |
| Total | 627 | 100.0% |
School Enrollment by Age by Funding Source in Factoryville borough
Out of a total of 627 students who are enrolled in schools in Factoryville borough, 465 (74.2%) attend a private institution, while the remaining 162 (25.8%) are enrolled in public schools. The age group of 3 to 4 year olds has the highest likelihood of being enrolled in private schools, with 3 (100.0% in the age bracket) enrolled. Conversely, the age group of 25 to 34 year olds has the lowest likelihood of being enrolled in a private school, with 3 (100.0% in the age bracket) attending a public institution.
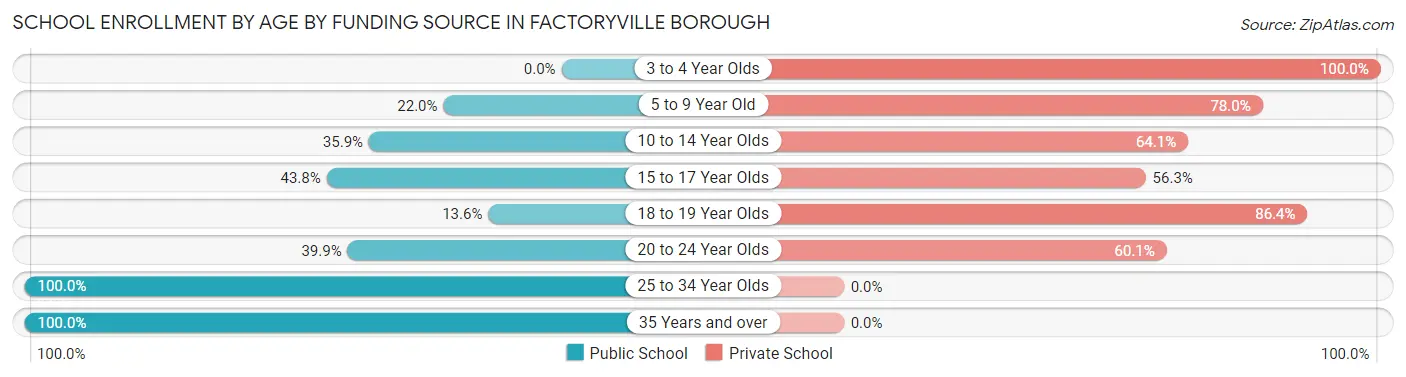
| Age Bracket | Public School | Private School |
| 3 to 4 Year Olds | 0 (0.0%) | 3 (100.0%) |
| 5 to 9 Year Old | 11 (22.0%) | 39 (78.0%) |
| 10 to 14 Year Olds | 33 (35.9%) | 59 (64.1%) |
| 15 to 17 Year Olds | 7 (43.8%) | 9 (56.2%) |
| 18 to 19 Year Olds | 42 (13.6%) | 266 (86.4%) |
| 20 to 24 Year Olds | 59 (39.9%) | 89 (60.1%) |
| 25 to 34 Year Olds | 3 (100.0%) | 0 (0.0%) |
| 35 Years and over | 7 (100.0%) | 0 (0.0%) |
| Total | 162 (25.8%) | 465 (74.2%) |
Educational Attainment by Field of Study in Factoryville borough
Education (35 | 21.0%), science & technology (26 | 15.6%), business (26 | 15.6%), literature & languages (14 | 8.4%), and psychology (12 | 7.2%) are the most common fields of study among 167 individuals in Factoryville borough who have obtained a bachelor's degree or higher.
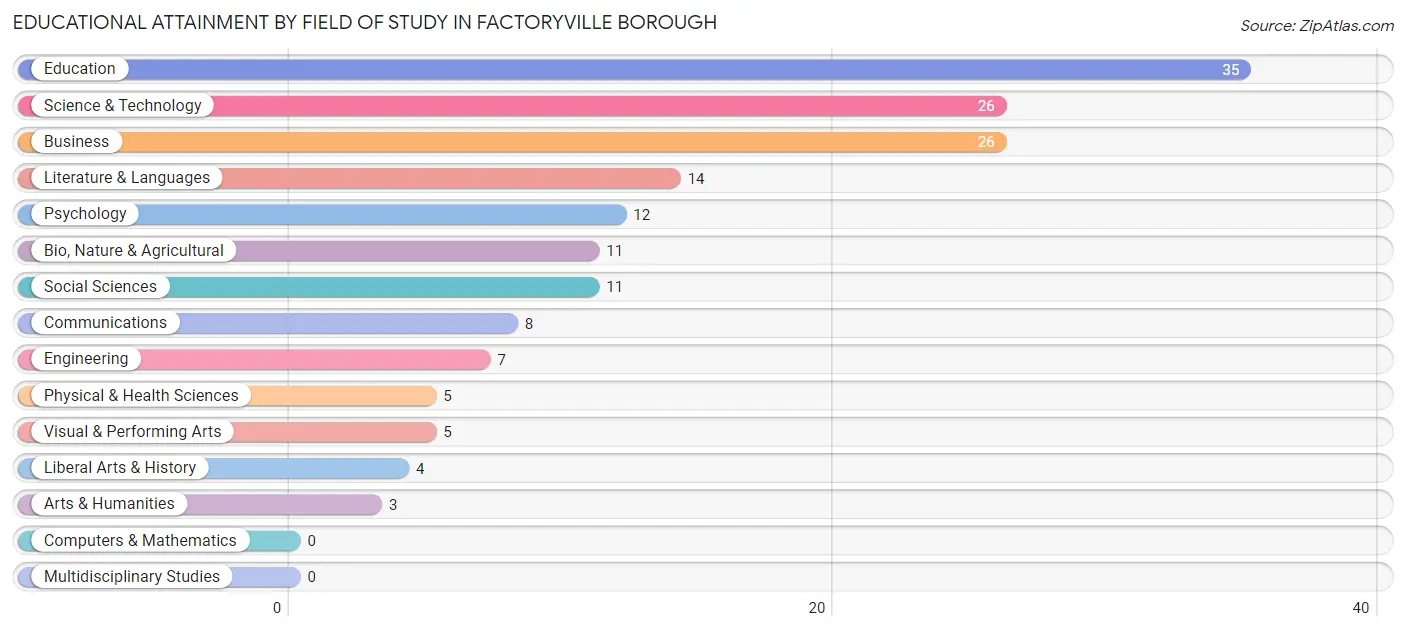
| Field of Study | # Graduates | % Graduates |
| Computers & Mathematics | 0 | 0.0% |
| Bio, Nature & Agricultural | 11 | 6.6% |
| Physical & Health Sciences | 5 | 3.0% |
| Psychology | 12 | 7.2% |
| Social Sciences | 11 | 6.6% |
| Engineering | 7 | 4.2% |
| Multidisciplinary Studies | 0 | 0.0% |
| Science & Technology | 26 | 15.6% |
| Business | 26 | 15.6% |
| Education | 35 | 21.0% |
| Literature & Languages | 14 | 8.4% |
| Liberal Arts & History | 4 | 2.4% |
| Visual & Performing Arts | 5 | 3.0% |
| Communications | 8 | 4.8% |
| Arts & Humanities | 3 | 1.8% |
| Total | 167 | 100.0% |
Transportation & Commute in Factoryville borough
Vehicle Availability by Sex in Factoryville borough
The most prevalent vehicle ownership categories in Factoryville borough are males with 3 vehicles (50, accounting for 36.5%) and females with 3 vehicles (39, making up 41.7%).
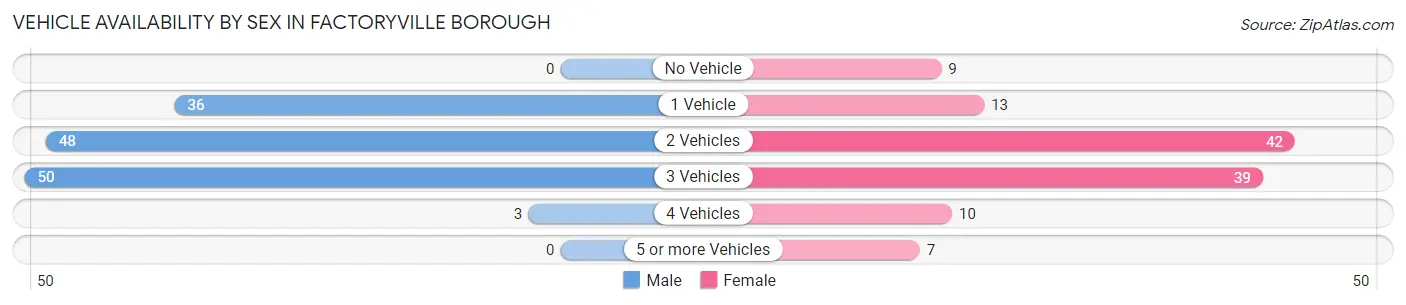
| Vehicles Available | Male | Female |
| No Vehicle | 0 (0.0%) | 9 (7.5%) |
| 1 Vehicle | 36 (26.3%) | 13 (10.8%) |
| 2 Vehicles | 48 (35.0%) | 42 (35.0%) |
| 3 Vehicles | 50 (36.5%) | 39 (32.5%) |
| 4 Vehicles | 3 (2.2%) | 10 (8.3%) |
| 5 or more Vehicles | 0 (0.0%) | 7 (5.8%) |
| Total | 137 (100.0%) | 120 (100.0%) |
Commute Time in Factoryville borough
The most frequently occuring commute durations in Factoryville borough are 5 to 9 minutes (78 commuters, 23.4%), 20 to 24 minutes (45 commuters, 13.5%), and 15 to 19 minutes (36 commuters, 10.8%).
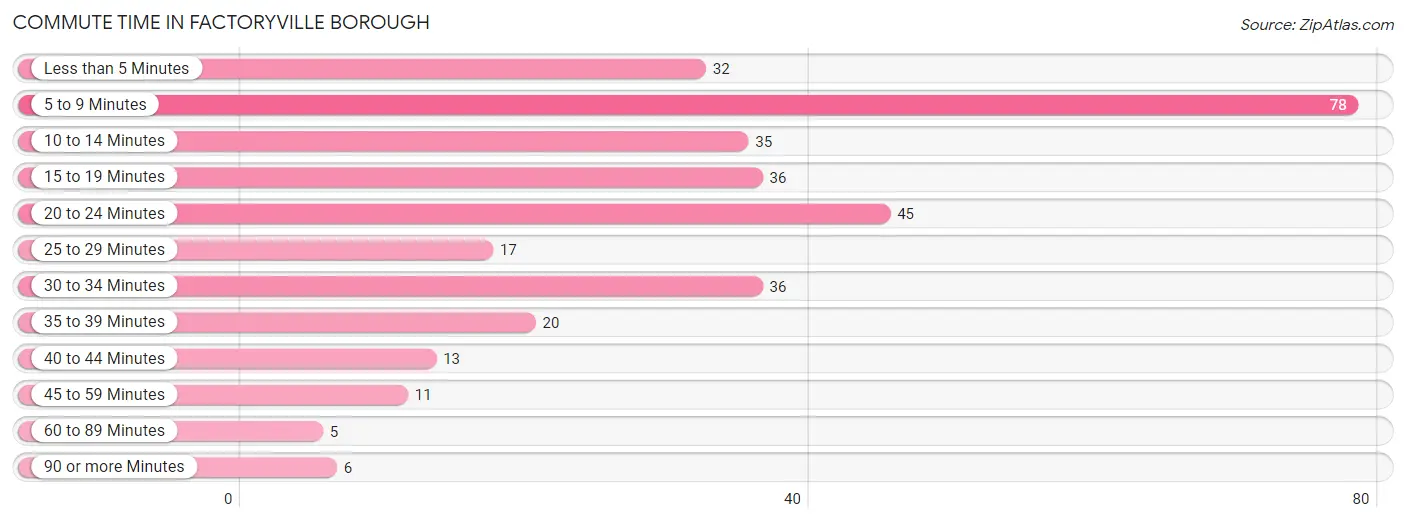
| Commute Time | # Commuters | % Commuters |
| Less than 5 Minutes | 32 | 9.6% |
| 5 to 9 Minutes | 78 | 23.4% |
| 10 to 14 Minutes | 35 | 10.5% |
| 15 to 19 Minutes | 36 | 10.8% |
| 20 to 24 Minutes | 45 | 13.5% |
| 25 to 29 Minutes | 17 | 5.1% |
| 30 to 34 Minutes | 36 | 10.8% |
| 35 to 39 Minutes | 20 | 6.0% |
| 40 to 44 Minutes | 13 | 3.9% |
| 45 to 59 Minutes | 11 | 3.3% |
| 60 to 89 Minutes | 5 | 1.5% |
| 90 or more Minutes | 6 | 1.8% |
Commute Time by Sex in Factoryville borough
The most common commute times in Factoryville borough are 20 to 24 minutes (35 commuters, 23.2%) for males and 5 to 9 minutes (52 commuters, 28.4%) for females.
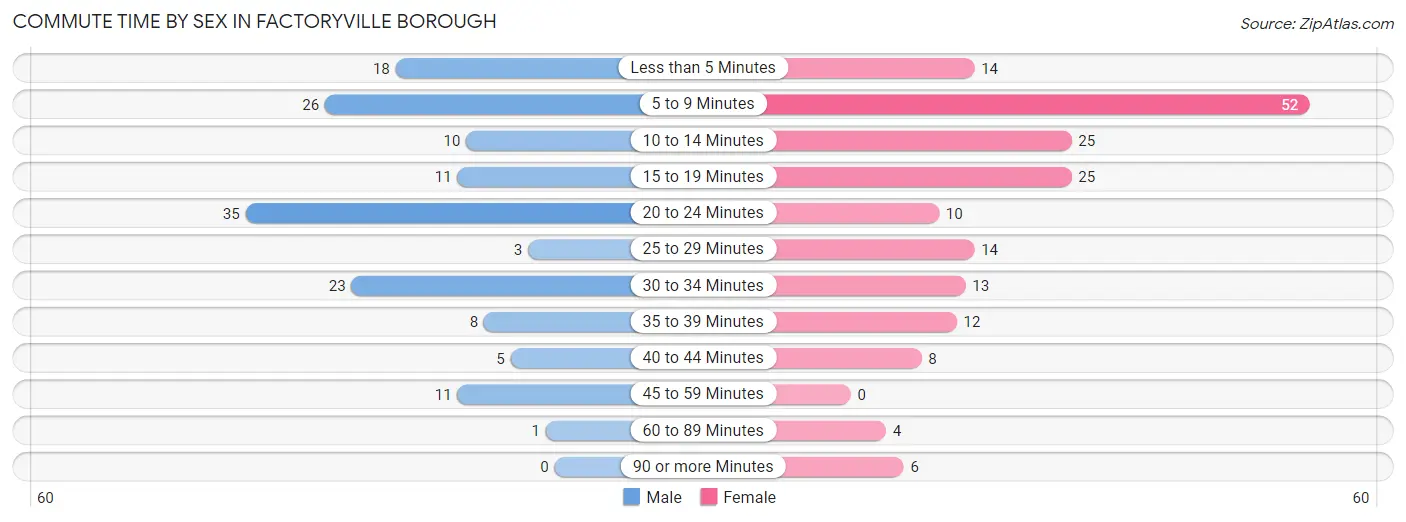
| Commute Time | Male | Female |
| Less than 5 Minutes | 18 (11.9%) | 14 (7.6%) |
| 5 to 9 Minutes | 26 (17.2%) | 52 (28.4%) |
| 10 to 14 Minutes | 10 (6.6%) | 25 (13.7%) |
| 15 to 19 Minutes | 11 (7.3%) | 25 (13.7%) |
| 20 to 24 Minutes | 35 (23.2%) | 10 (5.5%) |
| 25 to 29 Minutes | 3 (2.0%) | 14 (7.6%) |
| 30 to 34 Minutes | 23 (15.2%) | 13 (7.1%) |
| 35 to 39 Minutes | 8 (5.3%) | 12 (6.6%) |
| 40 to 44 Minutes | 5 (3.3%) | 8 (4.4%) |
| 45 to 59 Minutes | 11 (7.3%) | 0 (0.0%) |
| 60 to 89 Minutes | 1 (0.7%) | 4 (2.2%) |
| 90 or more Minutes | 0 (0.0%) | 6 (3.3%) |
Time of Departure to Work by Sex in Factoryville borough
The most frequent times of departure to work in Factoryville borough are 8:00 AM to 8:29 AM (29, 19.2%) for males and 12:00 PM to 3:59 PM (67, 36.6%) for females.
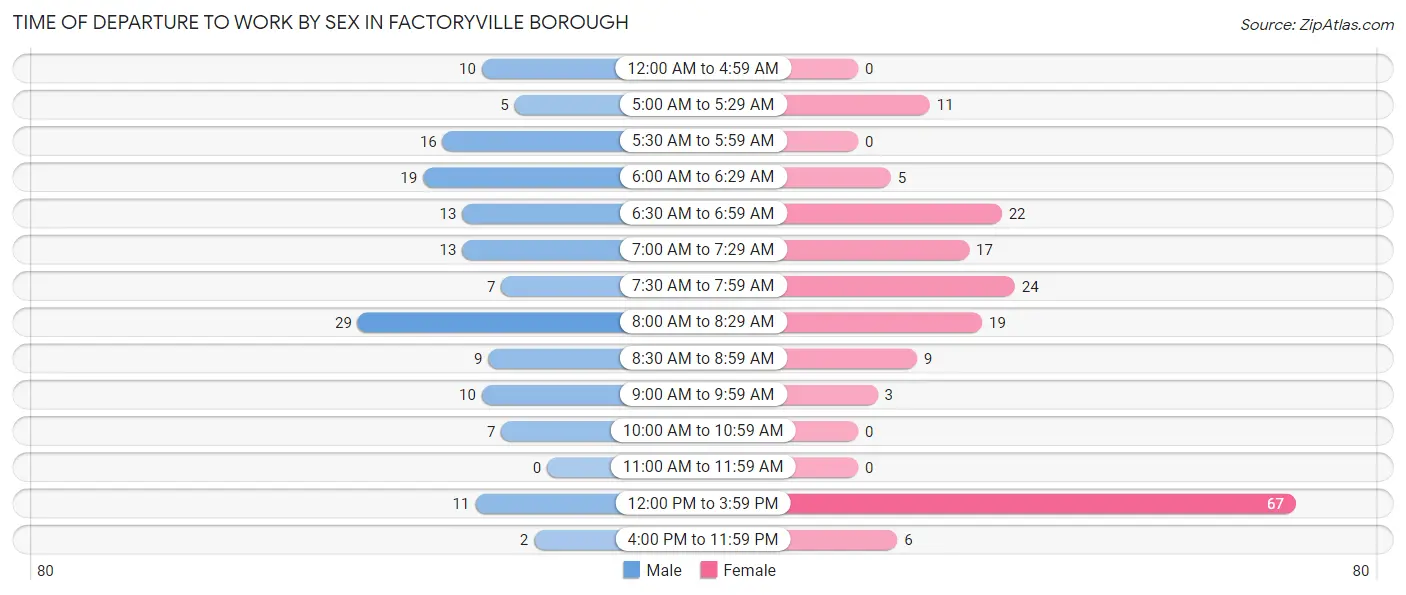
| Time of Departure | Male | Female |
| 12:00 AM to 4:59 AM | 10 (6.6%) | 0 (0.0%) |
| 5:00 AM to 5:29 AM | 5 (3.3%) | 11 (6.0%) |
| 5:30 AM to 5:59 AM | 16 (10.6%) | 0 (0.0%) |
| 6:00 AM to 6:29 AM | 19 (12.6%) | 5 (2.7%) |
| 6:30 AM to 6:59 AM | 13 (8.6%) | 22 (12.0%) |
| 7:00 AM to 7:29 AM | 13 (8.6%) | 17 (9.3%) |
| 7:30 AM to 7:59 AM | 7 (4.6%) | 24 (13.1%) |
| 8:00 AM to 8:29 AM | 29 (19.2%) | 19 (10.4%) |
| 8:30 AM to 8:59 AM | 9 (6.0%) | 9 (4.9%) |
| 9:00 AM to 9:59 AM | 10 (6.6%) | 3 (1.6%) |
| 10:00 AM to 10:59 AM | 7 (4.6%) | 0 (0.0%) |
| 11:00 AM to 11:59 AM | 0 (0.0%) | 0 (0.0%) |
| 12:00 PM to 3:59 PM | 11 (7.3%) | 67 (36.6%) |
| 4:00 PM to 11:59 PM | 2 (1.3%) | 6 (3.3%) |
| Total | 151 (100.0%) | 183 (100.0%) |
Housing Occupancy in Factoryville borough
Occupancy by Ownership in Factoryville borough
Of the total 306 dwellings in Factoryville borough, owner-occupied units account for 183 (59.8%), while renter-occupied units make up 123 (40.2%).
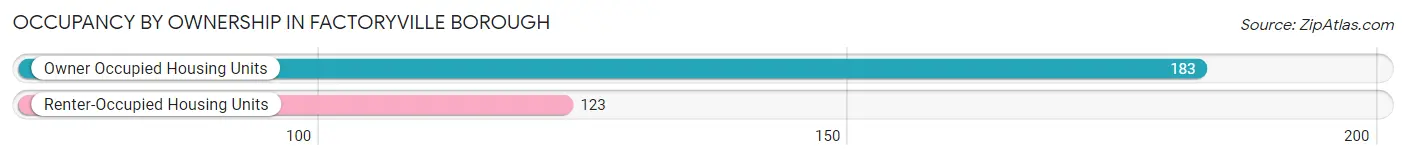
| Occupancy | # Housing Units | % Housing Units |
| Owner Occupied Housing Units | 183 | 59.8% |
| Renter-Occupied Housing Units | 123 | 40.2% |
| Total Occupied Housing Units | 306 | 100.0% |
Occupancy by Household Size in Factoryville borough
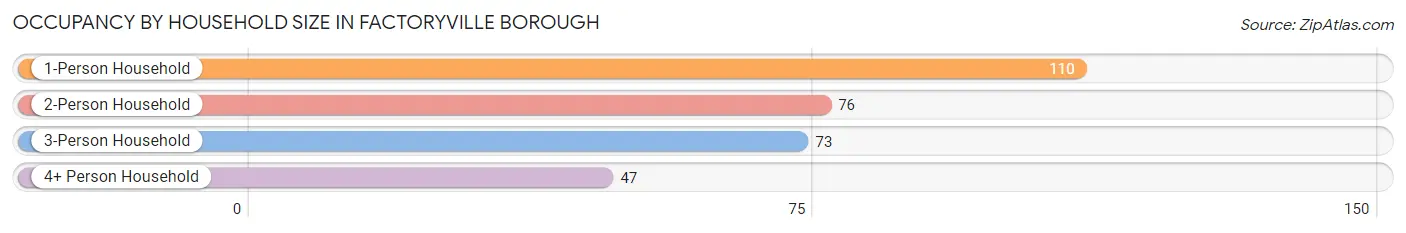
| Household Size | # Housing Units | % Housing Units |
| 1-Person Household | 110 | 35.9% |
| 2-Person Household | 76 | 24.8% |
| 3-Person Household | 73 | 23.9% |
| 4+ Person Household | 47 | 15.4% |
| Total Housing Units | 306 | 100.0% |
Occupancy by Ownership by Household Size in Factoryville borough
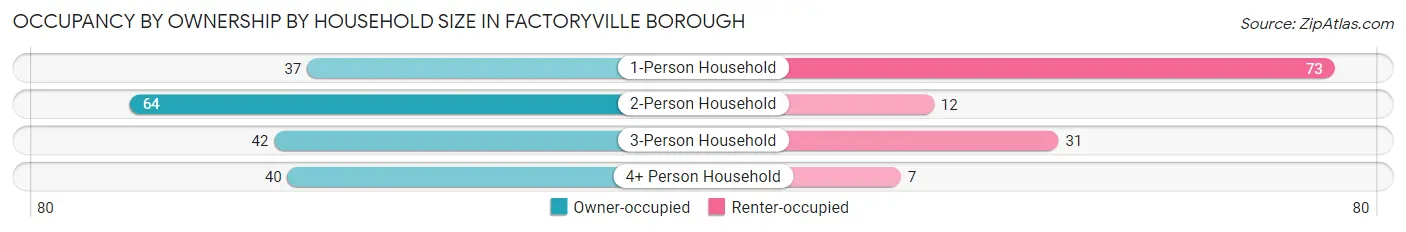
| Household Size | Owner-occupied | Renter-occupied |
| 1-Person Household | 37 (33.6%) | 73 (66.4%) |
| 2-Person Household | 64 (84.2%) | 12 (15.8%) |
| 3-Person Household | 42 (57.5%) | 31 (42.5%) |
| 4+ Person Household | 40 (85.1%) | 7 (14.9%) |
| Total Housing Units | 183 (59.8%) | 123 (40.2%) |
Occupancy by Educational Attainment in Factoryville borough
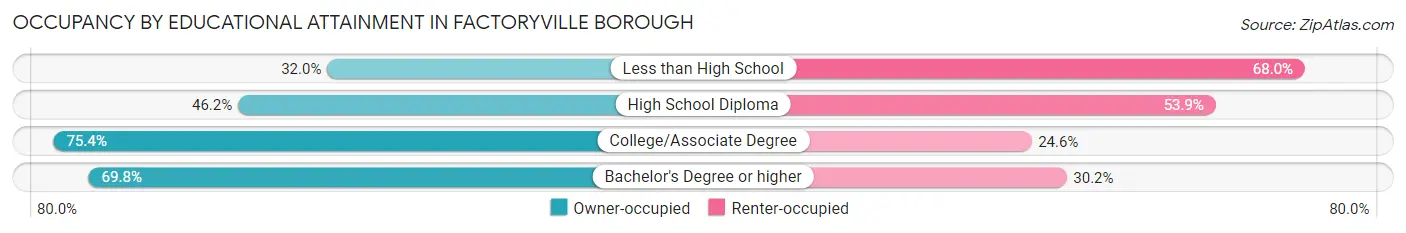
| Household Size | Owner-occupied | Renter-occupied |
| Less than High School | 8 (32.0%) | 17 (68.0%) |
| High School Diploma | 48 (46.2%) | 56 (53.8%) |
| College/Associate Degree | 46 (75.4%) | 15 (24.6%) |
| Bachelor's Degree or higher | 81 (69.8%) | 35 (30.2%) |
Occupancy by Age of Householder in Factoryville borough
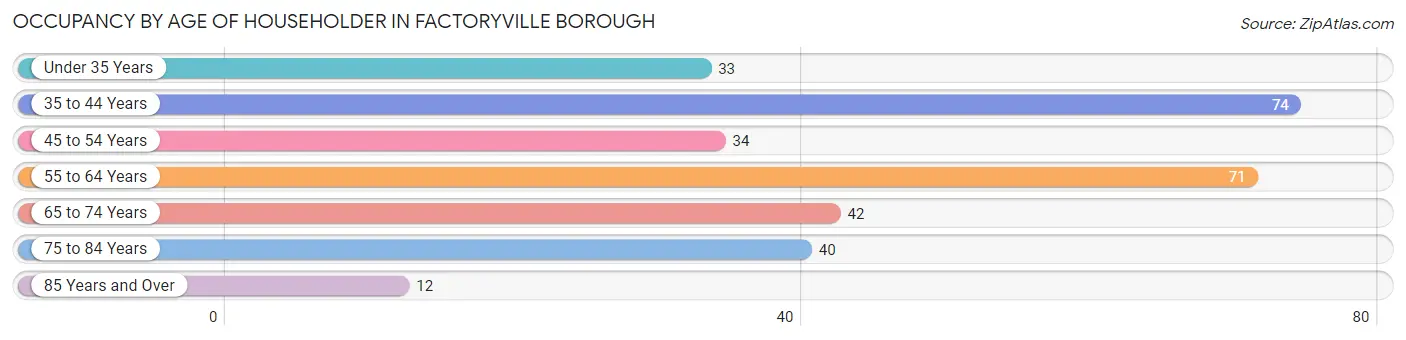
| Age Bracket | # Households | % Households |
| Under 35 Years | 33 | 10.8% |
| 35 to 44 Years | 74 | 24.2% |
| 45 to 54 Years | 34 | 11.1% |
| 55 to 64 Years | 71 | 23.2% |
| 65 to 74 Years | 42 | 13.7% |
| 75 to 84 Years | 40 | 13.1% |
| 85 Years and Over | 12 | 3.9% |
| Total | 306 | 100.0% |
Housing Finances in Factoryville borough
Median Income by Occupancy in Factoryville borough
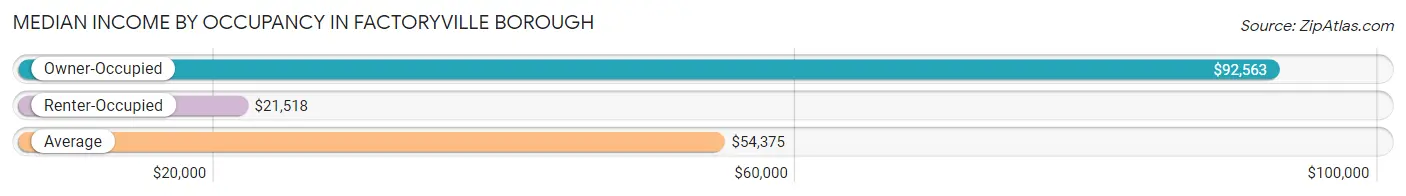
| Occupancy Type | # Households | Median Income |
| Owner-Occupied | 183 (59.8%) | $92,563 |
| Renter-Occupied | 123 (40.2%) | $21,518 |
| Average | 306 (100.0%) | $54,375 |
Occupancy by Householder Income Bracket in Factoryville borough
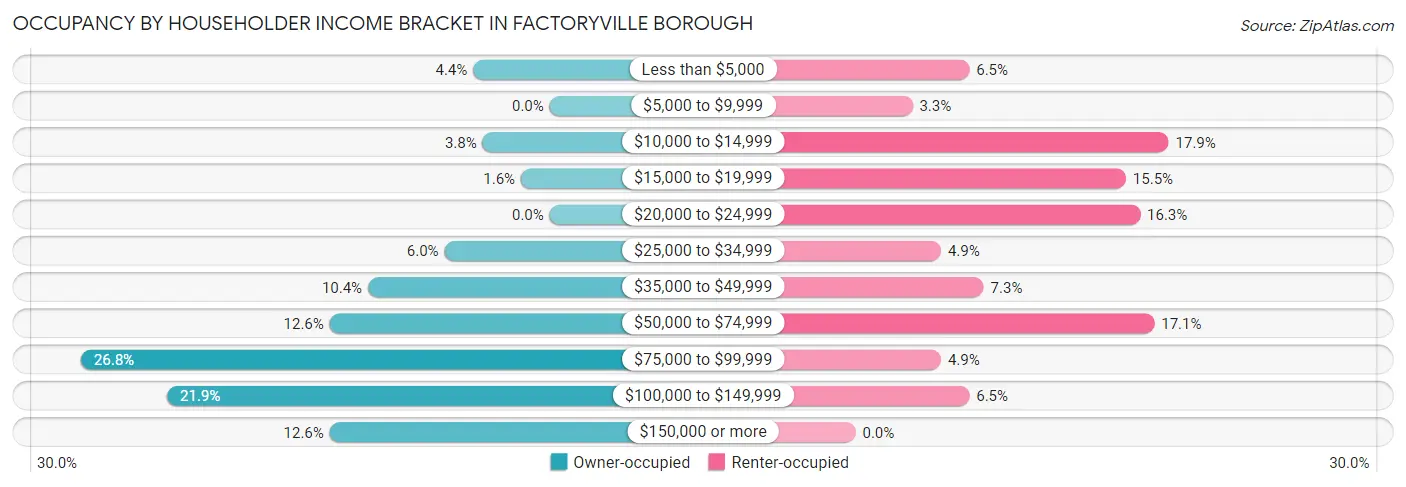
| Income Bracket | Owner-occupied | Renter-occupied |
| Less than $5,000 | 8 (4.4%) | 8 (6.5%) |
| $5,000 to $9,999 | 0 (0.0%) | 4 (3.3%) |
| $10,000 to $14,999 | 7 (3.8%) | 22 (17.9%) |
| $15,000 to $19,999 | 3 (1.6%) | 19 (15.4%) |
| $20,000 to $24,999 | 0 (0.0%) | 20 (16.3%) |
| $25,000 to $34,999 | 11 (6.0%) | 6 (4.9%) |
| $35,000 to $49,999 | 19 (10.4%) | 9 (7.3%) |
| $50,000 to $74,999 | 23 (12.6%) | 21 (17.1%) |
| $75,000 to $99,999 | 49 (26.8%) | 6 (4.9%) |
| $100,000 to $149,999 | 40 (21.9%) | 8 (6.5%) |
| $150,000 or more | 23 (12.6%) | 0 (0.0%) |
| Total | 183 (100.0%) | 123 (100.0%) |
Monthly Housing Cost Tiers in Factoryville borough
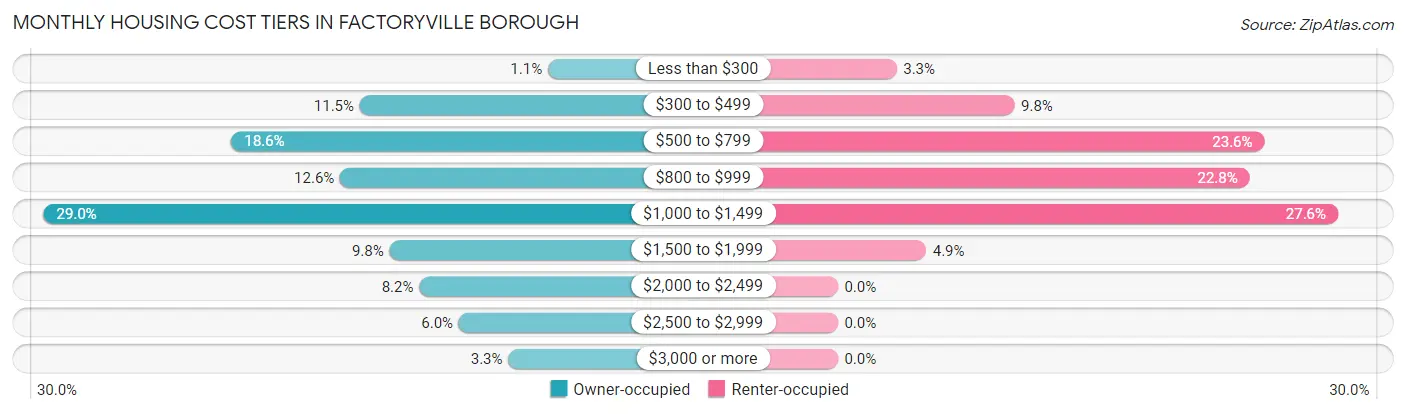
| Monthly Cost | Owner-occupied | Renter-occupied |
| Less than $300 | 2 (1.1%) | 4 (3.3%) |
| $300 to $499 | 21 (11.5%) | 12 (9.8%) |
| $500 to $799 | 34 (18.6%) | 29 (23.6%) |
| $800 to $999 | 23 (12.6%) | 28 (22.8%) |
| $1,000 to $1,499 | 53 (29.0%) | 34 (27.6%) |
| $1,500 to $1,999 | 18 (9.8%) | 6 (4.9%) |
| $2,000 to $2,499 | 15 (8.2%) | 0 (0.0%) |
| $2,500 to $2,999 | 11 (6.0%) | 0 (0.0%) |
| $3,000 or more | 6 (3.3%) | 0 (0.0%) |
| Total | 183 (100.0%) | 123 (100.0%) |
Physical Housing Characteristics in Factoryville borough
Housing Structures in Factoryville borough
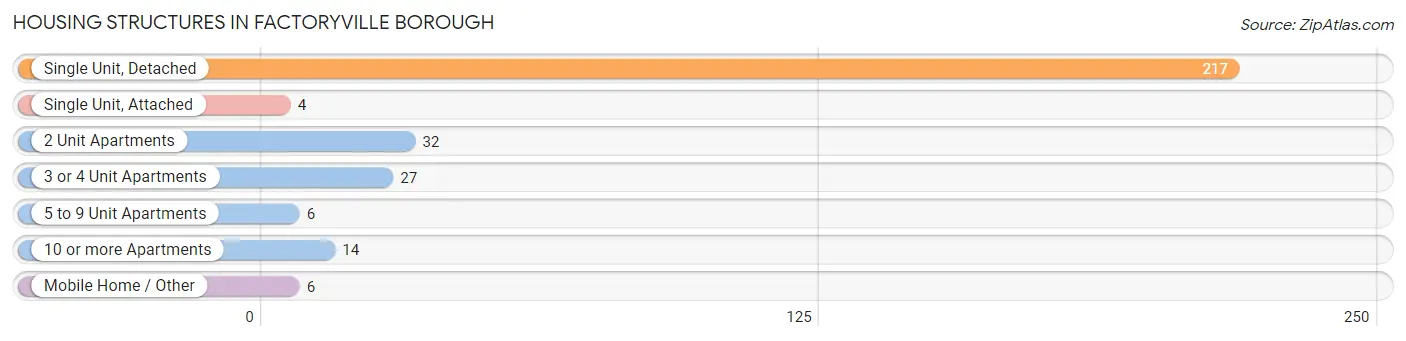
| Structure Type | # Housing Units | % Housing Units |
| Single Unit, Detached | 217 | 70.9% |
| Single Unit, Attached | 4 | 1.3% |
| 2 Unit Apartments | 32 | 10.5% |
| 3 or 4 Unit Apartments | 27 | 8.8% |
| 5 to 9 Unit Apartments | 6 | 2.0% |
| 10 or more Apartments | 14 | 4.6% |
| Mobile Home / Other | 6 | 2.0% |
| Total | 306 | 100.0% |
Housing Structures by Occupancy in Factoryville borough
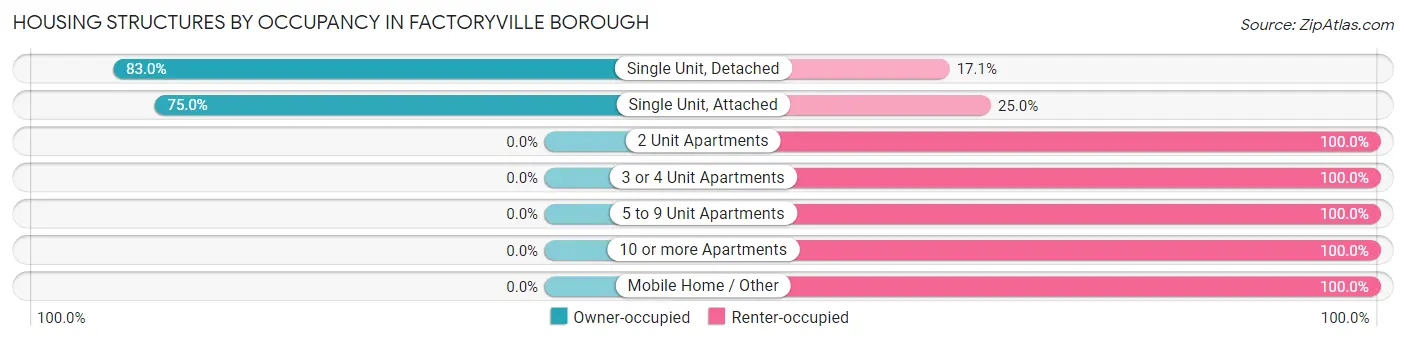
| Structure Type | Owner-occupied | Renter-occupied |
| Single Unit, Detached | 180 (83.0%) | 37 (17.1%) |
| Single Unit, Attached | 3 (75.0%) | 1 (25.0%) |
| 2 Unit Apartments | 0 (0.0%) | 32 (100.0%) |
| 3 or 4 Unit Apartments | 0 (0.0%) | 27 (100.0%) |
| 5 to 9 Unit Apartments | 0 (0.0%) | 6 (100.0%) |
| 10 or more Apartments | 0 (0.0%) | 14 (100.0%) |
| Mobile Home / Other | 0 (0.0%) | 6 (100.0%) |
| Total | 183 (59.8%) | 123 (40.2%) |
Housing Structures by Number of Rooms in Factoryville borough
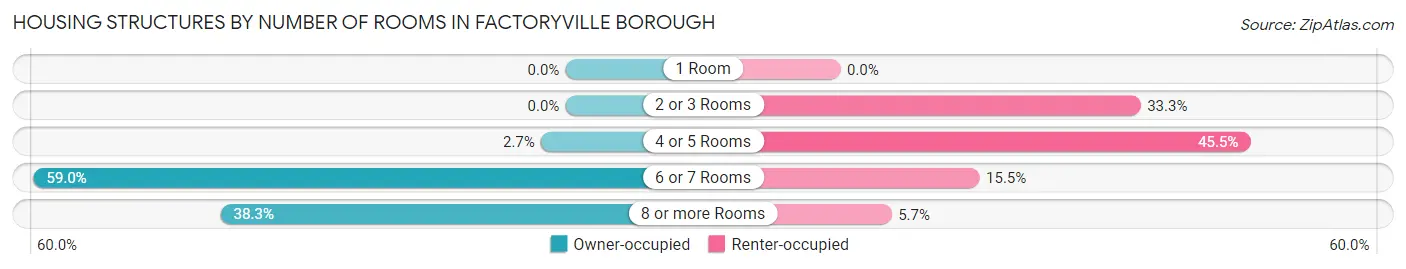
| Number of Rooms | Owner-occupied | Renter-occupied |
| 1 Room | 0 (0.0%) | 0 (0.0%) |
| 2 or 3 Rooms | 0 (0.0%) | 41 (33.3%) |
| 4 or 5 Rooms | 5 (2.7%) | 56 (45.5%) |
| 6 or 7 Rooms | 108 (59.0%) | 19 (15.4%) |
| 8 or more Rooms | 70 (38.3%) | 7 (5.7%) |
| Total | 183 (100.0%) | 123 (100.0%) |
Housing Structure by Heating Type in Factoryville borough
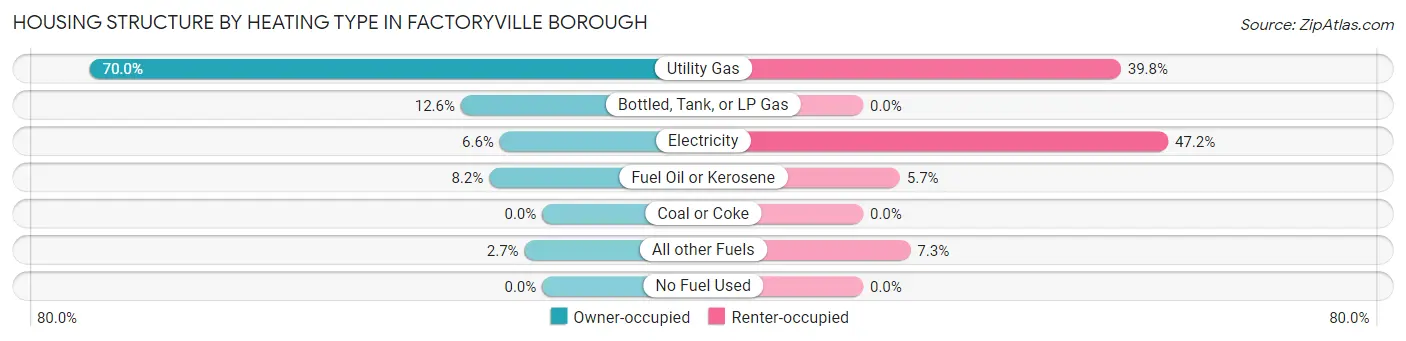
| Heating Type | Owner-occupied | Renter-occupied |
| Utility Gas | 128 (70.0%) | 49 (39.8%) |
| Bottled, Tank, or LP Gas | 23 (12.6%) | 0 (0.0%) |
| Electricity | 12 (6.6%) | 58 (47.1%) |
| Fuel Oil or Kerosene | 15 (8.2%) | 7 (5.7%) |
| Coal or Coke | 0 (0.0%) | 0 (0.0%) |
| All other Fuels | 5 (2.7%) | 9 (7.3%) |
| No Fuel Used | 0 (0.0%) | 0 (0.0%) |
| Total | 183 (100.0%) | 123 (100.0%) |
Household Vehicle Usage in Factoryville borough
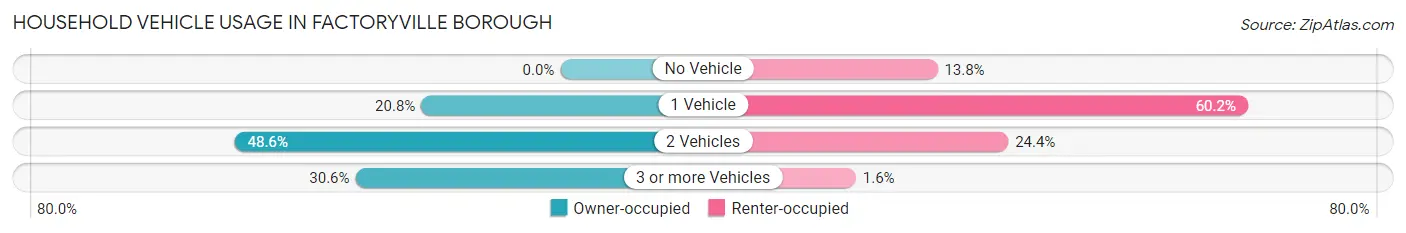
| Vehicles per Household | Owner-occupied | Renter-occupied |
| No Vehicle | 0 (0.0%) | 17 (13.8%) |
| 1 Vehicle | 38 (20.8%) | 74 (60.2%) |
| 2 Vehicles | 89 (48.6%) | 30 (24.4%) |
| 3 or more Vehicles | 56 (30.6%) | 2 (1.6%) |
| Total | 183 (100.0%) | 123 (100.0%) |
Real Estate & Mortgages in Factoryville borough
Real Estate and Mortgage Overview in Factoryville borough
| Characteristic | Without Mortgage | With Mortgage |
| Housing Units | 69 | 114 |
| Median Property Value | $171,500 | $200,000 |
| Median Household Income | $51,719 | $15 |
| Monthly Housing Costs | $548 | $6 |
| Real Estate Taxes | $2,603 | $0 |
Property Value by Mortgage Status in Factoryville borough
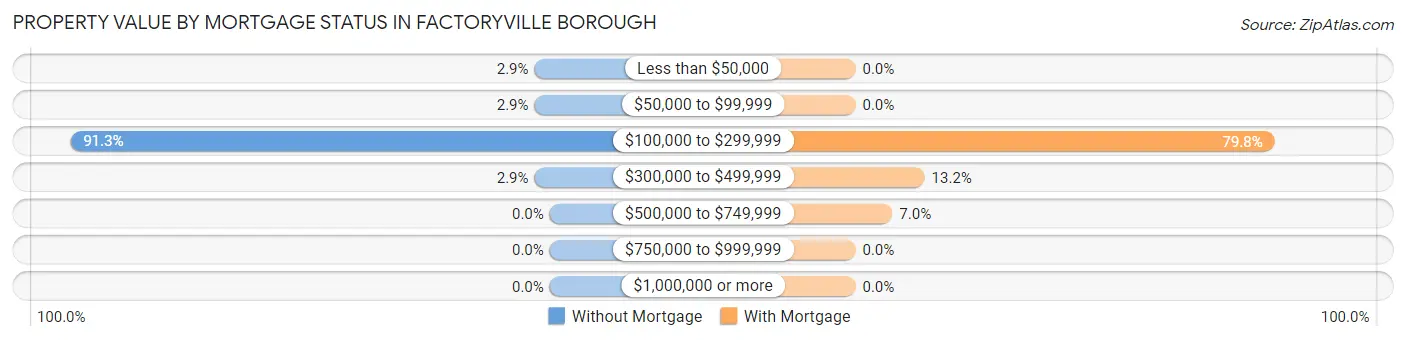
| Property Value | Without Mortgage | With Mortgage |
| Less than $50,000 | 2 (2.9%) | 0 (0.0%) |
| $50,000 to $99,999 | 2 (2.9%) | 0 (0.0%) |
| $100,000 to $299,999 | 63 (91.3%) | 91 (79.8%) |
| $300,000 to $499,999 | 2 (2.9%) | 15 (13.2%) |
| $500,000 to $749,999 | 0 (0.0%) | 8 (7.0%) |
| $750,000 to $999,999 | 0 (0.0%) | 0 (0.0%) |
| $1,000,000 or more | 0 (0.0%) | 0 (0.0%) |
| Total | 69 (100.0%) | 114 (100.0%) |
Household Income by Mortgage Status in Factoryville borough
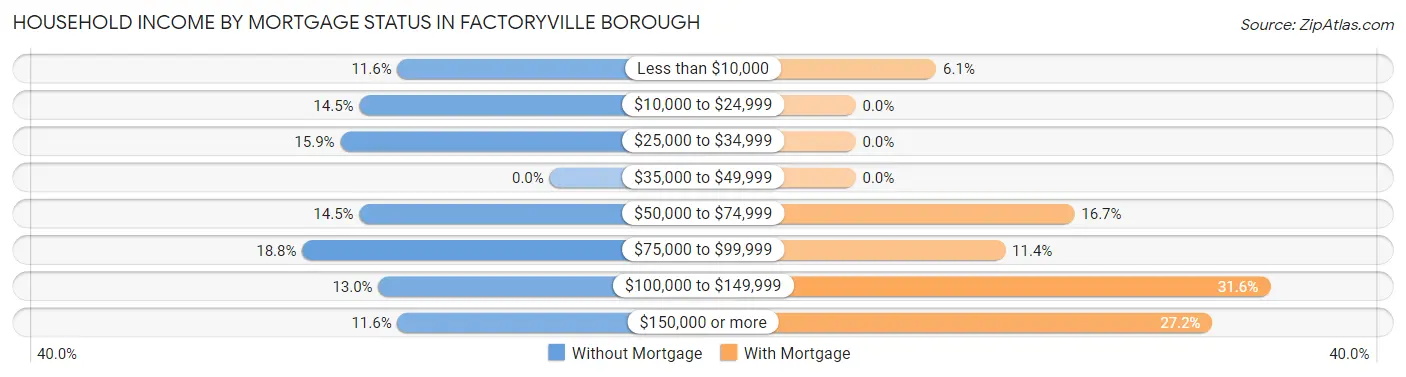
| Household Income | Without Mortgage | With Mortgage |
| Less than $10,000 | 8 (11.6%) | 7 (6.1%) |
| $10,000 to $24,999 | 10 (14.5%) | 0 (0.0%) |
| $25,000 to $34,999 | 11 (15.9%) | 0 (0.0%) |
| $35,000 to $49,999 | 0 (0.0%) | 0 (0.0%) |
| $50,000 to $74,999 | 10 (14.5%) | 19 (16.7%) |
| $75,000 to $99,999 | 13 (18.8%) | 13 (11.4%) |
| $100,000 to $149,999 | 9 (13.0%) | 36 (31.6%) |
| $150,000 or more | 8 (11.6%) | 31 (27.2%) |
| Total | 69 (100.0%) | 114 (100.0%) |
Property Value to Household Income Ratio in Factoryville borough
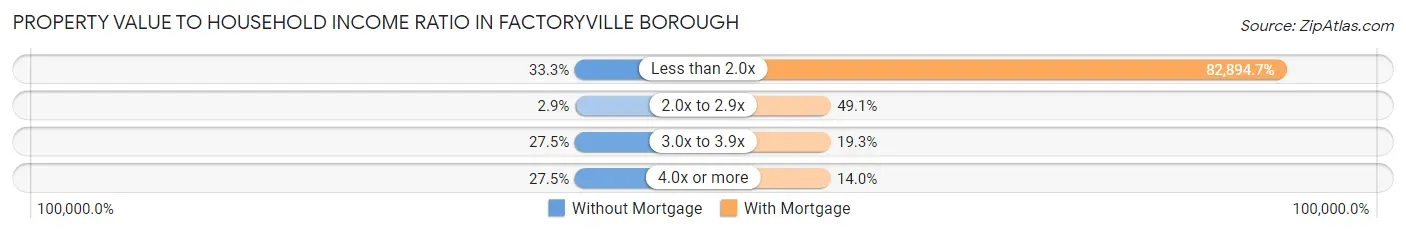
| Value-to-Income Ratio | Without Mortgage | With Mortgage |
| Less than 2.0x | 23 (33.3%) | 94,500 (82,894.7%) |
| 2.0x to 2.9x | 2 (2.9%) | 56 (49.1%) |
| 3.0x to 3.9x | 19 (27.5%) | 22 (19.3%) |
| 4.0x or more | 19 (27.5%) | 16 (14.0%) |
| Total | 69 (100.0%) | 114 (100.0%) |
Real Estate Taxes by Mortgage Status in Factoryville borough
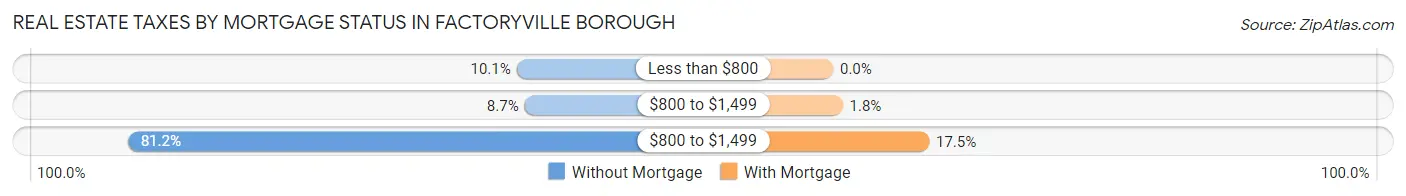
| Property Taxes | Without Mortgage | With Mortgage |
| Less than $800 | 7 (10.1%) | 0 (0.0%) |
| $800 to $1,499 | 6 (8.7%) | 2 (1.8%) |
| $800 to $1,499 | 56 (81.2%) | 20 (17.5%) |
| Total | 69 (100.0%) | 114 (100.0%) |
Health & Disability in Factoryville borough
Health Insurance Coverage by Age in Factoryville borough
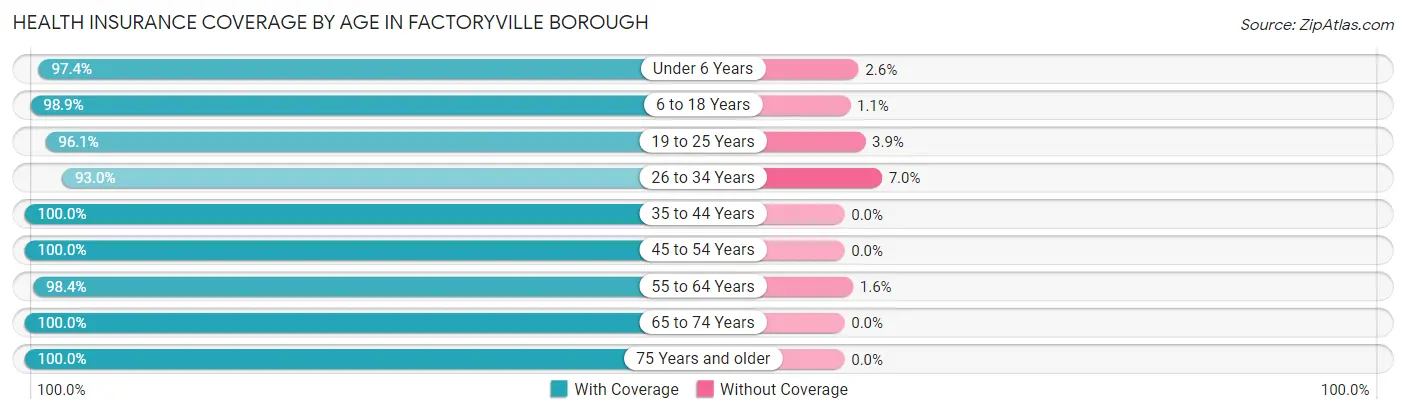
| Age Bracket | With Coverage | Without Coverage |
| Under 6 Years | 74 (97.4%) | 2 (2.6%) |
| 6 to 18 Years | 278 (98.9%) | 3 (1.1%) |
| 19 to 25 Years | 347 (96.1%) | 14 (3.9%) |
| 26 to 34 Years | 40 (93.0%) | 3 (7.0%) |
| 35 to 44 Years | 140 (100.0%) | 0 (0.0%) |
| 45 to 54 Years | 53 (100.0%) | 0 (0.0%) |
| 55 to 64 Years | 123 (98.4%) | 2 (1.6%) |
| 65 to 74 Years | 78 (100.0%) | 0 (0.0%) |
| 75 Years and older | 67 (100.0%) | 0 (0.0%) |
| Total | 1,200 (98.0%) | 24 (2.0%) |
Health Insurance Coverage by Citizenship Status in Factoryville borough
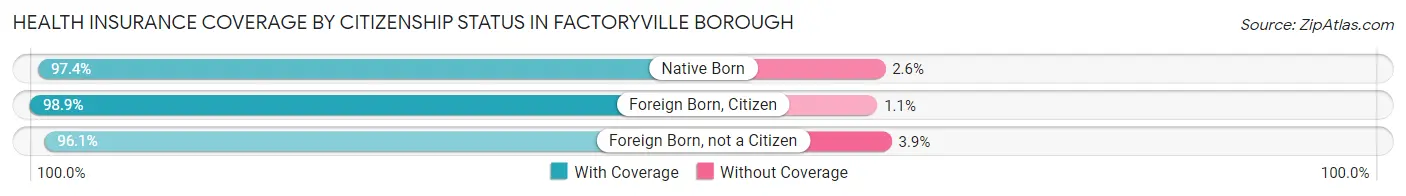
| Citizenship Status | With Coverage | Without Coverage |
| Native Born | 74 (97.4%) | 2 (2.6%) |
| Foreign Born, Citizen | 278 (98.9%) | 3 (1.1%) |
| Foreign Born, not a Citizen | 347 (96.1%) | 14 (3.9%) |
Health Insurance Coverage by Household Income in Factoryville borough
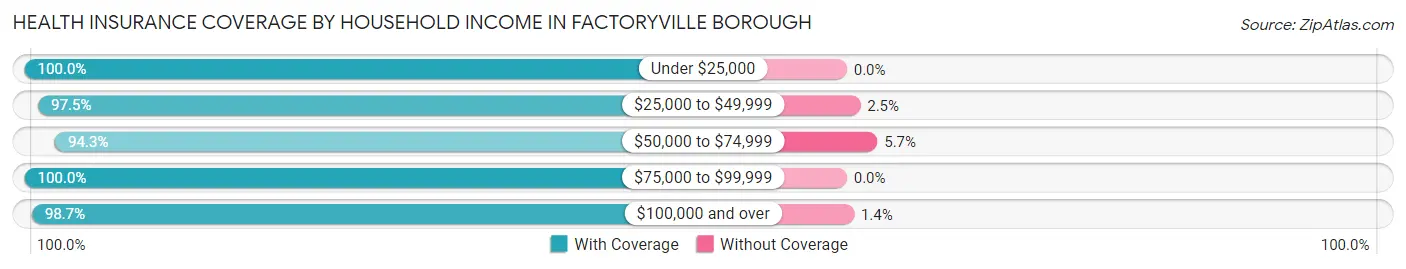
| Household Income | With Coverage | Without Coverage |
| Under $25,000 | 114 (100.0%) | 0 (0.0%) |
| $25,000 to $49,999 | 77 (97.5%) | 2 (2.5%) |
| $50,000 to $74,999 | 99 (94.3%) | 6 (5.7%) |
| $75,000 to $99,999 | 258 (100.0%) | 0 (0.0%) |
| $100,000 and over | 220 (98.7%) | 3 (1.3%) |
Public vs Private Health Insurance Coverage by Age in Factoryville borough
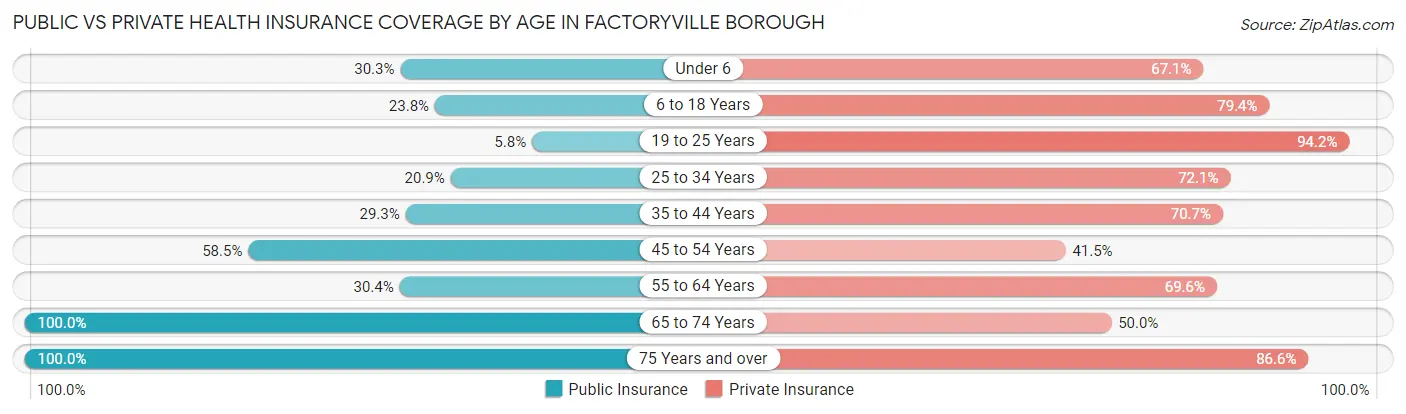
| Age Bracket | Public Insurance | Private Insurance |
| Under 6 | 23 (30.3%) | 51 (67.1%) |
| 6 to 18 Years | 67 (23.8%) | 223 (79.4%) |
| 19 to 25 Years | 21 (5.8%) | 340 (94.2%) |
| 25 to 34 Years | 9 (20.9%) | 31 (72.1%) |
| 35 to 44 Years | 41 (29.3%) | 99 (70.7%) |
| 45 to 54 Years | 31 (58.5%) | 22 (41.5%) |
| 55 to 64 Years | 38 (30.4%) | 87 (69.6%) |
| 65 to 74 Years | 78 (100.0%) | 39 (50.0%) |
| 75 Years and over | 67 (100.0%) | 58 (86.6%) |
| Total | 375 (30.6%) | 950 (77.6%) |
Disability Status by Sex by Age in Factoryville borough
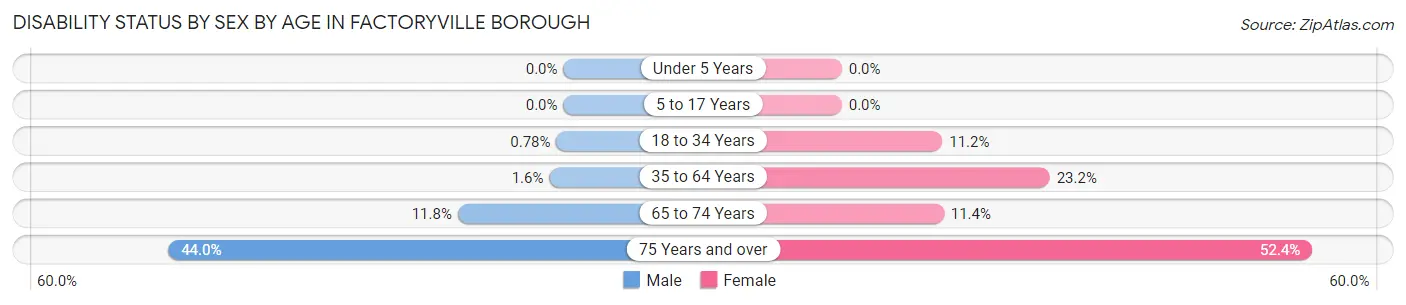
| Age Bracket | Male | Female |
| Under 5 Years | 0 (0.0%) | 0 (0.0%) |
| 5 to 17 Years | 0 (0.0%) | 0 (0.0%) |
| 18 to 34 Years | 2 (0.8%) | 31 (11.2%) |
| 35 to 64 Years | 2 (1.6%) | 44 (23.2%) |
| 65 to 74 Years | 4 (11.8%) | 5 (11.4%) |
| 75 Years and over | 11 (44.0%) | 22 (52.4%) |
Disability Class by Sex by Age in Factoryville borough
Disability Class: Hearing Difficulty
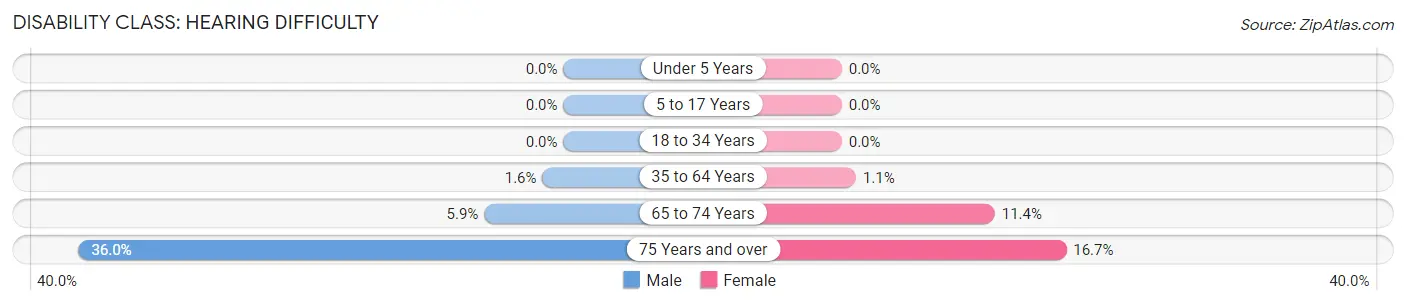
| Age Bracket | Male | Female |
| Under 5 Years | 0 (0.0%) | 0 (0.0%) |
| 5 to 17 Years | 0 (0.0%) | 0 (0.0%) |
| 18 to 34 Years | 0 (0.0%) | 0 (0.0%) |
| 35 to 64 Years | 2 (1.6%) | 2 (1.1%) |
| 65 to 74 Years | 2 (5.9%) | 5 (11.4%) |
| 75 Years and over | 9 (36.0%) | 7 (16.7%) |
Disability Class: Vision Difficulty
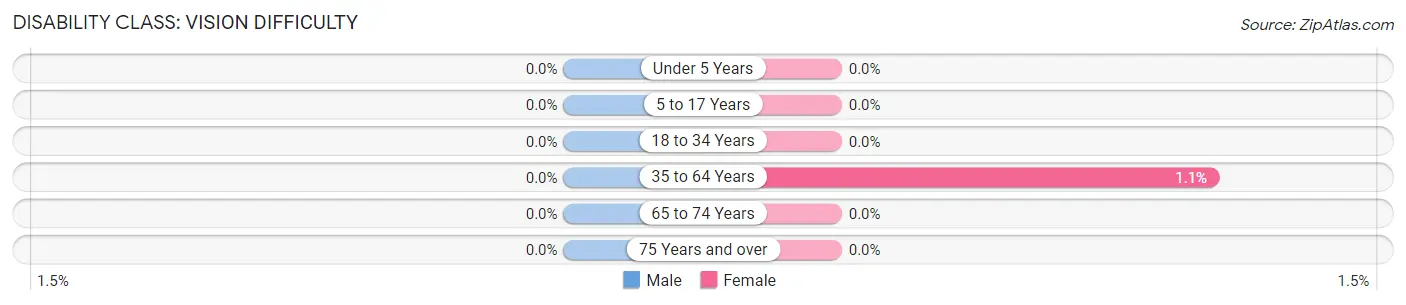
| Age Bracket | Male | Female |
| Under 5 Years | 0 (0.0%) | 0 (0.0%) |
| 5 to 17 Years | 0 (0.0%) | 0 (0.0%) |
| 18 to 34 Years | 0 (0.0%) | 0 (0.0%) |
| 35 to 64 Years | 0 (0.0%) | 2 (1.1%) |
| 65 to 74 Years | 0 (0.0%) | 0 (0.0%) |
| 75 Years and over | 0 (0.0%) | 0 (0.0%) |
Disability Class: Cognitive Difficulty
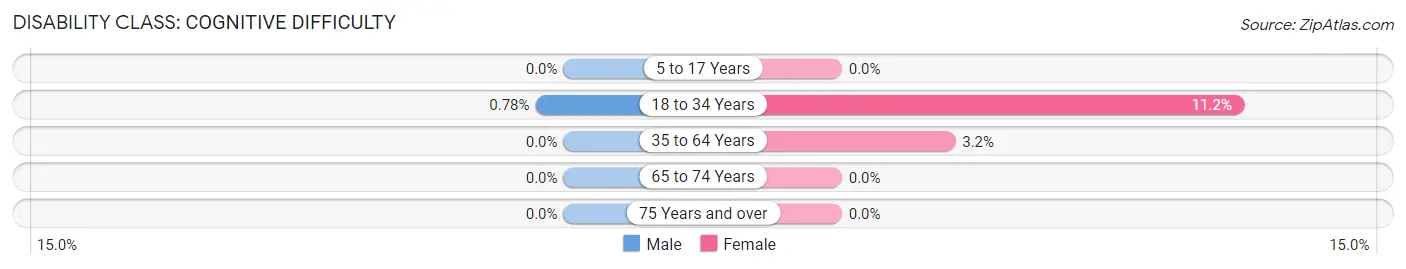
| Age Bracket | Male | Female |
| 5 to 17 Years | 0 (0.0%) | 0 (0.0%) |
| 18 to 34 Years | 2 (0.8%) | 31 (11.2%) |
| 35 to 64 Years | 0 (0.0%) | 6 (3.2%) |
| 65 to 74 Years | 0 (0.0%) | 0 (0.0%) |
| 75 Years and over | 0 (0.0%) | 0 (0.0%) |
Disability Class: Ambulatory Difficulty
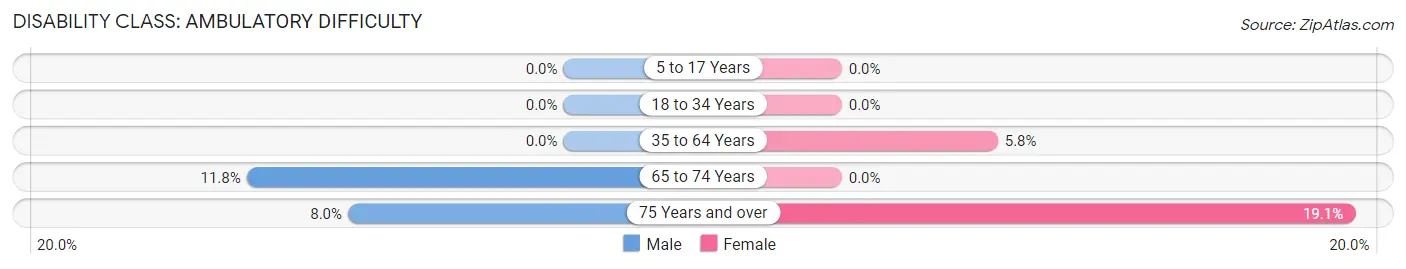
| Age Bracket | Male | Female |
| 5 to 17 Years | 0 (0.0%) | 0 (0.0%) |
| 18 to 34 Years | 0 (0.0%) | 0 (0.0%) |
| 35 to 64 Years | 0 (0.0%) | 11 (5.8%) |
| 65 to 74 Years | 4 (11.8%) | 0 (0.0%) |
| 75 Years and over | 2 (8.0%) | 8 (19.1%) |
Disability Class: Self-Care Difficulty
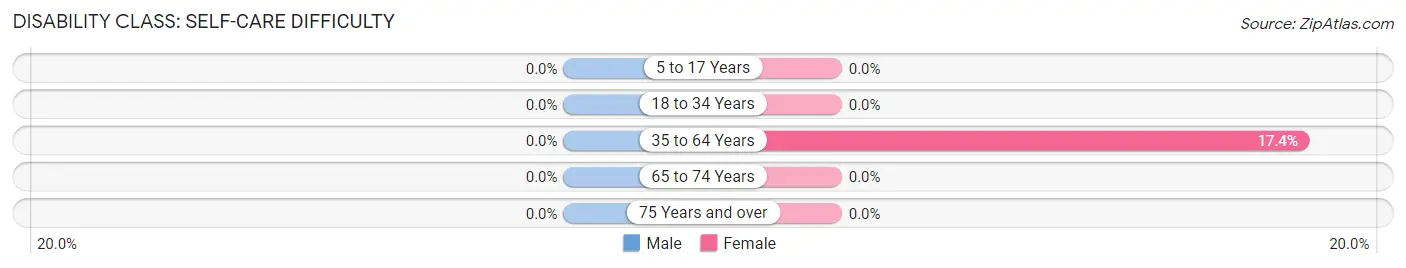
| Age Bracket | Male | Female |
| 5 to 17 Years | 0 (0.0%) | 0 (0.0%) |
| 18 to 34 Years | 0 (0.0%) | 0 (0.0%) |
| 35 to 64 Years | 0 (0.0%) | 33 (17.4%) |
| 65 to 74 Years | 0 (0.0%) | 0 (0.0%) |
| 75 Years and over | 0 (0.0%) | 0 (0.0%) |
Technology Access in Factoryville borough
Computing Device Access in Factoryville borough
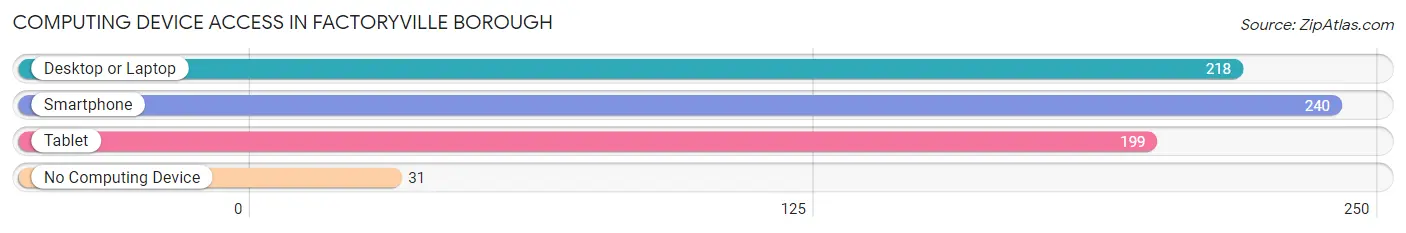
| Device Type | # Households | % Households |
| Desktop or Laptop | 218 | 71.2% |
| Smartphone | 240 | 78.4% |
| Tablet | 199 | 65.0% |
| No Computing Device | 31 | 10.1% |
| Total | 306 | 100.0% |
Internet Access in Factoryville borough
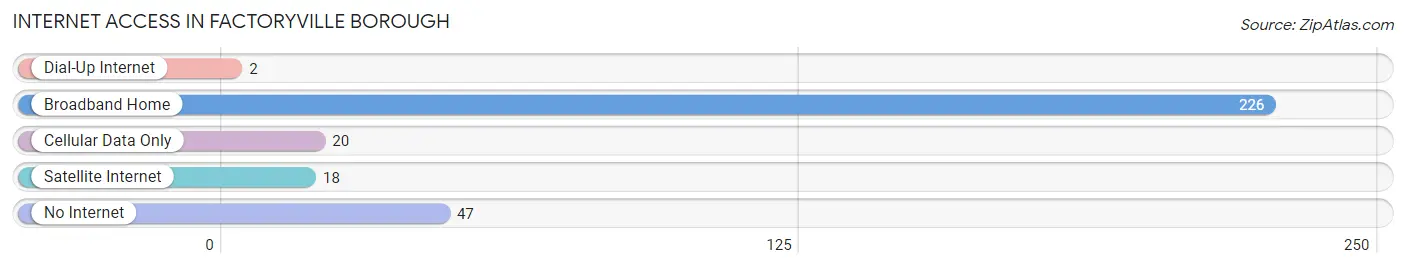
| Internet Type | # Households | % Households |
| Dial-Up Internet | 2 | 0.6% |
| Broadband Home | 226 | 73.9% |
| Cellular Data Only | 20 | 6.5% |
| Satellite Internet | 18 | 5.9% |
| No Internet | 47 | 15.4% |
| Total | 306 | 100.0% |
Factoryville borough Summary
Introduction
Factoryville Borough is a small borough located in Lackawanna County, Pennsylvania. It is situated in the Endless Mountains region of the state, and is part of the Scranton–Wilkes-Barre–Hazleton Metropolitan Statistical Area. The borough was incorporated in 1851 and has a population of 1,845 as of the 2010 census.
History
The area that is now Factoryville Borough was first settled in the late 1700s by a group of German immigrants. The area was originally known as “Factoryville” due to the numerous factories that were built in the area. The first factory was built in 1820 and was used to manufacture woolen goods. The factory was owned by the Factoryville Manufacturing Company, which was founded by William and John Factory.
The Factoryville Manufacturing Company was the first industry in the area and it helped to spur the growth of the borough. The company was successful and it helped to attract other businesses to the area. By the mid-1800s, the borough had become a thriving industrial center.
In 1851, the borough was officially incorporated as Factoryville Borough. The borough was named after the Factoryville Manufacturing Company, which was the first industry in the area.
Geography
Factoryville Borough is located in the Endless Mountains region of Pennsylvania. It is situated in Lackawanna County, and is part of the Scranton–Wilkes-Barre–Hazleton Metropolitan Statistical Area. The borough is located at an elevation of 1,072 feet (326 m) above sea level.
The borough is located in the northern part of Lackawanna County, and is bordered by Dalton Township to the north, Benton Township to the east, La Plume Township to the south, and Nicholson Township to the west. The borough is located approximately 10 miles (16 km) north of Scranton and approximately 20 miles (32 km) south of Binghamton, New York.
Economy
The economy of Factoryville Borough is largely based on manufacturing and retail. The borough is home to several factories, including the Factoryville Manufacturing Company, which is the oldest factory in the borough. The company manufactures woolen goods and has been in operation since 1820.
The borough is also home to several retail stores, including a grocery store, a hardware store, and a pharmacy. The borough also has several restaurants, including a pizza shop, a diner, and a Chinese restaurant.
Demographics
As of the 2010 census, the population of Factoryville Borough was 1,845. The racial makeup of the borough was 97.3% White, 0.7% African American, 0.2% Native American, 0.3% Asian, 0.2% from other races, and 1.3% from two or more races. Hispanic or Latino of any race were 1.2% of the population.
The median household income in Factoryville Borough was $45,938, and the median family income was $51,250. The per capita income for the borough was $20,945. About 8.3% of families and 10.2% of the population were below the poverty line, including 14.2% of those under age 18 and 6.2% of those age 65 or over.
Conclusion
Factoryville Borough is a small borough located in Lackawanna County, Pennsylvania. It is situated in the Endless Mountains region of the state, and is part of the Scranton–Wilkes-Barre–Hazleton Metropolitan Statistical Area. The borough was incorporated in 1851 and has a population of 1,845 as of the 2010 census. The economy of Factoryville Borough is largely based on manufacturing and retail, and the borough is home to several factories and retail stores. The racial makeup of the borough is predominantly White, with a small percentage of African American, Native American, and Asian residents. The median household income in Factoryville Borough is $45,938, and the per capita income is $20,945.
Common Questions
What is Per Capita Income in Factoryville borough?
Per Capita income in Factoryville borough is $17,514.
What is the Median Family Income in Factoryville borough?
Median Family Income in Factoryville borough is $93,000.
What is the Median Household income in Factoryville borough?
Median Household Income in Factoryville borough is $54,375.
What is Inequality or Gini Index in Factoryville borough?
Inequality or Gini Index in Factoryville borough is 0.43.
What is the Total Population of Factoryville borough?
Total Population of Factoryville borough is 1,224.
What is the Total Male Population of Factoryville borough?
Total Male Population of Factoryville borough is 526.
What is the Total Female Population of Factoryville borough?
Total Female Population of Factoryville borough is 698.
What is the Ratio of Males per 100 Females in Factoryville borough?
There are 75.36 Males per 100 Females in Factoryville borough.
What is the Ratio of Females per 100 Males in Factoryville borough?
There are 132.70 Females per 100 Males in Factoryville borough.
What is the Median Population Age in Factoryville borough?
Median Population Age in Factoryville borough is 21.3 Years.
What is the Average Family Size in Factoryville borough
Average Family Size in Factoryville borough is 3.5 People.
What is the Average Household Size in Factoryville borough
Average Household Size in Factoryville borough is 2.5 People.
How Large is the Labor Force in Factoryville borough?
There are 447 People in the Labor Forcein in Factoryville borough.
What is the Percentage of People in the Labor Force in Factoryville borough?
44.6% of People are in the Labor Force in Factoryville borough.
What is the Unemployment Rate in Factoryville borough?
Unemployment Rate in Factoryville borough is 17.0%.