Mifflinburg borough, PA Map & Demographics
Mifflinburg borough Overview
$32,492
PER CAPITA INCOME
$76,466
AVG FAMILY INCOME
$64,104
AVG HOUSEHOLD INCOME
41.4%
WAGE / INCOME GAP [ % ]
58.6¢/ $1
WAGE / INCOME GAP [ $ ]
0.36
INEQUALITY / GINI INDEX
3,479
TOTAL POPULATION
1,843
MALE POPULATION
1,636
FEMALE POPULATION
112.65
MALES / 100 FEMALES
88.77
FEMALES / 100 MALES
40.0
MEDIAN AGE
3.0
AVG FAMILY SIZE
2.4
AVG HOUSEHOLD SIZE
1,875
LABOR FORCE [ PEOPLE ]
68.0%
PERCENT IN LABOR FORCE
3.1%
UNEMPLOYMENT RATE
Income in Mifflinburg borough
Income Overview in Mifflinburg borough
Per Capita Income in Mifflinburg borough is $32,492, while median incomes of families and households are $76,466 and $64,104 respectively.
| Characteristic | Number | Measure |
| Per Capita Income | 3,479 | $32,492 |
| Median Family Income | 912 | $76,466 |
| Mean Family Income | 912 | $87,370 |
| Median Household Income | 1,423 | $64,104 |
| Mean Household Income | 1,423 | $75,632 |
| Income Deficit | 912 | $0 |
| Wage / Income Gap (%) | 3,479 | 41.40% |
| Wage / Income Gap ($) | 3,479 | 58.60¢ per $1 |
| Gini / Inequality Index | 3,479 | 0.36 |
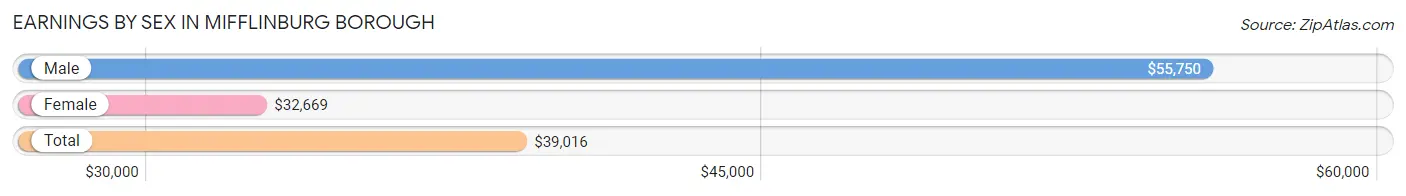
Earnings by Sex in Mifflinburg borough
Average Earnings in Mifflinburg borough are $39,016, $55,750 for men and $32,669 for women, a difference of 41.4%.
| Sex | Number | Average Earnings |
| Male | 1,032 (52.3%) | $55,750 |
| Female | 941 (47.7%) | $32,669 |
| Total | 1,973 (100.0%) | $39,016 |
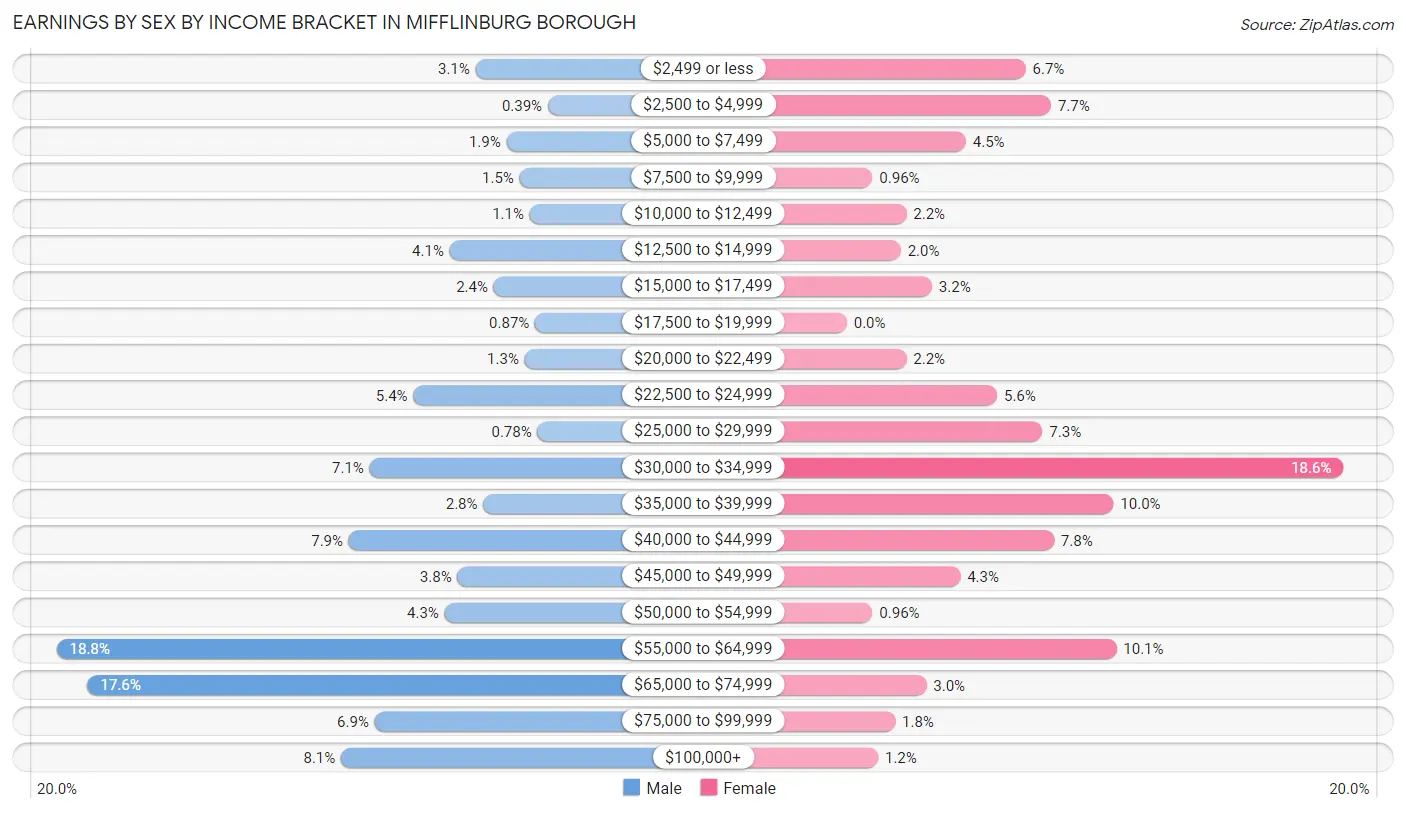
Earnings by Sex by Income Bracket in Mifflinburg borough
The most common earnings brackets in Mifflinburg borough are $55,000 to $64,999 for men (194 | 18.8%) and $30,000 to $34,999 for women (175 | 18.6%).
| Income | Male | Female |
| $2,499 or less | 32 (3.1%) | 63 (6.7%) |
| $2,500 to $4,999 | 4 (0.4%) | 72 (7.6%) |
| $5,000 to $7,499 | 20 (1.9%) | 42 (4.5%) |
| $7,500 to $9,999 | 15 (1.5%) | 9 (1.0%) |
| $10,000 to $12,499 | 11 (1.1%) | 21 (2.2%) |
| $12,500 to $14,999 | 42 (4.1%) | 19 (2.0%) |
| $15,000 to $17,499 | 25 (2.4%) | 30 (3.2%) |
| $17,500 to $19,999 | 9 (0.9%) | 0 (0.0%) |
| $20,000 to $22,499 | 13 (1.3%) | 21 (2.2%) |
| $22,500 to $24,999 | 56 (5.4%) | 53 (5.6%) |
| $25,000 to $29,999 | 8 (0.8%) | 69 (7.3%) |
| $30,000 to $34,999 | 73 (7.1%) | 175 (18.6%) |
| $35,000 to $39,999 | 29 (2.8%) | 94 (10.0%) |
| $40,000 to $44,999 | 81 (7.9%) | 73 (7.8%) |
| $45,000 to $49,999 | 39 (3.8%) | 40 (4.3%) |
| $50,000 to $54,999 | 44 (4.3%) | 9 (1.0%) |
| $55,000 to $64,999 | 194 (18.8%) | 95 (10.1%) |
| $65,000 to $74,999 | 182 (17.6%) | 28 (3.0%) |
| $75,000 to $99,999 | 71 (6.9%) | 17 (1.8%) |
| $100,000+ | 84 (8.1%) | 11 (1.2%) |
| Total | 1,032 (100.0%) | 941 (100.0%) |
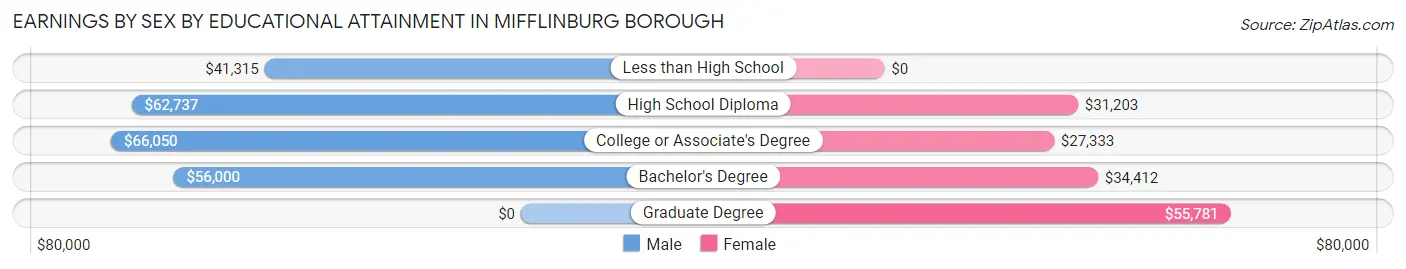
Earnings by Sex by Educational Attainment in Mifflinburg borough
Average earnings in Mifflinburg borough are $56,600 for men and $33,082 for women, a difference of 41.5%. Men with an educational attainment of college or associate's degree enjoy the highest average annual earnings of $66,050, while those with less than high school education earn the least with $41,315. Women with an educational attainment of graduate degree earn the most with the average annual earnings of $55,781, while those with college or associate's degree education have the smallest earnings of $27,333.
| Educational Attainment | Male Income | Female Income |
| Less than High School | $41,315 | $0 |
| High School Diploma | $62,737 | $31,203 |
| College or Associate's Degree | $66,050 | $27,333 |
| Bachelor's Degree | $56,000 | $34,412 |
| Graduate Degree | - | - |
| Total | $56,600 | $33,082 |
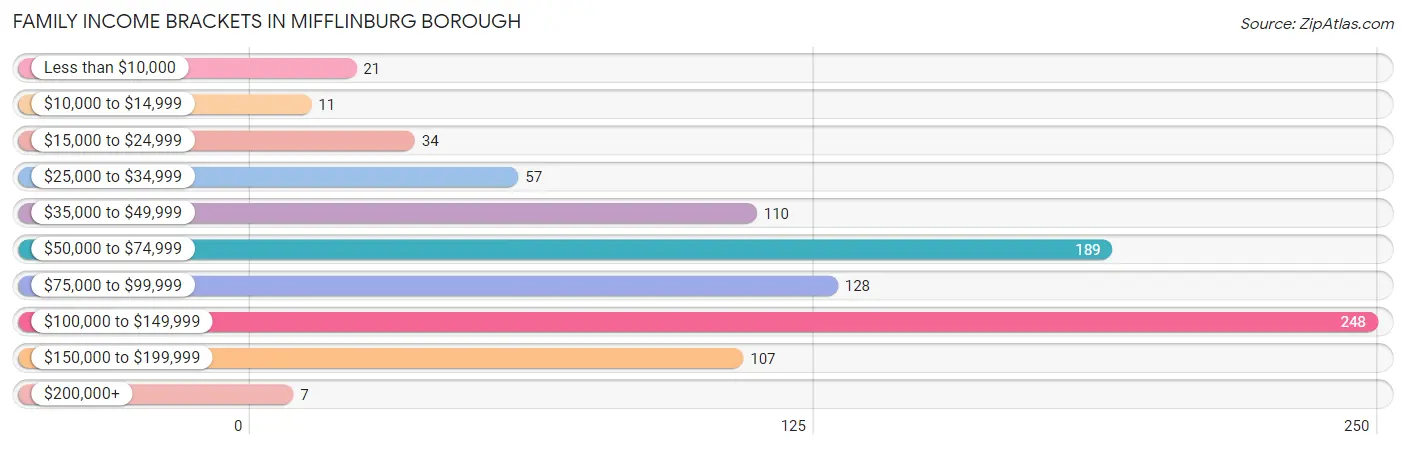
Family Income in Mifflinburg borough
Family Income Brackets in Mifflinburg borough
According to the Mifflinburg borough family income data, there are 248 families falling into the $100,000 to $149,999 income range, which is the most common income bracket and makes up 27.2% of all families. Conversely, the $200,000+ income bracket is the least frequent group with only 7 families (0.8%) belonging to this category.
| Income Bracket | # Families | % Families |
| Less than $10,000 | 21 | 2.3% |
| $10,000 to $14,999 | 11 | 1.2% |
| $15,000 to $24,999 | 34 | 3.7% |
| $25,000 to $34,999 | 57 | 6.3% |
| $35,000 to $49,999 | 110 | 12.1% |
| $50,000 to $74,999 | 189 | 20.7% |
| $75,000 to $99,999 | 128 | 14.0% |
| $100,000 to $149,999 | 248 | 27.2% |
| $150,000 to $199,999 | 107 | 11.7% |
| $200,000+ | 7 | 0.8% |
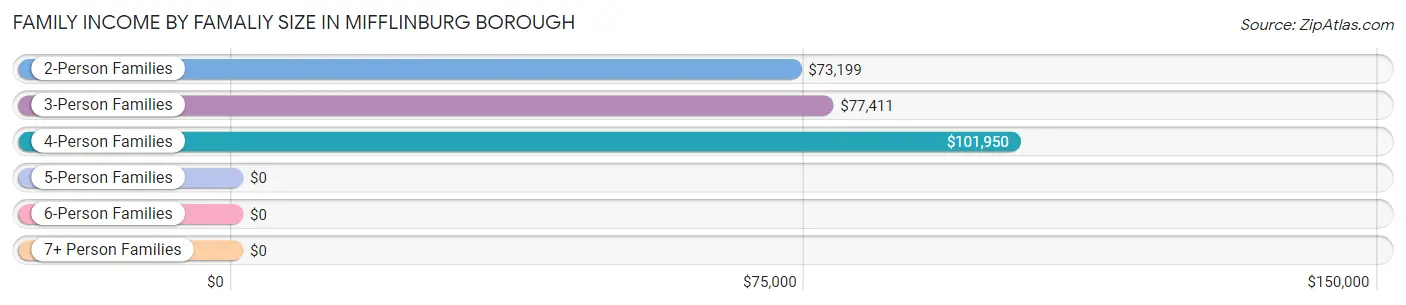
Family Income by Famaliy Size in Mifflinburg borough
4-person families (135 | 14.8%) account for the highest median family income in Mifflinburg borough with $101,950 per family, while 2-person families (471 | 51.6%) have the highest median income of $36,600 per family member.
| Income Bracket | # Families | Median Income |
| 2-Person Families | 471 (51.6%) | $73,199 |
| 3-Person Families | 239 (26.2%) | $77,411 |
| 4-Person Families | 135 (14.8%) | $101,950 |
| 5-Person Families | 67 (7.3%) | $0 |
| 6-Person Families | 0 (0.0%) | $0 |
| 7+ Person Families | 0 (0.0%) | $0 |
| Total | 912 (100.0%) | $76,466 |
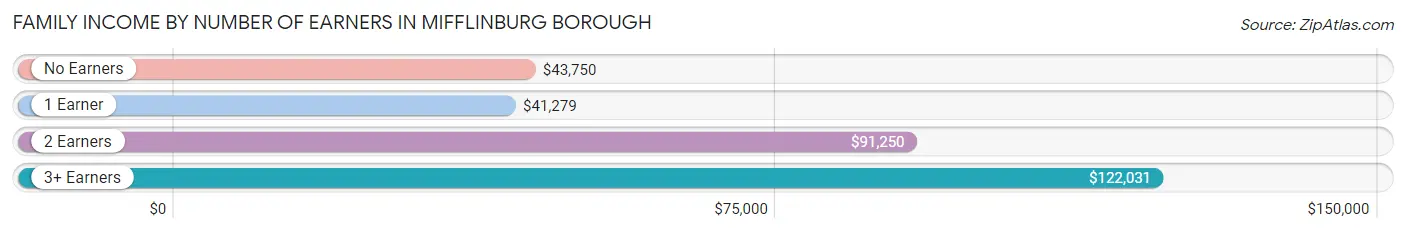
Family Income by Number of Earners in Mifflinburg borough
The median family income in Mifflinburg borough is $76,466, with families comprising 3+ earners (100) having the highest median family income of $122,031, while families with 1 earner (240) have the lowest median family income of $41,279, accounting for 11.0% and 26.3% of families, respectively.
| Number of Earners | # Families | Median Income |
| No Earners | 115 (12.6%) | $43,750 |
| 1 Earner | 240 (26.3%) | $41,279 |
| 2 Earners | 457 (50.1%) | $91,250 |
| 3+ Earners | 100 (11.0%) | $122,031 |
| Total | 912 (100.0%) | $76,466 |
Household Income in Mifflinburg borough
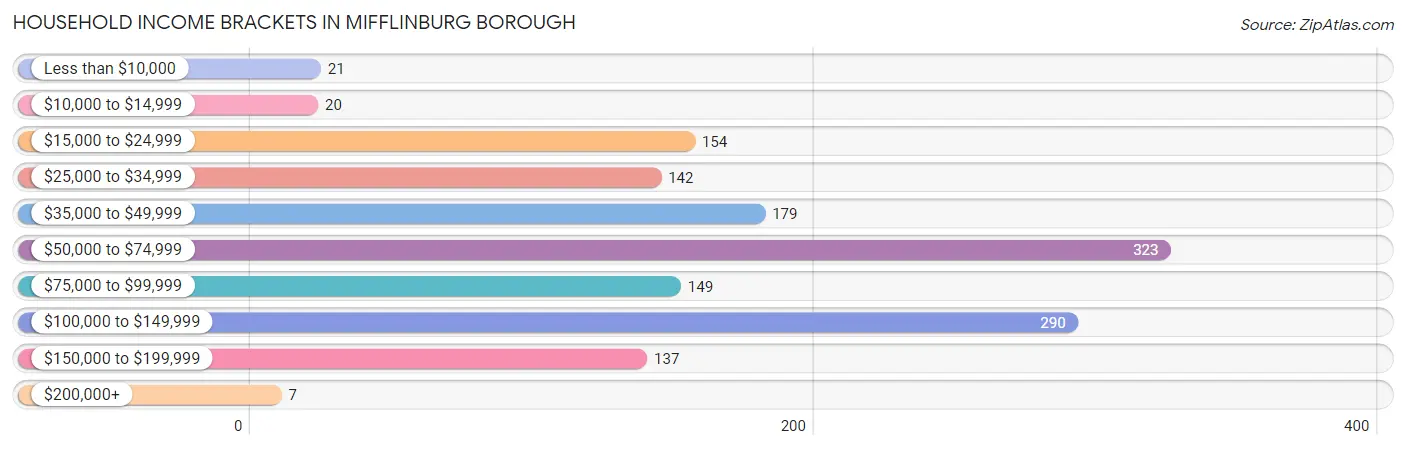
Household Income Brackets in Mifflinburg borough
With 323 households falling in the category, the $50,000 to $74,999 income range is the most frequent in Mifflinburg borough, accounting for 22.7% of all households. In contrast, only 7 households (0.5%) fall into the $200,000+ income bracket, making it the least populous group.
| Income Bracket | # Households | % Households |
| Less than $10,000 | 21 | 1.5% |
| $10,000 to $14,999 | 20 | 1.4% |
| $15,000 to $24,999 | 154 | 10.8% |
| $25,000 to $34,999 | 142 | 10.0% |
| $35,000 to $49,999 | 179 | 12.6% |
| $50,000 to $74,999 | 323 | 22.7% |
| $75,000 to $99,999 | 149 | 10.5% |
| $100,000 to $149,999 | 290 | 20.4% |
| $150,000 to $199,999 | 137 | 9.6% |
| $200,000+ | 7 | 0.5% |
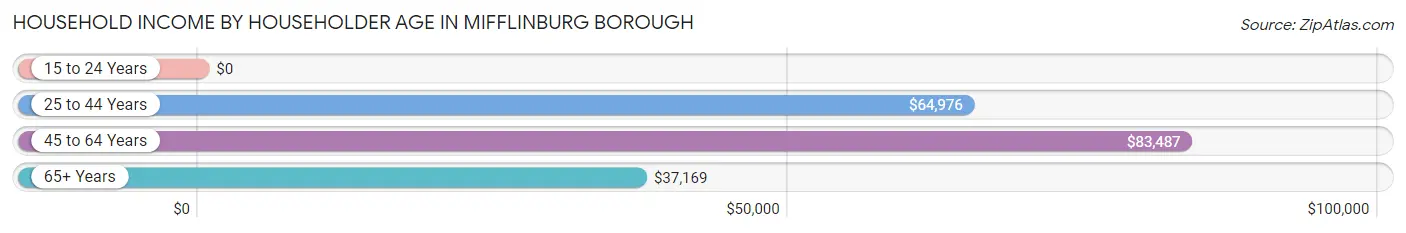
Household Income by Householder Age in Mifflinburg borough
The median household income in Mifflinburg borough is $64,104, with the highest median household income of $83,487 found in the 45 to 64 years age bracket for the primary householder. A total of 539 households (37.9%) fall into this category. Meanwhile, the 15 to 24 years age bracket for the primary householder has the lowest median household income of $0, with 48 households (3.4%) in this group.
| Income Bracket | # Households | Median Income |
| 15 to 24 Years | 48 (3.4%) | $0 |
| 25 to 44 Years | 383 (26.9%) | $64,976 |
| 45 to 64 Years | 539 (37.9%) | $83,487 |
| 65+ Years | 453 (31.8%) | $37,169 |
| Total | 1,423 (100.0%) | $64,104 |
Poverty in Mifflinburg borough
Income Below Poverty by Sex and Age in Mifflinburg borough
With 2.8% poverty level for males and 6.4% for females among the residents of Mifflinburg borough, 75 year old and over males and 16 and 17 year old females are the most vulnerable to poverty, with 20 males (21.0%) and 13 females (34.2%) in their respective age groups living below the poverty level.
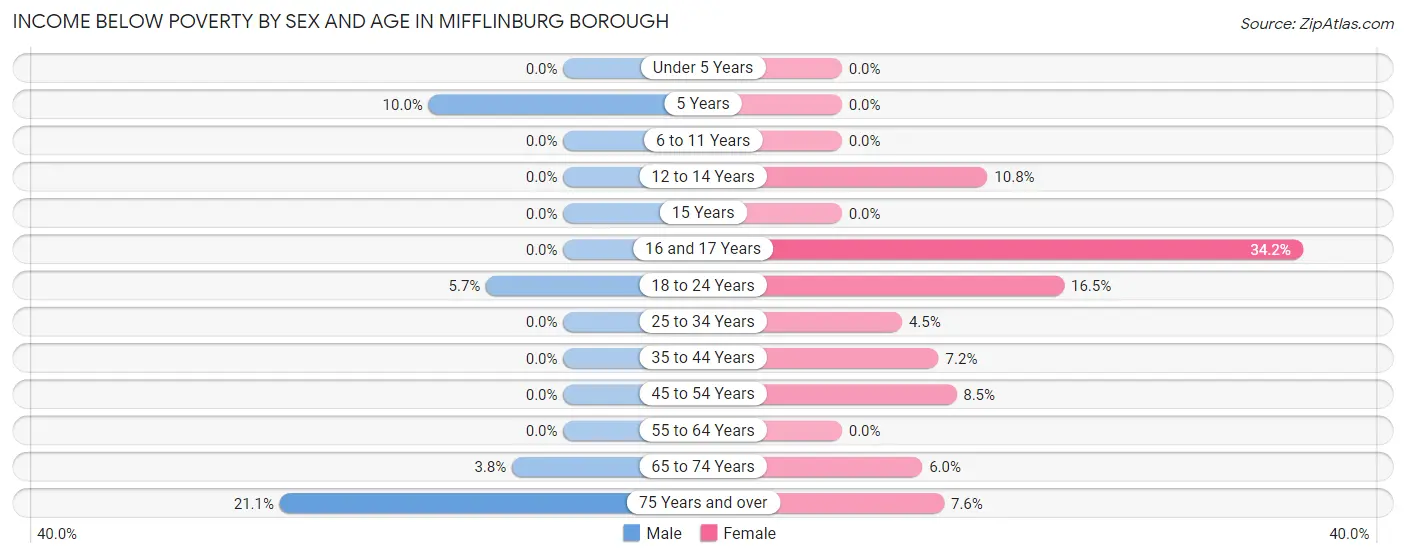
| Age Bracket | Male | Female |
| Under 5 Years | 0 (0.0%) | 0 (0.0%) |
| 5 Years | 12 (10.0%) | 0 (0.0%) |
| 6 to 11 Years | 0 (0.0%) | 0 (0.0%) |
| 12 to 14 Years | 0 (0.0%) | 8 (10.8%) |
| 15 Years | 0 (0.0%) | 0 (0.0%) |
| 16 and 17 Years | 0 (0.0%) | 13 (34.2%) |
| 18 to 24 Years | 11 (5.7%) | 17 (16.5%) |
| 25 to 34 Years | 0 (0.0%) | 11 (4.5%) |
| 35 to 44 Years | 0 (0.0%) | 10 (7.2%) |
| 45 to 54 Years | 0 (0.0%) | 17 (8.5%) |
| 55 to 64 Years | 0 (0.0%) | 0 (0.0%) |
| 65 to 74 Years | 8 (3.8%) | 16 (6.0%) |
| 75 Years and over | 20 (21.0%) | 12 (7.6%) |
| Total | 51 (2.8%) | 104 (6.4%) |
Income Above Poverty by Sex and Age in Mifflinburg borough
According to the poverty statistics in Mifflinburg borough, males aged under 5 years and females aged under 5 years are the age groups that are most secure financially, with 100.0% of males and 100.0% of females in these age groups living above the poverty line.
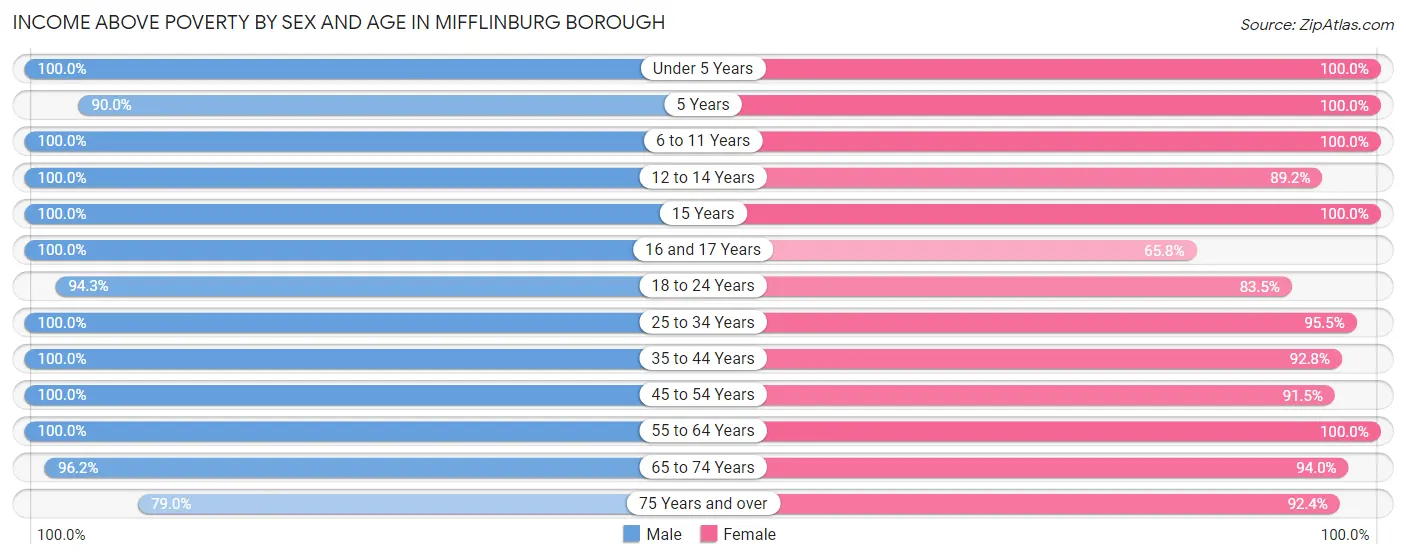
| Age Bracket | Male | Female |
| Under 5 Years | 127 (100.0%) | 16 (100.0%) |
| 5 Years | 108 (90.0%) | 21 (100.0%) |
| 6 to 11 Years | 118 (100.0%) | 126 (100.0%) |
| 12 to 14 Years | 30 (100.0%) | 66 (89.2%) |
| 15 Years | 38 (100.0%) | 10 (100.0%) |
| 16 and 17 Years | 33 (100.0%) | 25 (65.8%) |
| 18 to 24 Years | 181 (94.3%) | 86 (83.5%) |
| 25 to 34 Years | 312 (100.0%) | 235 (95.5%) |
| 35 to 44 Years | 77 (100.0%) | 129 (92.8%) |
| 45 to 54 Years | 154 (100.0%) | 183 (91.5%) |
| 55 to 64 Years | 295 (100.0%) | 237 (100.0%) |
| 65 to 74 Years | 202 (96.2%) | 252 (94.0%) |
| 75 Years and over | 75 (78.9%) | 146 (92.4%) |
| Total | 1,750 (97.2%) | 1,532 (93.6%) |
Income Below Poverty Among Married-Couple Families in Mifflinburg borough
The poverty statistics for married-couple families in Mifflinburg borough show that 3.6% or 28 of the total 777 families live below the poverty line. Families with no children have the highest poverty rate of 5.1%, comprising of 28 families. On the other hand, families with 1 or 2 children have the lowest poverty rate of 0.0%, which includes 0 families.
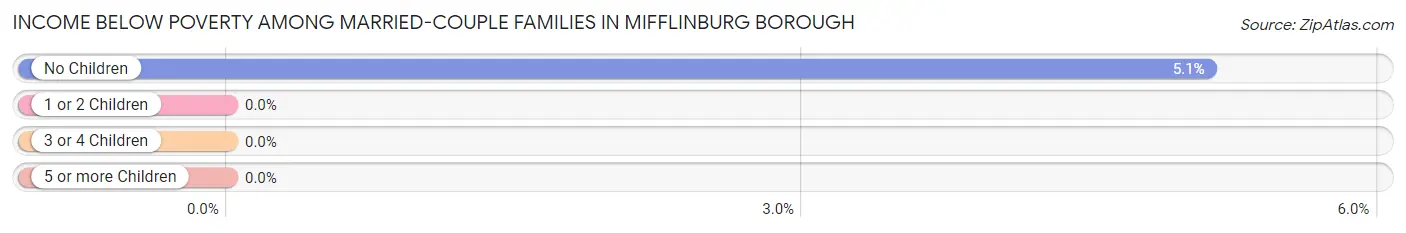
| Children | Above Poverty | Below Poverty |
| No Children | 520 (94.9%) | 28 (5.1%) |
| 1 or 2 Children | 178 (100.0%) | 0 (0.0%) |
| 3 or 4 Children | 51 (100.0%) | 0 (0.0%) |
| 5 or more Children | 0 (0.0%) | 0 (0.0%) |
| Total | 749 (96.4%) | 28 (3.6%) |
Income Below Poverty Among Single-Parent Households in Mifflinburg borough
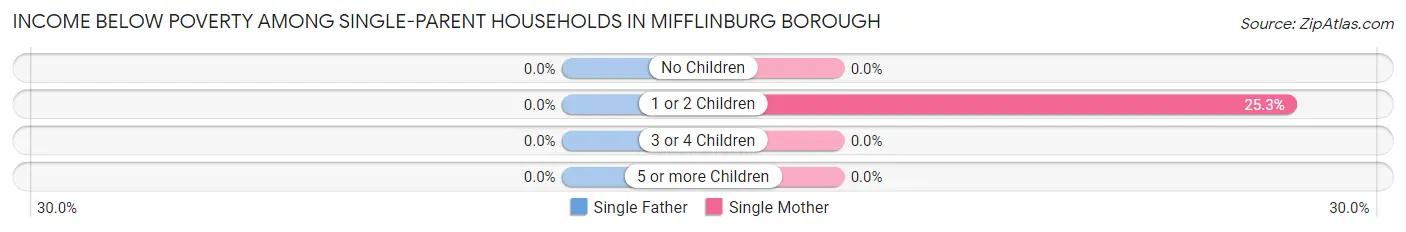
| Children | Single Father | Single Mother |
| No Children | 0 (0.0%) | 0 (0.0%) |
| 1 or 2 Children | 0 (0.0%) | 21 (25.3%) |
| 3 or 4 Children | 0 (0.0%) | 0 (0.0%) |
| 5 or more Children | 0 (0.0%) | 0 (0.0%) |
| Total | 0 (0.0%) | 21 (22.8%) |
Income Below Poverty Among Married-Couple vs Single-Parent Households in Mifflinburg borough
The poverty data for Mifflinburg borough shows that 28 of the married-couple family households (3.6%) and 21 of the single-parent households (15.6%) are living below the poverty level. Within the married-couple family households, those with no children have the highest poverty rate, with 28 households (5.1%) falling below the poverty line. Among the single-parent households, those with 1 or 2 children have the highest poverty rate, with 21 household (19.8%) living below poverty.
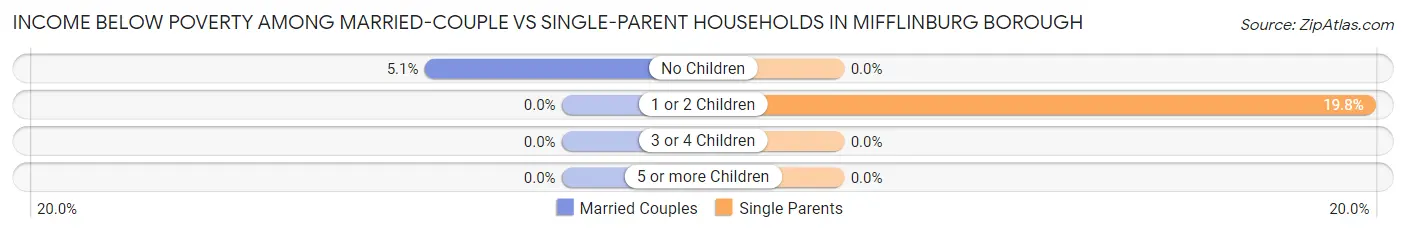
| Children | Married-Couple Families | Single-Parent Households |
| No Children | 28 (5.1%) | 0 (0.0%) |
| 1 or 2 Children | 0 (0.0%) | 21 (19.8%) |
| 3 or 4 Children | 0 (0.0%) | 0 (0.0%) |
| 5 or more Children | 0 (0.0%) | 0 (0.0%) |
| Total | 28 (3.6%) | 21 (15.6%) |
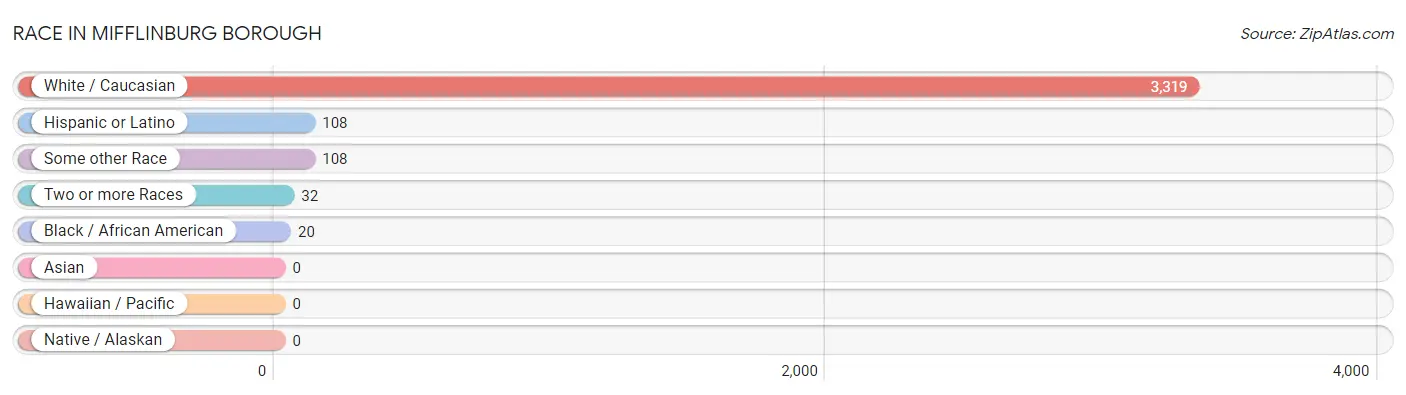
Race in Mifflinburg borough
The most populous races in Mifflinburg borough are White / Caucasian (3,319 | 95.4%), Hispanic or Latino (108 | 3.1%), and Some other Race (108 | 3.1%).
| Race | # Population | % Population |
| Asian | 0 | 0.0% |
| Black / African American | 20 | 0.6% |
| Hawaiian / Pacific | 0 | 0.0% |
| Hispanic or Latino | 108 | 3.1% |
| Native / Alaskan | 0 | 0.0% |
| White / Caucasian | 3,319 | 95.4% |
| Two or more Races | 32 | 0.9% |
| Some other Race | 108 | 3.1% |
| Total | 3,479 | 100.0% |
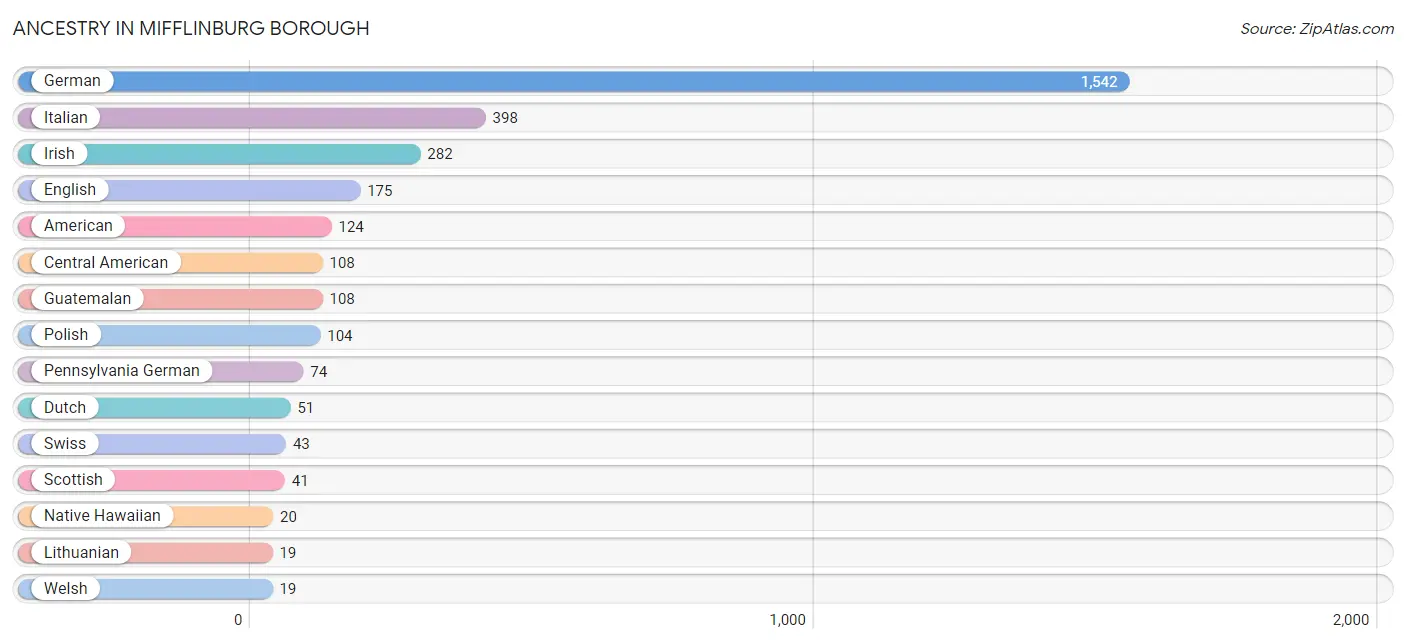
Ancestry in Mifflinburg borough
The most populous ancestries reported in Mifflinburg borough are German (1,542 | 44.3%), Italian (398 | 11.4%), Irish (282 | 8.1%), English (175 | 5.0%), and American (124 | 3.6%), together accounting for 72.5% of all Mifflinburg borough residents.
| Ancestry | # Population | % Population |
| American | 124 | 3.6% |
| British | 16 | 0.5% |
| Central American | 108 | 3.1% |
| Czechoslovakian | 6 | 0.2% |
| Danish | 10 | 0.3% |
| Dutch | 51 | 1.5% |
| Eastern European | 9 | 0.3% |
| English | 175 | 5.0% |
| European | 5 | 0.1% |
| French | 12 | 0.3% |
| German | 1,542 | 44.3% |
| Guatemalan | 108 | 3.1% |
| Hungarian | 6 | 0.2% |
| Irish | 282 | 8.1% |
| Italian | 398 | 11.4% |
| Lithuanian | 19 | 0.5% |
| Native Hawaiian | 20 | 0.6% |
| Pennsylvania German | 74 | 2.1% |
| Polish | 104 | 3.0% |
| Scotch-Irish | 17 | 0.5% |
| Scottish | 41 | 1.2% |
| Slovak | 14 | 0.4% |
| Swedish | 11 | 0.3% |
| Swiss | 43 | 1.2% |
| Turkish | 12 | 0.3% |
| Ukrainian | 11 | 0.3% |
| Welsh | 19 | 0.5% | View All 27 Rows |
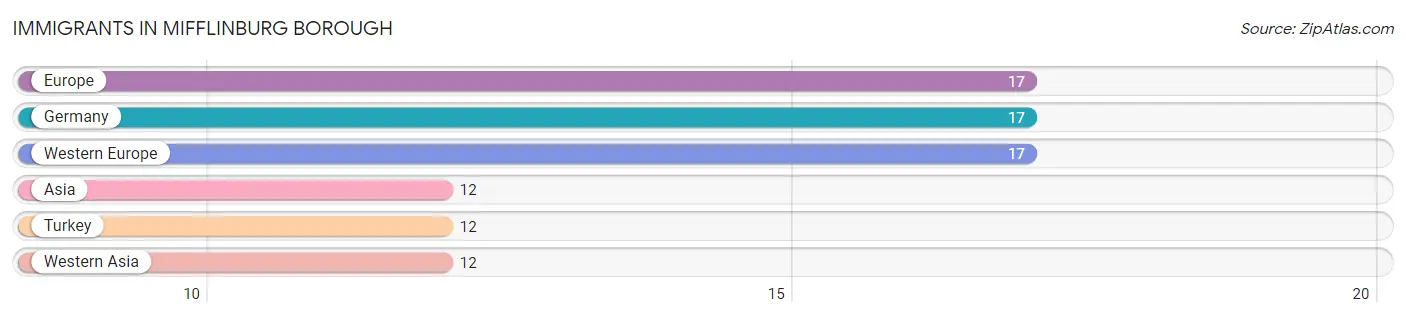
Immigrants in Mifflinburg borough
The most numerous immigrant groups reported in Mifflinburg borough came from Europe (17 | 0.5%), Germany (17 | 0.5%), Western Europe (17 | 0.5%), Asia (12 | 0.3%), and Turkey (12 | 0.3%), together accounting for 2.1% of all Mifflinburg borough residents.
| Immigration Origin | # Population | % Population |
| Asia | 12 | 0.3% |
| Europe | 17 | 0.5% |
| Germany | 17 | 0.5% |
| Turkey | 12 | 0.3% |
| Western Asia | 12 | 0.3% |
| Western Europe | 17 | 0.5% | View All 6 Rows |
Sex and Age in Mifflinburg borough
Sex and Age in Mifflinburg borough
The most populous age groups in Mifflinburg borough are 55 to 59 Years (210 | 11.4%) for men and 30 to 34 Years (199 | 12.2%) for women.
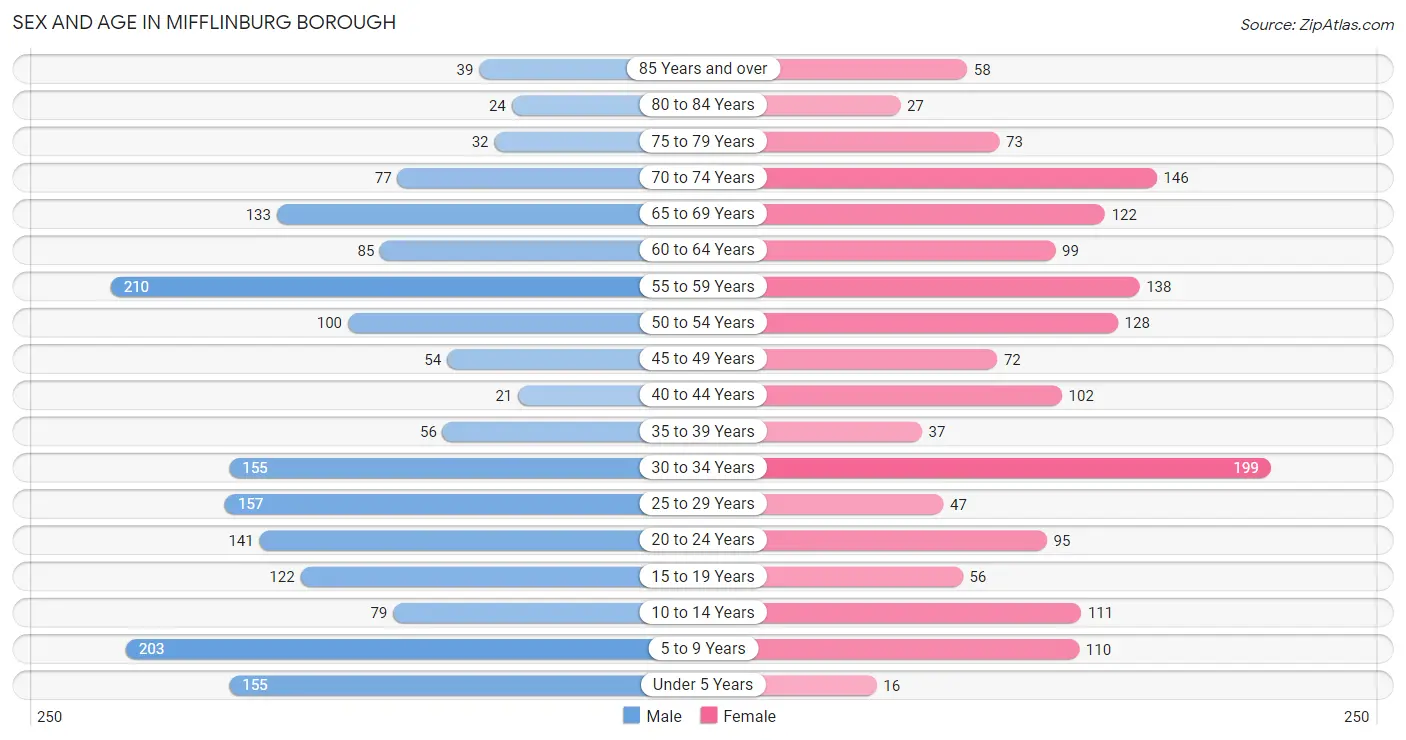
| Age Bracket | Male | Female |
| Under 5 Years | 155 (8.4%) | 16 (1.0%) |
| 5 to 9 Years | 203 (11.0%) | 110 (6.7%) |
| 10 to 14 Years | 79 (4.3%) | 111 (6.8%) |
| 15 to 19 Years | 122 (6.6%) | 56 (3.4%) |
| 20 to 24 Years | 141 (7.6%) | 95 (5.8%) |
| 25 to 29 Years | 157 (8.5%) | 47 (2.9%) |
| 30 to 34 Years | 155 (8.4%) | 199 (12.2%) |
| 35 to 39 Years | 56 (3.0%) | 37 (2.3%) |
| 40 to 44 Years | 21 (1.1%) | 102 (6.2%) |
| 45 to 49 Years | 54 (2.9%) | 72 (4.4%) |
| 50 to 54 Years | 100 (5.4%) | 128 (7.8%) |
| 55 to 59 Years | 210 (11.4%) | 138 (8.4%) |
| 60 to 64 Years | 85 (4.6%) | 99 (6.0%) |
| 65 to 69 Years | 133 (7.2%) | 122 (7.5%) |
| 70 to 74 Years | 77 (4.2%) | 146 (8.9%) |
| 75 to 79 Years | 32 (1.7%) | 73 (4.5%) |
| 80 to 84 Years | 24 (1.3%) | 27 (1.7%) |
| 85 Years and over | 39 (2.1%) | 58 (3.5%) |
| Total | 1,843 (100.0%) | 1,636 (100.0%) |
Families and Households in Mifflinburg borough
Median Family Size in Mifflinburg borough
The median family size in Mifflinburg borough is 3.00 persons per family, with married-couple families (777 | 85.2%) accounting for the largest median family size of 3.06 persons per family. On the other hand, single male/father families (43 | 4.7%) represent the smallest median family size with 2.53 persons per family.
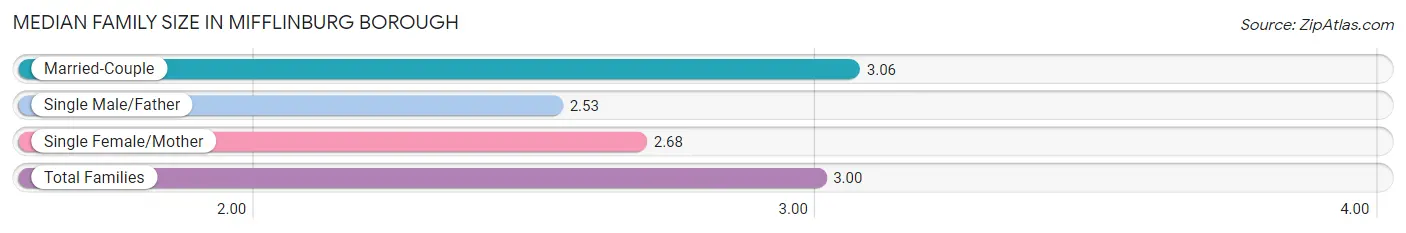
| Family Type | # Families | Family Size |
| Married-Couple | 777 (85.2%) | 3.06 |
| Single Male/Father | 43 (4.7%) | 2.53 |
| Single Female/Mother | 92 (10.1%) | 2.68 |
| Total Families | 912 (100.0%) | 3.00 |
Median Household Size in Mifflinburg borough
The median household size in Mifflinburg borough is 2.44 persons per household, with single female/mother households (92 | 6.5%) accounting for the largest median household size of 3.16 persons per household. non-family households (511 | 35.9%) represent the smallest median household size with 1.28 persons per household.
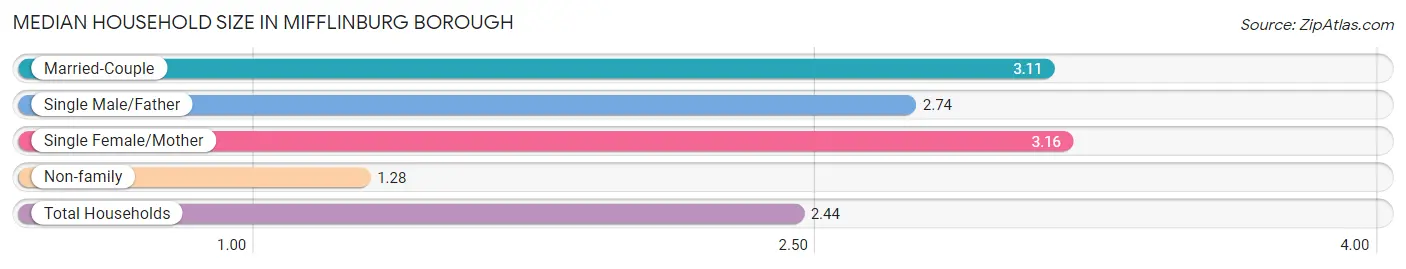
| Household Type | # Households | Household Size |
| Married-Couple | 777 (54.6%) | 3.11 |
| Single Male/Father | 43 (3.0%) | 2.74 |
| Single Female/Mother | 92 (6.5%) | 3.16 |
| Non-family | 511 (35.9%) | 1.28 |
| Total Households | 1,423 (100.0%) | 2.44 |
Household Size by Marriage Status in Mifflinburg borough
Out of a total of 1,423 households in Mifflinburg borough, 912 (64.1%) are family households, while 511 (35.9%) are nonfamily households. The most numerous type of family households are 2-person households, comprising 428, and the most common type of nonfamily households are 1-person households, comprising 438.
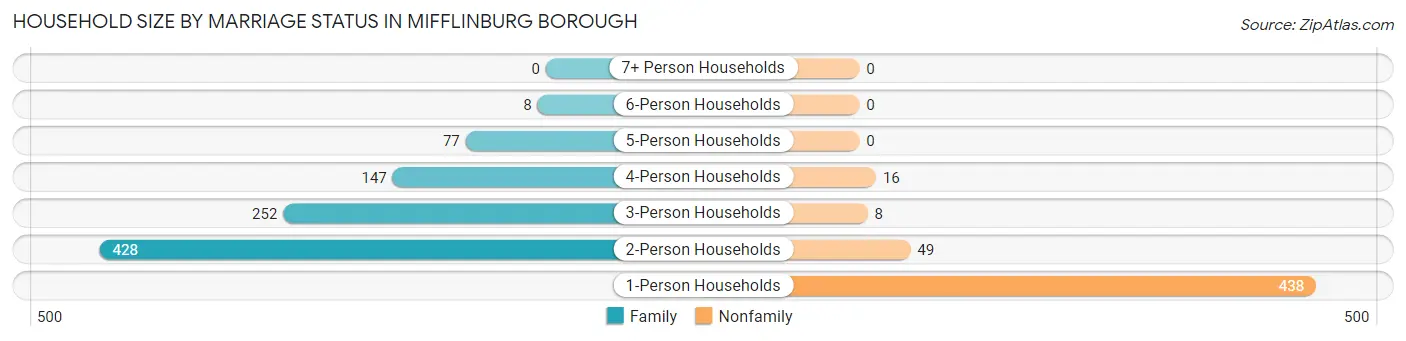
| Household Size | Family Households | Nonfamily Households |
| 1-Person Households | - | 438 (30.8%) |
| 2-Person Households | 428 (30.1%) | 49 (3.4%) |
| 3-Person Households | 252 (17.7%) | 8 (0.6%) |
| 4-Person Households | 147 (10.3%) | 16 (1.1%) |
| 5-Person Households | 77 (5.4%) | 0 (0.0%) |
| 6-Person Households | 8 (0.6%) | 0 (0.0%) |
| 7+ Person Households | 0 (0.0%) | 0 (0.0%) |
| Total | 912 (64.1%) | 511 (35.9%) |
Female Fertility in Mifflinburg borough
Fertility by Age in Mifflinburg borough
Average fertility rate in Mifflinburg borough is 99.0 births per 1,000 women. Women in the age bracket of 20 to 34 years have the highest fertility rate with 176.0 births per 1,000 women. Women in the age bracket of 20 to 34 years acount for 100.0% of all women with births.
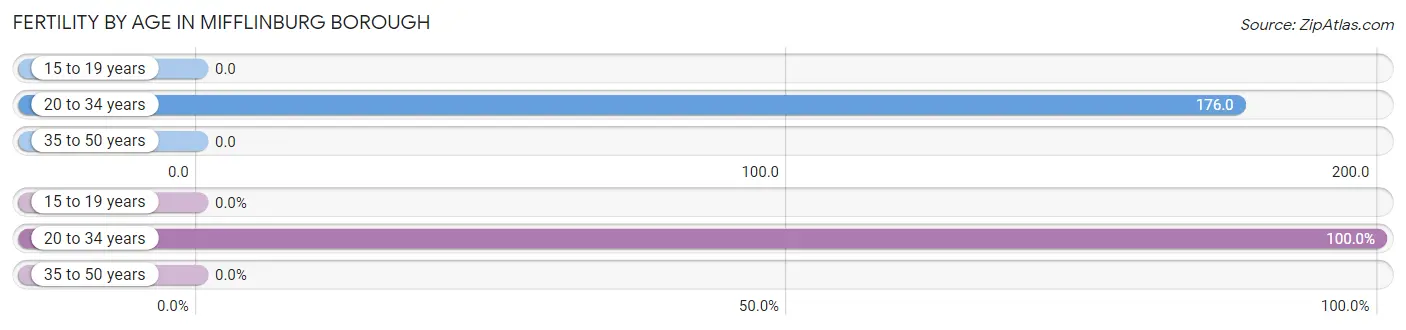
| Age Bracket | Women with Births | Births / 1,000 Women |
| 15 to 19 years | 0 (0.0%) | 0.0 |
| 20 to 34 years | 60 (100.0%) | 176.0 |
| 35 to 50 years | 0 (0.0%) | 0.0 |
| Total | 60 (100.0%) | 99.0 |
Fertility by Age by Marriage Status in Mifflinburg borough
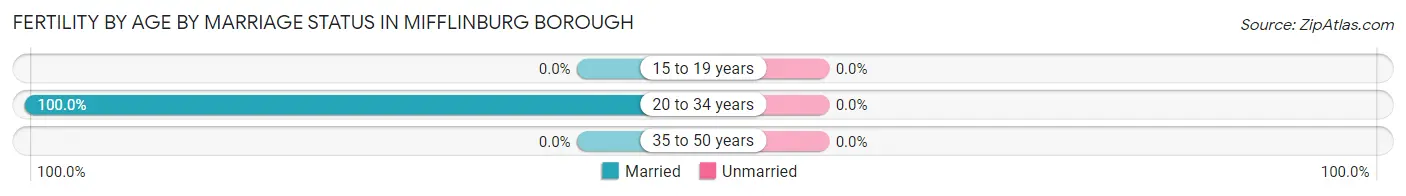
| Age Bracket | Married | Unmarried |
| 15 to 19 years | 0 (0.0%) | 0 (0.0%) |
| 20 to 34 years | 60 (100.0%) | 0 (0.0%) |
| 35 to 50 years | 0 (0.0%) | 0 (0.0%) |
| Total | 60 (100.0%) | 0 (0.0%) |
Fertility by Education in Mifflinburg borough
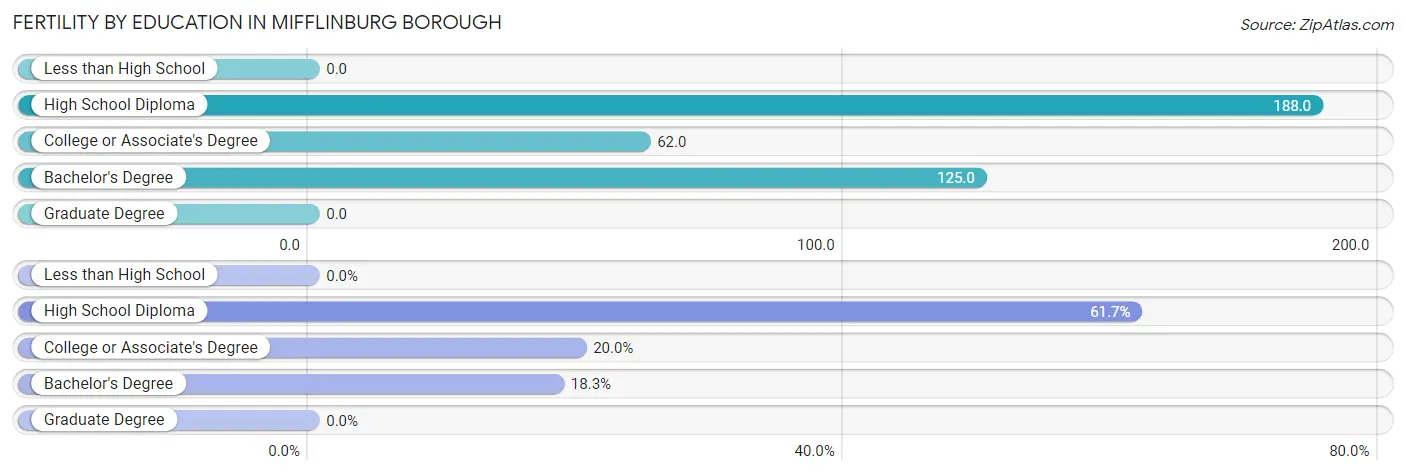
| Educational Attainment | Women with Births | Births / 1,000 Women |
| Less than High School | 0 (0.0%) | 0.0 |
| High School Diploma | 37 (61.7%) | 188.0 |
| College or Associate's Degree | 12 (20.0%) | 62.0 |
| Bachelor's Degree | 11 (18.3%) | 125.0 |
| Graduate Degree | 0 (0.0%) | 0.0 |
| Total | 60 (100.0%) | 99.0 |
Fertility by Education by Marriage Status in Mifflinburg borough
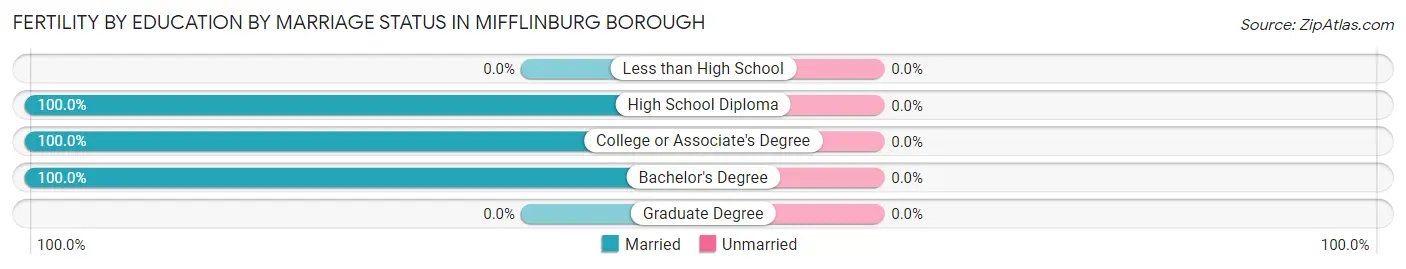
| Educational Attainment | Married | Unmarried |
| Less than High School | 0 (0.0%) | 0 (0.0%) |
| High School Diploma | 37 (100.0%) | 0 (0.0%) |
| College or Associate's Degree | 12 (100.0%) | 0 (0.0%) |
| Bachelor's Degree | 11 (100.0%) | 0 (0.0%) |
| Graduate Degree | 0 (0.0%) | 0 (0.0%) |
| Total | 60 (100.0%) | 0 (0.0%) |
Employment Characteristics in Mifflinburg borough
Employment by Class of Employer in Mifflinburg borough
Among the 1,804 employed individuals in Mifflinburg borough, private company employees (1,092 | 60.5%), not-for-profit organizations (334 | 18.5%), and self-employed (incorporated) (130 | 7.2%) make up the most common classes of employment.
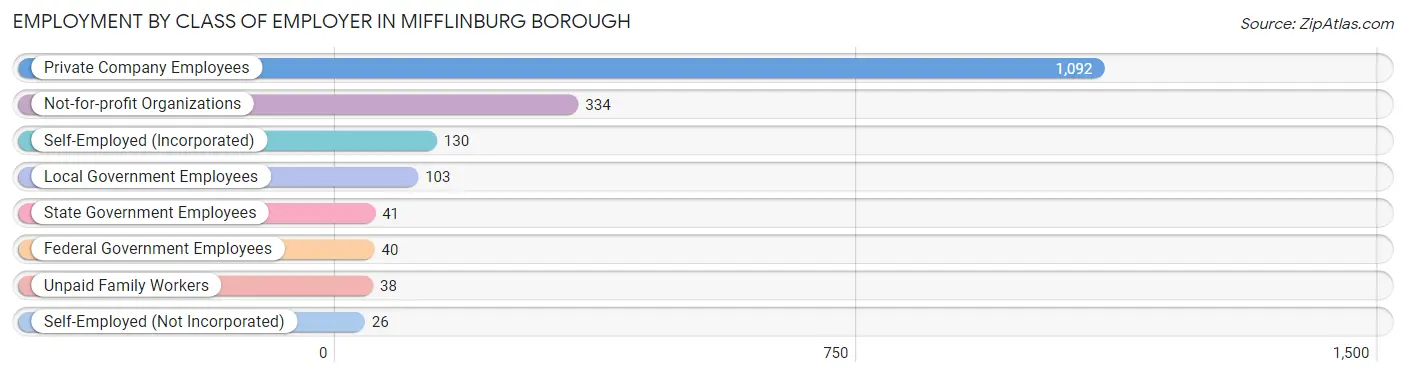
| Employer Class | # Employees | % Employees |
| Private Company Employees | 1,092 | 60.5% |
| Self-Employed (Incorporated) | 130 | 7.2% |
| Self-Employed (Not Incorporated) | 26 | 1.4% |
| Not-for-profit Organizations | 334 | 18.5% |
| Local Government Employees | 103 | 5.7% |
| State Government Employees | 41 | 2.3% |
| Federal Government Employees | 40 | 2.2% |
| Unpaid Family Workers | 38 | 2.1% |
| Total | 1,804 | 100.0% |
Employment Status by Age in Mifflinburg borough
According to the labor force statistics for Mifflinburg borough, out of the total population over 16 years of age (2,757), 68.0% or 1,875 individuals are in the labor force, with 3.1% or 58 of them unemployed. The age group with the highest labor force participation rate is 20 to 24 years, with 97.0% or 229 individuals in the labor force. Within the labor force, the 16 to 19 years age range has the highest percentage of unemployed individuals, with 25.0% or 18 of them being unemployed.
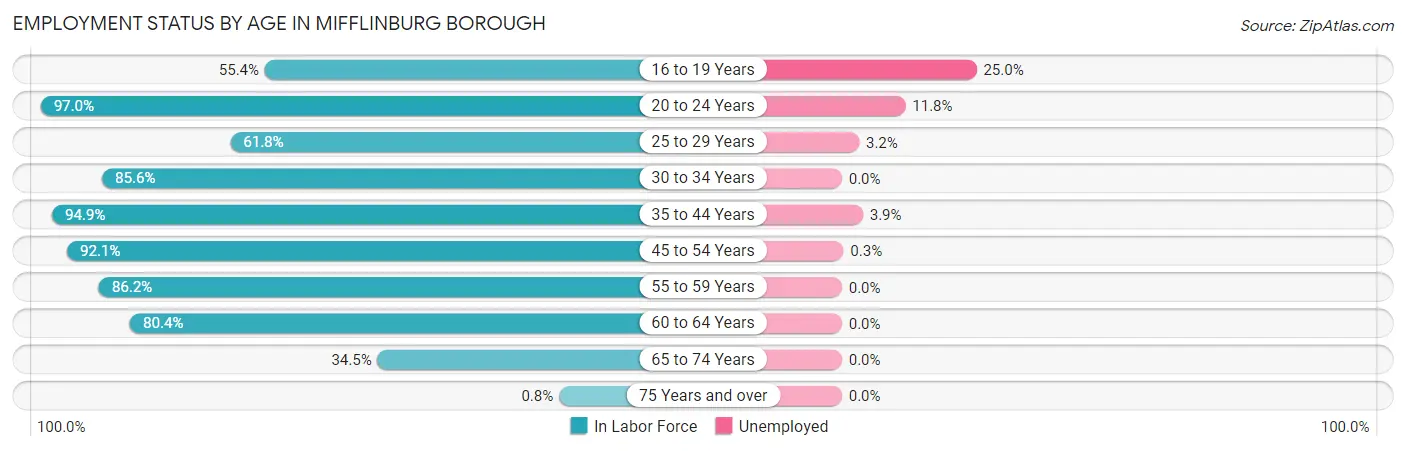
| Age Bracket | In Labor Force | Unemployed |
| 16 to 19 Years | 72 (55.4%) | 18 (25.0%) |
| 20 to 24 Years | 229 (97.0%) | 27 (11.8%) |
| 25 to 29 Years | 126 (61.8%) | 4 (3.2%) |
| 30 to 34 Years | 303 (85.6%) | 0 (0.0%) |
| 35 to 44 Years | 205 (94.9%) | 8 (3.9%) |
| 45 to 54 Years | 326 (92.1%) | 1 (0.3%) |
| 55 to 59 Years | 300 (86.2%) | 0 (0.0%) |
| 60 to 64 Years | 148 (80.4%) | 0 (0.0%) |
| 65 to 74 Years | 165 (34.5%) | 0 (0.0%) |
| 75 Years and over | 2 (0.8%) | 0 (0.0%) |
| Total | 1,875 (68.0%) | 58 (3.1%) |
Employment Status by Educational Attainment in Mifflinburg borough
According to labor force statistics for Mifflinburg borough, 84.8% of individuals (1,408) out of the total population between 25 and 64 years of age (1,660) are in the labor force, with 0.9% or 13 of them being unemployed. The group with the highest labor force participation rate are those with the educational attainment of high school diploma, with 93.4% or 683 individuals in the labor force. Within the labor force, individuals with bachelor's degree or higher education have the highest percentage of unemployment, with 2.5% or 8 of them being unemployed.
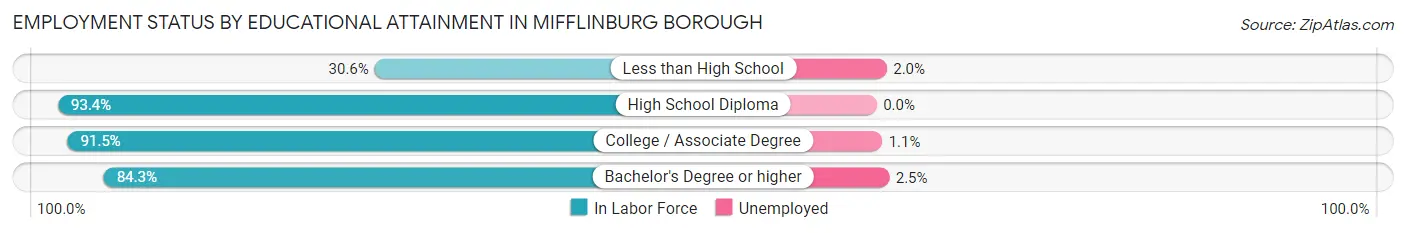
| Educational Attainment | In Labor Force | Unemployed |
| Less than High School | 49 (30.6%) | 3 (2.0%) |
| High School Diploma | 683 (93.4%) | 0 (0.0%) |
| College / Associate Degree | 354 (91.5%) | 4 (1.1%) |
| Bachelor's Degree or higher | 322 (84.3%) | 10 (2.5%) |
| Total | 1,408 (84.8%) | 15 (0.9%) |
Employment Occupations by Sex in Mifflinburg borough
Management, Business, Science and Arts Occupations
The most common Management, Business, Science and Arts occupations in Mifflinburg borough are Community & Social Service (181 | 10.0%), Management (178 | 9.8%), Education Instruction & Library (117 | 6.4%), Health Diagnosing & Treating (75 | 4.1%), and Computers, Engineering & Science (73 | 4.0%).
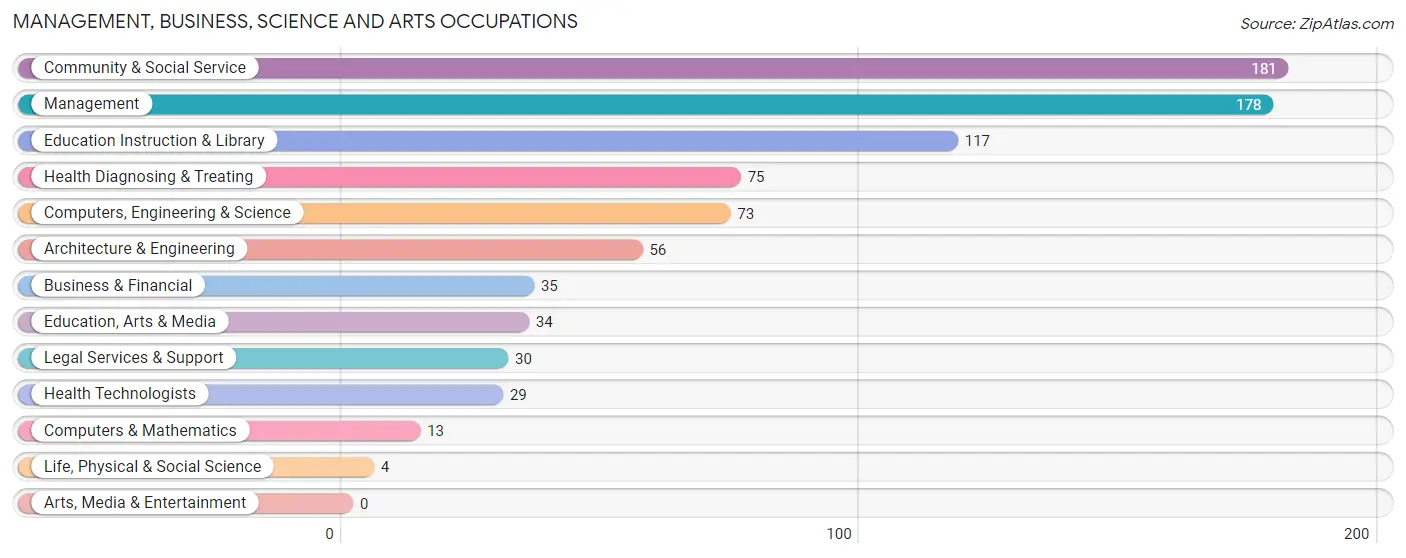
Management, Business, Science and Arts Occupations by Sex
Within the Management, Business, Science and Arts occupations in Mifflinburg borough, the most male-oriented occupations are Computers & Mathematics (100.0%), Architecture & Engineering (100.0%), and Computers, Engineering & Science (94.5%), while the most female-oriented occupations are Business & Financial (100.0%), Life, Physical & Social Science (100.0%), and Education, Arts & Media (76.5%).
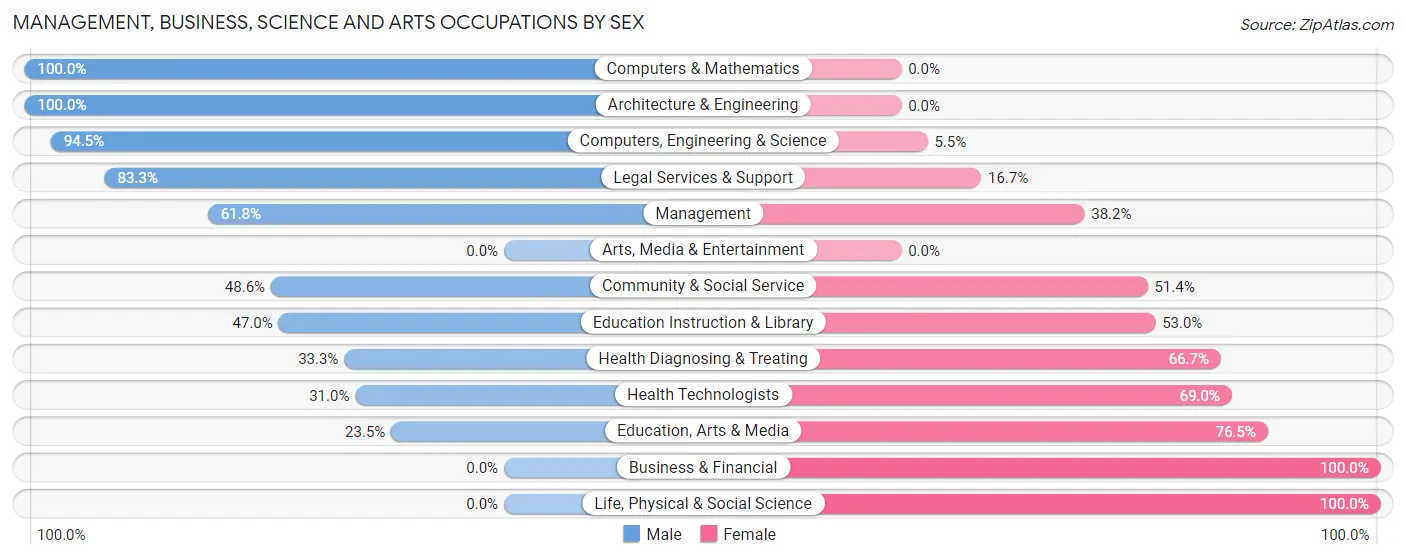
| Occupation | Male | Female |
| Management | 110 (61.8%) | 68 (38.2%) |
| Business & Financial | 0 (0.0%) | 35 (100.0%) |
| Computers, Engineering & Science | 69 (94.5%) | 4 (5.5%) |
| Computers & Mathematics | 13 (100.0%) | 0 (0.0%) |
| Architecture & Engineering | 56 (100.0%) | 0 (0.0%) |
| Life, Physical & Social Science | 0 (0.0%) | 4 (100.0%) |
| Community & Social Service | 88 (48.6%) | 93 (51.4%) |
| Education, Arts & Media | 8 (23.5%) | 26 (76.5%) |
| Legal Services & Support | 25 (83.3%) | 5 (16.7%) |
| Education Instruction & Library | 55 (47.0%) | 62 (53.0%) |
| Arts, Media & Entertainment | 0 (0.0%) | 0 (0.0%) |
| Health Diagnosing & Treating | 25 (33.3%) | 50 (66.7%) |
| Health Technologists | 9 (31.0%) | 20 (69.0%) |
| Total (Category) | 292 (53.9%) | 250 (46.1%) |
| Total (Overall) | 919 (50.5%) | 899 (49.4%) |
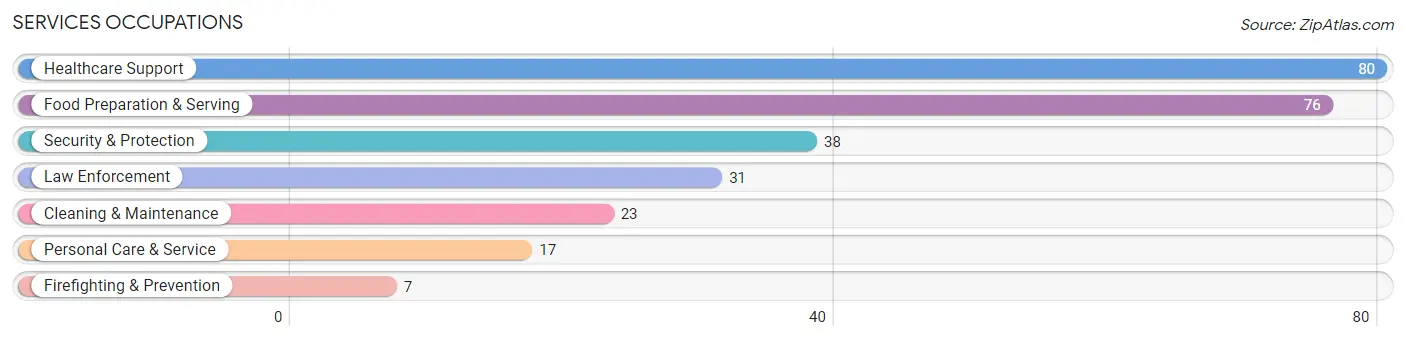
Services Occupations
The most common Services occupations in Mifflinburg borough are Healthcare Support (80 | 4.4%), Food Preparation & Serving (76 | 4.2%), Security & Protection (38 | 2.1%), Law Enforcement (31 | 1.7%), and Cleaning & Maintenance (23 | 1.3%).
Services Occupations by Sex
Within the Services occupations in Mifflinburg borough, the most male-oriented occupations are Law Enforcement (100.0%), Security & Protection (81.6%), and Personal Care & Service (41.2%), while the most female-oriented occupations are Firefighting & Prevention (100.0%), Food Preparation & Serving (89.5%), and Healthcare Support (78.7%).
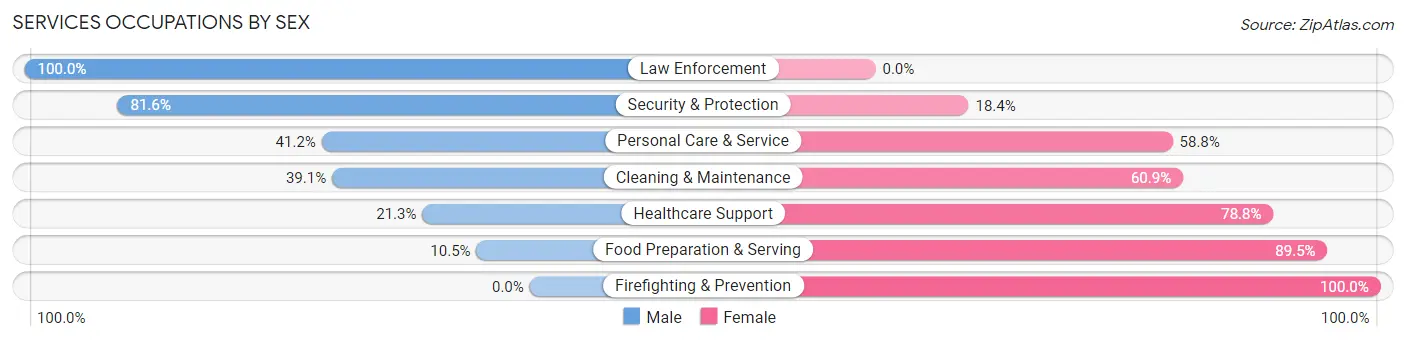
| Occupation | Male | Female |
| Healthcare Support | 17 (21.2%) | 63 (78.7%) |
| Security & Protection | 31 (81.6%) | 7 (18.4%) |
| Firefighting & Prevention | 0 (0.0%) | 7 (100.0%) |
| Law Enforcement | 31 (100.0%) | 0 (0.0%) |
| Food Preparation & Serving | 8 (10.5%) | 68 (89.5%) |
| Cleaning & Maintenance | 9 (39.1%) | 14 (60.9%) |
| Personal Care & Service | 7 (41.2%) | 10 (58.8%) |
| Total (Category) | 72 (30.8%) | 162 (69.2%) |
| Total (Overall) | 919 (50.5%) | 899 (49.4%) |
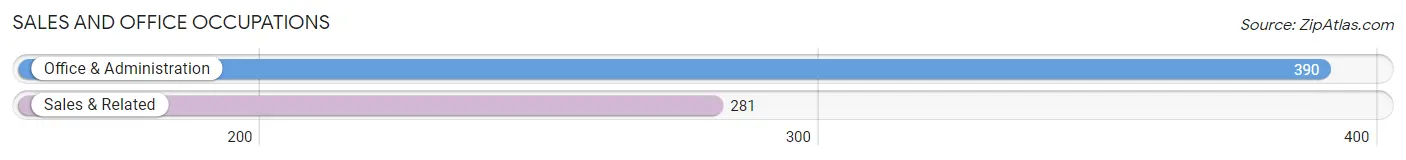
Sales and Office Occupations
The most common Sales and Office occupations in Mifflinburg borough are Office & Administration (390 | 21.4%), and Sales & Related (281 | 15.5%).
Sales and Office Occupations by Sex
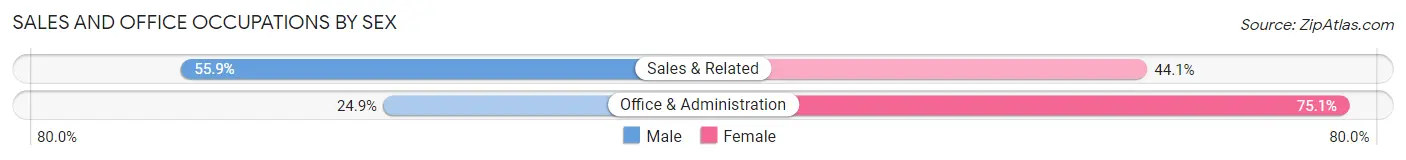
| Occupation | Male | Female |
| Sales & Related | 157 (55.9%) | 124 (44.1%) |
| Office & Administration | 97 (24.9%) | 293 (75.1%) |
| Total (Category) | 254 (37.9%) | 417 (62.2%) |
| Total (Overall) | 919 (50.5%) | 899 (49.4%) |
Natural Resources, Construction and Maintenance Occupations
The most common Natural Resources, Construction and Maintenance occupations in Mifflinburg borough are Installation, Maintenance & Repair (81 | 4.5%), and Construction & Extraction (16 | 0.9%).
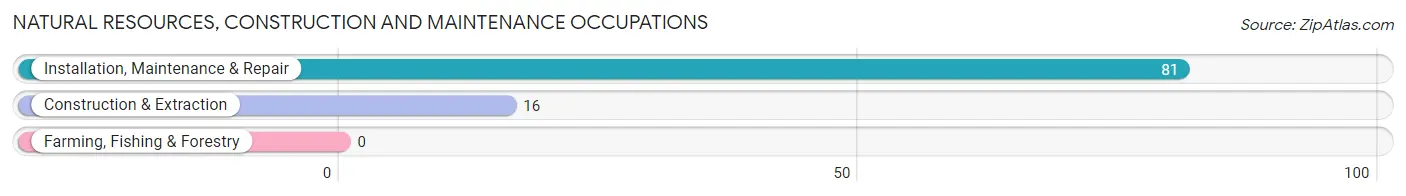
Natural Resources, Construction and Maintenance Occupations by Sex

| Occupation | Male | Female |
| Farming, Fishing & Forestry | 0 (0.0%) | 0 (0.0%) |
| Construction & Extraction | 16 (100.0%) | 0 (0.0%) |
| Installation, Maintenance & Repair | 81 (100.0%) | 0 (0.0%) |
| Total (Category) | 97 (100.0%) | 0 (0.0%) |
| Total (Overall) | 919 (50.5%) | 899 (49.4%) |
Production, Transportation and Moving Occupations
The most common Production, Transportation and Moving occupations in Mifflinburg borough are Production (139 | 7.6%), Material Moving (99 | 5.4%), and Transportation (36 | 2.0%).
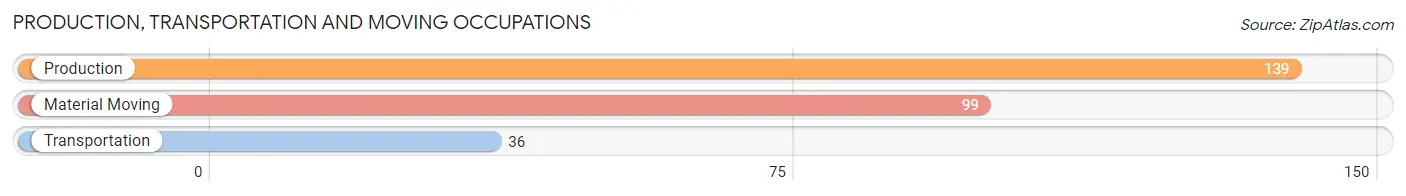
Production, Transportation and Moving Occupations by Sex
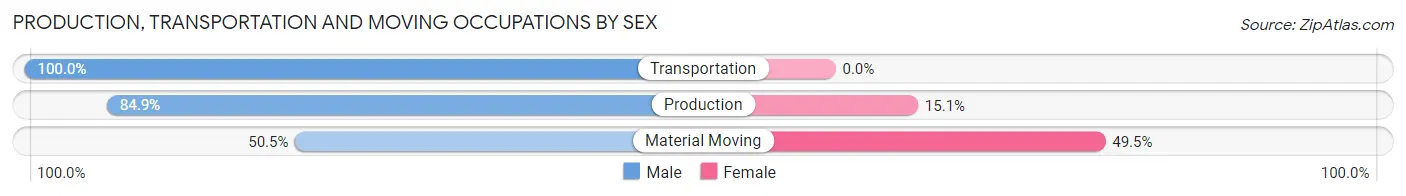
| Occupation | Male | Female |
| Production | 118 (84.9%) | 21 (15.1%) |
| Transportation | 36 (100.0%) | 0 (0.0%) |
| Material Moving | 50 (50.5%) | 49 (49.5%) |
| Total (Category) | 204 (74.5%) | 70 (25.6%) |
| Total (Overall) | 919 (50.5%) | 899 (49.4%) |
Employment Industries by Sex in Mifflinburg borough
Employment Industries in Mifflinburg borough
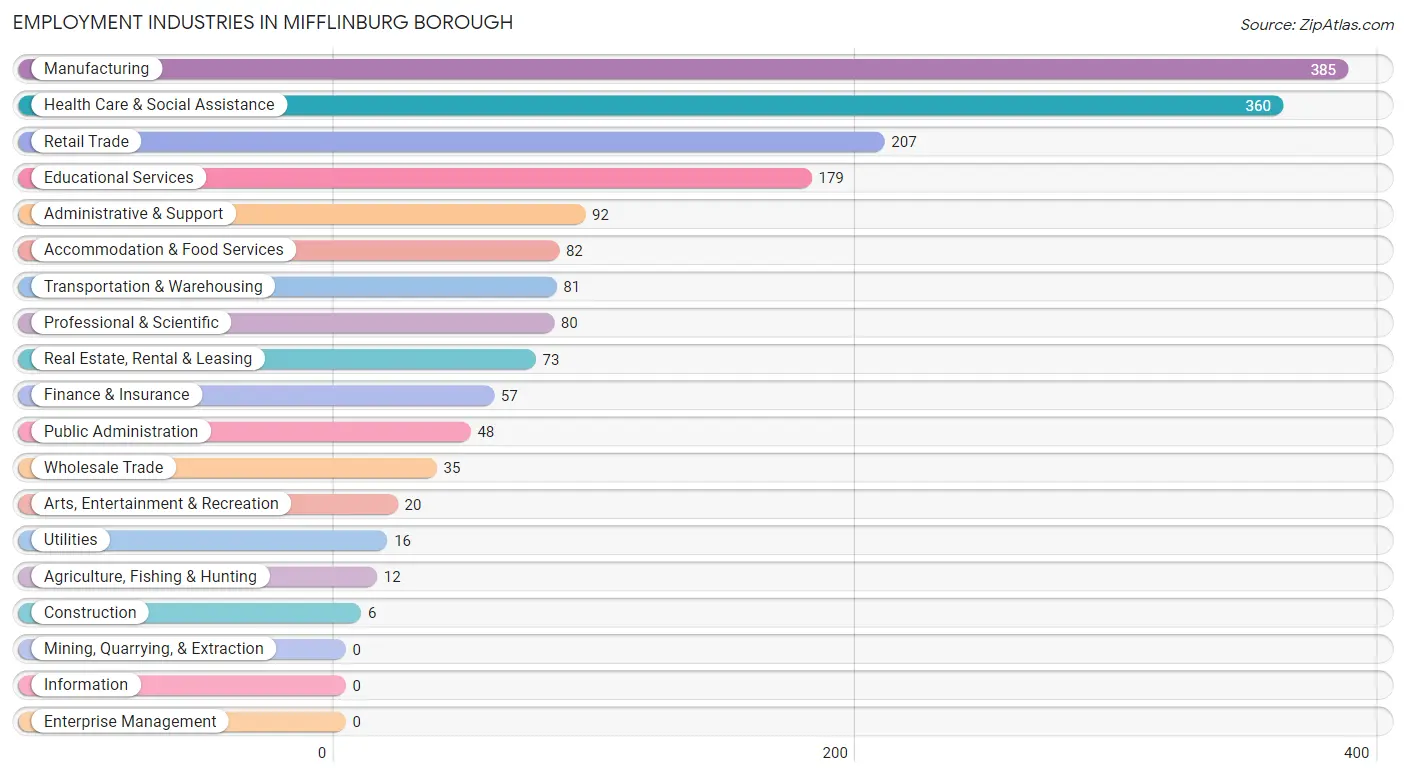
The major employment industries in Mifflinburg borough include Manufacturing (385 | 21.2%), Health Care & Social Assistance (360 | 19.8%), Retail Trade (207 | 11.4%), Educational Services (179 | 9.9%), and Administrative & Support (92 | 5.1%).
Employment Industries by Sex in Mifflinburg borough
The Mifflinburg borough industries that see more men than women are Construction (100.0%), Wholesale Trade (100.0%), and Utilities (100.0%), whereas the industries that tend to have a higher number of women are Agriculture, Fishing & Hunting (100.0%), Finance & Insurance (94.7%), and Accommodation & Food Services (78.0%).
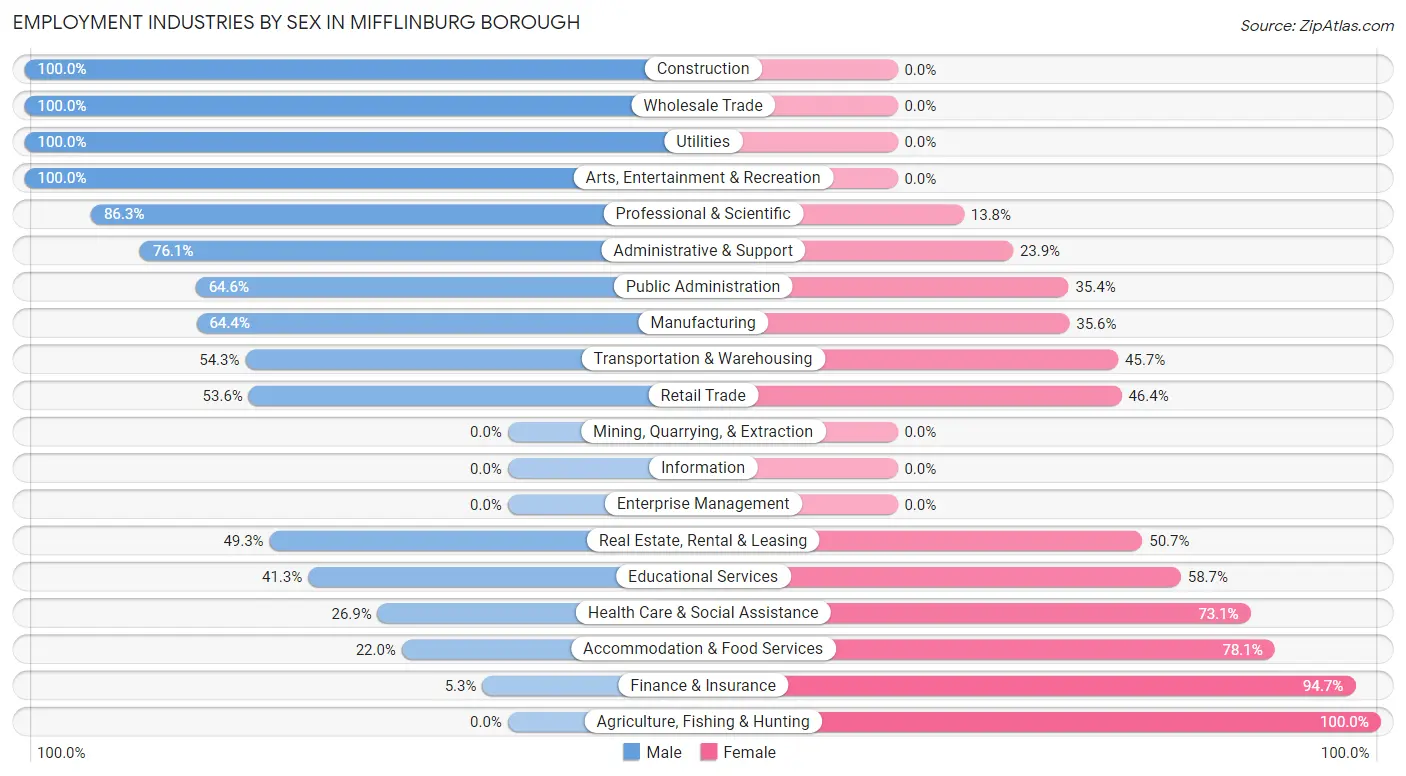
| Industry | Male | Female |
| Agriculture, Fishing & Hunting | 0 (0.0%) | 12 (100.0%) |
| Mining, Quarrying, & Extraction | 0 (0.0%) | 0 (0.0%) |
| Construction | 6 (100.0%) | 0 (0.0%) |
| Manufacturing | 248 (64.4%) | 137 (35.6%) |
| Wholesale Trade | 35 (100.0%) | 0 (0.0%) |
| Retail Trade | 111 (53.6%) | 96 (46.4%) |
| Transportation & Warehousing | 44 (54.3%) | 37 (45.7%) |
| Utilities | 16 (100.0%) | 0 (0.0%) |
| Information | 0 (0.0%) | 0 (0.0%) |
| Finance & Insurance | 3 (5.3%) | 54 (94.7%) |
| Real Estate, Rental & Leasing | 36 (49.3%) | 37 (50.7%) |
| Professional & Scientific | 69 (86.3%) | 11 (13.8%) |
| Enterprise Management | 0 (0.0%) | 0 (0.0%) |
| Administrative & Support | 70 (76.1%) | 22 (23.9%) |
| Educational Services | 74 (41.3%) | 105 (58.7%) |
| Health Care & Social Assistance | 97 (26.9%) | 263 (73.1%) |
| Arts, Entertainment & Recreation | 20 (100.0%) | 0 (0.0%) |
| Accommodation & Food Services | 18 (22.0%) | 64 (78.0%) |
| Public Administration | 31 (64.6%) | 17 (35.4%) |
| Total | 919 (50.5%) | 899 (49.4%) |
Education in Mifflinburg borough
School Enrollment in Mifflinburg borough
The most common levels of schooling among the 774 students in Mifflinburg borough are elementary school (193 | 24.9%), kindergarten (174 | 22.5%), and high school (129 | 16.7%).
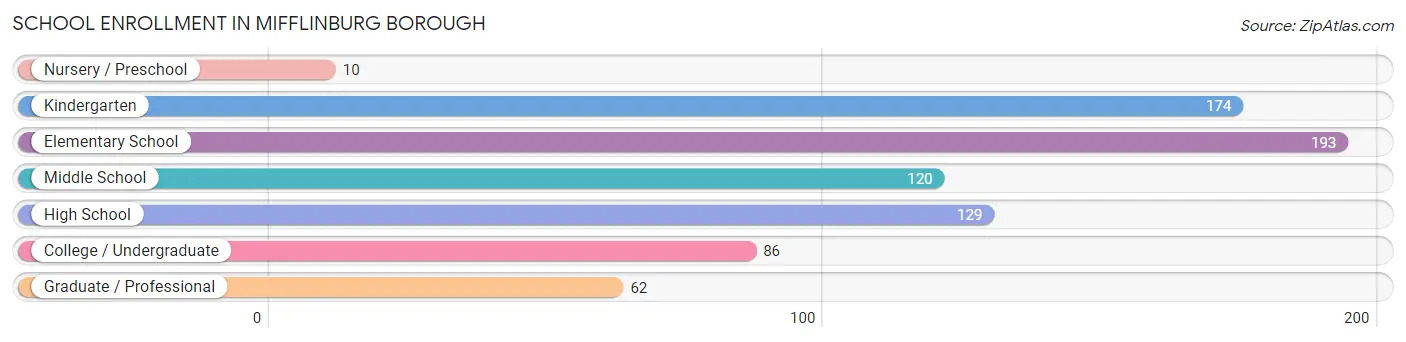
| School Level | # Students | % Students |
| Nursery / Preschool | 10 | 1.3% |
| Kindergarten | 174 | 22.5% |
| Elementary School | 193 | 24.9% |
| Middle School | 120 | 15.5% |
| High School | 129 | 16.7% |
| College / Undergraduate | 86 | 11.1% |
| Graduate / Professional | 62 | 8.0% |
| Total | 774 | 100.0% |
School Enrollment by Age by Funding Source in Mifflinburg borough
Out of a total of 774 students who are enrolled in schools in Mifflinburg borough, 260 (33.6%) attend a private institution, while the remaining 514 (66.4%) are enrolled in public schools. The age group of 25 to 34 year olds has the highest likelihood of being enrolled in private schools, with 57 (86.4% in the age bracket) enrolled. Conversely, the age group of 3 to 4 year olds has the lowest likelihood of being enrolled in a private school, with 10 (100.0% in the age bracket) attending a public institution.
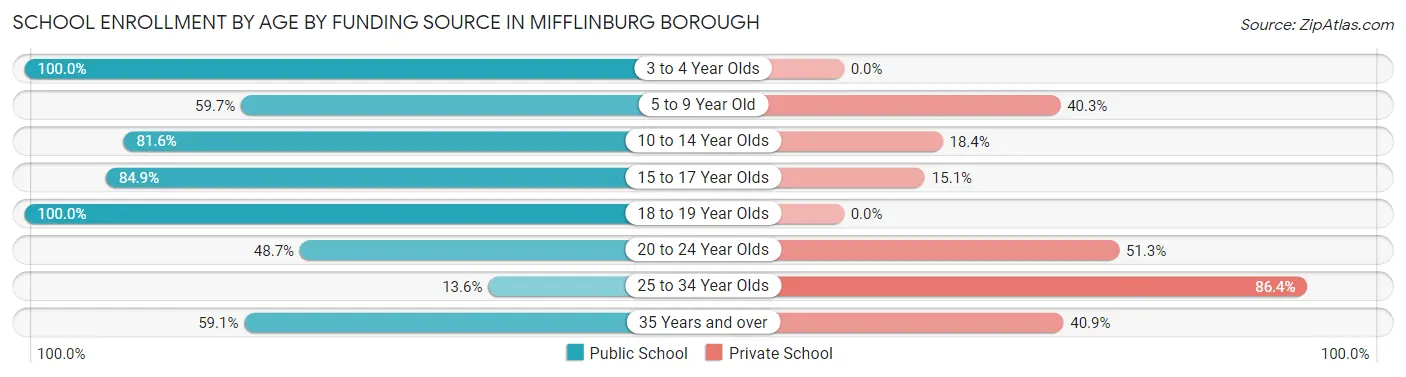
| Age Bracket | Public School | Private School |
| 3 to 4 Year Olds | 10 (100.0%) | 0 (0.0%) |
| 5 to 9 Year Old | 179 (59.7%) | 121 (40.3%) |
| 10 to 14 Year Olds | 155 (81.6%) | 35 (18.4%) |
| 15 to 17 Year Olds | 101 (84.9%) | 18 (15.1%) |
| 18 to 19 Year Olds | 28 (100.0%) | 0 (0.0%) |
| 20 to 24 Year Olds | 19 (48.7%) | 20 (51.3%) |
| 25 to 34 Year Olds | 9 (13.6%) | 57 (86.4%) |
| 35 Years and over | 13 (59.1%) | 9 (40.9%) |
| Total | 514 (66.4%) | 260 (33.6%) |
Educational Attainment by Field of Study in Mifflinburg borough
Education (146 | 23.9%), arts & humanities (93 | 15.2%), science & technology (81 | 13.3%), engineering (60 | 9.8%), and business (47 | 7.7%) are the most common fields of study among 610 individuals in Mifflinburg borough who have obtained a bachelor's degree or higher.
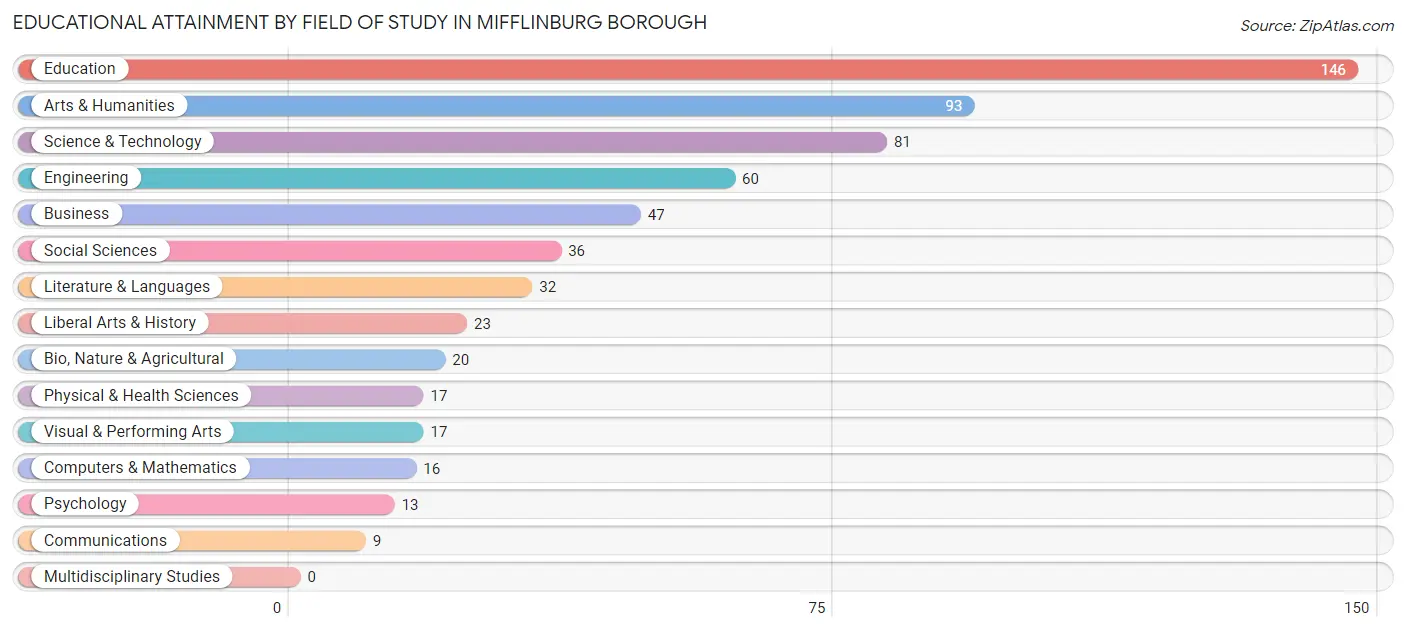
| Field of Study | # Graduates | % Graduates |
| Computers & Mathematics | 16 | 2.6% |
| Bio, Nature & Agricultural | 20 | 3.3% |
| Physical & Health Sciences | 17 | 2.8% |
| Psychology | 13 | 2.1% |
| Social Sciences | 36 | 5.9% |
| Engineering | 60 | 9.8% |
| Multidisciplinary Studies | 0 | 0.0% |
| Science & Technology | 81 | 13.3% |
| Business | 47 | 7.7% |
| Education | 146 | 23.9% |
| Literature & Languages | 32 | 5.2% |
| Liberal Arts & History | 23 | 3.8% |
| Visual & Performing Arts | 17 | 2.8% |
| Communications | 9 | 1.5% |
| Arts & Humanities | 93 | 15.2% |
| Total | 610 | 100.0% |
Transportation & Commute in Mifflinburg borough
Vehicle Availability by Sex in Mifflinburg borough
The most prevalent vehicle ownership categories in Mifflinburg borough are males with 2 vehicles (499, accounting for 54.3%) and females with 2 vehicles (444, making up 56.4%).
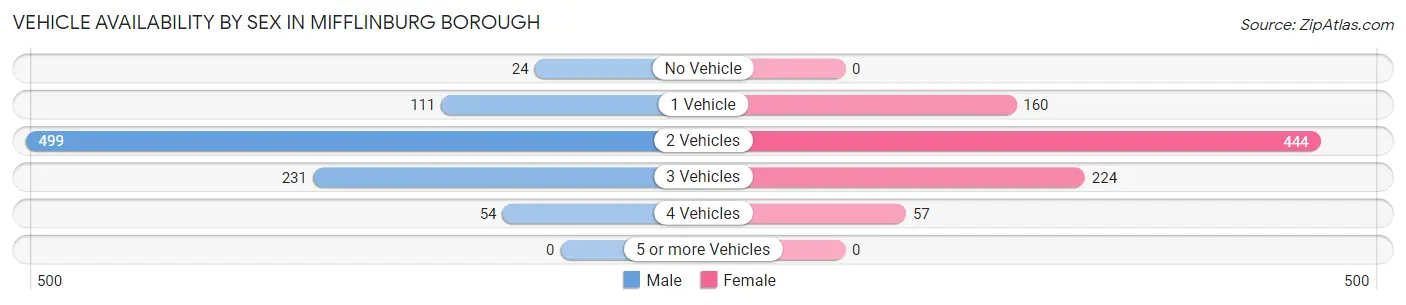
| Vehicles Available | Male | Female |
| No Vehicle | 24 (2.6%) | 0 (0.0%) |
| 1 Vehicle | 111 (12.1%) | 160 (18.1%) |
| 2 Vehicles | 499 (54.3%) | 444 (50.2%) |
| 3 Vehicles | 231 (25.1%) | 224 (25.3%) |
| 4 Vehicles | 54 (5.9%) | 57 (6.4%) |
| 5 or more Vehicles | 0 (0.0%) | 0 (0.0%) |
| Total | 919 (100.0%) | 885 (100.0%) |
Commute Time in Mifflinburg borough
The most frequently occuring commute durations in Mifflinburg borough are 20 to 24 minutes (336 commuters, 19.0%), 25 to 29 minutes (285 commuters, 16.1%), and 15 to 19 minutes (272 commuters, 15.4%).
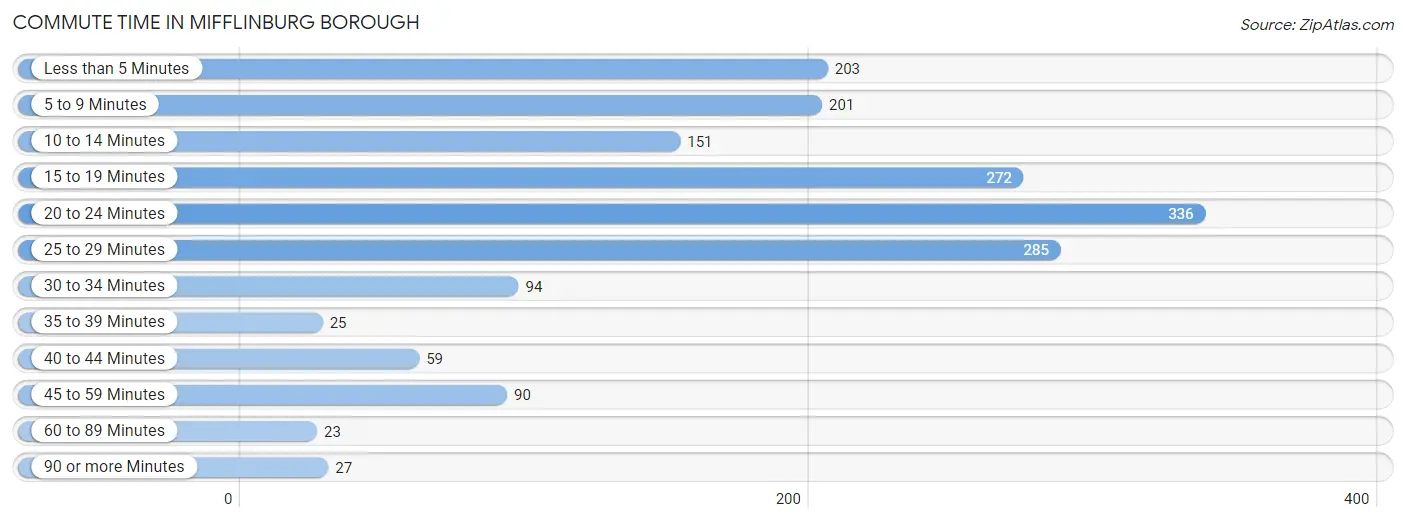
| Commute Time | # Commuters | % Commuters |
| Less than 5 Minutes | 203 | 11.5% |
| 5 to 9 Minutes | 201 | 11.4% |
| 10 to 14 Minutes | 151 | 8.6% |
| 15 to 19 Minutes | 272 | 15.4% |
| 20 to 24 Minutes | 336 | 19.0% |
| 25 to 29 Minutes | 285 | 16.1% |
| 30 to 34 Minutes | 94 | 5.3% |
| 35 to 39 Minutes | 25 | 1.4% |
| 40 to 44 Minutes | 59 | 3.3% |
| 45 to 59 Minutes | 90 | 5.1% |
| 60 to 89 Minutes | 23 | 1.3% |
| 90 or more Minutes | 27 | 1.5% |
Commute Time by Sex in Mifflinburg borough
The most common commute times in Mifflinburg borough are 25 to 29 minutes (178 commuters, 19.9%) for males and 20 to 24 minutes (212 commuters, 24.3%) for females.
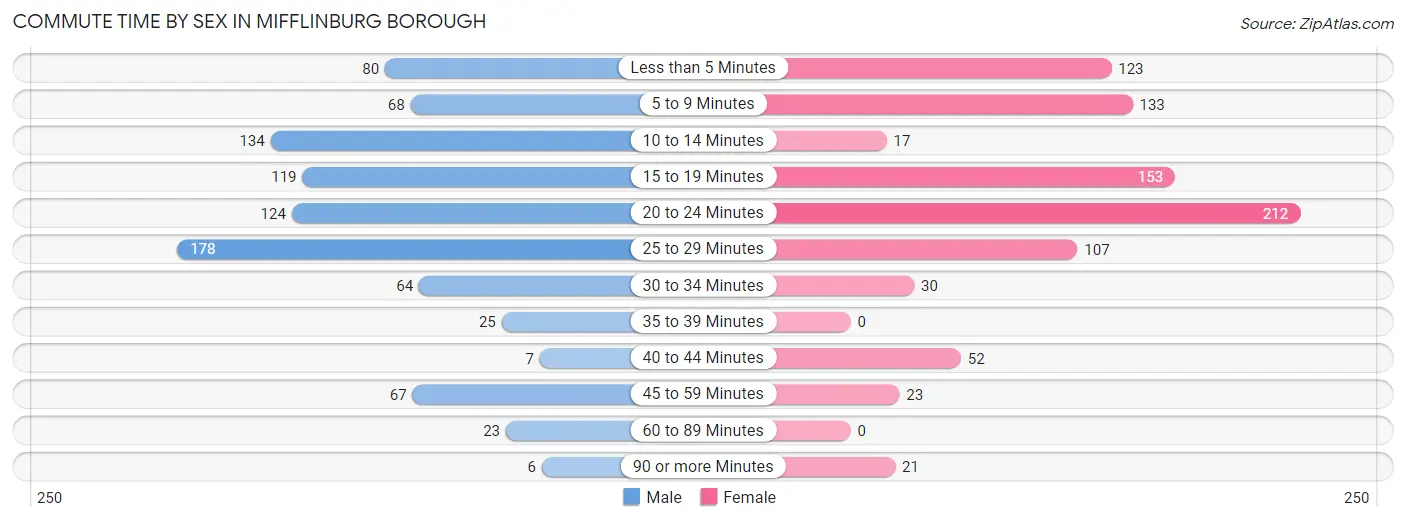
| Commute Time | Male | Female |
| Less than 5 Minutes | 80 (8.9%) | 123 (14.1%) |
| 5 to 9 Minutes | 68 (7.6%) | 133 (15.3%) |
| 10 to 14 Minutes | 134 (15.0%) | 17 (1.9%) |
| 15 to 19 Minutes | 119 (13.3%) | 153 (17.6%) |
| 20 to 24 Minutes | 124 (13.9%) | 212 (24.3%) |
| 25 to 29 Minutes | 178 (19.9%) | 107 (12.3%) |
| 30 to 34 Minutes | 64 (7.1%) | 30 (3.4%) |
| 35 to 39 Minutes | 25 (2.8%) | 0 (0.0%) |
| 40 to 44 Minutes | 7 (0.8%) | 52 (6.0%) |
| 45 to 59 Minutes | 67 (7.5%) | 23 (2.6%) |
| 60 to 89 Minutes | 23 (2.6%) | 0 (0.0%) |
| 90 or more Minutes | 6 (0.7%) | 21 (2.4%) |
Time of Departure to Work by Sex in Mifflinburg borough
The most frequent times of departure to work in Mifflinburg borough are 7:30 AM to 7:59 AM (155, 17.3%) for males and 7:30 AM to 7:59 AM (178, 20.4%) for females.
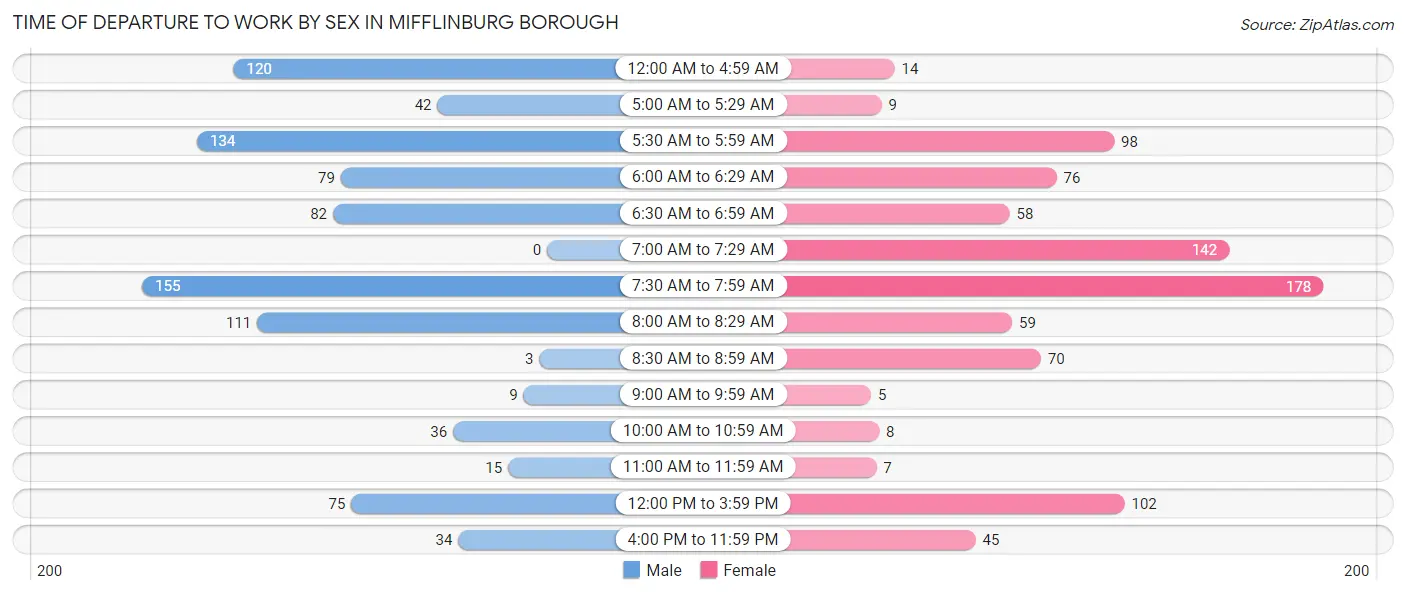
| Time of Departure | Male | Female |
| 12:00 AM to 4:59 AM | 120 (13.4%) | 14 (1.6%) |
| 5:00 AM to 5:29 AM | 42 (4.7%) | 9 (1.0%) |
| 5:30 AM to 5:59 AM | 134 (15.0%) | 98 (11.3%) |
| 6:00 AM to 6:29 AM | 79 (8.8%) | 76 (8.7%) |
| 6:30 AM to 6:59 AM | 82 (9.2%) | 58 (6.7%) |
| 7:00 AM to 7:29 AM | 0 (0.0%) | 142 (16.3%) |
| 7:30 AM to 7:59 AM | 155 (17.3%) | 178 (20.4%) |
| 8:00 AM to 8:29 AM | 111 (12.4%) | 59 (6.8%) |
| 8:30 AM to 8:59 AM | 3 (0.3%) | 70 (8.0%) |
| 9:00 AM to 9:59 AM | 9 (1.0%) | 5 (0.6%) |
| 10:00 AM to 10:59 AM | 36 (4.0%) | 8 (0.9%) |
| 11:00 AM to 11:59 AM | 15 (1.7%) | 7 (0.8%) |
| 12:00 PM to 3:59 PM | 75 (8.4%) | 102 (11.7%) |
| 4:00 PM to 11:59 PM | 34 (3.8%) | 45 (5.2%) |
| Total | 895 (100.0%) | 871 (100.0%) |
Housing Occupancy in Mifflinburg borough
Occupancy by Ownership in Mifflinburg borough
Of the total 1,423 dwellings in Mifflinburg borough, owner-occupied units account for 972 (68.3%), while renter-occupied units make up 451 (31.7%).
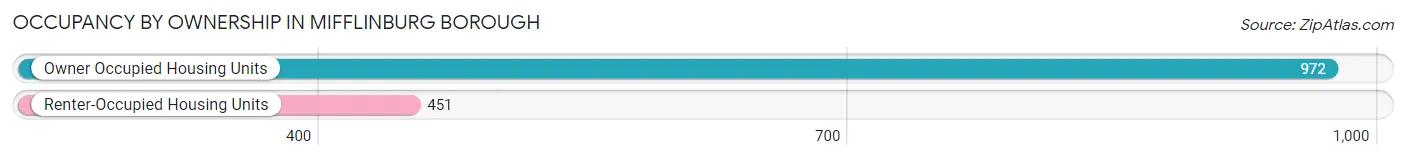
| Occupancy | # Housing Units | % Housing Units |
| Owner Occupied Housing Units | 972 | 68.3% |
| Renter-Occupied Housing Units | 451 | 31.7% |
| Total Occupied Housing Units | 1,423 | 100.0% |
Occupancy by Household Size in Mifflinburg borough
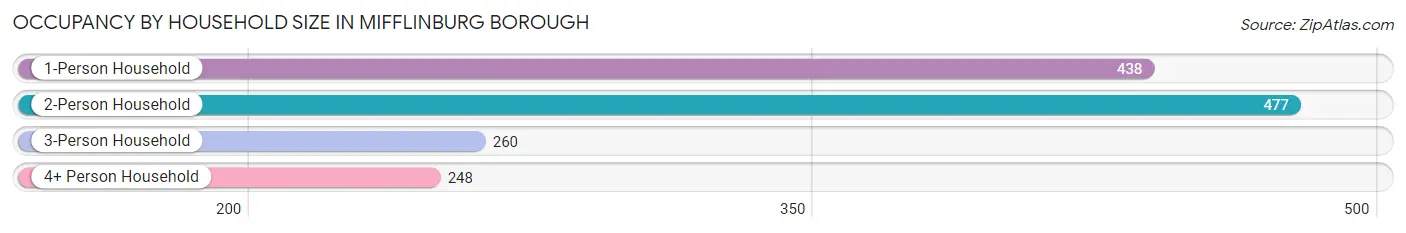
| Household Size | # Housing Units | % Housing Units |
| 1-Person Household | 438 | 30.8% |
| 2-Person Household | 477 | 33.5% |
| 3-Person Household | 260 | 18.3% |
| 4+ Person Household | 248 | 17.4% |
| Total Housing Units | 1,423 | 100.0% |
Occupancy by Ownership by Household Size in Mifflinburg borough
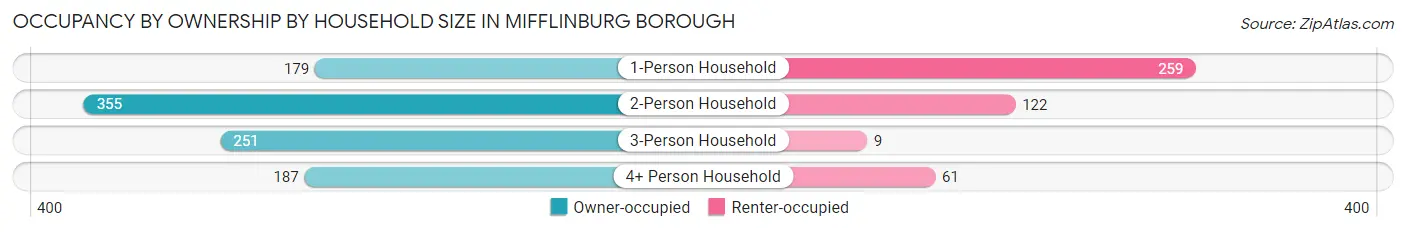
| Household Size | Owner-occupied | Renter-occupied |
| 1-Person Household | 179 (40.9%) | 259 (59.1%) |
| 2-Person Household | 355 (74.4%) | 122 (25.6%) |
| 3-Person Household | 251 (96.5%) | 9 (3.5%) |
| 4+ Person Household | 187 (75.4%) | 61 (24.6%) |
| Total Housing Units | 972 (68.3%) | 451 (31.7%) |
Occupancy by Educational Attainment in Mifflinburg borough
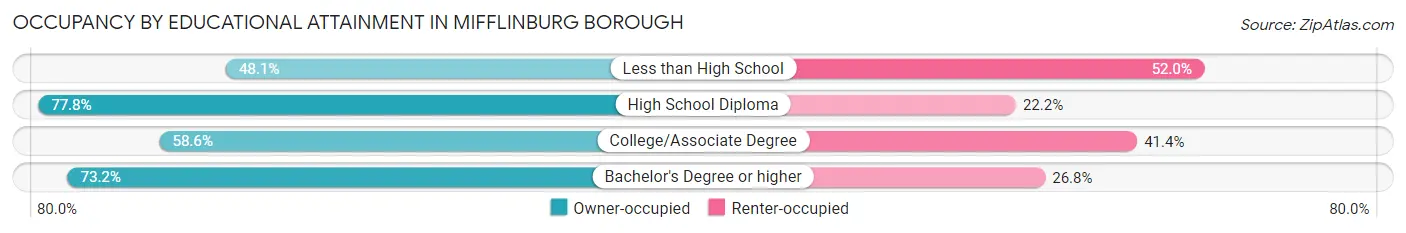
| Household Size | Owner-occupied | Renter-occupied |
| Less than High School | 74 (48.0%) | 80 (51.9%) |
| High School Diploma | 456 (77.8%) | 130 (22.2%) |
| College/Associate Degree | 232 (58.6%) | 164 (41.4%) |
| Bachelor's Degree or higher | 210 (73.2%) | 77 (26.8%) |
Occupancy by Age of Householder in Mifflinburg borough
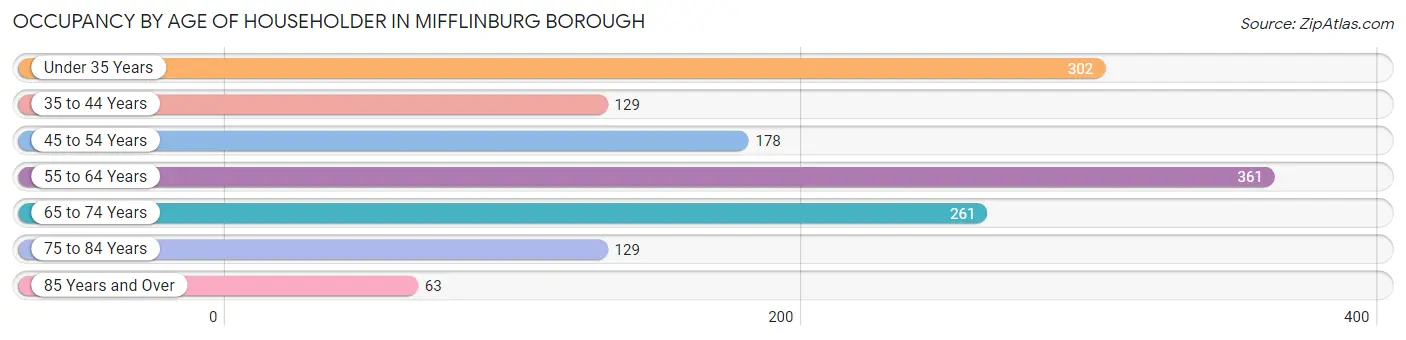
| Age Bracket | # Households | % Households |
| Under 35 Years | 302 | 21.2% |
| 35 to 44 Years | 129 | 9.1% |
| 45 to 54 Years | 178 | 12.5% |
| 55 to 64 Years | 361 | 25.4% |
| 65 to 74 Years | 261 | 18.3% |
| 75 to 84 Years | 129 | 9.1% |
| 85 Years and Over | 63 | 4.4% |
| Total | 1,423 | 100.0% |
Housing Finances in Mifflinburg borough
Median Income by Occupancy in Mifflinburg borough
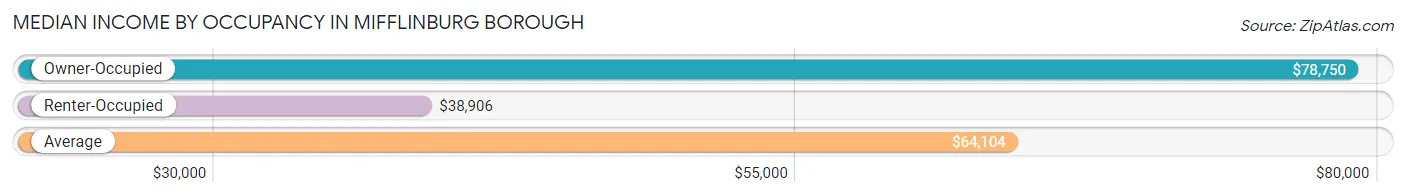
| Occupancy Type | # Households | Median Income |
| Owner-Occupied | 972 (68.3%) | $78,750 |
| Renter-Occupied | 451 (31.7%) | $38,906 |
| Average | 1,423 (100.0%) | $64,104 |
Occupancy by Householder Income Bracket in Mifflinburg borough
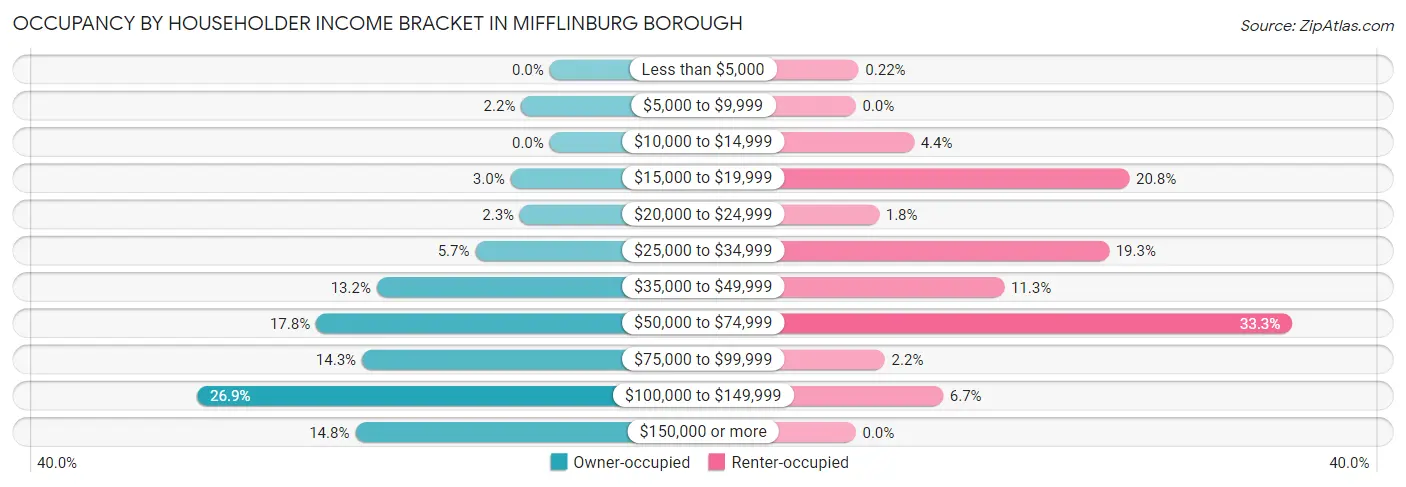
| Income Bracket | Owner-occupied | Renter-occupied |
| Less than $5,000 | 0 (0.0%) | 1 (0.2%) |
| $5,000 to $9,999 | 21 (2.2%) | 0 (0.0%) |
| $10,000 to $14,999 | 0 (0.0%) | 20 (4.4%) |
| $15,000 to $19,999 | 29 (3.0%) | 94 (20.8%) |
| $20,000 to $24,999 | 22 (2.3%) | 8 (1.8%) |
| $25,000 to $34,999 | 55 (5.7%) | 87 (19.3%) |
| $35,000 to $49,999 | 128 (13.2%) | 51 (11.3%) |
| $50,000 to $74,999 | 173 (17.8%) | 150 (33.3%) |
| $75,000 to $99,999 | 139 (14.3%) | 10 (2.2%) |
| $100,000 to $149,999 | 261 (26.9%) | 30 (6.7%) |
| $150,000 or more | 144 (14.8%) | 0 (0.0%) |
| Total | 972 (100.0%) | 451 (100.0%) |
Monthly Housing Cost Tiers in Mifflinburg borough
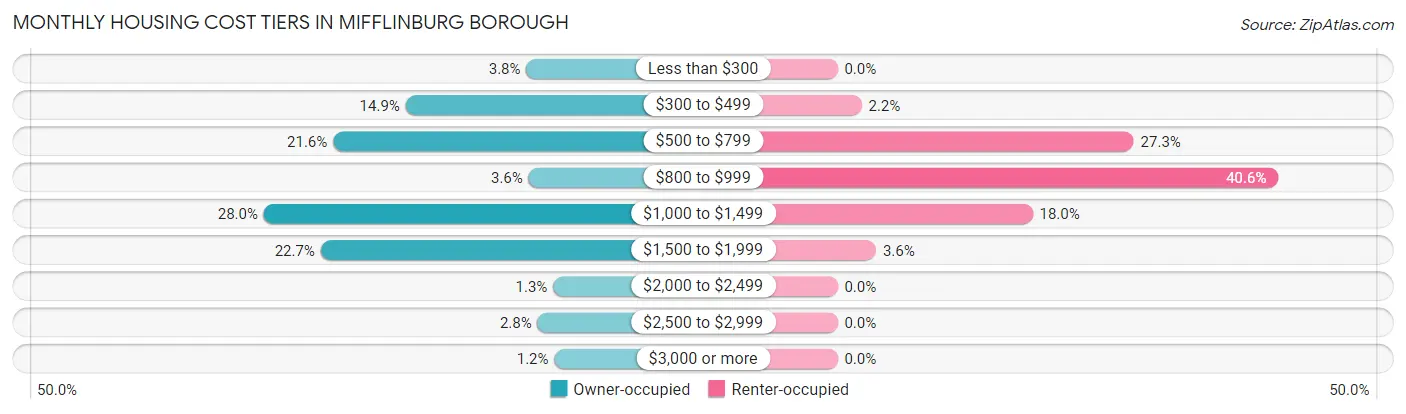
| Monthly Cost | Owner-occupied | Renter-occupied |
| Less than $300 | 37 (3.8%) | 0 (0.0%) |
| $300 to $499 | 145 (14.9%) | 10 (2.2%) |
| $500 to $799 | 210 (21.6%) | 123 (27.3%) |
| $800 to $999 | 35 (3.6%) | 183 (40.6%) |
| $1,000 to $1,499 | 272 (28.0%) | 81 (18.0%) |
| $1,500 to $1,999 | 221 (22.7%) | 16 (3.5%) |
| $2,000 to $2,499 | 13 (1.3%) | 0 (0.0%) |
| $2,500 to $2,999 | 27 (2.8%) | 0 (0.0%) |
| $3,000 or more | 12 (1.2%) | 0 (0.0%) |
| Total | 972 (100.0%) | 451 (100.0%) |
Physical Housing Characteristics in Mifflinburg borough
Housing Structures in Mifflinburg borough
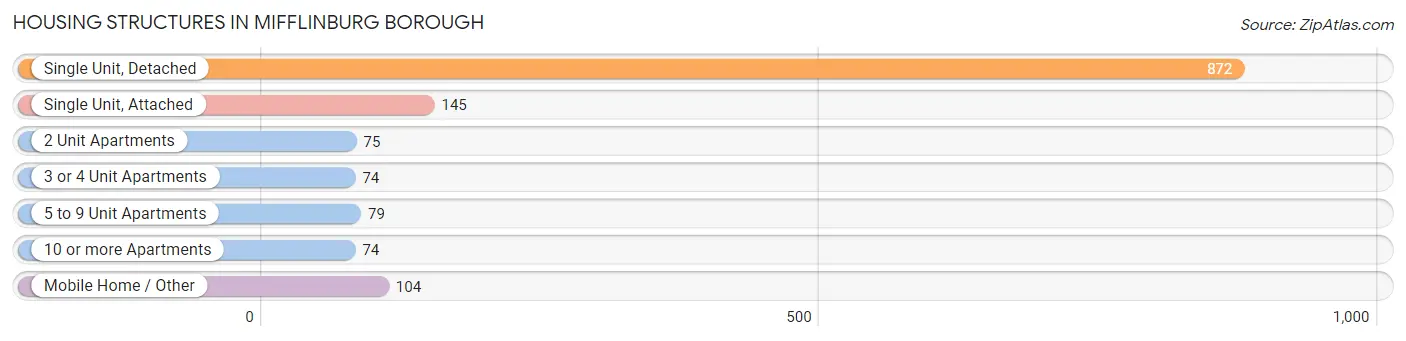
| Structure Type | # Housing Units | % Housing Units |
| Single Unit, Detached | 872 | 61.3% |
| Single Unit, Attached | 145 | 10.2% |
| 2 Unit Apartments | 75 | 5.3% |
| 3 or 4 Unit Apartments | 74 | 5.2% |
| 5 to 9 Unit Apartments | 79 | 5.6% |
| 10 or more Apartments | 74 | 5.2% |
| Mobile Home / Other | 104 | 7.3% |
| Total | 1,423 | 100.0% |
Housing Structures by Occupancy in Mifflinburg borough
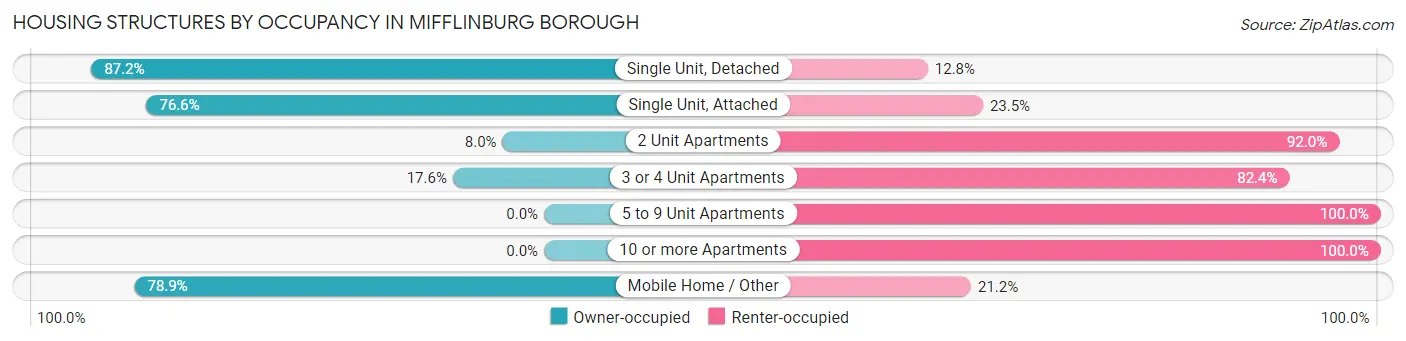
| Structure Type | Owner-occupied | Renter-occupied |
| Single Unit, Detached | 760 (87.2%) | 112 (12.8%) |
| Single Unit, Attached | 111 (76.5%) | 34 (23.4%) |
| 2 Unit Apartments | 6 (8.0%) | 69 (92.0%) |
| 3 or 4 Unit Apartments | 13 (17.6%) | 61 (82.4%) |
| 5 to 9 Unit Apartments | 0 (0.0%) | 79 (100.0%) |
| 10 or more Apartments | 0 (0.0%) | 74 (100.0%) |
| Mobile Home / Other | 82 (78.8%) | 22 (21.1%) |
| Total | 972 (68.3%) | 451 (31.7%) |
Housing Structures by Number of Rooms in Mifflinburg borough
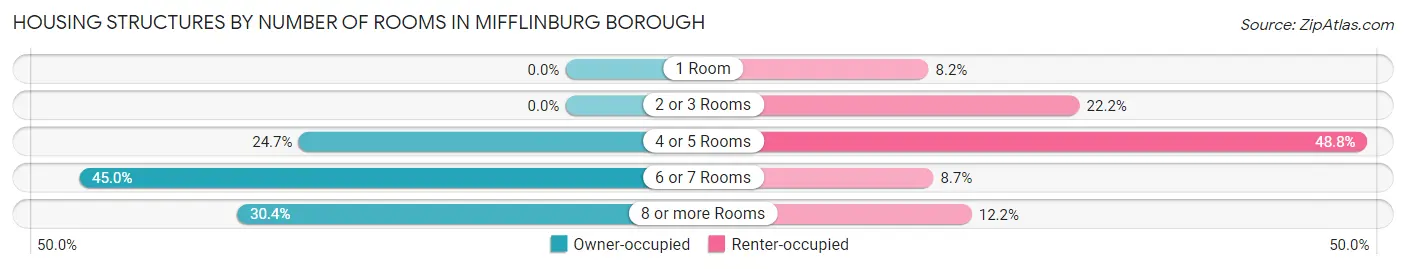
| Number of Rooms | Owner-occupied | Renter-occupied |
| 1 Room | 0 (0.0%) | 37 (8.2%) |
| 2 or 3 Rooms | 0 (0.0%) | 100 (22.2%) |
| 4 or 5 Rooms | 240 (24.7%) | 220 (48.8%) |
| 6 or 7 Rooms | 437 (45.0%) | 39 (8.6%) |
| 8 or more Rooms | 295 (30.3%) | 55 (12.2%) |
| Total | 972 (100.0%) | 451 (100.0%) |
Housing Structure by Heating Type in Mifflinburg borough
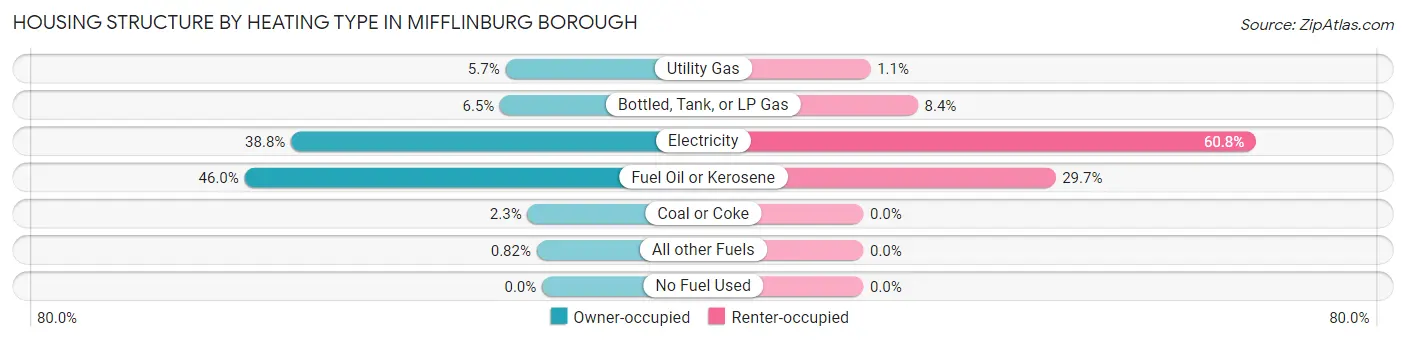
| Heating Type | Owner-occupied | Renter-occupied |
| Utility Gas | 55 (5.7%) | 5 (1.1%) |
| Bottled, Tank, or LP Gas | 63 (6.5%) | 38 (8.4%) |
| Electricity | 377 (38.8%) | 274 (60.8%) |
| Fuel Oil or Kerosene | 447 (46.0%) | 134 (29.7%) |
| Coal or Coke | 22 (2.3%) | 0 (0.0%) |
| All other Fuels | 8 (0.8%) | 0 (0.0%) |
| No Fuel Used | 0 (0.0%) | 0 (0.0%) |
| Total | 972 (100.0%) | 451 (100.0%) |
Household Vehicle Usage in Mifflinburg borough
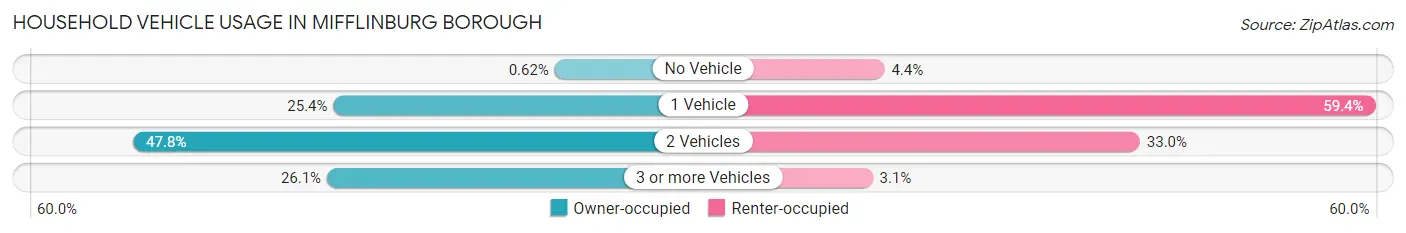
| Vehicles per Household | Owner-occupied | Renter-occupied |
| No Vehicle | 6 (0.6%) | 20 (4.4%) |
| 1 Vehicle | 247 (25.4%) | 268 (59.4%) |
| 2 Vehicles | 465 (47.8%) | 149 (33.0%) |
| 3 or more Vehicles | 254 (26.1%) | 14 (3.1%) |
| Total | 972 (100.0%) | 451 (100.0%) |
Real Estate & Mortgages in Mifflinburg borough
Real Estate and Mortgage Overview in Mifflinburg borough
| Characteristic | Without Mortgage | With Mortgage |
| Housing Units | 349 | 623 |
| Median Property Value | $170,800 | $175,500 |
| Median Household Income | $52,829 | $118 |
| Monthly Housing Costs | $550 | $12 |
| Real Estate Taxes | $1,753 | $37 |
Property Value by Mortgage Status in Mifflinburg borough
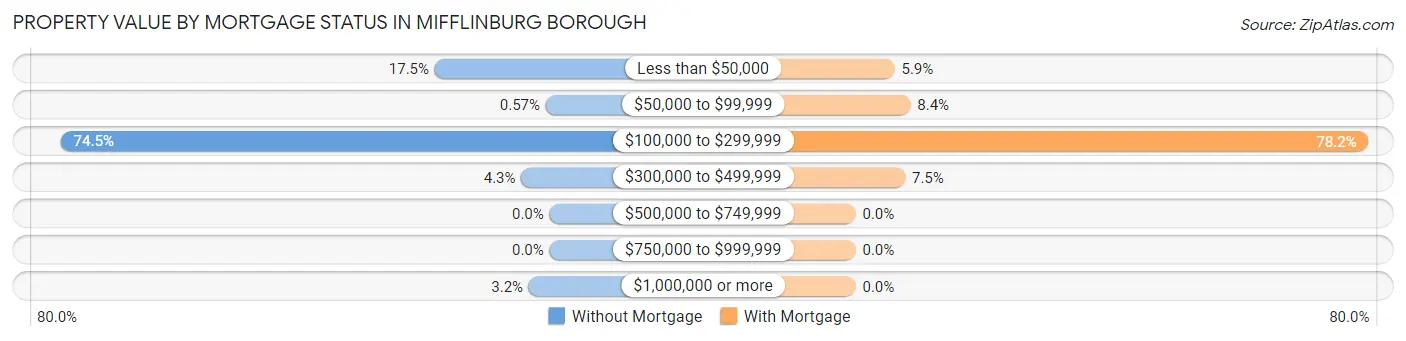
| Property Value | Without Mortgage | With Mortgage |
| Less than $50,000 | 61 (17.5%) | 37 (5.9%) |
| $50,000 to $99,999 | 2 (0.6%) | 52 (8.4%) |
| $100,000 to $299,999 | 260 (74.5%) | 487 (78.2%) |
| $300,000 to $499,999 | 15 (4.3%) | 47 (7.5%) |
| $500,000 to $749,999 | 0 (0.0%) | 0 (0.0%) |
| $750,000 to $999,999 | 0 (0.0%) | 0 (0.0%) |
| $1,000,000 or more | 11 (3.2%) | 0 (0.0%) |
| Total | 349 (100.0%) | 623 (100.0%) |
Household Income by Mortgage Status in Mifflinburg borough
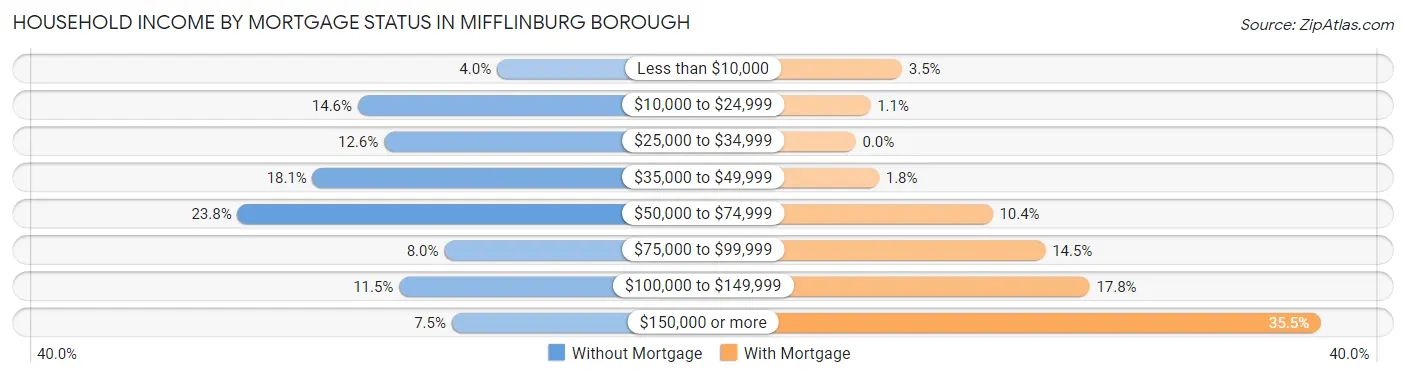
| Household Income | Without Mortgage | With Mortgage |
| Less than $10,000 | 14 (4.0%) | 22 (3.5%) |
| $10,000 to $24,999 | 51 (14.6%) | 7 (1.1%) |
| $25,000 to $34,999 | 44 (12.6%) | 0 (0.0%) |
| $35,000 to $49,999 | 63 (18.0%) | 11 (1.8%) |
| $50,000 to $74,999 | 83 (23.8%) | 65 (10.4%) |
| $75,000 to $99,999 | 28 (8.0%) | 90 (14.4%) |
| $100,000 to $149,999 | 40 (11.5%) | 111 (17.8%) |
| $150,000 or more | 26 (7.4%) | 221 (35.5%) |
| Total | 349 (100.0%) | 623 (100.0%) |
Property Value to Household Income Ratio in Mifflinburg borough
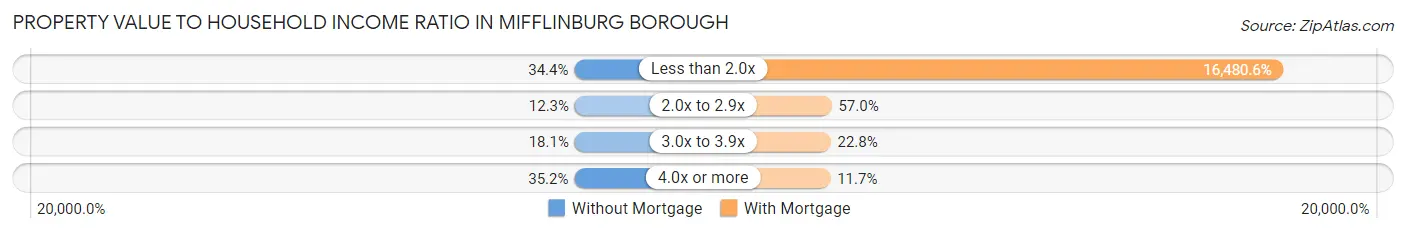
| Value-to-Income Ratio | Without Mortgage | With Mortgage |
| Less than 2.0x | 120 (34.4%) | 102,674 (16,480.6%) |
| 2.0x to 2.9x | 43 (12.3%) | 355 (57.0%) |
| 3.0x to 3.9x | 63 (18.0%) | 142 (22.8%) |
| 4.0x or more | 123 (35.2%) | 73 (11.7%) |
| Total | 349 (100.0%) | 623 (100.0%) |
Real Estate Taxes by Mortgage Status in Mifflinburg borough
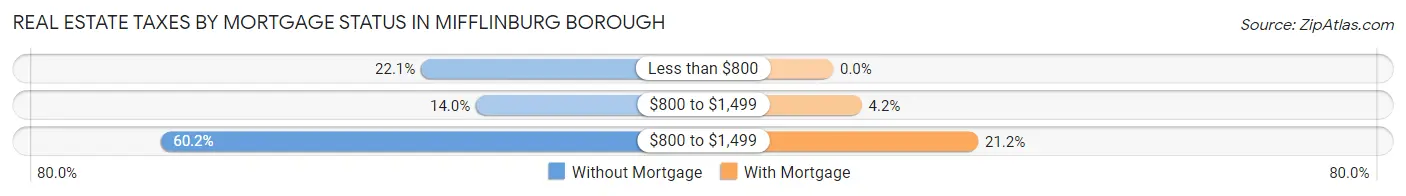
| Property Taxes | Without Mortgage | With Mortgage |
| Less than $800 | 77 (22.1%) | 0 (0.0%) |
| $800 to $1,499 | 49 (14.0%) | 26 (4.2%) |
| $800 to $1,499 | 210 (60.2%) | 132 (21.2%) |
| Total | 349 (100.0%) | 623 (100.0%) |
Health & Disability in Mifflinburg borough
Health Insurance Coverage by Age in Mifflinburg borough
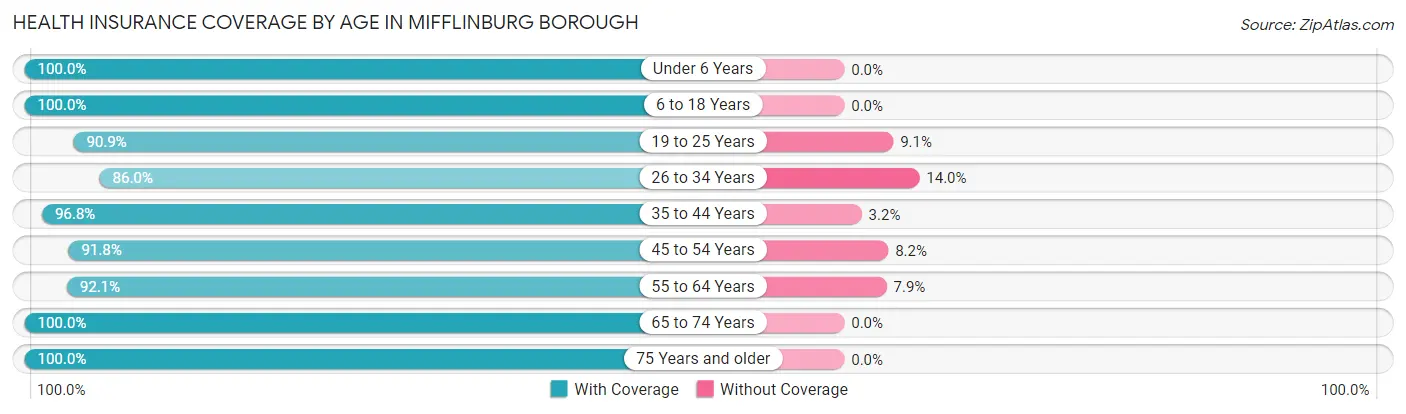
| Age Bracket | With Coverage | Without Coverage |
| Under 6 Years | 312 (100.0%) | 0 (0.0%) |
| 6 to 18 Years | 509 (100.0%) | 0 (0.0%) |
| 19 to 25 Years | 289 (90.9%) | 29 (9.1%) |
| 26 to 34 Years | 436 (86.0%) | 71 (14.0%) |
| 35 to 44 Years | 209 (96.8%) | 7 (3.2%) |
| 45 to 54 Years | 325 (91.8%) | 29 (8.2%) |
| 55 to 64 Years | 490 (92.1%) | 42 (7.9%) |
| 65 to 74 Years | 478 (100.0%) | 0 (0.0%) |
| 75 Years and older | 253 (100.0%) | 0 (0.0%) |
| Total | 3,301 (94.9%) | 178 (5.1%) |
Health Insurance Coverage by Citizenship Status in Mifflinburg borough
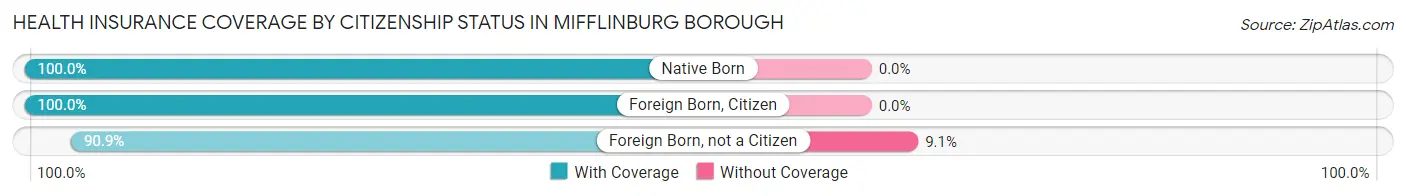
| Citizenship Status | With Coverage | Without Coverage |
| Native Born | 312 (100.0%) | 0 (0.0%) |
| Foreign Born, Citizen | 509 (100.0%) | 0 (0.0%) |
| Foreign Born, not a Citizen | 289 (90.9%) | 29 (9.1%) |
Health Insurance Coverage by Household Income in Mifflinburg borough
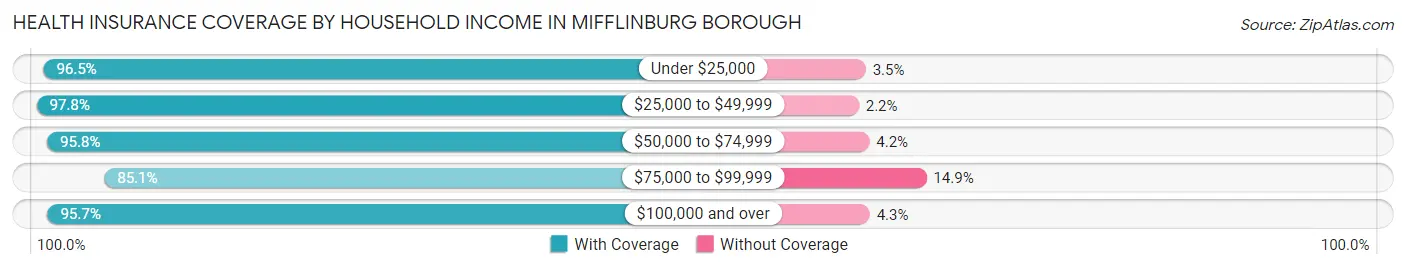
| Household Income | With Coverage | Without Coverage |
| Under $25,000 | 245 (96.5%) | 9 (3.5%) |
| $25,000 to $49,999 | 654 (97.8%) | 15 (2.2%) |
| $50,000 to $74,999 | 772 (95.8%) | 34 (4.2%) |
| $75,000 to $99,999 | 359 (85.1%) | 63 (14.9%) |
| $100,000 and over | 1,271 (95.7%) | 57 (4.3%) |
Public vs Private Health Insurance Coverage by Age in Mifflinburg borough
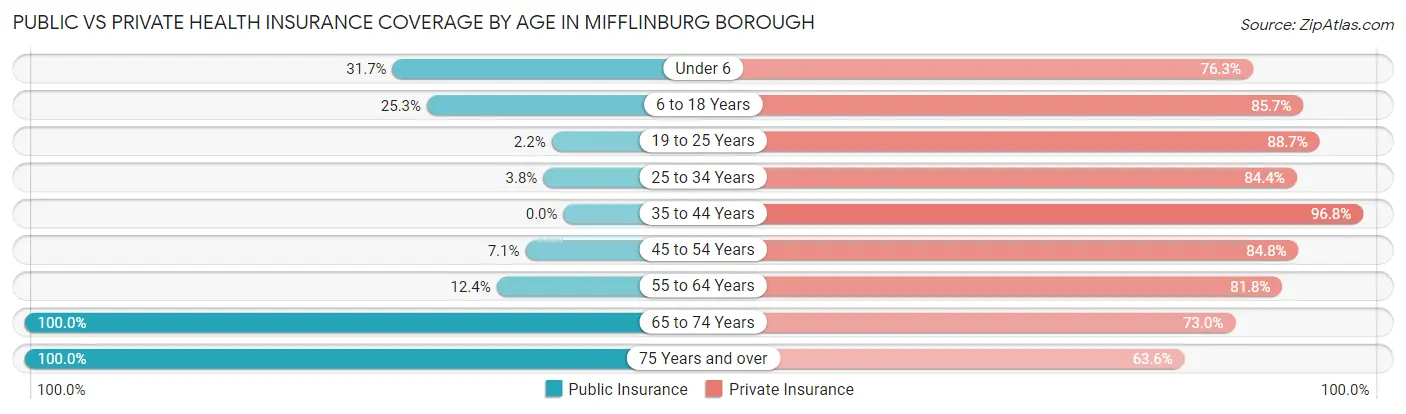
| Age Bracket | Public Insurance | Private Insurance |
| Under 6 | 99 (31.7%) | 238 (76.3%) |
| 6 to 18 Years | 129 (25.3%) | 436 (85.7%) |
| 19 to 25 Years | 7 (2.2%) | 282 (88.7%) |
| 25 to 34 Years | 19 (3.7%) | 428 (84.4%) |
| 35 to 44 Years | 0 (0.0%) | 209 (96.8%) |
| 45 to 54 Years | 25 (7.1%) | 300 (84.8%) |
| 55 to 64 Years | 66 (12.4%) | 435 (81.8%) |
| 65 to 74 Years | 478 (100.0%) | 349 (73.0%) |
| 75 Years and over | 253 (100.0%) | 161 (63.6%) |
| Total | 1,076 (30.9%) | 2,838 (81.6%) |
Disability Status by Sex by Age in Mifflinburg borough
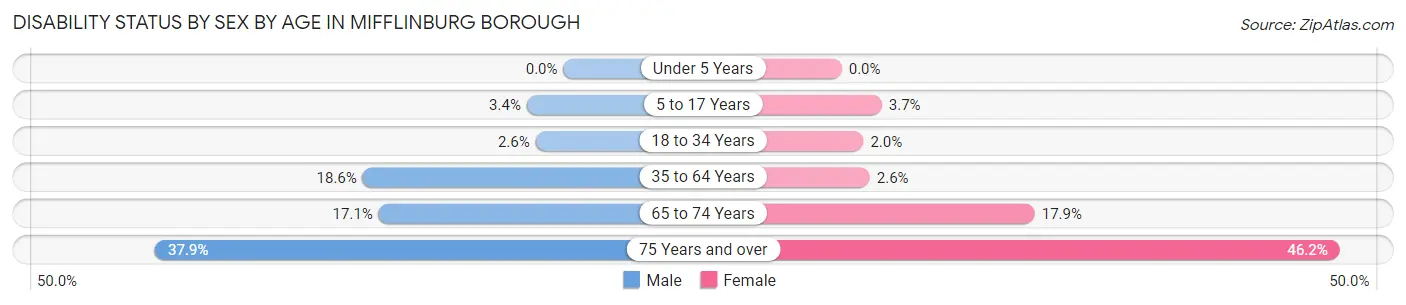
| Age Bracket | Male | Female |
| Under 5 Years | 0 (0.0%) | 0 (0.0%) |
| 5 to 17 Years | 12 (3.4%) | 10 (3.7%) |
| 18 to 34 Years | 13 (2.6%) | 7 (2.0%) |
| 35 to 64 Years | 98 (18.6%) | 15 (2.6%) |
| 65 to 74 Years | 36 (17.1%) | 48 (17.9%) |
| 75 Years and over | 36 (37.9%) | 73 (46.2%) |
Disability Class by Sex by Age in Mifflinburg borough
Disability Class: Hearing Difficulty
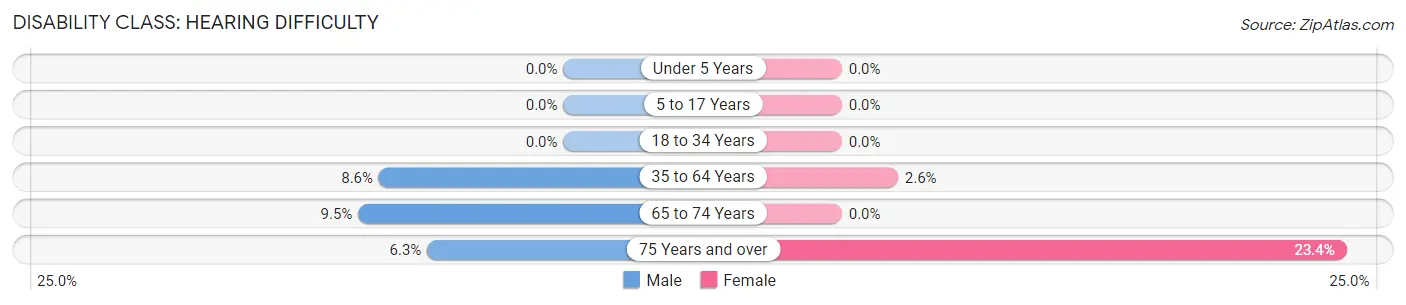
| Age Bracket | Male | Female |
| Under 5 Years | 0 (0.0%) | 0 (0.0%) |
| 5 to 17 Years | 0 (0.0%) | 0 (0.0%) |
| 18 to 34 Years | 0 (0.0%) | 0 (0.0%) |
| 35 to 64 Years | 45 (8.6%) | 15 (2.6%) |
| 65 to 74 Years | 20 (9.5%) | 0 (0.0%) |
| 75 Years and over | 6 (6.3%) | 37 (23.4%) |
Disability Class: Vision Difficulty
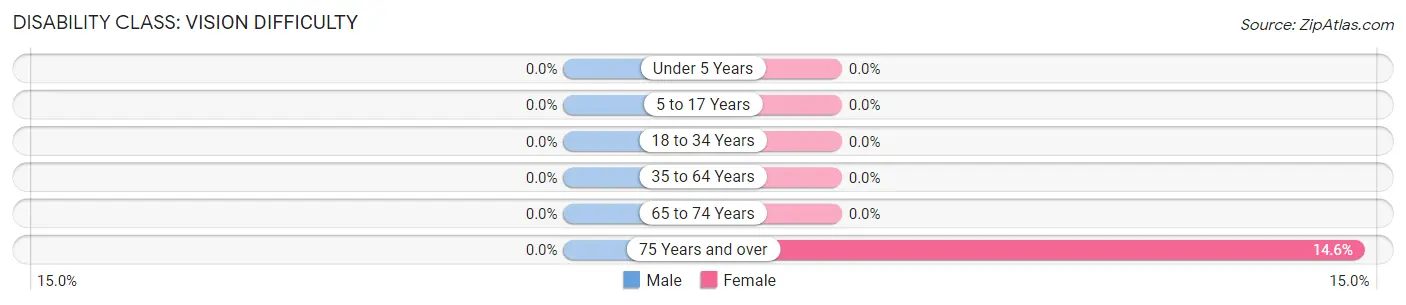
| Age Bracket | Male | Female |
| Under 5 Years | 0 (0.0%) | 0 (0.0%) |
| 5 to 17 Years | 0 (0.0%) | 0 (0.0%) |
| 18 to 34 Years | 0 (0.0%) | 0 (0.0%) |
| 35 to 64 Years | 0 (0.0%) | 0 (0.0%) |
| 65 to 74 Years | 0 (0.0%) | 0 (0.0%) |
| 75 Years and over | 0 (0.0%) | 23 (14.6%) |
Disability Class: Cognitive Difficulty
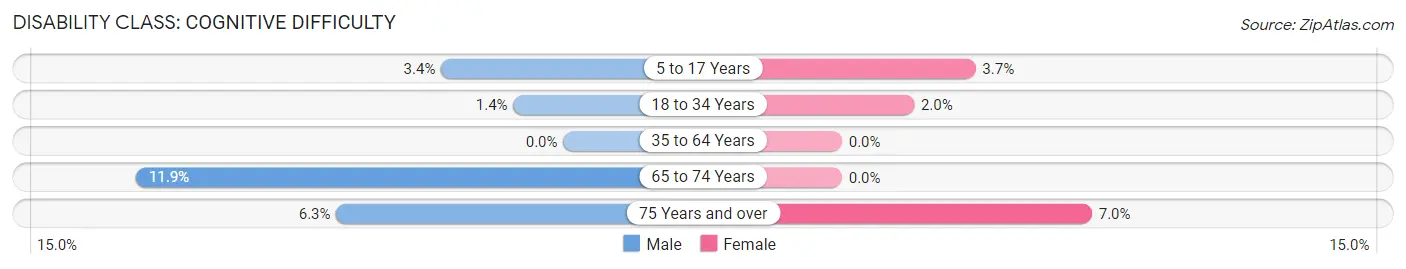
| Age Bracket | Male | Female |
| 5 to 17 Years | 12 (3.4%) | 10 (3.7%) |
| 18 to 34 Years | 7 (1.4%) | 7 (2.0%) |
| 35 to 64 Years | 0 (0.0%) | 0 (0.0%) |
| 65 to 74 Years | 25 (11.9%) | 0 (0.0%) |
| 75 Years and over | 6 (6.3%) | 11 (7.0%) |
Disability Class: Ambulatory Difficulty
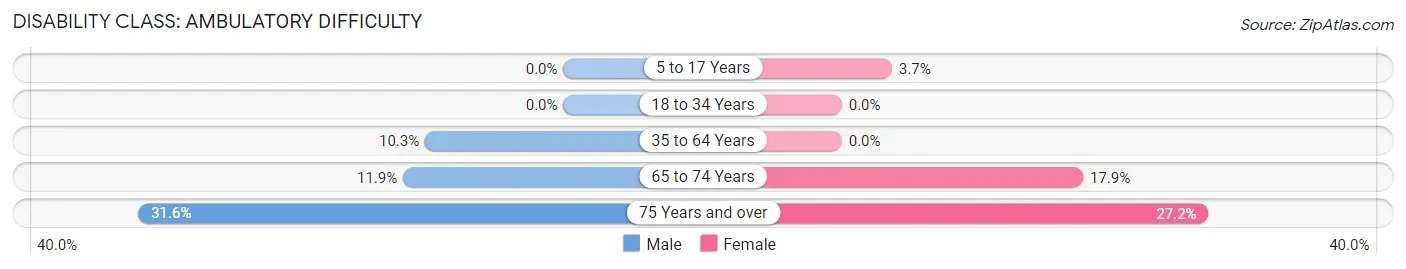
| Age Bracket | Male | Female |
| 5 to 17 Years | 0 (0.0%) | 10 (3.7%) |
| 18 to 34 Years | 0 (0.0%) | 0 (0.0%) |
| 35 to 64 Years | 54 (10.3%) | 0 (0.0%) |
| 65 to 74 Years | 25 (11.9%) | 48 (17.9%) |
| 75 Years and over | 30 (31.6%) | 43 (27.2%) |
Disability Class: Self-Care Difficulty
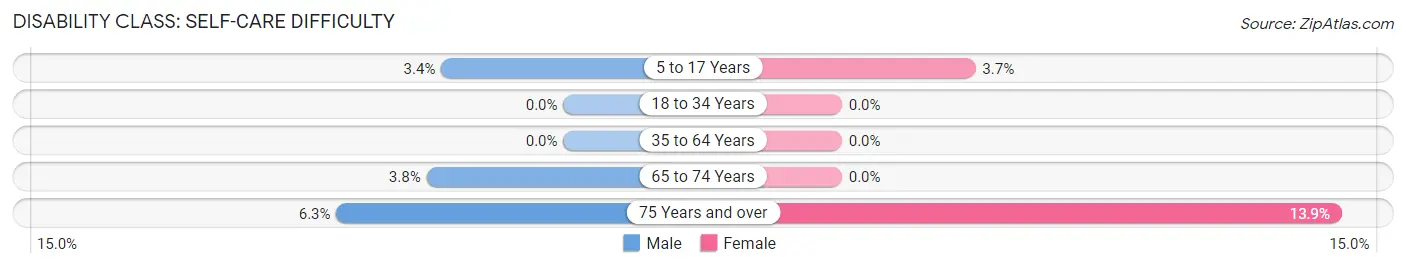
| Age Bracket | Male | Female |
| 5 to 17 Years | 12 (3.4%) | 10 (3.7%) |
| 18 to 34 Years | 0 (0.0%) | 0 (0.0%) |
| 35 to 64 Years | 0 (0.0%) | 0 (0.0%) |
| 65 to 74 Years | 8 (3.8%) | 0 (0.0%) |
| 75 Years and over | 6 (6.3%) | 22 (13.9%) |
Technology Access in Mifflinburg borough
Computing Device Access in Mifflinburg borough
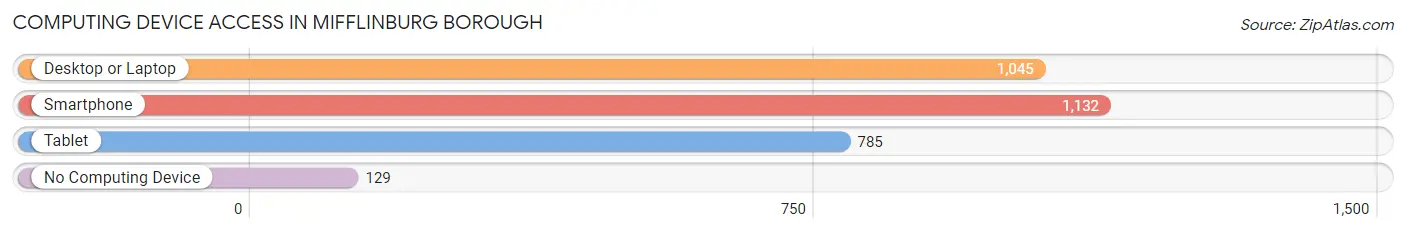
| Device Type | # Households | % Households |
| Desktop or Laptop | 1,045 | 73.4% |
| Smartphone | 1,132 | 79.5% |
| Tablet | 785 | 55.2% |
| No Computing Device | 129 | 9.1% |
| Total | 1,423 | 100.0% |
Internet Access in Mifflinburg borough
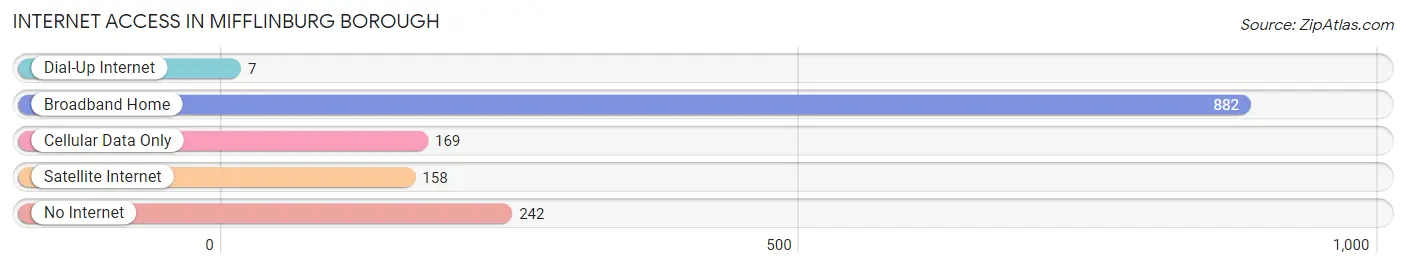
| Internet Type | # Households | % Households |
| Dial-Up Internet | 7 | 0.5% |
| Broadband Home | 882 | 62.0% |
| Cellular Data Only | 169 | 11.9% |
| Satellite Internet | 158 | 11.1% |
| No Internet | 242 | 17.0% |
| Total | 1,423 | 100.0% |
Mifflinburg borough Summary
Mifflinburg Borough is a small borough located in Union County, Pennsylvania. It is situated in the Susquehanna Valley, approximately 10 miles south of Lewisburg and 15 miles north of Selinsgrove. The population of Mifflinburg Borough was 2,541 at the 2010 census.
History
Mifflinburg was founded in 1792 by John Mifflin, a Revolutionary War veteran. The town was originally known as Mifflinburg Station, and was the first settlement in Union County. The town was laid out in 1793 and incorporated as a borough in 1845.
Mifflinburg was an important stop on the Susquehanna and Union Canal, which was built in the early 1800s. The canal was used to transport coal, lumber, and other goods from the Susquehanna Valley to the Lehigh Valley. The canal was eventually replaced by the Pennsylvania Railroad in the late 1800s.
Mifflinburg was also an important stop on the Underground Railroad. The town was a safe haven for escaped slaves, and many of the town’s residents were active in the abolitionist movement.
Geography
Mifflinburg Borough is located at 40°52'N 76°54'W (40.867, -76.900). It is situated in the Susquehanna Valley, approximately 10 miles south of Lewisburg and 15 miles north of Selinsgrove.
The borough is located in the Appalachian Mountains, and is surrounded by rolling hills and forests. The borough is located in the Middle Susquehanna River watershed.
Economy
Mifflinburg’s economy is largely based on agriculture and tourism. The borough is home to several farms, including dairy farms, beef farms, and vegetable farms. The borough is also home to several wineries and breweries.
The borough is also home to several small businesses, including restaurants, shops, and galleries. The borough is also home to several manufacturing companies, including a furniture manufacturer and a metal fabrication company.
Demographics
As of the 2010 census, the population of Mifflinburg Borough was 2,541. The racial makeup of the borough was 97.2% White, 0.7% African American, 0.2% Native American, 0.4% Asian, 0.1% Pacific Islander, 0.3% from other races, and 1.1% from two or more races. Hispanic or Latino of any race were 1.2% of the population.
The median household income in Mifflinburg Borough was $41,944, and the median family income was $50,938. The per capita income for the borough was $20,945. About 8.2% of families and 10.2% of the population were below the poverty line, including 14.2% of those under age 18 and 8.2% of those age 65 or over.
Common Questions
What is Per Capita Income in Mifflinburg borough?
Per Capita income in Mifflinburg borough is $32,492.
What is the Median Family Income in Mifflinburg borough?
Median Family Income in Mifflinburg borough is $76,466.
What is the Median Household income in Mifflinburg borough?
Median Household Income in Mifflinburg borough is $64,104.
What is Income or Wage Gap in Mifflinburg borough?
Income or Wage Gap in Mifflinburg borough is 41.4%.
Women in Mifflinburg borough earn 58.6 cents for every dollar earned by a man.
What is Inequality or Gini Index in Mifflinburg borough?
Inequality or Gini Index in Mifflinburg borough is 0.36.
What is the Total Population of Mifflinburg borough?
Total Population of Mifflinburg borough is 3,479.
What is the Total Male Population of Mifflinburg borough?
Total Male Population of Mifflinburg borough is 1,843.
What is the Total Female Population of Mifflinburg borough?
Total Female Population of Mifflinburg borough is 1,636.
What is the Ratio of Males per 100 Females in Mifflinburg borough?
There are 112.65 Males per 100 Females in Mifflinburg borough.
What is the Ratio of Females per 100 Males in Mifflinburg borough?
There are 88.77 Females per 100 Males in Mifflinburg borough.
What is the Median Population Age in Mifflinburg borough?
Median Population Age in Mifflinburg borough is 40.0 Years.
What is the Average Family Size in Mifflinburg borough
Average Family Size in Mifflinburg borough is 3.0 People.
What is the Average Household Size in Mifflinburg borough
Average Household Size in Mifflinburg borough is 2.4 People.
How Large is the Labor Force in Mifflinburg borough?
There are 1,875 People in the Labor Forcein in Mifflinburg borough.
What is the Percentage of People in the Labor Force in Mifflinburg borough?
68.0% of People are in the Labor Force in Mifflinburg borough.
What is the Unemployment Rate in Mifflinburg borough?
Unemployment Rate in Mifflinburg borough is 3.1%.