New Kensington, PA Map & Demographics
New Kensington Map
New Kensington Overview
$29,099
PER CAPITA INCOME
$64,702
AVG FAMILY INCOME
$47,015
AVG HOUSEHOLD INCOME
29.7%
WAGE / INCOME GAP [ % ]
70.3¢/ $1
WAGE / INCOME GAP [ $ ]
$14,229
FAMILY INCOME DEFICIT
0.42
INEQUALITY / GINI INDEX
12,163
TOTAL POPULATION
6,282
MALE POPULATION
5,881
FEMALE POPULATION
106.82
MALES / 100 FEMALES
93.62
FEMALES / 100 MALES
47.8
MEDIAN AGE
2.8
AVG FAMILY SIZE
2.0
AVG HOUSEHOLD SIZE
5,686
LABOR FORCE [ PEOPLE ]
56.4%
PERCENT IN LABOR FORCE
7.0%
UNEMPLOYMENT RATE
New Kensington Zip Codes
New Kensington Area Codes
Income in New Kensington
Income Overview in New Kensington
Per Capita Income in New Kensington is $29,099, while median incomes of families and households are $64,702 and $47,015 respectively.
| Characteristic | Number | Measure |
| Per Capita Income | 12,163 | $29,099 |
| Median Family Income | 3,017 | $64,702 |
| Mean Family Income | 3,017 | $74,923 |
| Median Household Income | 5,964 | $47,015 |
| Mean Household Income | 5,964 | $58,514 |
| Income Deficit | 3,017 | $14,229 |
| Wage / Income Gap (%) | 12,163 | 29.65% |
| Wage / Income Gap ($) | 12,163 | 70.35¢ per $1 |
| Gini / Inequality Index | 12,163 | 0.42 |
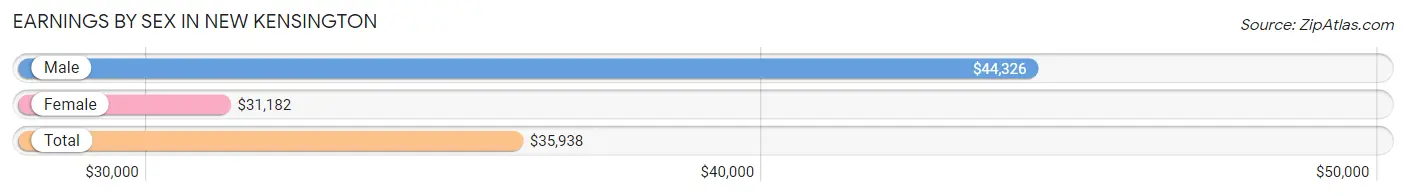
Earnings by Sex in New Kensington
Average Earnings in New Kensington are $35,938, $44,326 for men and $31,182 for women, a difference of 29.6%.
| Sex | Number | Average Earnings |
| Male | 3,297 (55.0%) | $44,326 |
| Female | 2,693 (45.0%) | $31,182 |
| Total | 5,990 (100.0%) | $35,938 |
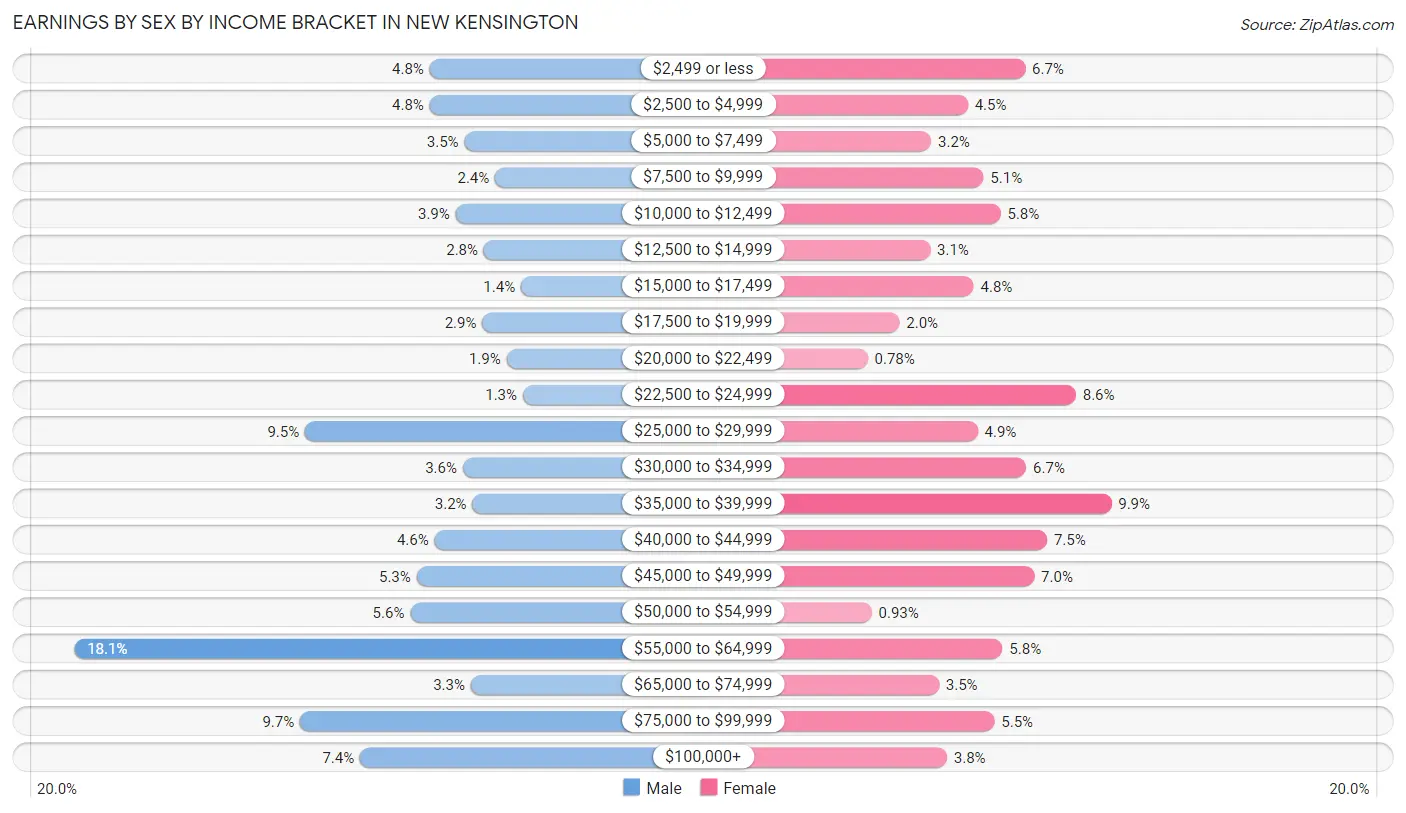
Earnings by Sex by Income Bracket in New Kensington
The most common earnings brackets in New Kensington are $55,000 to $64,999 for men (598 | 18.1%) and $35,000 to $39,999 for women (267 | 9.9%).
| Income | Male | Female |
| $2,499 or less | 159 (4.8%) | 180 (6.7%) |
| $2,500 to $4,999 | 159 (4.8%) | 122 (4.5%) |
| $5,000 to $7,499 | 116 (3.5%) | 85 (3.2%) |
| $7,500 to $9,999 | 78 (2.4%) | 138 (5.1%) |
| $10,000 to $12,499 | 127 (3.8%) | 155 (5.8%) |
| $12,500 to $14,999 | 92 (2.8%) | 84 (3.1%) |
| $15,000 to $17,499 | 46 (1.4%) | 128 (4.8%) |
| $17,500 to $19,999 | 94 (2.9%) | 53 (2.0%) |
| $20,000 to $22,499 | 64 (1.9%) | 21 (0.8%) |
| $22,500 to $24,999 | 44 (1.3%) | 231 (8.6%) |
| $25,000 to $29,999 | 313 (9.5%) | 132 (4.9%) |
| $30,000 to $34,999 | 118 (3.6%) | 181 (6.7%) |
| $35,000 to $39,999 | 106 (3.2%) | 267 (9.9%) |
| $40,000 to $44,999 | 153 (4.6%) | 202 (7.5%) |
| $45,000 to $49,999 | 175 (5.3%) | 189 (7.0%) |
| $50,000 to $54,999 | 183 (5.6%) | 25 (0.9%) |
| $55,000 to $64,999 | 598 (18.1%) | 157 (5.8%) |
| $65,000 to $74,999 | 108 (3.3%) | 93 (3.5%) |
| $75,000 to $99,999 | 319 (9.7%) | 149 (5.5%) |
| $100,000+ | 245 (7.4%) | 101 (3.7%) |
| Total | 3,297 (100.0%) | 2,693 (100.0%) |
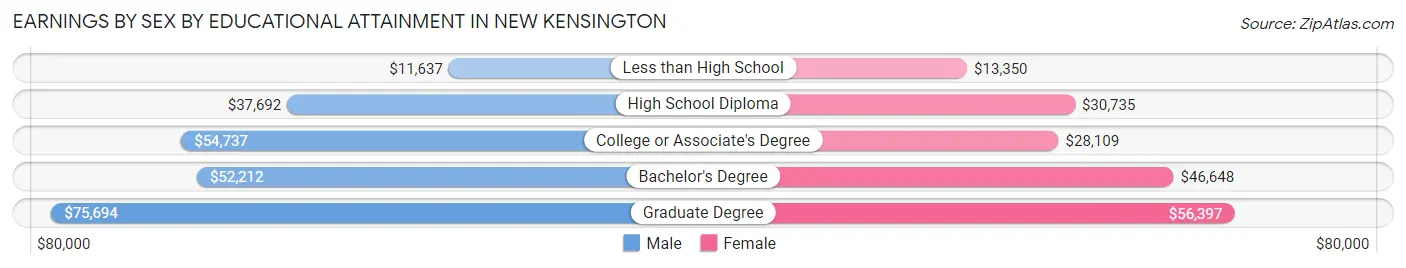
Earnings by Sex by Educational Attainment in New Kensington
Average earnings in New Kensington are $47,798 for men and $34,409 for women, a difference of 28.0%. Men with an educational attainment of graduate degree enjoy the highest average annual earnings of $75,694, while those with less than high school education earn the least with $11,637. Women with an educational attainment of graduate degree earn the most with the average annual earnings of $56,397, while those with less than high school education have the smallest earnings of $13,350.
| Educational Attainment | Male Income | Female Income |
| Less than High School | $11,637 | $13,350 |
| High School Diploma | $37,692 | $30,735 |
| College or Associate's Degree | $54,737 | $28,109 |
| Bachelor's Degree | $52,212 | $46,648 |
| Graduate Degree | $75,694 | $56,397 |
| Total | $47,798 | $34,409 |
Family Income in New Kensington
Family Income Brackets in New Kensington
According to the New Kensington family income data, there are 615 families falling into the $75,000 to $99,999 income range, which is the most common income bracket and makes up 20.4% of all families. Conversely, the less than $10,000 income bracket is the least frequent group with only 69 families (2.3%) belonging to this category.
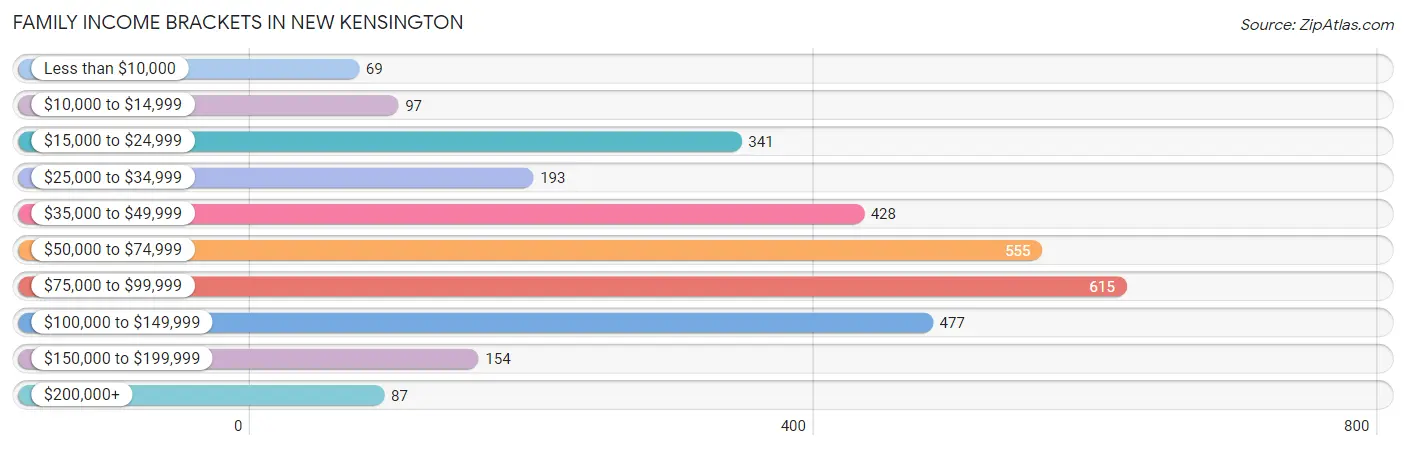
| Income Bracket | # Families | % Families |
| Less than $10,000 | 69 | 2.3% |
| $10,000 to $14,999 | 97 | 3.2% |
| $15,000 to $24,999 | 341 | 11.3% |
| $25,000 to $34,999 | 193 | 6.4% |
| $35,000 to $49,999 | 428 | 14.2% |
| $50,000 to $74,999 | 555 | 18.4% |
| $75,000 to $99,999 | 615 | 20.4% |
| $100,000 to $149,999 | 477 | 15.8% |
| $150,000 to $199,999 | 154 | 5.1% |
| $200,000+ | 87 | 2.9% |
Family Income by Famaliy Size in New Kensington
3-person families (487 | 16.1%) account for the highest median family income in New Kensington with $88,208 per family, while 2-person families (1,927 | 63.9%) have the highest median income of $30,065 per family member.
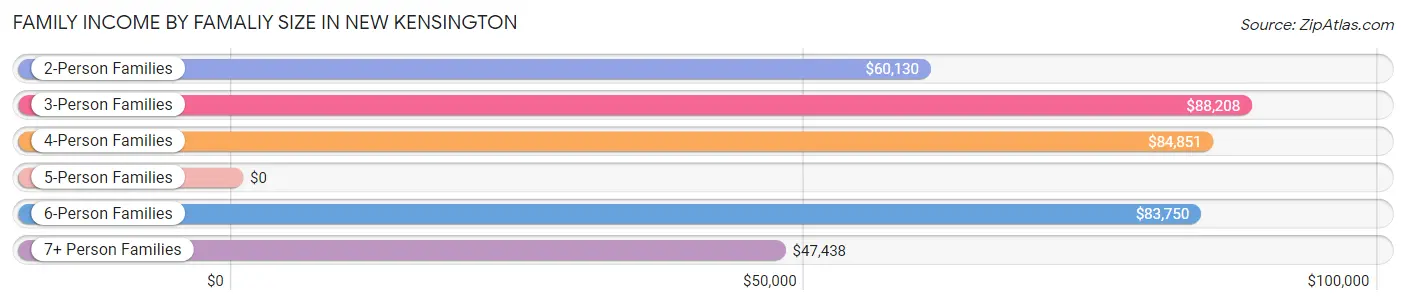
| Income Bracket | # Families | Median Income |
| 2-Person Families | 1,927 (63.9%) | $60,130 |
| 3-Person Families | 487 (16.1%) | $88,208 |
| 4-Person Families | 311 (10.3%) | $84,851 |
| 5-Person Families | 185 (6.1%) | $0 |
| 6-Person Families | 68 (2.2%) | $83,750 |
| 7+ Person Families | 39 (1.3%) | $47,438 |
| Total | 3,017 (100.0%) | $64,702 |
Family Income by Number of Earners in New Kensington
The median family income in New Kensington is $64,702, with families comprising 3+ earners (279) having the highest median family income of $115,337, while families with no earners (777) have the lowest median family income of $35,885, accounting for 9.2% and 25.8% of families, respectively.
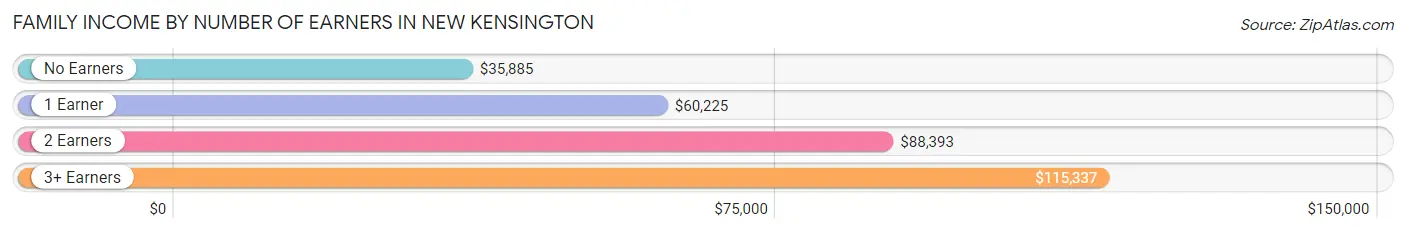
| Number of Earners | # Families | Median Income |
| No Earners | 777 (25.8%) | $35,885 |
| 1 Earner | 974 (32.3%) | $60,225 |
| 2 Earners | 987 (32.7%) | $88,393 |
| 3+ Earners | 279 (9.2%) | $115,337 |
| Total | 3,017 (100.0%) | $64,702 |
Household Income in New Kensington
Household Income Brackets in New Kensington
With 1,068 households falling in the category, the $50,000 to $74,999 income range is the most frequent in New Kensington, accounting for 17.9% of all households. In contrast, only 89 households (1.5%) fall into the $200,000+ income bracket, making it the least populous group.
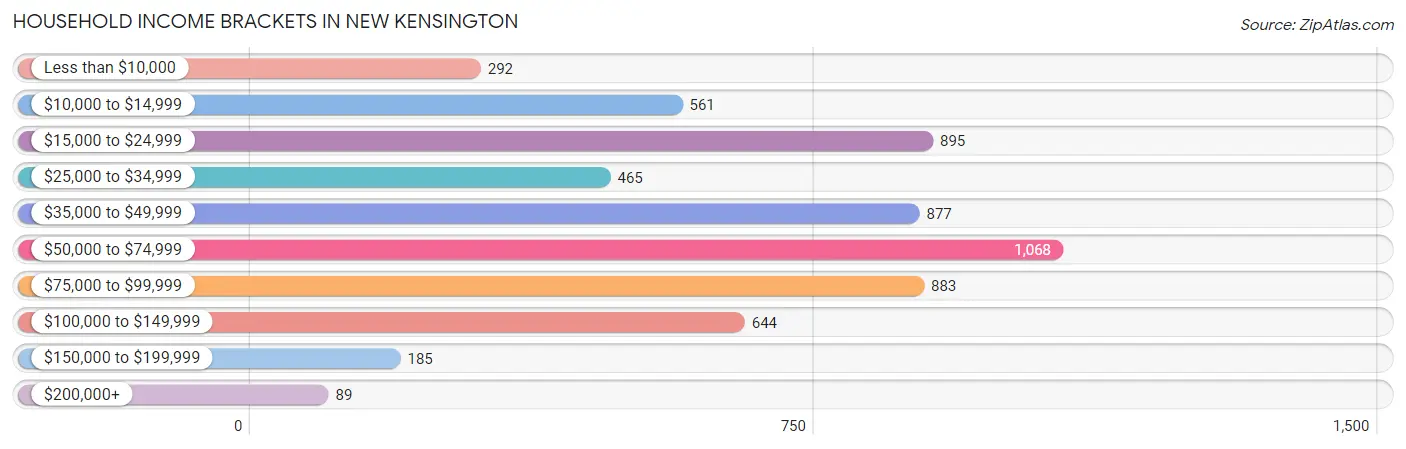
| Income Bracket | # Households | % Households |
| Less than $10,000 | 292 | 4.9% |
| $10,000 to $14,999 | 561 | 9.4% |
| $15,000 to $24,999 | 895 | 15.0% |
| $25,000 to $34,999 | 465 | 7.8% |
| $35,000 to $49,999 | 877 | 14.7% |
| $50,000 to $74,999 | 1,068 | 17.9% |
| $75,000 to $99,999 | 883 | 14.8% |
| $100,000 to $149,999 | 644 | 10.8% |
| $150,000 to $199,999 | 185 | 3.1% |
| $200,000+ | 89 | 1.5% |
Household Income by Householder Age in New Kensington
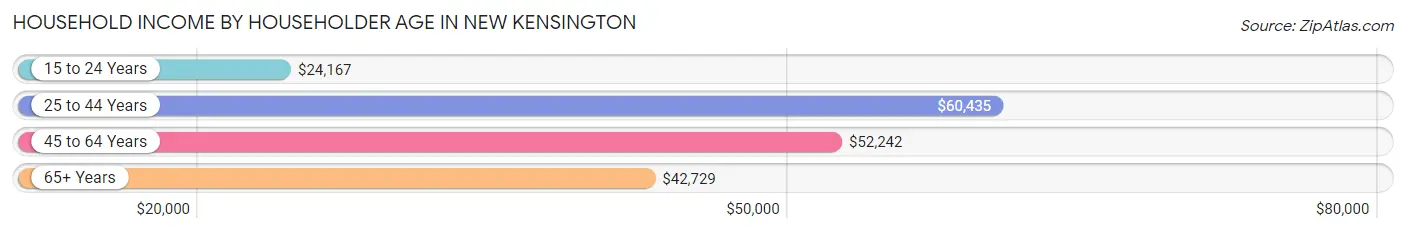
The median household income in New Kensington is $47,015, with the highest median household income of $60,435 found in the 25 to 44 years age bracket for the primary householder. A total of 1,396 households (23.4%) fall into this category. Meanwhile, the 15 to 24 years age bracket for the primary householder has the lowest median household income of $24,167, with 228 households (3.8%) in this group.
| Income Bracket | # Households | Median Income |
| 15 to 24 Years | 228 (3.8%) | $24,167 |
| 25 to 44 Years | 1,396 (23.4%) | $60,435 |
| 45 to 64 Years | 2,467 (41.4%) | $52,242 |
| 65+ Years | 1,873 (31.4%) | $42,729 |
| Total | 5,964 (100.0%) | $47,015 |
Poverty in New Kensington
Income Below Poverty by Sex and Age in New Kensington
With 18.4% poverty level for males and 20.5% for females among the residents of New Kensington, 15 year old males and 15 year old females are the most vulnerable to poverty, with 36 males (57.1%) and 45 females (57.0%) in their respective age groups living below the poverty level.
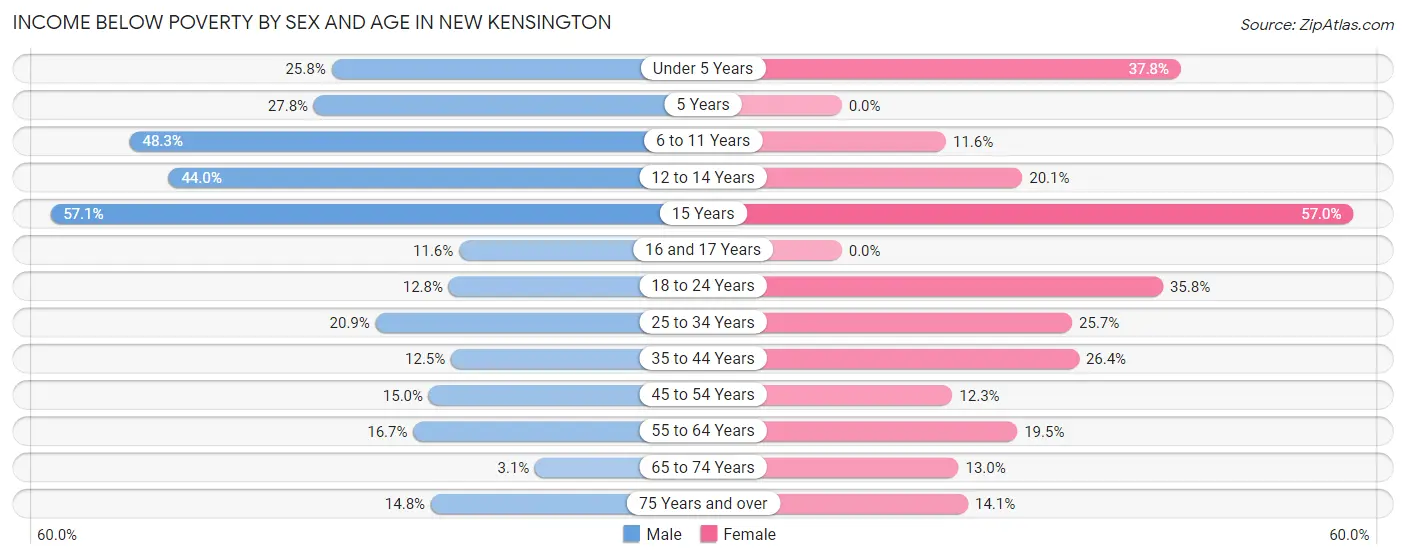
| Age Bracket | Male | Female |
| Under 5 Years | 95 (25.8%) | 125 (37.8%) |
| 5 Years | 10 (27.8%) | 0 (0.0%) |
| 6 to 11 Years | 215 (48.3%) | 36 (11.6%) |
| 12 to 14 Years | 62 (44.0%) | 42 (20.1%) |
| 15 Years | 36 (57.1%) | 45 (57.0%) |
| 16 and 17 Years | 13 (11.6%) | 0 (0.0%) |
| 18 to 24 Years | 61 (12.8%) | 137 (35.8%) |
| 25 to 34 Years | 184 (20.9%) | 158 (25.7%) |
| 35 to 44 Years | 67 (12.5%) | 145 (26.4%) |
| 45 to 54 Years | 105 (15.0%) | 67 (12.3%) |
| 55 to 64 Years | 196 (16.7%) | 248 (19.5%) |
| 65 to 74 Years | 24 (3.1%) | 101 (13.0%) |
| 75 Years and over | 82 (14.7%) | 96 (14.1%) |
| Total | 1,150 (18.4%) | 1,200 (20.5%) |
Income Above Poverty by Sex and Age in New Kensington
According to the poverty statistics in New Kensington, males aged 65 to 74 years and females aged 5 years are the age groups that are most secure financially, with 96.9% of males and 100.0% of females in these age groups living above the poverty line.
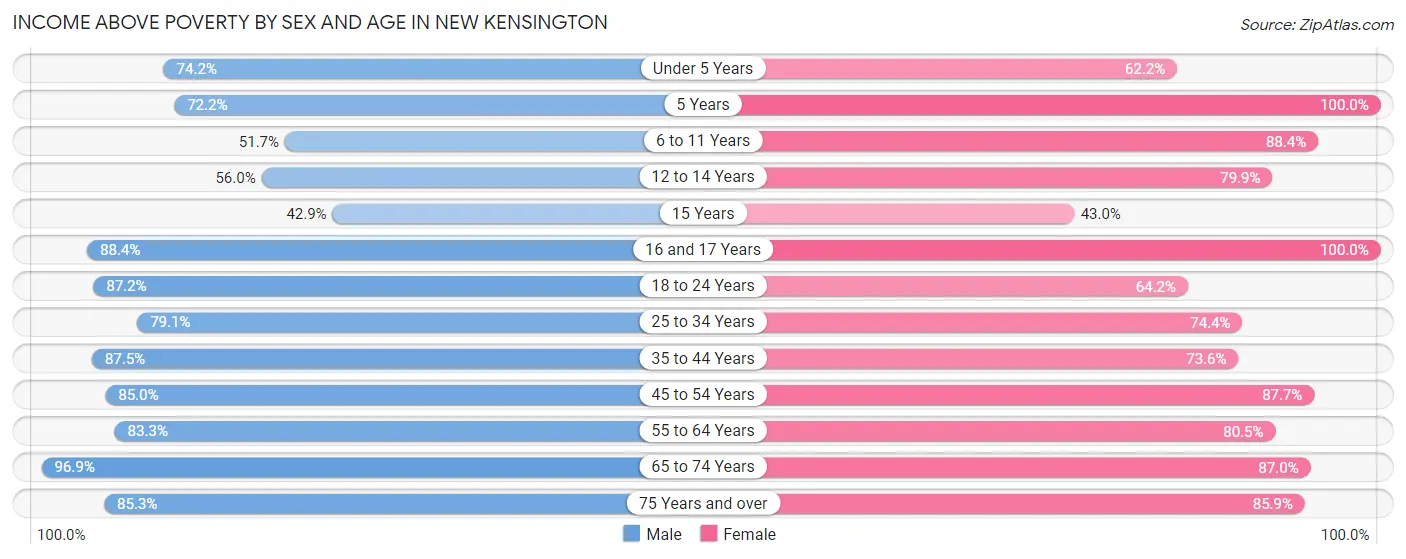
| Age Bracket | Male | Female |
| Under 5 Years | 273 (74.2%) | 206 (62.2%) |
| 5 Years | 26 (72.2%) | 30 (100.0%) |
| 6 to 11 Years | 230 (51.7%) | 274 (88.4%) |
| 12 to 14 Years | 79 (56.0%) | 167 (79.9%) |
| 15 Years | 27 (42.9%) | 34 (43.0%) |
| 16 and 17 Years | 99 (88.4%) | 60 (100.0%) |
| 18 to 24 Years | 417 (87.2%) | 246 (64.2%) |
| 25 to 34 Years | 696 (79.1%) | 458 (74.4%) |
| 35 to 44 Years | 469 (87.5%) | 404 (73.6%) |
| 45 to 54 Years | 596 (85.0%) | 477 (87.7%) |
| 55 to 64 Years | 977 (83.3%) | 1,021 (80.5%) |
| 65 to 74 Years | 741 (96.9%) | 676 (87.0%) |
| 75 Years and over | 474 (85.3%) | 587 (85.9%) |
| Total | 5,104 (81.6%) | 4,640 (79.4%) |
Income Below Poverty Among Married-Couple Families in New Kensington
The poverty statistics for married-couple families in New Kensington show that 3.6% or 75 of the total 2,087 families live below the poverty line. Families with 3 or 4 children have the highest poverty rate of 18.9%, comprising of 30 families. On the other hand, families with no children have the lowest poverty rate of 2.3%, which includes 36 families.
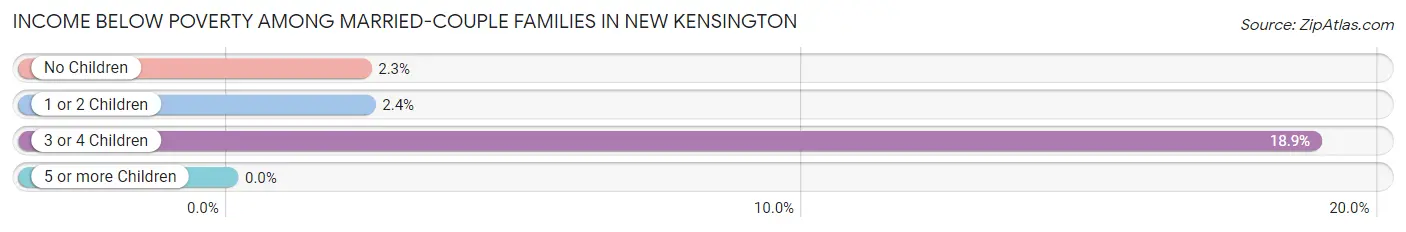
| Children | Above Poverty | Below Poverty |
| No Children | 1,516 (97.7%) | 36 (2.3%) |
| 1 or 2 Children | 367 (97.6%) | 9 (2.4%) |
| 3 or 4 Children | 129 (81.1%) | 30 (18.9%) |
| 5 or more Children | 0 (0.0%) | 0 (0.0%) |
| Total | 2,012 (96.4%) | 75 (3.6%) |
Income Below Poverty Among Single-Parent Households in New Kensington
According to the poverty data in New Kensington, 24.3% or 58 single-father households and 21.3% or 147 single-mother households are living below the poverty line. Among single-father households, those with 3 or 4 children have the highest poverty rate, with 45 households (100.0%) experiencing poverty. Likewise, among single-mother households, those with 3 or 4 children have the highest poverty rate, with 60 households (73.2%) falling below the poverty line.
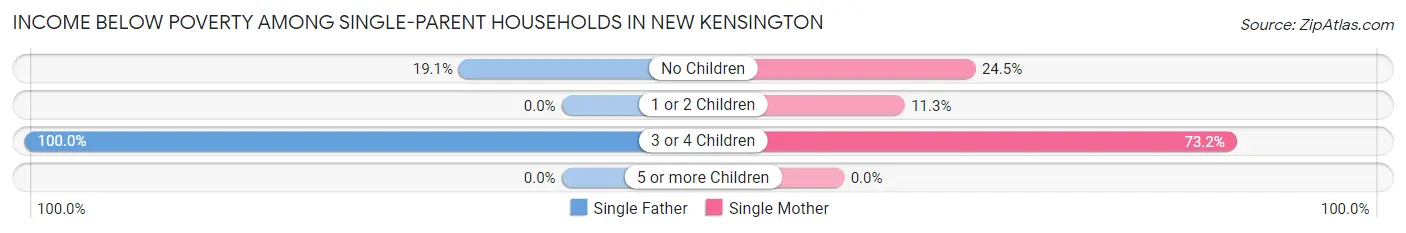
| Children | Single Father | Single Mother |
| No Children | 13 (19.1%) | 34 (24.5%) |
| 1 or 2 Children | 0 (0.0%) | 53 (11.3%) |
| 3 or 4 Children | 45 (100.0%) | 60 (73.2%) |
| 5 or more Children | 0 (0.0%) | 0 (0.0%) |
| Total | 58 (24.3%) | 147 (21.3%) |
Income Below Poverty Among Married-Couple vs Single-Parent Households in New Kensington
The poverty data for New Kensington shows that 75 of the married-couple family households (3.6%) and 205 of the single-parent households (22.0%) are living below the poverty level. Within the married-couple family households, those with 3 or 4 children have the highest poverty rate, with 30 households (18.9%) falling below the poverty line. Among the single-parent households, those with 3 or 4 children have the highest poverty rate, with 105 household (82.7%) living below poverty.
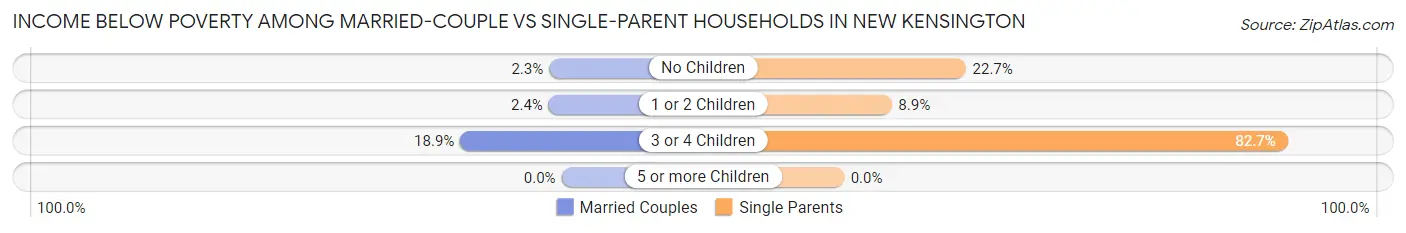
| Children | Married-Couple Families | Single-Parent Households |
| No Children | 36 (2.3%) | 47 (22.7%) |
| 1 or 2 Children | 9 (2.4%) | 53 (8.9%) |
| 3 or 4 Children | 30 (18.9%) | 105 (82.7%) |
| 5 or more Children | 0 (0.0%) | 0 (0.0%) |
| Total | 75 (3.6%) | 205 (22.0%) |
Race in New Kensington
The most populous races in New Kensington are White / Caucasian (10,032 | 82.5%), Black / African American (1,544 | 12.7%), and Two or more Races (256 | 2.1%).
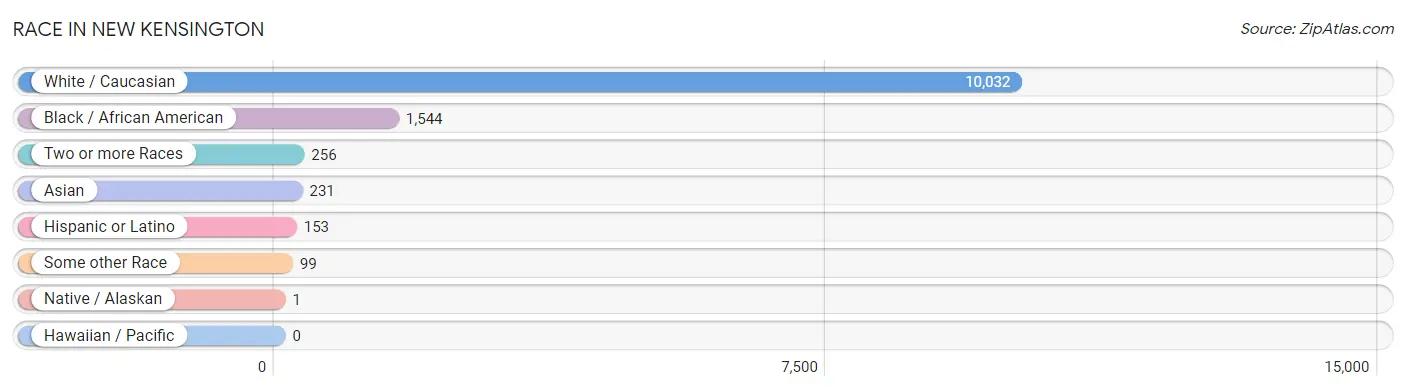
| Race | # Population | % Population |
| Asian | 231 | 1.9% |
| Black / African American | 1,544 | 12.7% |
| Hawaiian / Pacific | 0 | 0.0% |
| Hispanic or Latino | 153 | 1.3% |
| Native / Alaskan | 1 | 0.0% |
| White / Caucasian | 10,032 | 82.5% |
| Two or more Races | 256 | 2.1% |
| Some other Race | 99 | 0.8% |
| Total | 12,163 | 100.0% |
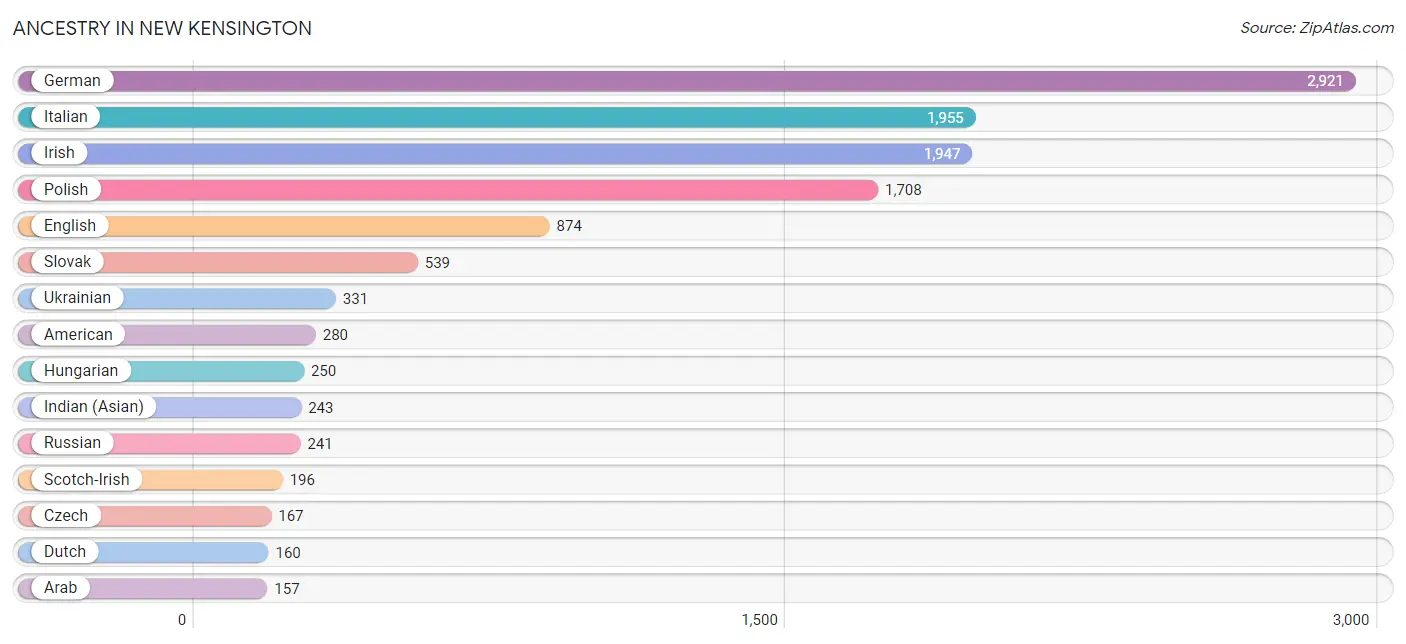
Ancestry in New Kensington
The most populous ancestries reported in New Kensington are German (2,921 | 24.0%), Italian (1,955 | 16.1%), Irish (1,947 | 16.0%), Polish (1,708 | 14.0%), and English (874 | 7.2%), together accounting for 77.3% of all New Kensington residents.
| Ancestry | # Population | % Population |
| African | 71 | 0.6% |
| American | 280 | 2.3% |
| Arab | 157 | 1.3% |
| Austrian | 60 | 0.5% |
| Belgian | 33 | 0.3% |
| Blackfeet | 3 | 0.0% |
| British | 23 | 0.2% |
| Bulgarian | 10 | 0.1% |
| Central American Indian | 5 | 0.0% |
| Cherokee | 9 | 0.1% |
| Croatian | 55 | 0.4% |
| Czech | 167 | 1.4% |
| Czechoslovakian | 34 | 0.3% |
| Danish | 6 | 0.1% |
| Dominican | 44 | 0.4% |
| Dutch | 160 | 1.3% |
| Eastern European | 19 | 0.2% |
| English | 874 | 7.2% |
| European | 68 | 0.6% |
| Finnish | 13 | 0.1% |
| French | 60 | 0.5% |
| French Canadian | 35 | 0.3% |
| German | 2,921 | 24.0% |
| Greek | 23 | 0.2% |
| Hungarian | 250 | 2.1% |
| Indian (Asian) | 243 | 2.0% |
| Irish | 1,947 | 16.0% |
| Iroquois | 33 | 0.3% |
| Italian | 1,955 | 16.1% |
| Jamaican | 14 | 0.1% |
| Lebanese | 24 | 0.2% |
| Lithuanian | 44 | 0.4% |
| Mexican | 92 | 0.8% |
| Nigerian | 12 | 0.1% |
| Northern European | 19 | 0.2% |
| Pennsylvania German | 9 | 0.1% |
| Polish | 1,708 | 14.0% |
| Puerto Rican | 5 | 0.0% |
| Romanian | 23 | 0.2% |
| Russian | 241 | 2.0% |
| Scandinavian | 28 | 0.2% |
| Scotch-Irish | 196 | 1.6% |
| Scottish | 117 | 1.0% |
| Serbian | 35 | 0.3% |
| Slavic | 65 | 0.5% |
| Slovak | 539 | 4.4% |
| Slovene | 62 | 0.5% |
| Spaniard | 5 | 0.0% |
| Subsaharan African | 83 | 0.7% |
| Swedish | 52 | 0.4% |
| Swiss | 5 | 0.0% |
| Syrian | 138 | 1.1% |
| Ukrainian | 331 | 2.7% |
| Welsh | 63 | 0.5% | View All 54 Rows |
Immigrants in New Kensington
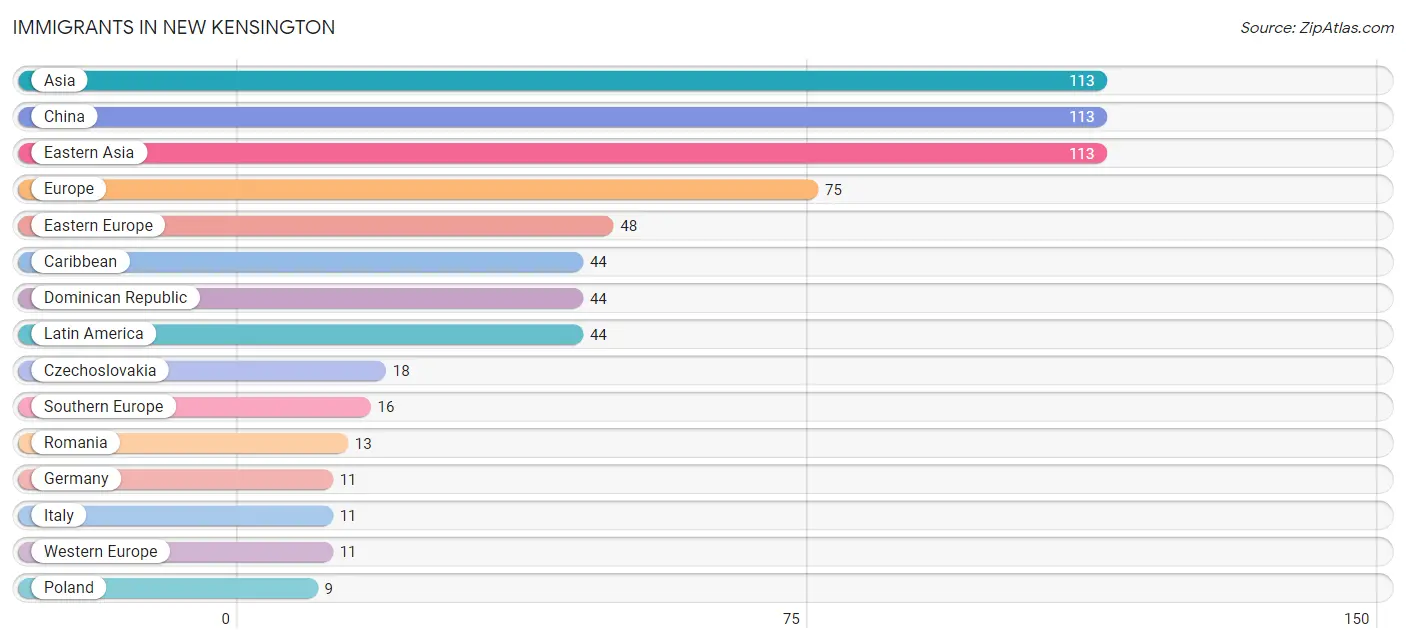
The most numerous immigrant groups reported in New Kensington came from Asia (113 | 0.9%), China (113 | 0.9%), Eastern Asia (113 | 0.9%), Europe (75 | 0.6%), and Eastern Europe (48 | 0.4%), together accounting for 3.8% of all New Kensington residents.
| Immigration Origin | # Population | % Population |
| Asia | 113 | 0.9% |
| Caribbean | 44 | 0.4% |
| China | 113 | 0.9% |
| Czechoslovakia | 18 | 0.2% |
| Dominican Republic | 44 | 0.4% |
| Eastern Asia | 113 | 0.9% |
| Eastern Europe | 48 | 0.4% |
| Europe | 75 | 0.6% |
| Germany | 11 | 0.1% |
| Italy | 11 | 0.1% |
| Latin America | 44 | 0.4% |
| Poland | 9 | 0.1% |
| Romania | 13 | 0.1% |
| Russia | 8 | 0.1% |
| Southern Europe | 16 | 0.1% |
| Spain | 5 | 0.0% |
| Western Europe | 11 | 0.1% | View All 17 Rows |
Sex and Age in New Kensington
Sex and Age in New Kensington
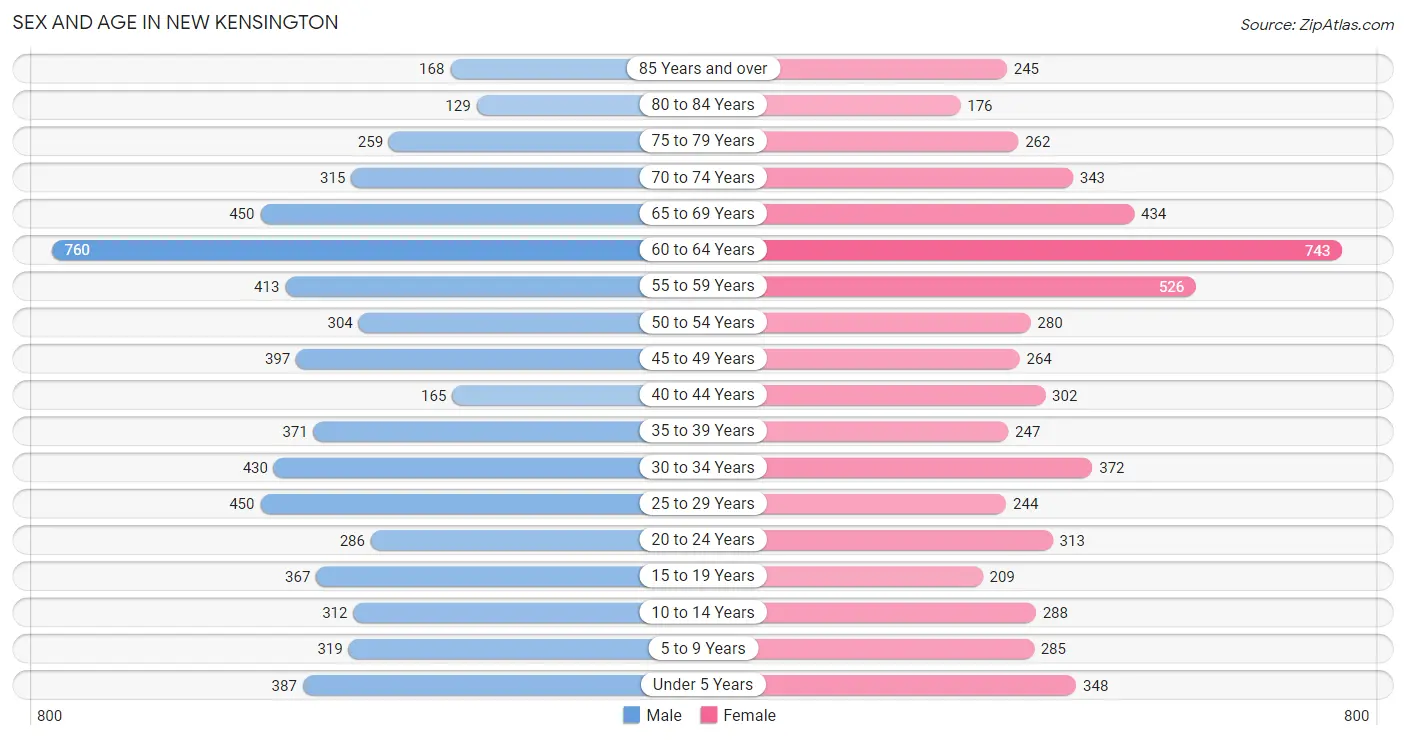
The most populous age groups in New Kensington are 60 to 64 Years (760 | 12.1%) for men and 60 to 64 Years (743 | 12.6%) for women.
| Age Bracket | Male | Female |
| Under 5 Years | 387 (6.2%) | 348 (5.9%) |
| 5 to 9 Years | 319 (5.1%) | 285 (4.9%) |
| 10 to 14 Years | 312 (5.0%) | 288 (4.9%) |
| 15 to 19 Years | 367 (5.8%) | 209 (3.5%) |
| 20 to 24 Years | 286 (4.5%) | 313 (5.3%) |
| 25 to 29 Years | 450 (7.2%) | 244 (4.2%) |
| 30 to 34 Years | 430 (6.8%) | 372 (6.3%) |
| 35 to 39 Years | 371 (5.9%) | 247 (4.2%) |
| 40 to 44 Years | 165 (2.6%) | 302 (5.1%) |
| 45 to 49 Years | 397 (6.3%) | 264 (4.5%) |
| 50 to 54 Years | 304 (4.8%) | 280 (4.8%) |
| 55 to 59 Years | 413 (6.6%) | 526 (8.9%) |
| 60 to 64 Years | 760 (12.1%) | 743 (12.6%) |
| 65 to 69 Years | 450 (7.2%) | 434 (7.4%) |
| 70 to 74 Years | 315 (5.0%) | 343 (5.8%) |
| 75 to 79 Years | 259 (4.1%) | 262 (4.5%) |
| 80 to 84 Years | 129 (2.1%) | 176 (3.0%) |
| 85 Years and over | 168 (2.7%) | 245 (4.2%) |
| Total | 6,282 (100.0%) | 5,881 (100.0%) |
Families and Households in New Kensington
Median Family Size in New Kensington
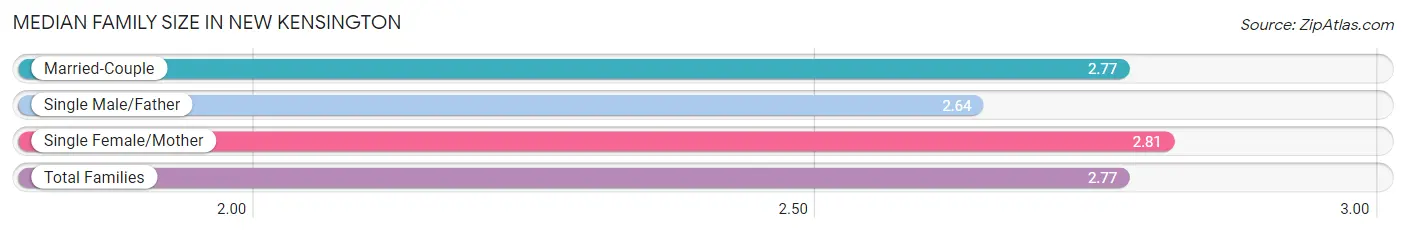
The median family size in New Kensington is 2.77 persons per family, with single female/mother families (691 | 22.9%) accounting for the largest median family size of 2.81 persons per family. On the other hand, single male/father families (239 | 7.9%) represent the smallest median family size with 2.64 persons per family.
| Family Type | # Families | Family Size |
| Married-Couple | 2,087 (69.2%) | 2.77 |
| Single Male/Father | 239 (7.9%) | 2.64 |
| Single Female/Mother | 691 (22.9%) | 2.81 |
| Total Families | 3,017 (100.0%) | 2.77 |
Median Household Size in New Kensington
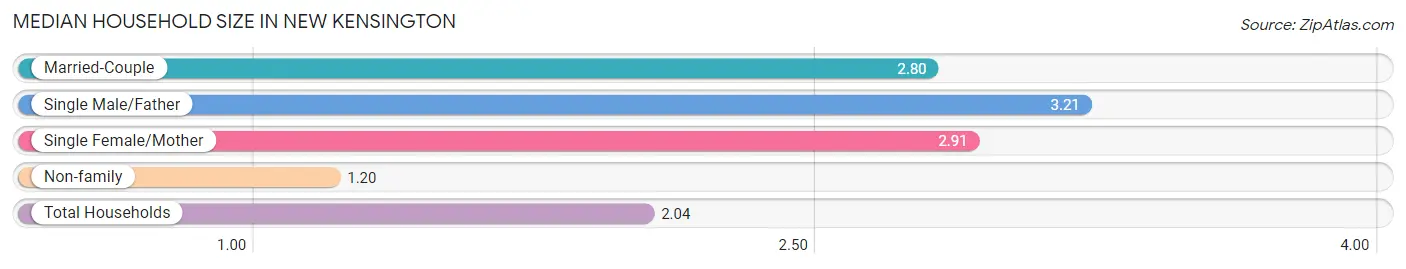
The median household size in New Kensington is 2.04 persons per household, with single male/father households (239 | 4.0%) accounting for the largest median household size of 3.21 persons per household. non-family households (2,947 | 49.4%) represent the smallest median household size with 1.20 persons per household.
| Household Type | # Households | Household Size |
| Married-Couple | 2,087 (35.0%) | 2.80 |
| Single Male/Father | 239 (4.0%) | 3.21 |
| Single Female/Mother | 691 (11.6%) | 2.91 |
| Non-family | 2,947 (49.4%) | 1.20 |
| Total Households | 5,964 (100.0%) | 2.04 |
Household Size by Marriage Status in New Kensington
Out of a total of 5,964 households in New Kensington, 3,017 (50.6%) are family households, while 2,947 (49.4%) are nonfamily households. The most numerous type of family households are 2-person households, comprising 1,715, and the most common type of nonfamily households are 1-person households, comprising 2,481.
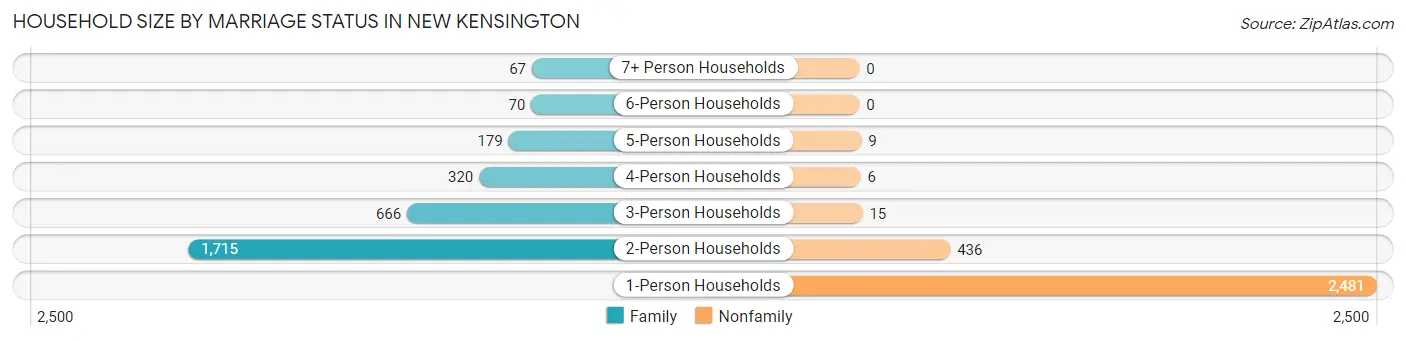
| Household Size | Family Households | Nonfamily Households |
| 1-Person Households | - | 2,481 (41.6%) |
| 2-Person Households | 1,715 (28.8%) | 436 (7.3%) |
| 3-Person Households | 666 (11.2%) | 15 (0.3%) |
| 4-Person Households | 320 (5.4%) | 6 (0.1%) |
| 5-Person Households | 179 (3.0%) | 9 (0.2%) |
| 6-Person Households | 70 (1.2%) | 0 (0.0%) |
| 7+ Person Households | 67 (1.1%) | 0 (0.0%) |
| Total | 3,017 (50.6%) | 2,947 (49.4%) |
Female Fertility in New Kensington
Fertility by Age in New Kensington
Average fertility rate in New Kensington is 83.0 births per 1,000 women. Women in the age bracket of 15 to 19 years have the highest fertility rate with 163.0 births per 1,000 women. Women in the age bracket of 20 to 34 years acount for 75.6% of all women with births.
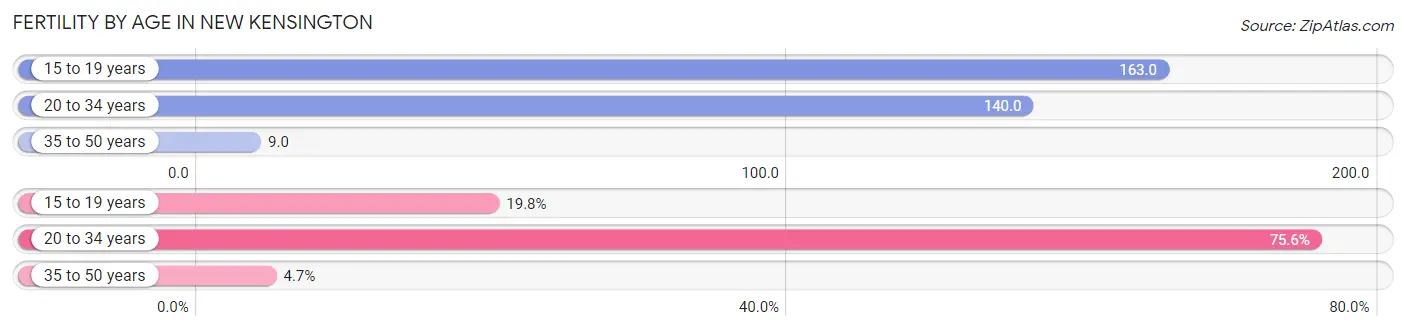
| Age Bracket | Women with Births | Births / 1,000 Women |
| 15 to 19 years | 34 (19.8%) | 163.0 |
| 20 to 34 years | 130 (75.6%) | 140.0 |
| 35 to 50 years | 8 (4.6%) | 9.0 |
| Total | 172 (100.0%) | 83.0 |
Fertility by Age by Marriage Status in New Kensington
23.8% of women with births (172) in New Kensington are married. The highest percentage of unmarried women with births falls into 15 to 19 years age bracket with 100.0% of them unmarried at the time of birth, while the lowest percentage of unmarried women with births belong to 35 to 50 years age bracket with 0.0% of them unmarried.
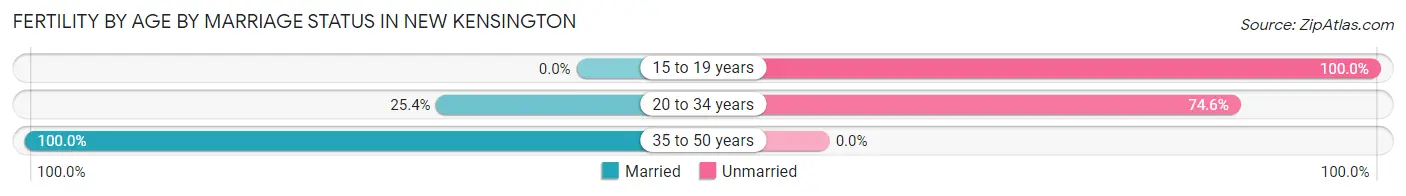
| Age Bracket | Married | Unmarried |
| 15 to 19 years | 0 (0.0%) | 34 (100.0%) |
| 20 to 34 years | 33 (25.4%) | 97 (74.6%) |
| 35 to 50 years | 8 (100.0%) | 0 (0.0%) |
| Total | 41 (23.8%) | 131 (76.2%) |
Fertility by Education in New Kensington
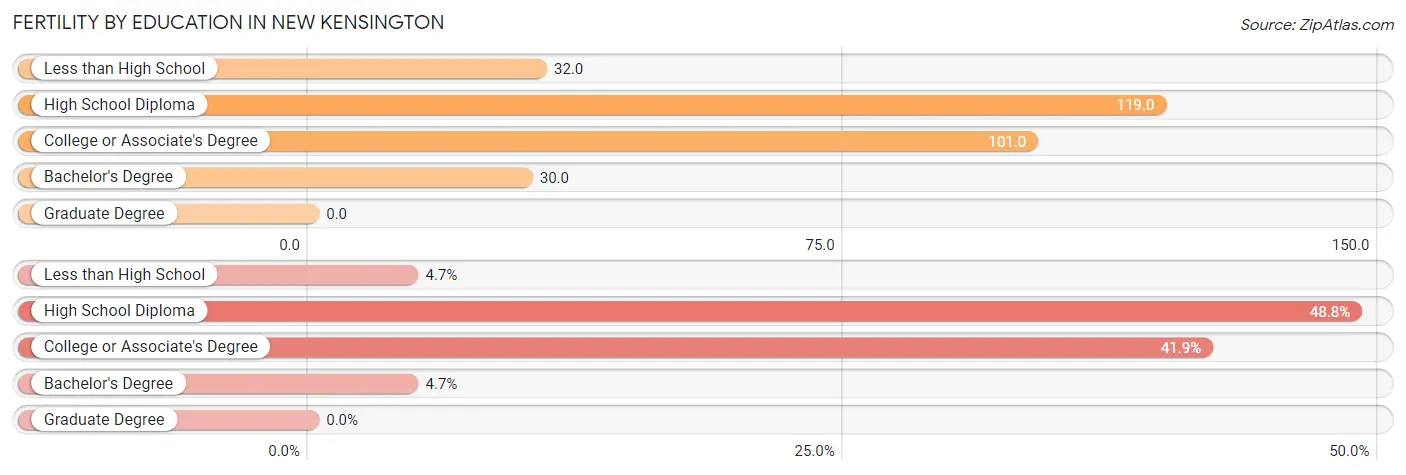
| Educational Attainment | Women with Births | Births / 1,000 Women |
| Less than High School | 8 (4.6%) | 32.0 |
| High School Diploma | 84 (48.8%) | 119.0 |
| College or Associate's Degree | 72 (41.9%) | 101.0 |
| Bachelor's Degree | 8 (4.6%) | 30.0 |
| Graduate Degree | 0 (0.0%) | 0.0 |
| Total | 172 (100.0%) | 83.0 |
Fertility by Education by Marriage Status in New Kensington
76.2% of women with births in New Kensington are unmarried. Women with the educational attainment of bachelor's degree are most likely to be married with 100.0% of them married at childbirth, while women with the educational attainment of less than high school are least likely to be married with 100.0% of them unmarried at childbirth.
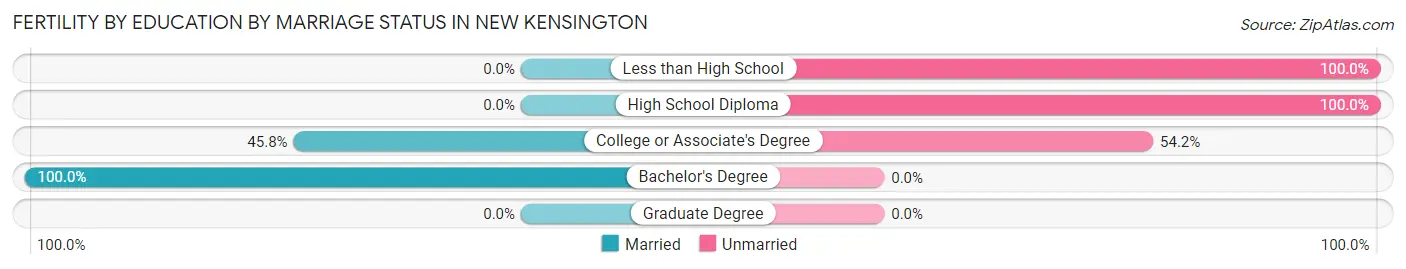
| Educational Attainment | Married | Unmarried |
| Less than High School | 0 (0.0%) | 8 (100.0%) |
| High School Diploma | 0 (0.0%) | 84 (100.0%) |
| College or Associate's Degree | 33 (45.8%) | 39 (54.2%) |
| Bachelor's Degree | 8 (100.0%) | 0 (0.0%) |
| Graduate Degree | 0 (0.0%) | 0 (0.0%) |
| Total | 41 (23.8%) | 131 (76.2%) |
Employment Characteristics in New Kensington
Employment by Class of Employer in New Kensington
Among the 5,186 employed individuals in New Kensington, private company employees (3,759 | 72.5%), not-for-profit organizations (523 | 10.1%), and local government employees (257 | 5.0%) make up the most common classes of employment.
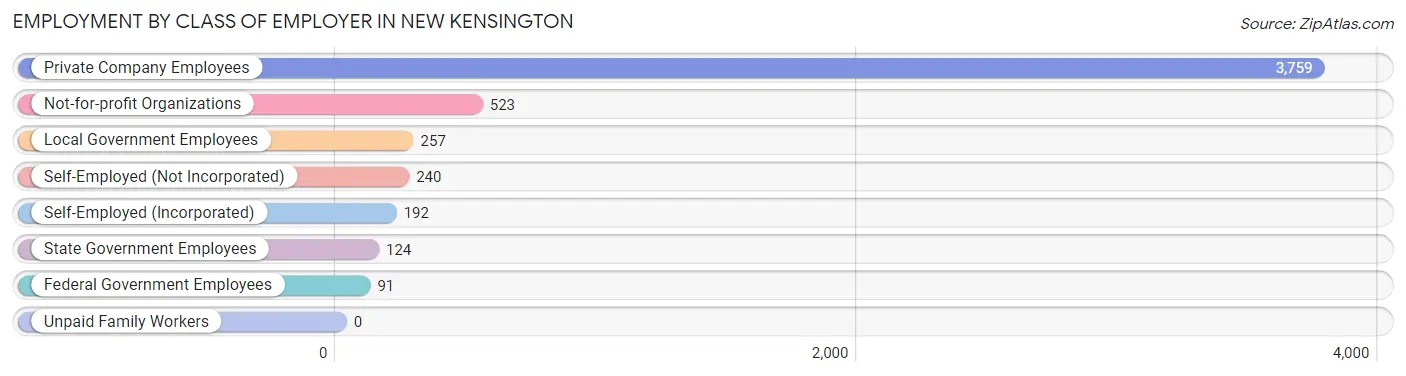
| Employer Class | # Employees | % Employees |
| Private Company Employees | 3,759 | 72.5% |
| Self-Employed (Incorporated) | 192 | 3.7% |
| Self-Employed (Not Incorporated) | 240 | 4.6% |
| Not-for-profit Organizations | 523 | 10.1% |
| Local Government Employees | 257 | 5.0% |
| State Government Employees | 124 | 2.4% |
| Federal Government Employees | 91 | 1.8% |
| Unpaid Family Workers | 0 | 0.0% |
| Total | 5,186 | 100.0% |
Employment Status by Age in New Kensington
According to the labor force statistics for New Kensington, out of the total population over 16 years of age (10,082), 56.4% or 5,686 individuals are in the labor force, with 7.0% or 398 of them unemployed. The age group with the highest labor force participation rate is 20 to 24 years, with 87.5% or 524 individuals in the labor force. Within the labor force, the 25 to 29 years age range has the highest percentage of unemployed individuals, with 11.7% or 61 of them being unemployed.
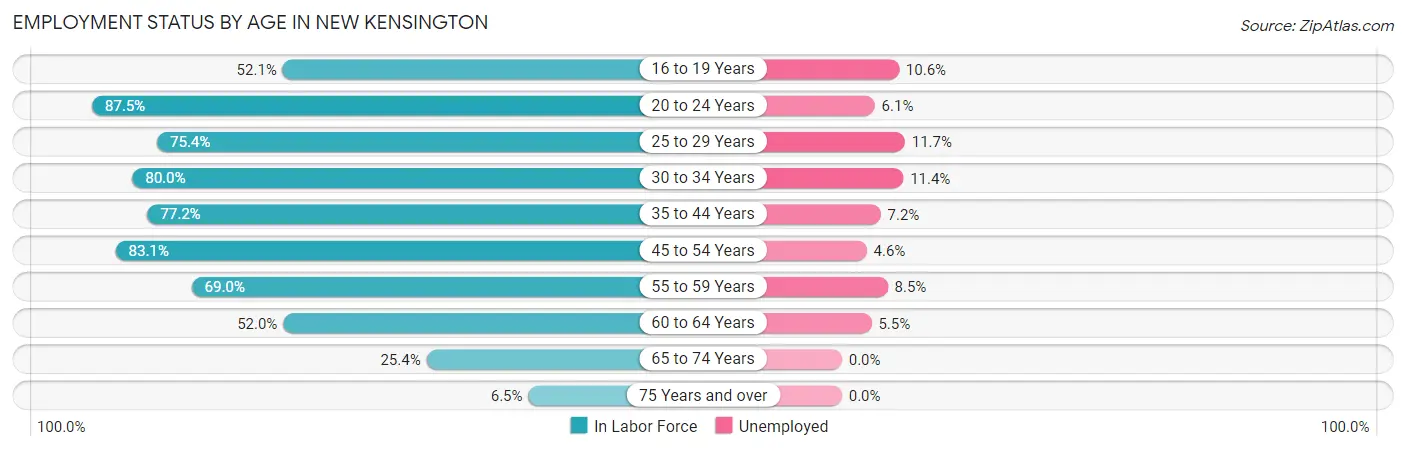
| Age Bracket | In Labor Force | Unemployed |
| 16 to 19 Years | 226 (52.1%) | 24 (10.6%) |
| 20 to 24 Years | 524 (87.5%) | 32 (6.1%) |
| 25 to 29 Years | 523 (75.4%) | 61 (11.7%) |
| 30 to 34 Years | 642 (80.0%) | 73 (11.4%) |
| 35 to 44 Years | 838 (77.2%) | 60 (7.2%) |
| 45 to 54 Years | 1,035 (83.1%) | 48 (4.6%) |
| 55 to 59 Years | 648 (69.0%) | 55 (8.5%) |
| 60 to 64 Years | 782 (52.0%) | 43 (5.5%) |
| 65 to 74 Years | 392 (25.4%) | 0 (0.0%) |
| 75 Years and over | 81 (6.5%) | 0 (0.0%) |
| Total | 5,686 (56.4%) | 398 (7.0%) |
Employment Status by Educational Attainment in New Kensington
According to labor force statistics for New Kensington, 71.3% of individuals (4,469) out of the total population between 25 and 64 years of age (6,268) are in the labor force, with 7.6% or 340 of them being unemployed. The group with the highest labor force participation rate are those with the educational attainment of bachelor's degree or higher, with 85.3% or 1,187 individuals in the labor force. Within the labor force, individuals with college / associate degree education have the highest percentage of unemployment, with 10.2% or 156 of them being unemployed.
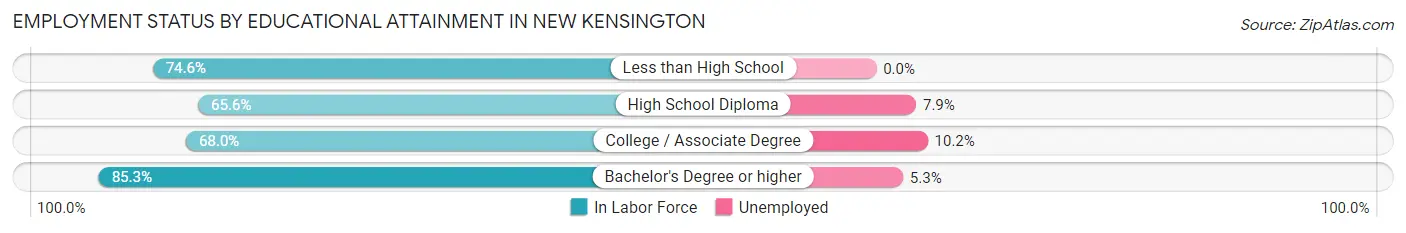
| Educational Attainment | In Labor Force | Unemployed |
| Less than High School | 206 (74.6%) | 0 (0.0%) |
| High School Diploma | 1,538 (65.6%) | 185 (7.9%) |
| College / Associate Degree | 1,533 (68.0%) | 230 (10.2%) |
| Bachelor's Degree or higher | 1,187 (85.3%) | 74 (5.3%) |
| Total | 4,469 (71.3%) | 476 (7.6%) |
Employment Occupations by Sex in New Kensington
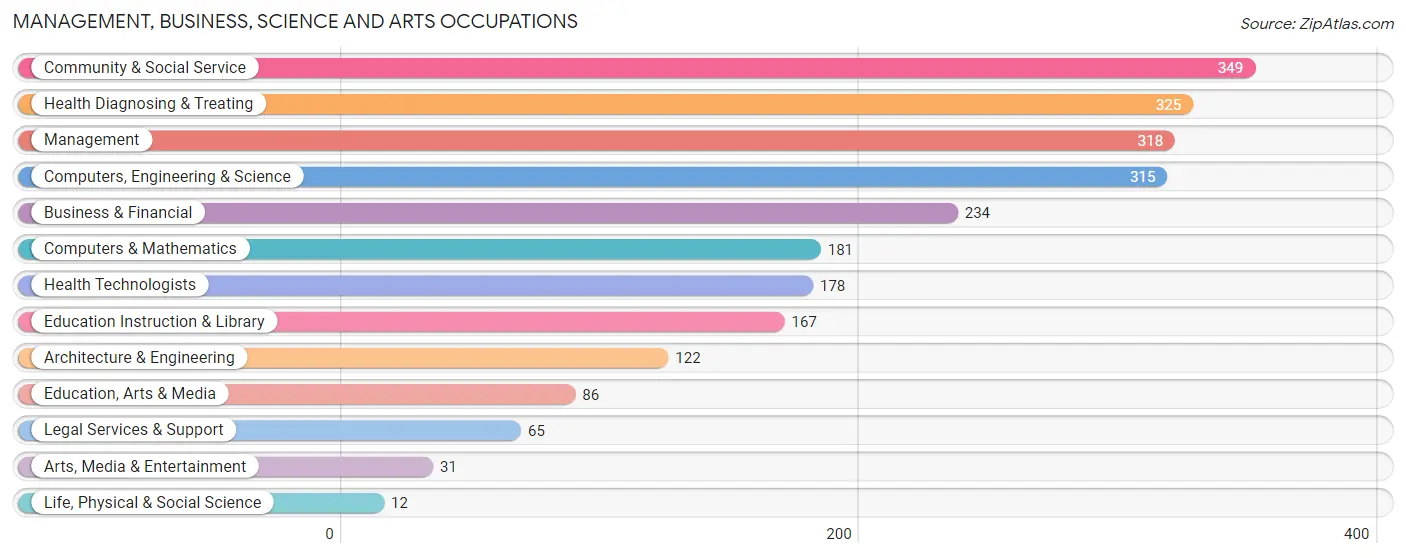
Management, Business, Science and Arts Occupations
The most common Management, Business, Science and Arts occupations in New Kensington are Community & Social Service (349 | 6.6%), Health Diagnosing & Treating (325 | 6.1%), Management (318 | 6.0%), Computers, Engineering & Science (315 | 5.9%), and Business & Financial (234 | 4.4%).
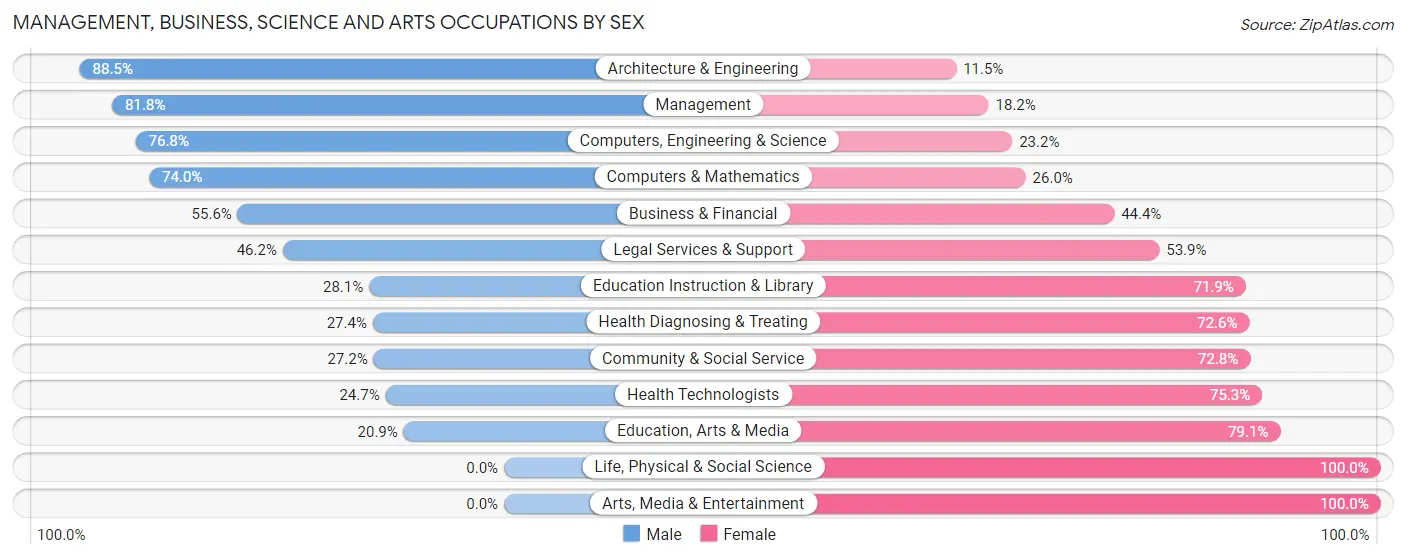
Management, Business, Science and Arts Occupations by Sex
Within the Management, Business, Science and Arts occupations in New Kensington, the most male-oriented occupations are Architecture & Engineering (88.5%), Management (81.8%), and Computers, Engineering & Science (76.8%), while the most female-oriented occupations are Life, Physical & Social Science (100.0%), Arts, Media & Entertainment (100.0%), and Education, Arts & Media (79.1%).
| Occupation | Male | Female |
| Management | 260 (81.8%) | 58 (18.2%) |
| Business & Financial | 130 (55.6%) | 104 (44.4%) |
| Computers, Engineering & Science | 242 (76.8%) | 73 (23.2%) |
| Computers & Mathematics | 134 (74.0%) | 47 (26.0%) |
| Architecture & Engineering | 108 (88.5%) | 14 (11.5%) |
| Life, Physical & Social Science | 0 (0.0%) | 12 (100.0%) |
| Community & Social Service | 95 (27.2%) | 254 (72.8%) |
| Education, Arts & Media | 18 (20.9%) | 68 (79.1%) |
| Legal Services & Support | 30 (46.2%) | 35 (53.8%) |
| Education Instruction & Library | 47 (28.1%) | 120 (71.9%) |
| Arts, Media & Entertainment | 0 (0.0%) | 31 (100.0%) |
| Health Diagnosing & Treating | 89 (27.4%) | 236 (72.6%) |
| Health Technologists | 44 (24.7%) | 134 (75.3%) |
| Total (Category) | 816 (52.9%) | 725 (47.0%) |
| Total (Overall) | 2,882 (54.5%) | 2,410 (45.5%) |
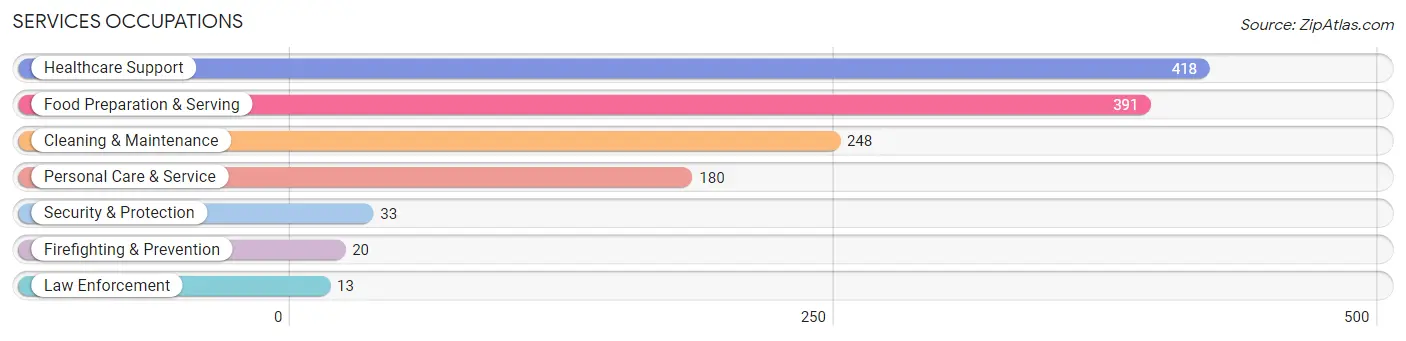
Services Occupations
The most common Services occupations in New Kensington are Healthcare Support (418 | 7.9%), Food Preparation & Serving (391 | 7.4%), Cleaning & Maintenance (248 | 4.7%), Personal Care & Service (180 | 3.4%), and Security & Protection (33 | 0.6%).
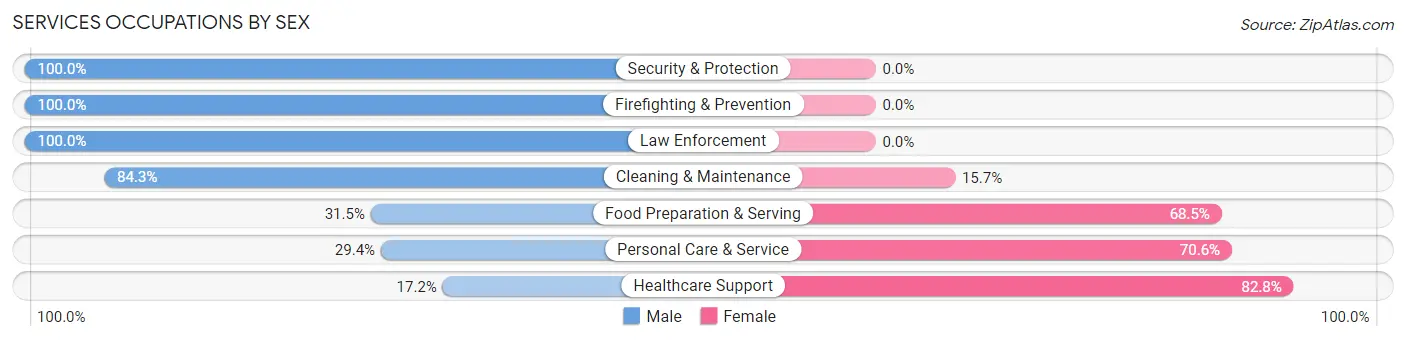
Services Occupations by Sex
Within the Services occupations in New Kensington, the most male-oriented occupations are Security & Protection (100.0%), Firefighting & Prevention (100.0%), and Law Enforcement (100.0%), while the most female-oriented occupations are Healthcare Support (82.8%), Personal Care & Service (70.6%), and Food Preparation & Serving (68.5%).
| Occupation | Male | Female |
| Healthcare Support | 72 (17.2%) | 346 (82.8%) |
| Security & Protection | 33 (100.0%) | 0 (0.0%) |
| Firefighting & Prevention | 20 (100.0%) | 0 (0.0%) |
| Law Enforcement | 13 (100.0%) | 0 (0.0%) |
| Food Preparation & Serving | 123 (31.5%) | 268 (68.5%) |
| Cleaning & Maintenance | 209 (84.3%) | 39 (15.7%) |
| Personal Care & Service | 53 (29.4%) | 127 (70.6%) |
| Total (Category) | 490 (38.6%) | 780 (61.4%) |
| Total (Overall) | 2,882 (54.5%) | 2,410 (45.5%) |
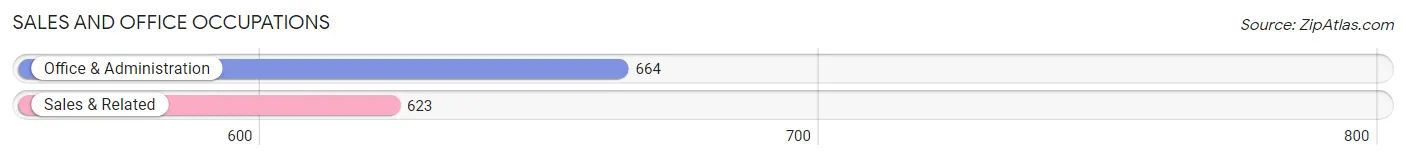
Sales and Office Occupations
The most common Sales and Office occupations in New Kensington are Office & Administration (664 | 12.6%), and Sales & Related (623 | 11.8%).
Sales and Office Occupations by Sex
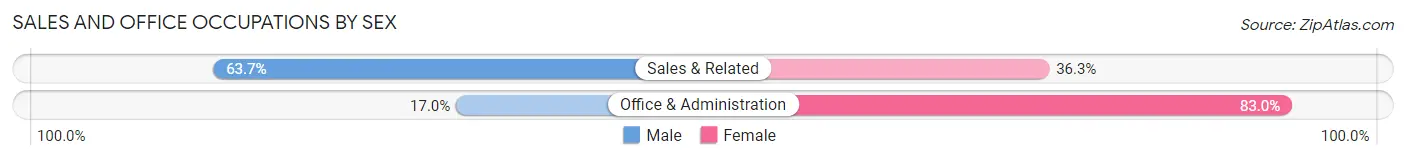
| Occupation | Male | Female |
| Sales & Related | 397 (63.7%) | 226 (36.3%) |
| Office & Administration | 113 (17.0%) | 551 (83.0%) |
| Total (Category) | 510 (39.6%) | 777 (60.4%) |
| Total (Overall) | 2,882 (54.5%) | 2,410 (45.5%) |
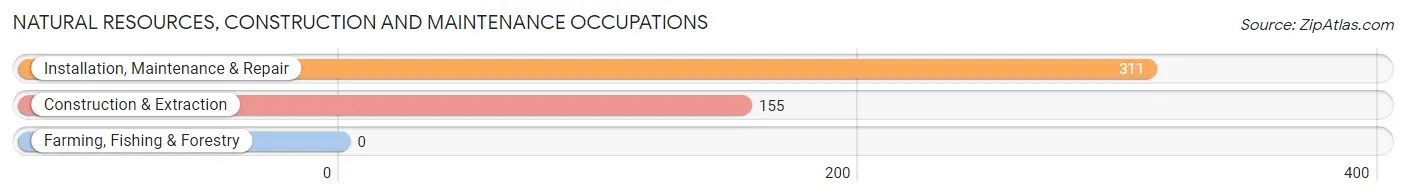
Natural Resources, Construction and Maintenance Occupations
The most common Natural Resources, Construction and Maintenance occupations in New Kensington are Installation, Maintenance & Repair (311 | 5.9%), and Construction & Extraction (155 | 2.9%).
Natural Resources, Construction and Maintenance Occupations by Sex
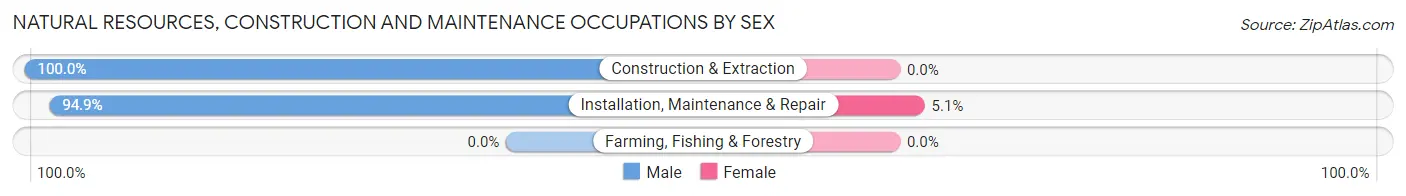
| Occupation | Male | Female |
| Farming, Fishing & Forestry | 0 (0.0%) | 0 (0.0%) |
| Construction & Extraction | 155 (100.0%) | 0 (0.0%) |
| Installation, Maintenance & Repair | 295 (94.9%) | 16 (5.1%) |
| Total (Category) | 450 (96.6%) | 16 (3.4%) |
| Total (Overall) | 2,882 (54.5%) | 2,410 (45.5%) |
Production, Transportation and Moving Occupations
The most common Production, Transportation and Moving occupations in New Kensington are Production (480 | 9.1%), Material Moving (127 | 2.4%), and Transportation (121 | 2.3%).
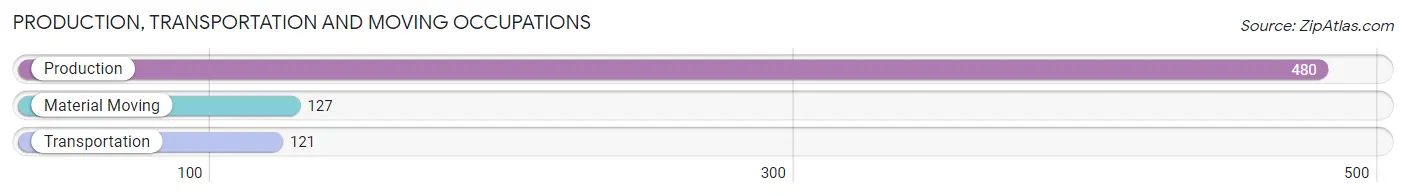
Production, Transportation and Moving Occupations by Sex
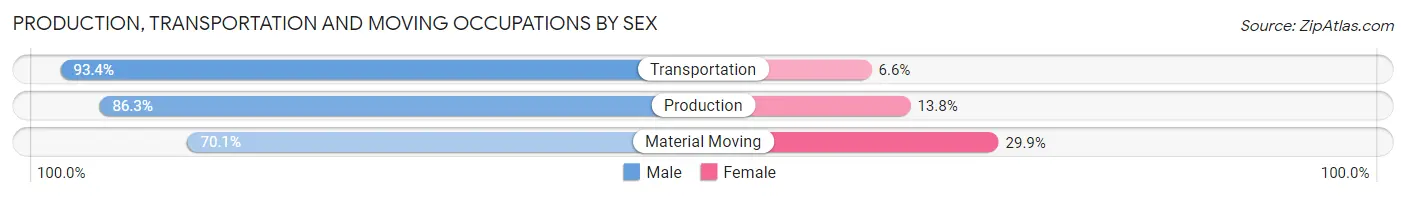
| Occupation | Male | Female |
| Production | 414 (86.3%) | 66 (13.8%) |
| Transportation | 113 (93.4%) | 8 (6.6%) |
| Material Moving | 89 (70.1%) | 38 (29.9%) |
| Total (Category) | 616 (84.6%) | 112 (15.4%) |
| Total (Overall) | 2,882 (54.5%) | 2,410 (45.5%) |
Employment Industries by Sex in New Kensington
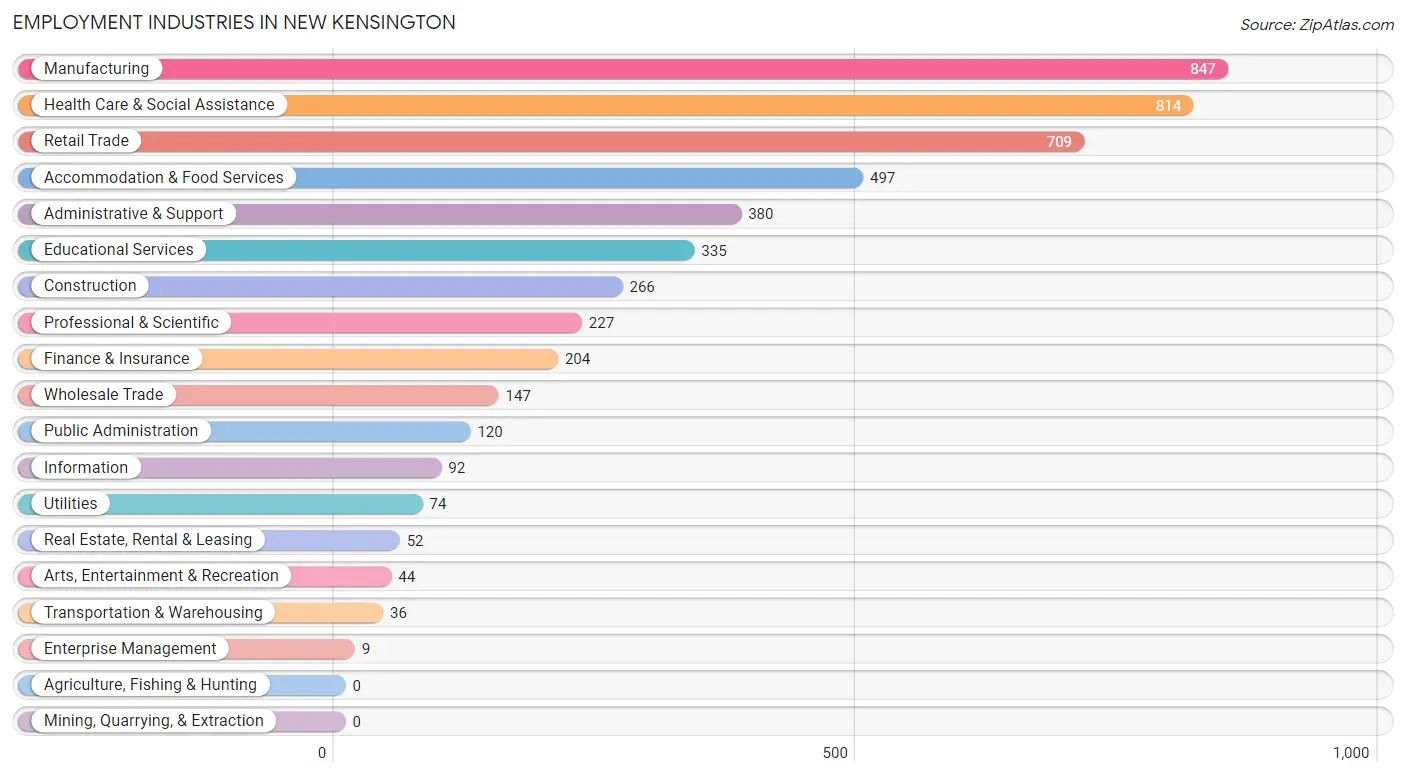
Employment Industries in New Kensington
The major employment industries in New Kensington include Manufacturing (847 | 16.0%), Health Care & Social Assistance (814 | 15.4%), Retail Trade (709 | 13.4%), Accommodation & Food Services (497 | 9.4%), and Administrative & Support (380 | 7.2%).
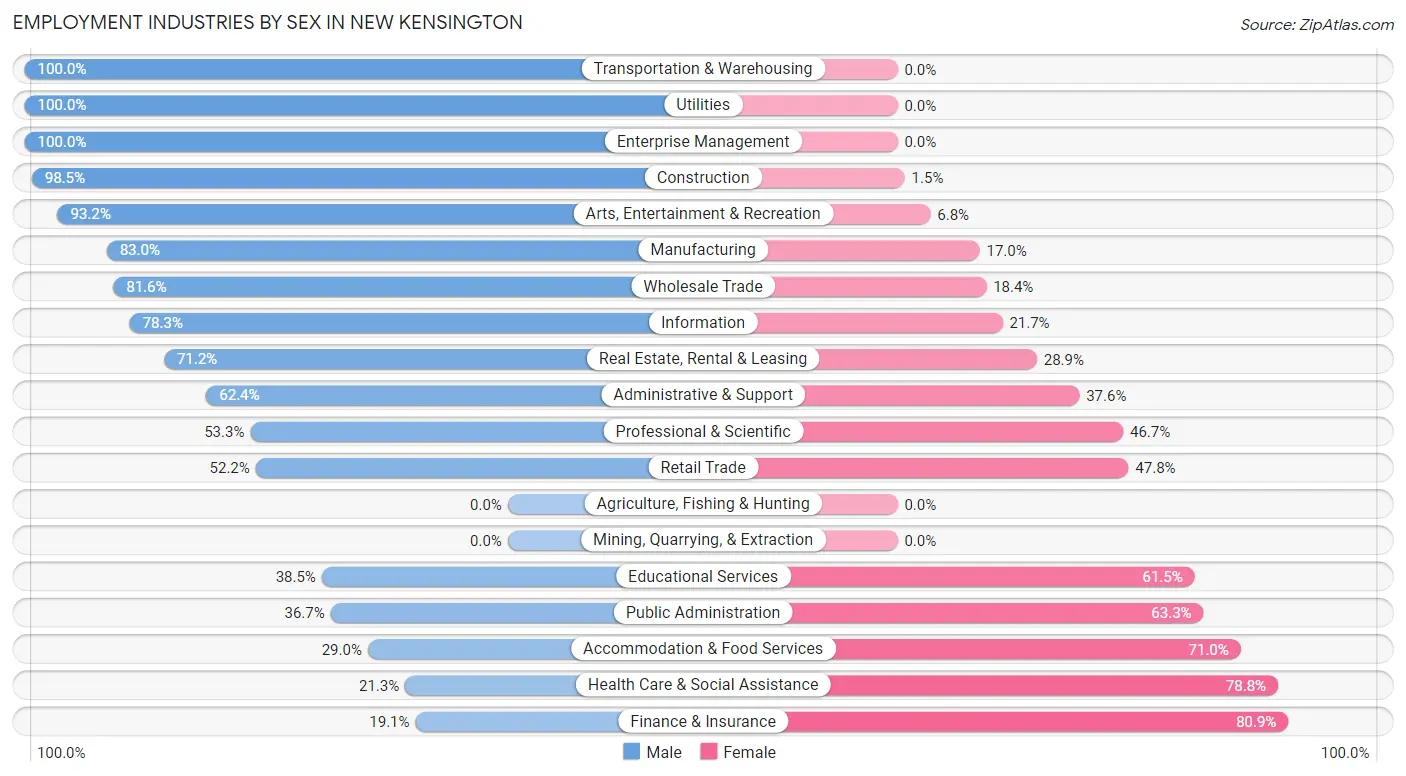
Employment Industries by Sex in New Kensington
The New Kensington industries that see more men than women are Transportation & Warehousing (100.0%), Utilities (100.0%), and Enterprise Management (100.0%), whereas the industries that tend to have a higher number of women are Finance & Insurance (80.9%), Health Care & Social Assistance (78.7%), and Accommodation & Food Services (71.0%).
| Industry | Male | Female |
| Agriculture, Fishing & Hunting | 0 (0.0%) | 0 (0.0%) |
| Mining, Quarrying, & Extraction | 0 (0.0%) | 0 (0.0%) |
| Construction | 262 (98.5%) | 4 (1.5%) |
| Manufacturing | 703 (83.0%) | 144 (17.0%) |
| Wholesale Trade | 120 (81.6%) | 27 (18.4%) |
| Retail Trade | 370 (52.2%) | 339 (47.8%) |
| Transportation & Warehousing | 36 (100.0%) | 0 (0.0%) |
| Utilities | 74 (100.0%) | 0 (0.0%) |
| Information | 72 (78.3%) | 20 (21.7%) |
| Finance & Insurance | 39 (19.1%) | 165 (80.9%) |
| Real Estate, Rental & Leasing | 37 (71.2%) | 15 (28.8%) |
| Professional & Scientific | 121 (53.3%) | 106 (46.7%) |
| Enterprise Management | 9 (100.0%) | 0 (0.0%) |
| Administrative & Support | 237 (62.4%) | 143 (37.6%) |
| Educational Services | 129 (38.5%) | 206 (61.5%) |
| Health Care & Social Assistance | 173 (21.2%) | 641 (78.7%) |
| Arts, Entertainment & Recreation | 41 (93.2%) | 3 (6.8%) |
| Accommodation & Food Services | 144 (29.0%) | 353 (71.0%) |
| Public Administration | 44 (36.7%) | 76 (63.3%) |
| Total | 2,882 (54.5%) | 2,410 (45.5%) |
Education in New Kensington
School Enrollment in New Kensington
The most common levels of schooling among the 1,935 students in New Kensington are middle school (500 | 25.8%), high school (480 | 24.8%), and elementary school (476 | 24.6%).
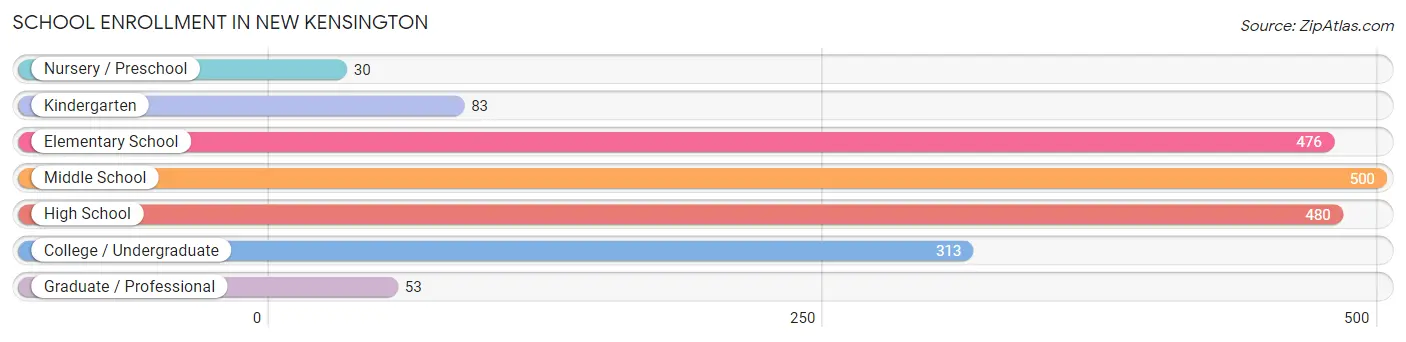
| School Level | # Students | % Students |
| Nursery / Preschool | 30 | 1.5% |
| Kindergarten | 83 | 4.3% |
| Elementary School | 476 | 24.6% |
| Middle School | 500 | 25.8% |
| High School | 480 | 24.8% |
| College / Undergraduate | 313 | 16.2% |
| Graduate / Professional | 53 | 2.7% |
| Total | 1,935 | 100.0% |
School Enrollment by Age by Funding Source in New Kensington
Out of a total of 1,935 students who are enrolled in schools in New Kensington, 240 (12.4%) attend a private institution, while the remaining 1,695 (87.6%) are enrolled in public schools. The age group of 3 to 4 year olds has the highest likelihood of being enrolled in private schools, with 18 (60.0% in the age bracket) enrolled. Conversely, the age group of 10 to 14 year olds has the lowest likelihood of being enrolled in a private school, with 538 (95.6% in the age bracket) attending a public institution.
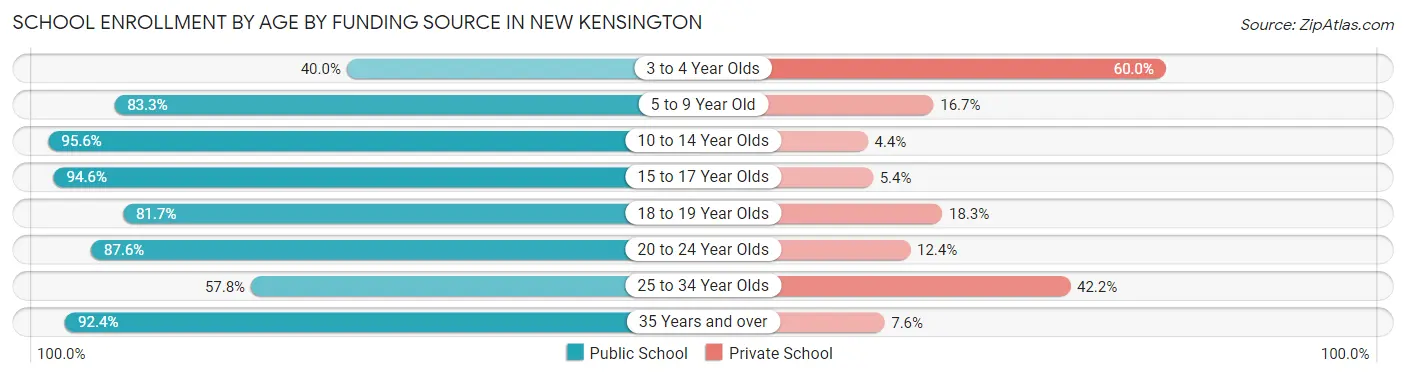
| Age Bracket | Public School | Private School |
| 3 to 4 Year Olds | 12 (40.0%) | 18 (60.0%) |
| 5 to 9 Year Old | 454 (83.3%) | 91 (16.7%) |
| 10 to 14 Year Olds | 538 (95.6%) | 25 (4.4%) |
| 15 to 17 Year Olds | 297 (94.6%) | 17 (5.4%) |
| 18 to 19 Year Olds | 98 (81.7%) | 22 (18.3%) |
| 20 to 24 Year Olds | 78 (87.6%) | 11 (12.4%) |
| 25 to 34 Year Olds | 59 (57.8%) | 43 (42.2%) |
| 35 Years and over | 159 (92.4%) | 13 (7.6%) |
| Total | 1,695 (87.6%) | 240 (12.4%) |
Educational Attainment by Field of Study in New Kensington
Business (299 | 14.3%), science & technology (294 | 14.1%), education (248 | 11.9%), arts & humanities (195 | 9.4%), and physical & health sciences (144 | 6.9%) are the most common fields of study among 2,084 individuals in New Kensington who have obtained a bachelor's degree or higher.
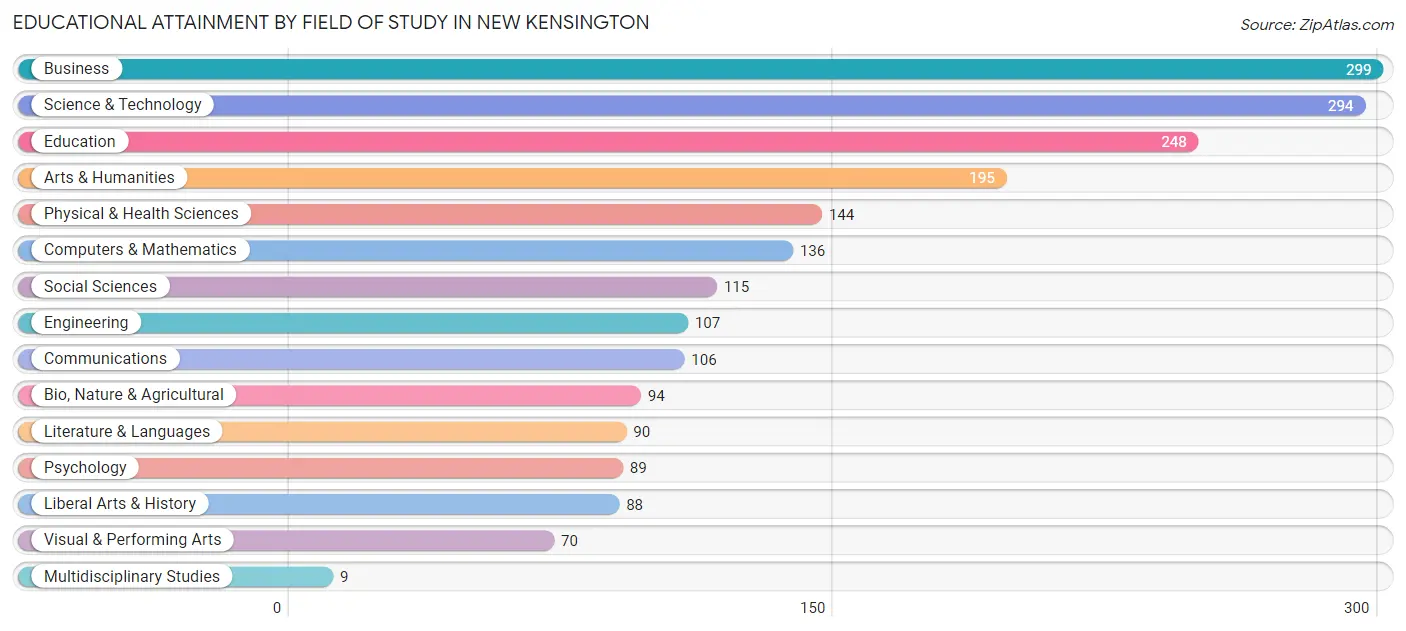
| Field of Study | # Graduates | % Graduates |
| Computers & Mathematics | 136 | 6.5% |
| Bio, Nature & Agricultural | 94 | 4.5% |
| Physical & Health Sciences | 144 | 6.9% |
| Psychology | 89 | 4.3% |
| Social Sciences | 115 | 5.5% |
| Engineering | 107 | 5.1% |
| Multidisciplinary Studies | 9 | 0.4% |
| Science & Technology | 294 | 14.1% |
| Business | 299 | 14.3% |
| Education | 248 | 11.9% |
| Literature & Languages | 90 | 4.3% |
| Liberal Arts & History | 88 | 4.2% |
| Visual & Performing Arts | 70 | 3.4% |
| Communications | 106 | 5.1% |
| Arts & Humanities | 195 | 9.4% |
| Total | 2,084 | 100.0% |
Transportation & Commute in New Kensington
Vehicle Availability by Sex in New Kensington
The most prevalent vehicle ownership categories in New Kensington are males with 2 vehicles (1,120, accounting for 39.7%) and females with 2 vehicles (974, making up 47.5%).
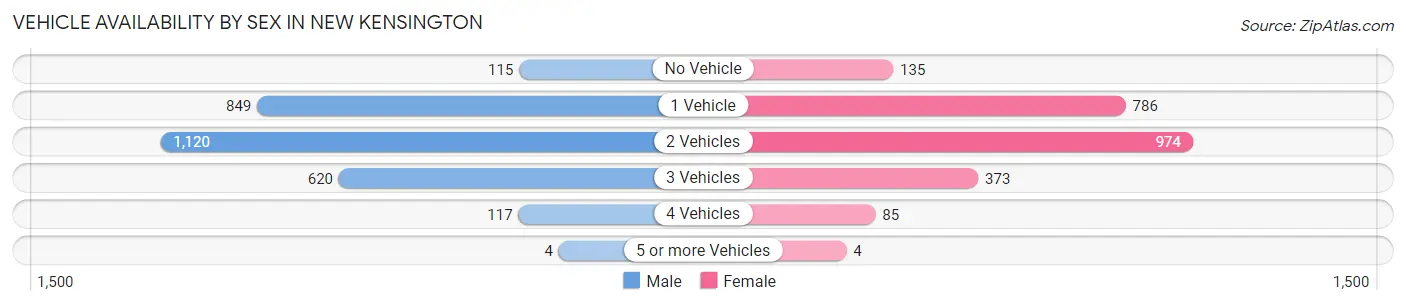
| Vehicles Available | Male | Female |
| No Vehicle | 115 (4.1%) | 135 (5.7%) |
| 1 Vehicle | 849 (30.0%) | 786 (33.4%) |
| 2 Vehicles | 1,120 (39.7%) | 974 (41.3%) |
| 3 Vehicles | 620 (22.0%) | 373 (15.8%) |
| 4 Vehicles | 117 (4.1%) | 85 (3.6%) |
| 5 or more Vehicles | 4 (0.1%) | 4 (0.2%) |
| Total | 2,825 (100.0%) | 2,357 (100.0%) |
Commute Time in New Kensington
The most frequently occuring commute durations in New Kensington are 15 to 19 minutes (757 commuters, 16.1%), 5 to 9 minutes (719 commuters, 15.3%), and 20 to 24 minutes (590 commuters, 12.6%).
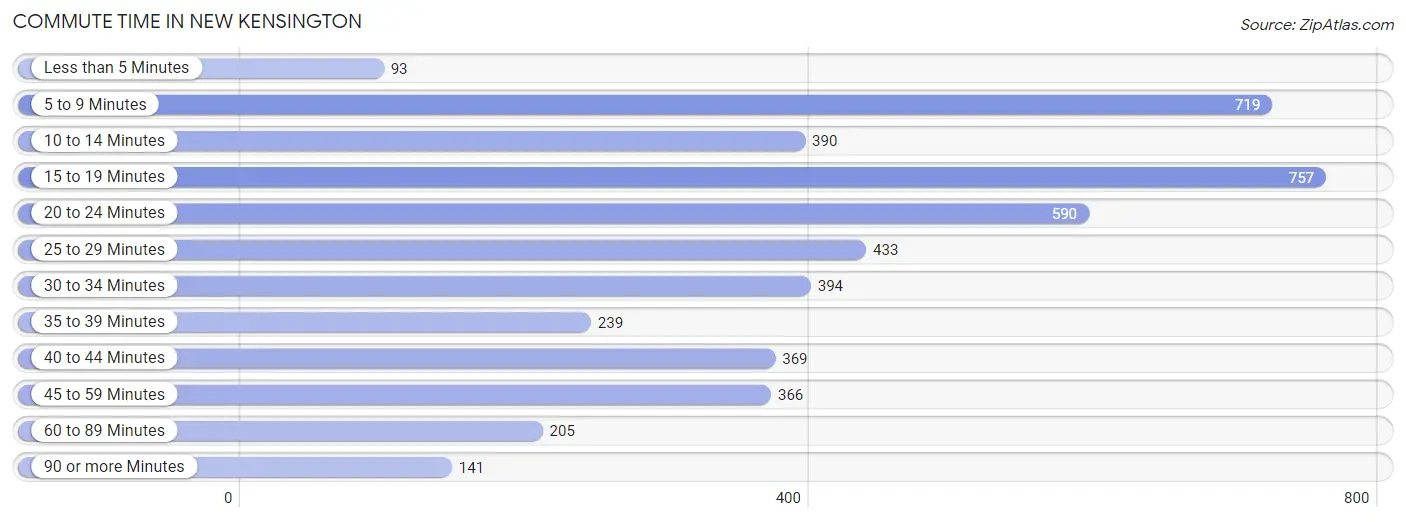
| Commute Time | # Commuters | % Commuters |
| Less than 5 Minutes | 93 | 2.0% |
| 5 to 9 Minutes | 719 | 15.3% |
| 10 to 14 Minutes | 390 | 8.3% |
| 15 to 19 Minutes | 757 | 16.1% |
| 20 to 24 Minutes | 590 | 12.6% |
| 25 to 29 Minutes | 433 | 9.2% |
| 30 to 34 Minutes | 394 | 8.4% |
| 35 to 39 Minutes | 239 | 5.1% |
| 40 to 44 Minutes | 369 | 7.9% |
| 45 to 59 Minutes | 366 | 7.8% |
| 60 to 89 Minutes | 205 | 4.4% |
| 90 or more Minutes | 141 | 3.0% |
Commute Time by Sex in New Kensington
The most common commute times in New Kensington are 5 to 9 minutes (486 commuters, 18.0%) for males and 15 to 19 minutes (369 commuters, 18.5%) for females.
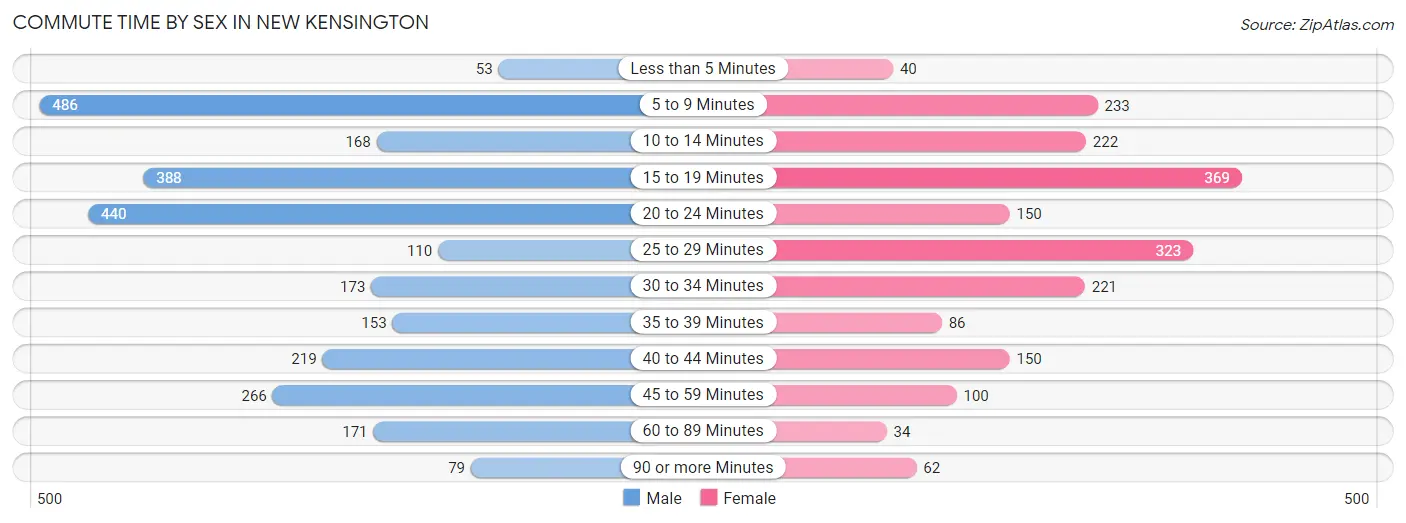
| Commute Time | Male | Female |
| Less than 5 Minutes | 53 (2.0%) | 40 (2.0%) |
| 5 to 9 Minutes | 486 (18.0%) | 233 (11.7%) |
| 10 to 14 Minutes | 168 (6.2%) | 222 (11.2%) |
| 15 to 19 Minutes | 388 (14.3%) | 369 (18.5%) |
| 20 to 24 Minutes | 440 (16.3%) | 150 (7.5%) |
| 25 to 29 Minutes | 110 (4.1%) | 323 (16.2%) |
| 30 to 34 Minutes | 173 (6.4%) | 221 (11.1%) |
| 35 to 39 Minutes | 153 (5.7%) | 86 (4.3%) |
| 40 to 44 Minutes | 219 (8.1%) | 150 (7.5%) |
| 45 to 59 Minutes | 266 (9.8%) | 100 (5.0%) |
| 60 to 89 Minutes | 171 (6.3%) | 34 (1.7%) |
| 90 or more Minutes | 79 (2.9%) | 62 (3.1%) |
Time of Departure to Work by Sex in New Kensington
The most frequent times of departure to work in New Kensington are 6:30 AM to 6:59 AM (415, 15.3%) for males and 8:00 AM to 8:29 AM (255, 12.8%) for females.
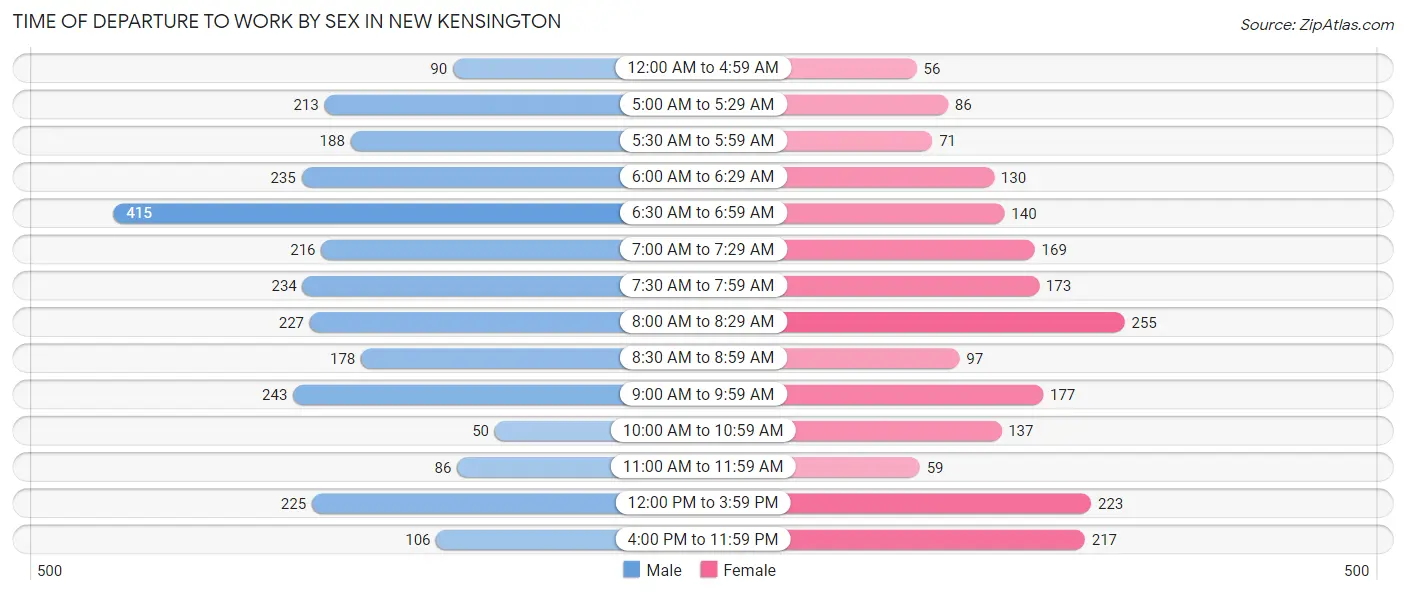
| Time of Departure | Male | Female |
| 12:00 AM to 4:59 AM | 90 (3.3%) | 56 (2.8%) |
| 5:00 AM to 5:29 AM | 213 (7.9%) | 86 (4.3%) |
| 5:30 AM to 5:59 AM | 188 (7.0%) | 71 (3.6%) |
| 6:00 AM to 6:29 AM | 235 (8.7%) | 130 (6.5%) |
| 6:30 AM to 6:59 AM | 415 (15.3%) | 140 (7.0%) |
| 7:00 AM to 7:29 AM | 216 (8.0%) | 169 (8.5%) |
| 7:30 AM to 7:59 AM | 234 (8.6%) | 173 (8.7%) |
| 8:00 AM to 8:29 AM | 227 (8.4%) | 255 (12.8%) |
| 8:30 AM to 8:59 AM | 178 (6.6%) | 97 (4.9%) |
| 9:00 AM to 9:59 AM | 243 (9.0%) | 177 (8.9%) |
| 10:00 AM to 10:59 AM | 50 (1.8%) | 137 (6.9%) |
| 11:00 AM to 11:59 AM | 86 (3.2%) | 59 (3.0%) |
| 12:00 PM to 3:59 PM | 225 (8.3%) | 223 (11.2%) |
| 4:00 PM to 11:59 PM | 106 (3.9%) | 217 (10.9%) |
| Total | 2,706 (100.0%) | 1,990 (100.0%) |
Housing Occupancy in New Kensington
Occupancy by Ownership in New Kensington
Of the total 5,964 dwellings in New Kensington, owner-occupied units account for 3,577 (60.0%), while renter-occupied units make up 2,387 (40.0%).
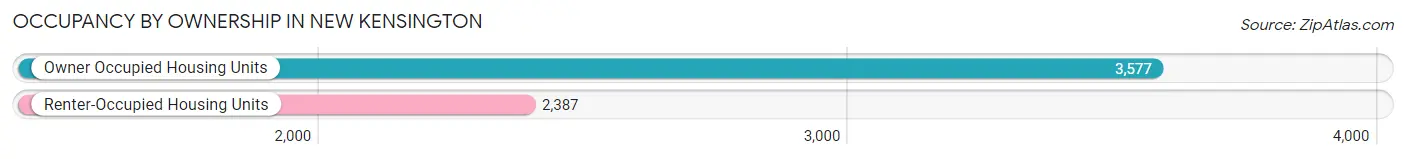
| Occupancy | # Housing Units | % Housing Units |
| Owner Occupied Housing Units | 3,577 | 60.0% |
| Renter-Occupied Housing Units | 2,387 | 40.0% |
| Total Occupied Housing Units | 5,964 | 100.0% |
Occupancy by Household Size in New Kensington
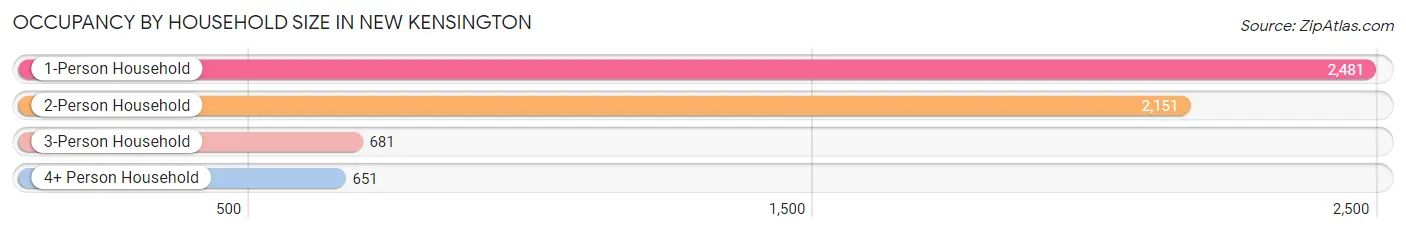
| Household Size | # Housing Units | % Housing Units |
| 1-Person Household | 2,481 | 41.6% |
| 2-Person Household | 2,151 | 36.1% |
| 3-Person Household | 681 | 11.4% |
| 4+ Person Household | 651 | 10.9% |
| Total Housing Units | 5,964 | 100.0% |
Occupancy by Ownership by Household Size in New Kensington
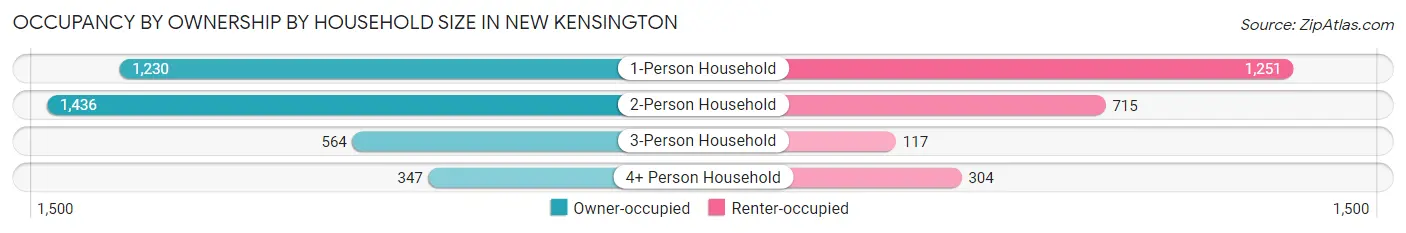
| Household Size | Owner-occupied | Renter-occupied |
| 1-Person Household | 1,230 (49.6%) | 1,251 (50.4%) |
| 2-Person Household | 1,436 (66.8%) | 715 (33.2%) |
| 3-Person Household | 564 (82.8%) | 117 (17.2%) |
| 4+ Person Household | 347 (53.3%) | 304 (46.7%) |
| Total Housing Units | 3,577 (60.0%) | 2,387 (40.0%) |
Occupancy by Educational Attainment in New Kensington
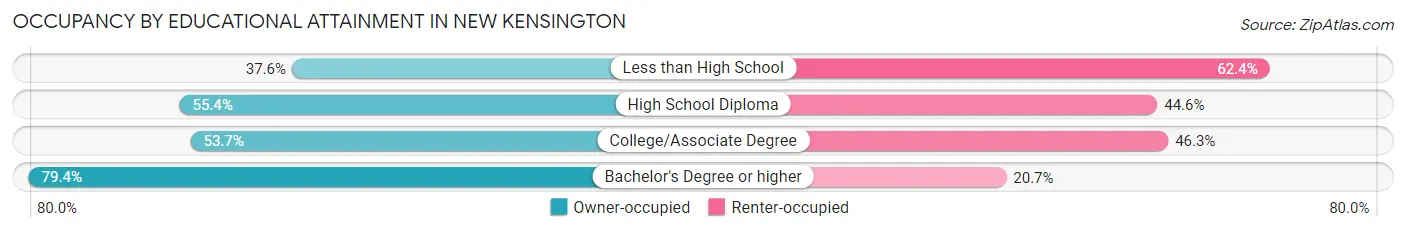
| Household Size | Owner-occupied | Renter-occupied |
| Less than High School | 79 (37.6%) | 131 (62.4%) |
| High School Diploma | 1,244 (55.4%) | 1,001 (44.6%) |
| College/Associate Degree | 1,109 (53.7%) | 957 (46.3%) |
| Bachelor's Degree or higher | 1,145 (79.3%) | 298 (20.6%) |
Occupancy by Age of Householder in New Kensington
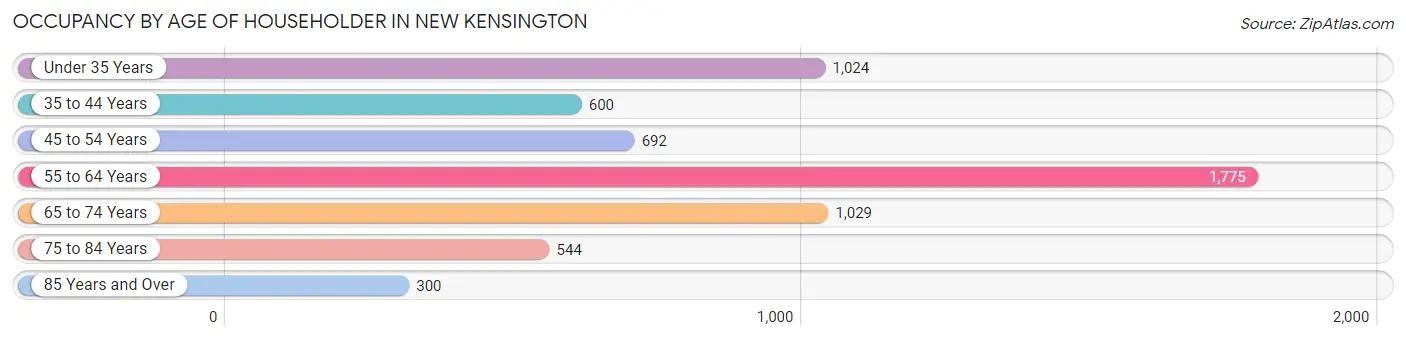
| Age Bracket | # Households | % Households |
| Under 35 Years | 1,024 | 17.2% |
| 35 to 44 Years | 600 | 10.1% |
| 45 to 54 Years | 692 | 11.6% |
| 55 to 64 Years | 1,775 | 29.8% |
| 65 to 74 Years | 1,029 | 17.2% |
| 75 to 84 Years | 544 | 9.1% |
| 85 Years and Over | 300 | 5.0% |
| Total | 5,964 | 100.0% |
Housing Finances in New Kensington
Median Income by Occupancy in New Kensington
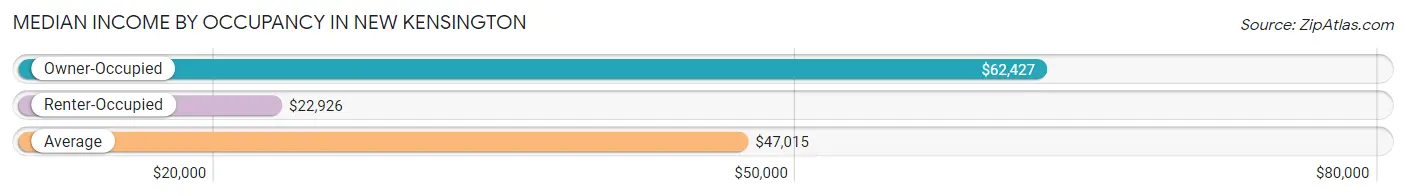
| Occupancy Type | # Households | Median Income |
| Owner-Occupied | 3,577 (60.0%) | $62,427 |
| Renter-Occupied | 2,387 (40.0%) | $22,926 |
| Average | 5,964 (100.0%) | $47,015 |
Occupancy by Householder Income Bracket in New Kensington
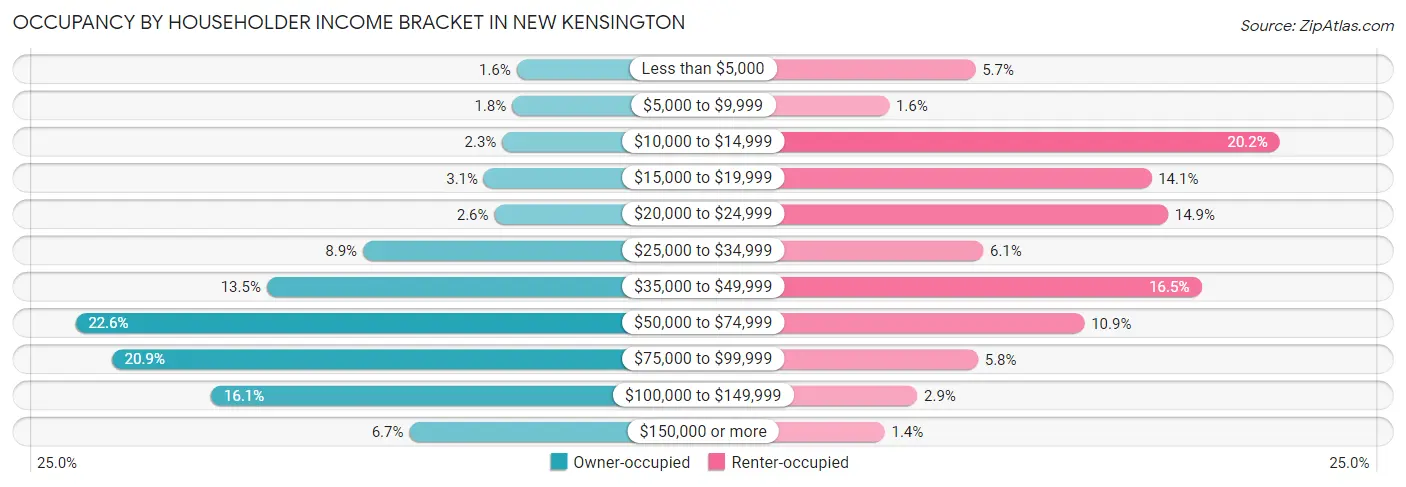
| Income Bracket | Owner-occupied | Renter-occupied |
| Less than $5,000 | 56 (1.6%) | 136 (5.7%) |
| $5,000 to $9,999 | 64 (1.8%) | 38 (1.6%) |
| $10,000 to $14,999 | 81 (2.3%) | 482 (20.2%) |
| $15,000 to $19,999 | 112 (3.1%) | 336 (14.1%) |
| $20,000 to $24,999 | 94 (2.6%) | 355 (14.9%) |
| $25,000 to $34,999 | 318 (8.9%) | 145 (6.1%) |
| $35,000 to $49,999 | 482 (13.5%) | 393 (16.5%) |
| $50,000 to $74,999 | 808 (22.6%) | 260 (10.9%) |
| $75,000 to $99,999 | 746 (20.9%) | 139 (5.8%) |
| $100,000 to $149,999 | 577 (16.1%) | 70 (2.9%) |
| $150,000 or more | 239 (6.7%) | 33 (1.4%) |
| Total | 3,577 (100.0%) | 2,387 (100.0%) |
Monthly Housing Cost Tiers in New Kensington
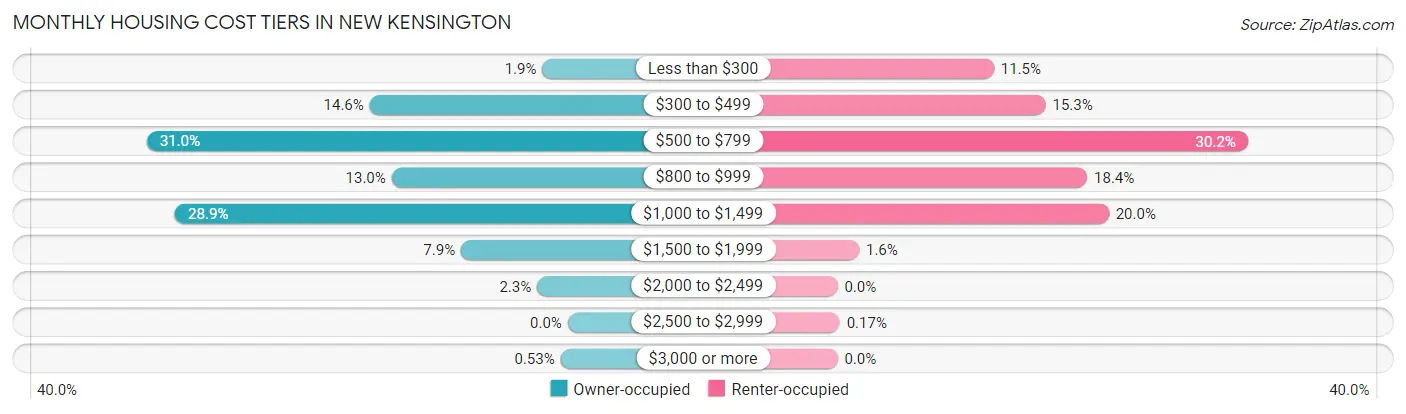
| Monthly Cost | Owner-occupied | Renter-occupied |
| Less than $300 | 67 (1.9%) | 275 (11.5%) |
| $300 to $499 | 522 (14.6%) | 366 (15.3%) |
| $500 to $799 | 1,109 (31.0%) | 721 (30.2%) |
| $800 to $999 | 464 (13.0%) | 439 (18.4%) |
| $1,000 to $1,499 | 1,034 (28.9%) | 477 (20.0%) |
| $1,500 to $1,999 | 281 (7.9%) | 38 (1.6%) |
| $2,000 to $2,499 | 81 (2.3%) | 0 (0.0%) |
| $2,500 to $2,999 | 0 (0.0%) | 4 (0.2%) |
| $3,000 or more | 19 (0.5%) | 0 (0.0%) |
| Total | 3,577 (100.0%) | 2,387 (100.0%) |
Physical Housing Characteristics in New Kensington
Housing Structures in New Kensington
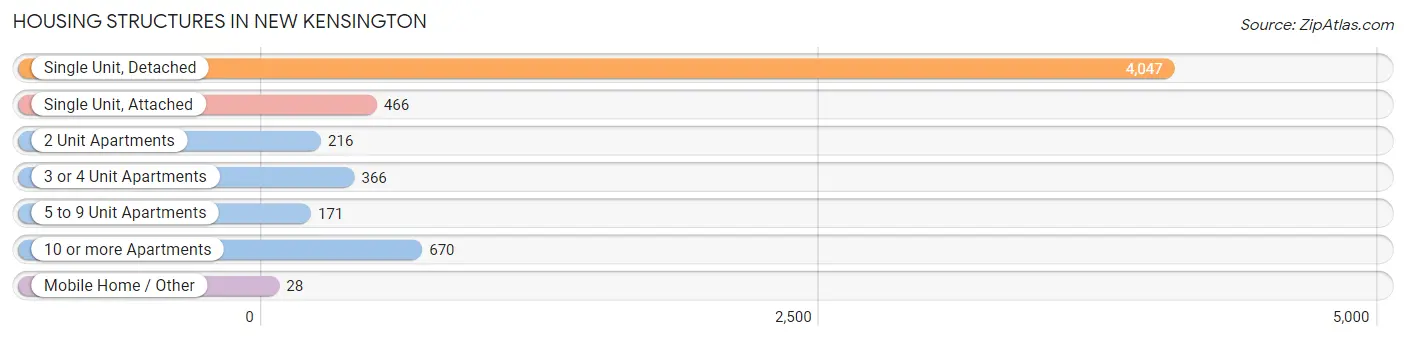
| Structure Type | # Housing Units | % Housing Units |
| Single Unit, Detached | 4,047 | 67.9% |
| Single Unit, Attached | 466 | 7.8% |
| 2 Unit Apartments | 216 | 3.6% |
| 3 or 4 Unit Apartments | 366 | 6.1% |
| 5 to 9 Unit Apartments | 171 | 2.9% |
| 10 or more Apartments | 670 | 11.2% |
| Mobile Home / Other | 28 | 0.5% |
| Total | 5,964 | 100.0% |
Housing Structures by Occupancy in New Kensington
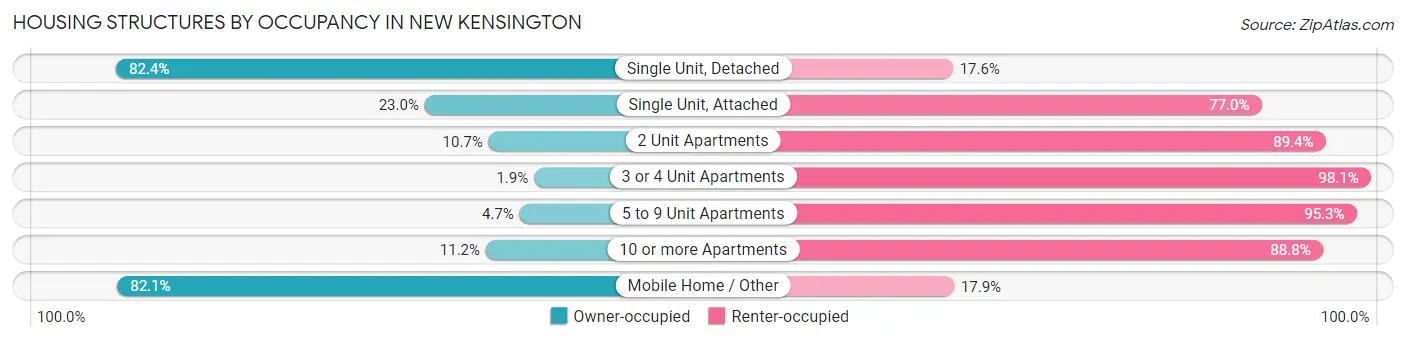
| Structure Type | Owner-occupied | Renter-occupied |
| Single Unit, Detached | 3,334 (82.4%) | 713 (17.6%) |
| Single Unit, Attached | 107 (23.0%) | 359 (77.0%) |
| 2 Unit Apartments | 23 (10.6%) | 193 (89.3%) |
| 3 or 4 Unit Apartments | 7 (1.9%) | 359 (98.1%) |
| 5 to 9 Unit Apartments | 8 (4.7%) | 163 (95.3%) |
| 10 or more Apartments | 75 (11.2%) | 595 (88.8%) |
| Mobile Home / Other | 23 (82.1%) | 5 (17.9%) |
| Total | 3,577 (60.0%) | 2,387 (40.0%) |
Housing Structures by Number of Rooms in New Kensington
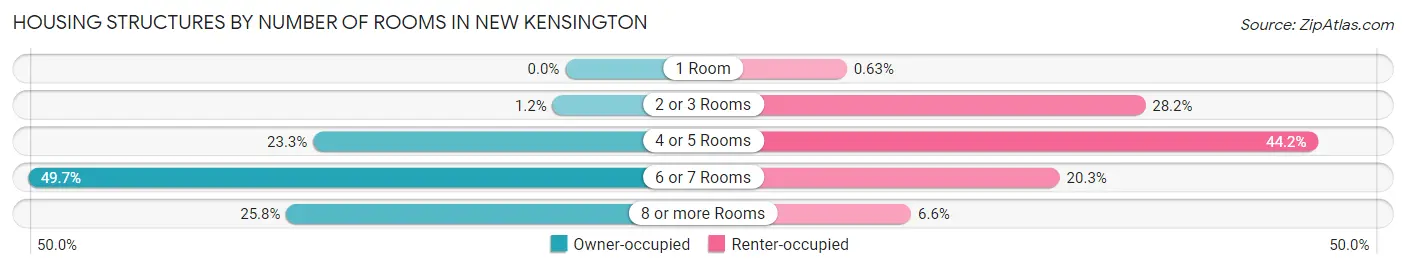
| Number of Rooms | Owner-occupied | Renter-occupied |
| 1 Room | 0 (0.0%) | 15 (0.6%) |
| 2 or 3 Rooms | 42 (1.2%) | 674 (28.2%) |
| 4 or 5 Rooms | 834 (23.3%) | 1,056 (44.2%) |
| 6 or 7 Rooms | 1,778 (49.7%) | 485 (20.3%) |
| 8 or more Rooms | 923 (25.8%) | 157 (6.6%) |
| Total | 3,577 (100.0%) | 2,387 (100.0%) |
Housing Structure by Heating Type in New Kensington
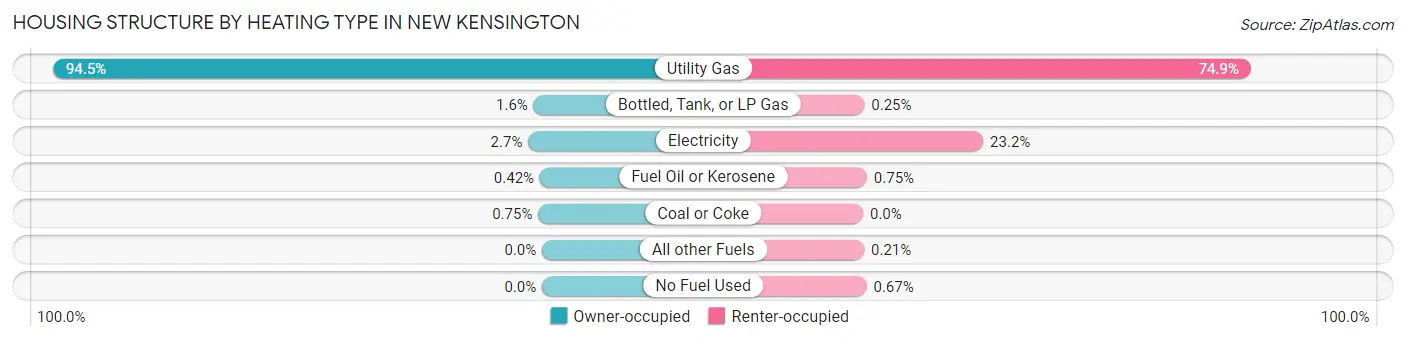
| Heating Type | Owner-occupied | Renter-occupied |
| Utility Gas | 3,381 (94.5%) | 1,788 (74.9%) |
| Bottled, Tank, or LP Gas | 58 (1.6%) | 6 (0.3%) |
| Electricity | 96 (2.7%) | 554 (23.2%) |
| Fuel Oil or Kerosene | 15 (0.4%) | 18 (0.7%) |
| Coal or Coke | 27 (0.7%) | 0 (0.0%) |
| All other Fuels | 0 (0.0%) | 5 (0.2%) |
| No Fuel Used | 0 (0.0%) | 16 (0.7%) |
| Total | 3,577 (100.0%) | 2,387 (100.0%) |
Household Vehicle Usage in New Kensington
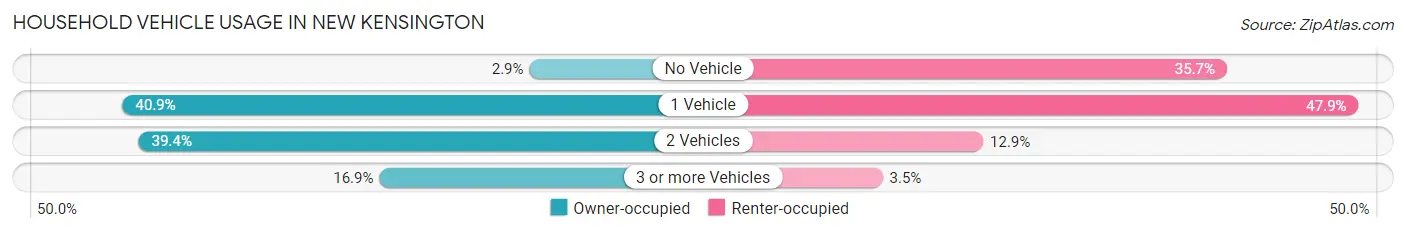
| Vehicles per Household | Owner-occupied | Renter-occupied |
| No Vehicle | 103 (2.9%) | 851 (35.6%) |
| 1 Vehicle | 1,462 (40.9%) | 1,144 (47.9%) |
| 2 Vehicles | 1,408 (39.4%) | 308 (12.9%) |
| 3 or more Vehicles | 604 (16.9%) | 84 (3.5%) |
| Total | 3,577 (100.0%) | 2,387 (100.0%) |
Real Estate & Mortgages in New Kensington
Real Estate and Mortgage Overview in New Kensington
| Characteristic | Without Mortgage | With Mortgage |
| Housing Units | 1,565 | 2,012 |
| Median Property Value | $112,200 | $118,300 |
| Median Household Income | $54,297 | $173 |
| Monthly Housing Costs | $589 | $9 |
| Real Estate Taxes | $1,981 | $36 |
Property Value by Mortgage Status in New Kensington
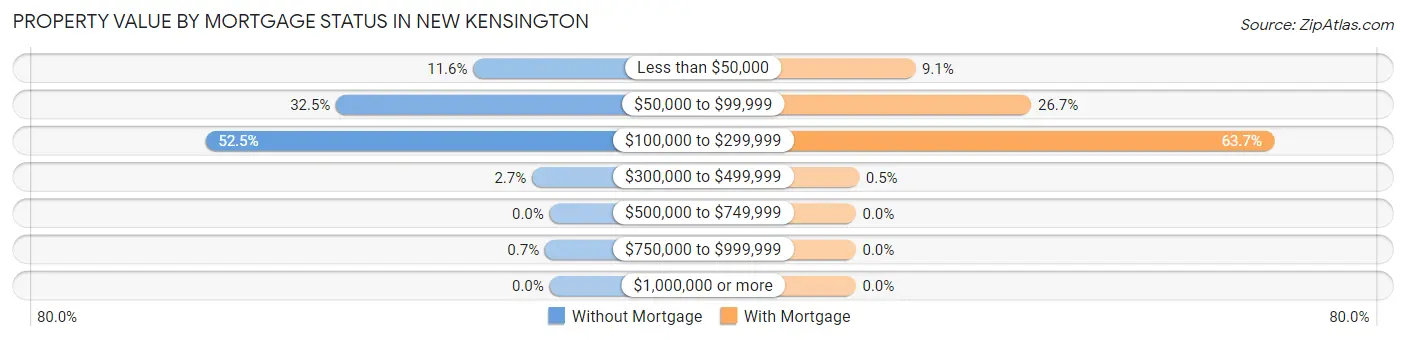
| Property Value | Without Mortgage | With Mortgage |
| Less than $50,000 | 182 (11.6%) | 182 (9.0%) |
| $50,000 to $99,999 | 509 (32.5%) | 538 (26.7%) |
| $100,000 to $299,999 | 821 (52.5%) | 1,282 (63.7%) |
| $300,000 to $499,999 | 42 (2.7%) | 10 (0.5%) |
| $500,000 to $749,999 | 0 (0.0%) | 0 (0.0%) |
| $750,000 to $999,999 | 11 (0.7%) | 0 (0.0%) |
| $1,000,000 or more | 0 (0.0%) | 0 (0.0%) |
| Total | 1,565 (100.0%) | 2,012 (100.0%) |
Household Income by Mortgage Status in New Kensington
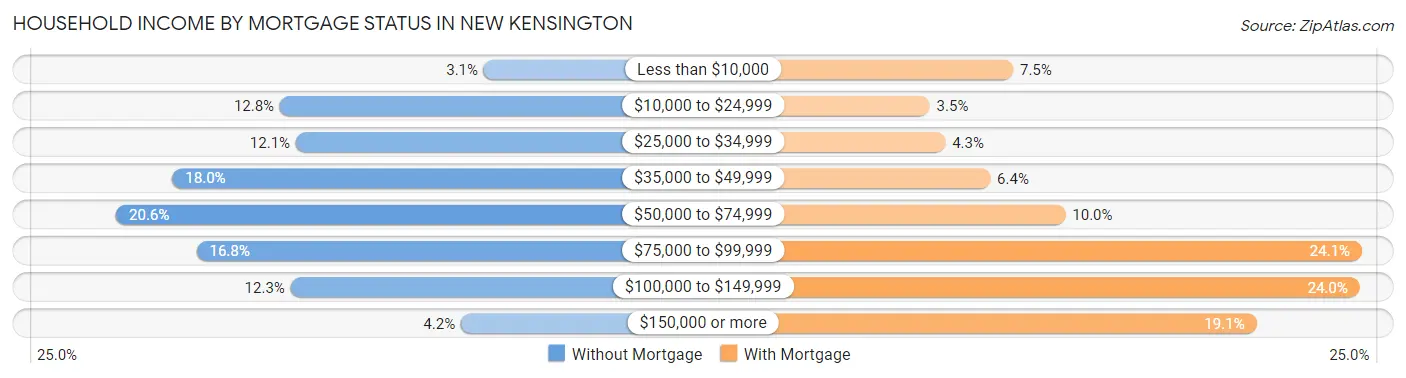
| Household Income | Without Mortgage | With Mortgage |
| Less than $10,000 | 49 (3.1%) | 151 (7.5%) |
| $10,000 to $24,999 | 201 (12.8%) | 71 (3.5%) |
| $25,000 to $34,999 | 189 (12.1%) | 86 (4.3%) |
| $35,000 to $49,999 | 281 (18.0%) | 129 (6.4%) |
| $50,000 to $74,999 | 323 (20.6%) | 201 (10.0%) |
| $75,000 to $99,999 | 263 (16.8%) | 485 (24.1%) |
| $100,000 to $149,999 | 193 (12.3%) | 483 (24.0%) |
| $150,000 or more | 66 (4.2%) | 384 (19.1%) |
| Total | 1,565 (100.0%) | 2,012 (100.0%) |
Property Value to Household Income Ratio in New Kensington
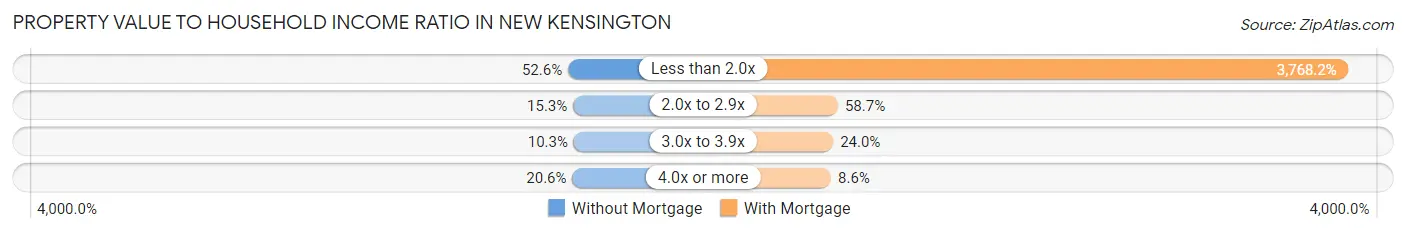
| Value-to-Income Ratio | Without Mortgage | With Mortgage |
| Less than 2.0x | 823 (52.6%) | 75,817 (3,768.2%) |
| 2.0x to 2.9x | 240 (15.3%) | 1,181 (58.7%) |
| 3.0x to 3.9x | 161 (10.3%) | 482 (24.0%) |
| 4.0x or more | 323 (20.6%) | 173 (8.6%) |
| Total | 1,565 (100.0%) | 2,012 (100.0%) |
Real Estate Taxes by Mortgage Status in New Kensington
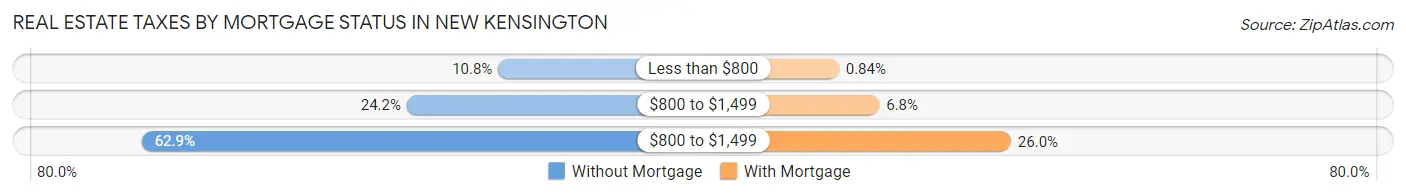
| Property Taxes | Without Mortgage | With Mortgage |
| Less than $800 | 169 (10.8%) | 17 (0.8%) |
| $800 to $1,499 | 378 (24.1%) | 136 (6.8%) |
| $800 to $1,499 | 984 (62.9%) | 523 (26.0%) |
| Total | 1,565 (100.0%) | 2,012 (100.0%) |
Health & Disability in New Kensington
Health Insurance Coverage by Age in New Kensington
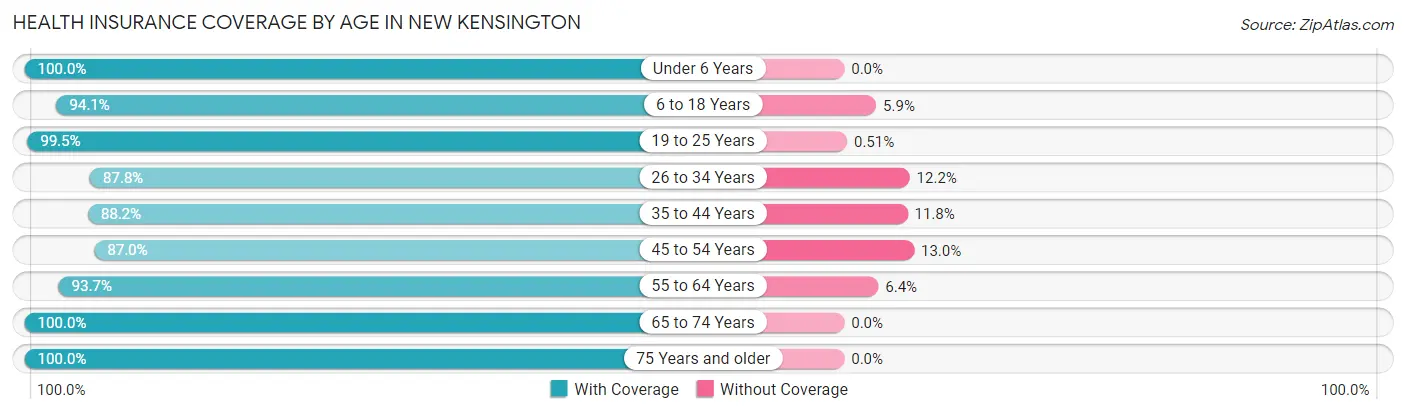
| Age Bracket | With Coverage | Without Coverage |
| Under 6 Years | 810 (100.0%) | 0 (0.0%) |
| 6 to 18 Years | 1,503 (94.1%) | 95 (5.9%) |
| 19 to 25 Years | 787 (99.5%) | 4 (0.5%) |
| 26 to 34 Years | 1,239 (87.8%) | 172 (12.2%) |
| 35 to 44 Years | 957 (88.2%) | 128 (11.8%) |
| 45 to 54 Years | 1,083 (87.0%) | 162 (13.0%) |
| 55 to 64 Years | 2,287 (93.6%) | 155 (6.4%) |
| 65 to 74 Years | 1,542 (100.0%) | 0 (0.0%) |
| 75 Years and older | 1,239 (100.0%) | 0 (0.0%) |
| Total | 11,447 (94.1%) | 716 (5.9%) |
Health Insurance Coverage by Citizenship Status in New Kensington
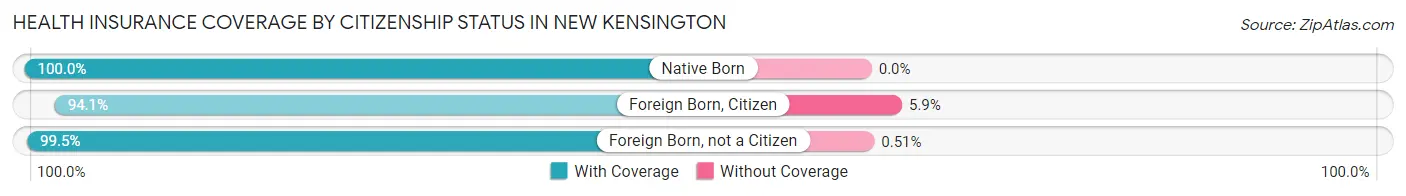
| Citizenship Status | With Coverage | Without Coverage |
| Native Born | 810 (100.0%) | 0 (0.0%) |
| Foreign Born, Citizen | 1,503 (94.1%) | 95 (5.9%) |
| Foreign Born, not a Citizen | 787 (99.5%) | 4 (0.5%) |
Health Insurance Coverage by Household Income in New Kensington
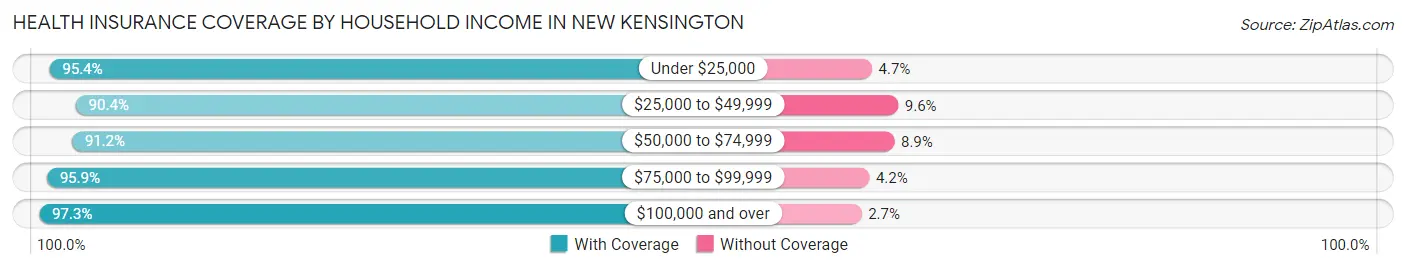
| Household Income | With Coverage | Without Coverage |
| Under $25,000 | 2,663 (95.4%) | 130 (4.6%) |
| $25,000 to $49,999 | 2,080 (90.4%) | 220 (9.6%) |
| $50,000 to $74,999 | 2,069 (91.1%) | 201 (8.8%) |
| $75,000 to $99,999 | 2,354 (95.9%) | 102 (4.2%) |
| $100,000 and over | 2,271 (97.3%) | 63 (2.7%) |
Public vs Private Health Insurance Coverage by Age in New Kensington
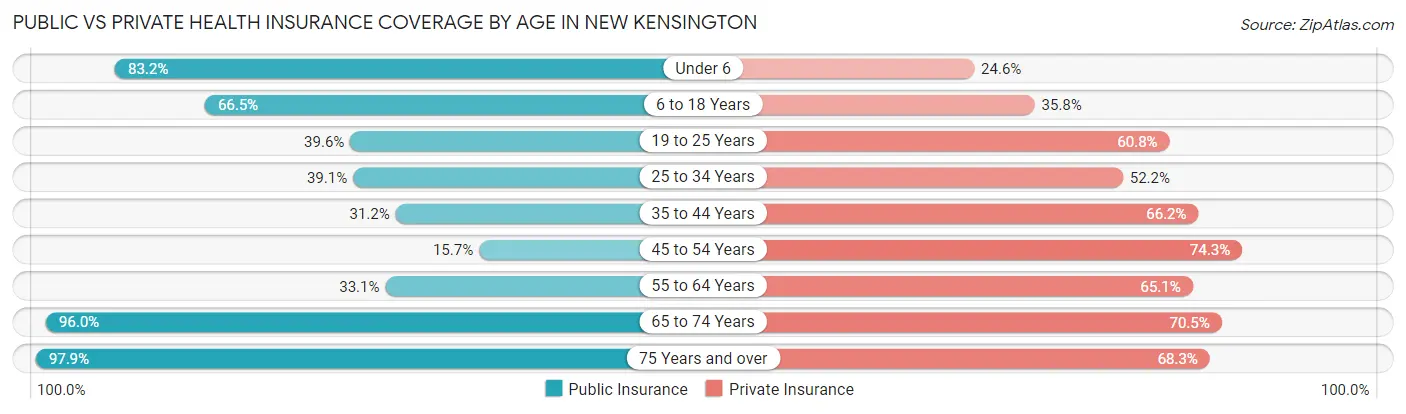
| Age Bracket | Public Insurance | Private Insurance |
| Under 6 | 674 (83.2%) | 199 (24.6%) |
| 6 to 18 Years | 1,063 (66.5%) | 572 (35.8%) |
| 19 to 25 Years | 313 (39.6%) | 481 (60.8%) |
| 25 to 34 Years | 551 (39.1%) | 736 (52.2%) |
| 35 to 44 Years | 338 (31.1%) | 718 (66.2%) |
| 45 to 54 Years | 195 (15.7%) | 925 (74.3%) |
| 55 to 64 Years | 807 (33.1%) | 1,590 (65.1%) |
| 65 to 74 Years | 1,481 (96.0%) | 1,087 (70.5%) |
| 75 Years and over | 1,213 (97.9%) | 846 (68.3%) |
| Total | 6,635 (54.5%) | 7,154 (58.8%) |
Disability Status by Sex by Age in New Kensington
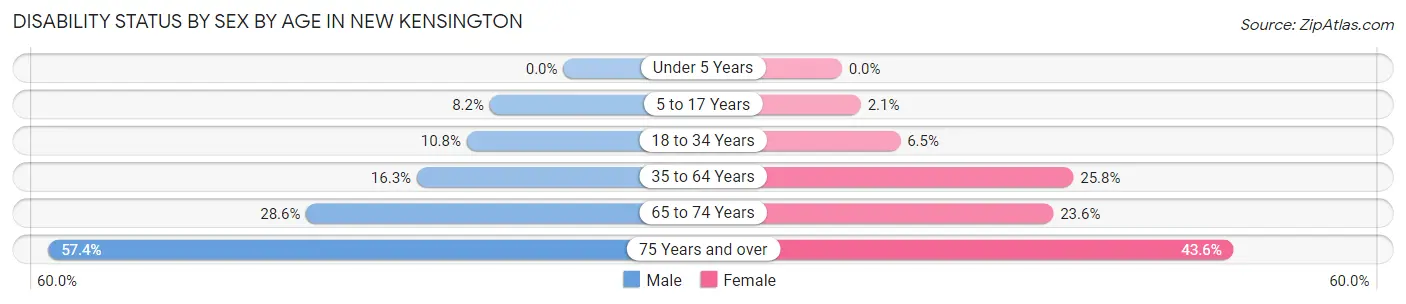
| Age Bracket | Male | Female |
| Under 5 Years | 0 (0.0%) | 0 (0.0%) |
| 5 to 17 Years | 66 (8.2%) | 15 (2.1%) |
| 18 to 34 Years | 146 (10.7%) | 65 (6.5%) |
| 35 to 64 Years | 393 (16.3%) | 609 (25.8%) |
| 65 to 74 Years | 219 (28.6%) | 183 (23.5%) |
| 75 Years and over | 319 (57.4%) | 298 (43.6%) |
Disability Class by Sex by Age in New Kensington
Disability Class: Hearing Difficulty
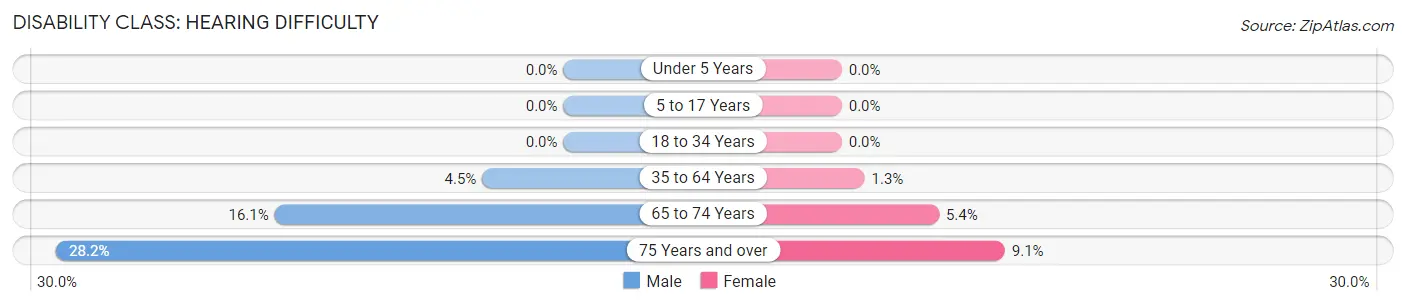
| Age Bracket | Male | Female |
| Under 5 Years | 0 (0.0%) | 0 (0.0%) |
| 5 to 17 Years | 0 (0.0%) | 0 (0.0%) |
| 18 to 34 Years | 0 (0.0%) | 0 (0.0%) |
| 35 to 64 Years | 109 (4.5%) | 30 (1.3%) |
| 65 to 74 Years | 123 (16.1%) | 42 (5.4%) |
| 75 Years and over | 157 (28.2%) | 62 (9.1%) |
Disability Class: Vision Difficulty
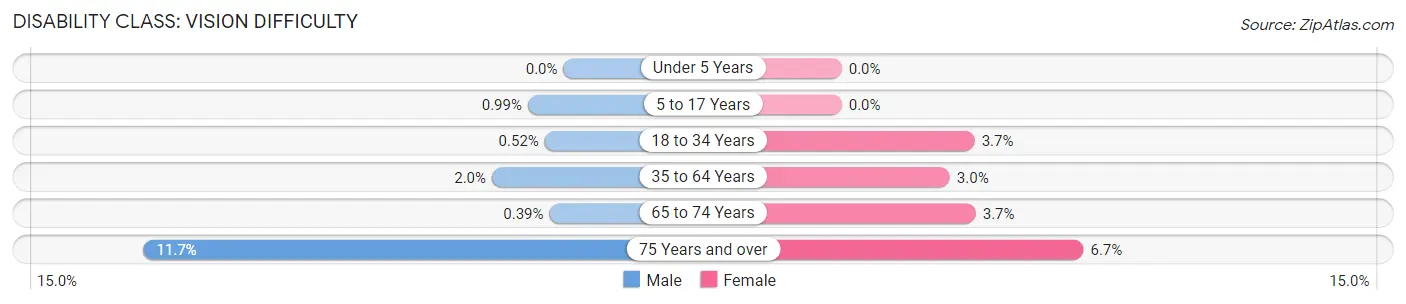
| Age Bracket | Male | Female |
| Under 5 Years | 0 (0.0%) | 0 (0.0%) |
| 5 to 17 Years | 8 (1.0%) | 0 (0.0%) |
| 18 to 34 Years | 7 (0.5%) | 37 (3.7%) |
| 35 to 64 Years | 48 (2.0%) | 71 (3.0%) |
| 65 to 74 Years | 3 (0.4%) | 29 (3.7%) |
| 75 Years and over | 65 (11.7%) | 46 (6.7%) |
Disability Class: Cognitive Difficulty
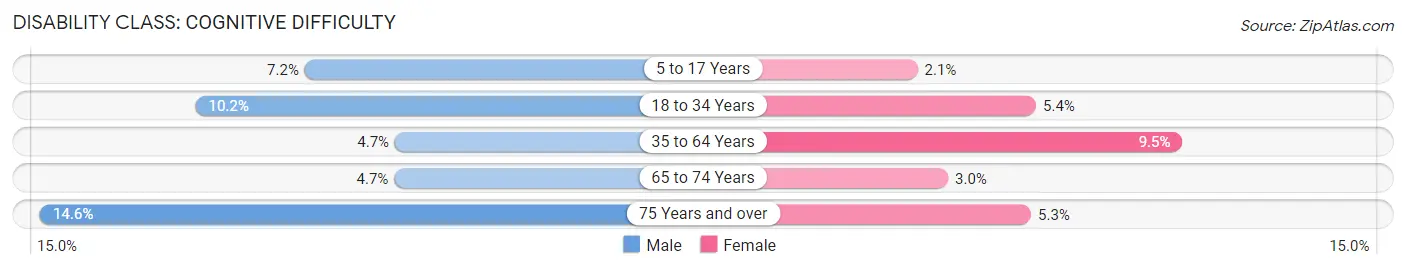
| Age Bracket | Male | Female |
| 5 to 17 Years | 58 (7.2%) | 15 (2.1%) |
| 18 to 34 Years | 139 (10.2%) | 54 (5.4%) |
| 35 to 64 Years | 113 (4.7%) | 224 (9.5%) |
| 65 to 74 Years | 36 (4.7%) | 23 (3.0%) |
| 75 Years and over | 81 (14.6%) | 36 (5.3%) |
Disability Class: Ambulatory Difficulty
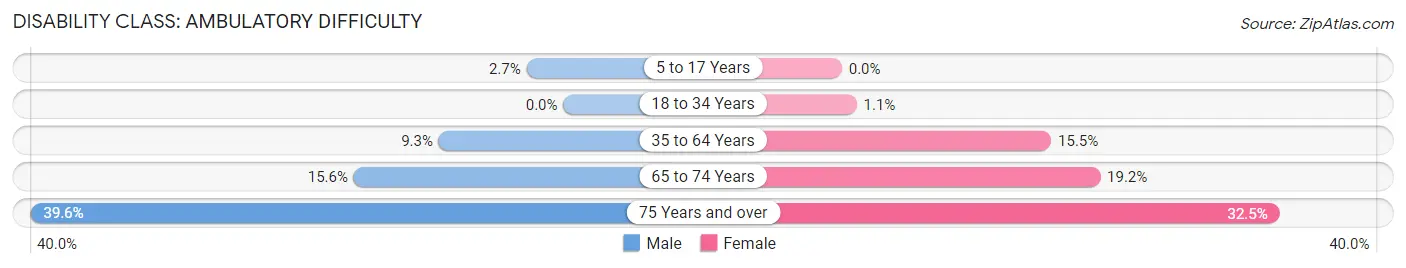
| Age Bracket | Male | Female |
| 5 to 17 Years | 22 (2.7%) | 0 (0.0%) |
| 18 to 34 Years | 0 (0.0%) | 11 (1.1%) |
| 35 to 64 Years | 223 (9.2%) | 367 (15.5%) |
| 65 to 74 Years | 119 (15.6%) | 149 (19.2%) |
| 75 Years and over | 220 (39.6%) | 222 (32.5%) |
Disability Class: Self-Care Difficulty
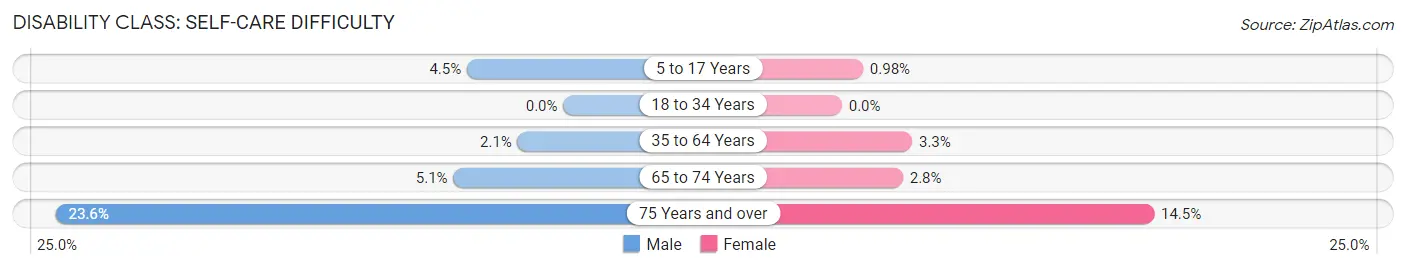
| Age Bracket | Male | Female |
| 5 to 17 Years | 36 (4.5%) | 7 (1.0%) |
| 18 to 34 Years | 0 (0.0%) | 0 (0.0%) |
| 35 to 64 Years | 51 (2.1%) | 77 (3.3%) |
| 65 to 74 Years | 39 (5.1%) | 22 (2.8%) |
| 75 Years and over | 131 (23.6%) | 99 (14.5%) |
Technology Access in New Kensington
Computing Device Access in New Kensington
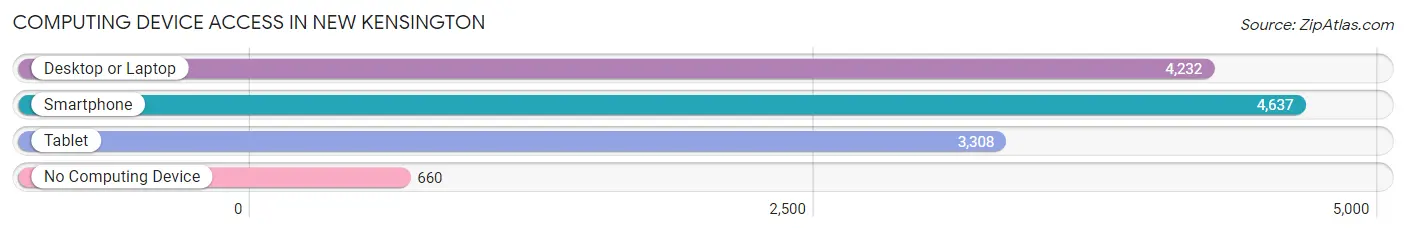
| Device Type | # Households | % Households |
| Desktop or Laptop | 4,232 | 71.0% |
| Smartphone | 4,637 | 77.7% |
| Tablet | 3,308 | 55.5% |
| No Computing Device | 660 | 11.1% |
| Total | 5,964 | 100.0% |
Internet Access in New Kensington
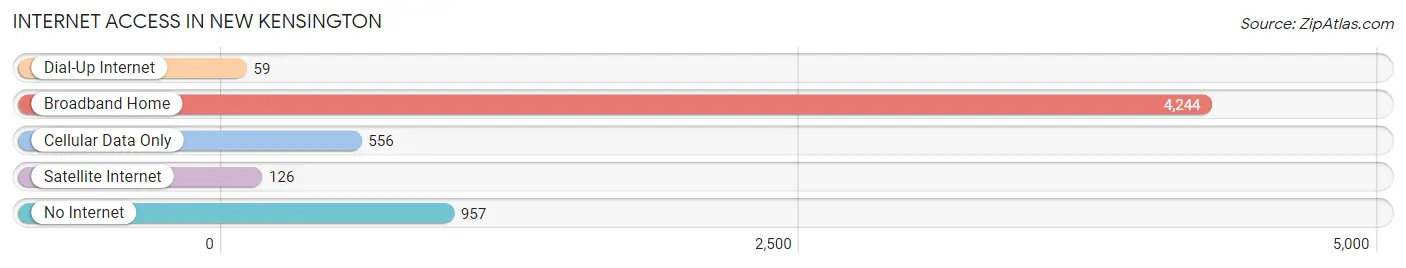
| Internet Type | # Households | % Households |
| Dial-Up Internet | 59 | 1.0% |
| Broadband Home | 4,244 | 71.2% |
| Cellular Data Only | 556 | 9.3% |
| Satellite Internet | 126 | 2.1% |
| No Internet | 957 | 16.1% |
| Total | 5,964 | 100.0% |
New Kensington Summary
Kensington, Pennsylvania is a small city located in Westmoreland County, Pennsylvania. It is situated along the Allegheny River, approximately 25 miles northeast of Pittsburgh. The city has a population of approximately 13,000 people and is part of the Pittsburgh metropolitan area.
History
Kensington was founded in 1891 by the New Kensington Land Company. The company was formed by a group of investors from Pittsburgh who wanted to create a new industrial center in the area. The city was named after the city of Kensington in England. The city was designed to be a model industrial city, with wide streets, parks, and a variety of housing options.
The city quickly grew and became a major industrial center. The city was home to several steel mills, glass factories, and other manufacturing plants. The city also had a thriving business district, with several banks, stores, and other businesses.
The city experienced a period of decline in the mid-20th century, as the steel industry declined and many of the factories closed. The city has since experienced a resurgence, with new businesses and industries moving into the area.
Geography
Kensington is located in Westmoreland County, Pennsylvania. It is situated along the Allegheny River, approximately 25 miles northeast of Pittsburgh. The city has a total area of 4.2 square miles, all of which is land.
The city is located in a hilly region, with the Allegheny River running through the city. The city is home to several parks, including the New Kensington Riverfront Park, which offers views of the river and the city skyline.
Economy
Kensington is home to a variety of businesses and industries. The city is home to several manufacturing plants, including a steel mill, a glass factory, and a plastics plant. The city is also home to several banks, stores, and other businesses.
The city is also home to several educational institutions, including the University of Pittsburgh at Greensburg, the Pennsylvania State University at New Kensington, and the Westmoreland County Community College.
Demographics
Kensington has a population of approximately 13,000 people. The city has a diverse population, with people of various races, ethnicities, and religions. The city has a median household income of $37,000 and a poverty rate of 17%.
The city is home to a variety of religious institutions, including churches, synagogues, and mosques. The city is also home to several cultural institutions, including the New Kensington Historical Society and the New Kensington Arts Council.
Conclusion
Kensington, Pennsylvania is a small city located in Westmoreland County, Pennsylvania. It is situated along the Allegheny River, approximately 25 miles northeast of Pittsburgh. The city has a population of approximately 13,000 people and is part of the Pittsburgh metropolitan area. The city was founded in 1891 and was designed to be a model industrial city. The city has since experienced a resurgence, with new businesses and industries moving into the area. The city has a diverse population, with people of various races, ethnicities, and religions. The city is home to several businesses and industries, as well as educational and cultural institutions.
Common Questions
What is Per Capita Income in New Kensington?
Per Capita income in New Kensington is $29,099.
What is the Median Family Income in New Kensington?
Median Family Income in New Kensington is $64,702.
What is the Median Household income in New Kensington?
Median Household Income in New Kensington is $47,015.
What is Income or Wage Gap in New Kensington?
Income or Wage Gap in New Kensington is 29.7%.
Women in New Kensington earn 70.3 cents for every dollar earned by a man.
What is Family Income Deficit in New Kensington?
Family Income Deficit in New Kensington is $14,229.
Families that are below poverty line in New Kensington earn $14,229 less on average than the poverty threshold level.
What is Inequality or Gini Index in New Kensington?
Inequality or Gini Index in New Kensington is 0.42.
What is the Total Population of New Kensington?
Total Population of New Kensington is 12,163.
What is the Total Male Population of New Kensington?
Total Male Population of New Kensington is 6,282.
What is the Total Female Population of New Kensington?
Total Female Population of New Kensington is 5,881.
What is the Ratio of Males per 100 Females in New Kensington?
There are 106.82 Males per 100 Females in New Kensington.
What is the Ratio of Females per 100 Males in New Kensington?
There are 93.62 Females per 100 Males in New Kensington.
What is the Median Population Age in New Kensington?
Median Population Age in New Kensington is 47.8 Years.
What is the Average Family Size in New Kensington
Average Family Size in New Kensington is 2.8 People.
What is the Average Household Size in New Kensington
Average Household Size in New Kensington is 2.0 People.
How Large is the Labor Force in New Kensington?
There are 5,686 People in the Labor Forcein in New Kensington.
What is the Percentage of People in the Labor Force in New Kensington?
56.4% of People are in the Labor Force in New Kensington.
What is the Unemployment Rate in New Kensington?
Unemployment Rate in New Kensington is 7.0%.