Village Green Green Ridge, PA Map & Demographics
Village Green Green Ridge Map
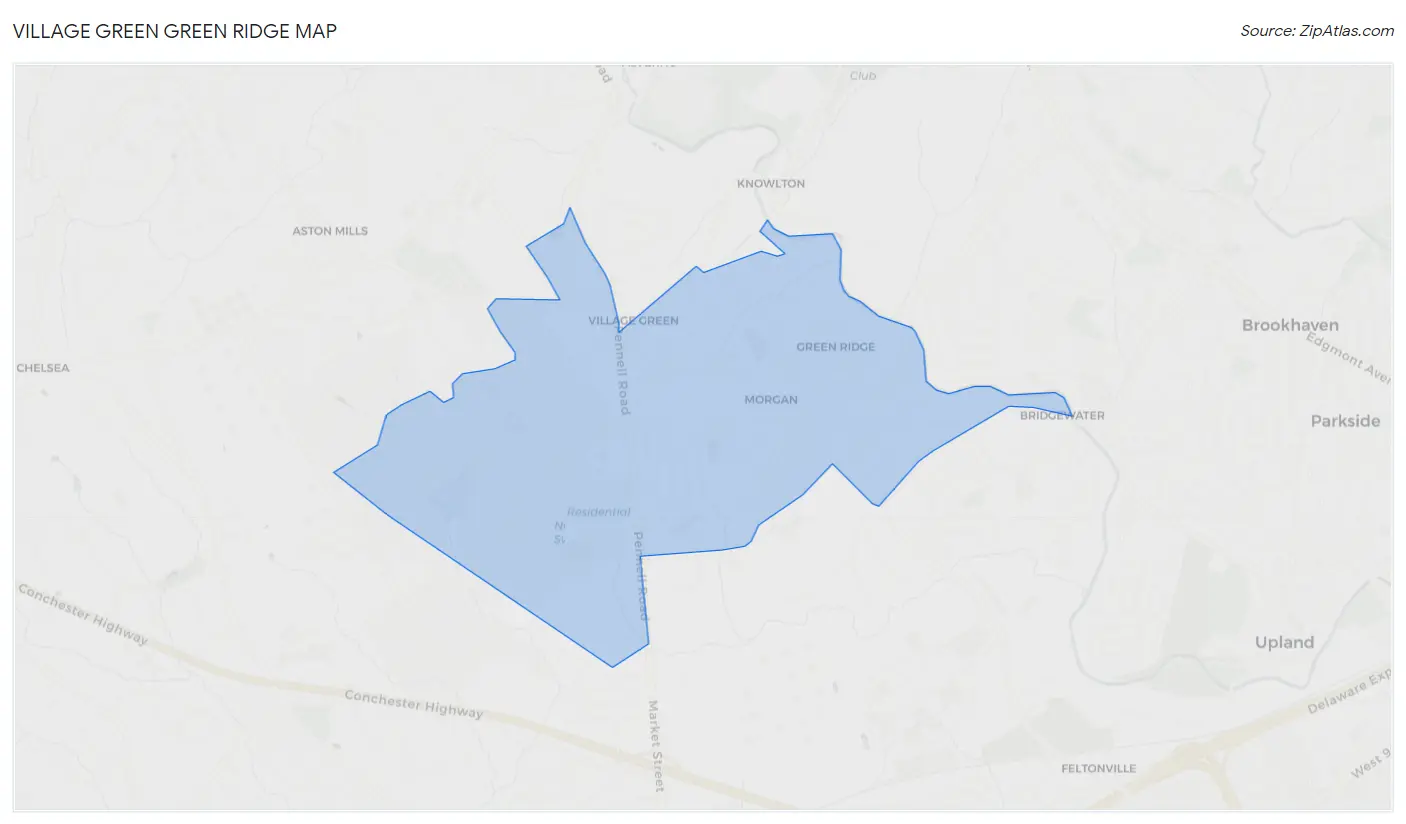
Village Green Green Ridge Overview
$42,436
PER CAPITA INCOME
$118,400
AVG FAMILY INCOME
$93,370
AVG HOUSEHOLD INCOME
53.5%
WAGE / INCOME GAP [ % ]
46.5¢/ $1
WAGE / INCOME GAP [ $ ]
0.40
INEQUALITY / GINI INDEX
8,652
TOTAL POPULATION
3,929
MALE POPULATION
4,723
FEMALE POPULATION
83.19
MALES / 100 FEMALES
120.21
FEMALES / 100 MALES
47.0
MEDIAN AGE
3.1
AVG FAMILY SIZE
2.6
AVG HOUSEHOLD SIZE
4,676
LABOR FORCE [ PEOPLE ]
64.5%
PERCENT IN LABOR FORCE
6.8%
UNEMPLOYMENT RATE
Income in Village Green Green Ridge
Income Overview in Village Green Green Ridge
Per Capita Income in Village Green Green Ridge is $42,436, while median incomes of families and households are $118,400 and $93,370 respectively.
| Characteristic | Number | Measure |
| Per Capita Income | 8,652 | $42,436 |
| Median Family Income | 2,428 | $118,400 |
| Mean Family Income | 2,428 | $125,910 |
| Median Household Income | 3,259 | $93,370 |
| Mean Household Income | 3,259 | $110,250 |
| Income Deficit | 2,428 | $0 |
| Wage / Income Gap (%) | 8,652 | 53.54% |
| Wage / Income Gap ($) | 8,652 | 46.46¢ per $1 |
| Gini / Inequality Index | 8,652 | 0.40 |
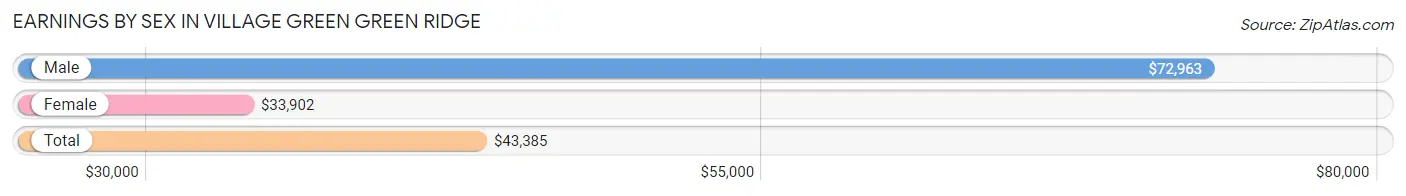
Earnings by Sex in Village Green Green Ridge
Average Earnings in Village Green Green Ridge are $43,385, $72,963 for men and $33,902 for women, a difference of 53.5%.
| Sex | Number | Average Earnings |
| Male | 2,256 (47.7%) | $72,963 |
| Female | 2,478 (52.3%) | $33,902 |
| Total | 4,734 (100.0%) | $43,385 |
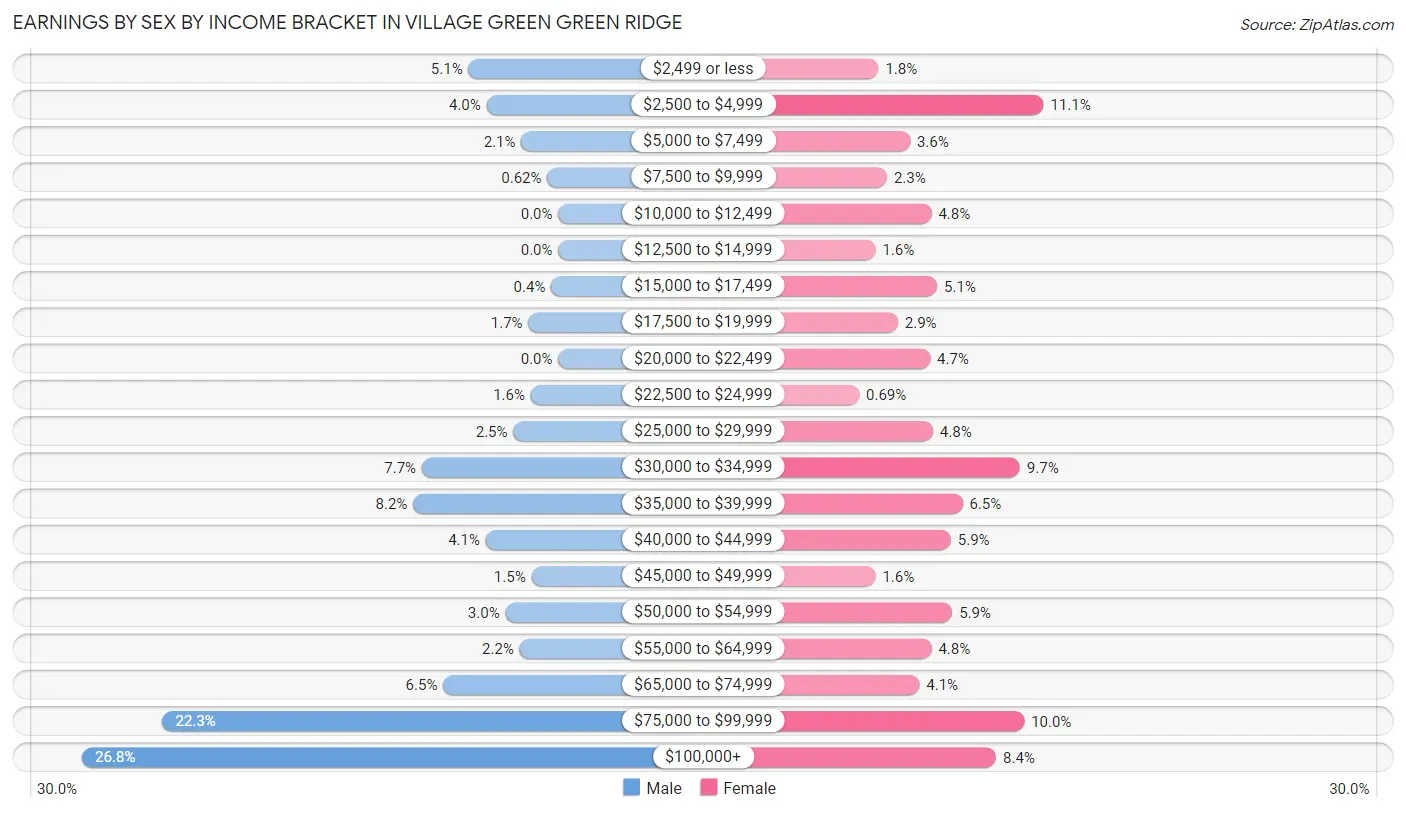
Earnings by Sex by Income Bracket in Village Green Green Ridge
The most common earnings brackets in Village Green Green Ridge are $100,000+ for men (604 | 26.8%) and $2,500 to $4,999 for women (274 | 11.1%).
| Income | Male | Female |
| $2,499 or less | 114 (5.1%) | 44 (1.8%) |
| $2,500 to $4,999 | 91 (4.0%) | 274 (11.1%) |
| $5,000 to $7,499 | 47 (2.1%) | 88 (3.5%) |
| $7,500 to $9,999 | 14 (0.6%) | 56 (2.3%) |
| $10,000 to $12,499 | 0 (0.0%) | 118 (4.8%) |
| $12,500 to $14,999 | 0 (0.0%) | 40 (1.6%) |
| $15,000 to $17,499 | 9 (0.4%) | 126 (5.1%) |
| $17,500 to $19,999 | 38 (1.7%) | 71 (2.9%) |
| $20,000 to $22,499 | 0 (0.0%) | 116 (4.7%) |
| $22,500 to $24,999 | 35 (1.5%) | 17 (0.7%) |
| $25,000 to $29,999 | 57 (2.5%) | 120 (4.8%) |
| $30,000 to $34,999 | 173 (7.7%) | 241 (9.7%) |
| $35,000 to $39,999 | 184 (8.2%) | 161 (6.5%) |
| $40,000 to $44,999 | 92 (4.1%) | 145 (5.9%) |
| $45,000 to $49,999 | 34 (1.5%) | 40 (1.6%) |
| $50,000 to $54,999 | 67 (3.0%) | 147 (5.9%) |
| $55,000 to $64,999 | 49 (2.2%) | 118 (4.8%) |
| $65,000 to $74,999 | 146 (6.5%) | 101 (4.1%) |
| $75,000 to $99,999 | 502 (22.3%) | 247 (10.0%) |
| $100,000+ | 604 (26.8%) | 208 (8.4%) |
| Total | 2,256 (100.0%) | 2,478 (100.0%) |
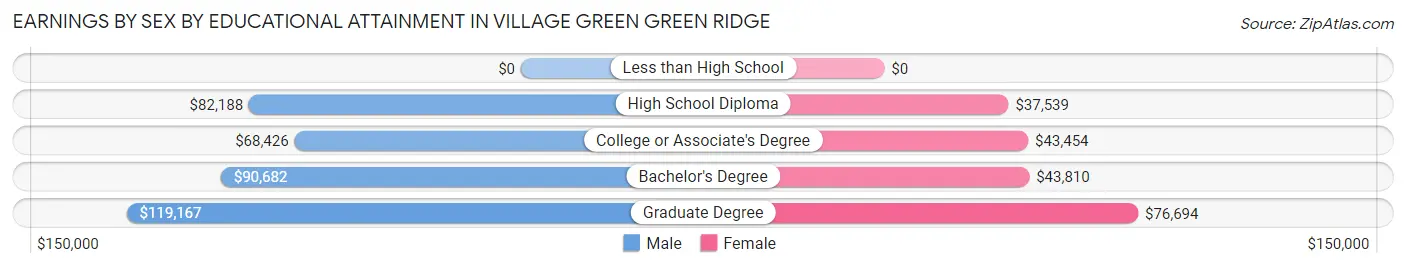
Earnings by Sex by Educational Attainment in Village Green Green Ridge
Average earnings in Village Green Green Ridge are $83,835 for men and $43,330 for women, a difference of 48.3%. Men with an educational attainment of graduate degree enjoy the highest average annual earnings of $119,167, while those with college or associate's degree education earn the least with $68,426. Women with an educational attainment of graduate degree earn the most with the average annual earnings of $76,694, while those with high school diploma education have the smallest earnings of $37,539.
| Educational Attainment | Male Income | Female Income |
| Less than High School | - | - |
| High School Diploma | $82,188 | $37,539 |
| College or Associate's Degree | $68,426 | $43,454 |
| Bachelor's Degree | $90,682 | $43,810 |
| Graduate Degree | $119,167 | $76,694 |
| Total | $83,835 | $43,330 |
Family Income in Village Green Green Ridge
Family Income Brackets in Village Green Green Ridge
According to the Village Green Green Ridge family income data, there are 646 families falling into the $100,000 to $149,999 income range, which is the most common income bracket and makes up 26.6% of all families. Conversely, the $10,000 to $14,999 income bracket is the least frequent group with only 17 families (0.7%) belonging to this category.
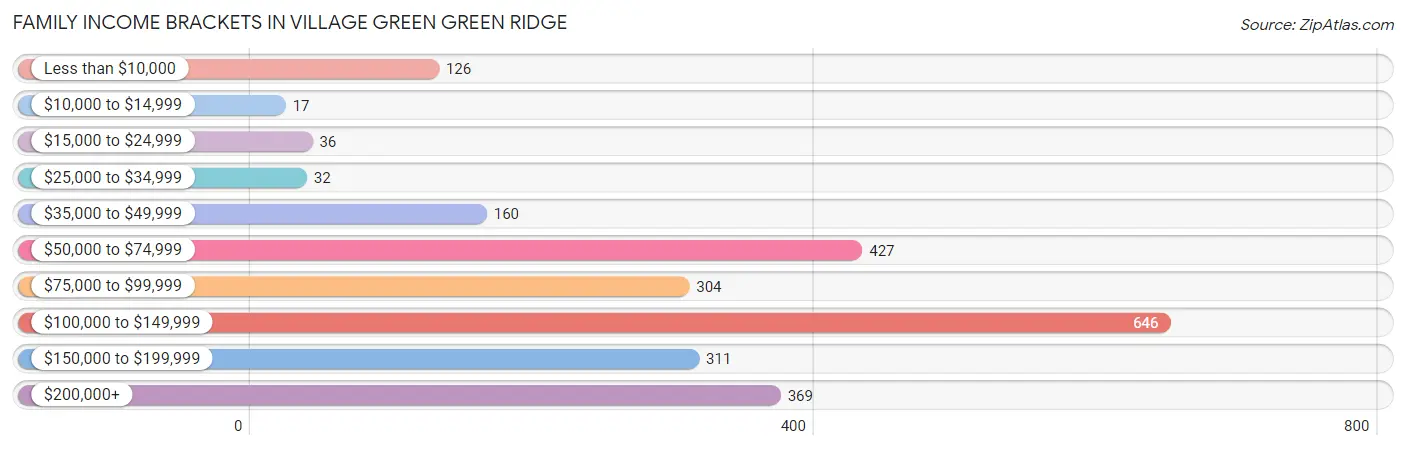
| Income Bracket | # Families | % Families |
| Less than $10,000 | 126 | 5.2% |
| $10,000 to $14,999 | 17 | 0.7% |
| $15,000 to $24,999 | 36 | 1.5% |
| $25,000 to $34,999 | 32 | 1.3% |
| $35,000 to $49,999 | 160 | 6.6% |
| $50,000 to $74,999 | 427 | 17.6% |
| $75,000 to $99,999 | 304 | 12.5% |
| $100,000 to $149,999 | 646 | 26.6% |
| $150,000 to $199,999 | 311 | 12.8% |
| $200,000+ | 369 | 15.2% |
Family Income by Famaliy Size in Village Green Green Ridge
5-person families (191 | 7.9%) account for the highest median family income in Village Green Green Ridge with $168,393 per family, while 2-person families (989 | 40.7%) have the highest median income of $45,208 per family member.
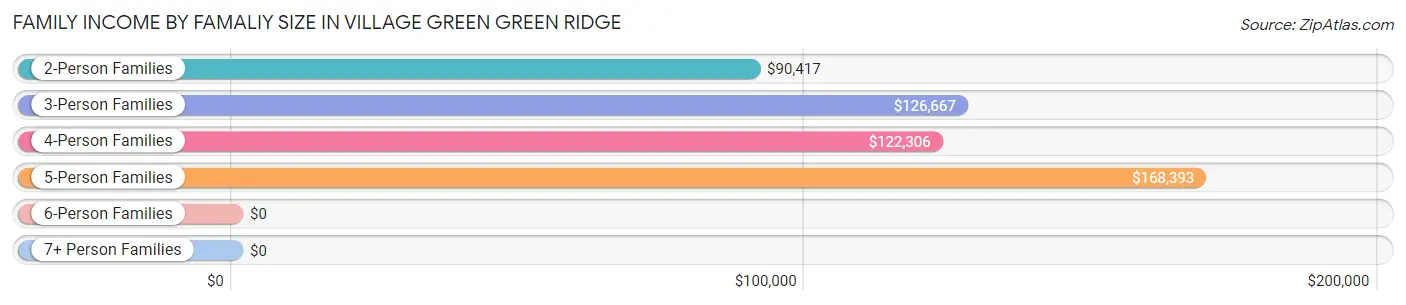
| Income Bracket | # Families | Median Income |
| 2-Person Families | 989 (40.7%) | $90,417 |
| 3-Person Families | 532 (21.9%) | $126,667 |
| 4-Person Families | 652 (26.9%) | $122,306 |
| 5-Person Families | 191 (7.9%) | $168,393 |
| 6-Person Families | 64 (2.6%) | $0 |
| 7+ Person Families | 0 (0.0%) | $0 |
| Total | 2,428 (100.0%) | $118,400 |
Family Income by Number of Earners in Village Green Green Ridge
The median family income in Village Green Green Ridge is $118,400, with families comprising 3+ earners (472) having the highest median family income of $203,152, while families with no earners (430) have the lowest median family income of $49,688, accounting for 19.4% and 17.7% of families, respectively.
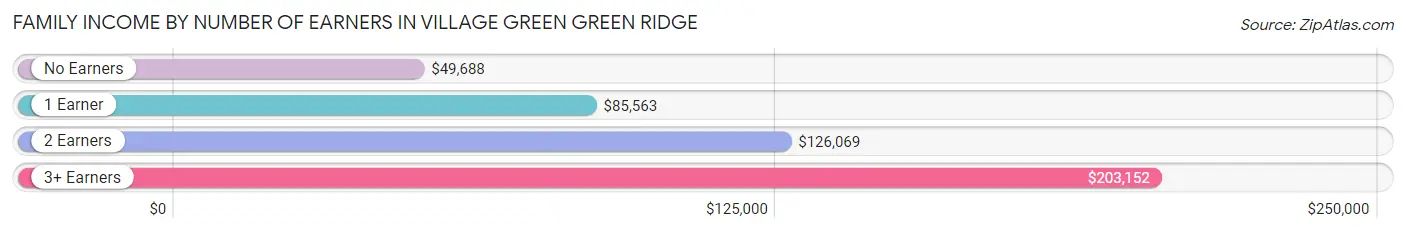
| Number of Earners | # Families | Median Income |
| No Earners | 430 (17.7%) | $49,688 |
| 1 Earner | 605 (24.9%) | $85,563 |
| 2 Earners | 921 (37.9%) | $126,069 |
| 3+ Earners | 472 (19.4%) | $203,152 |
| Total | 2,428 (100.0%) | $118,400 |
Household Income in Village Green Green Ridge
Household Income Brackets in Village Green Green Ridge
With 720 households falling in the category, the $100,000 to $149,999 income range is the most frequent in Village Green Green Ridge, accounting for 22.1% of all households. In contrast, only 52 households (1.6%) fall into the $10,000 to $14,999 income bracket, making it the least populous group.
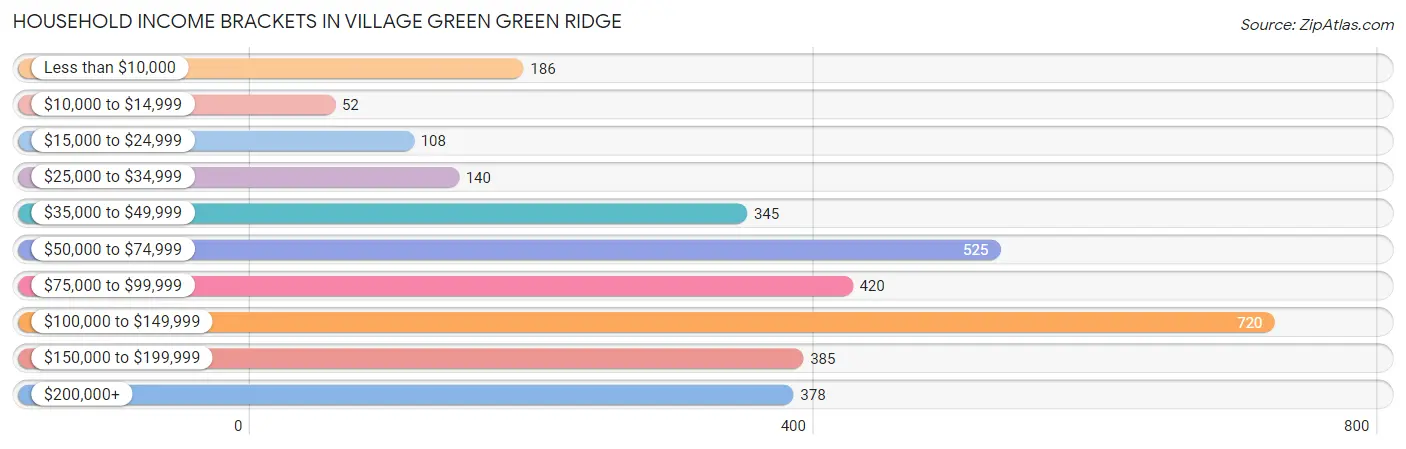
| Income Bracket | # Households | % Households |
| Less than $10,000 | 186 | 5.7% |
| $10,000 to $14,999 | 52 | 1.6% |
| $15,000 to $24,999 | 108 | 3.3% |
| $25,000 to $34,999 | 140 | 4.3% |
| $35,000 to $49,999 | 345 | 10.6% |
| $50,000 to $74,999 | 525 | 16.1% |
| $75,000 to $99,999 | 420 | 12.9% |
| $100,000 to $149,999 | 720 | 22.1% |
| $150,000 to $199,999 | 385 | 11.8% |
| $200,000+ | 378 | 11.6% |
Household Income by Householder Age in Village Green Green Ridge
The median household income in Village Green Green Ridge is $93,370, with the highest median household income of $125,066 found in the 45 to 64 years age bracket for the primary householder. A total of 1,381 households (42.4%) fall into this category.
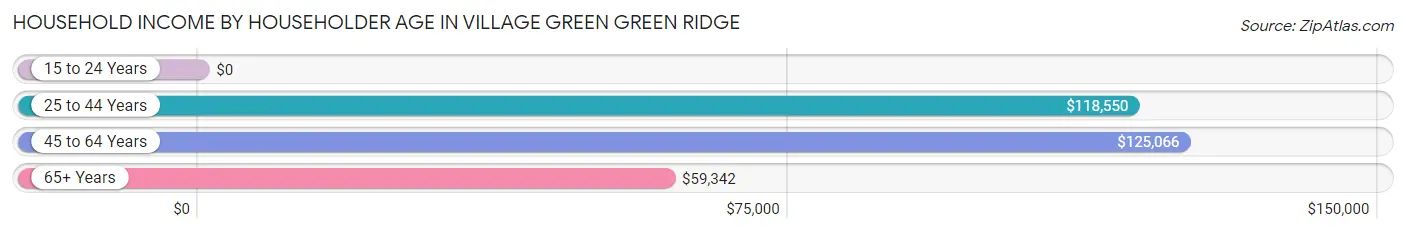
| Income Bracket | # Households | Median Income |
| 15 to 24 Years | 0 (0.0%) | $0 |
| 25 to 44 Years | 694 (21.3%) | $118,550 |
| 45 to 64 Years | 1,381 (42.4%) | $125,066 |
| 65+ Years | 1,184 (36.3%) | $59,342 |
| Total | 3,259 (100.0%) | $93,370 |
Poverty in Village Green Green Ridge
Income Below Poverty by Sex and Age in Village Green Green Ridge
With 11.0% poverty level for males and 6.0% for females among the residents of Village Green Green Ridge, 5 year old males and 12 to 14 year old females are the most vulnerable to poverty, with 47 males (82.5%) and 51 females (75.0%) in their respective age groups living below the poverty level.
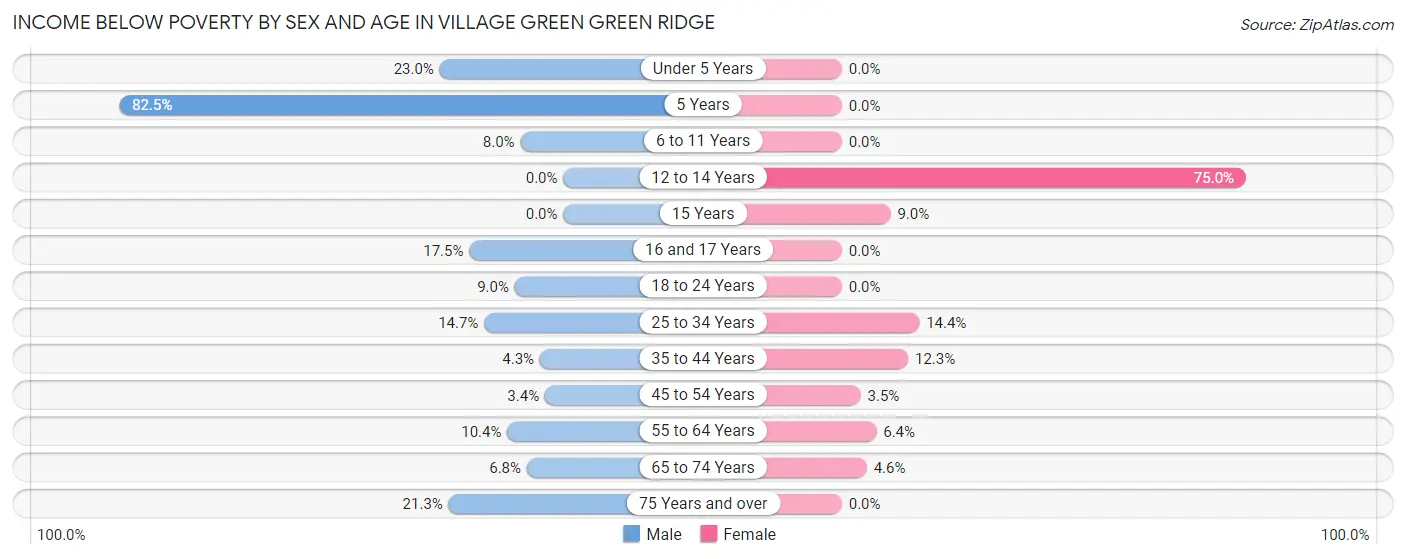
| Age Bracket | Male | Female |
| Under 5 Years | 70 (23.0%) | 0 (0.0%) |
| 5 Years | 47 (82.5%) | 0 (0.0%) |
| 6 to 11 Years | 24 (8.0%) | 0 (0.0%) |
| 12 to 14 Years | 0 (0.0%) | 51 (75.0%) |
| 15 Years | 0 (0.0%) | 13 (9.0%) |
| 16 and 17 Years | 11 (17.5%) | 0 (0.0%) |
| 18 to 24 Years | 30 (9.0%) | 0 (0.0%) |
| 25 to 34 Years | 52 (14.7%) | 76 (14.4%) |
| 35 to 44 Years | 17 (4.3%) | 47 (12.3%) |
| 45 to 54 Years | 16 (3.4%) | 22 (3.5%) |
| 55 to 64 Years | 78 (10.4%) | 42 (6.4%) |
| 65 to 74 Years | 42 (6.8%) | 31 (4.6%) |
| 75 Years and over | 43 (21.3%) | 0 (0.0%) |
| Total | 430 (11.0%) | 282 (6.0%) |
Income Above Poverty by Sex and Age in Village Green Green Ridge
According to the poverty statistics in Village Green Green Ridge, males aged 12 to 14 years and females aged under 5 years are the age groups that are most secure financially, with 100.0% of males and 100.0% of females in these age groups living above the poverty line.
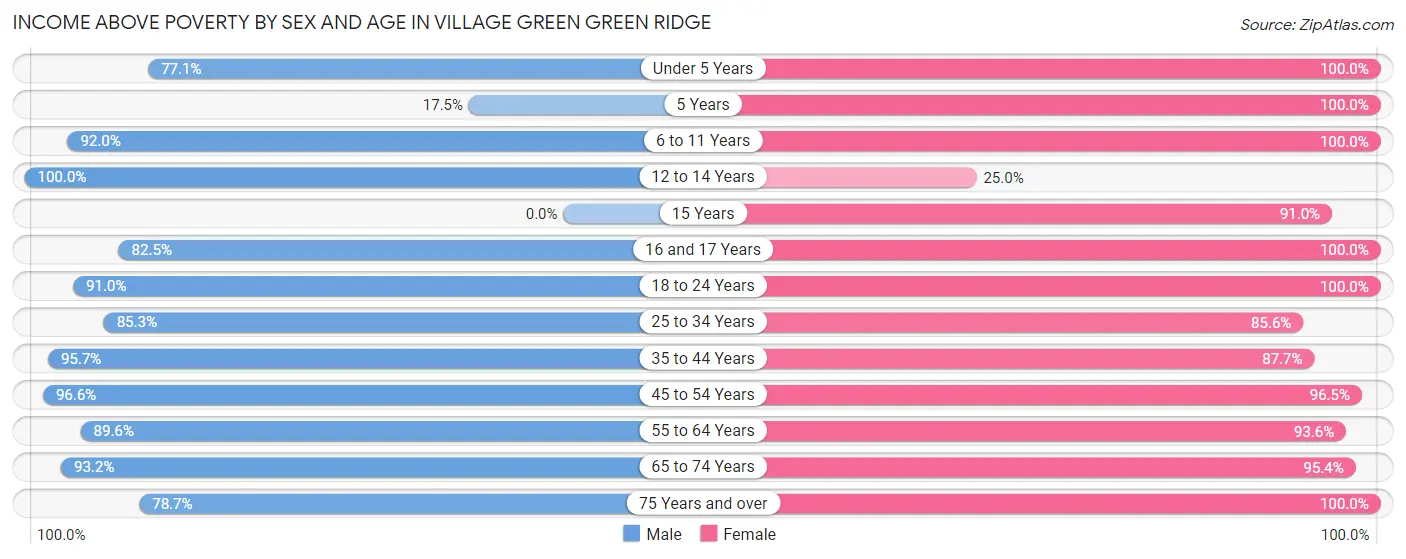
| Age Bracket | Male | Female |
| Under 5 Years | 235 (77.0%) | 270 (100.0%) |
| 5 Years | 10 (17.5%) | 33 (100.0%) |
| 6 to 11 Years | 277 (92.0%) | 155 (100.0%) |
| 12 to 14 Years | 69 (100.0%) | 17 (25.0%) |
| 15 Years | 0 (0.0%) | 131 (91.0%) |
| 16 and 17 Years | 52 (82.5%) | 181 (100.0%) |
| 18 to 24 Years | 303 (91.0%) | 551 (100.0%) |
| 25 to 34 Years | 302 (85.3%) | 453 (85.6%) |
| 35 to 44 Years | 375 (95.7%) | 335 (87.7%) |
| 45 to 54 Years | 453 (96.6%) | 609 (96.5%) |
| 55 to 64 Years | 672 (89.6%) | 614 (93.6%) |
| 65 to 74 Years | 578 (93.2%) | 638 (95.4%) |
| 75 Years and over | 159 (78.7%) | 440 (100.0%) |
| Total | 3,485 (89.0%) | 4,427 (94.0%) |
Income Below Poverty Among Married-Couple Families in Village Green Green Ridge
The poverty statistics for married-couple families in Village Green Green Ridge show that 2.3% or 45 of the total 1,922 families live below the poverty line. Families with no children have the highest poverty rate of 2.7%, comprising of 29 families. On the other hand, families with 3 or 4 children have the lowest poverty rate of 0.0%, which includes 0 families.
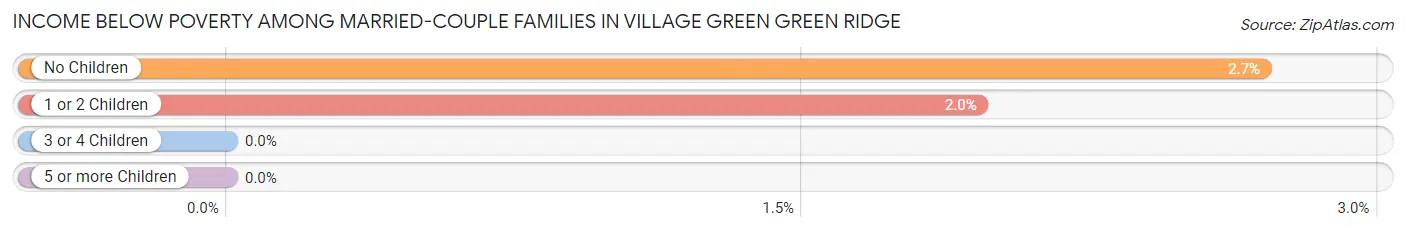
| Children | Above Poverty | Below Poverty |
| No Children | 1,046 (97.3%) | 29 (2.7%) |
| 1 or 2 Children | 801 (98.0%) | 16 (2.0%) |
| 3 or 4 Children | 30 (100.0%) | 0 (0.0%) |
| 5 or more Children | 0 (0.0%) | 0 (0.0%) |
| Total | 1,877 (97.7%) | 45 (2.3%) |
Income Below Poverty Among Single-Parent Households in Village Green Green Ridge
According to the poverty data in Village Green Green Ridge, 54.3% or 57 single-father households and 12.2% or 49 single-mother households are living below the poverty line. Among single-father households, those with 3 or 4 children have the highest poverty rate, with 51 households (100.0%) experiencing poverty. Likewise, among single-mother households, those with 1 or 2 children have the highest poverty rate, with 49 households (23.0%) falling below the poverty line.
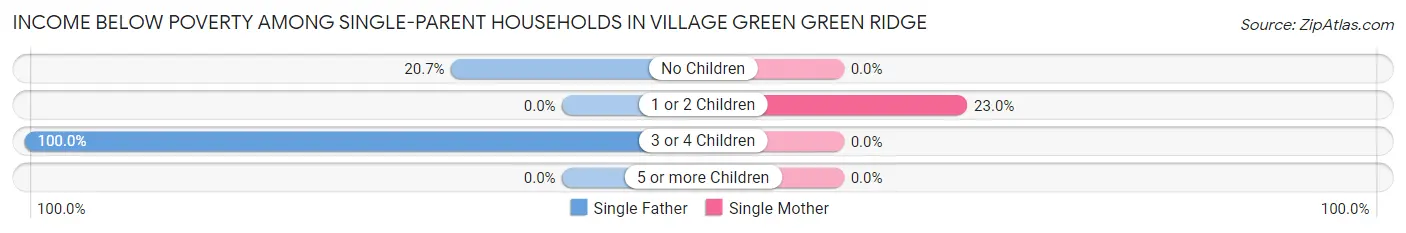
| Children | Single Father | Single Mother |
| No Children | 6 (20.7%) | 0 (0.0%) |
| 1 or 2 Children | 0 (0.0%) | 49 (23.0%) |
| 3 or 4 Children | 51 (100.0%) | 0 (0.0%) |
| 5 or more Children | 0 (0.0%) | 0 (0.0%) |
| Total | 57 (54.3%) | 49 (12.2%) |
Income Below Poverty Among Married-Couple vs Single-Parent Households in Village Green Green Ridge
The poverty data for Village Green Green Ridge shows that 45 of the married-couple family households (2.3%) and 106 of the single-parent households (20.9%) are living below the poverty level. Within the married-couple family households, those with no children have the highest poverty rate, with 29 households (2.7%) falling below the poverty line. Among the single-parent households, those with 3 or 4 children have the highest poverty rate, with 51 household (100.0%) living below poverty.
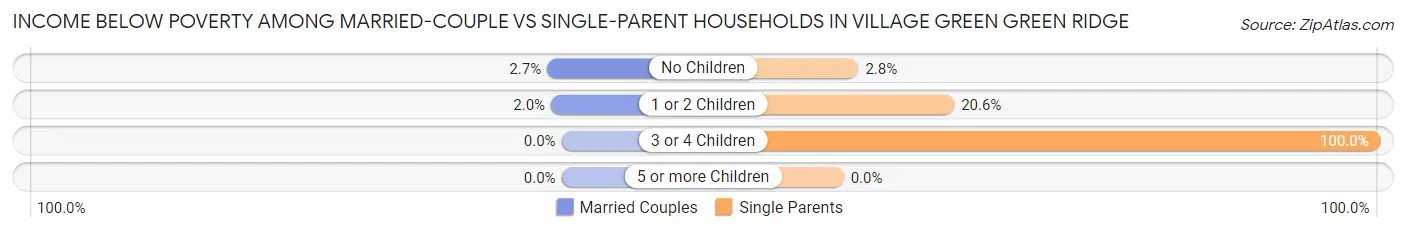
| Children | Married-Couple Families | Single-Parent Households |
| No Children | 29 (2.7%) | 6 (2.8%) |
| 1 or 2 Children | 16 (2.0%) | 49 (20.6%) |
| 3 or 4 Children | 0 (0.0%) | 51 (100.0%) |
| 5 or more Children | 0 (0.0%) | 0 (0.0%) |
| Total | 45 (2.3%) | 106 (20.9%) |
Race in Village Green Green Ridge
The most populous races in Village Green Green Ridge are White / Caucasian (8,032 | 92.8%), Asian (180 | 2.1%), and Two or more Races (178 | 2.1%).
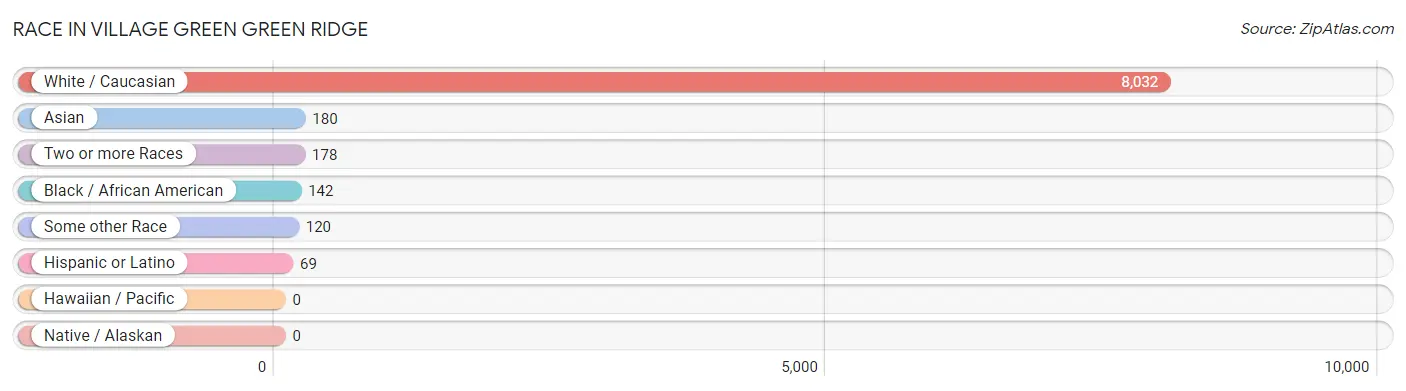
| Race | # Population | % Population |
| Asian | 180 | 2.1% |
| Black / African American | 142 | 1.6% |
| Hawaiian / Pacific | 0 | 0.0% |
| Hispanic or Latino | 69 | 0.8% |
| Native / Alaskan | 0 | 0.0% |
| White / Caucasian | 8,032 | 92.8% |
| Two or more Races | 178 | 2.1% |
| Some other Race | 120 | 1.4% |
| Total | 8,652 | 100.0% |
Ancestry in Village Green Green Ridge
The most populous ancestries reported in Village Green Green Ridge are Irish (3,003 | 34.7%), German (2,173 | 25.1%), Italian (1,265 | 14.6%), Polish (1,032 | 11.9%), and English (825 | 9.5%), together accounting for 95.9% of all Village Green Green Ridge residents.
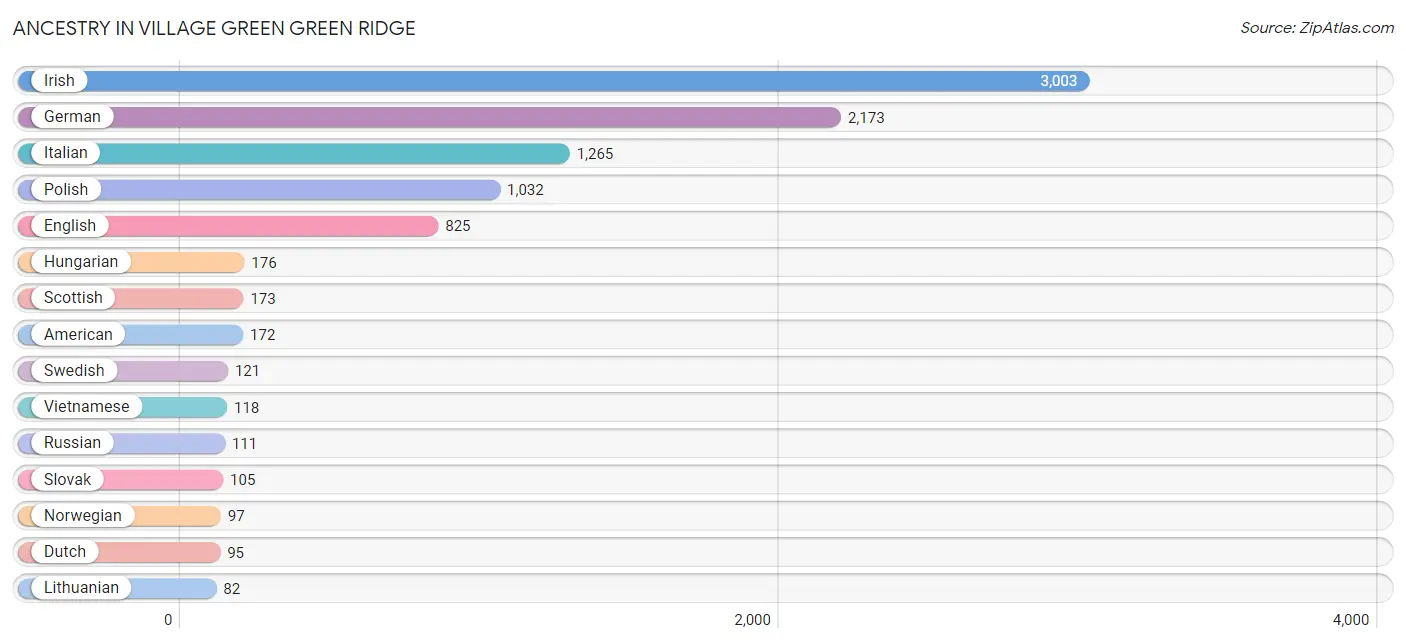
| Ancestry | # Population | % Population |
| American | 172 | 2.0% |
| Austrian | 67 | 0.8% |
| Belgian | 21 | 0.2% |
| Belizean | 28 | 0.3% |
| Brazilian | 24 | 0.3% |
| British | 71 | 0.8% |
| Burmese | 26 | 0.3% |
| Cuban | 9 | 0.1% |
| Czech | 45 | 0.5% |
| Czechoslovakian | 11 | 0.1% |
| Dutch | 95 | 1.1% |
| English | 825 | 9.5% |
| European | 78 | 0.9% |
| French | 48 | 0.5% |
| French Canadian | 38 | 0.4% |
| German | 2,173 | 25.1% |
| Greek | 20 | 0.2% |
| Hungarian | 176 | 2.0% |
| Irish | 3,003 | 34.7% |
| Italian | 1,265 | 14.6% |
| Jamaican | 12 | 0.1% |
| Latvian | 11 | 0.1% |
| Lithuanian | 82 | 0.9% |
| Norwegian | 97 | 1.1% |
| Polish | 1,032 | 11.9% |
| Puerto Rican | 58 | 0.7% |
| Russian | 111 | 1.3% |
| Scotch-Irish | 21 | 0.2% |
| Scottish | 173 | 2.0% |
| Slovak | 105 | 1.2% |
| Swedish | 121 | 1.4% |
| Thai | 36 | 0.4% |
| Ukrainian | 62 | 0.7% |
| Vietnamese | 118 | 1.4% |
| Welsh | 74 | 0.9% | View All 35 Rows |
Immigrants in Village Green Green Ridge
The most numerous immigrant groups reported in Village Green Green Ridge came from Europe (203 | 2.4%), Northern Europe (143 | 1.7%), Asia (110 | 1.3%), Bangladesh (84 | 1.0%), and South Central Asia (84 | 1.0%), together accounting for 7.2% of all Village Green Green Ridge residents.
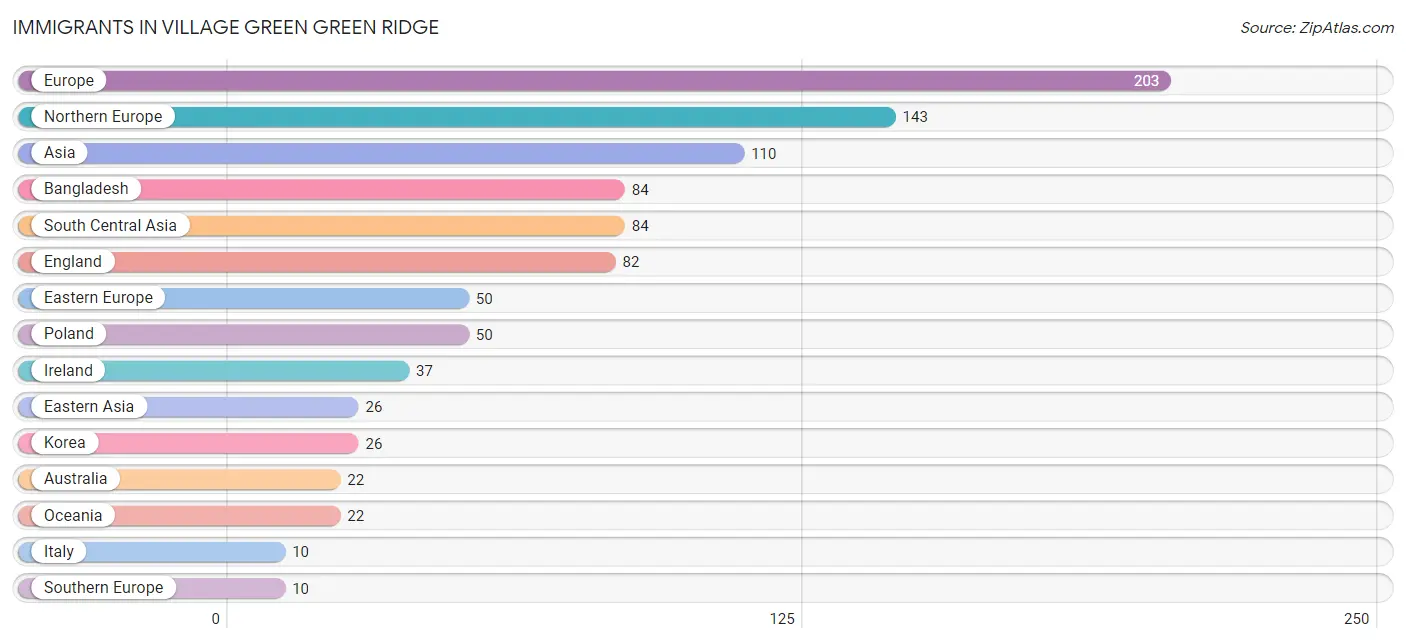
| Immigration Origin | # Population | % Population |
| Asia | 110 | 1.3% |
| Australia | 22 | 0.3% |
| Bangladesh | 84 | 1.0% |
| Eastern Asia | 26 | 0.3% |
| Eastern Europe | 50 | 0.6% |
| England | 82 | 0.9% |
| Europe | 203 | 2.4% |
| Ireland | 37 | 0.4% |
| Italy | 10 | 0.1% |
| Korea | 26 | 0.3% |
| Northern Europe | 143 | 1.7% |
| Oceania | 22 | 0.3% |
| Poland | 50 | 0.6% |
| South Central Asia | 84 | 1.0% |
| Southern Europe | 10 | 0.1% | View All 15 Rows |
Sex and Age in Village Green Green Ridge
Sex and Age in Village Green Green Ridge
The most populous age groups in Village Green Green Ridge are 55 to 59 Years (381 | 9.7%) for men and 15 to 19 Years (514 | 10.9%) for women.
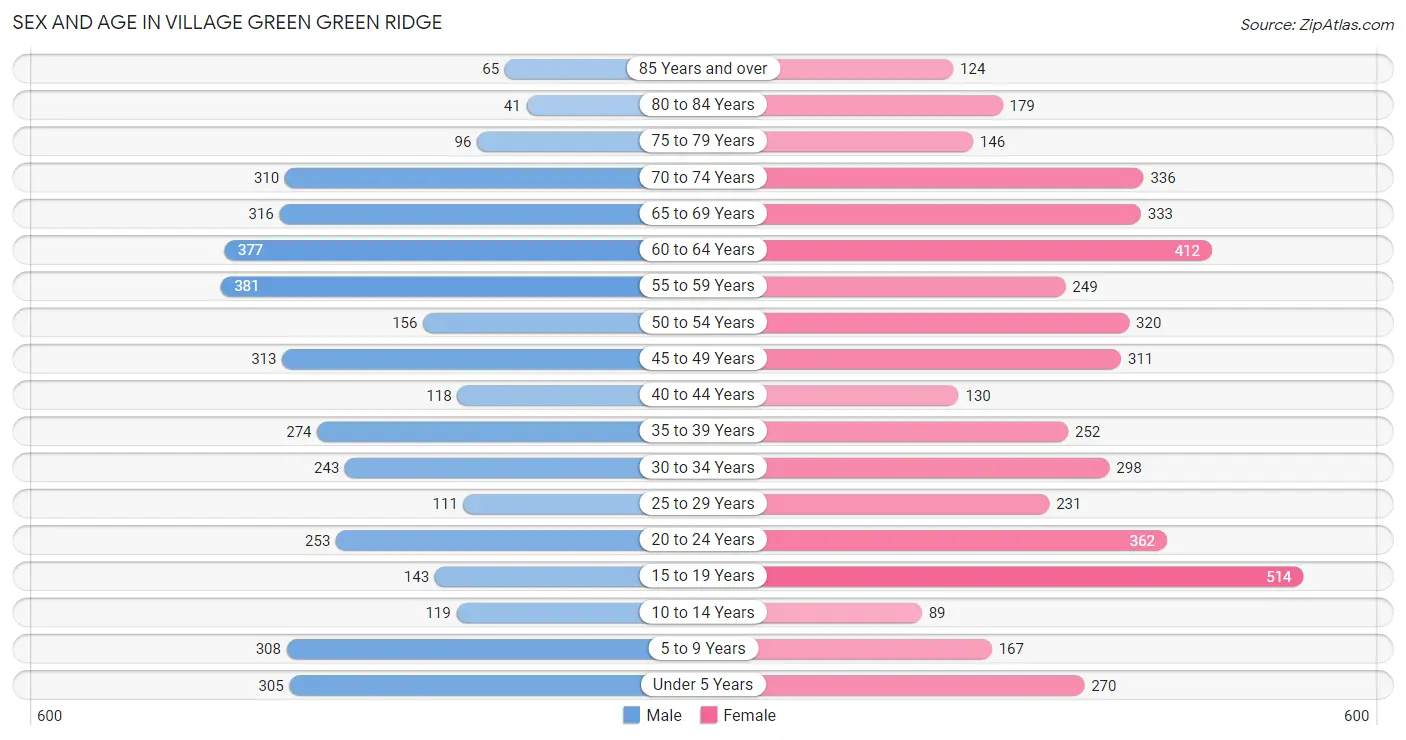
| Age Bracket | Male | Female |
| Under 5 Years | 305 (7.8%) | 270 (5.7%) |
| 5 to 9 Years | 308 (7.8%) | 167 (3.5%) |
| 10 to 14 Years | 119 (3.0%) | 89 (1.9%) |
| 15 to 19 Years | 143 (3.6%) | 514 (10.9%) |
| 20 to 24 Years | 253 (6.4%) | 362 (7.7%) |
| 25 to 29 Years | 111 (2.8%) | 231 (4.9%) |
| 30 to 34 Years | 243 (6.2%) | 298 (6.3%) |
| 35 to 39 Years | 274 (7.0%) | 252 (5.3%) |
| 40 to 44 Years | 118 (3.0%) | 130 (2.8%) |
| 45 to 49 Years | 313 (8.0%) | 311 (6.6%) |
| 50 to 54 Years | 156 (4.0%) | 320 (6.8%) |
| 55 to 59 Years | 381 (9.7%) | 249 (5.3%) |
| 60 to 64 Years | 377 (9.6%) | 412 (8.7%) |
| 65 to 69 Years | 316 (8.0%) | 333 (7.0%) |
| 70 to 74 Years | 310 (7.9%) | 336 (7.1%) |
| 75 to 79 Years | 96 (2.4%) | 146 (3.1%) |
| 80 to 84 Years | 41 (1.0%) | 179 (3.8%) |
| 85 Years and over | 65 (1.7%) | 124 (2.6%) |
| Total | 3,929 (100.0%) | 4,723 (100.0%) |
Families and Households in Village Green Green Ridge
Median Family Size in Village Green Green Ridge
The median family size in Village Green Green Ridge is 3.11 persons per family, with single male/father families (105 | 4.3%) accounting for the largest median family size of 3.17 persons per family. On the other hand, single female/mother families (401 | 16.5%) represent the smallest median family size with 2.95 persons per family.
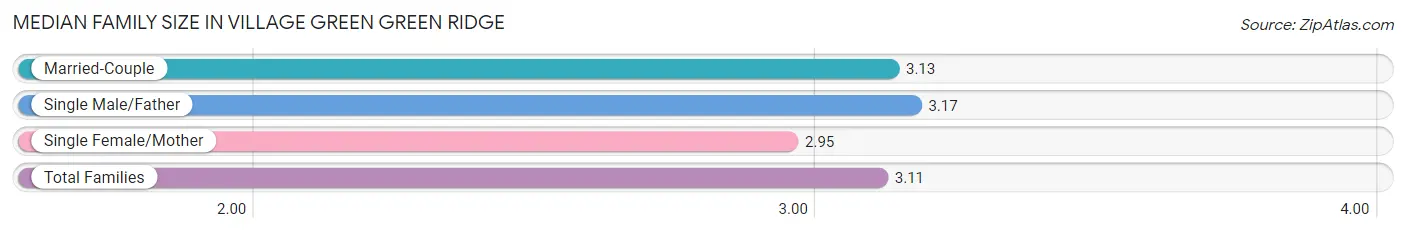
| Family Type | # Families | Family Size |
| Married-Couple | 1,922 (79.2%) | 3.13 |
| Single Male/Father | 105 (4.3%) | 3.17 |
| Single Female/Mother | 401 (16.5%) | 2.95 |
| Total Families | 2,428 (100.0%) | 3.11 |
Median Household Size in Village Green Green Ridge
The median household size in Village Green Green Ridge is 2.64 persons per household, with single male/father households (105 | 3.2%) accounting for the largest median household size of 3.84 persons per household. non-family households (831 | 25.5%) represent the smallest median household size with 1.09 persons per household.
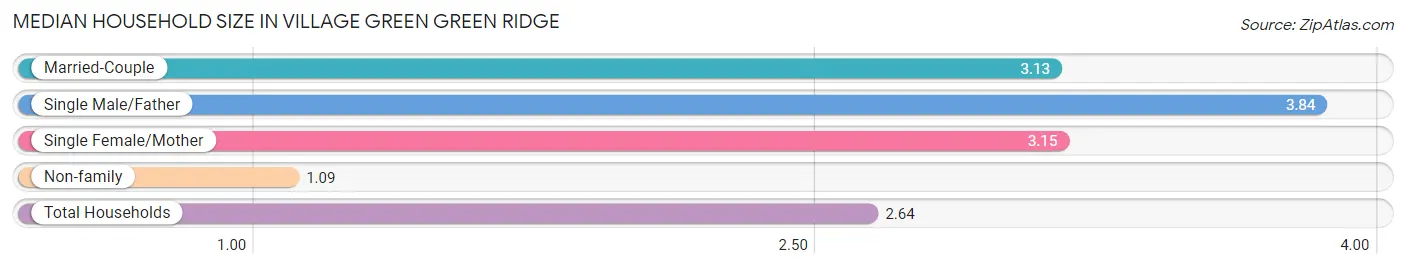
| Household Type | # Households | Household Size |
| Married-Couple | 1,922 (59.0%) | 3.13 |
| Single Male/Father | 105 (3.2%) | 3.84 |
| Single Female/Mother | 401 (12.3%) | 3.15 |
| Non-family | 831 (25.5%) | 1.09 |
| Total Households | 3,259 (100.0%) | 2.64 |
Household Size by Marriage Status in Village Green Green Ridge
Out of a total of 3,259 households in Village Green Green Ridge, 2,428 (74.5%) are family households, while 831 (25.5%) are nonfamily households. The most numerous type of family households are 2-person households, comprising 964, and the most common type of nonfamily households are 1-person households, comprising 759.
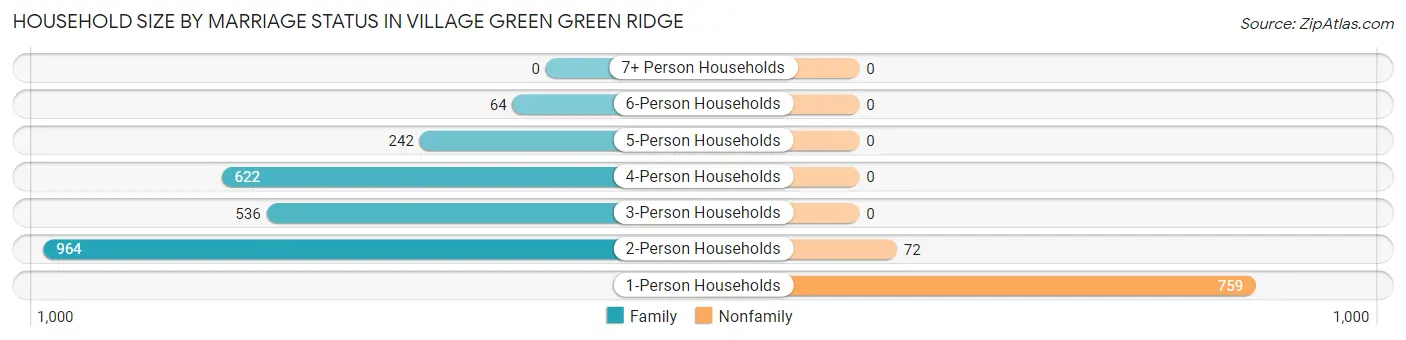
| Household Size | Family Households | Nonfamily Households |
| 1-Person Households | - | 759 (23.3%) |
| 2-Person Households | 964 (29.6%) | 72 (2.2%) |
| 3-Person Households | 536 (16.5%) | 0 (0.0%) |
| 4-Person Households | 622 (19.1%) | 0 (0.0%) |
| 5-Person Households | 242 (7.4%) | 0 (0.0%) |
| 6-Person Households | 64 (2.0%) | 0 (0.0%) |
| 7+ Person Households | 0 (0.0%) | 0 (0.0%) |
| Total | 2,428 (74.5%) | 831 (25.5%) |
Female Fertility in Village Green Green Ridge
Fertility by Age in Village Green Green Ridge
Average fertility rate in Village Green Green Ridge is 45.0 births per 1,000 women. Women in the age bracket of 20 to 34 years have the highest fertility rate with 89.0 births per 1,000 women. Women in the age bracket of 20 to 34 years acount for 82.3% of all women with births.
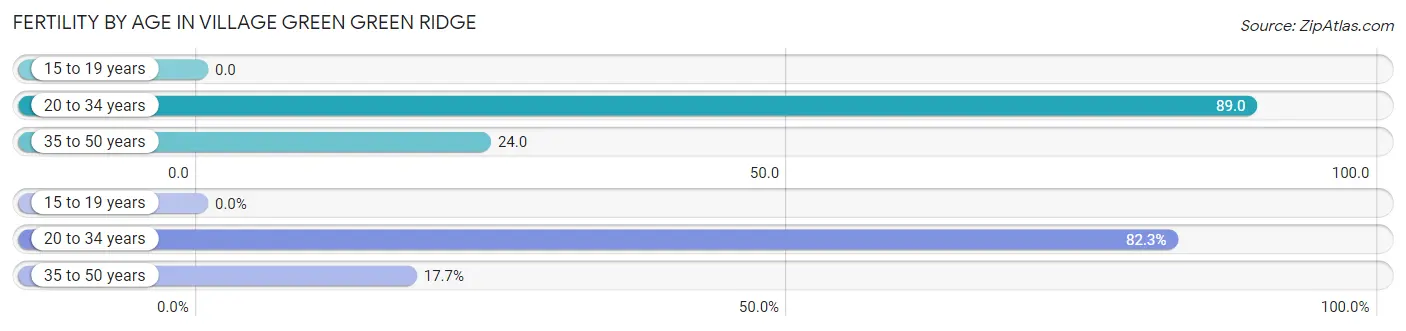
| Age Bracket | Women with Births | Births / 1,000 Women |
| 15 to 19 years | 0 (0.0%) | 0.0 |
| 20 to 34 years | 79 (82.3%) | 89.0 |
| 35 to 50 years | 17 (17.7%) | 24.0 |
| Total | 96 (100.0%) | 45.0 |
Fertility by Age by Marriage Status in Village Green Green Ridge
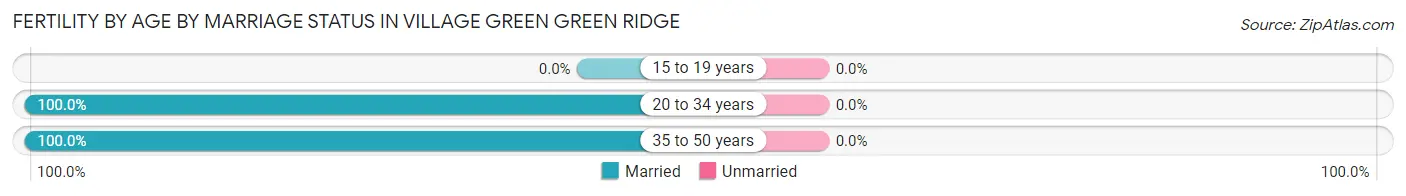
| Age Bracket | Married | Unmarried |
| 15 to 19 years | 0 (0.0%) | 0 (0.0%) |
| 20 to 34 years | 79 (100.0%) | 0 (0.0%) |
| 35 to 50 years | 17 (100.0%) | 0 (0.0%) |
| Total | 96 (100.0%) | 0 (0.0%) |
Fertility by Education in Village Green Green Ridge
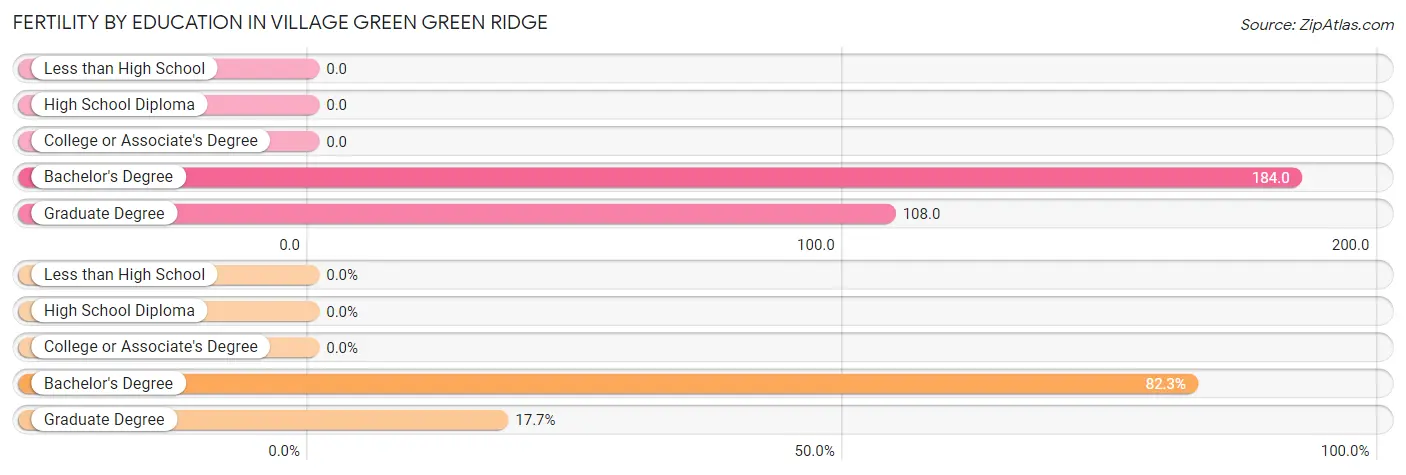
| Educational Attainment | Women with Births | Births / 1,000 Women |
| Less than High School | 0 (0.0%) | 0.0 |
| High School Diploma | 0 (0.0%) | 0.0 |
| College or Associate's Degree | 0 (0.0%) | 0.0 |
| Bachelor's Degree | 79 (82.3%) | 184.0 |
| Graduate Degree | 17 (17.7%) | 108.0 |
| Total | 96 (100.0%) | 45.0 |
Fertility by Education by Marriage Status in Village Green Green Ridge
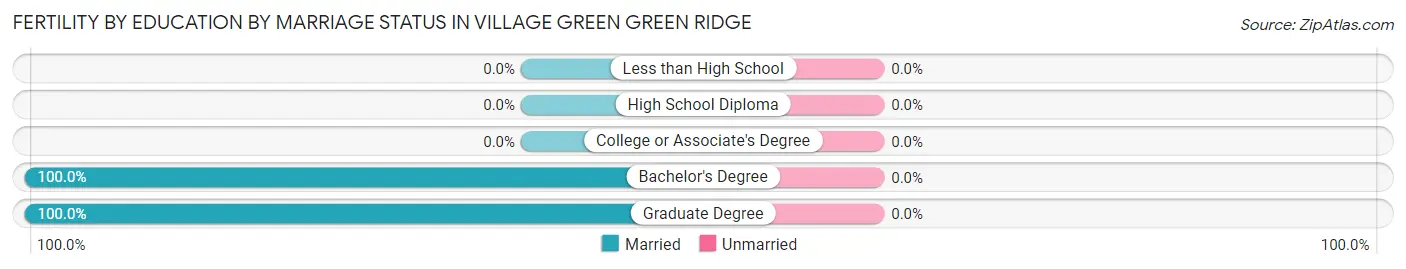
| Educational Attainment | Married | Unmarried |
| Less than High School | 0 (0.0%) | 0 (0.0%) |
| High School Diploma | 0 (0.0%) | 0 (0.0%) |
| College or Associate's Degree | 0 (0.0%) | 0 (0.0%) |
| Bachelor's Degree | 79 (100.0%) | 0 (0.0%) |
| Graduate Degree | 17 (100.0%) | 0 (0.0%) |
| Total | 96 (100.0%) | 0 (0.0%) |
Employment Characteristics in Village Green Green Ridge
Employment by Class of Employer in Village Green Green Ridge
Among the 4,197 employed individuals in Village Green Green Ridge, private company employees (2,943 | 70.1%), not-for-profit organizations (505 | 12.0%), and local government employees (284 | 6.8%) make up the most common classes of employment.
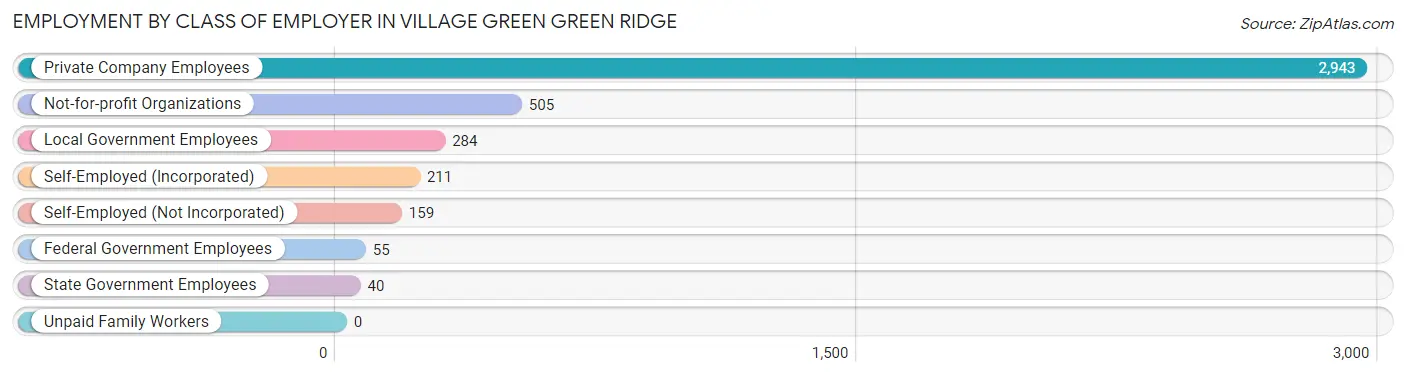
| Employer Class | # Employees | % Employees |
| Private Company Employees | 2,943 | 70.1% |
| Self-Employed (Incorporated) | 211 | 5.0% |
| Self-Employed (Not Incorporated) | 159 | 3.8% |
| Not-for-profit Organizations | 505 | 12.0% |
| Local Government Employees | 284 | 6.8% |
| State Government Employees | 40 | 0.9% |
| Federal Government Employees | 55 | 1.3% |
| Unpaid Family Workers | 0 | 0.0% |
| Total | 4,197 | 100.0% |
Employment Status by Age in Village Green Green Ridge
According to the labor force statistics for Village Green Green Ridge, out of the total population over 16 years of age (7,250), 64.5% or 4,676 individuals are in the labor force, with 6.8% or 318 of them unemployed. The age group with the highest labor force participation rate is 35 to 44 years, with 93.7% or 725 individuals in the labor force. Within the labor force, the 75 years and over age range has the highest percentage of unemployed individuals, with 32.4% or 24 of them being unemployed.
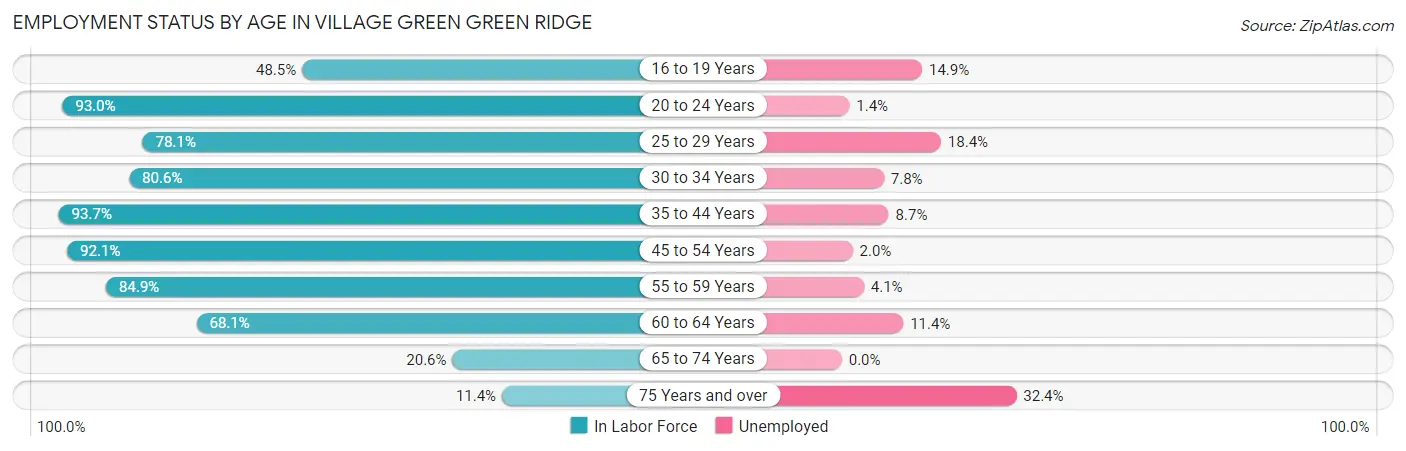
| Age Bracket | In Labor Force | Unemployed |
| 16 to 19 Years | 249 (48.5%) | 37 (14.9%) |
| 20 to 24 Years | 572 (93.0%) | 8 (1.4%) |
| 25 to 29 Years | 267 (78.1%) | 49 (18.4%) |
| 30 to 34 Years | 436 (80.6%) | 34 (7.8%) |
| 35 to 44 Years | 725 (93.7%) | 63 (8.7%) |
| 45 to 54 Years | 1,013 (92.1%) | 20 (2.0%) |
| 55 to 59 Years | 535 (84.9%) | 22 (4.1%) |
| 60 to 64 Years | 537 (68.1%) | 61 (11.4%) |
| 65 to 74 Years | 267 (20.6%) | 0 (0.0%) |
| 75 Years and over | 74 (11.4%) | 24 (32.4%) |
| Total | 4,676 (64.5%) | 318 (6.8%) |
Employment Status by Educational Attainment in Village Green Green Ridge
According to labor force statistics for Village Green Green Ridge, 84.1% of individuals (3,512) out of the total population between 25 and 64 years of age (4,176) are in the labor force, with 7.1% or 249 of them being unemployed. The group with the highest labor force participation rate are those with the educational attainment of college / associate degree, with 90.8% or 1,279 individuals in the labor force. Within the labor force, individuals with bachelor's degree or higher education have the highest percentage of unemployment, with 10.5% or 141 of them being unemployed.
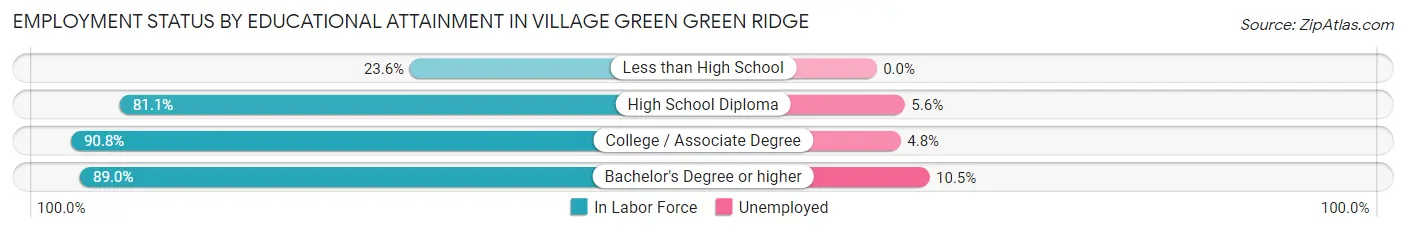
| Educational Attainment | In Labor Force | Unemployed |
| Less than High School | 53 (23.6%) | 0 (0.0%) |
| High School Diploma | 835 (81.1%) | 58 (5.6%) |
| College / Associate Degree | 1,279 (90.8%) | 68 (4.8%) |
| Bachelor's Degree or higher | 1,346 (89.0%) | 159 (10.5%) |
| Total | 3,512 (84.1%) | 296 (7.1%) |
Employment Occupations by Sex in Village Green Green Ridge
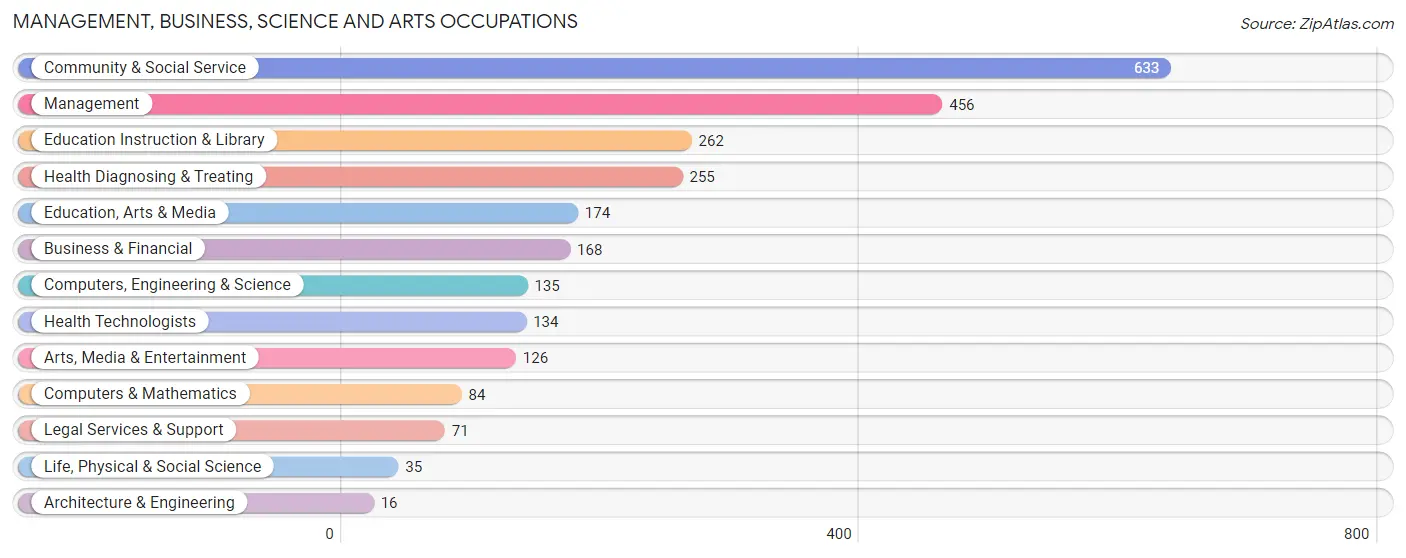
Management, Business, Science and Arts Occupations
The most common Management, Business, Science and Arts occupations in Village Green Green Ridge are Community & Social Service (633 | 14.5%), Management (456 | 10.5%), Education Instruction & Library (262 | 6.0%), Health Diagnosing & Treating (255 | 5.9%), and Education, Arts & Media (174 | 4.0%).
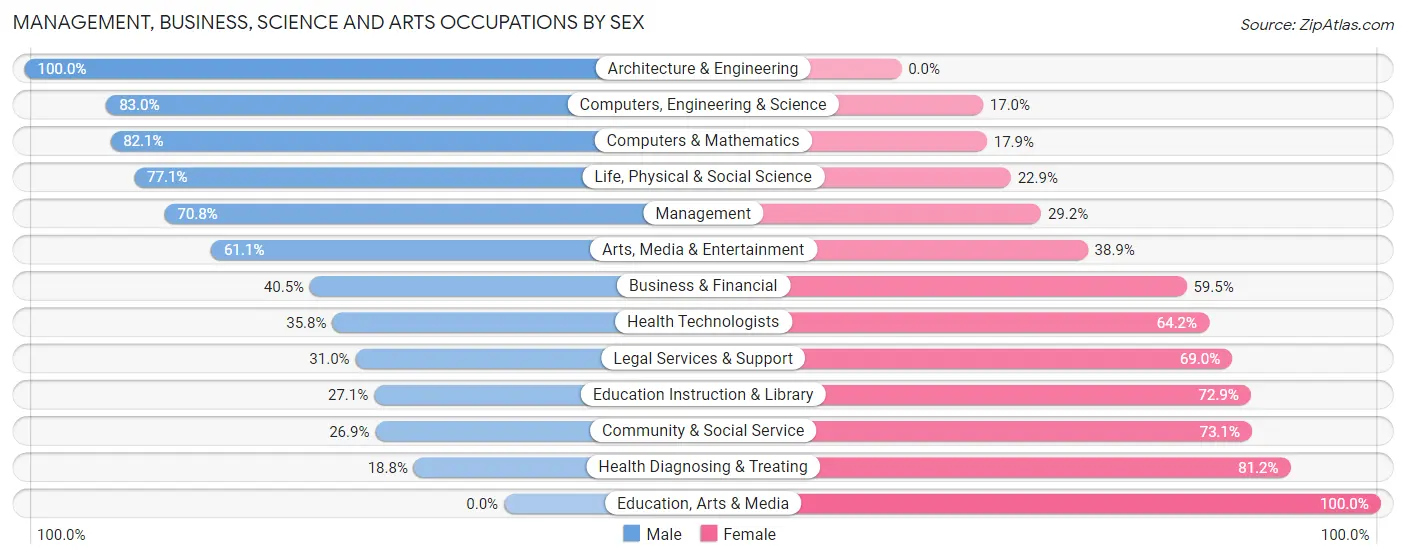
Management, Business, Science and Arts Occupations by Sex
Within the Management, Business, Science and Arts occupations in Village Green Green Ridge, the most male-oriented occupations are Architecture & Engineering (100.0%), Computers, Engineering & Science (83.0%), and Computers & Mathematics (82.1%), while the most female-oriented occupations are Education, Arts & Media (100.0%), Health Diagnosing & Treating (81.2%), and Community & Social Service (73.1%).
| Occupation | Male | Female |
| Management | 323 (70.8%) | 133 (29.2%) |
| Business & Financial | 68 (40.5%) | 100 (59.5%) |
| Computers, Engineering & Science | 112 (83.0%) | 23 (17.0%) |
| Computers & Mathematics | 69 (82.1%) | 15 (17.9%) |
| Architecture & Engineering | 16 (100.0%) | 0 (0.0%) |
| Life, Physical & Social Science | 27 (77.1%) | 8 (22.9%) |
| Community & Social Service | 170 (26.9%) | 463 (73.1%) |
| Education, Arts & Media | 0 (0.0%) | 174 (100.0%) |
| Legal Services & Support | 22 (31.0%) | 49 (69.0%) |
| Education Instruction & Library | 71 (27.1%) | 191 (72.9%) |
| Arts, Media & Entertainment | 77 (61.1%) | 49 (38.9%) |
| Health Diagnosing & Treating | 48 (18.8%) | 207 (81.2%) |
| Health Technologists | 48 (35.8%) | 86 (64.2%) |
| Total (Category) | 721 (43.8%) | 926 (56.2%) |
| Total (Overall) | 2,054 (47.1%) | 2,303 (52.9%) |
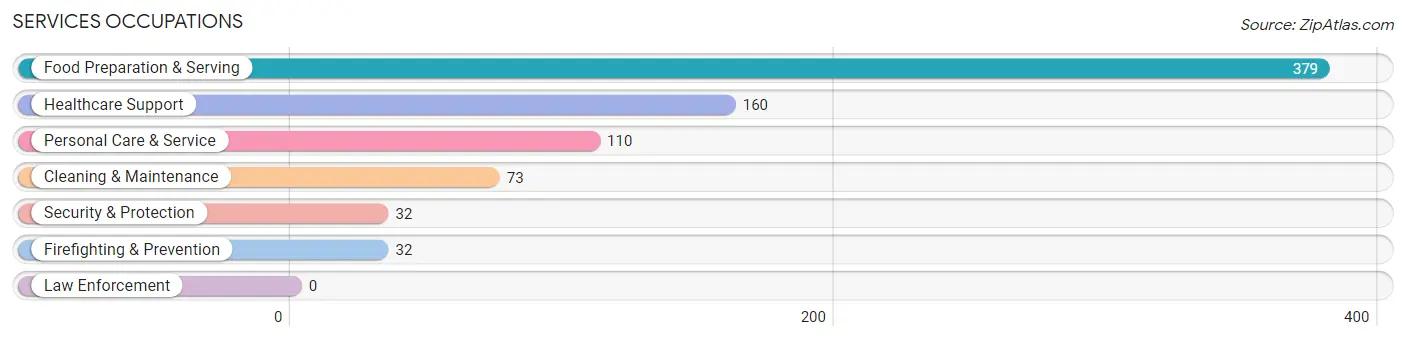
Services Occupations
The most common Services occupations in Village Green Green Ridge are Food Preparation & Serving (379 | 8.7%), Healthcare Support (160 | 3.7%), Personal Care & Service (110 | 2.5%), Cleaning & Maintenance (73 | 1.7%), and Security & Protection (32 | 0.7%).
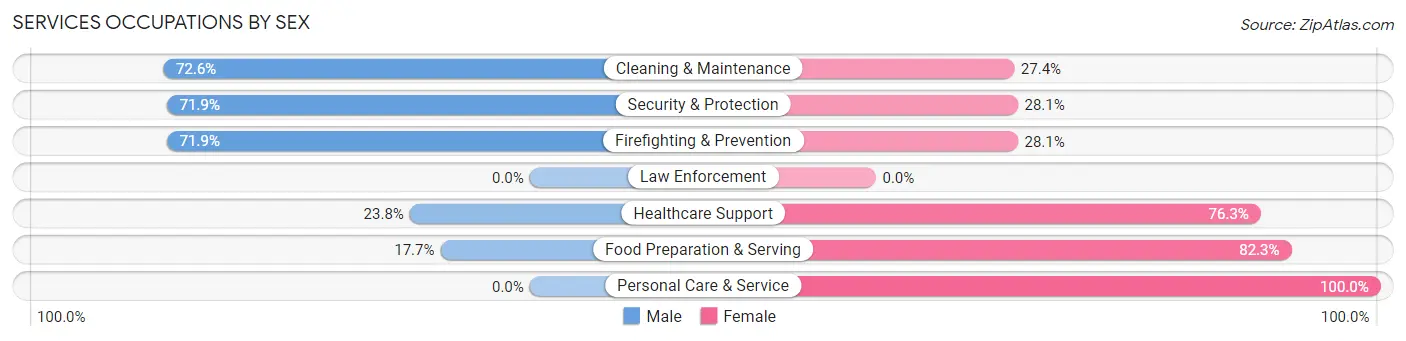
Services Occupations by Sex
Within the Services occupations in Village Green Green Ridge, the most male-oriented occupations are Cleaning & Maintenance (72.6%), Security & Protection (71.9%), and Firefighting & Prevention (71.9%), while the most female-oriented occupations are Personal Care & Service (100.0%), Food Preparation & Serving (82.3%), and Healthcare Support (76.2%).
| Occupation | Male | Female |
| Healthcare Support | 38 (23.7%) | 122 (76.2%) |
| Security & Protection | 23 (71.9%) | 9 (28.1%) |
| Firefighting & Prevention | 23 (71.9%) | 9 (28.1%) |
| Law Enforcement | 0 (0.0%) | 0 (0.0%) |
| Food Preparation & Serving | 67 (17.7%) | 312 (82.3%) |
| Cleaning & Maintenance | 53 (72.6%) | 20 (27.4%) |
| Personal Care & Service | 0 (0.0%) | 110 (100.0%) |
| Total (Category) | 181 (24.0%) | 573 (76.0%) |
| Total (Overall) | 2,054 (47.1%) | 2,303 (52.9%) |
Sales and Office Occupations
The most common Sales and Office occupations in Village Green Green Ridge are Office & Administration (635 | 14.6%), and Sales & Related (479 | 11.0%).

Sales and Office Occupations by Sex

| Occupation | Male | Female |
| Sales & Related | 278 (58.0%) | 201 (42.0%) |
| Office & Administration | 85 (13.4%) | 550 (86.6%) |
| Total (Category) | 363 (32.6%) | 751 (67.4%) |
| Total (Overall) | 2,054 (47.1%) | 2,303 (52.9%) |
Natural Resources, Construction and Maintenance Occupations
The most common Natural Resources, Construction and Maintenance occupations in Village Green Green Ridge are Construction & Extraction (347 | 8.0%), and Installation, Maintenance & Repair (170 | 3.9%).
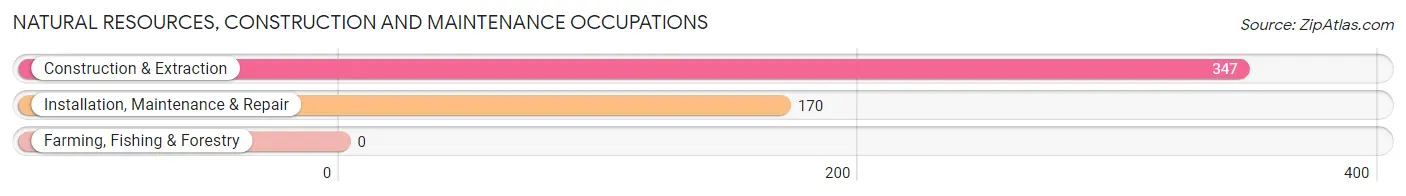
Natural Resources, Construction and Maintenance Occupations by Sex

| Occupation | Male | Female |
| Farming, Fishing & Forestry | 0 (0.0%) | 0 (0.0%) |
| Construction & Extraction | 347 (100.0%) | 0 (0.0%) |
| Installation, Maintenance & Repair | 170 (100.0%) | 0 (0.0%) |
| Total (Category) | 517 (100.0%) | 0 (0.0%) |
| Total (Overall) | 2,054 (47.1%) | 2,303 (52.9%) |
Production, Transportation and Moving Occupations
The most common Production, Transportation and Moving occupations in Village Green Green Ridge are Production (180 | 4.1%), Transportation (126 | 2.9%), and Material Moving (19 | 0.4%).
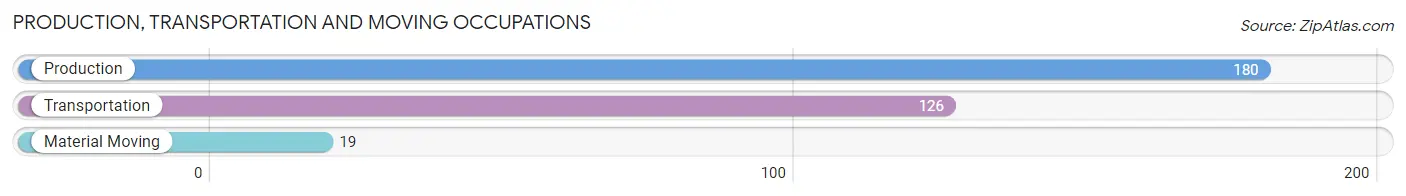
Production, Transportation and Moving Occupations by Sex
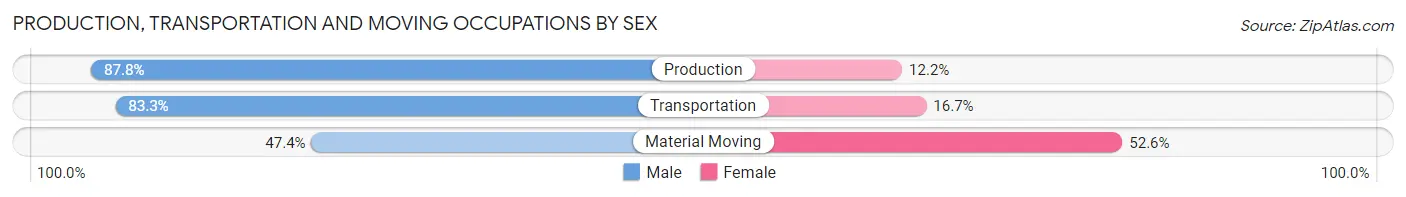
| Occupation | Male | Female |
| Production | 158 (87.8%) | 22 (12.2%) |
| Transportation | 105 (83.3%) | 21 (16.7%) |
| Material Moving | 9 (47.4%) | 10 (52.6%) |
| Total (Category) | 272 (83.7%) | 53 (16.3%) |
| Total (Overall) | 2,054 (47.1%) | 2,303 (52.9%) |
Employment Industries by Sex in Village Green Green Ridge
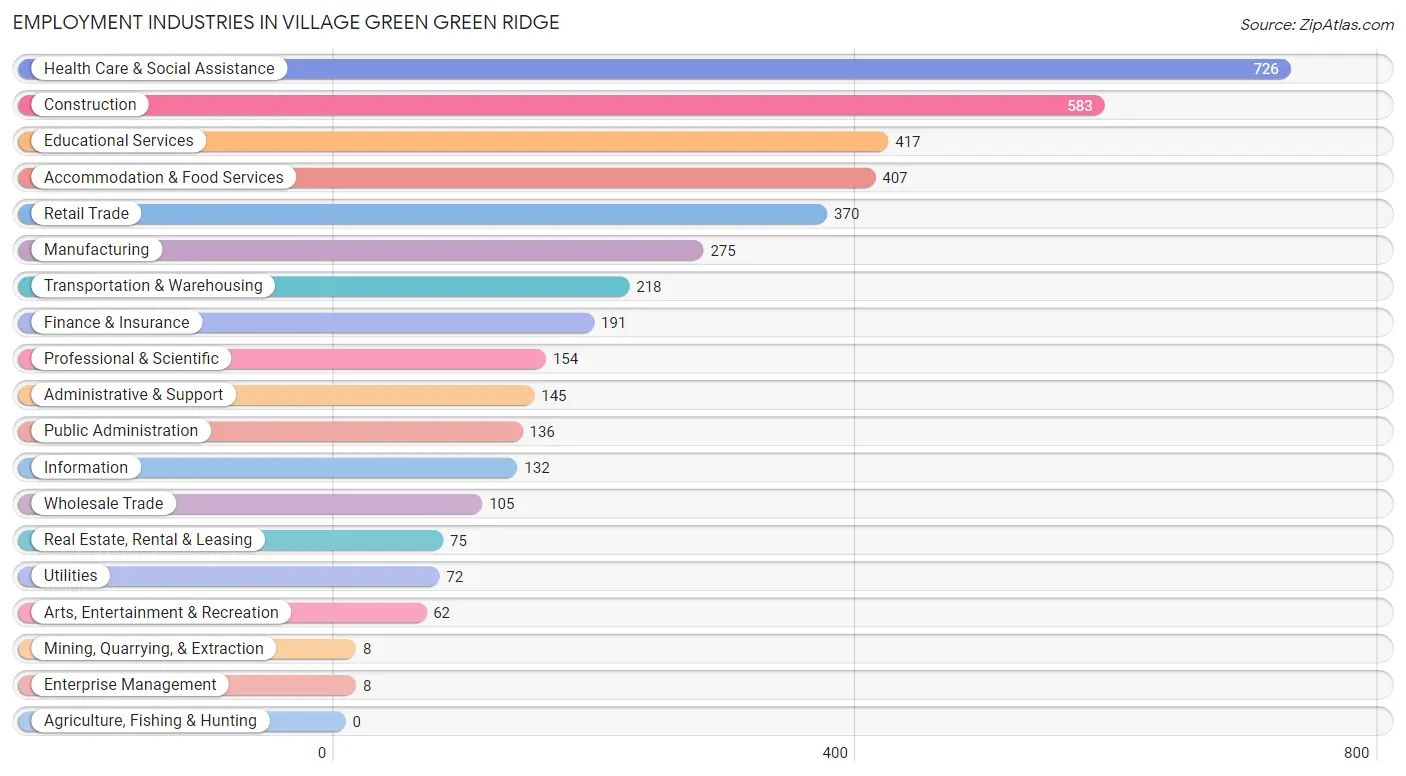
Employment Industries in Village Green Green Ridge
The major employment industries in Village Green Green Ridge include Health Care & Social Assistance (726 | 16.7%), Construction (583 | 13.4%), Educational Services (417 | 9.6%), Accommodation & Food Services (407 | 9.3%), and Retail Trade (370 | 8.5%).
Employment Industries by Sex in Village Green Green Ridge
The Village Green Green Ridge industries that see more men than women are Mining, Quarrying, & Extraction (100.0%), Wholesale Trade (100.0%), and Utilities (100.0%), whereas the industries that tend to have a higher number of women are Enterprise Management (100.0%), Health Care & Social Assistance (88.8%), and Finance & Insurance (84.8%).
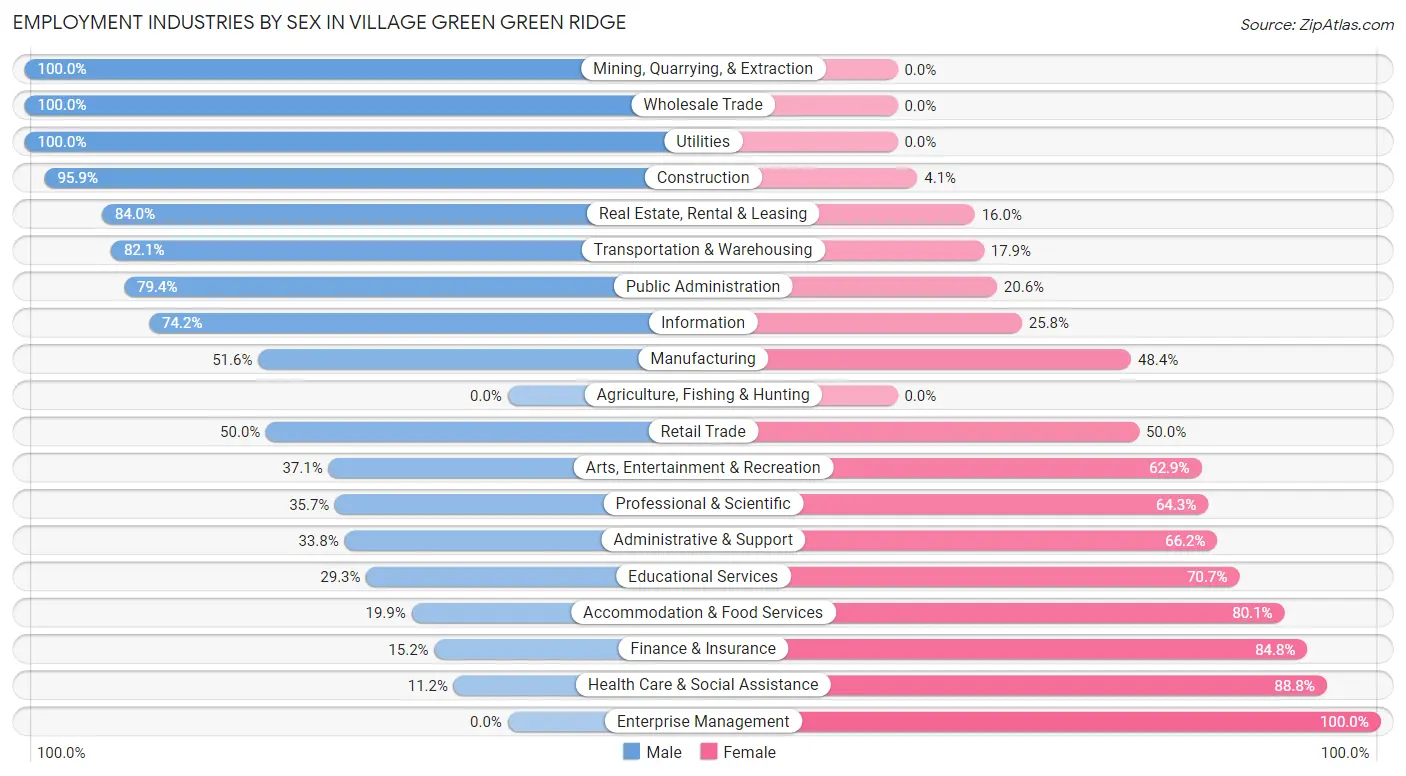
| Industry | Male | Female |
| Agriculture, Fishing & Hunting | 0 (0.0%) | 0 (0.0%) |
| Mining, Quarrying, & Extraction | 8 (100.0%) | 0 (0.0%) |
| Construction | 559 (95.9%) | 24 (4.1%) |
| Manufacturing | 142 (51.6%) | 133 (48.4%) |
| Wholesale Trade | 105 (100.0%) | 0 (0.0%) |
| Retail Trade | 185 (50.0%) | 185 (50.0%) |
| Transportation & Warehousing | 179 (82.1%) | 39 (17.9%) |
| Utilities | 72 (100.0%) | 0 (0.0%) |
| Information | 98 (74.2%) | 34 (25.8%) |
| Finance & Insurance | 29 (15.2%) | 162 (84.8%) |
| Real Estate, Rental & Leasing | 63 (84.0%) | 12 (16.0%) |
| Professional & Scientific | 55 (35.7%) | 99 (64.3%) |
| Enterprise Management | 0 (0.0%) | 8 (100.0%) |
| Administrative & Support | 49 (33.8%) | 96 (66.2%) |
| Educational Services | 122 (29.3%) | 295 (70.7%) |
| Health Care & Social Assistance | 81 (11.2%) | 645 (88.8%) |
| Arts, Entertainment & Recreation | 23 (37.1%) | 39 (62.9%) |
| Accommodation & Food Services | 81 (19.9%) | 326 (80.1%) |
| Public Administration | 108 (79.4%) | 28 (20.6%) |
| Total | 2,054 (47.1%) | 2,303 (52.9%) |
Education in Village Green Green Ridge
School Enrollment in Village Green Green Ridge
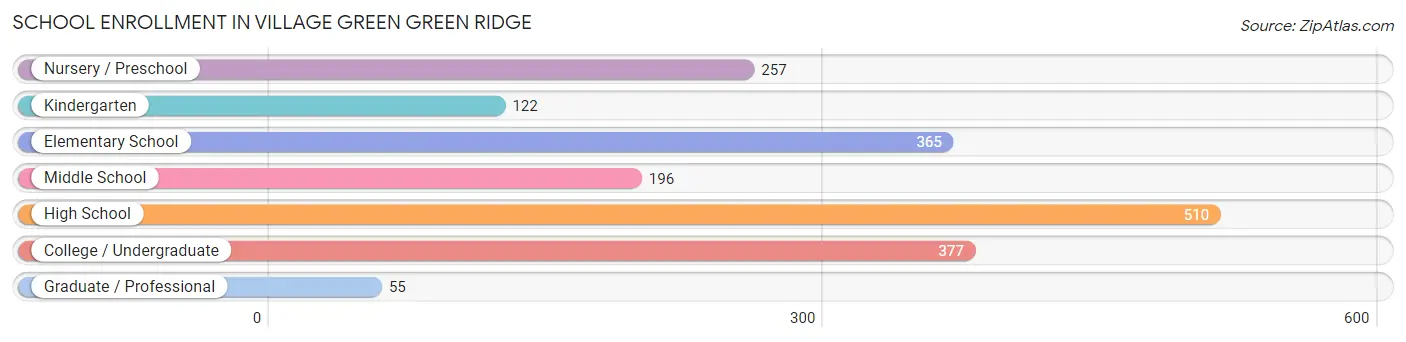
The most common levels of schooling among the 1,882 students in Village Green Green Ridge are high school (510 | 27.1%), college / undergraduate (377 | 20.0%), and elementary school (365 | 19.4%).
| School Level | # Students | % Students |
| Nursery / Preschool | 257 | 13.7% |
| Kindergarten | 122 | 6.5% |
| Elementary School | 365 | 19.4% |
| Middle School | 196 | 10.4% |
| High School | 510 | 27.1% |
| College / Undergraduate | 377 | 20.0% |
| Graduate / Professional | 55 | 2.9% |
| Total | 1,882 | 100.0% |
School Enrollment by Age by Funding Source in Village Green Green Ridge
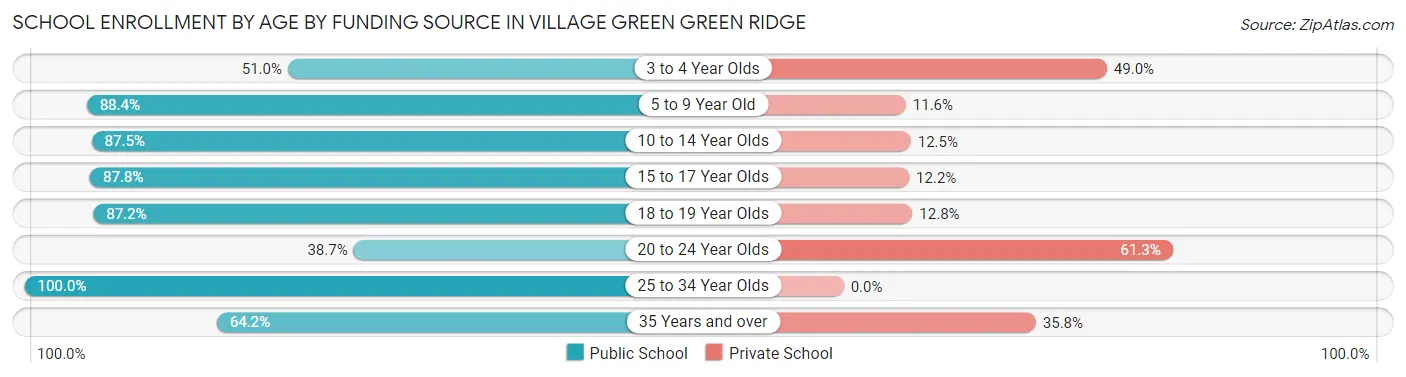
Out of a total of 1,882 students who are enrolled in schools in Village Green Green Ridge, 431 (22.9%) attend a private institution, while the remaining 1,451 (77.1%) are enrolled in public schools. The age group of 20 to 24 year olds has the highest likelihood of being enrolled in private schools, with 117 (61.3% in the age bracket) enrolled. Conversely, the age group of 25 to 34 year olds has the lowest likelihood of being enrolled in a private school, with 43 (100.0% in the age bracket) attending a public institution.
| Age Bracket | Public School | Private School |
| 3 to 4 Year Olds | 131 (51.0%) | 126 (49.0%) |
| 5 to 9 Year Old | 420 (88.4%) | 55 (11.6%) |
| 10 to 14 Year Olds | 182 (87.5%) | 26 (12.5%) |
| 15 to 17 Year Olds | 331 (87.8%) | 46 (12.2%) |
| 18 to 19 Year Olds | 218 (87.2%) | 32 (12.8%) |
| 20 to 24 Year Olds | 74 (38.7%) | 117 (61.3%) |
| 25 to 34 Year Olds | 43 (100.0%) | 0 (0.0%) |
| 35 Years and over | 52 (64.2%) | 29 (35.8%) |
| Total | 1,451 (77.1%) | 431 (22.9%) |
Educational Attainment by Field of Study in Village Green Green Ridge
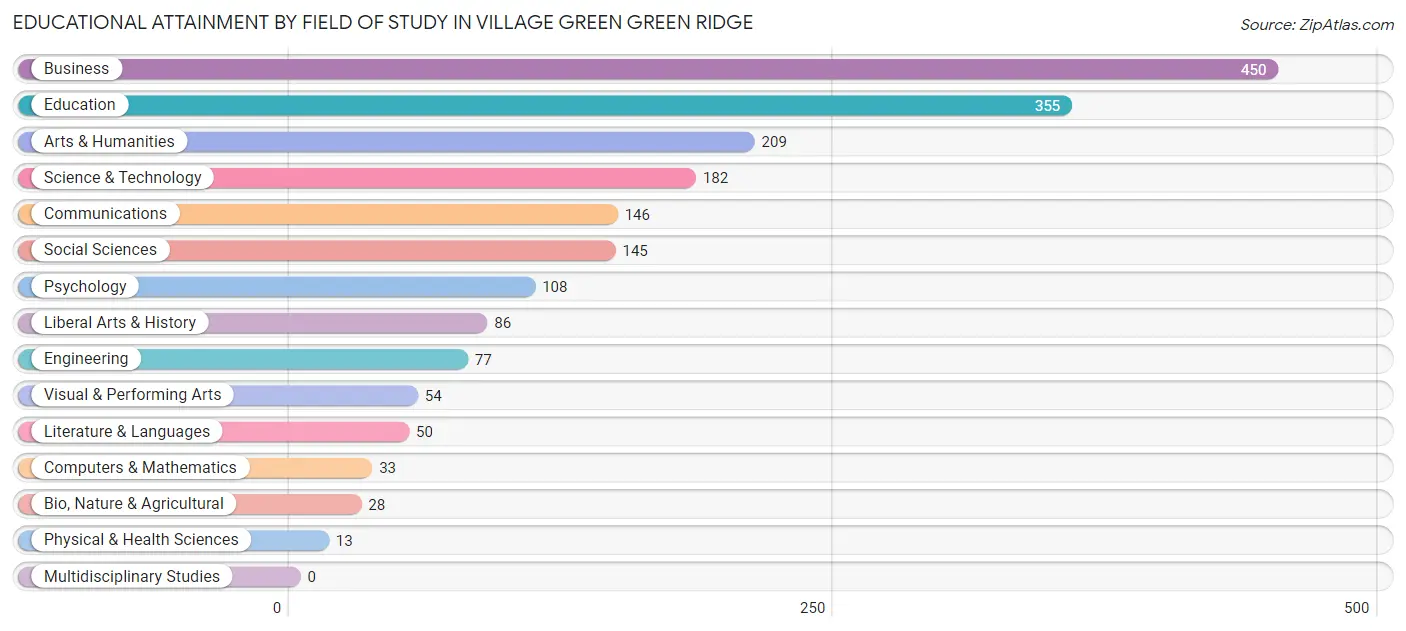
Business (450 | 23.2%), education (355 | 18.3%), arts & humanities (209 | 10.8%), science & technology (182 | 9.4%), and communications (146 | 7.5%) are the most common fields of study among 1,936 individuals in Village Green Green Ridge who have obtained a bachelor's degree or higher.
| Field of Study | # Graduates | % Graduates |
| Computers & Mathematics | 33 | 1.7% |
| Bio, Nature & Agricultural | 28 | 1.5% |
| Physical & Health Sciences | 13 | 0.7% |
| Psychology | 108 | 5.6% |
| Social Sciences | 145 | 7.5% |
| Engineering | 77 | 4.0% |
| Multidisciplinary Studies | 0 | 0.0% |
| Science & Technology | 182 | 9.4% |
| Business | 450 | 23.2% |
| Education | 355 | 18.3% |
| Literature & Languages | 50 | 2.6% |
| Liberal Arts & History | 86 | 4.4% |
| Visual & Performing Arts | 54 | 2.8% |
| Communications | 146 | 7.5% |
| Arts & Humanities | 209 | 10.8% |
| Total | 1,936 | 100.0% |
Transportation & Commute in Village Green Green Ridge
Vehicle Availability by Sex in Village Green Green Ridge
The most prevalent vehicle ownership categories in Village Green Green Ridge are males with 2 vehicles (798, accounting for 39.7%) and females with 2 vehicles (755, making up 36.7%).
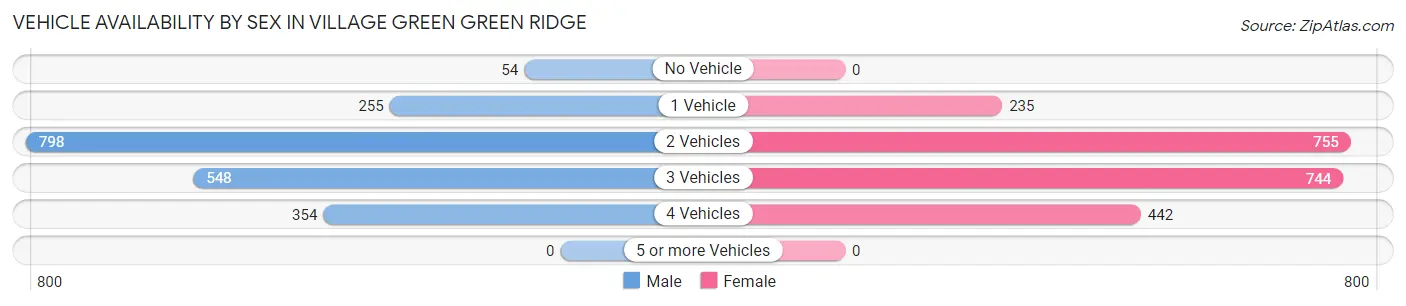
| Vehicles Available | Male | Female |
| No Vehicle | 54 (2.7%) | 0 (0.0%) |
| 1 Vehicle | 255 (12.7%) | 235 (10.8%) |
| 2 Vehicles | 798 (39.7%) | 755 (34.7%) |
| 3 Vehicles | 548 (27.3%) | 744 (34.2%) |
| 4 Vehicles | 354 (17.6%) | 442 (20.3%) |
| 5 or more Vehicles | 0 (0.0%) | 0 (0.0%) |
| Total | 2,009 (100.0%) | 2,176 (100.0%) |
Commute Time in Village Green Green Ridge
The most frequently occuring commute durations in Village Green Green Ridge are 15 to 19 minutes (581 commuters, 15.5%), 5 to 9 minutes (540 commuters, 14.4%), and 20 to 24 minutes (524 commuters, 14.0%).
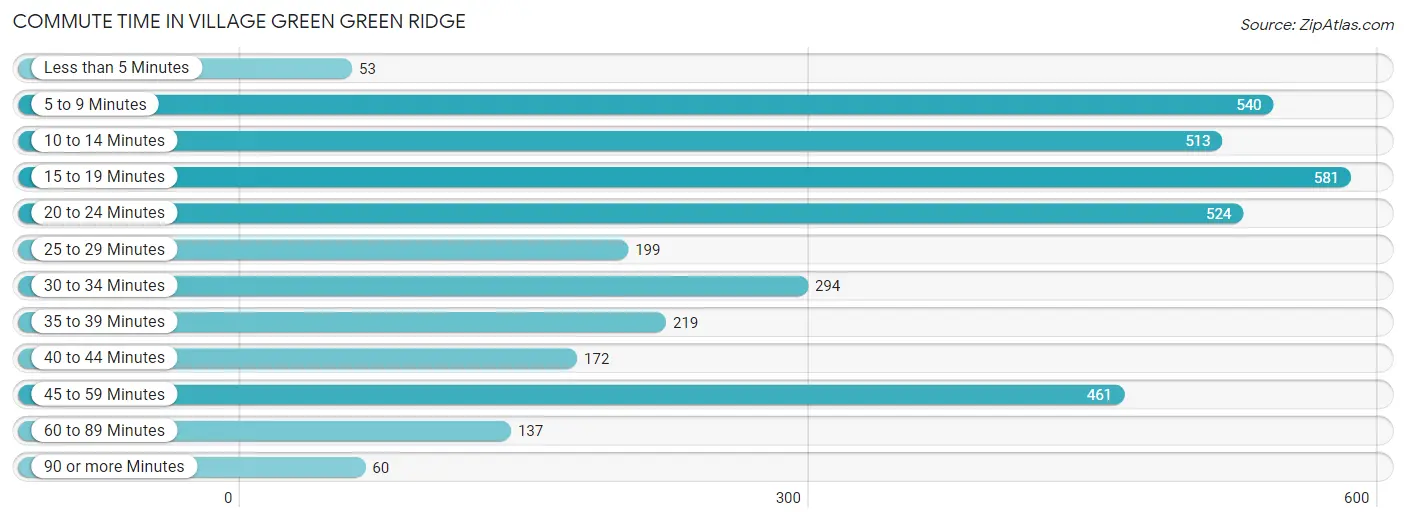
| Commute Time | # Commuters | % Commuters |
| Less than 5 Minutes | 53 | 1.4% |
| 5 to 9 Minutes | 540 | 14.4% |
| 10 to 14 Minutes | 513 | 13.7% |
| 15 to 19 Minutes | 581 | 15.5% |
| 20 to 24 Minutes | 524 | 14.0% |
| 25 to 29 Minutes | 199 | 5.3% |
| 30 to 34 Minutes | 294 | 7.8% |
| 35 to 39 Minutes | 219 | 5.8% |
| 40 to 44 Minutes | 172 | 4.6% |
| 45 to 59 Minutes | 461 | 12.3% |
| 60 to 89 Minutes | 137 | 3.6% |
| 90 or more Minutes | 60 | 1.6% |
Commute Time by Sex in Village Green Green Ridge
The most common commute times in Village Green Green Ridge are 15 to 19 minutes (306 commuters, 17.5%) for males and 10 to 14 minutes (360 commuters, 17.9%) for females.
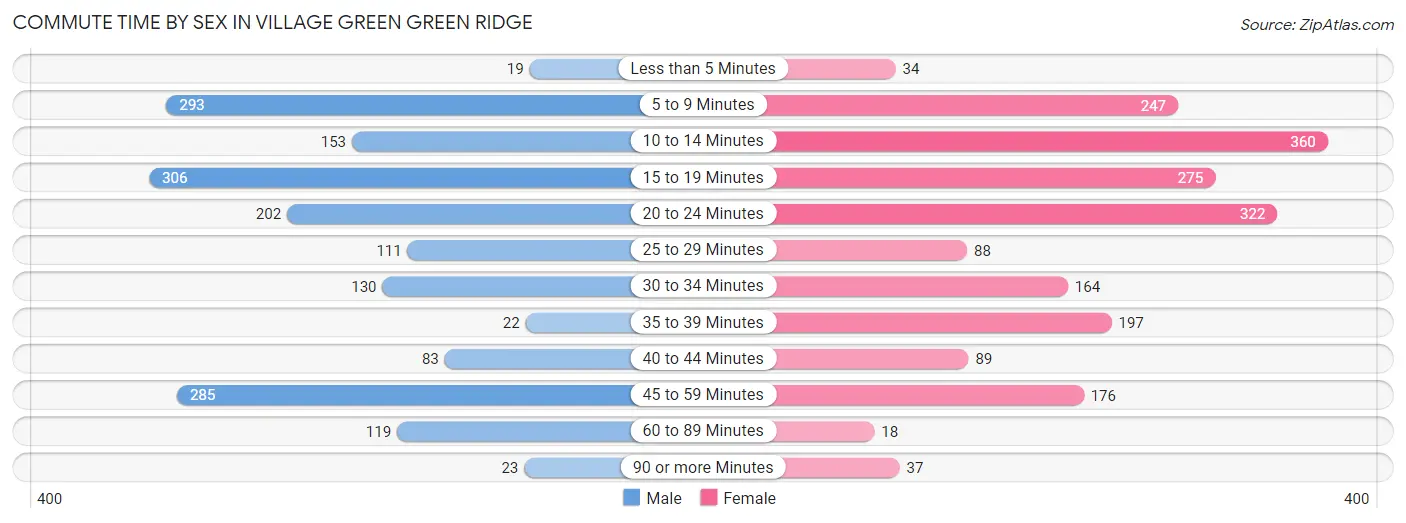
| Commute Time | Male | Female |
| Less than 5 Minutes | 19 (1.1%) | 34 (1.7%) |
| 5 to 9 Minutes | 293 (16.8%) | 247 (12.3%) |
| 10 to 14 Minutes | 153 (8.8%) | 360 (17.9%) |
| 15 to 19 Minutes | 306 (17.5%) | 275 (13.7%) |
| 20 to 24 Minutes | 202 (11.6%) | 322 (16.0%) |
| 25 to 29 Minutes | 111 (6.4%) | 88 (4.4%) |
| 30 to 34 Minutes | 130 (7.4%) | 164 (8.2%) |
| 35 to 39 Minutes | 22 (1.3%) | 197 (9.8%) |
| 40 to 44 Minutes | 83 (4.8%) | 89 (4.4%) |
| 45 to 59 Minutes | 285 (16.3%) | 176 (8.8%) |
| 60 to 89 Minutes | 119 (6.8%) | 18 (0.9%) |
| 90 or more Minutes | 23 (1.3%) | 37 (1.8%) |
Time of Departure to Work by Sex in Village Green Green Ridge
The most frequent times of departure to work in Village Green Green Ridge are 6:30 AM to 6:59 AM (330, 18.9%) for males and 7:30 AM to 7:59 AM (554, 27.6%) for females.
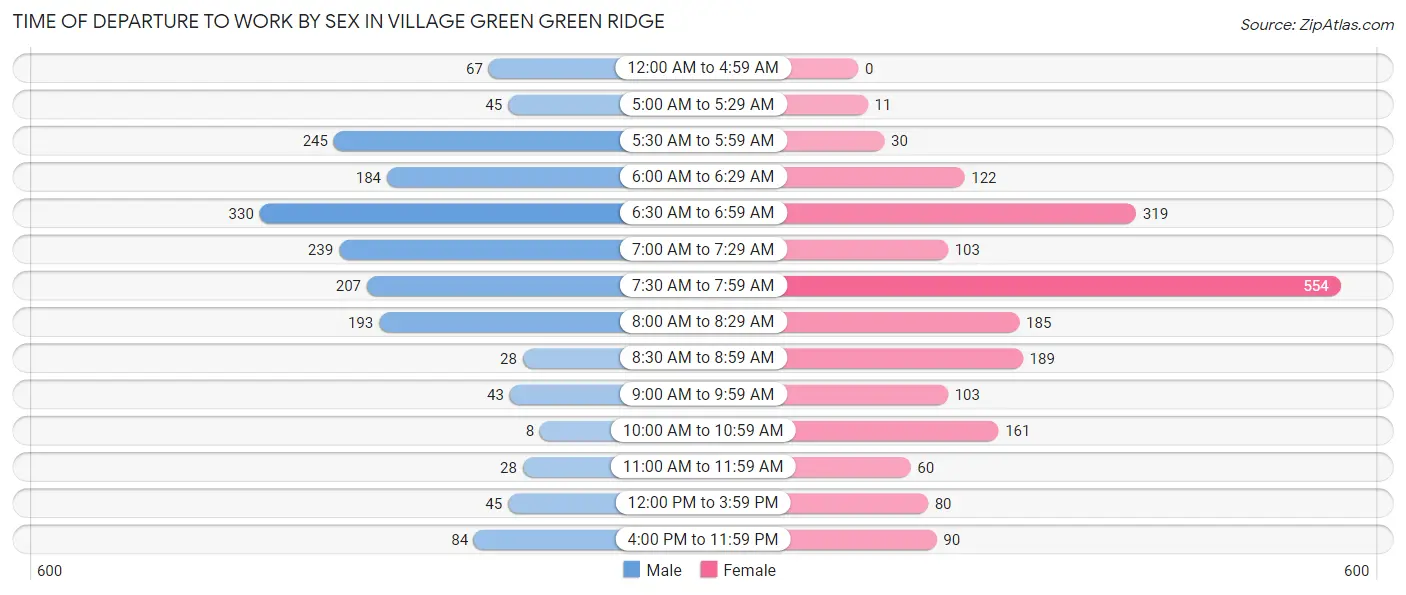
| Time of Departure | Male | Female |
| 12:00 AM to 4:59 AM | 67 (3.8%) | 0 (0.0%) |
| 5:00 AM to 5:29 AM | 45 (2.6%) | 11 (0.5%) |
| 5:30 AM to 5:59 AM | 245 (14.0%) | 30 (1.5%) |
| 6:00 AM to 6:29 AM | 184 (10.5%) | 122 (6.1%) |
| 6:30 AM to 6:59 AM | 330 (18.9%) | 319 (15.9%) |
| 7:00 AM to 7:29 AM | 239 (13.7%) | 103 (5.1%) |
| 7:30 AM to 7:59 AM | 207 (11.9%) | 554 (27.6%) |
| 8:00 AM to 8:29 AM | 193 (11.1%) | 185 (9.2%) |
| 8:30 AM to 8:59 AM | 28 (1.6%) | 189 (9.4%) |
| 9:00 AM to 9:59 AM | 43 (2.5%) | 103 (5.1%) |
| 10:00 AM to 10:59 AM | 8 (0.5%) | 161 (8.0%) |
| 11:00 AM to 11:59 AM | 28 (1.6%) | 60 (3.0%) |
| 12:00 PM to 3:59 PM | 45 (2.6%) | 80 (4.0%) |
| 4:00 PM to 11:59 PM | 84 (4.8%) | 90 (4.5%) |
| Total | 1,746 (100.0%) | 2,007 (100.0%) |
Housing Occupancy in Village Green Green Ridge
Occupancy by Ownership in Village Green Green Ridge
Of the total 3,259 dwellings in Village Green Green Ridge, owner-occupied units account for 2,868 (88.0%), while renter-occupied units make up 391 (12.0%).
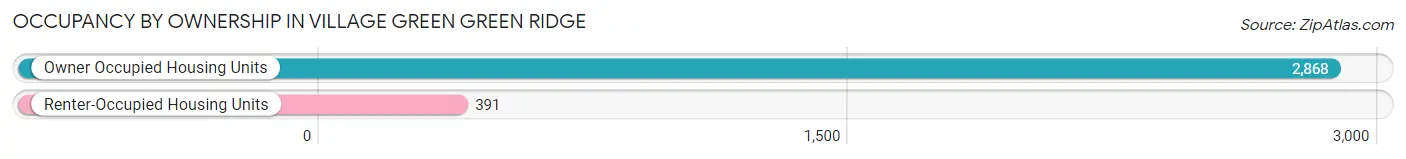
| Occupancy | # Housing Units | % Housing Units |
| Owner Occupied Housing Units | 2,868 | 88.0% |
| Renter-Occupied Housing Units | 391 | 12.0% |
| Total Occupied Housing Units | 3,259 | 100.0% |
Occupancy by Household Size in Village Green Green Ridge
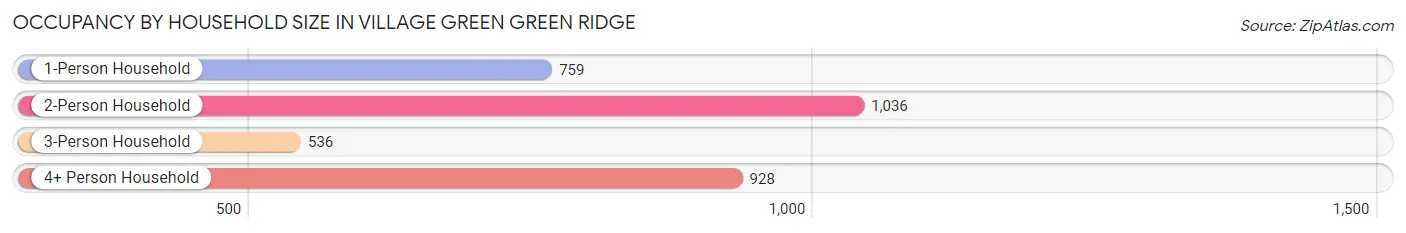
| Household Size | # Housing Units | % Housing Units |
| 1-Person Household | 759 | 23.3% |
| 2-Person Household | 1,036 | 31.8% |
| 3-Person Household | 536 | 16.5% |
| 4+ Person Household | 928 | 28.5% |
| Total Housing Units | 3,259 | 100.0% |
Occupancy by Ownership by Household Size in Village Green Green Ridge
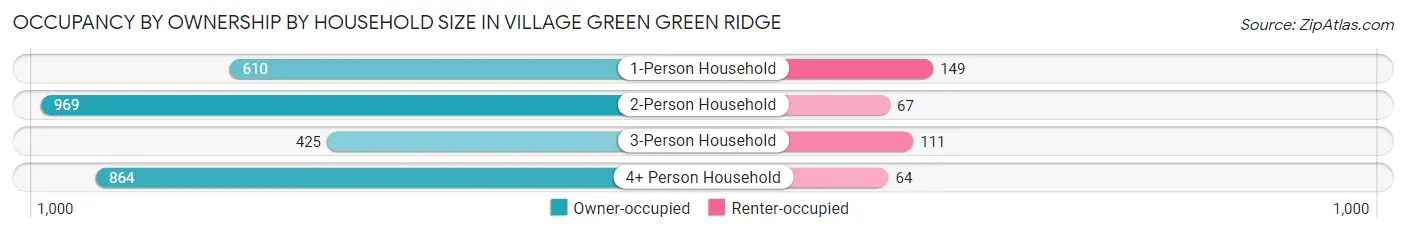
| Household Size | Owner-occupied | Renter-occupied |
| 1-Person Household | 610 (80.4%) | 149 (19.6%) |
| 2-Person Household | 969 (93.5%) | 67 (6.5%) |
| 3-Person Household | 425 (79.3%) | 111 (20.7%) |
| 4+ Person Household | 864 (93.1%) | 64 (6.9%) |
| Total Housing Units | 2,868 (88.0%) | 391 (12.0%) |
Occupancy by Educational Attainment in Village Green Green Ridge
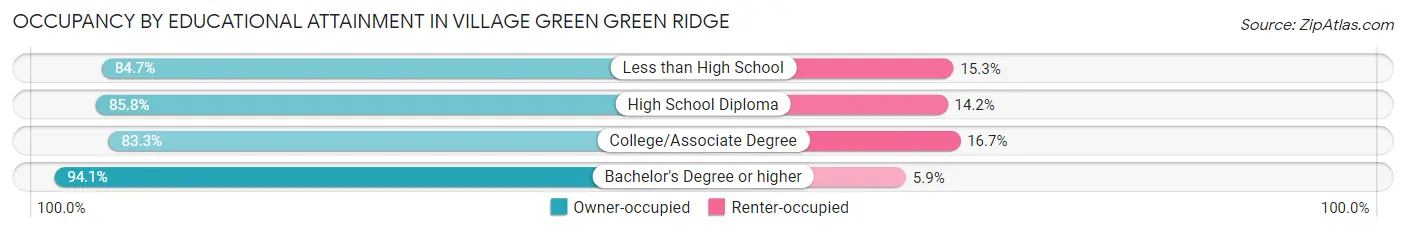
| Household Size | Owner-occupied | Renter-occupied |
| Less than High School | 116 (84.7%) | 21 (15.3%) |
| High School Diploma | 952 (85.8%) | 157 (14.2%) |
| College/Associate Degree | 730 (83.3%) | 146 (16.7%) |
| Bachelor's Degree or higher | 1,070 (94.1%) | 67 (5.9%) |
Occupancy by Age of Householder in Village Green Green Ridge
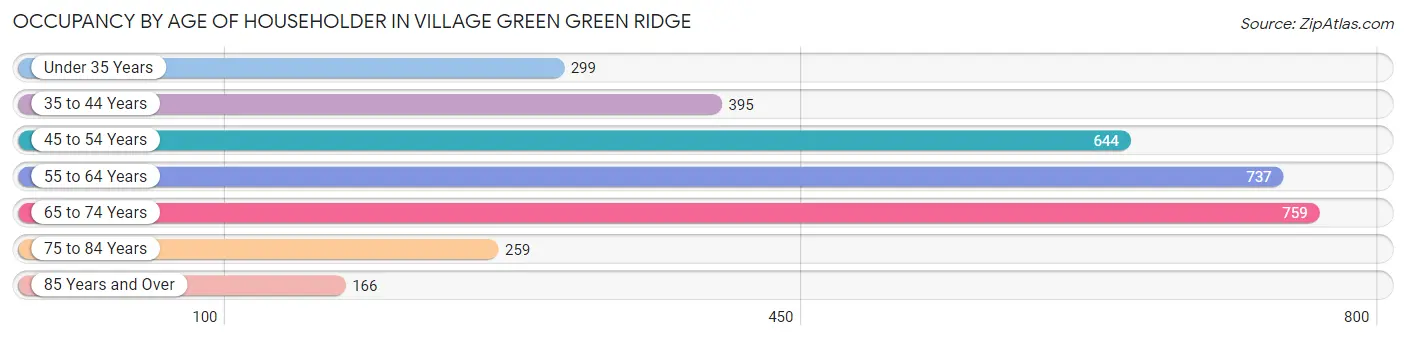
| Age Bracket | # Households | % Households |
| Under 35 Years | 299 | 9.2% |
| 35 to 44 Years | 395 | 12.1% |
| 45 to 54 Years | 644 | 19.8% |
| 55 to 64 Years | 737 | 22.6% |
| 65 to 74 Years | 759 | 23.3% |
| 75 to 84 Years | 259 | 8.0% |
| 85 Years and Over | 166 | 5.1% |
| Total | 3,259 | 100.0% |
Housing Finances in Village Green Green Ridge
Median Income by Occupancy in Village Green Green Ridge
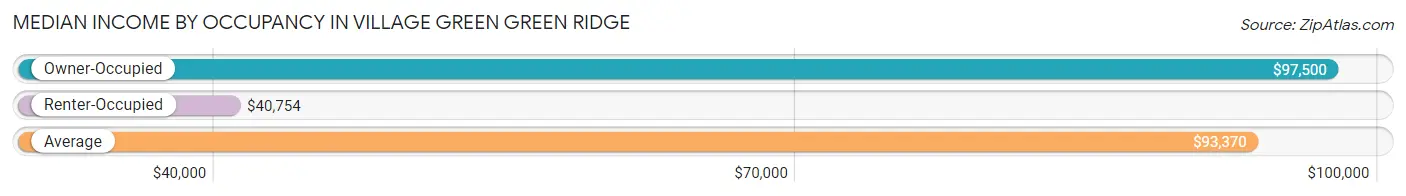
| Occupancy Type | # Households | Median Income |
| Owner-Occupied | 2,868 (88.0%) | $97,500 |
| Renter-Occupied | 391 (12.0%) | $40,754 |
| Average | 3,259 (100.0%) | $93,370 |
Occupancy by Householder Income Bracket in Village Green Green Ridge
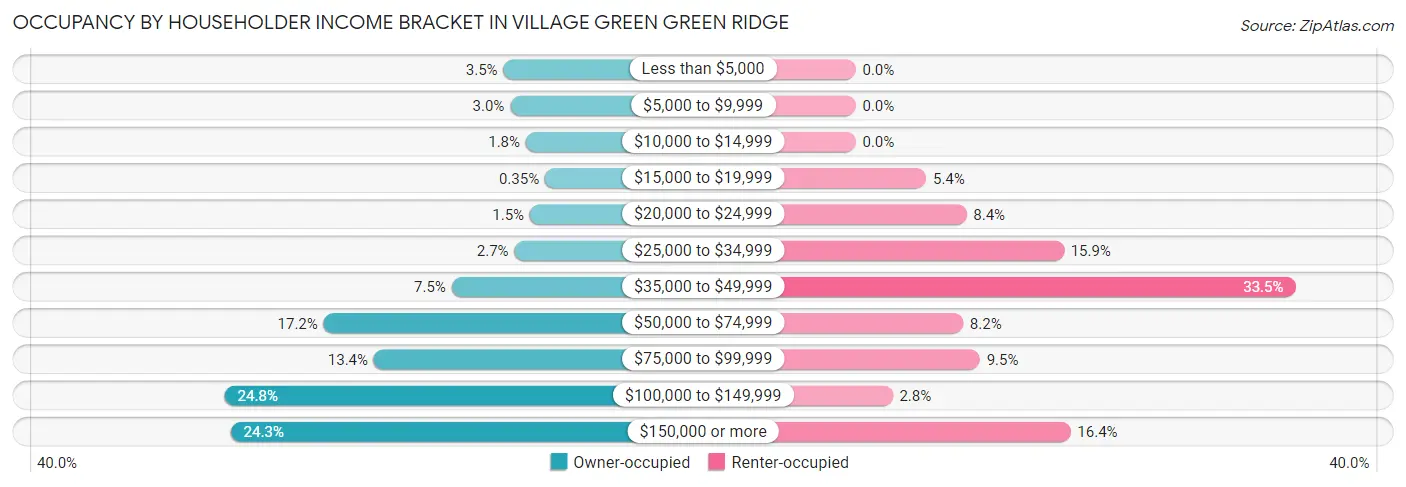
| Income Bracket | Owner-occupied | Renter-occupied |
| Less than $5,000 | 101 (3.5%) | 0 (0.0%) |
| $5,000 to $9,999 | 86 (3.0%) | 0 (0.0%) |
| $10,000 to $14,999 | 52 (1.8%) | 0 (0.0%) |
| $15,000 to $19,999 | 10 (0.4%) | 21 (5.4%) |
| $20,000 to $24,999 | 43 (1.5%) | 33 (8.4%) |
| $25,000 to $34,999 | 77 (2.7%) | 62 (15.9%) |
| $35,000 to $49,999 | 214 (7.5%) | 131 (33.5%) |
| $50,000 to $74,999 | 494 (17.2%) | 32 (8.2%) |
| $75,000 to $99,999 | 384 (13.4%) | 37 (9.5%) |
| $100,000 to $149,999 | 710 (24.8%) | 11 (2.8%) |
| $150,000 or more | 697 (24.3%) | 64 (16.4%) |
| Total | 2,868 (100.0%) | 391 (100.0%) |
Monthly Housing Cost Tiers in Village Green Green Ridge
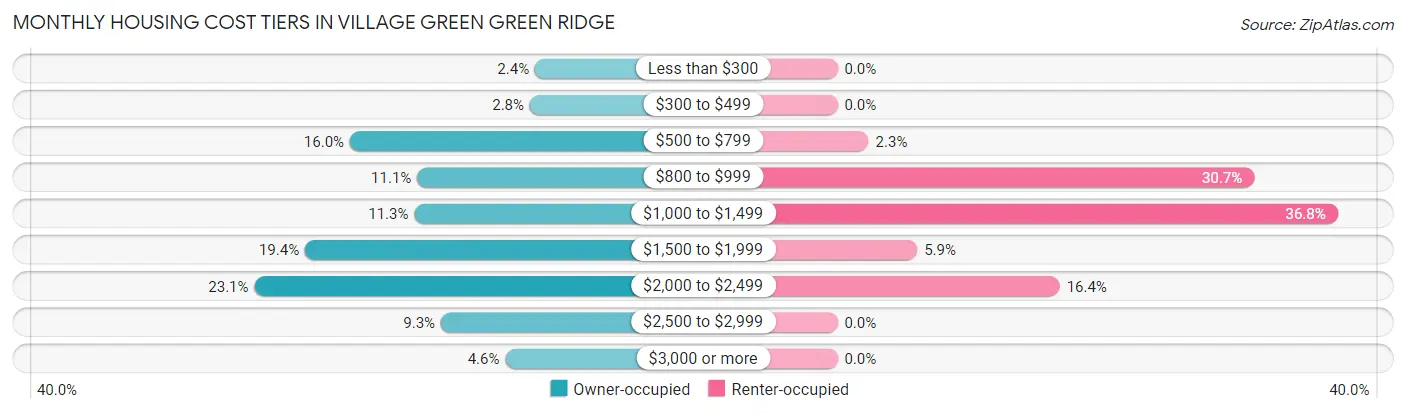
| Monthly Cost | Owner-occupied | Renter-occupied |
| Less than $300 | 69 (2.4%) | 0 (0.0%) |
| $300 to $499 | 80 (2.8%) | 0 (0.0%) |
| $500 to $799 | 460 (16.0%) | 9 (2.3%) |
| $800 to $999 | 318 (11.1%) | 120 (30.7%) |
| $1,000 to $1,499 | 324 (11.3%) | 144 (36.8%) |
| $1,500 to $1,999 | 555 (19.4%) | 23 (5.9%) |
| $2,000 to $2,499 | 662 (23.1%) | 64 (16.4%) |
| $2,500 to $2,999 | 268 (9.3%) | 0 (0.0%) |
| $3,000 or more | 132 (4.6%) | 0 (0.0%) |
| Total | 2,868 (100.0%) | 391 (100.0%) |
Physical Housing Characteristics in Village Green Green Ridge
Housing Structures in Village Green Green Ridge
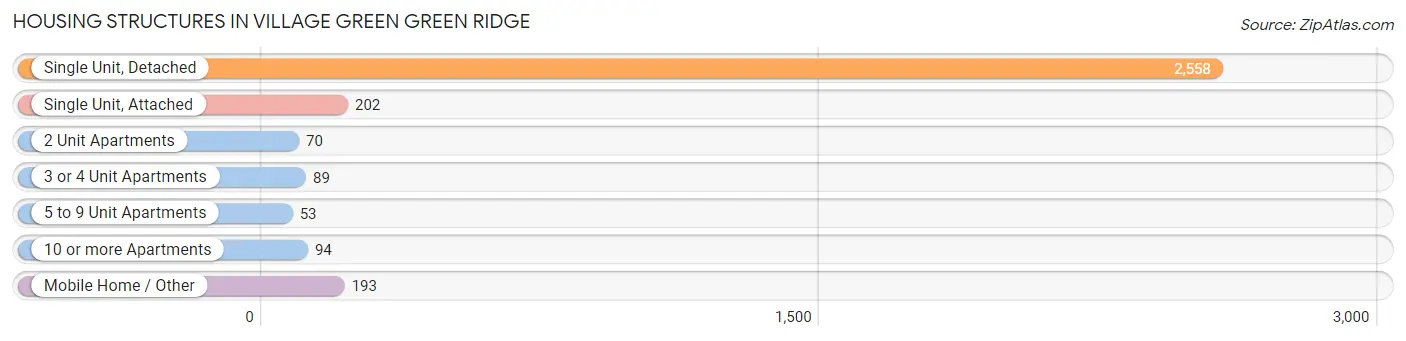
| Structure Type | # Housing Units | % Housing Units |
| Single Unit, Detached | 2,558 | 78.5% |
| Single Unit, Attached | 202 | 6.2% |
| 2 Unit Apartments | 70 | 2.1% |
| 3 or 4 Unit Apartments | 89 | 2.7% |
| 5 to 9 Unit Apartments | 53 | 1.6% |
| 10 or more Apartments | 94 | 2.9% |
| Mobile Home / Other | 193 | 5.9% |
| Total | 3,259 | 100.0% |
Housing Structures by Occupancy in Village Green Green Ridge
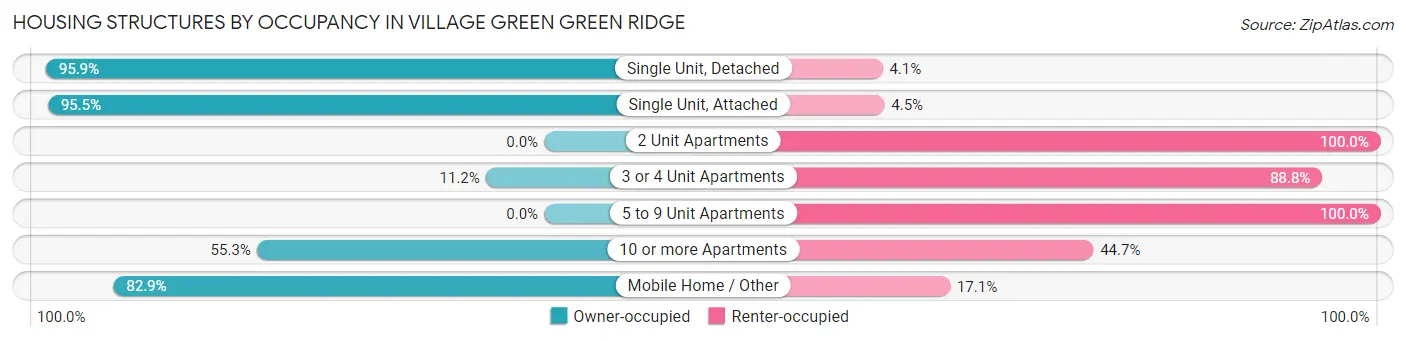
| Structure Type | Owner-occupied | Renter-occupied |
| Single Unit, Detached | 2,453 (95.9%) | 105 (4.1%) |
| Single Unit, Attached | 193 (95.5%) | 9 (4.5%) |
| 2 Unit Apartments | 0 (0.0%) | 70 (100.0%) |
| 3 or 4 Unit Apartments | 10 (11.2%) | 79 (88.8%) |
| 5 to 9 Unit Apartments | 0 (0.0%) | 53 (100.0%) |
| 10 or more Apartments | 52 (55.3%) | 42 (44.7%) |
| Mobile Home / Other | 160 (82.9%) | 33 (17.1%) |
| Total | 2,868 (88.0%) | 391 (12.0%) |
Housing Structures by Number of Rooms in Village Green Green Ridge
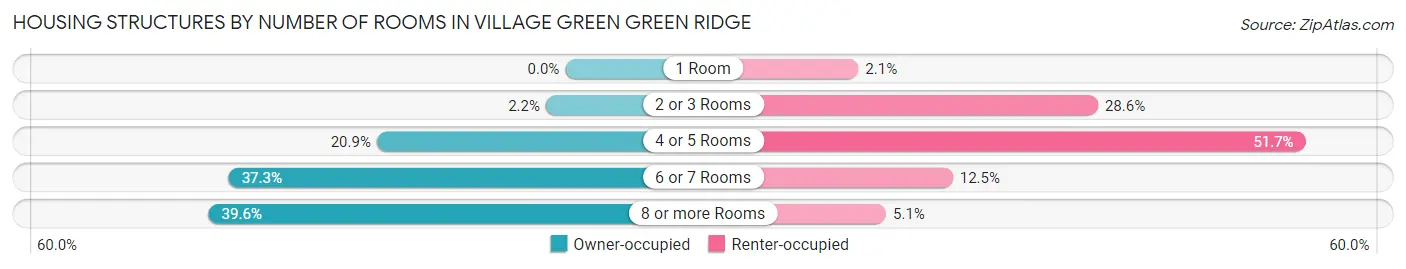
| Number of Rooms | Owner-occupied | Renter-occupied |
| 1 Room | 0 (0.0%) | 8 (2.1%) |
| 2 or 3 Rooms | 62 (2.2%) | 112 (28.6%) |
| 4 or 5 Rooms | 600 (20.9%) | 202 (51.7%) |
| 6 or 7 Rooms | 1,071 (37.3%) | 49 (12.5%) |
| 8 or more Rooms | 1,135 (39.6%) | 20 (5.1%) |
| Total | 2,868 (100.0%) | 391 (100.0%) |
Housing Structure by Heating Type in Village Green Green Ridge
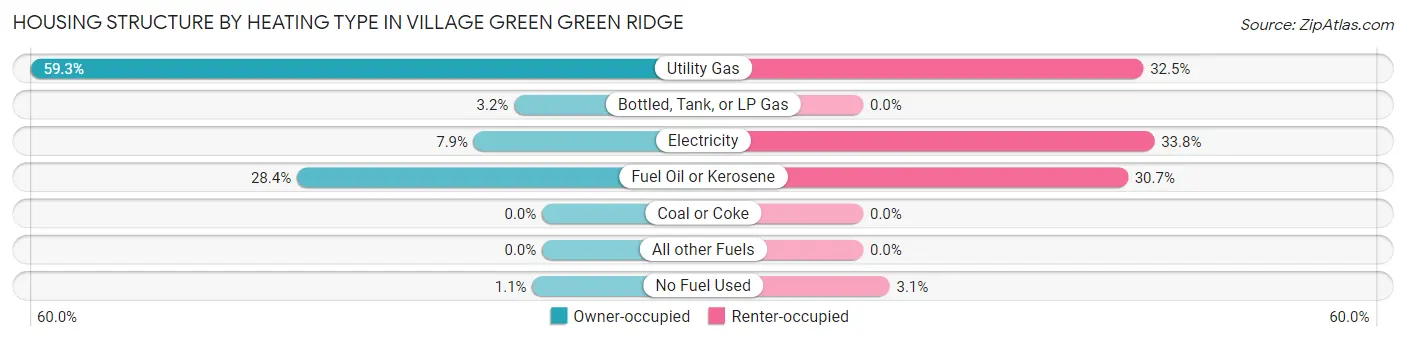
| Heating Type | Owner-occupied | Renter-occupied |
| Utility Gas | 1,701 (59.3%) | 127 (32.5%) |
| Bottled, Tank, or LP Gas | 93 (3.2%) | 0 (0.0%) |
| Electricity | 227 (7.9%) | 132 (33.8%) |
| Fuel Oil or Kerosene | 815 (28.4%) | 120 (30.7%) |
| Coal or Coke | 0 (0.0%) | 0 (0.0%) |
| All other Fuels | 0 (0.0%) | 0 (0.0%) |
| No Fuel Used | 32 (1.1%) | 12 (3.1%) |
| Total | 2,868 (100.0%) | 391 (100.0%) |
Household Vehicle Usage in Village Green Green Ridge
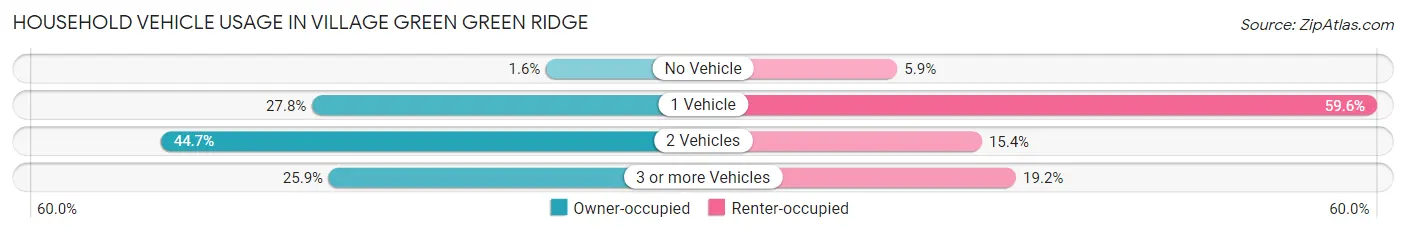
| Vehicles per Household | Owner-occupied | Renter-occupied |
| No Vehicle | 45 (1.6%) | 23 (5.9%) |
| 1 Vehicle | 797 (27.8%) | 233 (59.6%) |
| 2 Vehicles | 1,283 (44.7%) | 60 (15.3%) |
| 3 or more Vehicles | 743 (25.9%) | 75 (19.2%) |
| Total | 2,868 (100.0%) | 391 (100.0%) |
Real Estate & Mortgages in Village Green Green Ridge
Real Estate and Mortgage Overview in Village Green Green Ridge
| Characteristic | Without Mortgage | With Mortgage |
| Housing Units | 1,152 | 1,716 |
| Median Property Value | $264,200 | $310,300 |
| Median Household Income | $67,857 | $443 |
| Monthly Housing Costs | $792 | $124 |
| Real Estate Taxes | $5,325 | $0 |
Property Value by Mortgage Status in Village Green Green Ridge
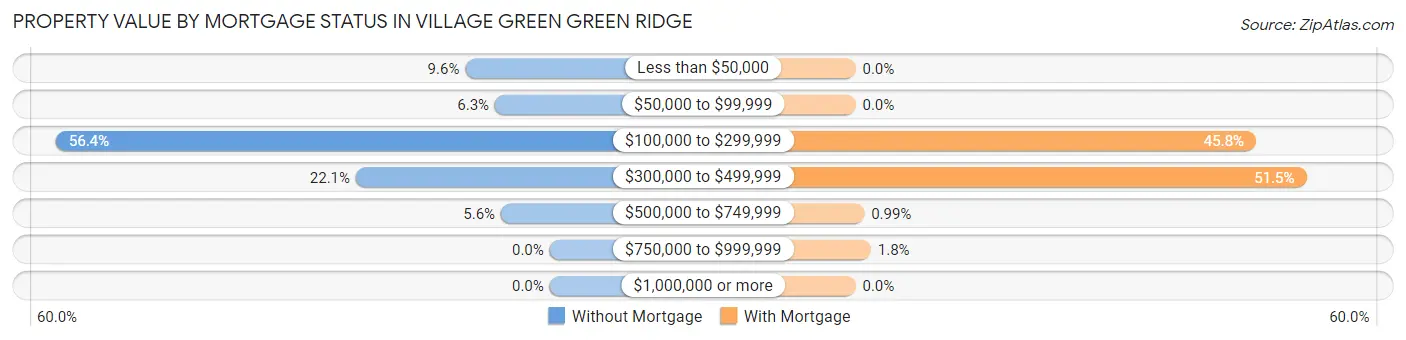
| Property Value | Without Mortgage | With Mortgage |
| Less than $50,000 | 111 (9.6%) | 0 (0.0%) |
| $50,000 to $99,999 | 72 (6.2%) | 0 (0.0%) |
| $100,000 to $299,999 | 650 (56.4%) | 785 (45.8%) |
| $300,000 to $499,999 | 255 (22.1%) | 884 (51.5%) |
| $500,000 to $749,999 | 64 (5.6%) | 17 (1.0%) |
| $750,000 to $999,999 | 0 (0.0%) | 30 (1.8%) |
| $1,000,000 or more | 0 (0.0%) | 0 (0.0%) |
| Total | 1,152 (100.0%) | 1,716 (100.0%) |
Household Income by Mortgage Status in Village Green Green Ridge
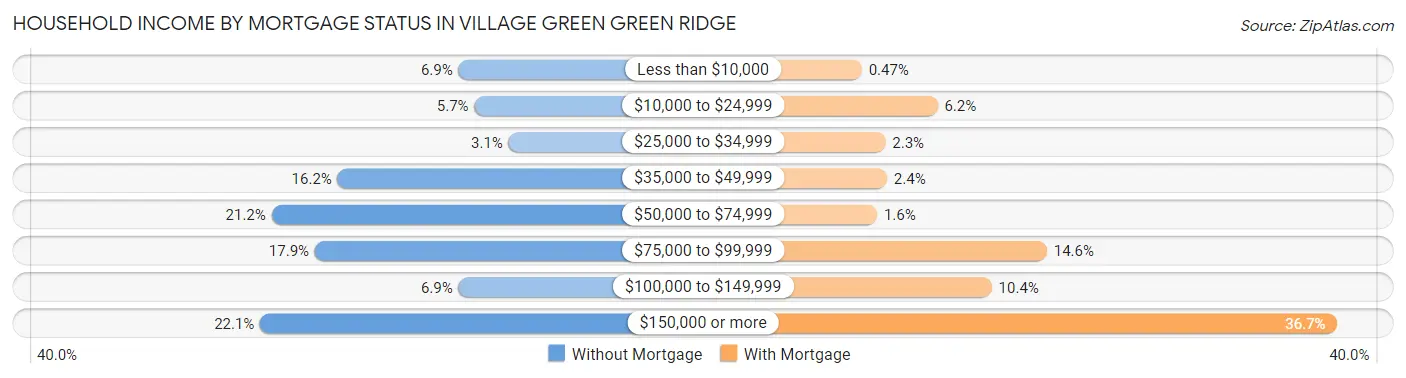
| Household Income | Without Mortgage | With Mortgage |
| Less than $10,000 | 80 (6.9%) | 8 (0.5%) |
| $10,000 to $24,999 | 66 (5.7%) | 107 (6.2%) |
| $25,000 to $34,999 | 36 (3.1%) | 39 (2.3%) |
| $35,000 to $49,999 | 186 (16.2%) | 41 (2.4%) |
| $50,000 to $74,999 | 244 (21.2%) | 28 (1.6%) |
| $75,000 to $99,999 | 206 (17.9%) | 250 (14.6%) |
| $100,000 to $149,999 | 80 (6.9%) | 178 (10.4%) |
| $150,000 or more | 254 (22.1%) | 630 (36.7%) |
| Total | 1,152 (100.0%) | 1,716 (100.0%) |
Property Value to Household Income Ratio in Village Green Green Ridge
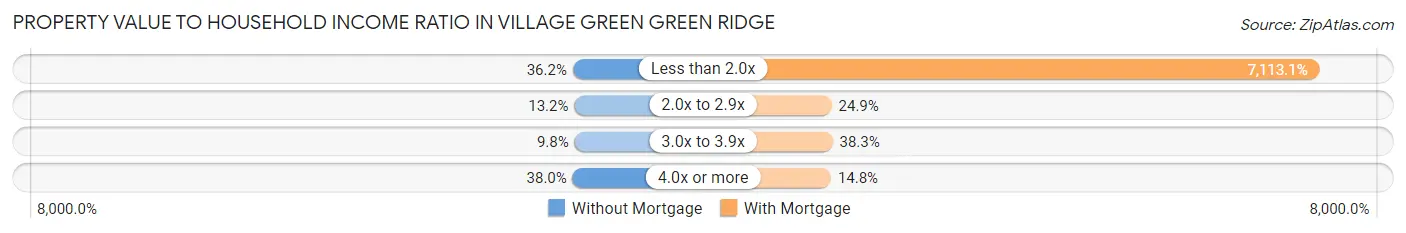
| Value-to-Income Ratio | Without Mortgage | With Mortgage |
| Less than 2.0x | 417 (36.2%) | 122,060 (7,113.0%) |
| 2.0x to 2.9x | 152 (13.2%) | 428 (24.9%) |
| 3.0x to 3.9x | 113 (9.8%) | 658 (38.3%) |
| 4.0x or more | 438 (38.0%) | 254 (14.8%) |
| Total | 1,152 (100.0%) | 1,716 (100.0%) |
Real Estate Taxes by Mortgage Status in Village Green Green Ridge
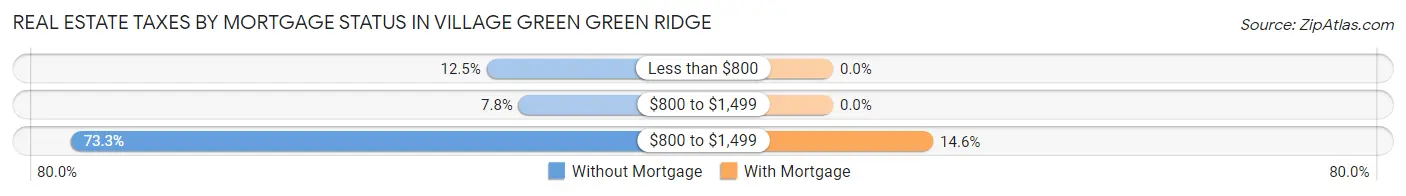
| Property Taxes | Without Mortgage | With Mortgage |
| Less than $800 | 144 (12.5%) | 0 (0.0%) |
| $800 to $1,499 | 90 (7.8%) | 0 (0.0%) |
| $800 to $1,499 | 844 (73.3%) | 251 (14.6%) |
| Total | 1,152 (100.0%) | 1,716 (100.0%) |
Health & Disability in Village Green Green Ridge
Health Insurance Coverage by Age in Village Green Green Ridge
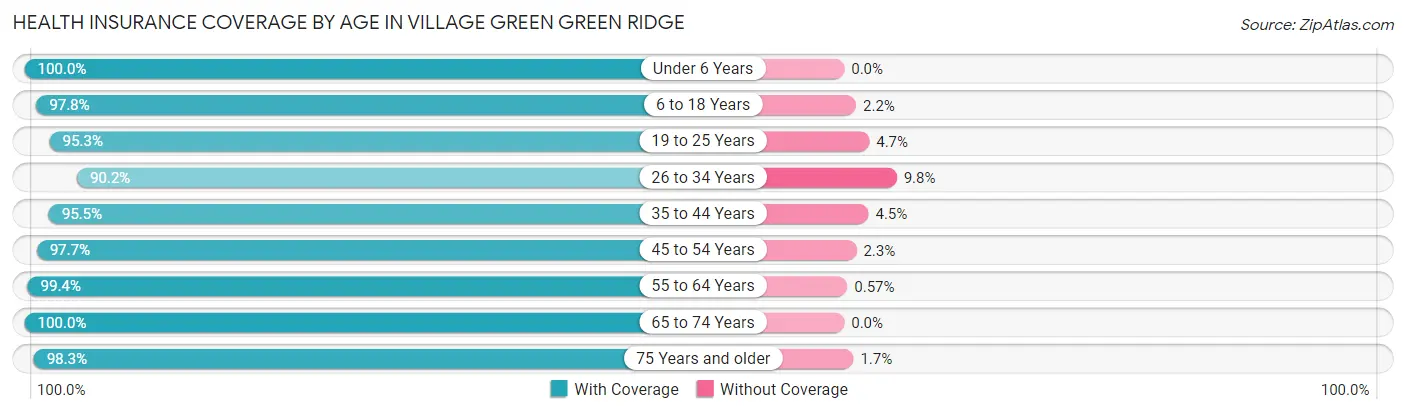
| Age Bracket | With Coverage | Without Coverage |
| Under 6 Years | 665 (100.0%) | 0 (0.0%) |
| 6 to 18 Years | 1,110 (97.8%) | 25 (2.2%) |
| 19 to 25 Years | 757 (95.3%) | 37 (4.7%) |
| 26 to 34 Years | 739 (90.2%) | 80 (9.8%) |
| 35 to 44 Years | 739 (95.5%) | 35 (4.5%) |
| 45 to 54 Years | 1,075 (97.7%) | 25 (2.3%) |
| 55 to 64 Years | 1,398 (99.4%) | 8 (0.6%) |
| 65 to 74 Years | 1,289 (100.0%) | 0 (0.0%) |
| 75 Years and older | 631 (98.3%) | 11 (1.7%) |
| Total | 8,403 (97.4%) | 221 (2.6%) |
Health Insurance Coverage by Citizenship Status in Village Green Green Ridge
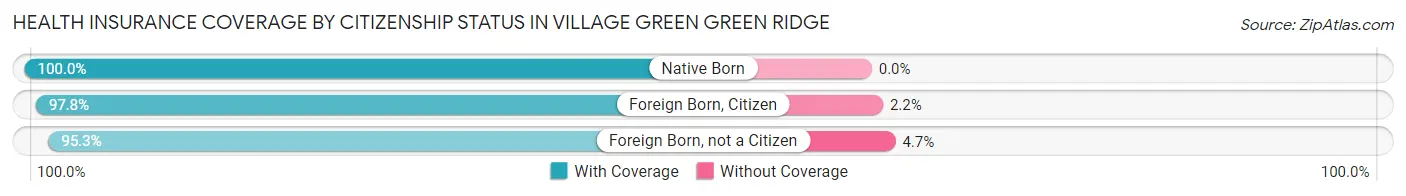
| Citizenship Status | With Coverage | Without Coverage |
| Native Born | 665 (100.0%) | 0 (0.0%) |
| Foreign Born, Citizen | 1,110 (97.8%) | 25 (2.2%) |
| Foreign Born, not a Citizen | 757 (95.3%) | 37 (4.7%) |
Health Insurance Coverage by Household Income in Village Green Green Ridge
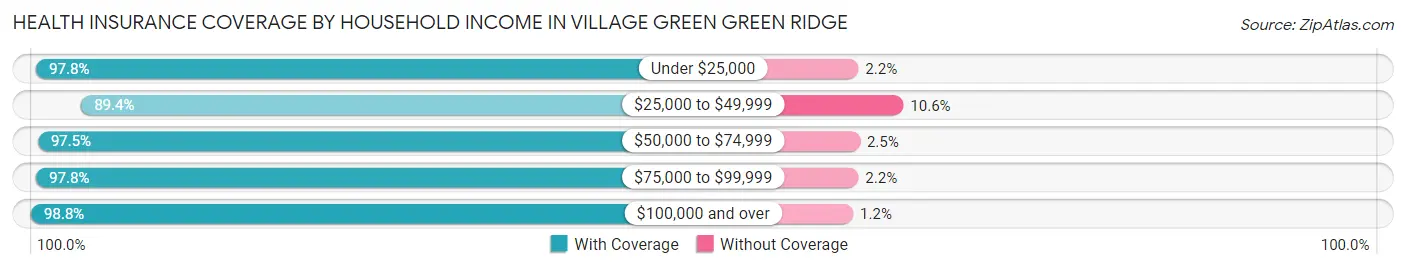
| Household Income | With Coverage | Without Coverage |
| Under $25,000 | 723 (97.8%) | 16 (2.2%) |
| $25,000 to $49,999 | 708 (89.4%) | 84 (10.6%) |
| $50,000 to $74,999 | 1,307 (97.5%) | 33 (2.5%) |
| $75,000 to $99,999 | 813 (97.8%) | 18 (2.2%) |
| $100,000 and over | 4,835 (98.8%) | 58 (1.2%) |
Public vs Private Health Insurance Coverage by Age in Village Green Green Ridge
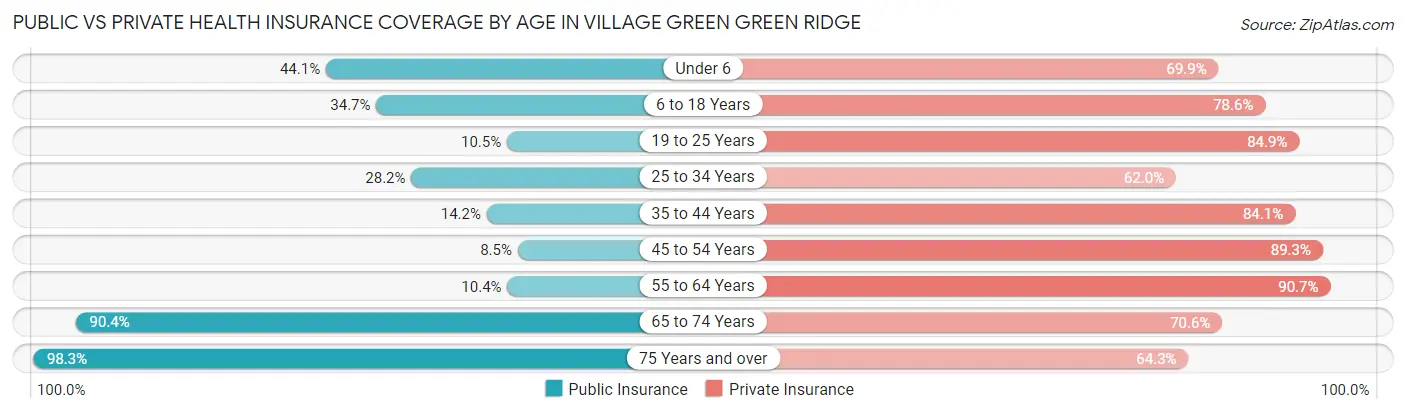
| Age Bracket | Public Insurance | Private Insurance |
| Under 6 | 293 (44.1%) | 465 (69.9%) |
| 6 to 18 Years | 394 (34.7%) | 892 (78.6%) |
| 19 to 25 Years | 83 (10.4%) | 674 (84.9%) |
| 25 to 34 Years | 231 (28.2%) | 508 (62.0%) |
| 35 to 44 Years | 110 (14.2%) | 651 (84.1%) |
| 45 to 54 Years | 93 (8.5%) | 982 (89.3%) |
| 55 to 64 Years | 146 (10.4%) | 1,275 (90.7%) |
| 65 to 74 Years | 1,165 (90.4%) | 910 (70.6%) |
| 75 Years and over | 631 (98.3%) | 413 (64.3%) |
| Total | 3,146 (36.5%) | 6,770 (78.5%) |
Disability Status by Sex by Age in Village Green Green Ridge
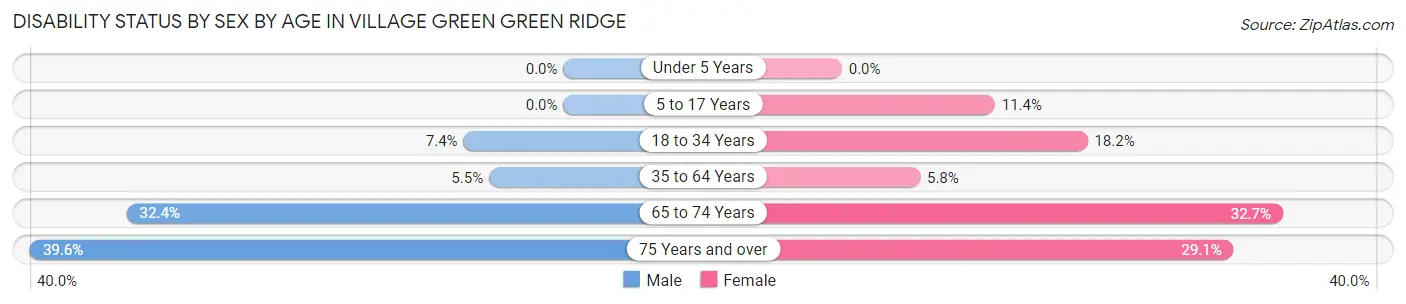
| Age Bracket | Male | Female |
| Under 5 Years | 0 (0.0%) | 0 (0.0%) |
| 5 to 17 Years | 0 (0.0%) | 66 (11.4%) |
| 18 to 34 Years | 51 (7.4%) | 197 (18.2%) |
| 35 to 64 Years | 89 (5.5%) | 97 (5.8%) |
| 65 to 74 Years | 201 (32.4%) | 219 (32.7%) |
| 75 Years and over | 80 (39.6%) | 128 (29.1%) |
Disability Class by Sex by Age in Village Green Green Ridge
Disability Class: Hearing Difficulty
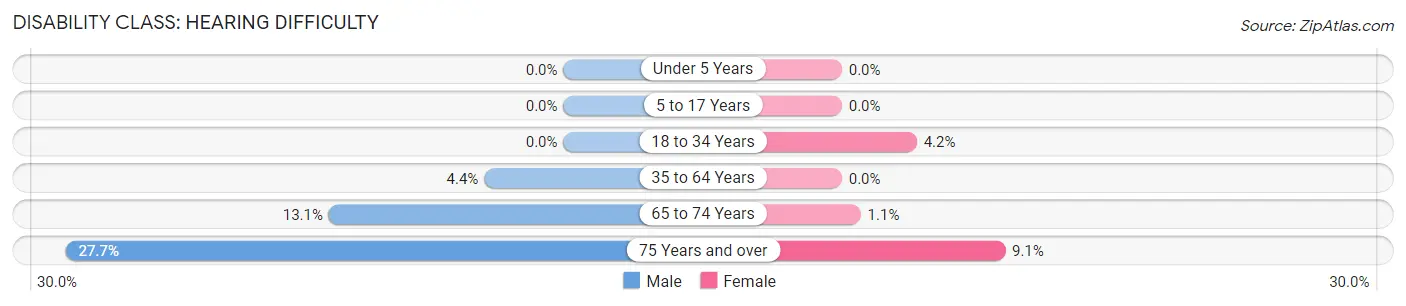
| Age Bracket | Male | Female |
| Under 5 Years | 0 (0.0%) | 0 (0.0%) |
| 5 to 17 Years | 0 (0.0%) | 0 (0.0%) |
| 18 to 34 Years | 0 (0.0%) | 45 (4.2%) |
| 35 to 64 Years | 71 (4.4%) | 0 (0.0%) |
| 65 to 74 Years | 81 (13.1%) | 7 (1.1%) |
| 75 Years and over | 56 (27.7%) | 40 (9.1%) |
Disability Class: Vision Difficulty
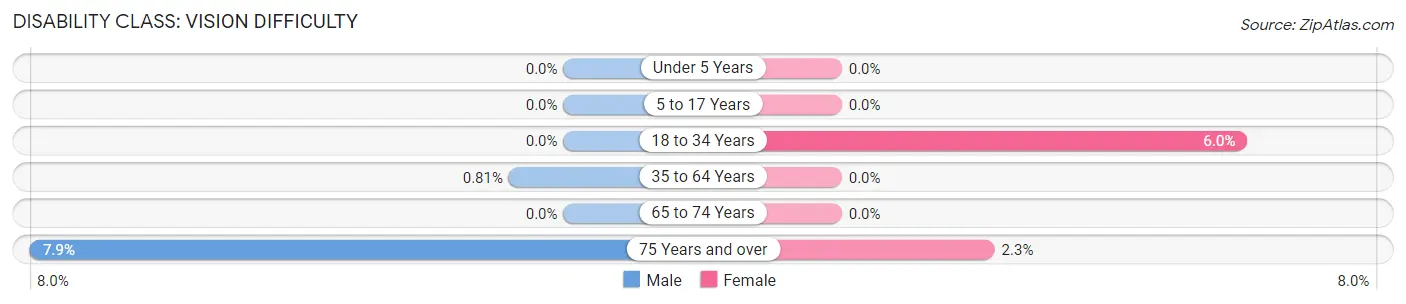
| Age Bracket | Male | Female |
| Under 5 Years | 0 (0.0%) | 0 (0.0%) |
| 5 to 17 Years | 0 (0.0%) | 0 (0.0%) |
| 18 to 34 Years | 0 (0.0%) | 65 (6.0%) |
| 35 to 64 Years | 13 (0.8%) | 0 (0.0%) |
| 65 to 74 Years | 0 (0.0%) | 0 (0.0%) |
| 75 Years and over | 16 (7.9%) | 10 (2.3%) |
Disability Class: Cognitive Difficulty
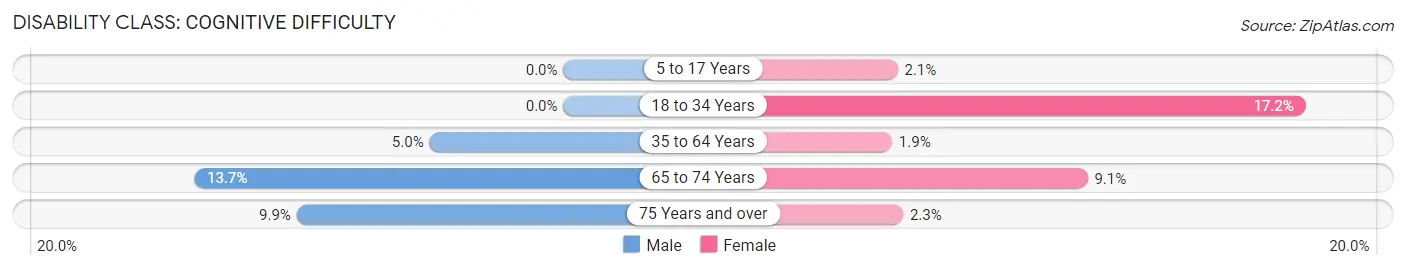
| Age Bracket | Male | Female |
| 5 to 17 Years | 0 (0.0%) | 12 (2.1%) |
| 18 to 34 Years | 0 (0.0%) | 186 (17.2%) |
| 35 to 64 Years | 80 (5.0%) | 31 (1.9%) |
| 65 to 74 Years | 85 (13.7%) | 61 (9.1%) |
| 75 Years and over | 20 (9.9%) | 10 (2.3%) |
Disability Class: Ambulatory Difficulty
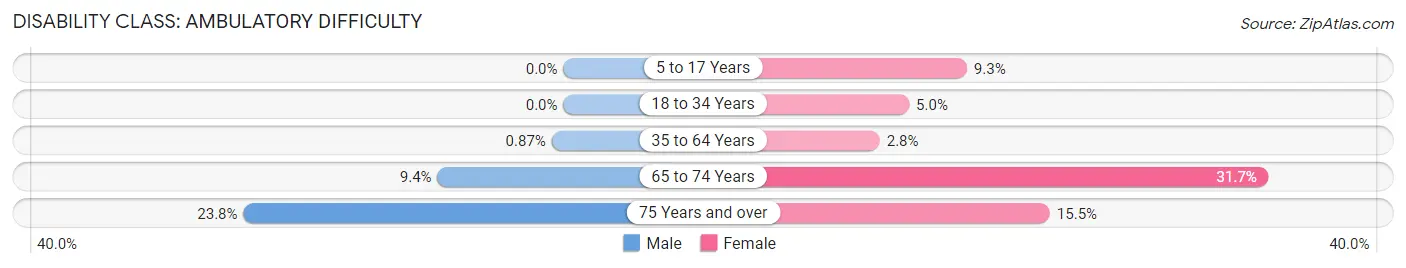
| Age Bracket | Male | Female |
| 5 to 17 Years | 0 (0.0%) | 54 (9.3%) |
| 18 to 34 Years | 0 (0.0%) | 54 (5.0%) |
| 35 to 64 Years | 14 (0.9%) | 47 (2.8%) |
| 65 to 74 Years | 58 (9.3%) | 212 (31.7%) |
| 75 Years and over | 48 (23.8%) | 68 (15.4%) |
Disability Class: Self-Care Difficulty
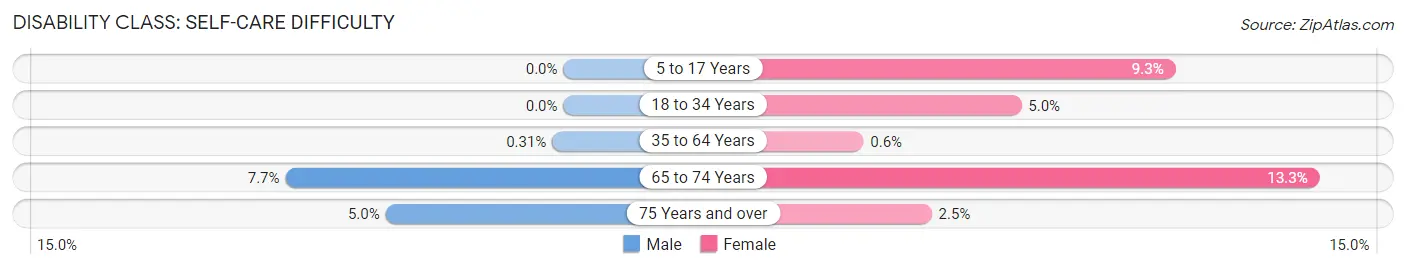
| Age Bracket | Male | Female |
| 5 to 17 Years | 0 (0.0%) | 54 (9.3%) |
| 18 to 34 Years | 0 (0.0%) | 54 (5.0%) |
| 35 to 64 Years | 5 (0.3%) | 10 (0.6%) |
| 65 to 74 Years | 48 (7.7%) | 89 (13.3%) |
| 75 Years and over | 10 (5.0%) | 11 (2.5%) |
Technology Access in Village Green Green Ridge
Computing Device Access in Village Green Green Ridge
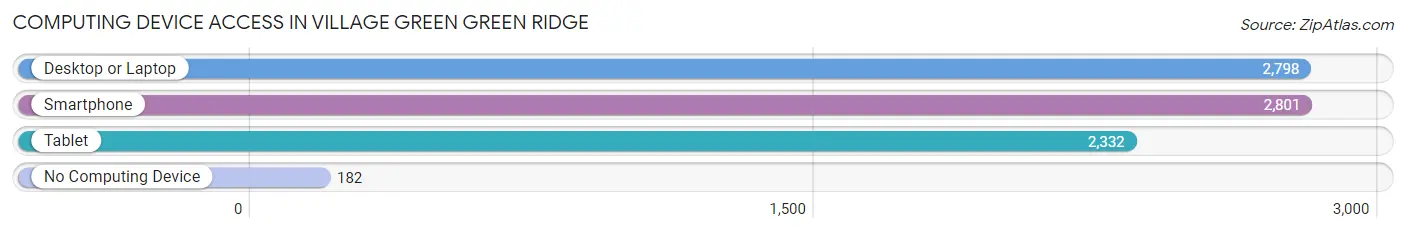
| Device Type | # Households | % Households |
| Desktop or Laptop | 2,798 | 85.9% |
| Smartphone | 2,801 | 86.0% |
| Tablet | 2,332 | 71.6% |
| No Computing Device | 182 | 5.6% |
| Total | 3,259 | 100.0% |
Internet Access in Village Green Green Ridge
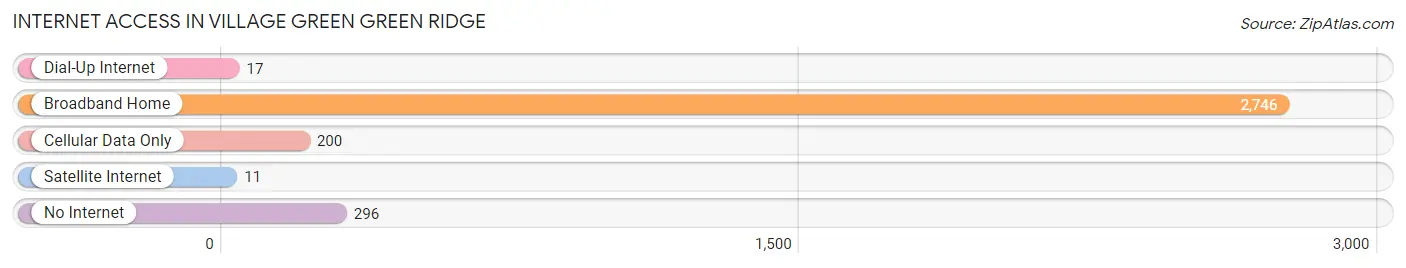
| Internet Type | # Households | % Households |
| Dial-Up Internet | 17 | 0.5% |
| Broadband Home | 2,746 | 84.3% |
| Cellular Data Only | 200 | 6.1% |
| Satellite Internet | 11 | 0.3% |
| No Internet | 296 | 9.1% |
| Total | 3,259 | 100.0% |
Village Green Green Ridge Summary
Green Ridge is a small village located in Lackawanna County, Pennsylvania. It is situated in the foothills of the Pocono Mountains, approximately 10 miles south of Scranton. The village is home to a population of approximately 1,000 people, and is known for its rural charm and small-town atmosphere.
History
Green Ridge was first settled in the early 1800s by a group of German immigrants. The village was originally known as “Greensburg”, but the name was changed to Green Ridge in 1845. The village was officially incorporated in 1851.
In the late 1800s, Green Ridge was a thriving community with a variety of businesses, including a sawmill, a gristmill, a tannery, and a blacksmith shop. The village also had a post office, a school, and several churches.
In the early 1900s, the village began to decline as many of its businesses closed. The population decreased, and the village became a quiet, rural community.
Geography
Green Ridge is located in the foothills of the Pocono Mountains, approximately 10 miles south of Scranton. The village is situated on a ridge, which is why it was given its name. The village is surrounded by rolling hills and forests, and is home to a variety of wildlife, including deer, foxes, and wild turkeys.
The village is located near several major highways, including Interstate 81 and the Pennsylvania Turnpike. The nearest airport is Wilkes-Barre/Scranton International Airport, which is approximately 25 miles away.
Economy
Green Ridge is a small, rural community with a limited economy. The village is home to a few small businesses, including a grocery store, a hardware store, and a few restaurants. The village also has a post office and a few churches.
The village is home to a few small farms, which produce a variety of crops, including corn, soybeans, and hay. The village also has a few small manufacturing businesses, which produce a variety of products, including furniture and clothing.
Demographics
As of the 2010 census, Green Ridge had a population of 1,000 people. The village is predominantly white, with approximately 95% of the population being of European descent. The median household income is approximately $45,000, and the median home value is approximately $150,000.
The village is home to a variety of religious denominations, including Catholic, Protestant, and Jewish. The village also has a few small churches, including a Methodist church, a Presbyterian church, and a Baptist church.
Conclusion
Green Ridge is a small, rural village located in the foothills of the Pocono Mountains. The village is home to a population of approximately 1,000 people, and is known for its rural charm and small-town atmosphere. The village is home to a few small businesses, and is surrounded by rolling hills and forests. The village is predominantly white, with a median household income of approximately $45,000. Green Ridge is a peaceful, quiet village that is a great place to call home.
Common Questions
What is Per Capita Income in Village Green Green Ridge?
Per Capita income in Village Green Green Ridge is $42,436.
What is the Median Family Income in Village Green Green Ridge?
Median Family Income in Village Green Green Ridge is $118,400.
What is the Median Household income in Village Green Green Ridge?
Median Household Income in Village Green Green Ridge is $93,370.
What is Income or Wage Gap in Village Green Green Ridge?
Income or Wage Gap in Village Green Green Ridge is 53.5%.
Women in Village Green Green Ridge earn 46.5 cents for every dollar earned by a man.
What is Inequality or Gini Index in Village Green Green Ridge?
Inequality or Gini Index in Village Green Green Ridge is 0.40.
What is the Total Population of Village Green Green Ridge?
Total Population of Village Green Green Ridge is 8,652.
What is the Total Male Population of Village Green Green Ridge?
Total Male Population of Village Green Green Ridge is 3,929.
What is the Total Female Population of Village Green Green Ridge?
Total Female Population of Village Green Green Ridge is 4,723.
What is the Ratio of Males per 100 Females in Village Green Green Ridge?
There are 83.19 Males per 100 Females in Village Green Green Ridge.
What is the Ratio of Females per 100 Males in Village Green Green Ridge?
There are 120.21 Females per 100 Males in Village Green Green Ridge.
What is the Median Population Age in Village Green Green Ridge?
Median Population Age in Village Green Green Ridge is 47.0 Years.
What is the Average Family Size in Village Green Green Ridge
Average Family Size in Village Green Green Ridge is 3.1 People.
What is the Average Household Size in Village Green Green Ridge
Average Household Size in Village Green Green Ridge is 2.6 People.
How Large is the Labor Force in Village Green Green Ridge?
There are 4,676 People in the Labor Forcein in Village Green Green Ridge.
What is the Percentage of People in the Labor Force in Village Green Green Ridge?
64.5% of People are in the Labor Force in Village Green Green Ridge.
What is the Unemployment Rate in Village Green Green Ridge?
Unemployment Rate in Village Green Green Ridge is 6.8%.