Blairsville borough, PA Map & Demographics
Blairsville borough Overview
$30,006
PER CAPITA INCOME
$67,083
AVG FAMILY INCOME
$46,082
AVG HOUSEHOLD INCOME
59.7%
WAGE / INCOME GAP [ % ]
40.3¢/ $1
WAGE / INCOME GAP [ $ ]
0.48
INEQUALITY / GINI INDEX
3,215
TOTAL POPULATION
1,472
MALE POPULATION
1,743
FEMALE POPULATION
84.45
MALES / 100 FEMALES
118.41
FEMALES / 100 MALES
51.5
MEDIAN AGE
2.8
AVG FAMILY SIZE
2.1
AVG HOUSEHOLD SIZE
1,510
LABOR FORCE [ PEOPLE ]
55.6%
PERCENT IN LABOR FORCE
1.8%
UNEMPLOYMENT RATE
Income in Blairsville borough
Income Overview in Blairsville borough
Per Capita Income in Blairsville borough is $30,006, while median incomes of families and households are $67,083 and $46,082 respectively.
| Characteristic | Number | Measure |
| Per Capita Income | 3,215 | $30,006 |
| Median Family Income | 832 | $67,083 |
| Mean Family Income | 832 | $69,422 |
| Median Household Income | 1,496 | $46,082 |
| Mean Household Income | 1,496 | $60,067 |
| Income Deficit | 832 | $0 |
| Wage / Income Gap (%) | 3,215 | 59.65% |
| Wage / Income Gap ($) | 3,215 | 40.35¢ per $1 |
| Gini / Inequality Index | 3,215 | 0.48 |
Earnings by Sex in Blairsville borough
Average Earnings in Blairsville borough are $32,000, $47,470 for men and $19,153 for women, a difference of 59.7%.
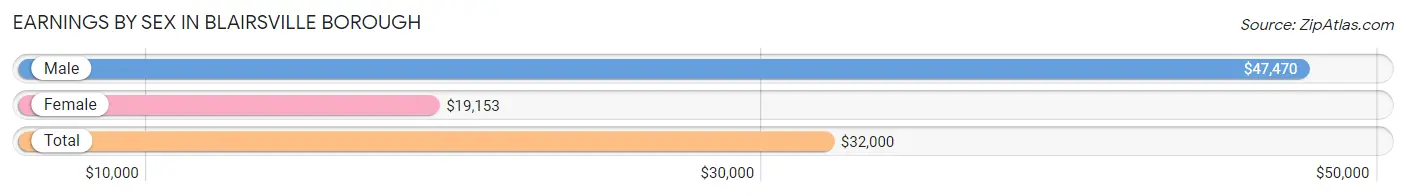
| Sex | Number | Average Earnings |
| Male | 609 (38.3%) | $47,470 |
| Female | 981 (61.7%) | $19,153 |
| Total | 1,590 (100.0%) | $32,000 |
Earnings by Sex by Income Bracket in Blairsville borough
The most common earnings brackets in Blairsville borough are $75,000 to $99,999 for men (109 | 17.9%) and $12,500 to $14,999 for women (122 | 12.4%).
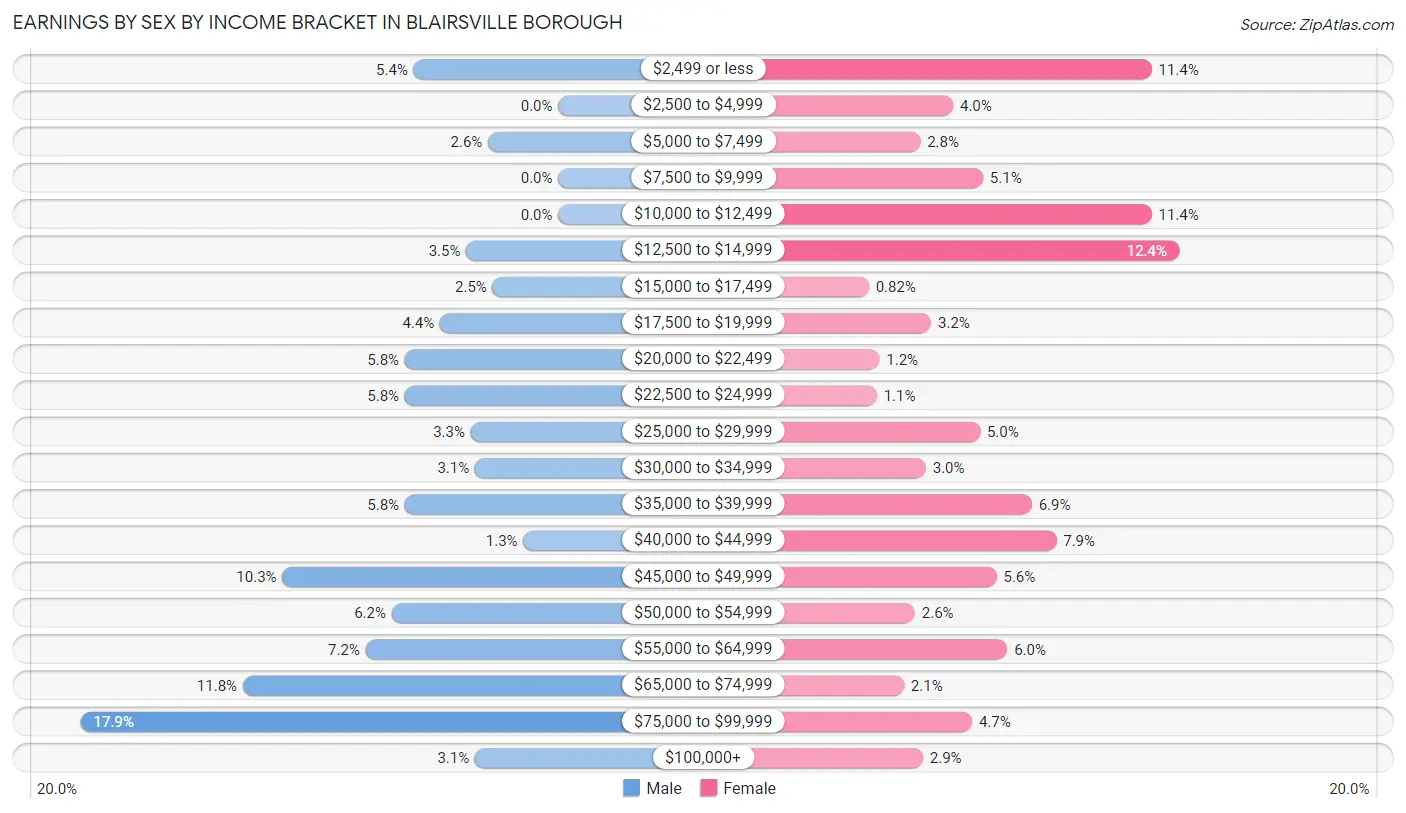
| Income | Male | Female |
| $2,499 or less | 33 (5.4%) | 112 (11.4%) |
| $2,500 to $4,999 | 0 (0.0%) | 39 (4.0%) |
| $5,000 to $7,499 | 16 (2.6%) | 27 (2.8%) |
| $7,500 to $9,999 | 0 (0.0%) | 50 (5.1%) |
| $10,000 to $12,499 | 0 (0.0%) | 112 (11.4%) |
| $12,500 to $14,999 | 21 (3.5%) | 122 (12.4%) |
| $15,000 to $17,499 | 15 (2.5%) | 8 (0.8%) |
| $17,500 to $19,999 | 27 (4.4%) | 31 (3.2%) |
| $20,000 to $22,499 | 35 (5.8%) | 12 (1.2%) |
| $22,500 to $24,999 | 35 (5.8%) | 11 (1.1%) |
| $25,000 to $29,999 | 20 (3.3%) | 49 (5.0%) |
| $30,000 to $34,999 | 19 (3.1%) | 29 (3.0%) |
| $35,000 to $39,999 | 35 (5.8%) | 68 (6.9%) |
| $40,000 to $44,999 | 8 (1.3%) | 77 (7.9%) |
| $45,000 to $49,999 | 63 (10.3%) | 55 (5.6%) |
| $50,000 to $54,999 | 38 (6.2%) | 25 (2.5%) |
| $55,000 to $64,999 | 44 (7.2%) | 59 (6.0%) |
| $65,000 to $74,999 | 72 (11.8%) | 21 (2.1%) |
| $75,000 to $99,999 | 109 (17.9%) | 46 (4.7%) |
| $100,000+ | 19 (3.1%) | 28 (2.9%) |
| Total | 609 (100.0%) | 981 (100.0%) |
Earnings by Sex by Educational Attainment in Blairsville borough
Average earnings in Blairsville borough are $49,489 for men and $19,395 for women, a difference of 60.8%. Men with an educational attainment of bachelor's degree enjoy the highest average annual earnings of $65,769, while those with college or associate's degree education earn the least with $39,265. Women with an educational attainment of graduate degree earn the most with the average annual earnings of $61,290, while those with high school diploma education have the smallest earnings of $14,494.
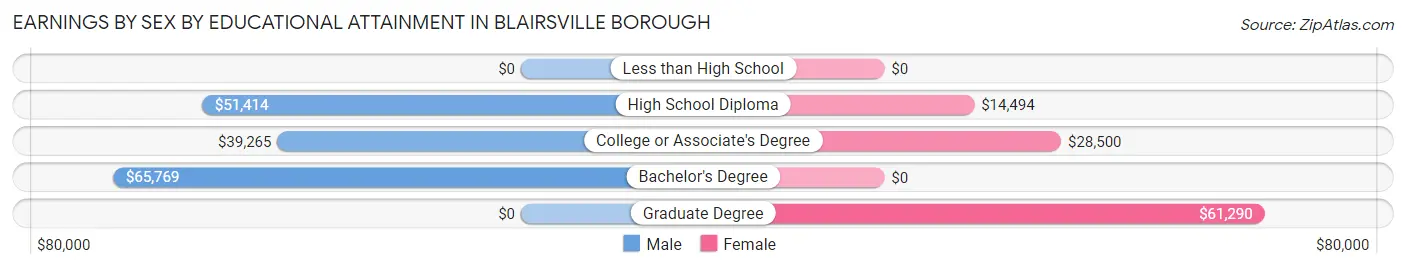
| Educational Attainment | Male Income | Female Income |
| Less than High School | - | - |
| High School Diploma | $51,414 | $14,494 |
| College or Associate's Degree | $39,265 | $28,500 |
| Bachelor's Degree | $65,769 | $0 |
| Graduate Degree | - | - |
| Total | $49,489 | $19,395 |
Family Income in Blairsville borough
Family Income Brackets in Blairsville borough
According to the Blairsville borough family income data, there are 156 families falling into the $100,000 to $149,999 income range, which is the most common income bracket and makes up 18.8% of all families. Conversely, the $200,000+ income bracket is the least frequent group with only 13 families (1.6%) belonging to this category.
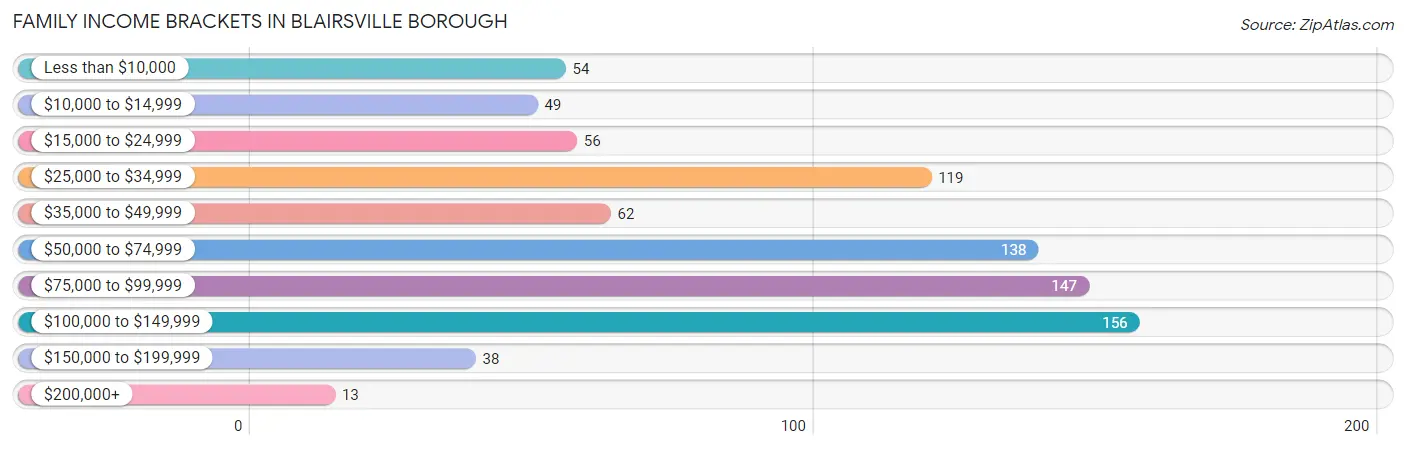
| Income Bracket | # Families | % Families |
| Less than $10,000 | 54 | 6.5% |
| $10,000 to $14,999 | 49 | 5.9% |
| $15,000 to $24,999 | 56 | 6.7% |
| $25,000 to $34,999 | 119 | 14.3% |
| $35,000 to $49,999 | 62 | 7.5% |
| $50,000 to $74,999 | 138 | 16.6% |
| $75,000 to $99,999 | 147 | 17.7% |
| $100,000 to $149,999 | 156 | 18.8% |
| $150,000 to $199,999 | 38 | 4.6% |
| $200,000+ | 13 | 1.6% |
Family Income by Famaliy Size in Blairsville borough
2-person families (541 | 65.0%) account for the highest median family income in Blairsville borough with $64,625 per family, while 2-person families (541 | 65.0%) have the highest median income of $32,312 per family member.
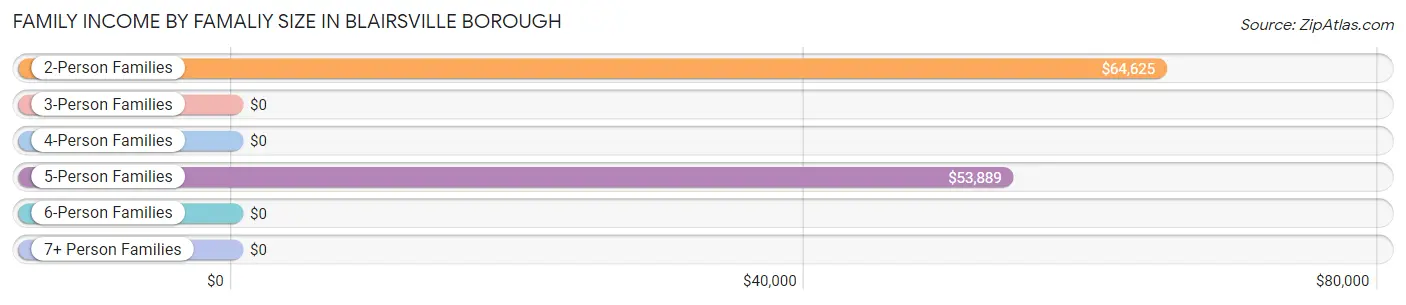
| Income Bracket | # Families | Median Income |
| 2-Person Families | 541 (65.0%) | $64,625 |
| 3-Person Families | 216 (26.0%) | $0 |
| 4-Person Families | 33 (4.0%) | $0 |
| 5-Person Families | 24 (2.9%) | $53,889 |
| 6-Person Families | 0 (0.0%) | $0 |
| 7+ Person Families | 18 (2.2%) | $0 |
| Total | 832 (100.0%) | $67,083 |
Family Income by Number of Earners in Blairsville borough
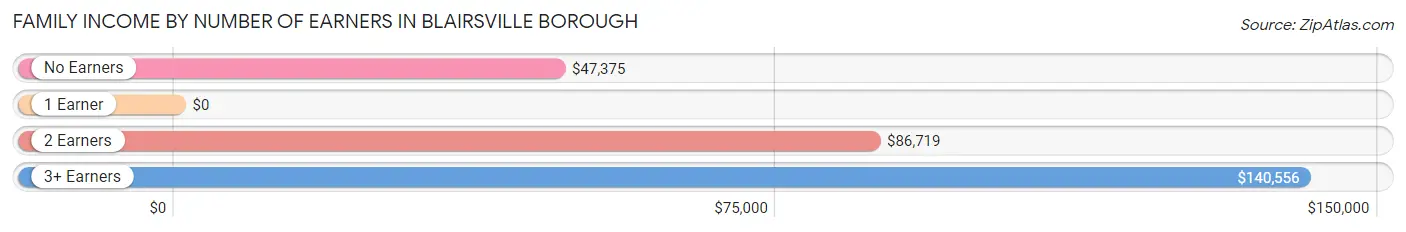
| Number of Earners | # Families | Median Income |
| No Earners | 167 (20.1%) | $47,375 |
| 1 Earner | 352 (42.3%) | $0 |
| 2 Earners | 275 (33.1%) | $86,719 |
| 3+ Earners | 38 (4.6%) | $140,556 |
| Total | 832 (100.0%) | $67,083 |
Household Income in Blairsville borough
Household Income Brackets in Blairsville borough
With 242 households falling in the category, the $50,000 to $74,999 income range is the most frequent in Blairsville borough, accounting for 16.2% of all households. In contrast, only 27 households (1.8%) fall into the $200,000+ income bracket, making it the least populous group.
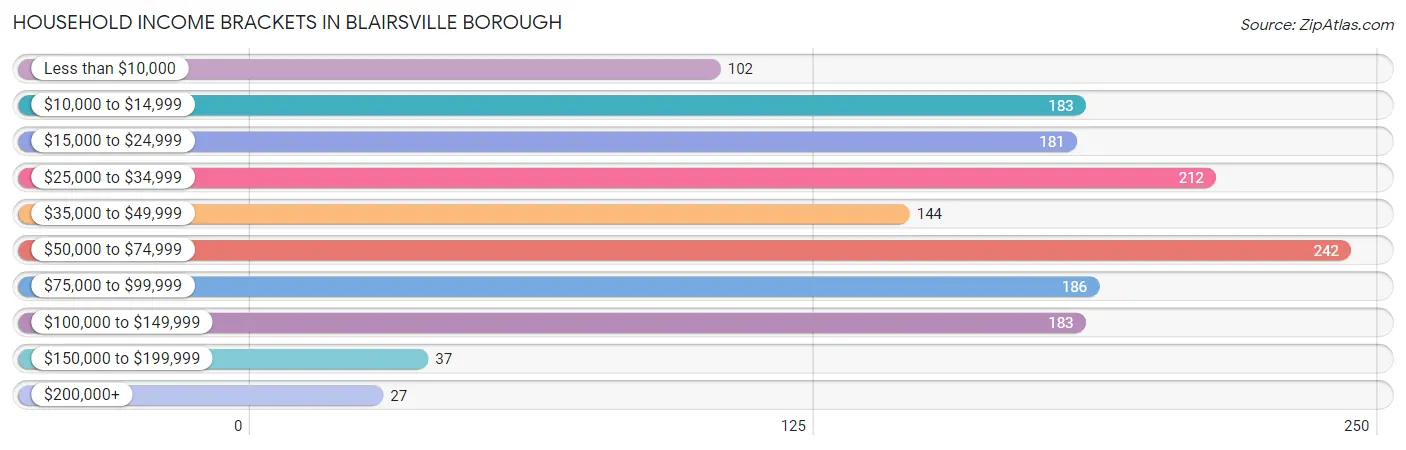
| Income Bracket | # Households | % Households |
| Less than $10,000 | 102 | 6.8% |
| $10,000 to $14,999 | 183 | 12.2% |
| $15,000 to $24,999 | 181 | 12.1% |
| $25,000 to $34,999 | 212 | 14.2% |
| $35,000 to $49,999 | 144 | 9.6% |
| $50,000 to $74,999 | 242 | 16.2% |
| $75,000 to $99,999 | 186 | 12.4% |
| $100,000 to $149,999 | 183 | 12.2% |
| $150,000 to $199,999 | 37 | 2.5% |
| $200,000+ | 27 | 1.8% |
Household Income by Householder Age in Blairsville borough
The median household income in Blairsville borough is $46,082, with the highest median household income of $49,821 found in the 65+ years age bracket for the primary householder. A total of 514 households (34.4%) fall into this category. Meanwhile, the 15 to 24 years age bracket for the primary householder has the lowest median household income of $0, with 9 households (0.6%) in this group.
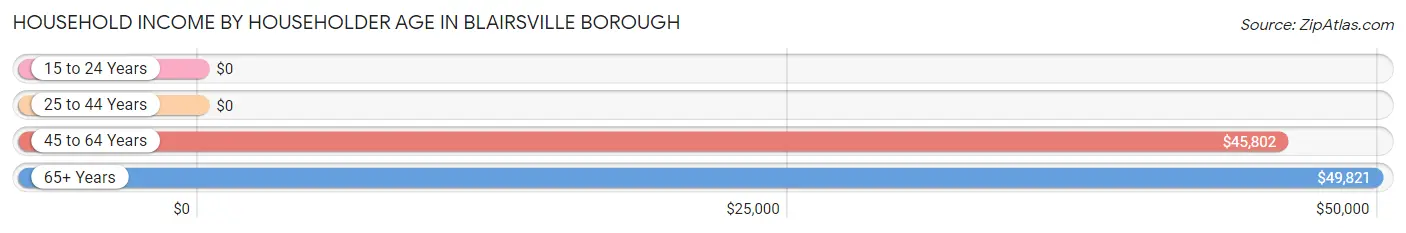
| Income Bracket | # Households | Median Income |
| 15 to 24 Years | 9 (0.6%) | $0 |
| 25 to 44 Years | 356 (23.8%) | $0 |
| 45 to 64 Years | 617 (41.2%) | $45,802 |
| 65+ Years | 514 (34.4%) | $49,821 |
| Total | 1,496 (100.0%) | $46,082 |
Poverty in Blairsville borough
Income Below Poverty by Sex and Age in Blairsville borough
With 15.3% poverty level for males and 20.5% for females among the residents of Blairsville borough, 12 to 14 year old males and 15 year old females are the most vulnerable to poverty, with 33 males (71.7%) and 35 females (100.0%) in their respective age groups living below the poverty level.
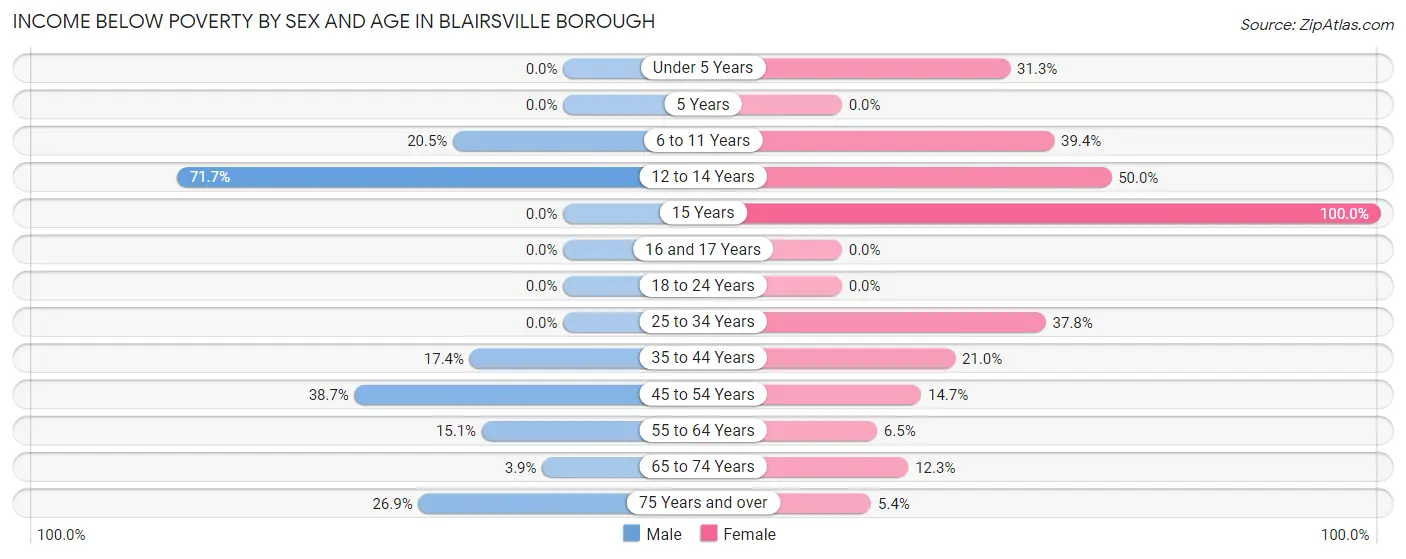
| Age Bracket | Male | Female |
| Under 5 Years | 0 (0.0%) | 10 (31.2%) |
| 5 Years | 0 (0.0%) | 0 (0.0%) |
| 6 to 11 Years | 9 (20.4%) | 65 (39.4%) |
| 12 to 14 Years | 33 (71.7%) | 10 (50.0%) |
| 15 Years | 0 (0.0%) | 35 (100.0%) |
| 16 and 17 Years | 0 (0.0%) | 0 (0.0%) |
| 18 to 24 Years | 0 (0.0%) | 0 (0.0%) |
| 25 to 34 Years | 0 (0.0%) | 115 (37.8%) |
| 35 to 44 Years | 34 (17.3%) | 29 (21.0%) |
| 45 to 54 Years | 55 (38.7%) | 25 (14.7%) |
| 55 to 64 Years | 50 (15.1%) | 30 (6.5%) |
| 65 to 74 Years | 9 (3.9%) | 28 (12.3%) |
| 75 Years and over | 32 (26.9%) | 8 (5.4%) |
| Total | 222 (15.3%) | 355 (20.5%) |
Income Above Poverty by Sex and Age in Blairsville borough
According to the poverty statistics in Blairsville borough, males aged under 5 years and females aged 16 and 17 years are the age groups that are most secure financially, with 100.0% of males and 100.0% of females in these age groups living above the poverty line.
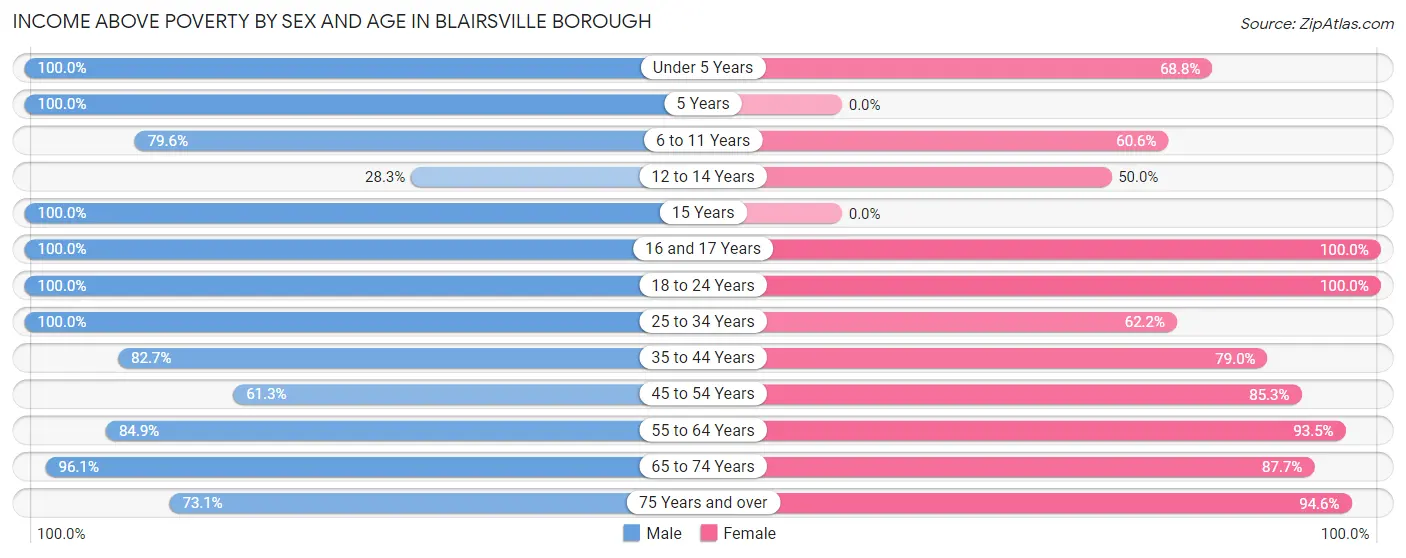
| Age Bracket | Male | Female |
| Under 5 Years | 93 (100.0%) | 22 (68.8%) |
| 5 Years | 13 (100.0%) | 0 (0.0%) |
| 6 to 11 Years | 35 (79.5%) | 100 (60.6%) |
| 12 to 14 Years | 13 (28.3%) | 10 (50.0%) |
| 15 Years | 19 (100.0%) | 0 (0.0%) |
| 16 and 17 Years | 19 (100.0%) | 12 (100.0%) |
| 18 to 24 Years | 84 (100.0%) | 24 (100.0%) |
| 25 to 34 Years | 112 (100.0%) | 189 (62.2%) |
| 35 to 44 Years | 162 (82.7%) | 109 (79.0%) |
| 45 to 54 Years | 87 (61.3%) | 145 (85.3%) |
| 55 to 64 Years | 281 (84.9%) | 430 (93.5%) |
| 65 to 74 Years | 222 (96.1%) | 199 (87.7%) |
| 75 Years and over | 87 (73.1%) | 139 (94.6%) |
| Total | 1,227 (84.7%) | 1,379 (79.5%) |
Income Below Poverty Among Married-Couple Families in Blairsville borough
The poverty statistics for married-couple families in Blairsville borough show that 3.2% or 18 of the total 566 families live below the poverty line. Families with no children have the highest poverty rate of 3.8%, comprising of 18 families. On the other hand, families with 1 or 2 children have the lowest poverty rate of 0.0%, which includes 0 families.
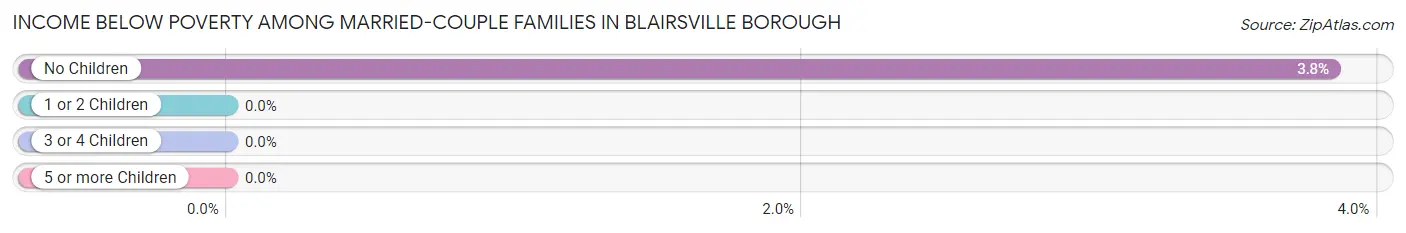
| Children | Above Poverty | Below Poverty |
| No Children | 451 (96.2%) | 18 (3.8%) |
| 1 or 2 Children | 77 (100.0%) | 0 (0.0%) |
| 3 or 4 Children | 7 (100.0%) | 0 (0.0%) |
| 5 or more Children | 13 (100.0%) | 0 (0.0%) |
| Total | 548 (96.8%) | 18 (3.2%) |
Income Below Poverty Among Single-Parent Households in Blairsville borough
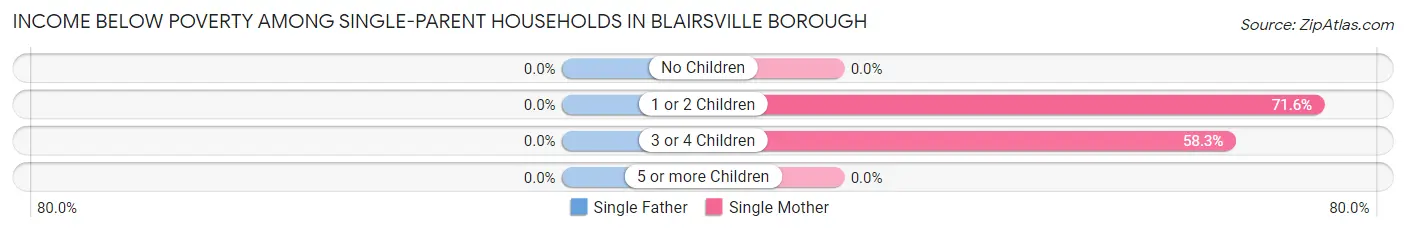
| Children | Single Father | Single Mother |
| No Children | 0 (0.0%) | 0 (0.0%) |
| 1 or 2 Children | 0 (0.0%) | 78 (71.6%) |
| 3 or 4 Children | 0 (0.0%) | 7 (58.3%) |
| 5 or more Children | 0 (0.0%) | 0 (0.0%) |
| Total | 0 (0.0%) | 85 (37.8%) |
Income Below Poverty Among Married-Couple vs Single-Parent Households in Blairsville borough
The poverty data for Blairsville borough shows that 18 of the married-couple family households (3.2%) and 85 of the single-parent households (32.0%) are living below the poverty level. Within the married-couple family households, those with no children have the highest poverty rate, with 18 households (3.8%) falling below the poverty line. Among the single-parent households, those with 3 or 4 children have the highest poverty rate, with 7 household (58.3%) living below poverty.
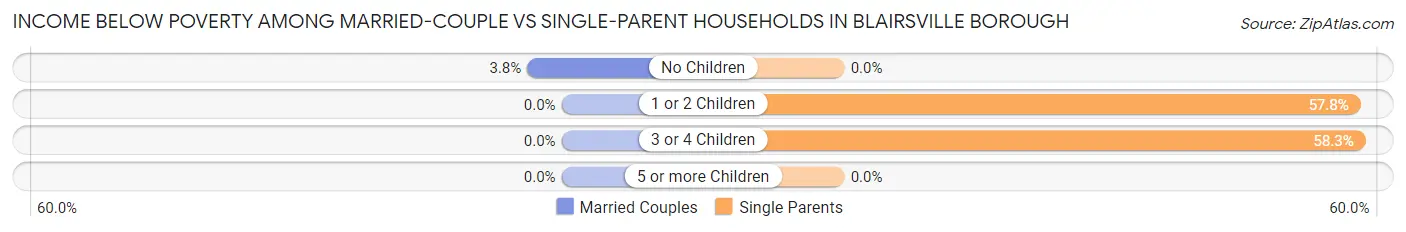
| Children | Married-Couple Families | Single-Parent Households |
| No Children | 18 (3.8%) | 0 (0.0%) |
| 1 or 2 Children | 0 (0.0%) | 78 (57.8%) |
| 3 or 4 Children | 0 (0.0%) | 7 (58.3%) |
| 5 or more Children | 0 (0.0%) | 0 (0.0%) |
| Total | 18 (3.2%) | 85 (32.0%) |
Race in Blairsville borough
The most populous races in Blairsville borough are White / Caucasian (2,760 | 85.9%), Two or more Races (242 | 7.5%), and Black / African American (190 | 5.9%).
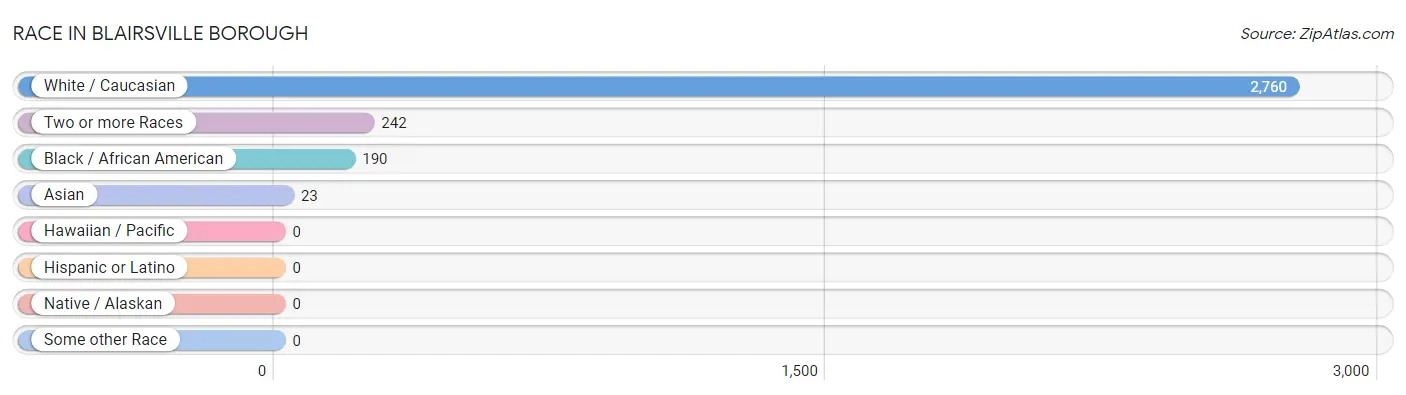
| Race | # Population | % Population |
| Asian | 23 | 0.7% |
| Black / African American | 190 | 5.9% |
| Hawaiian / Pacific | 0 | 0.0% |
| Hispanic or Latino | 0 | 0.0% |
| Native / Alaskan | 0 | 0.0% |
| White / Caucasian | 2,760 | 85.9% |
| Two or more Races | 242 | 7.5% |
| Some other Race | 0 | 0.0% |
| Total | 3,215 | 100.0% |
Ancestry in Blairsville borough
The most populous ancestries reported in Blairsville borough are German (862 | 26.8%), Irish (606 | 18.9%), English (386 | 12.0%), Italian (381 | 11.8%), and American (93 | 2.9%), together accounting for 72.4% of all Blairsville borough residents.
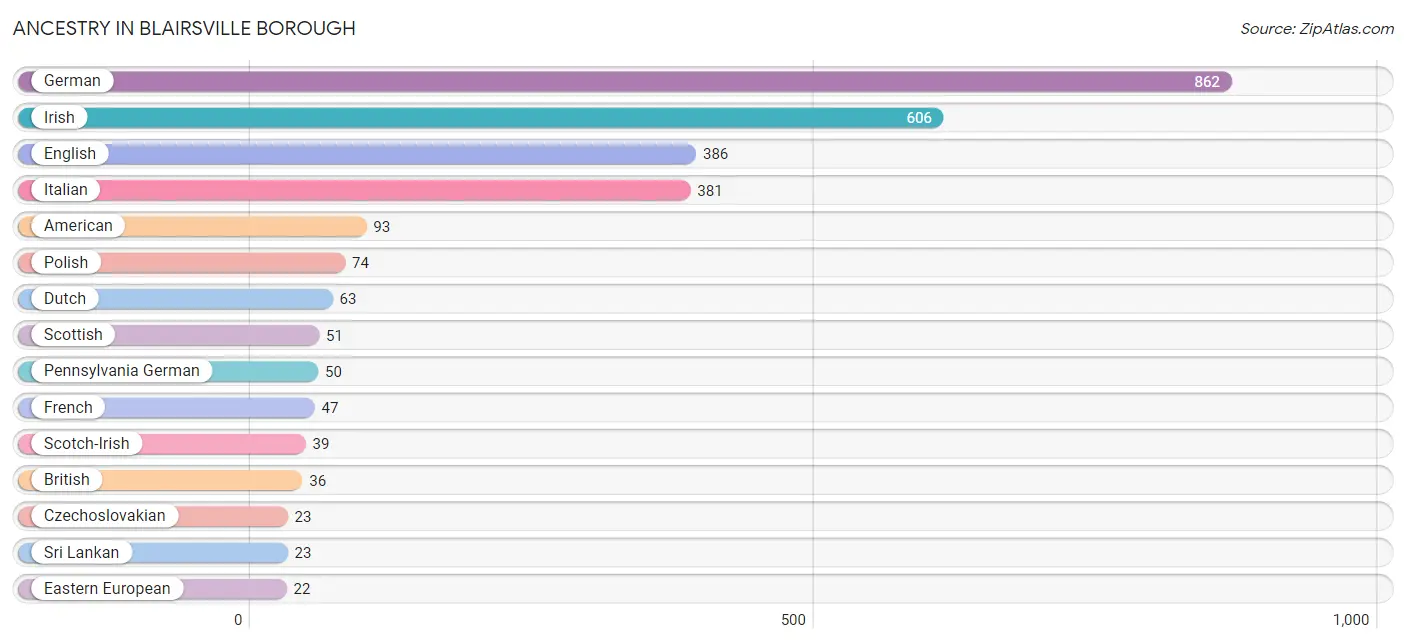
| Ancestry | # Population | % Population |
| American | 93 | 2.9% |
| British | 36 | 1.1% |
| Croatian | 16 | 0.5% |
| Czech | 14 | 0.4% |
| Czechoslovakian | 23 | 0.7% |
| Dutch | 63 | 2.0% |
| Eastern European | 22 | 0.7% |
| English | 386 | 12.0% |
| French | 47 | 1.5% |
| German | 862 | 26.8% |
| Indian (Asian) | 19 | 0.6% |
| Irish | 606 | 18.9% |
| Iroquois | 15 | 0.5% |
| Italian | 381 | 11.8% |
| Pennsylvania German | 50 | 1.6% |
| Polish | 74 | 2.3% |
| Russian | 20 | 0.6% |
| Scotch-Irish | 39 | 1.2% |
| Scottish | 51 | 1.6% |
| Slovak | 18 | 0.6% |
| Slovene | 20 | 0.6% |
| Sri Lankan | 23 | 0.7% |
| Swedish | 9 | 0.3% |
| Ukrainian | 12 | 0.4% |
| Welsh | 10 | 0.3% | View All 25 Rows |
Immigrants in Blairsville borough
The most numerous immigrant groups reported in Blairsville borough came from Asia (6 | 0.2%), South Eastern Asia (6 | 0.2%), and Vietnam (6 | 0.2%), together accounting for 0.6% of all Blairsville borough residents.
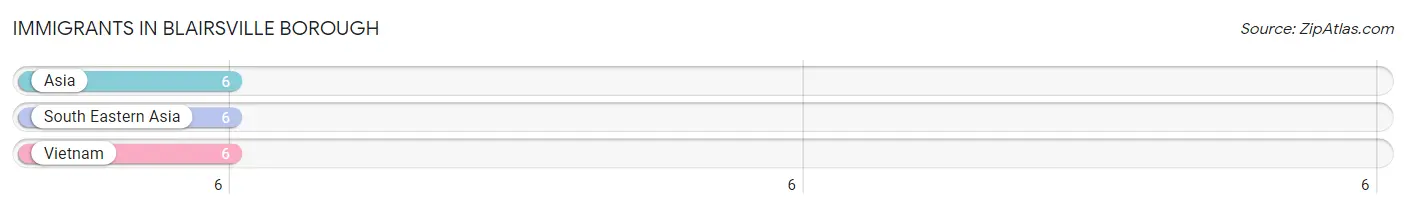
| Immigration Origin | # Population | % Population |
| Asia | 6 | 0.2% |
| South Eastern Asia | 6 | 0.2% |
| Vietnam | 6 | 0.2% | View All 3 Rows |
Sex and Age in Blairsville borough
Sex and Age in Blairsville borough
The most populous age groups in Blairsville borough are 55 to 59 Years (191 | 13.0%) for men and 60 to 64 Years (305 | 17.5%) for women.
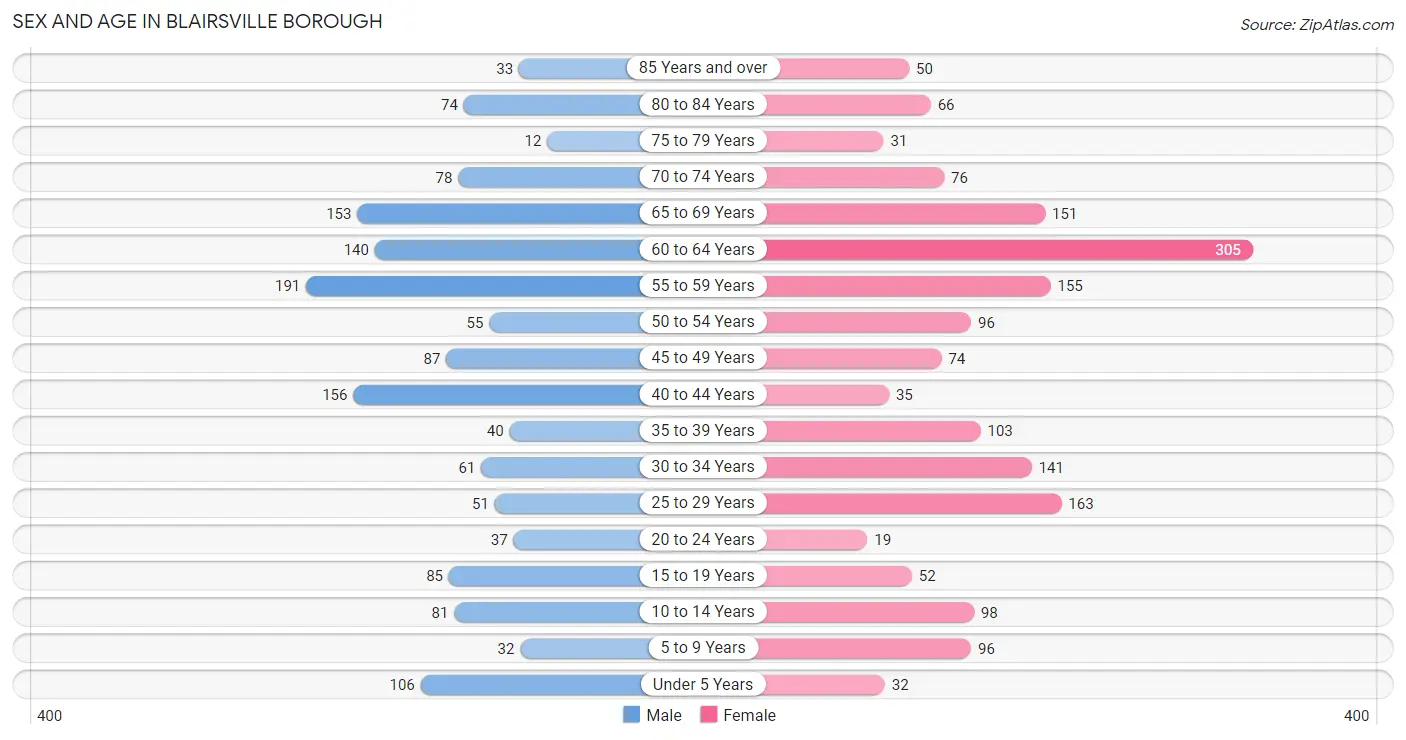
| Age Bracket | Male | Female |
| Under 5 Years | 106 (7.2%) | 32 (1.8%) |
| 5 to 9 Years | 32 (2.2%) | 96 (5.5%) |
| 10 to 14 Years | 81 (5.5%) | 98 (5.6%) |
| 15 to 19 Years | 85 (5.8%) | 52 (3.0%) |
| 20 to 24 Years | 37 (2.5%) | 19 (1.1%) |
| 25 to 29 Years | 51 (3.5%) | 163 (9.3%) |
| 30 to 34 Years | 61 (4.1%) | 141 (8.1%) |
| 35 to 39 Years | 40 (2.7%) | 103 (5.9%) |
| 40 to 44 Years | 156 (10.6%) | 35 (2.0%) |
| 45 to 49 Years | 87 (5.9%) | 74 (4.3%) |
| 50 to 54 Years | 55 (3.7%) | 96 (5.5%) |
| 55 to 59 Years | 191 (13.0%) | 155 (8.9%) |
| 60 to 64 Years | 140 (9.5%) | 305 (17.5%) |
| 65 to 69 Years | 153 (10.4%) | 151 (8.7%) |
| 70 to 74 Years | 78 (5.3%) | 76 (4.4%) |
| 75 to 79 Years | 12 (0.8%) | 31 (1.8%) |
| 80 to 84 Years | 74 (5.0%) | 66 (3.8%) |
| 85 Years and over | 33 (2.2%) | 50 (2.9%) |
| Total | 1,472 (100.0%) | 1,743 (100.0%) |
Families and Households in Blairsville borough
Median Family Size in Blairsville borough
The median family size in Blairsville borough is 2.78 persons per family, with single male/father families (41 | 4.9%) accounting for the largest median family size of 4.17 persons per family. On the other hand, married-couple families (566 | 68.0%) represent the smallest median family size with 2.63 persons per family.
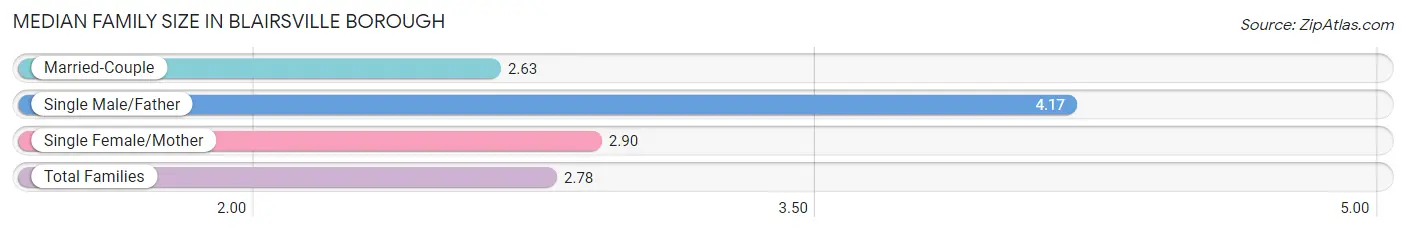
| Family Type | # Families | Family Size |
| Married-Couple | 566 (68.0%) | 2.63 |
| Single Male/Father | 41 (4.9%) | 4.17 |
| Single Female/Mother | 225 (27.0%) | 2.90 |
| Total Families | 832 (100.0%) | 2.78 |
Median Household Size in Blairsville borough
The median household size in Blairsville borough is 2.15 persons per household, with single male/father households (41 | 2.7%) accounting for the largest median household size of 4.59 persons per household. non-family households (664 | 44.4%) represent the smallest median household size with 1.17 persons per household.
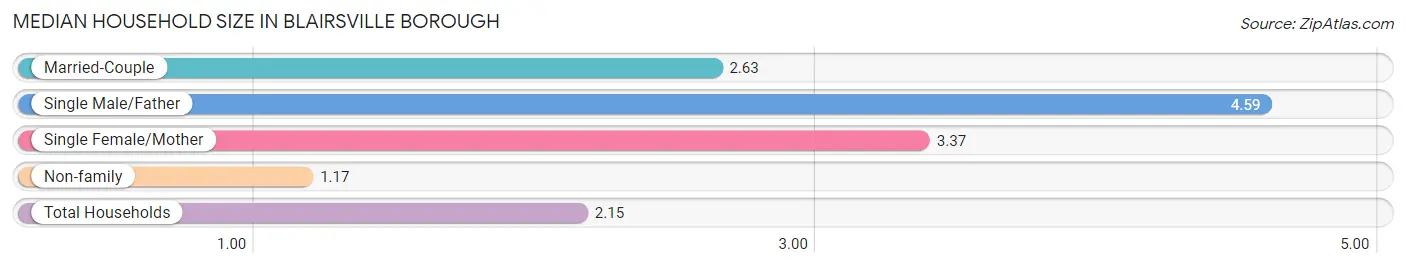
| Household Type | # Households | Household Size |
| Married-Couple | 566 (37.8%) | 2.63 |
| Single Male/Father | 41 (2.7%) | 4.59 |
| Single Female/Mother | 225 (15.0%) | 3.37 |
| Non-family | 664 (44.4%) | 1.17 |
| Total Households | 1,496 (100.0%) | 2.15 |
Household Size by Marriage Status in Blairsville borough
Out of a total of 1,496 households in Blairsville borough, 832 (55.6%) are family households, while 664 (44.4%) are nonfamily households. The most numerous type of family households are 2-person households, comprising 508, and the most common type of nonfamily households are 1-person households, comprising 561.
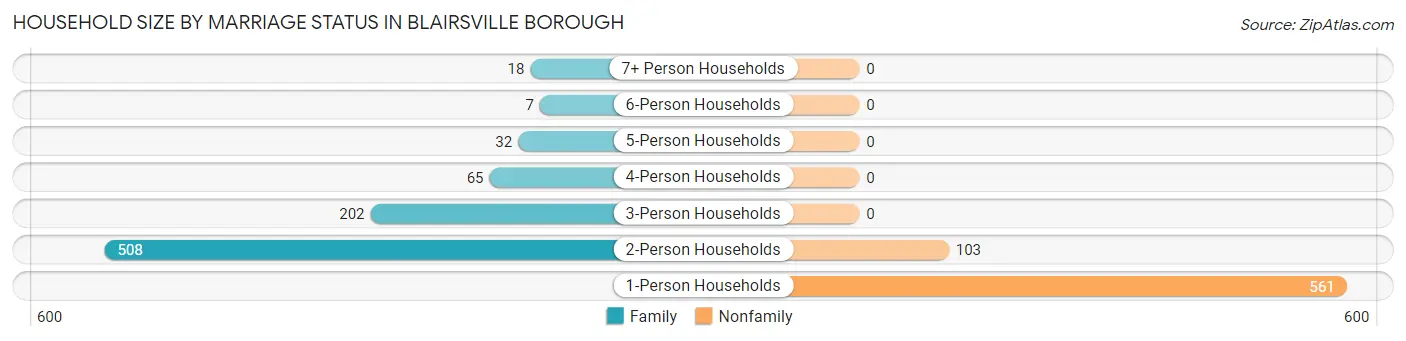
| Household Size | Family Households | Nonfamily Households |
| 1-Person Households | - | 561 (37.5%) |
| 2-Person Households | 508 (34.0%) | 103 (6.9%) |
| 3-Person Households | 202 (13.5%) | 0 (0.0%) |
| 4-Person Households | 65 (4.3%) | 0 (0.0%) |
| 5-Person Households | 32 (2.1%) | 0 (0.0%) |
| 6-Person Households | 7 (0.5%) | 0 (0.0%) |
| 7+ Person Households | 18 (1.2%) | 0 (0.0%) |
| Total | 832 (55.6%) | 664 (44.4%) |
Female Fertility in Blairsville borough
Fertility by Age in Blairsville borough
Average fertility rate in Blairsville borough is 126.0 births per 1,000 women. Women in the age bracket of 20 to 34 years have the highest fertility rate with 232.0 births per 1,000 women. Women in the age bracket of 20 to 34 years acount for 100.0% of all women with births.
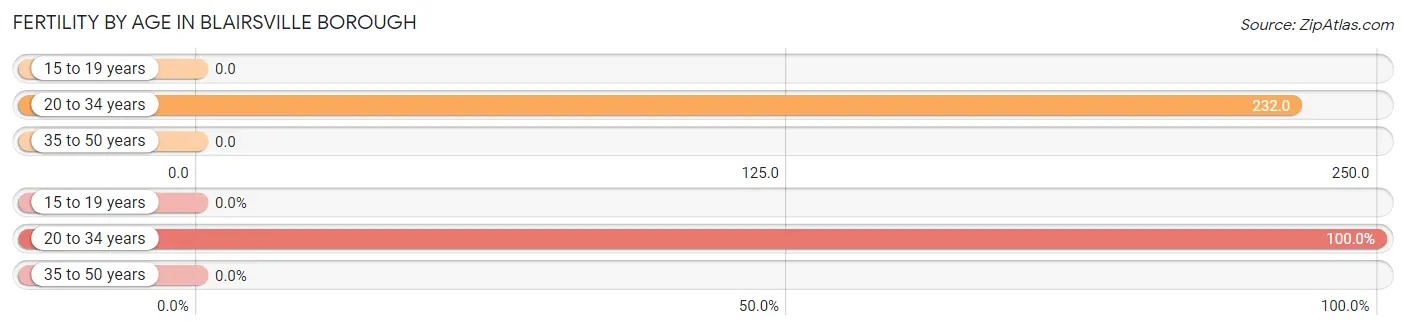
| Age Bracket | Women with Births | Births / 1,000 Women |
| 15 to 19 years | 0 (0.0%) | 0.0 |
| 20 to 34 years | 75 (100.0%) | 232.0 |
| 35 to 50 years | 0 (0.0%) | 0.0 |
| Total | 75 (100.0%) | 126.0 |
Fertility by Age by Marriage Status in Blairsville borough
22.7% of women with births (75) in Blairsville borough are married. The highest percentage of unmarried women with births falls into 20 to 34 years age bracket with 77.3% of them unmarried at the time of birth, while the lowest percentage of unmarried women with births belong to 20 to 34 years age bracket with 77.3% of them unmarried.
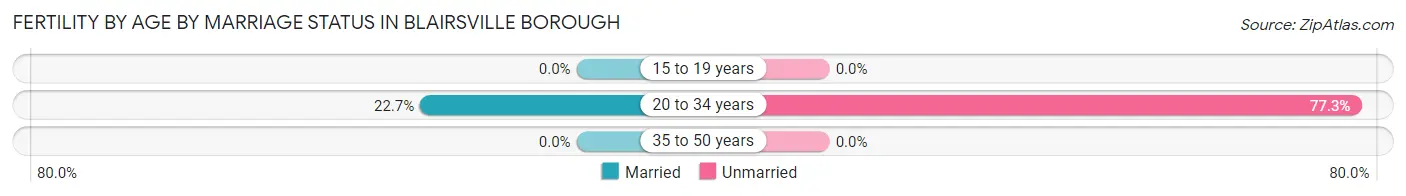
| Age Bracket | Married | Unmarried |
| 15 to 19 years | 0 (0.0%) | 0 (0.0%) |
| 20 to 34 years | 17 (22.7%) | 58 (77.3%) |
| 35 to 50 years | 0 (0.0%) | 0 (0.0%) |
| Total | 17 (22.7%) | 58 (77.3%) |
Fertility by Education in Blairsville borough
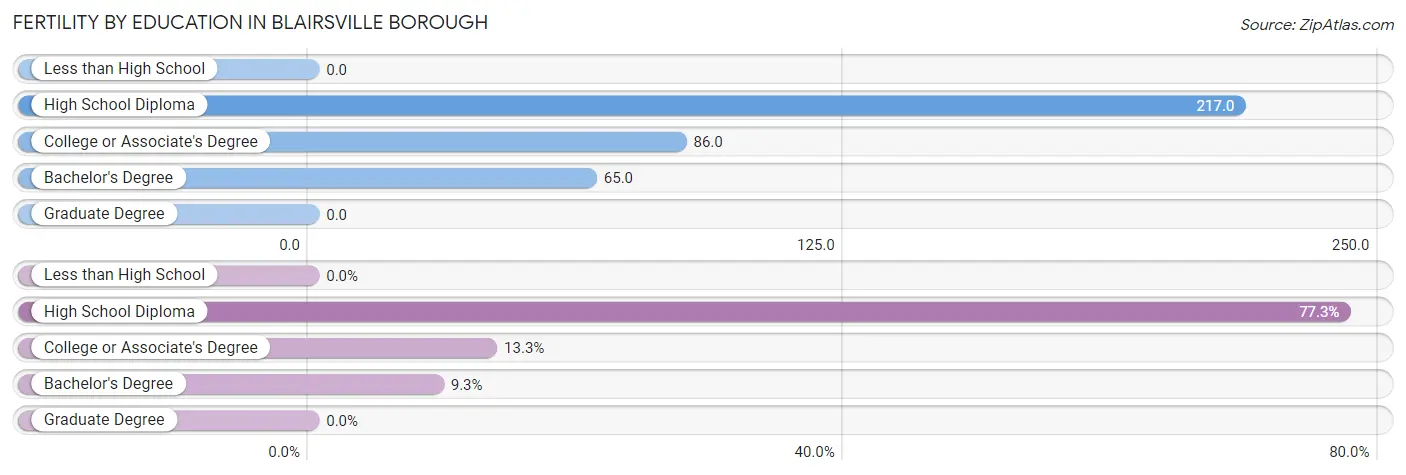
| Educational Attainment | Women with Births | Births / 1,000 Women |
| Less than High School | 0 (0.0%) | 0.0 |
| High School Diploma | 58 (77.3%) | 217.0 |
| College or Associate's Degree | 10 (13.3%) | 86.0 |
| Bachelor's Degree | 7 (9.3%) | 65.0 |
| Graduate Degree | 0 (0.0%) | 0.0 |
| Total | 75 (100.0%) | 126.0 |
Fertility by Education by Marriage Status in Blairsville borough
77.3% of women with births in Blairsville borough are unmarried. Women with the educational attainment of college or associate's degree are most likely to be married with 100.0% of them married at childbirth, while women with the educational attainment of high school diploma are least likely to be married with 100.0% of them unmarried at childbirth.
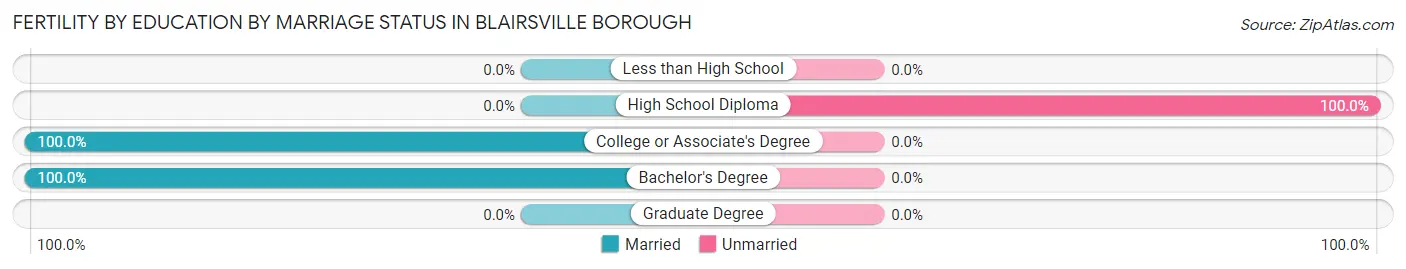
| Educational Attainment | Married | Unmarried |
| Less than High School | 0 (0.0%) | 0 (0.0%) |
| High School Diploma | 0 (0.0%) | 58 (100.0%) |
| College or Associate's Degree | 10 (100.0%) | 0 (0.0%) |
| Bachelor's Degree | 7 (100.0%) | 0 (0.0%) |
| Graduate Degree | 0 (0.0%) | 0 (0.0%) |
| Total | 17 (22.7%) | 58 (77.3%) |
Employment Characteristics in Blairsville borough
Employment by Class of Employer in Blairsville borough
Among the 1,467 employed individuals in Blairsville borough, private company employees (1,072 | 73.1%), local government employees (137 | 9.3%), and state government employees (130 | 8.9%) make up the most common classes of employment.
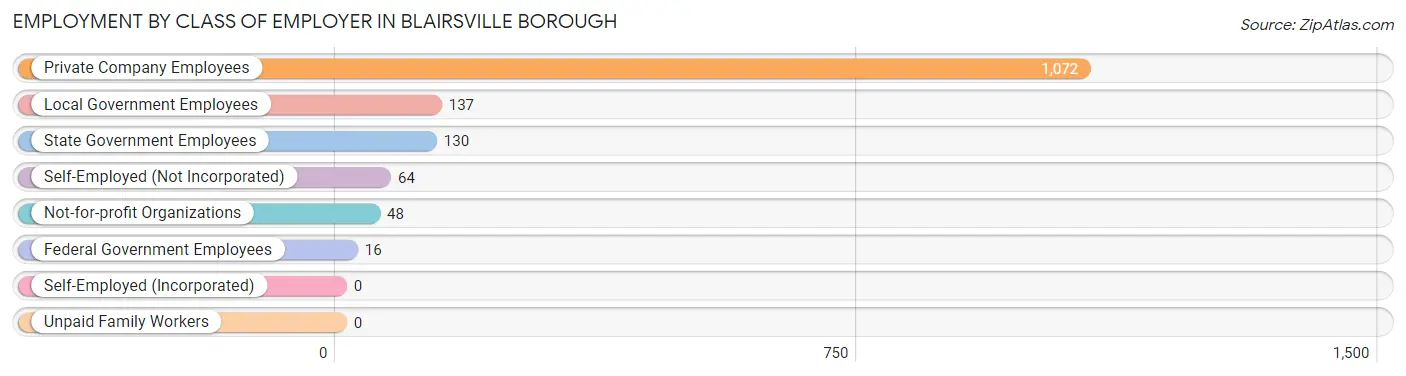
| Employer Class | # Employees | % Employees |
| Private Company Employees | 1,072 | 73.1% |
| Self-Employed (Incorporated) | 0 | 0.0% |
| Self-Employed (Not Incorporated) | 64 | 4.4% |
| Not-for-profit Organizations | 48 | 3.3% |
| Local Government Employees | 137 | 9.3% |
| State Government Employees | 130 | 8.9% |
| Federal Government Employees | 16 | 1.1% |
| Unpaid Family Workers | 0 | 0.0% |
| Total | 1,467 | 100.0% |
Employment Status by Age in Blairsville borough
According to the labor force statistics for Blairsville borough, out of the total population over 16 years of age (2,716), 55.6% or 1,510 individuals are in the labor force, with 1.8% or 27 of them unemployed. The age group with the highest labor force participation rate is 25 to 29 years, with 100.0% or 214 individuals in the labor force. Within the labor force, the 65 to 74 years age range has the highest percentage of unemployed individuals, with 18.6% or 18 of them being unemployed.
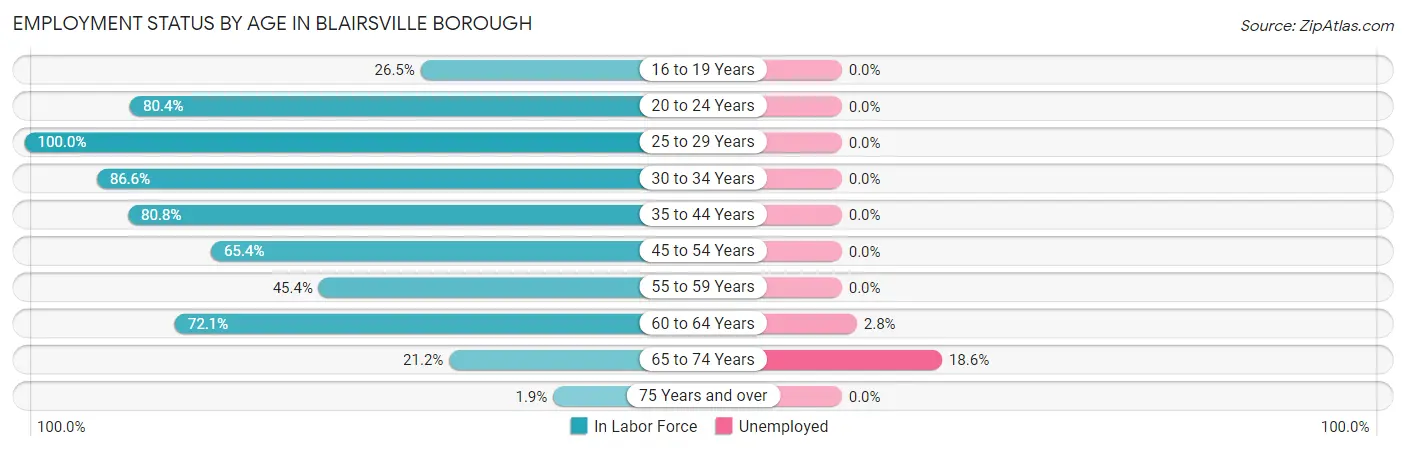
| Age Bracket | In Labor Force | Unemployed |
| 16 to 19 Years | 22 (26.5%) | 0 (0.0%) |
| 20 to 24 Years | 45 (80.4%) | 0 (0.0%) |
| 25 to 29 Years | 214 (100.0%) | 0 (0.0%) |
| 30 to 34 Years | 175 (86.6%) | 0 (0.0%) |
| 35 to 44 Years | 270 (80.8%) | 0 (0.0%) |
| 45 to 54 Years | 204 (65.4%) | 0 (0.0%) |
| 55 to 59 Years | 157 (45.4%) | 0 (0.0%) |
| 60 to 64 Years | 321 (72.1%) | 9 (2.8%) |
| 65 to 74 Years | 97 (21.2%) | 18 (18.6%) |
| 75 Years and over | 5 (1.9%) | 0 (0.0%) |
| Total | 1,510 (55.6%) | 27 (1.8%) |
Employment Status by Educational Attainment in Blairsville borough
According to labor force statistics for Blairsville borough, 72.4% of individuals (1,342) out of the total population between 25 and 64 years of age (1,853) are in the labor force, with 0.7% or 9 of them being unemployed. The group with the highest labor force participation rate are those with the educational attainment of bachelor's degree or higher, with 94.7% or 301 individuals in the labor force. Within the labor force, individuals with college / associate degree education have the highest percentage of unemployment, with 2.4% or 9 of them being unemployed.
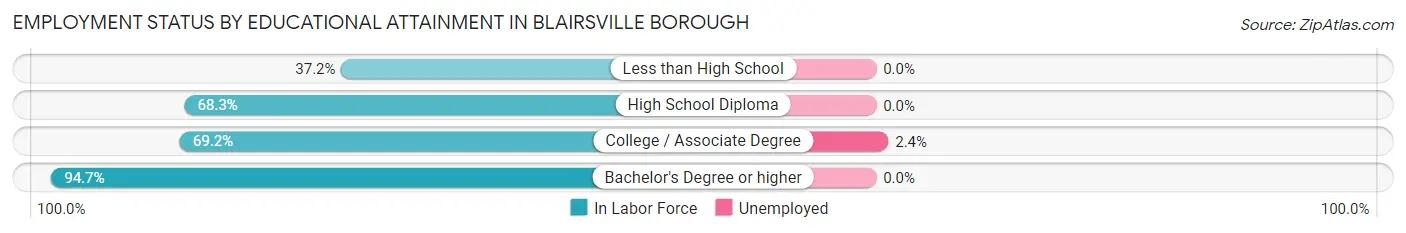
| Educational Attainment | In Labor Force | Unemployed |
| Less than High School | 16 (37.2%) | 0 (0.0%) |
| High School Diploma | 651 (68.3%) | 0 (0.0%) |
| College / Associate Degree | 373 (69.2%) | 13 (2.4%) |
| Bachelor's Degree or higher | 301 (94.7%) | 0 (0.0%) |
| Total | 1,342 (72.4%) | 13 (0.7%) |
Employment Occupations by Sex in Blairsville borough
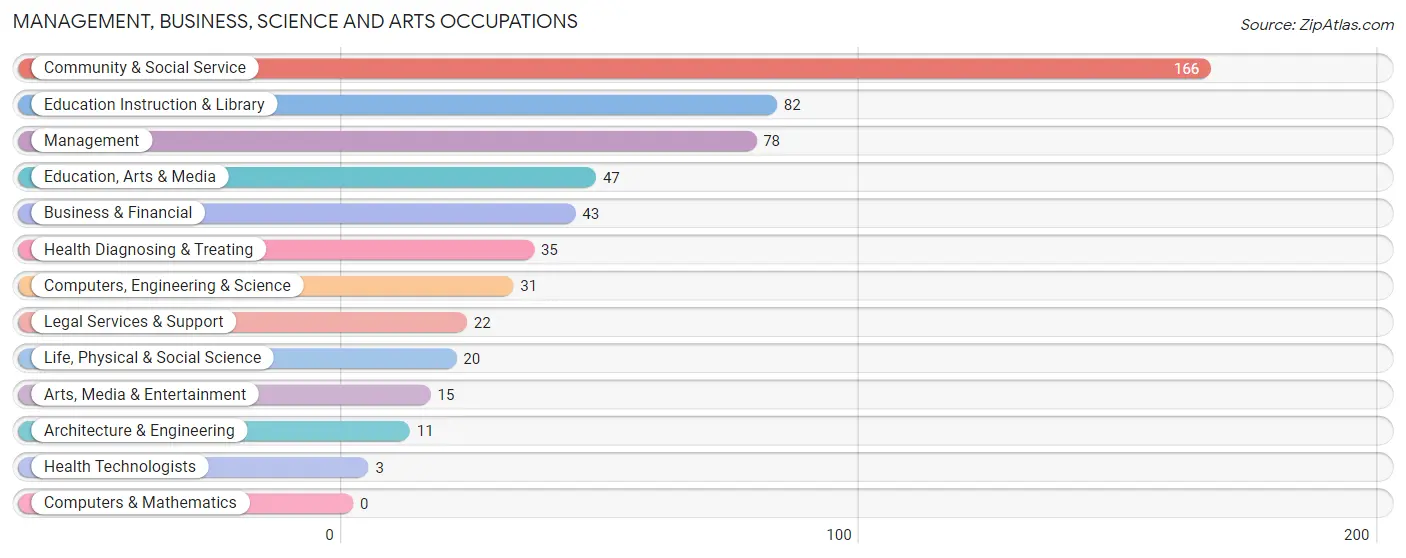
Management, Business, Science and Arts Occupations
The most common Management, Business, Science and Arts occupations in Blairsville borough are Community & Social Service (166 | 11.2%), Education Instruction & Library (82 | 5.5%), Management (78 | 5.3%), Education, Arts & Media (47 | 3.2%), and Business & Financial (43 | 2.9%).
Management, Business, Science and Arts Occupations by Sex
Within the Management, Business, Science and Arts occupations in Blairsville borough, the most male-oriented occupations are Architecture & Engineering (100.0%), Arts, Media & Entertainment (100.0%), and Health Technologists (100.0%), while the most female-oriented occupations are Business & Financial (100.0%), Life, Physical & Social Science (100.0%), and Legal Services & Support (100.0%).
| Occupation | Male | Female |
| Management | 68 (87.2%) | 10 (12.8%) |
| Business & Financial | 0 (0.0%) | 43 (100.0%) |
| Computers, Engineering & Science | 11 (35.5%) | 20 (64.5%) |
| Computers & Mathematics | 0 (0.0%) | 0 (0.0%) |
| Architecture & Engineering | 11 (100.0%) | 0 (0.0%) |
| Life, Physical & Social Science | 0 (0.0%) | 20 (100.0%) |
| Community & Social Service | 31 (18.7%) | 135 (81.3%) |
| Education, Arts & Media | 7 (14.9%) | 40 (85.1%) |
| Legal Services & Support | 0 (0.0%) | 22 (100.0%) |
| Education Instruction & Library | 9 (11.0%) | 73 (89.0%) |
| Arts, Media & Entertainment | 15 (100.0%) | 0 (0.0%) |
| Health Diagnosing & Treating | 3 (8.6%) | 32 (91.4%) |
| Health Technologists | 3 (100.0%) | 0 (0.0%) |
| Total (Category) | 113 (32.0%) | 240 (68.0%) |
| Total (Overall) | 542 (36.5%) | 941 (63.4%) |
Services Occupations
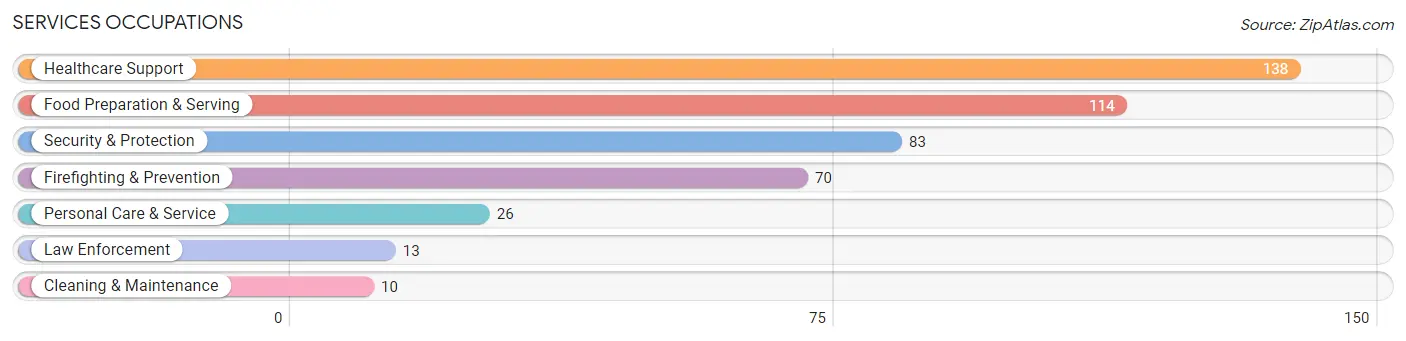
The most common Services occupations in Blairsville borough are Healthcare Support (138 | 9.3%), Food Preparation & Serving (114 | 7.7%), Security & Protection (83 | 5.6%), Firefighting & Prevention (70 | 4.7%), and Personal Care & Service (26 | 1.8%).
Services Occupations by Sex
Within the Services occupations in Blairsville borough, the most male-oriented occupations are Law Enforcement (100.0%), Personal Care & Service (26.9%), and Security & Protection (15.7%), while the most female-oriented occupations are Firefighting & Prevention (100.0%), Cleaning & Maintenance (100.0%), and Healthcare Support (96.4%).
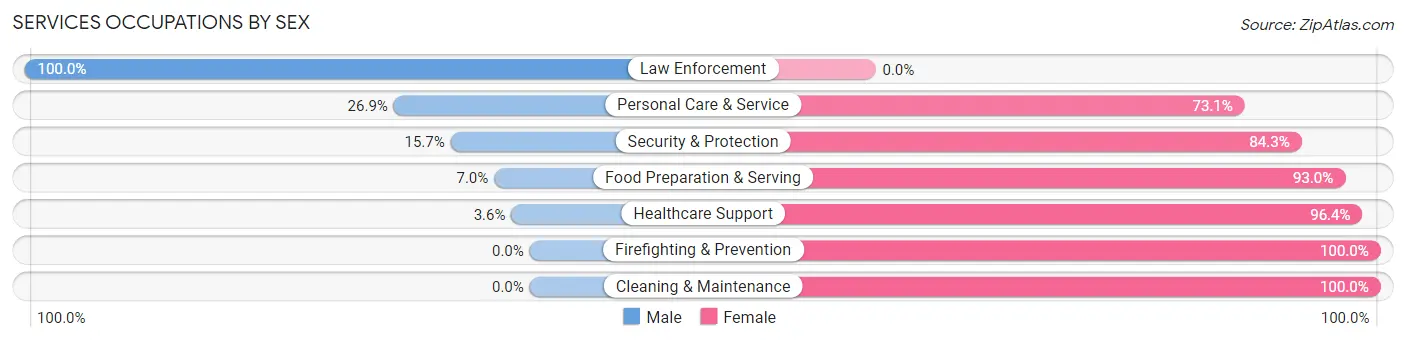
| Occupation | Male | Female |
| Healthcare Support | 5 (3.6%) | 133 (96.4%) |
| Security & Protection | 13 (15.7%) | 70 (84.3%) |
| Firefighting & Prevention | 0 (0.0%) | 70 (100.0%) |
| Law Enforcement | 13 (100.0%) | 0 (0.0%) |
| Food Preparation & Serving | 8 (7.0%) | 106 (93.0%) |
| Cleaning & Maintenance | 0 (0.0%) | 10 (100.0%) |
| Personal Care & Service | 7 (26.9%) | 19 (73.1%) |
| Total (Category) | 33 (8.9%) | 338 (91.1%) |
| Total (Overall) | 542 (36.5%) | 941 (63.4%) |
Sales and Office Occupations
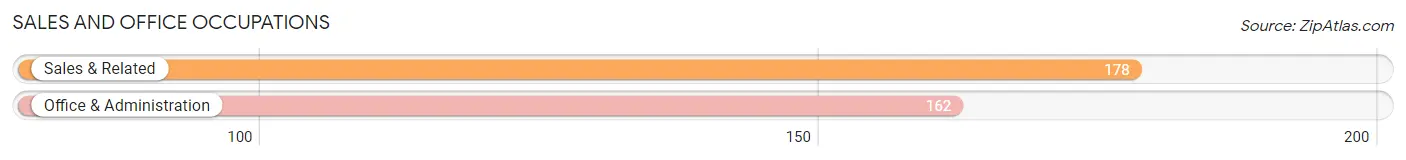
The most common Sales and Office occupations in Blairsville borough are Sales & Related (178 | 12.0%), and Office & Administration (162 | 10.9%).
Sales and Office Occupations by Sex
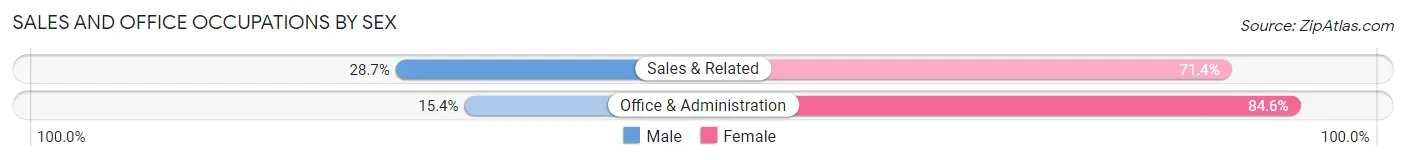
| Occupation | Male | Female |
| Sales & Related | 51 (28.6%) | 127 (71.4%) |
| Office & Administration | 25 (15.4%) | 137 (84.6%) |
| Total (Category) | 76 (22.4%) | 264 (77.6%) |
| Total (Overall) | 542 (36.5%) | 941 (63.4%) |
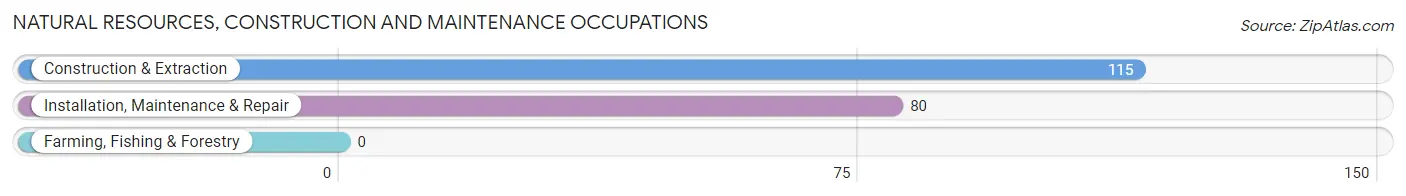
Natural Resources, Construction and Maintenance Occupations
The most common Natural Resources, Construction and Maintenance occupations in Blairsville borough are Construction & Extraction (115 | 7.7%), and Installation, Maintenance & Repair (80 | 5.4%).
Natural Resources, Construction and Maintenance Occupations by Sex
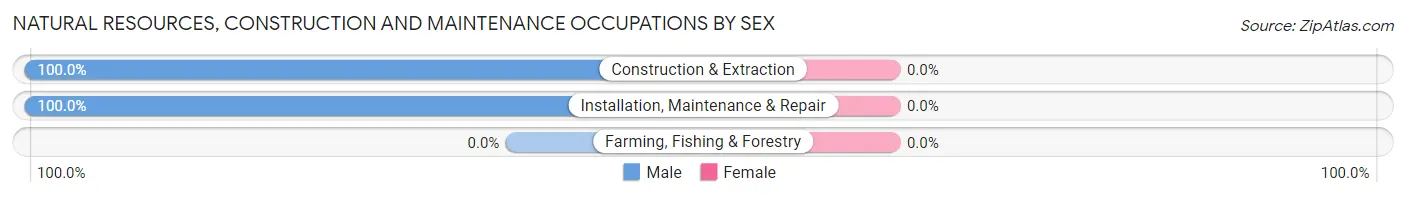
| Occupation | Male | Female |
| Farming, Fishing & Forestry | 0 (0.0%) | 0 (0.0%) |
| Construction & Extraction | 115 (100.0%) | 0 (0.0%) |
| Installation, Maintenance & Repair | 80 (100.0%) | 0 (0.0%) |
| Total (Category) | 195 (100.0%) | 0 (0.0%) |
| Total (Overall) | 542 (36.5%) | 941 (63.4%) |
Production, Transportation and Moving Occupations
The most common Production, Transportation and Moving occupations in Blairsville borough are Production (109 | 7.3%), Transportation (59 | 4.0%), and Material Moving (56 | 3.8%).
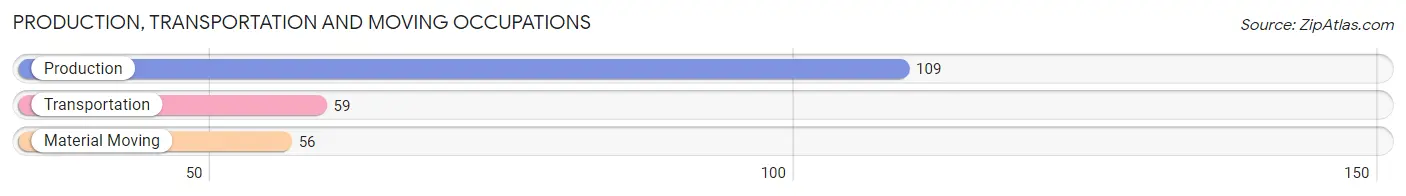
Production, Transportation and Moving Occupations by Sex
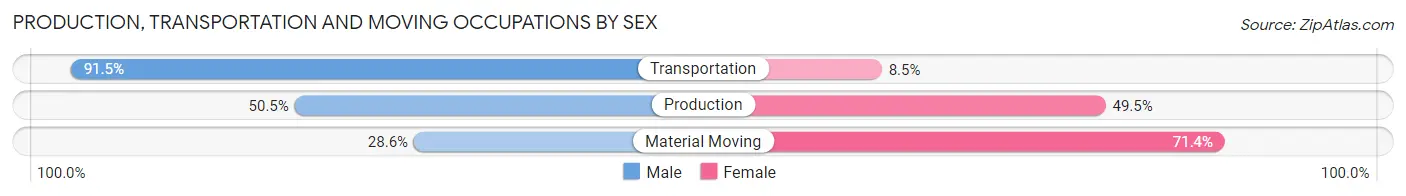
| Occupation | Male | Female |
| Production | 55 (50.5%) | 54 (49.5%) |
| Transportation | 54 (91.5%) | 5 (8.5%) |
| Material Moving | 16 (28.6%) | 40 (71.4%) |
| Total (Category) | 125 (55.8%) | 99 (44.2%) |
| Total (Overall) | 542 (36.5%) | 941 (63.4%) |
Employment Industries by Sex in Blairsville borough
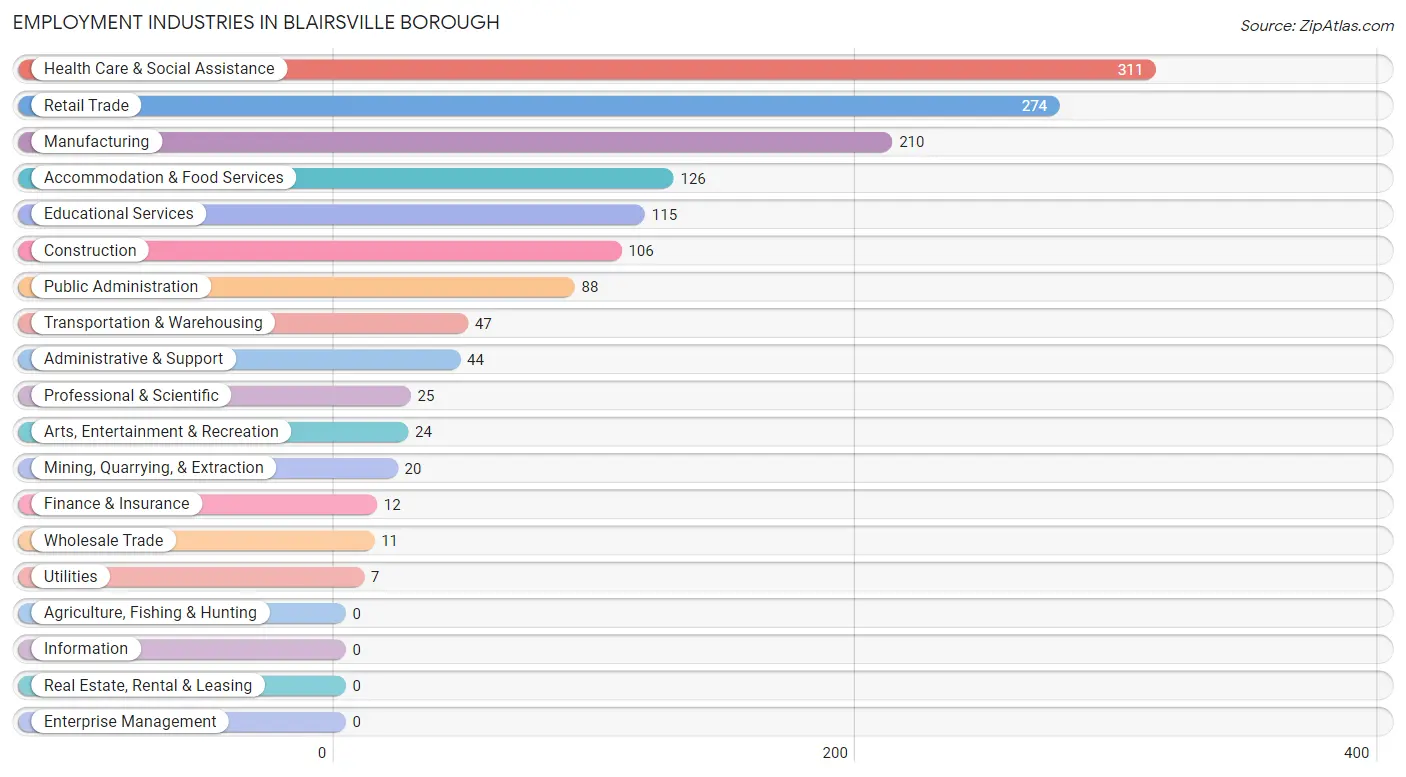
Employment Industries in Blairsville borough
The major employment industries in Blairsville borough include Health Care & Social Assistance (311 | 21.0%), Retail Trade (274 | 18.5%), Manufacturing (210 | 14.2%), Accommodation & Food Services (126 | 8.5%), and Educational Services (115 | 7.7%).
Employment Industries by Sex in Blairsville borough
The Blairsville borough industries that see more men than women are Mining, Quarrying, & Extraction (100.0%), Wholesale Trade (100.0%), and Utilities (100.0%), whereas the industries that tend to have a higher number of women are Finance & Insurance (100.0%), Professional & Scientific (100.0%), and Accommodation & Food Services (92.1%).
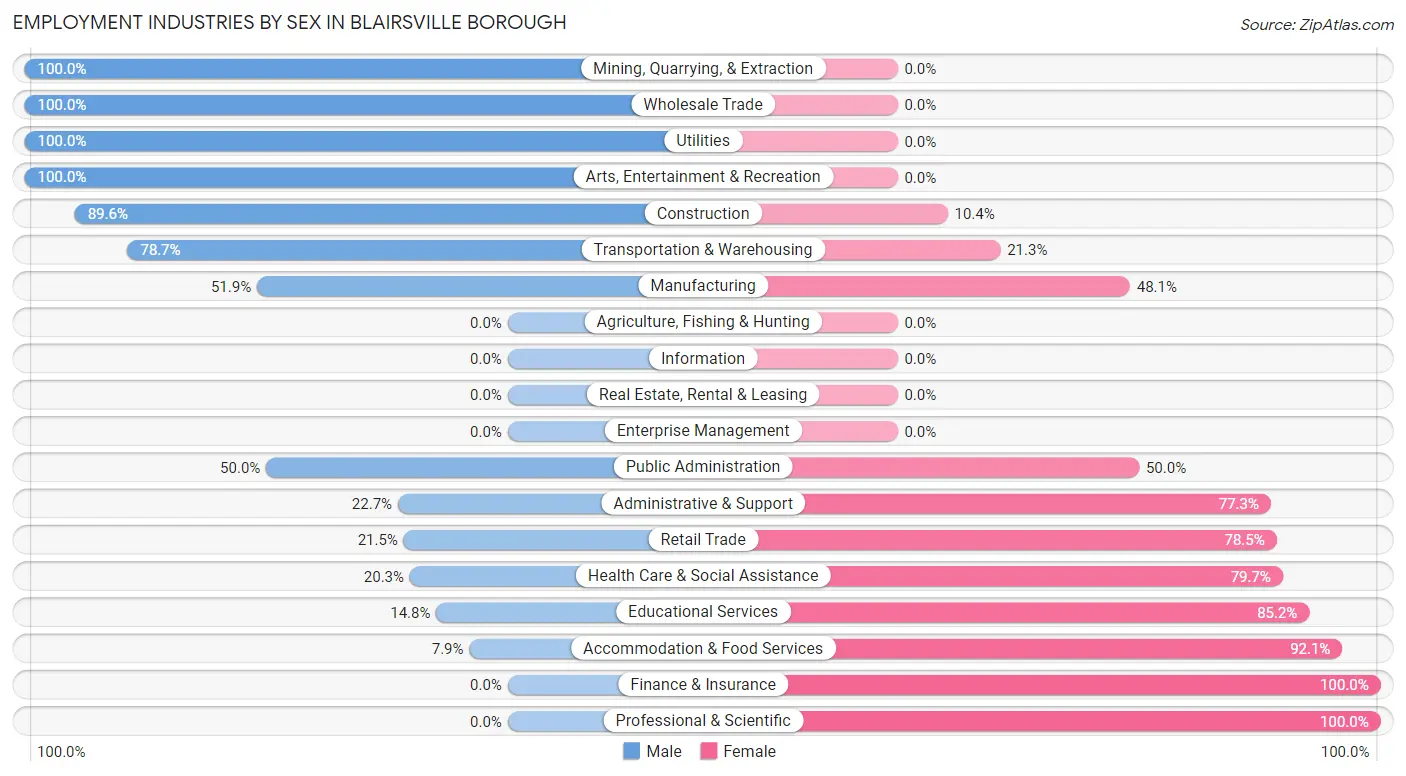
| Industry | Male | Female |
| Agriculture, Fishing & Hunting | 0 (0.0%) | 0 (0.0%) |
| Mining, Quarrying, & Extraction | 20 (100.0%) | 0 (0.0%) |
| Construction | 95 (89.6%) | 11 (10.4%) |
| Manufacturing | 109 (51.9%) | 101 (48.1%) |
| Wholesale Trade | 11 (100.0%) | 0 (0.0%) |
| Retail Trade | 59 (21.5%) | 215 (78.5%) |
| Transportation & Warehousing | 37 (78.7%) | 10 (21.3%) |
| Utilities | 7 (100.0%) | 0 (0.0%) |
| Information | 0 (0.0%) | 0 (0.0%) |
| Finance & Insurance | 0 (0.0%) | 12 (100.0%) |
| Real Estate, Rental & Leasing | 0 (0.0%) | 0 (0.0%) |
| Professional & Scientific | 0 (0.0%) | 25 (100.0%) |
| Enterprise Management | 0 (0.0%) | 0 (0.0%) |
| Administrative & Support | 10 (22.7%) | 34 (77.3%) |
| Educational Services | 17 (14.8%) | 98 (85.2%) |
| Health Care & Social Assistance | 63 (20.3%) | 248 (79.7%) |
| Arts, Entertainment & Recreation | 24 (100.0%) | 0 (0.0%) |
| Accommodation & Food Services | 10 (7.9%) | 116 (92.1%) |
| Public Administration | 44 (50.0%) | 44 (50.0%) |
| Total | 542 (36.5%) | 941 (63.4%) |
Education in Blairsville borough
School Enrollment in Blairsville borough
The most common levels of schooling among the 522 students in Blairsville borough are middle school (152 | 29.1%), elementary school (133 | 25.5%), and high school (120 | 23.0%).
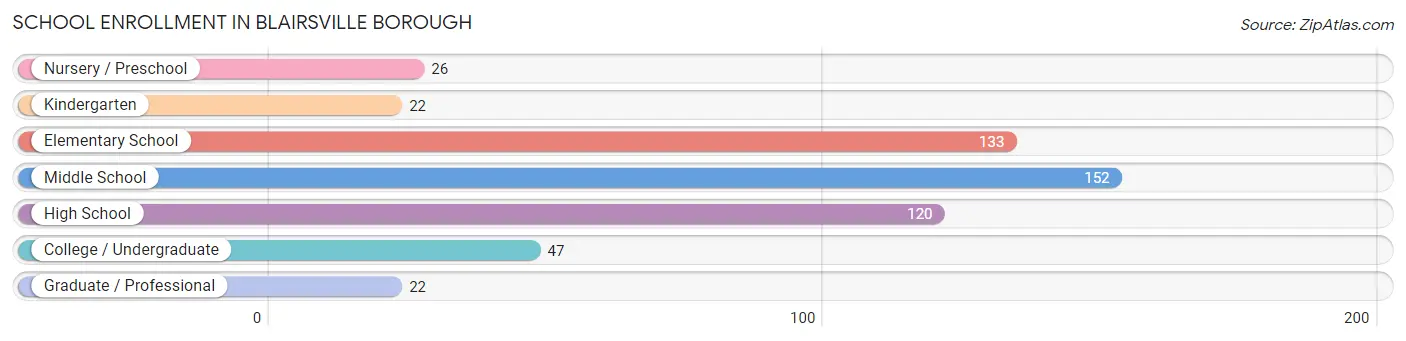
| School Level | # Students | % Students |
| Nursery / Preschool | 26 | 5.0% |
| Kindergarten | 22 | 4.2% |
| Elementary School | 133 | 25.5% |
| Middle School | 152 | 29.1% |
| High School | 120 | 23.0% |
| College / Undergraduate | 47 | 9.0% |
| Graduate / Professional | 22 | 4.2% |
| Total | 522 | 100.0% |
School Enrollment by Age by Funding Source in Blairsville borough
Out of a total of 522 students who are enrolled in schools in Blairsville borough, 84 (16.1%) attend a private institution, while the remaining 438 (83.9%) are enrolled in public schools. The age group of 3 to 4 year olds has the highest likelihood of being enrolled in private schools, with 26 (100.0% in the age bracket) enrolled. Conversely, the age group of 10 to 14 year olds has the lowest likelihood of being enrolled in a private school, with 179 (100.0% in the age bracket) attending a public institution.
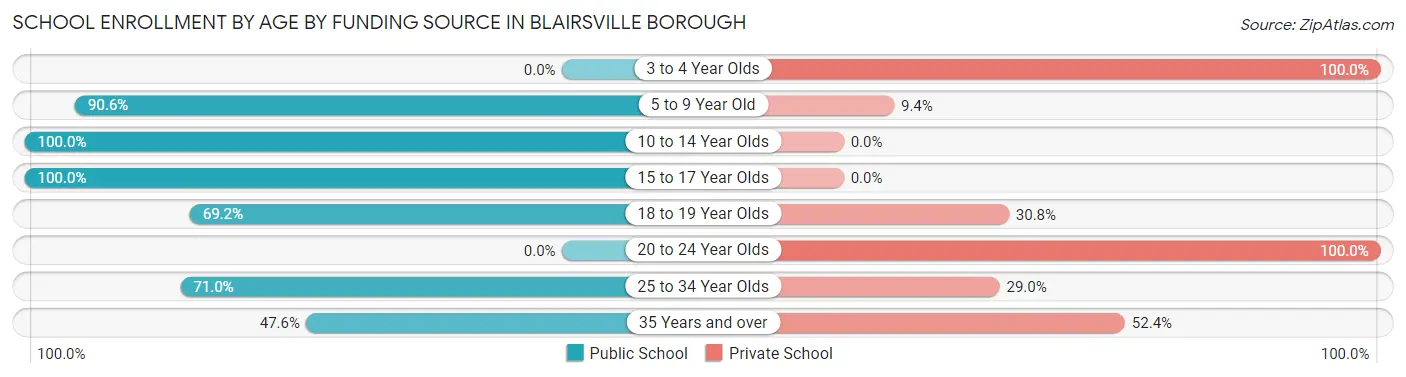
| Age Bracket | Public School | Private School |
| 3 to 4 Year Olds | 0 (0.0%) | 26 (100.0%) |
| 5 to 9 Year Old | 116 (90.6%) | 12 (9.4%) |
| 10 to 14 Year Olds | 179 (100.0%) | 0 (0.0%) |
| 15 to 17 Year Olds | 75 (100.0%) | 0 (0.0%) |
| 18 to 19 Year Olds | 36 (69.2%) | 16 (30.8%) |
| 20 to 24 Year Olds | 0 (0.0%) | 10 (100.0%) |
| 25 to 34 Year Olds | 22 (71.0%) | 9 (29.0%) |
| 35 Years and over | 10 (47.6%) | 11 (52.4%) |
| Total | 438 (83.9%) | 84 (16.1%) |
Educational Attainment by Field of Study in Blairsville borough
Education (136 | 26.5%), business (91 | 17.7%), arts & humanities (61 | 11.9%), psychology (60 | 11.7%), and engineering (44 | 8.6%) are the most common fields of study among 514 individuals in Blairsville borough who have obtained a bachelor's degree or higher.
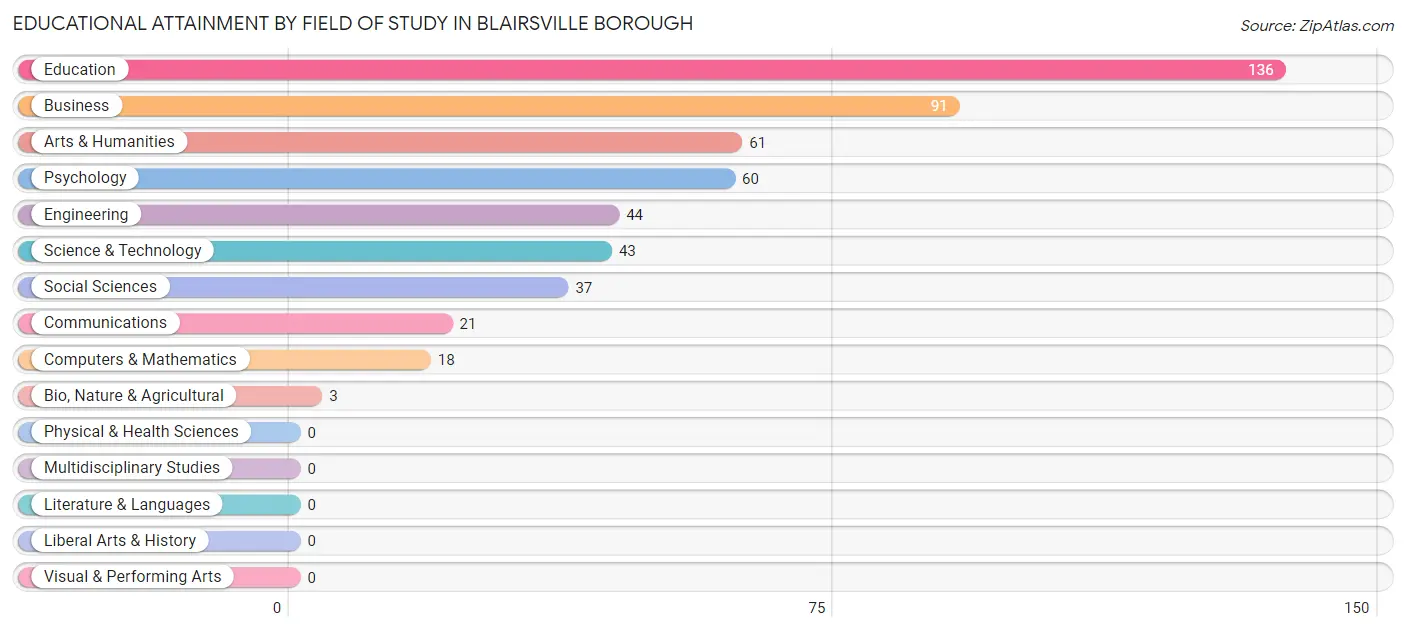
| Field of Study | # Graduates | % Graduates |
| Computers & Mathematics | 18 | 3.5% |
| Bio, Nature & Agricultural | 3 | 0.6% |
| Physical & Health Sciences | 0 | 0.0% |
| Psychology | 60 | 11.7% |
| Social Sciences | 37 | 7.2% |
| Engineering | 44 | 8.6% |
| Multidisciplinary Studies | 0 | 0.0% |
| Science & Technology | 43 | 8.4% |
| Business | 91 | 17.7% |
| Education | 136 | 26.5% |
| Literature & Languages | 0 | 0.0% |
| Liberal Arts & History | 0 | 0.0% |
| Visual & Performing Arts | 0 | 0.0% |
| Communications | 21 | 4.1% |
| Arts & Humanities | 61 | 11.9% |
| Total | 514 | 100.0% |
Transportation & Commute in Blairsville borough
Vehicle Availability by Sex in Blairsville borough
The most prevalent vehicle ownership categories in Blairsville borough are males with 2 vehicles (247, accounting for 46.2%) and females with 2 vehicles (532, making up 26.5%).
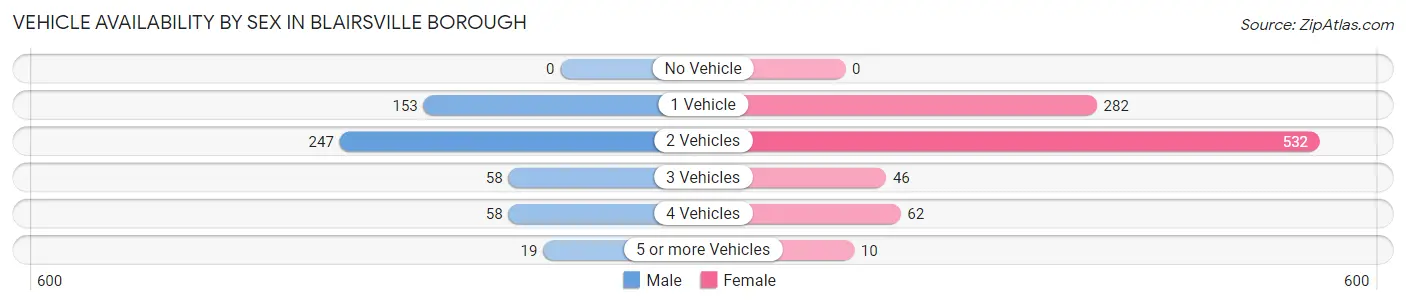
| Vehicles Available | Male | Female |
| No Vehicle | 0 (0.0%) | 0 (0.0%) |
| 1 Vehicle | 153 (28.6%) | 282 (30.3%) |
| 2 Vehicles | 247 (46.2%) | 532 (57.1%) |
| 3 Vehicles | 58 (10.8%) | 46 (4.9%) |
| 4 Vehicles | 58 (10.8%) | 62 (6.7%) |
| 5 or more Vehicles | 19 (3.5%) | 10 (1.1%) |
| Total | 535 (100.0%) | 932 (100.0%) |
Commute Time in Blairsville borough
The most frequently occuring commute durations in Blairsville borough are 5 to 9 minutes (344 commuters, 23.9%), 10 to 14 minutes (235 commuters, 16.3%), and 20 to 24 minutes (207 commuters, 14.4%).
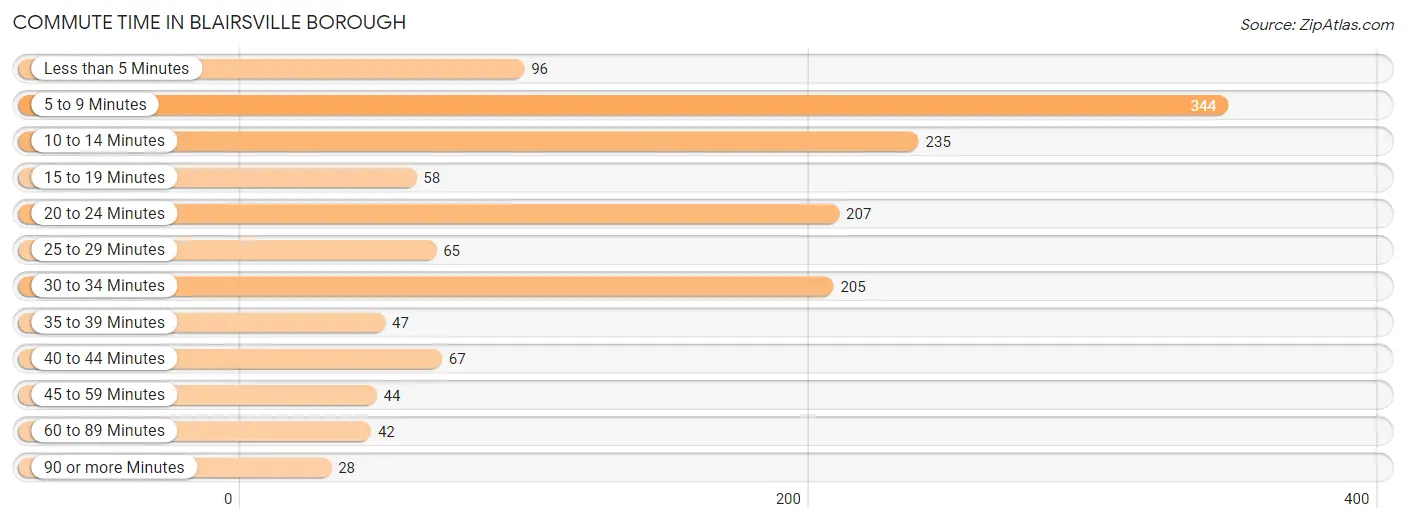
| Commute Time | # Commuters | % Commuters |
| Less than 5 Minutes | 96 | 6.7% |
| 5 to 9 Minutes | 344 | 23.9% |
| 10 to 14 Minutes | 235 | 16.3% |
| 15 to 19 Minutes | 58 | 4.0% |
| 20 to 24 Minutes | 207 | 14.4% |
| 25 to 29 Minutes | 65 | 4.5% |
| 30 to 34 Minutes | 205 | 14.3% |
| 35 to 39 Minutes | 47 | 3.3% |
| 40 to 44 Minutes | 67 | 4.7% |
| 45 to 59 Minutes | 44 | 3.1% |
| 60 to 89 Minutes | 42 | 2.9% |
| 90 or more Minutes | 28 | 1.9% |
Commute Time by Sex in Blairsville borough
The most common commute times in Blairsville borough are 30 to 34 minutes (140 commuters, 26.2%) for males and 5 to 9 minutes (274 commuters, 30.3%) for females.
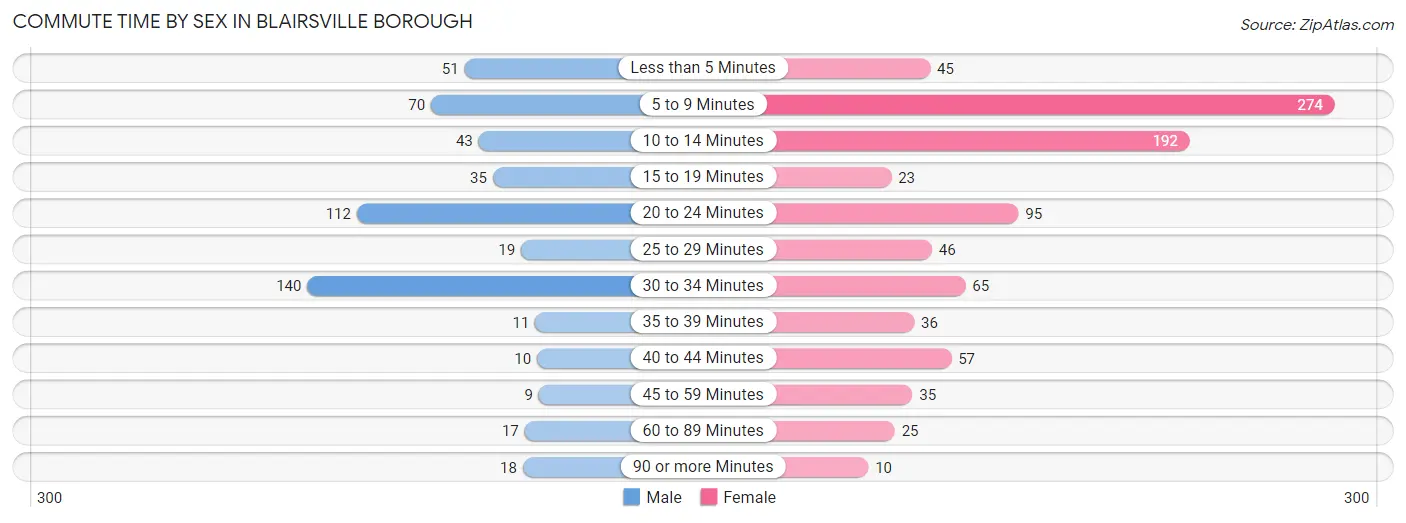
| Commute Time | Male | Female |
| Less than 5 Minutes | 51 (9.5%) | 45 (5.0%) |
| 5 to 9 Minutes | 70 (13.1%) | 274 (30.3%) |
| 10 to 14 Minutes | 43 (8.0%) | 192 (21.3%) |
| 15 to 19 Minutes | 35 (6.5%) | 23 (2.5%) |
| 20 to 24 Minutes | 112 (20.9%) | 95 (10.5%) |
| 25 to 29 Minutes | 19 (3.5%) | 46 (5.1%) |
| 30 to 34 Minutes | 140 (26.2%) | 65 (7.2%) |
| 35 to 39 Minutes | 11 (2.1%) | 36 (4.0%) |
| 40 to 44 Minutes | 10 (1.9%) | 57 (6.3%) |
| 45 to 59 Minutes | 9 (1.7%) | 35 (3.9%) |
| 60 to 89 Minutes | 17 (3.2%) | 25 (2.8%) |
| 90 or more Minutes | 18 (3.4%) | 10 (1.1%) |
Time of Departure to Work by Sex in Blairsville borough
The most frequent times of departure to work in Blairsville borough are 5:30 AM to 5:59 AM (92, 17.2%) for males and 12:00 PM to 3:59 PM (307, 34.0%) for females.
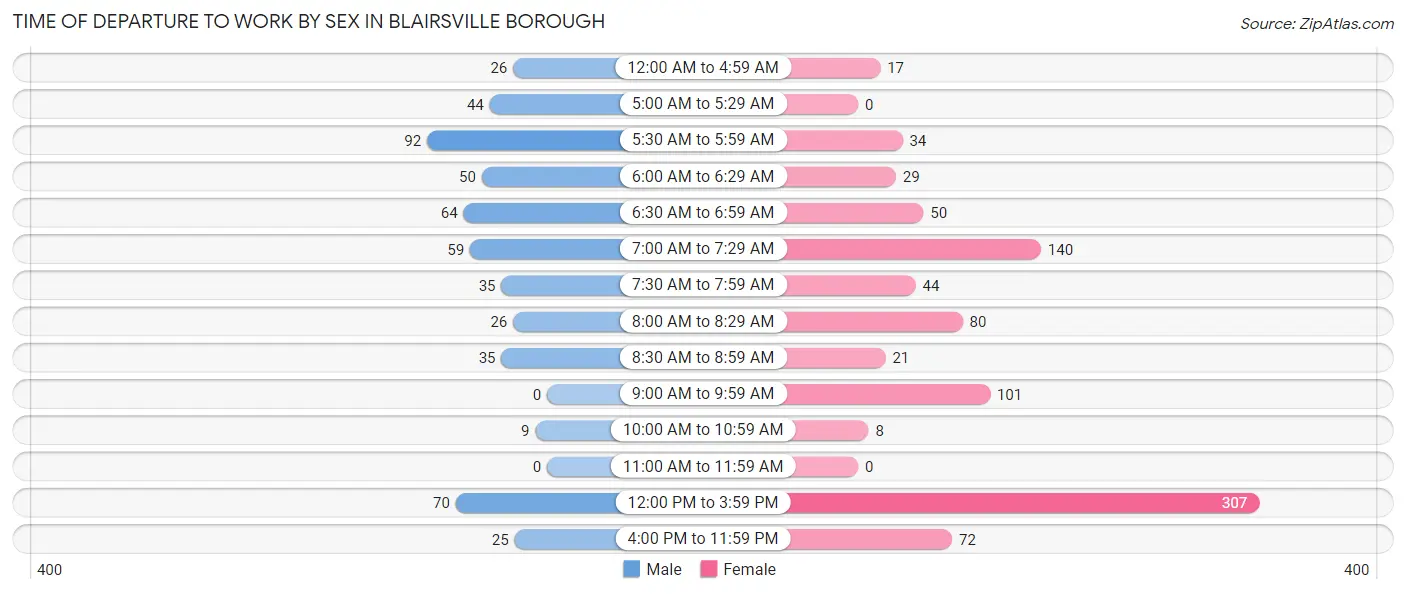
| Time of Departure | Male | Female |
| 12:00 AM to 4:59 AM | 26 (4.9%) | 17 (1.9%) |
| 5:00 AM to 5:29 AM | 44 (8.2%) | 0 (0.0%) |
| 5:30 AM to 5:59 AM | 92 (17.2%) | 34 (3.8%) |
| 6:00 AM to 6:29 AM | 50 (9.3%) | 29 (3.2%) |
| 6:30 AM to 6:59 AM | 64 (12.0%) | 50 (5.5%) |
| 7:00 AM to 7:29 AM | 59 (11.0%) | 140 (15.5%) |
| 7:30 AM to 7:59 AM | 35 (6.5%) | 44 (4.9%) |
| 8:00 AM to 8:29 AM | 26 (4.9%) | 80 (8.9%) |
| 8:30 AM to 8:59 AM | 35 (6.5%) | 21 (2.3%) |
| 9:00 AM to 9:59 AM | 0 (0.0%) | 101 (11.2%) |
| 10:00 AM to 10:59 AM | 9 (1.7%) | 8 (0.9%) |
| 11:00 AM to 11:59 AM | 0 (0.0%) | 0 (0.0%) |
| 12:00 PM to 3:59 PM | 70 (13.1%) | 307 (34.0%) |
| 4:00 PM to 11:59 PM | 25 (4.7%) | 72 (8.0%) |
| Total | 535 (100.0%) | 903 (100.0%) |
Housing Occupancy in Blairsville borough
Occupancy by Ownership in Blairsville borough
Of the total 1,496 dwellings in Blairsville borough, owner-occupied units account for 875 (58.5%), while renter-occupied units make up 621 (41.5%).
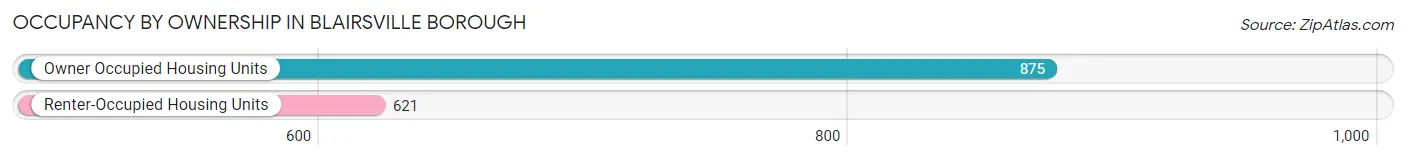
| Occupancy | # Housing Units | % Housing Units |
| Owner Occupied Housing Units | 875 | 58.5% |
| Renter-Occupied Housing Units | 621 | 41.5% |
| Total Occupied Housing Units | 1,496 | 100.0% |
Occupancy by Household Size in Blairsville borough
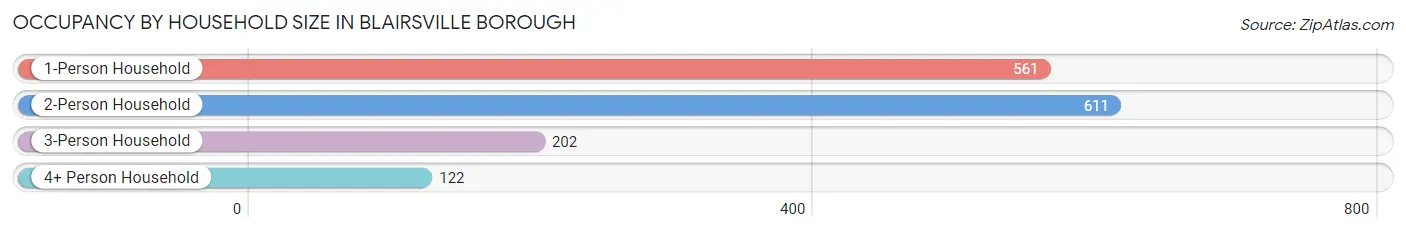
| Household Size | # Housing Units | % Housing Units |
| 1-Person Household | 561 | 37.5% |
| 2-Person Household | 611 | 40.8% |
| 3-Person Household | 202 | 13.5% |
| 4+ Person Household | 122 | 8.2% |
| Total Housing Units | 1,496 | 100.0% |
Occupancy by Ownership by Household Size in Blairsville borough
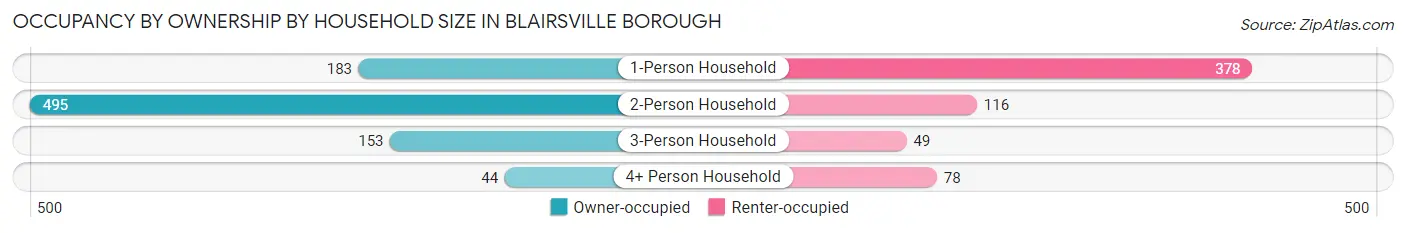
| Household Size | Owner-occupied | Renter-occupied |
| 1-Person Household | 183 (32.6%) | 378 (67.4%) |
| 2-Person Household | 495 (81.0%) | 116 (19.0%) |
| 3-Person Household | 153 (75.7%) | 49 (24.3%) |
| 4+ Person Household | 44 (36.1%) | 78 (63.9%) |
| Total Housing Units | 875 (58.5%) | 621 (41.5%) |
Occupancy by Educational Attainment in Blairsville borough
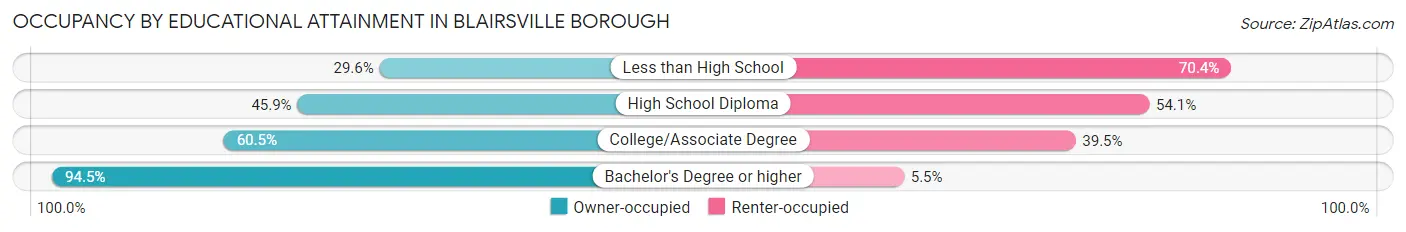
| Household Size | Owner-occupied | Renter-occupied |
| Less than High School | 16 (29.6%) | 38 (70.4%) |
| High School Diploma | 375 (45.9%) | 442 (54.1%) |
| College/Associate Degree | 190 (60.5%) | 124 (39.5%) |
| Bachelor's Degree or higher | 294 (94.5%) | 17 (5.5%) |
Occupancy by Age of Householder in Blairsville borough
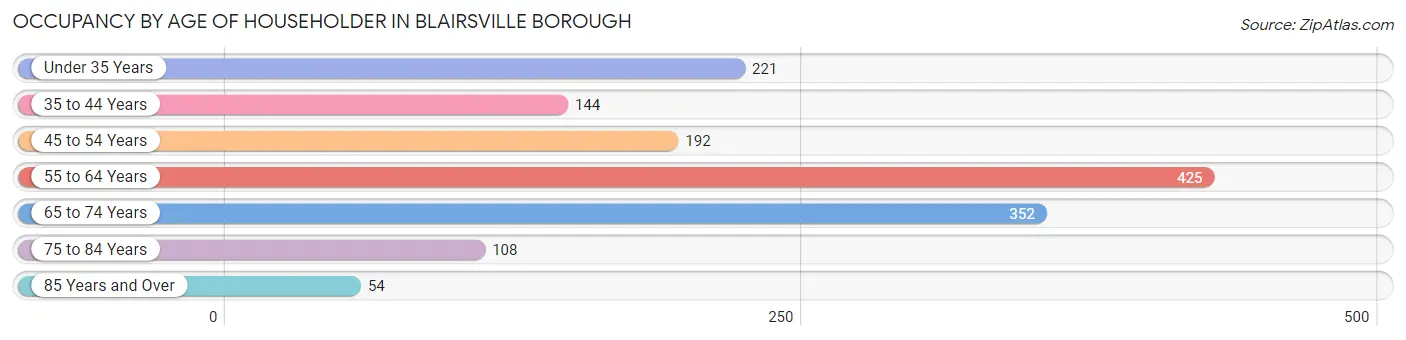
| Age Bracket | # Households | % Households |
| Under 35 Years | 221 | 14.8% |
| 35 to 44 Years | 144 | 9.6% |
| 45 to 54 Years | 192 | 12.8% |
| 55 to 64 Years | 425 | 28.4% |
| 65 to 74 Years | 352 | 23.5% |
| 75 to 84 Years | 108 | 7.2% |
| 85 Years and Over | 54 | 3.6% |
| Total | 1,496 | 100.0% |
Housing Finances in Blairsville borough
Median Income by Occupancy in Blairsville borough
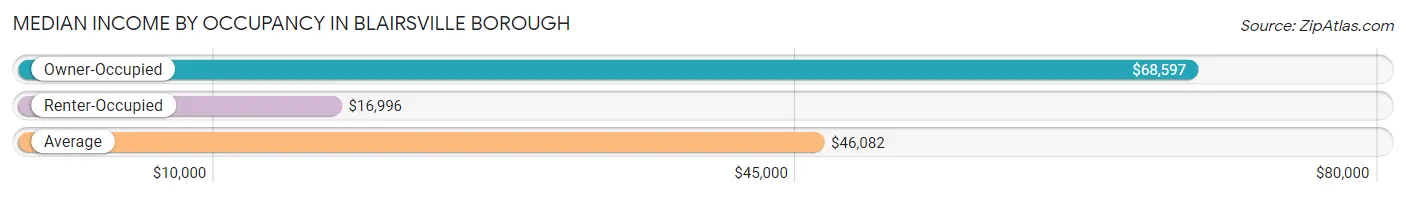
| Occupancy Type | # Households | Median Income |
| Owner-Occupied | 875 (58.5%) | $68,597 |
| Renter-Occupied | 621 (41.5%) | $16,996 |
| Average | 1,496 (100.0%) | $46,082 |
Occupancy by Householder Income Bracket in Blairsville borough
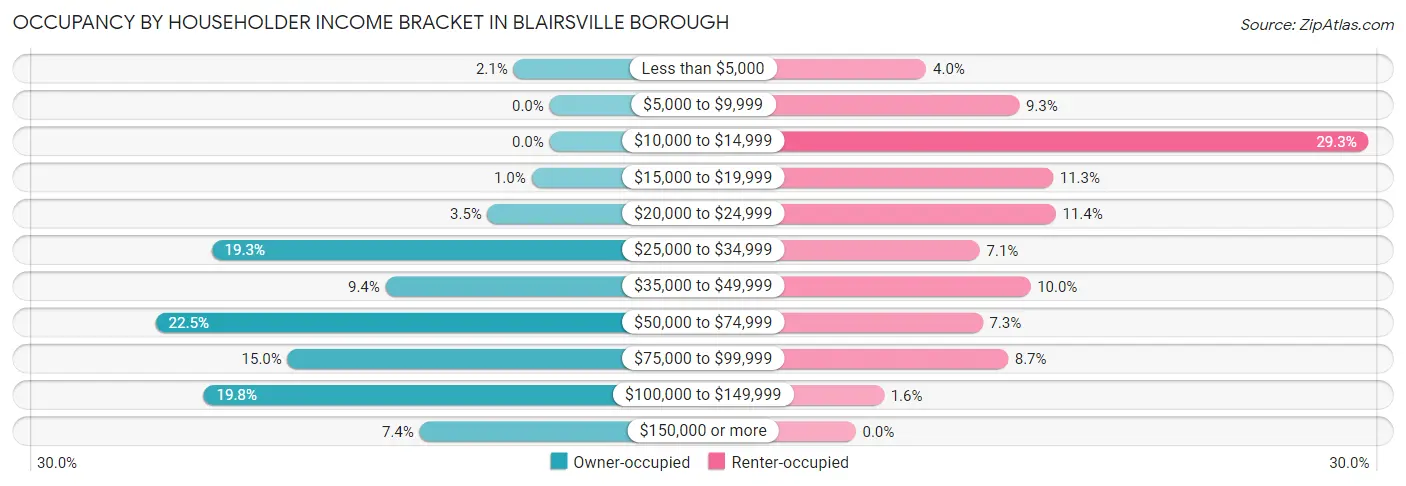
| Income Bracket | Owner-occupied | Renter-occupied |
| Less than $5,000 | 18 (2.1%) | 25 (4.0%) |
| $5,000 to $9,999 | 0 (0.0%) | 58 (9.3%) |
| $10,000 to $14,999 | 0 (0.0%) | 182 (29.3%) |
| $15,000 to $19,999 | 9 (1.0%) | 70 (11.3%) |
| $20,000 to $24,999 | 31 (3.5%) | 71 (11.4%) |
| $25,000 to $34,999 | 169 (19.3%) | 44 (7.1%) |
| $35,000 to $49,999 | 82 (9.4%) | 62 (10.0%) |
| $50,000 to $74,999 | 197 (22.5%) | 45 (7.2%) |
| $75,000 to $99,999 | 131 (15.0%) | 54 (8.7%) |
| $100,000 to $149,999 | 173 (19.8%) | 10 (1.6%) |
| $150,000 or more | 65 (7.4%) | 0 (0.0%) |
| Total | 875 (100.0%) | 621 (100.0%) |
Monthly Housing Cost Tiers in Blairsville borough
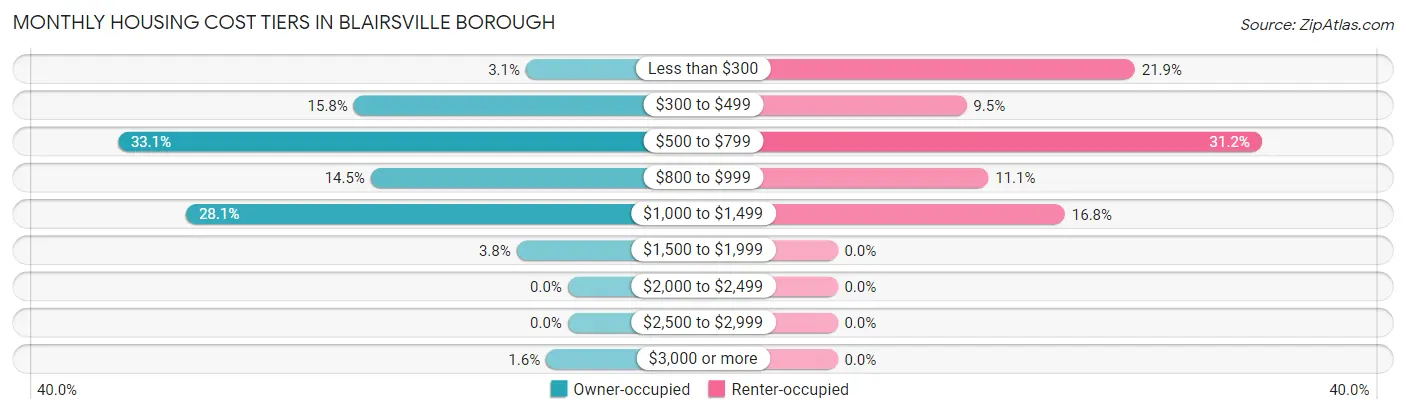
| Monthly Cost | Owner-occupied | Renter-occupied |
| Less than $300 | 27 (3.1%) | 136 (21.9%) |
| $300 to $499 | 138 (15.8%) | 59 (9.5%) |
| $500 to $799 | 290 (33.1%) | 194 (31.2%) |
| $800 to $999 | 127 (14.5%) | 69 (11.1%) |
| $1,000 to $1,499 | 246 (28.1%) | 104 (16.8%) |
| $1,500 to $1,999 | 33 (3.8%) | 0 (0.0%) |
| $2,000 to $2,499 | 0 (0.0%) | 0 (0.0%) |
| $2,500 to $2,999 | 0 (0.0%) | 0 (0.0%) |
| $3,000 or more | 14 (1.6%) | 0 (0.0%) |
| Total | 875 (100.0%) | 621 (100.0%) |
Physical Housing Characteristics in Blairsville borough
Housing Structures in Blairsville borough
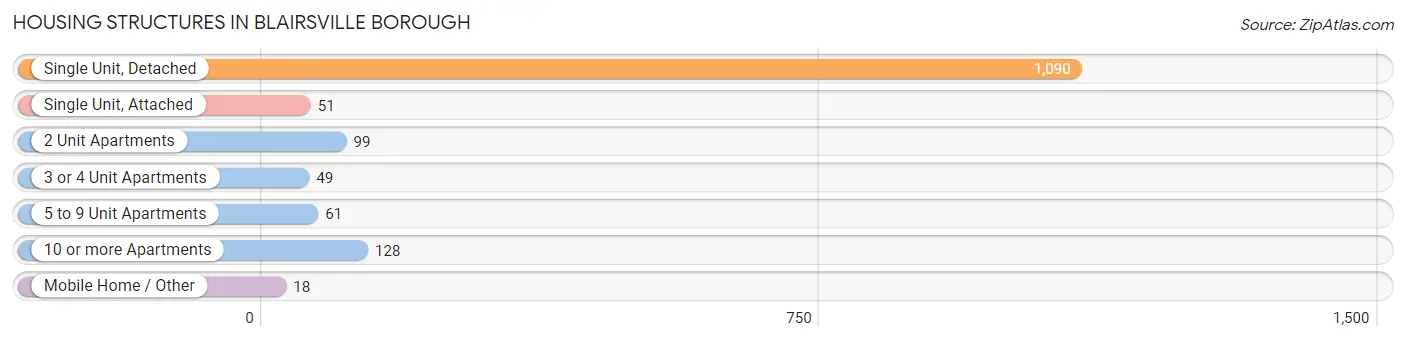
| Structure Type | # Housing Units | % Housing Units |
| Single Unit, Detached | 1,090 | 72.9% |
| Single Unit, Attached | 51 | 3.4% |
| 2 Unit Apartments | 99 | 6.6% |
| 3 or 4 Unit Apartments | 49 | 3.3% |
| 5 to 9 Unit Apartments | 61 | 4.1% |
| 10 or more Apartments | 128 | 8.6% |
| Mobile Home / Other | 18 | 1.2% |
| Total | 1,496 | 100.0% |
Housing Structures by Occupancy in Blairsville borough
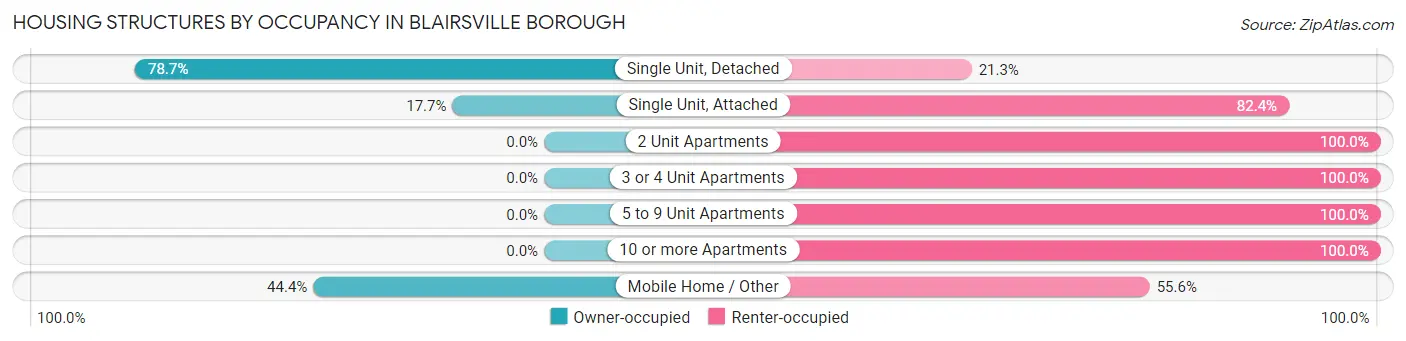
| Structure Type | Owner-occupied | Renter-occupied |
| Single Unit, Detached | 858 (78.7%) | 232 (21.3%) |
| Single Unit, Attached | 9 (17.6%) | 42 (82.4%) |
| 2 Unit Apartments | 0 (0.0%) | 99 (100.0%) |
| 3 or 4 Unit Apartments | 0 (0.0%) | 49 (100.0%) |
| 5 to 9 Unit Apartments | 0 (0.0%) | 61 (100.0%) |
| 10 or more Apartments | 0 (0.0%) | 128 (100.0%) |
| Mobile Home / Other | 8 (44.4%) | 10 (55.6%) |
| Total | 875 (58.5%) | 621 (41.5%) |
Housing Structures by Number of Rooms in Blairsville borough
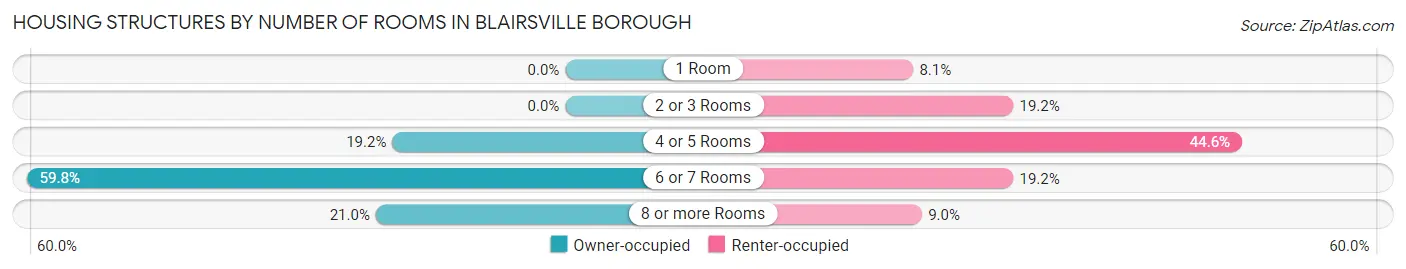
| Number of Rooms | Owner-occupied | Renter-occupied |
| 1 Room | 0 (0.0%) | 50 (8.1%) |
| 2 or 3 Rooms | 0 (0.0%) | 119 (19.2%) |
| 4 or 5 Rooms | 168 (19.2%) | 277 (44.6%) |
| 6 or 7 Rooms | 523 (59.8%) | 119 (19.2%) |
| 8 or more Rooms | 184 (21.0%) | 56 (9.0%) |
| Total | 875 (100.0%) | 621 (100.0%) |
Housing Structure by Heating Type in Blairsville borough
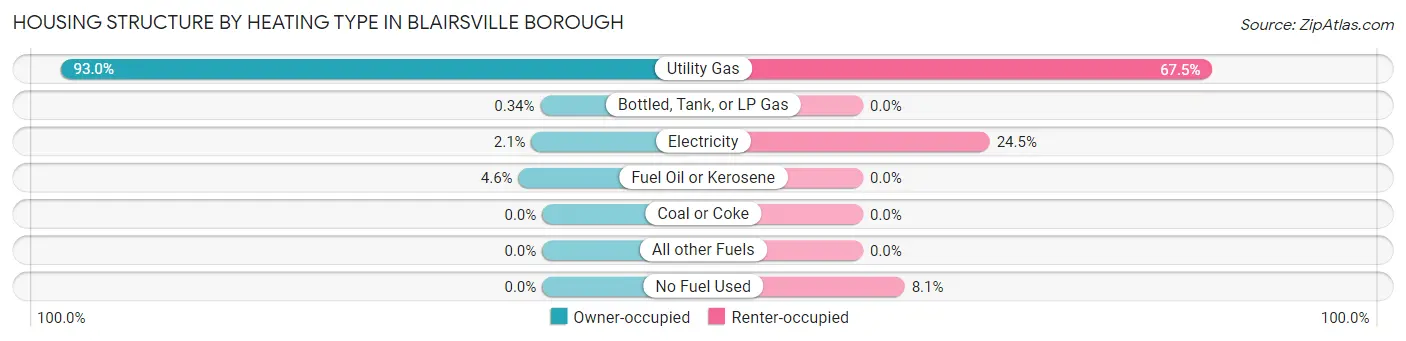
| Heating Type | Owner-occupied | Renter-occupied |
| Utility Gas | 814 (93.0%) | 419 (67.5%) |
| Bottled, Tank, or LP Gas | 3 (0.3%) | 0 (0.0%) |
| Electricity | 18 (2.1%) | 152 (24.5%) |
| Fuel Oil or Kerosene | 40 (4.6%) | 0 (0.0%) |
| Coal or Coke | 0 (0.0%) | 0 (0.0%) |
| All other Fuels | 0 (0.0%) | 0 (0.0%) |
| No Fuel Used | 0 (0.0%) | 50 (8.1%) |
| Total | 875 (100.0%) | 621 (100.0%) |
Household Vehicle Usage in Blairsville borough
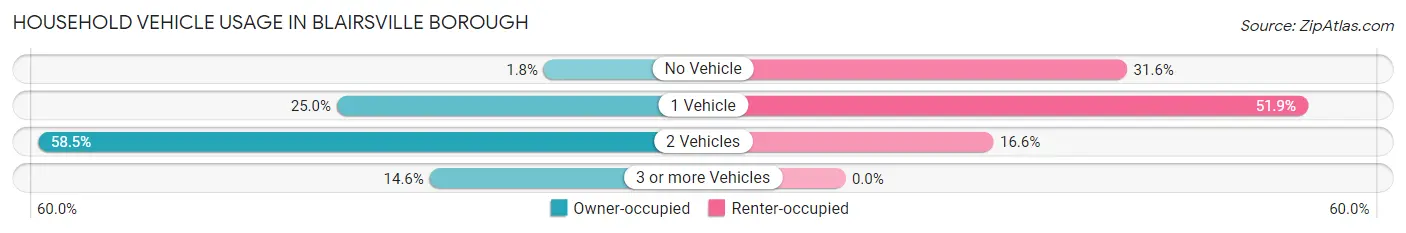
| Vehicles per Household | Owner-occupied | Renter-occupied |
| No Vehicle | 16 (1.8%) | 196 (31.6%) |
| 1 Vehicle | 219 (25.0%) | 322 (51.8%) |
| 2 Vehicles | 512 (58.5%) | 103 (16.6%) |
| 3 or more Vehicles | 128 (14.6%) | 0 (0.0%) |
| Total | 875 (100.0%) | 621 (100.0%) |
Real Estate & Mortgages in Blairsville borough
Real Estate and Mortgage Overview in Blairsville borough
| Characteristic | Without Mortgage | With Mortgage |
| Housing Units | 458 | 417 |
| Median Property Value | $101,900 | $94,400 |
| Median Household Income | $68,026 | $38 |
| Monthly Housing Costs | $542 | $14 |
| Real Estate Taxes | $1,762 | $0 |
Property Value by Mortgage Status in Blairsville borough
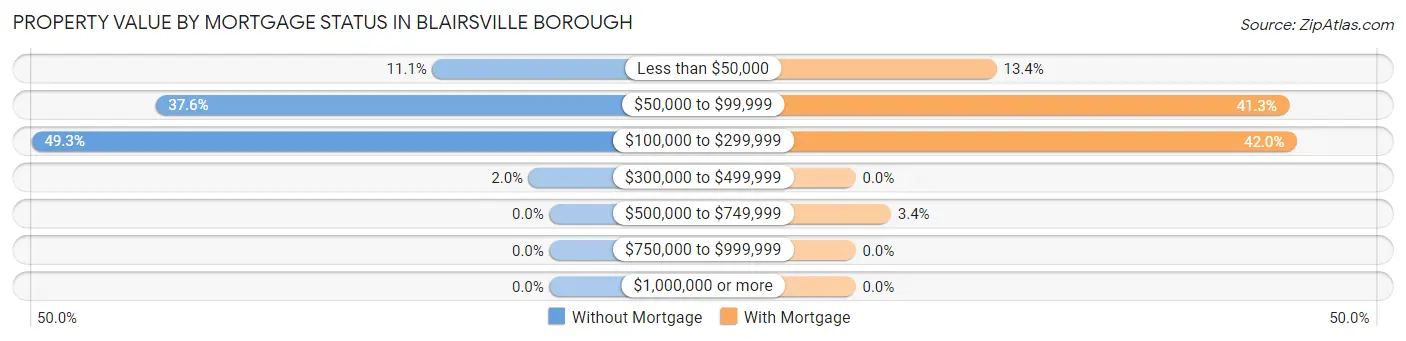
| Property Value | Without Mortgage | With Mortgage |
| Less than $50,000 | 51 (11.1%) | 56 (13.4%) |
| $50,000 to $99,999 | 172 (37.6%) | 172 (41.2%) |
| $100,000 to $299,999 | 226 (49.3%) | 175 (42.0%) |
| $300,000 to $499,999 | 9 (2.0%) | 0 (0.0%) |
| $500,000 to $749,999 | 0 (0.0%) | 14 (3.4%) |
| $750,000 to $999,999 | 0 (0.0%) | 0 (0.0%) |
| $1,000,000 or more | 0 (0.0%) | 0 (0.0%) |
| Total | 458 (100.0%) | 417 (100.0%) |
Household Income by Mortgage Status in Blairsville borough
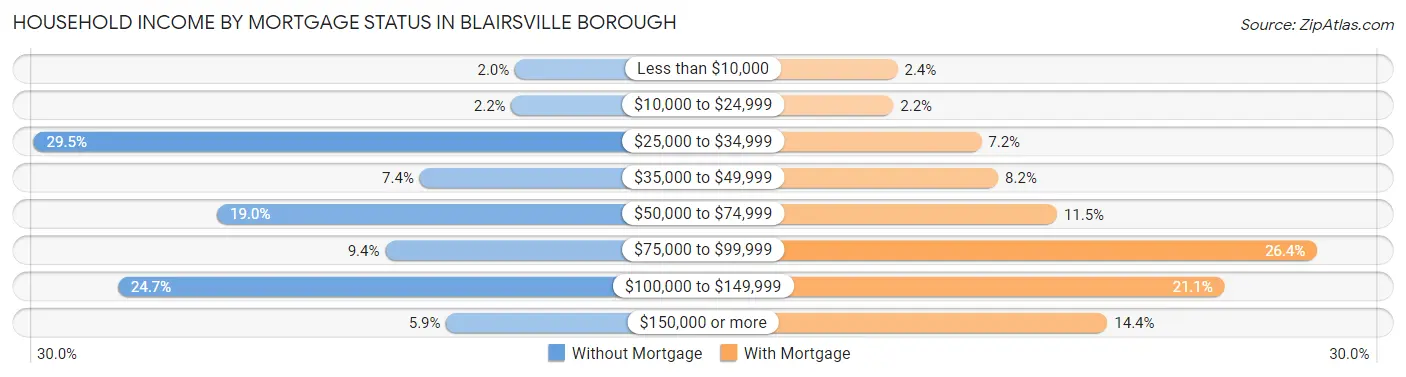
| Household Income | Without Mortgage | With Mortgage |
| Less than $10,000 | 9 (2.0%) | 10 (2.4%) |
| $10,000 to $24,999 | 10 (2.2%) | 9 (2.2%) |
| $25,000 to $34,999 | 135 (29.5%) | 30 (7.2%) |
| $35,000 to $49,999 | 34 (7.4%) | 34 (8.2%) |
| $50,000 to $74,999 | 87 (19.0%) | 48 (11.5%) |
| $75,000 to $99,999 | 43 (9.4%) | 110 (26.4%) |
| $100,000 to $149,999 | 113 (24.7%) | 88 (21.1%) |
| $150,000 or more | 27 (5.9%) | 60 (14.4%) |
| Total | 458 (100.0%) | 417 (100.0%) |
Property Value to Household Income Ratio in Blairsville borough
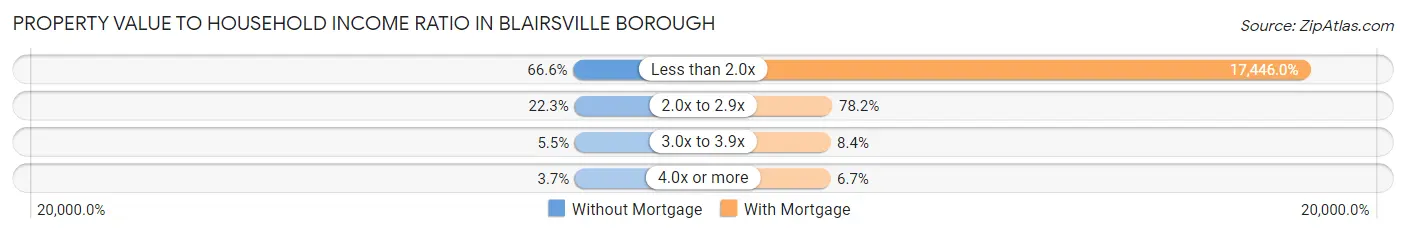
| Value-to-Income Ratio | Without Mortgage | With Mortgage |
| Less than 2.0x | 305 (66.6%) | 72,750 (17,446.0%) |
| 2.0x to 2.9x | 102 (22.3%) | 326 (78.2%) |
| 3.0x to 3.9x | 25 (5.5%) | 35 (8.4%) |
| 4.0x or more | 17 (3.7%) | 28 (6.7%) |
| Total | 458 (100.0%) | 417 (100.0%) |
Real Estate Taxes by Mortgage Status in Blairsville borough
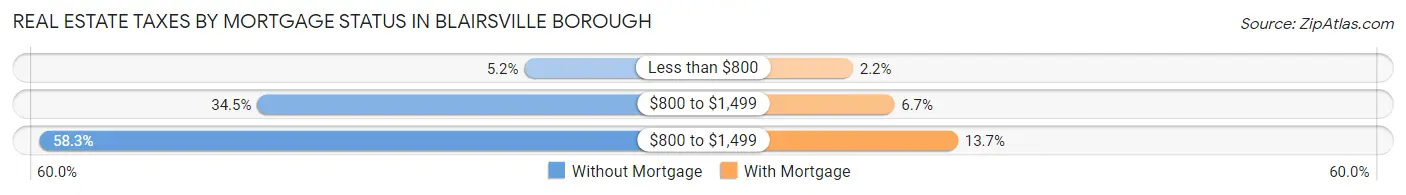
| Property Taxes | Without Mortgage | With Mortgage |
| Less than $800 | 24 (5.2%) | 9 (2.2%) |
| $800 to $1,499 | 158 (34.5%) | 28 (6.7%) |
| $800 to $1,499 | 267 (58.3%) | 57 (13.7%) |
| Total | 458 (100.0%) | 417 (100.0%) |
Health & Disability in Blairsville borough
Health Insurance Coverage by Age in Blairsville borough
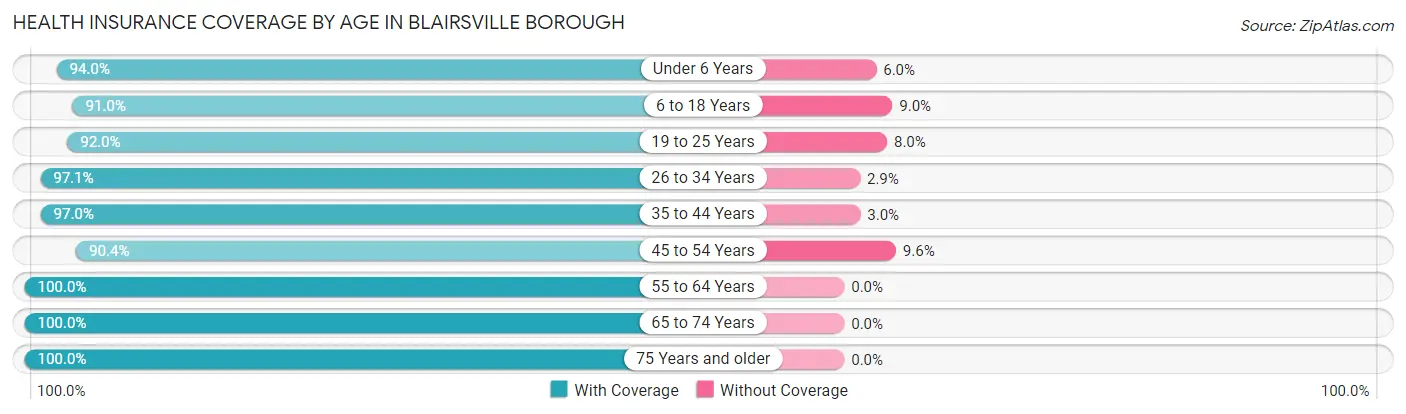
| Age Bracket | With Coverage | Without Coverage |
| Under 6 Years | 142 (94.0%) | 9 (6.0%) |
| 6 to 18 Years | 386 (91.0%) | 38 (9.0%) |
| 19 to 25 Years | 127 (92.0%) | 11 (8.0%) |
| 26 to 34 Years | 331 (97.1%) | 10 (2.9%) |
| 35 to 44 Years | 324 (97.0%) | 10 (3.0%) |
| 45 to 54 Years | 282 (90.4%) | 30 (9.6%) |
| 55 to 64 Years | 791 (100.0%) | 0 (0.0%) |
| 65 to 74 Years | 458 (100.0%) | 0 (0.0%) |
| 75 Years and older | 266 (100.0%) | 0 (0.0%) |
| Total | 3,107 (96.6%) | 108 (3.4%) |
Health Insurance Coverage by Citizenship Status in Blairsville borough
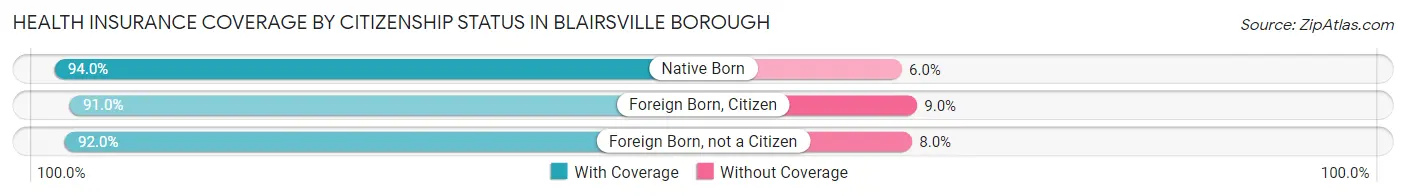
| Citizenship Status | With Coverage | Without Coverage |
| Native Born | 142 (94.0%) | 9 (6.0%) |
| Foreign Born, Citizen | 386 (91.0%) | 38 (9.0%) |
| Foreign Born, not a Citizen | 127 (92.0%) | 11 (8.0%) |
Health Insurance Coverage by Household Income in Blairsville borough
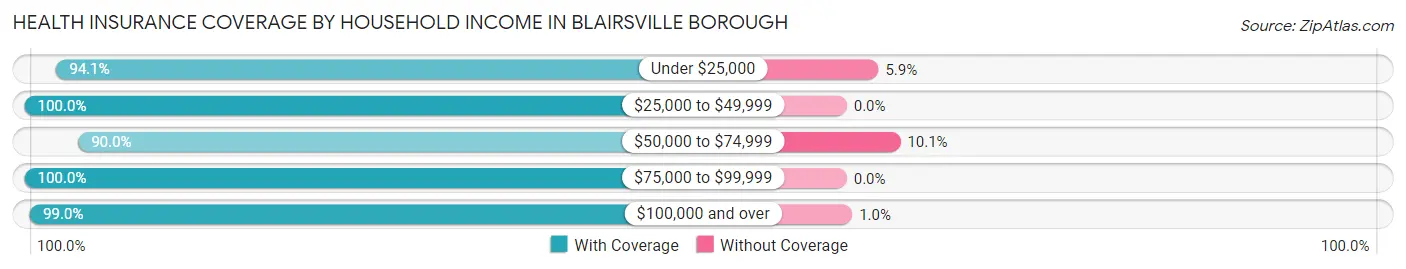
| Household Income | With Coverage | Without Coverage |
| Under $25,000 | 649 (94.1%) | 41 (5.9%) |
| $25,000 to $49,999 | 690 (100.0%) | 0 (0.0%) |
| $50,000 to $74,999 | 528 (89.9%) | 59 (10.1%) |
| $75,000 to $99,999 | 461 (100.0%) | 0 (0.0%) |
| $100,000 and over | 779 (99.0%) | 8 (1.0%) |
Public vs Private Health Insurance Coverage by Age in Blairsville borough
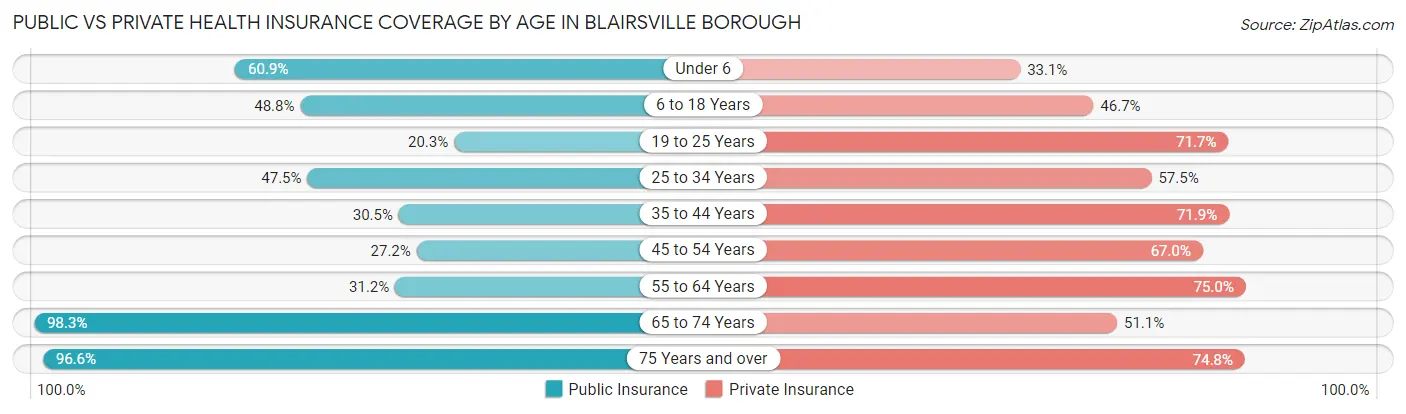
| Age Bracket | Public Insurance | Private Insurance |
| Under 6 | 92 (60.9%) | 50 (33.1%) |
| 6 to 18 Years | 207 (48.8%) | 198 (46.7%) |
| 19 to 25 Years | 28 (20.3%) | 99 (71.7%) |
| 25 to 34 Years | 162 (47.5%) | 196 (57.5%) |
| 35 to 44 Years | 102 (30.5%) | 240 (71.9%) |
| 45 to 54 Years | 85 (27.2%) | 209 (67.0%) |
| 55 to 64 Years | 247 (31.2%) | 593 (75.0%) |
| 65 to 74 Years | 450 (98.3%) | 234 (51.1%) |
| 75 Years and over | 257 (96.6%) | 199 (74.8%) |
| Total | 1,630 (50.7%) | 2,018 (62.8%) |
Disability Status by Sex by Age in Blairsville borough
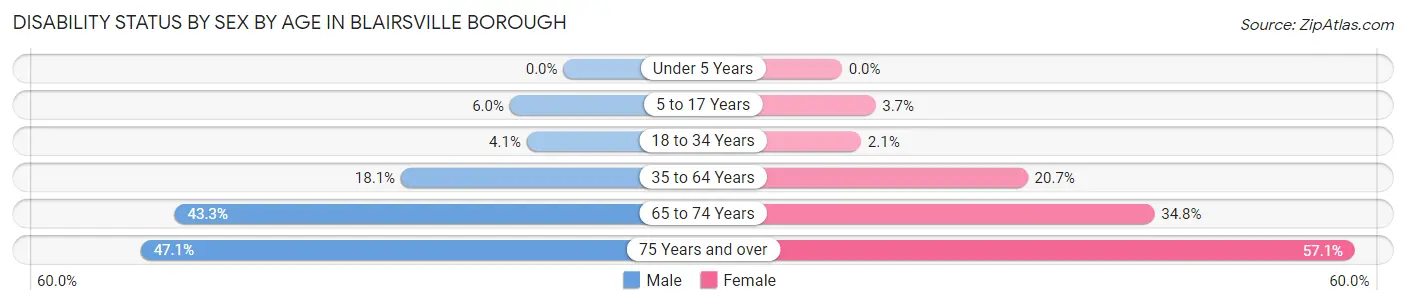
| Age Bracket | Male | Female |
| Under 5 Years | 0 (0.0%) | 0 (0.0%) |
| 5 to 17 Years | 9 (6.0%) | 9 (3.7%) |
| 18 to 34 Years | 8 (4.1%) | 7 (2.1%) |
| 35 to 64 Years | 121 (18.1%) | 159 (20.7%) |
| 65 to 74 Years | 100 (43.3%) | 79 (34.8%) |
| 75 Years and over | 56 (47.1%) | 84 (57.1%) |
Disability Class by Sex by Age in Blairsville borough
Disability Class: Hearing Difficulty
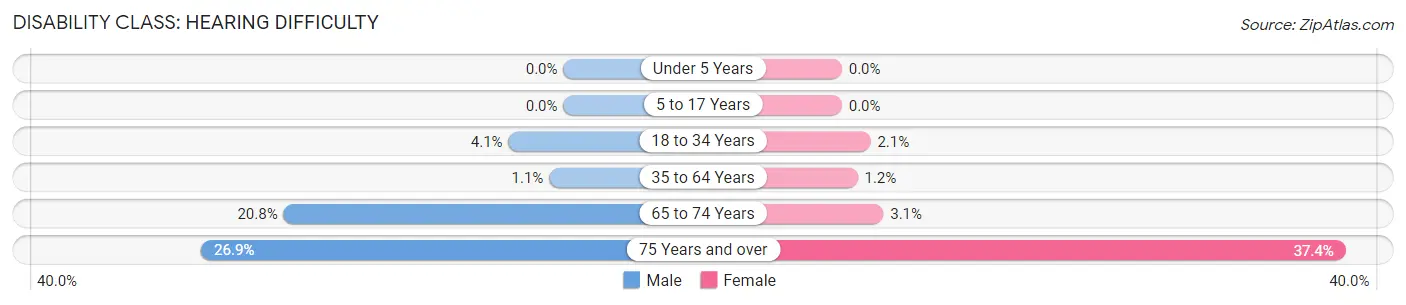
| Age Bracket | Male | Female |
| Under 5 Years | 0 (0.0%) | 0 (0.0%) |
| 5 to 17 Years | 0 (0.0%) | 0 (0.0%) |
| 18 to 34 Years | 8 (4.1%) | 7 (2.1%) |
| 35 to 64 Years | 7 (1.1%) | 9 (1.2%) |
| 65 to 74 Years | 48 (20.8%) | 7 (3.1%) |
| 75 Years and over | 32 (26.9%) | 55 (37.4%) |
Disability Class: Vision Difficulty
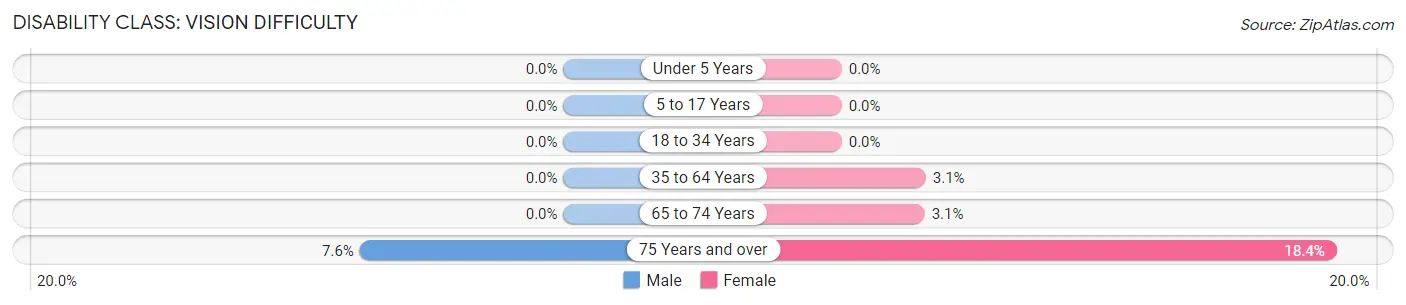
| Age Bracket | Male | Female |
| Under 5 Years | 0 (0.0%) | 0 (0.0%) |
| 5 to 17 Years | 0 (0.0%) | 0 (0.0%) |
| 18 to 34 Years | 0 (0.0%) | 0 (0.0%) |
| 35 to 64 Years | 0 (0.0%) | 24 (3.1%) |
| 65 to 74 Years | 0 (0.0%) | 7 (3.1%) |
| 75 Years and over | 9 (7.6%) | 27 (18.4%) |
Disability Class: Cognitive Difficulty
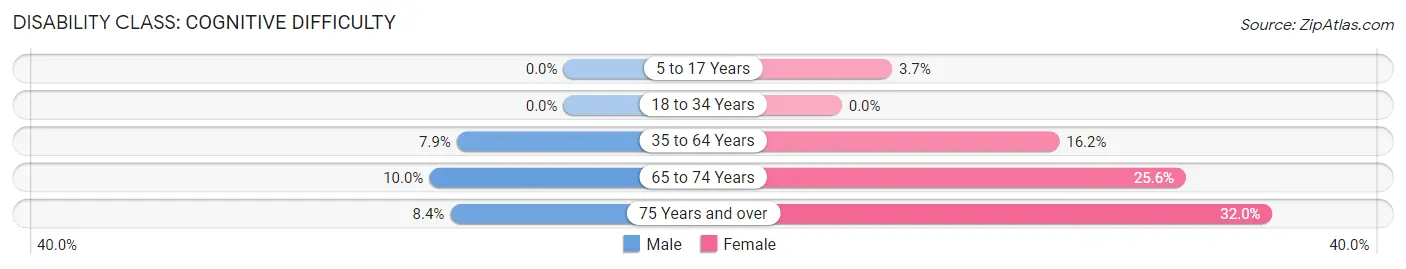
| Age Bracket | Male | Female |
| 5 to 17 Years | 0 (0.0%) | 9 (3.7%) |
| 18 to 34 Years | 0 (0.0%) | 0 (0.0%) |
| 35 to 64 Years | 53 (7.9%) | 124 (16.2%) |
| 65 to 74 Years | 23 (10.0%) | 58 (25.6%) |
| 75 Years and over | 10 (8.4%) | 47 (32.0%) |
Disability Class: Ambulatory Difficulty
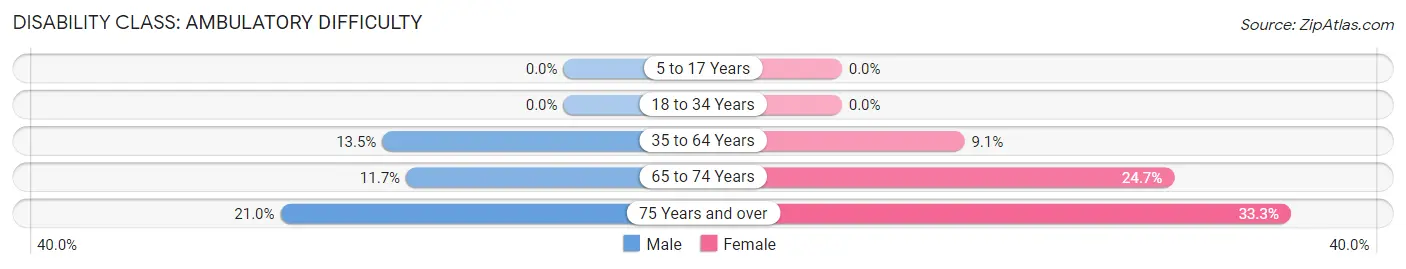
| Age Bracket | Male | Female |
| 5 to 17 Years | 0 (0.0%) | 0 (0.0%) |
| 18 to 34 Years | 0 (0.0%) | 0 (0.0%) |
| 35 to 64 Years | 90 (13.5%) | 70 (9.1%) |
| 65 to 74 Years | 27 (11.7%) | 56 (24.7%) |
| 75 Years and over | 25 (21.0%) | 49 (33.3%) |
Disability Class: Self-Care Difficulty
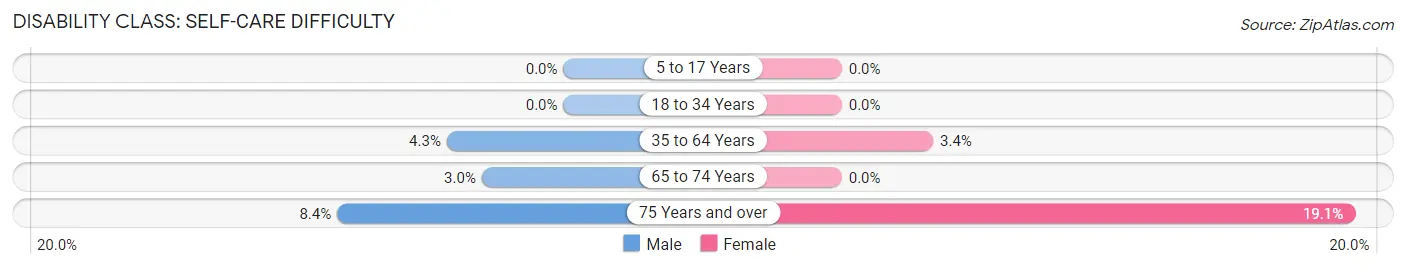
| Age Bracket | Male | Female |
| 5 to 17 Years | 0 (0.0%) | 0 (0.0%) |
| 18 to 34 Years | 0 (0.0%) | 0 (0.0%) |
| 35 to 64 Years | 29 (4.3%) | 26 (3.4%) |
| 65 to 74 Years | 7 (3.0%) | 0 (0.0%) |
| 75 Years and over | 10 (8.4%) | 28 (19.1%) |
Technology Access in Blairsville borough
Computing Device Access in Blairsville borough
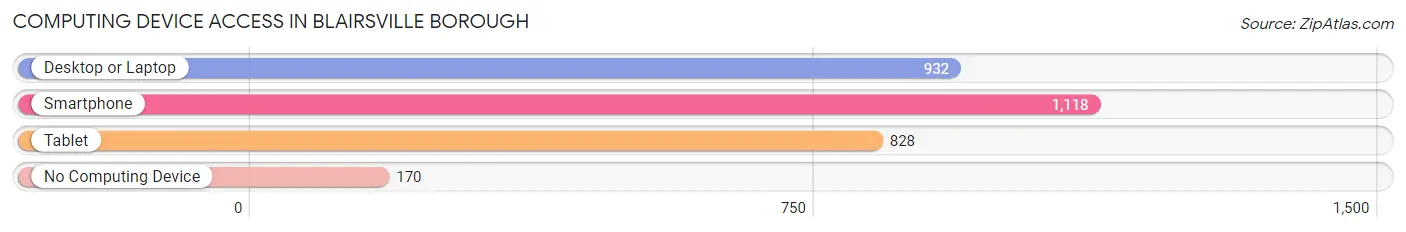
| Device Type | # Households | % Households |
| Desktop or Laptop | 932 | 62.3% |
| Smartphone | 1,118 | 74.7% |
| Tablet | 828 | 55.3% |
| No Computing Device | 170 | 11.4% |
| Total | 1,496 | 100.0% |
Internet Access in Blairsville borough
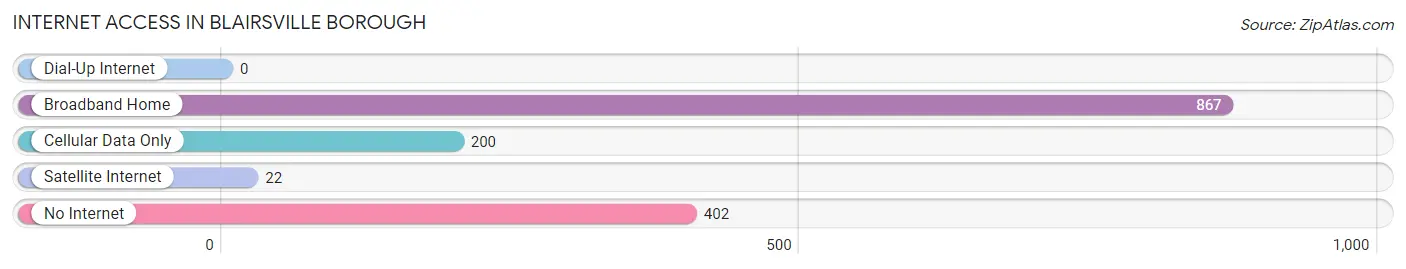
| Internet Type | # Households | % Households |
| Dial-Up Internet | 0 | 0.0% |
| Broadband Home | 867 | 58.0% |
| Cellular Data Only | 200 | 13.4% |
| Satellite Internet | 22 | 1.5% |
| No Internet | 402 | 26.9% |
| Total | 1,496 | 100.0% |
Blairsville borough Summary
Blairsville Borough is a small borough located in Indiana County, Pennsylvania. It is situated in the foothills of the Allegheny Mountains, approximately 40 miles east of Pittsburgh. The borough is home to a population of approximately 2,500 people, and is the county seat of Indiana County.
History
Blairsville Borough was founded in 1839 by William Blair, a local landowner. The borough was named after him, and was incorporated in 1845. The borough was originally a small farming community, but grew rapidly in the late 19th century due to the development of the Pennsylvania Railroad. The railroad brought new industry and jobs to the area, and the population of the borough grew to over 3,000 by the early 20th century.
The borough was also home to a number of coal mines, which provided employment for many of the residents. The coal industry declined in the mid-20th century, and the population of the borough began to decline as well. The borough has since become a bedroom community for Pittsburgh, with many of its residents commuting to the city for work.
Geography
Blairsville Borough is located in the foothills of the Allegheny Mountains, approximately 40 miles east of Pittsburgh. The borough is situated in the Conemaugh River Valley, and is bordered by the towns of Homer City, Indiana, and Saltsburg. The borough is located at an elevation of 1,000 feet, and has a total area of 1.2 square miles.
The borough is home to a number of parks and recreational areas, including the Blairsville Community Park, which features a playground, basketball court, and picnic pavilion. The borough is also home to the Blairsville Historical Society, which operates a museum and library.
Economy
The economy of Blairsville Borough is largely based on tourism and retail. The borough is home to a number of small businesses, including restaurants, shops, and galleries. The borough is also home to a number of manufacturing companies, including a steel mill and a paper mill.
The borough is also home to a number of educational institutions, including the Indiana University of Pennsylvania, which is located just outside of the borough. The university provides a number of educational and cultural opportunities for the residents of the borough.
Demographics
As of the 2010 census, the population of Blairsville Borough was 2,521. The racial makeup of the borough was 97.3% White, 0.7% African American, 0.2% Native American, 0.3% Asian, 0.1% Pacific Islander, 0.3% from other races, and 1.2% from two or more races. Hispanic or Latino of any race were 1.2% of the population.
The median household income in the borough was $37,917, and the median family income was $45,938. The per capita income for the borough was $19,945. About 11.3% of families and 14.2% of the population were below the poverty line, including 19.2% of those under age 18 and 8.2% of those age 65 or over.
Common Questions
What is Per Capita Income in Blairsville borough?
Per Capita income in Blairsville borough is $30,006.
What is the Median Family Income in Blairsville borough?
Median Family Income in Blairsville borough is $67,083.
What is the Median Household income in Blairsville borough?
Median Household Income in Blairsville borough is $46,082.
What is Income or Wage Gap in Blairsville borough?
Income or Wage Gap in Blairsville borough is 59.7%.
Women in Blairsville borough earn 40.3 cents for every dollar earned by a man.
What is Inequality or Gini Index in Blairsville borough?
Inequality or Gini Index in Blairsville borough is 0.48.
What is the Total Population of Blairsville borough?
Total Population of Blairsville borough is 3,215.
What is the Total Male Population of Blairsville borough?
Total Male Population of Blairsville borough is 1,472.
What is the Total Female Population of Blairsville borough?
Total Female Population of Blairsville borough is 1,743.
What is the Ratio of Males per 100 Females in Blairsville borough?
There are 84.45 Males per 100 Females in Blairsville borough.
What is the Ratio of Females per 100 Males in Blairsville borough?
There are 118.41 Females per 100 Males in Blairsville borough.
What is the Median Population Age in Blairsville borough?
Median Population Age in Blairsville borough is 51.5 Years.
What is the Average Family Size in Blairsville borough
Average Family Size in Blairsville borough is 2.8 People.
What is the Average Household Size in Blairsville borough
Average Household Size in Blairsville borough is 2.1 People.
How Large is the Labor Force in Blairsville borough?
There are 1,510 People in the Labor Forcein in Blairsville borough.
What is the Percentage of People in the Labor Force in Blairsville borough?
55.6% of People are in the Labor Force in Blairsville borough.
What is the Unemployment Rate in Blairsville borough?
Unemployment Rate in Blairsville borough is 1.8%.