Tunkhannock borough, PA Map & Demographics
Tunkhannock borough Overview
$32,278
PER CAPITA INCOME
$78,798
AVG FAMILY INCOME
$55,542
AVG HOUSEHOLD INCOME
30.0%
WAGE / INCOME GAP [ % ]
70.0¢/ $1
WAGE / INCOME GAP [ $ ]
0.44
INEQUALITY / GINI INDEX
1,635
TOTAL POPULATION
792
MALE POPULATION
843
FEMALE POPULATION
93.95
MALES / 100 FEMALES
106.44
FEMALES / 100 MALES
45.2
MEDIAN AGE
2.8
AVG FAMILY SIZE
2.1
AVG HOUSEHOLD SIZE
736
LABOR FORCE [ PEOPLE ]
52.8%
PERCENT IN LABOR FORCE
4.5%
UNEMPLOYMENT RATE
Income in Tunkhannock borough
Income Overview in Tunkhannock borough
Per Capita Income in Tunkhannock borough is $32,278, while median incomes of families and households are $78,798 and $55,542 respectively.
| Characteristic | Number | Measure |
| Per Capita Income | 1,635 | $32,278 |
| Median Family Income | 397 | $78,798 |
| Mean Family Income | 397 | $91,761 |
| Median Household Income | 749 | $55,542 |
| Mean Household Income | 749 | $69,393 |
| Income Deficit | 397 | $0 |
| Wage / Income Gap (%) | 1,635 | 30.03% |
| Wage / Income Gap ($) | 1,635 | 69.97¢ per $1 |
| Gini / Inequality Index | 1,635 | 0.44 |
Earnings by Sex in Tunkhannock borough
Average Earnings in Tunkhannock borough are $37,143, $45,405 for men and $31,771 for women, a difference of 30.0%.
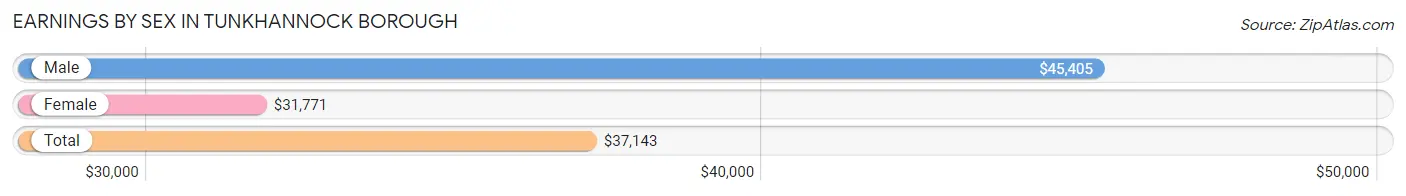
| Sex | Number | Average Earnings |
| Male | 384 (49.7%) | $45,405 |
| Female | 388 (50.3%) | $31,771 |
| Total | 772 (100.0%) | $37,143 |
Earnings by Sex by Income Bracket in Tunkhannock borough
The most common earnings brackets in Tunkhannock borough are $75,000 to $99,999 for men (65 | 16.9%) and $55,000 to $64,999 for women (67 | 17.3%).

| Income | Male | Female |
| $2,499 or less | 14 (3.6%) | 19 (4.9%) |
| $2,500 to $4,999 | 29 (7.5%) | 8 (2.1%) |
| $5,000 to $7,499 | 12 (3.1%) | 28 (7.2%) |
| $7,500 to $9,999 | 0 (0.0%) | 5 (1.3%) |
| $10,000 to $12,499 | 5 (1.3%) | 38 (9.8%) |
| $12,500 to $14,999 | 5 (1.3%) | 0 (0.0%) |
| $15,000 to $17,499 | 25 (6.5%) | 9 (2.3%) |
| $17,500 to $19,999 | 0 (0.0%) | 17 (4.4%) |
| $20,000 to $22,499 | 14 (3.6%) | 29 (7.5%) |
| $22,500 to $24,999 | 4 (1.0%) | 6 (1.5%) |
| $25,000 to $29,999 | 24 (6.2%) | 18 (4.6%) |
| $30,000 to $34,999 | 25 (6.5%) | 46 (11.9%) |
| $35,000 to $39,999 | 7 (1.8%) | 32 (8.3%) |
| $40,000 to $44,999 | 22 (5.7%) | 8 (2.1%) |
| $45,000 to $49,999 | 37 (9.6%) | 11 (2.8%) |
| $50,000 to $54,999 | 15 (3.9%) | 0 (0.0%) |
| $55,000 to $64,999 | 17 (4.4%) | 67 (17.3%) |
| $65,000 to $74,999 | 16 (4.2%) | 7 (1.8%) |
| $75,000 to $99,999 | 65 (16.9%) | 17 (4.4%) |
| $100,000+ | 48 (12.5%) | 23 (5.9%) |
| Total | 384 (100.0%) | 388 (100.0%) |
Earnings by Sex by Educational Attainment in Tunkhannock borough
Average earnings in Tunkhannock borough are $46,655 for men and $33,864 for women, a difference of 27.4%. Men with an educational attainment of graduate degree enjoy the highest average annual earnings of $100,694, while those with bachelor's degree education earn the least with $32,000. Women with an educational attainment of bachelor's degree earn the most with the average annual earnings of $58,580, while those with college or associate's degree education have the smallest earnings of $22,426.
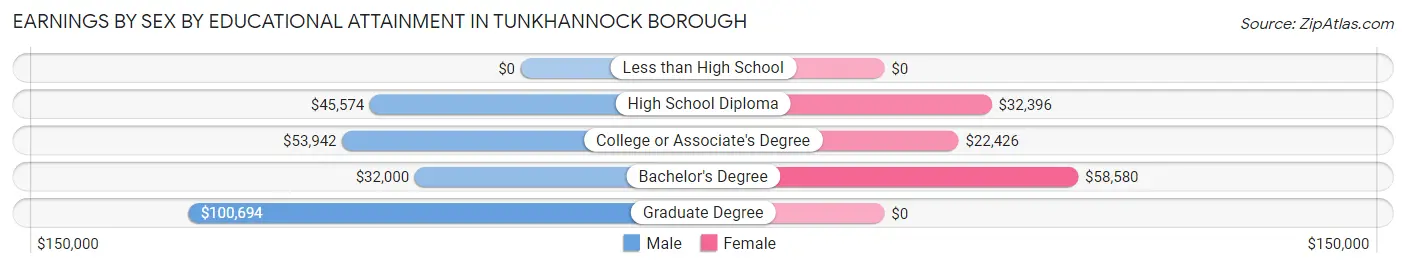
| Educational Attainment | Male Income | Female Income |
| Less than High School | - | - |
| High School Diploma | $45,574 | $32,396 |
| College or Associate's Degree | $53,942 | $22,426 |
| Bachelor's Degree | $32,000 | $58,580 |
| Graduate Degree | $100,694 | $0 |
| Total | $46,655 | $33,864 |
Family Income in Tunkhannock borough
Family Income Brackets in Tunkhannock borough
According to the Tunkhannock borough family income data, there are 107 families falling into the $100,000 to $149,999 income range, which is the most common income bracket and makes up 27.0% of all families. Conversely, the $25,000 to $34,999 income bracket is the least frequent group with only 4 families (1.0%) belonging to this category.
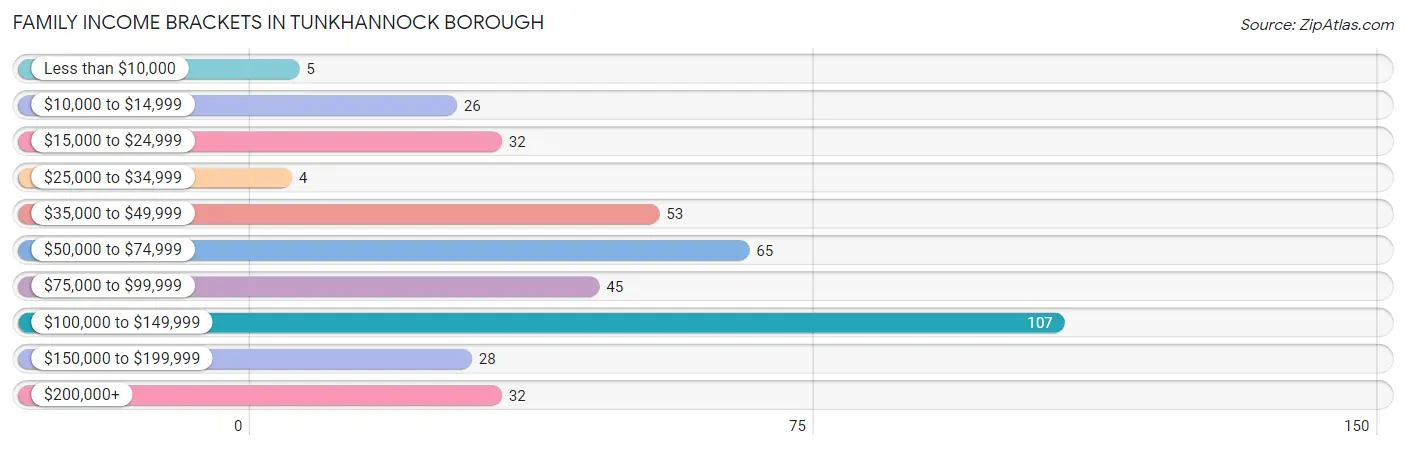
| Income Bracket | # Families | % Families |
| Less than $10,000 | 5 | 1.3% |
| $10,000 to $14,999 | 26 | 6.5% |
| $15,000 to $24,999 | 32 | 8.1% |
| $25,000 to $34,999 | 4 | 1.0% |
| $35,000 to $49,999 | 53 | 13.4% |
| $50,000 to $74,999 | 65 | 16.4% |
| $75,000 to $99,999 | 45 | 11.3% |
| $100,000 to $149,999 | 107 | 27.0% |
| $150,000 to $199,999 | 28 | 7.1% |
| $200,000+ | 32 | 8.1% |
Family Income by Famaliy Size in Tunkhannock borough
3-person families (113 | 28.5%) account for the highest median family income in Tunkhannock borough with $91,250 per family, while 3-person families (113 | 28.5%) have the highest median income of $30,417 per family member.
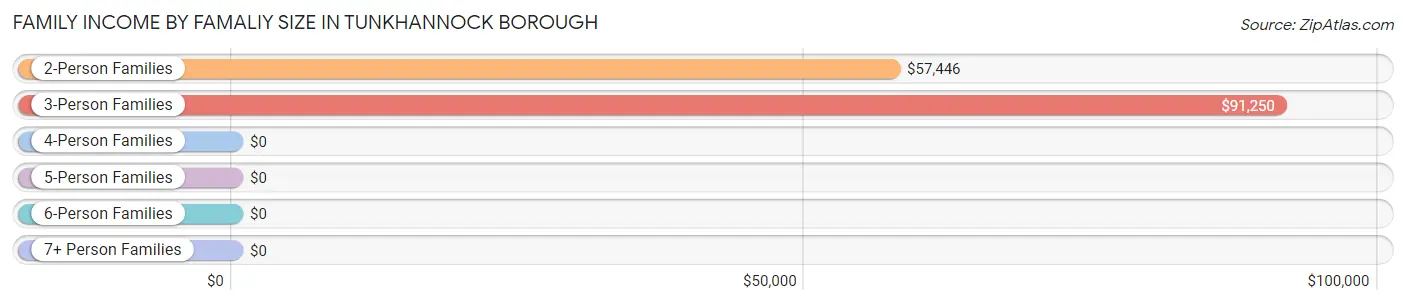
| Income Bracket | # Families | Median Income |
| 2-Person Families | 211 (53.1%) | $57,446 |
| 3-Person Families | 113 (28.5%) | $91,250 |
| 4-Person Families | 48 (12.1%) | $0 |
| 5-Person Families | 23 (5.8%) | $0 |
| 6-Person Families | 2 (0.5%) | $0 |
| 7+ Person Families | 0 (0.0%) | $0 |
| Total | 397 (100.0%) | $78,798 |
Family Income by Number of Earners in Tunkhannock borough
The median family income in Tunkhannock borough is $78,798, with families comprising 2 earners (149) having the highest median family income of $133,173, while families with 1 earner (115) have the lowest median family income of $39,226, accounting for 37.5% and 29.0% of families, respectively.
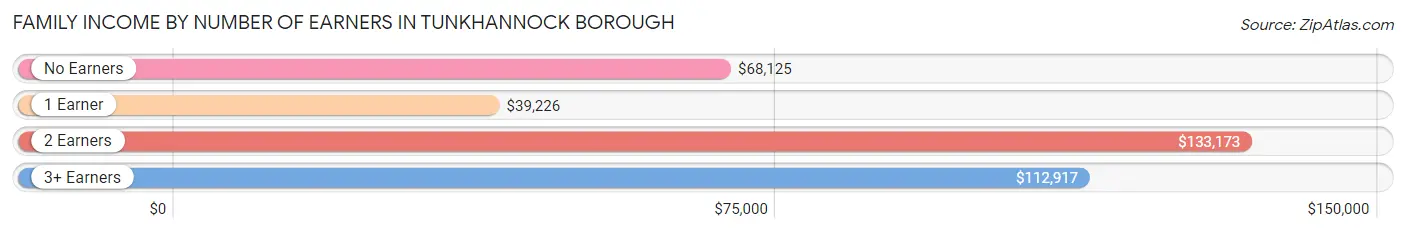
| Number of Earners | # Families | Median Income |
| No Earners | 102 (25.7%) | $68,125 |
| 1 Earner | 115 (29.0%) | $39,226 |
| 2 Earners | 149 (37.5%) | $133,173 |
| 3+ Earners | 31 (7.8%) | $112,917 |
| Total | 397 (100.0%) | $78,798 |
Household Income in Tunkhannock borough
Household Income Brackets in Tunkhannock borough
With 141 households falling in the category, the $50,000 to $74,999 income range is the most frequent in Tunkhannock borough, accounting for 18.8% of all households. In contrast, only 28 households (3.7%) fall into the $150,000 to $199,999 income bracket, making it the least populous group.
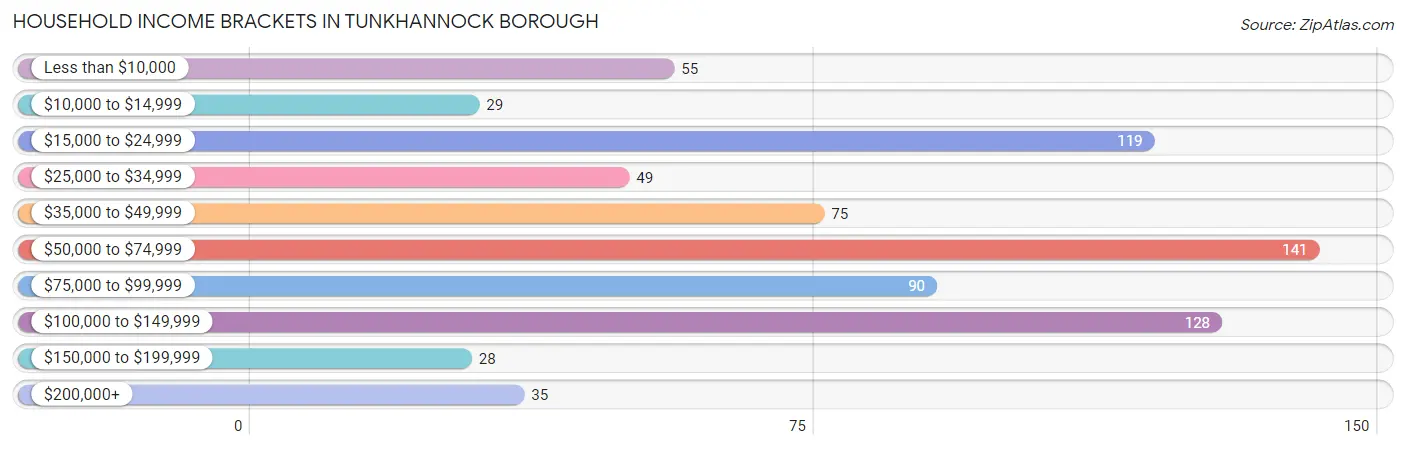
| Income Bracket | # Households | % Households |
| Less than $10,000 | 55 | 7.3% |
| $10,000 to $14,999 | 29 | 3.9% |
| $15,000 to $24,999 | 119 | 15.9% |
| $25,000 to $34,999 | 49 | 6.5% |
| $35,000 to $49,999 | 75 | 10.0% |
| $50,000 to $74,999 | 141 | 18.8% |
| $75,000 to $99,999 | 90 | 12.0% |
| $100,000 to $149,999 | 128 | 17.1% |
| $150,000 to $199,999 | 28 | 3.7% |
| $200,000+ | 35 | 4.7% |
Household Income by Householder Age in Tunkhannock borough
The median household income in Tunkhannock borough is $55,542, with the highest median household income of $57,813 found in the 45 to 64 years age bracket for the primary householder. A total of 287 households (38.3%) fall into this category. Meanwhile, the 15 to 24 years age bracket for the primary householder has the lowest median household income of $0, with 18 households (2.4%) in this group.
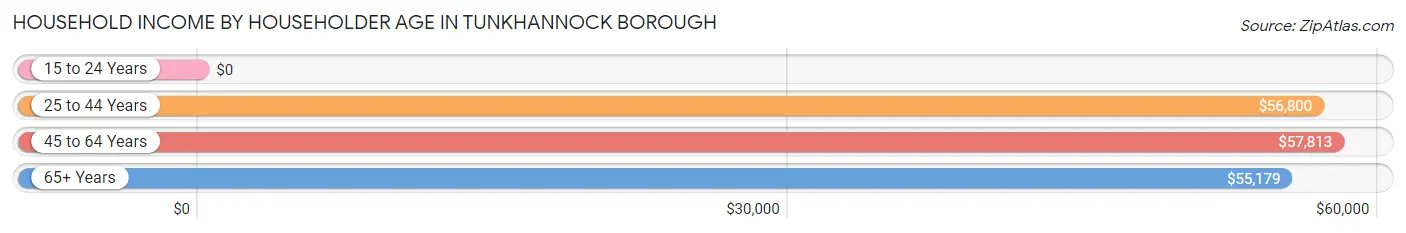
| Income Bracket | # Households | Median Income |
| 15 to 24 Years | 18 (2.4%) | $0 |
| 25 to 44 Years | 190 (25.4%) | $56,800 |
| 45 to 64 Years | 287 (38.3%) | $57,813 |
| 65+ Years | 254 (33.9%) | $55,179 |
| Total | 749 (100.0%) | $55,542 |
Poverty in Tunkhannock borough
Income Below Poverty by Sex and Age in Tunkhannock borough
With 17.4% poverty level for males and 22.7% for females among the residents of Tunkhannock borough, under 5 year old males and 15 year old females are the most vulnerable to poverty, with 39 males (88.6%) and 17 females (65.4%) in their respective age groups living below the poverty level.
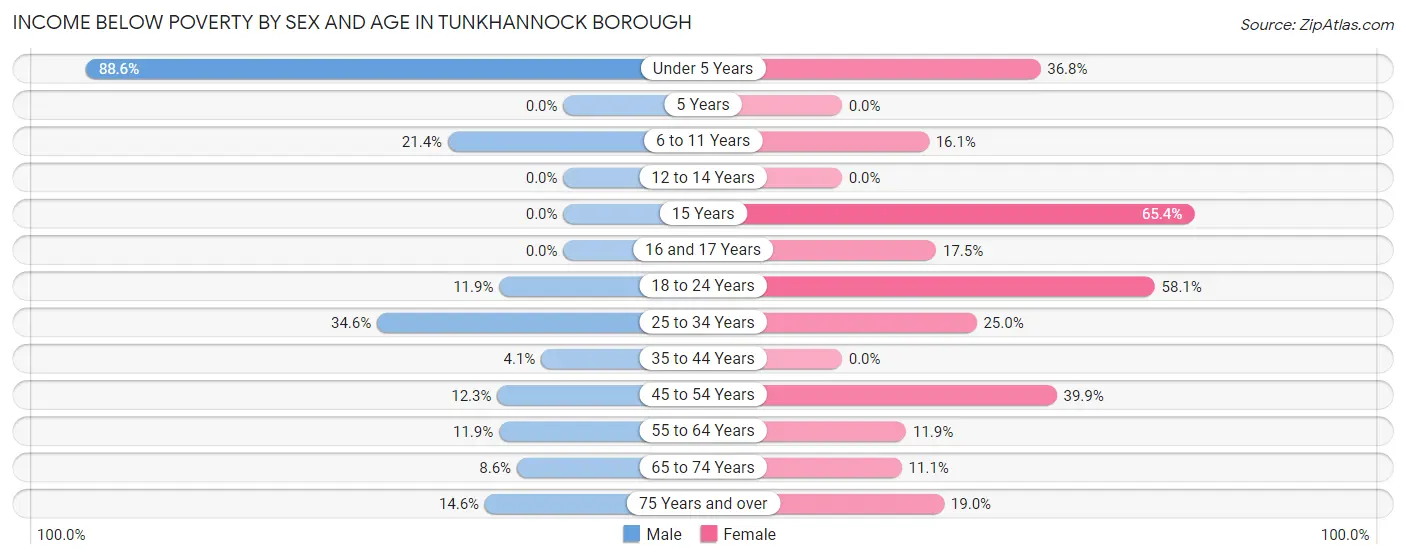
| Age Bracket | Male | Female |
| Under 5 Years | 39 (88.6%) | 14 (36.8%) |
| 5 Years | 0 (0.0%) | 0 (0.0%) |
| 6 to 11 Years | 6 (21.4%) | 5 (16.1%) |
| 12 to 14 Years | 0 (0.0%) | 0 (0.0%) |
| 15 Years | 0 (0.0%) | 17 (65.4%) |
| 16 and 17 Years | 0 (0.0%) | 7 (17.5%) |
| 18 to 24 Years | 5 (11.9%) | 18 (58.1%) |
| 25 to 34 Years | 37 (34.6%) | 24 (25.0%) |
| 35 to 44 Years | 3 (4.1%) | 0 (0.0%) |
| 45 to 54 Years | 13 (12.3%) | 59 (39.9%) |
| 55 to 64 Years | 8 (11.9%) | 13 (11.9%) |
| 65 to 74 Years | 10 (8.6%) | 14 (11.1%) |
| 75 Years and over | 8 (14.5%) | 18 (19.0%) |
| Total | 129 (17.4%) | 189 (22.7%) |
Income Above Poverty by Sex and Age in Tunkhannock borough
According to the poverty statistics in Tunkhannock borough, males aged 12 to 14 years and females aged 12 to 14 years are the age groups that are most secure financially, with 100.0% of males and 100.0% of females in these age groups living above the poverty line.
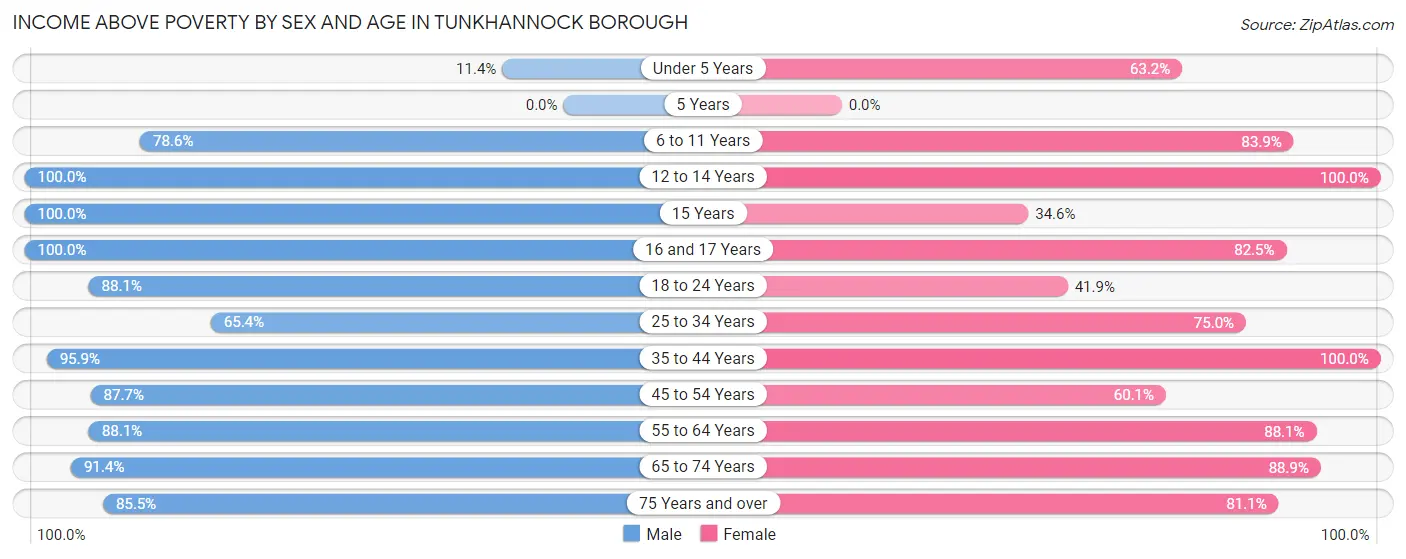
| Age Bracket | Male | Female |
| Under 5 Years | 5 (11.4%) | 24 (63.2%) |
| 5 Years | 0 (0.0%) | 0 (0.0%) |
| 6 to 11 Years | 22 (78.6%) | 26 (83.9%) |
| 12 to 14 Years | 44 (100.0%) | 8 (100.0%) |
| 15 Years | 9 (100.0%) | 9 (34.6%) |
| 16 and 17 Years | 52 (100.0%) | 33 (82.5%) |
| 18 to 24 Years | 37 (88.1%) | 13 (41.9%) |
| 25 to 34 Years | 70 (65.4%) | 72 (75.0%) |
| 35 to 44 Years | 70 (95.9%) | 83 (100.0%) |
| 45 to 54 Years | 93 (87.7%) | 89 (60.1%) |
| 55 to 64 Years | 59 (88.1%) | 96 (88.1%) |
| 65 to 74 Years | 106 (91.4%) | 112 (88.9%) |
| 75 Years and over | 47 (85.5%) | 77 (81.0%) |
| Total | 614 (82.6%) | 642 (77.3%) |
Income Below Poverty Among Married-Couple Families in Tunkhannock borough
The poverty statistics for married-couple families in Tunkhannock borough show that 2.9% or 8 of the total 275 families live below the poverty line. Families with 1 or 2 children have the highest poverty rate of 3.6%, comprising of 4 families. On the other hand, families with 3 or 4 children have the lowest poverty rate of 0.0%, which includes 0 families.
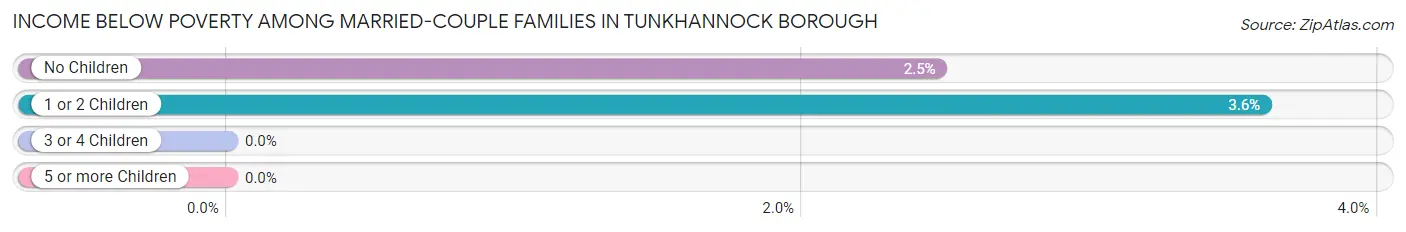
| Children | Above Poverty | Below Poverty |
| No Children | 158 (97.5%) | 4 (2.5%) |
| 1 or 2 Children | 107 (96.4%) | 4 (3.6%) |
| 3 or 4 Children | 2 (100.0%) | 0 (0.0%) |
| 5 or more Children | 0 (0.0%) | 0 (0.0%) |
| Total | 267 (97.1%) | 8 (2.9%) |
Income Below Poverty Among Single-Parent Households in Tunkhannock borough
According to the poverty data in Tunkhannock borough, 52.0% or 13 single-father households and 40.2% or 39 single-mother households are living below the poverty line. Among single-father households, those with 1 or 2 children have the highest poverty rate, with 13 households (72.2%) experiencing poverty. Likewise, among single-mother households, those with 1 or 2 children have the highest poverty rate, with 35 households (61.4%) falling below the poverty line.
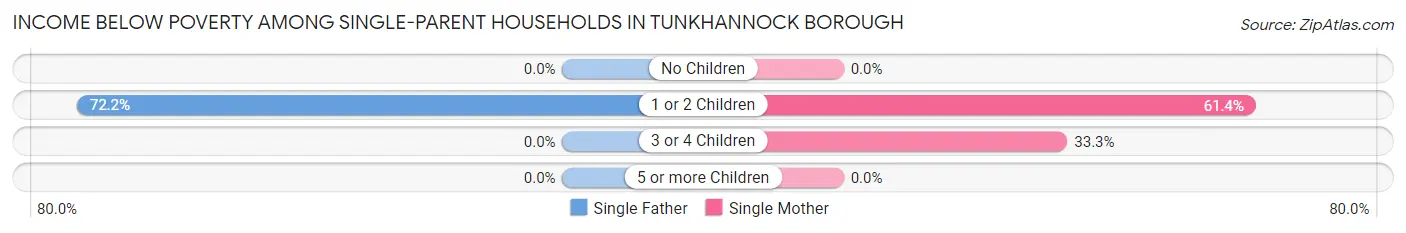
| Children | Single Father | Single Mother |
| No Children | 0 (0.0%) | 0 (0.0%) |
| 1 or 2 Children | 13 (72.2%) | 35 (61.4%) |
| 3 or 4 Children | 0 (0.0%) | 4 (33.3%) |
| 5 or more Children | 0 (0.0%) | 0 (0.0%) |
| Total | 13 (52.0%) | 39 (40.2%) |
Income Below Poverty Among Married-Couple vs Single-Parent Households in Tunkhannock borough
The poverty data for Tunkhannock borough shows that 8 of the married-couple family households (2.9%) and 52 of the single-parent households (42.6%) are living below the poverty level. Within the married-couple family households, those with 1 or 2 children have the highest poverty rate, with 4 households (3.6%) falling below the poverty line. Among the single-parent households, those with 1 or 2 children have the highest poverty rate, with 48 household (64.0%) living below poverty.
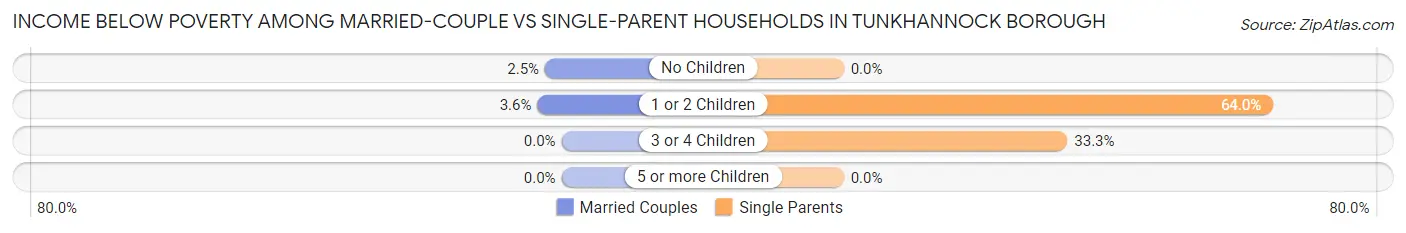
| Children | Married-Couple Families | Single-Parent Households |
| No Children | 4 (2.5%) | 0 (0.0%) |
| 1 or 2 Children | 4 (3.6%) | 48 (64.0%) |
| 3 or 4 Children | 0 (0.0%) | 4 (33.3%) |
| 5 or more Children | 0 (0.0%) | 0 (0.0%) |
| Total | 8 (2.9%) | 52 (42.6%) |
Race in Tunkhannock borough
The most populous races in Tunkhannock borough are White / Caucasian (1,546 | 94.6%), Hispanic or Latino (54 | 3.3%), and Two or more Races (54 | 3.3%).
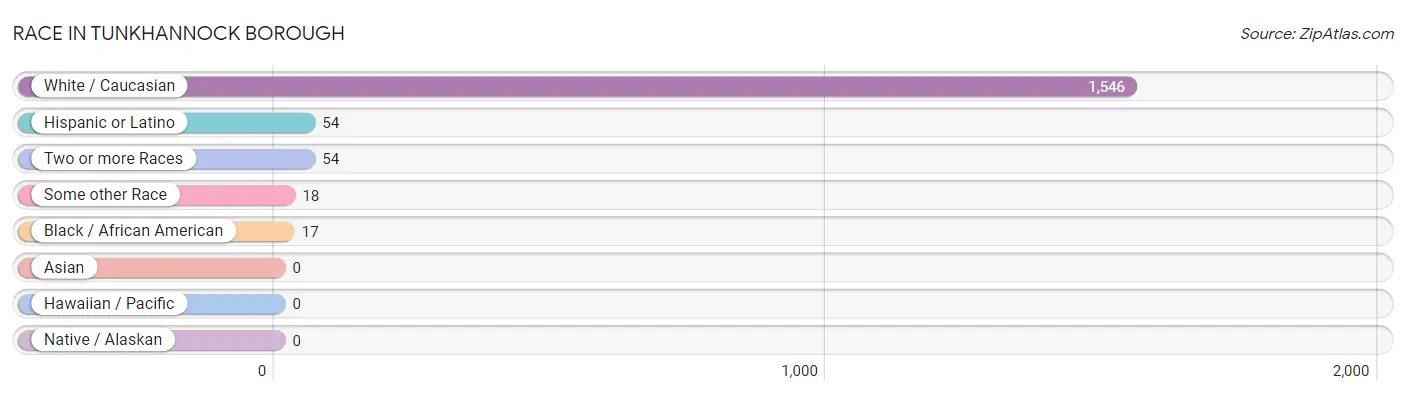
| Race | # Population | % Population |
| Asian | 0 | 0.0% |
| Black / African American | 17 | 1.0% |
| Hawaiian / Pacific | 0 | 0.0% |
| Hispanic or Latino | 54 | 3.3% |
| Native / Alaskan | 0 | 0.0% |
| White / Caucasian | 1,546 | 94.6% |
| Two or more Races | 54 | 3.3% |
| Some other Race | 18 | 1.1% |
| Total | 1,635 | 100.0% |
Ancestry in Tunkhannock borough
The most populous ancestries reported in Tunkhannock borough are Irish (326 | 19.9%), English (295 | 18.0%), German (265 | 16.2%), Polish (219 | 13.4%), and Italian (120 | 7.3%), together accounting for 74.9% of all Tunkhannock borough residents.
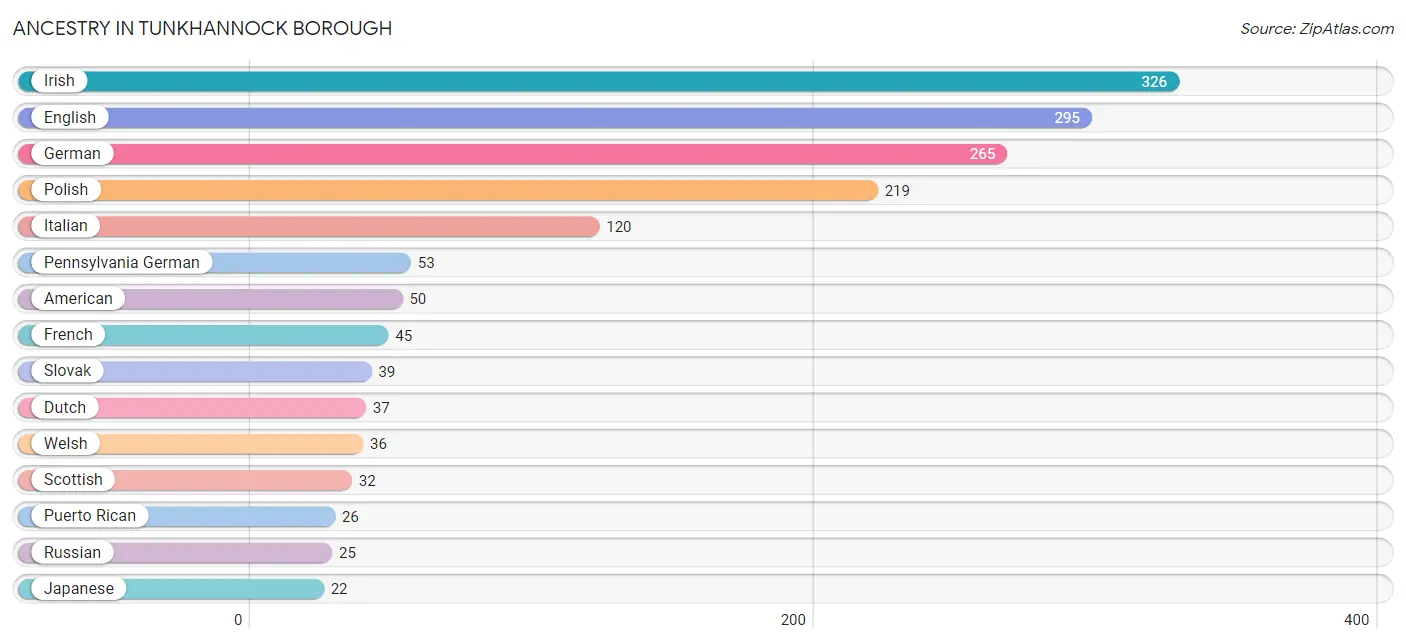
| Ancestry | # Population | % Population |
| American | 50 | 3.1% |
| Austrian | 3 | 0.2% |
| British | 4 | 0.2% |
| British West Indian | 5 | 0.3% |
| Canadian | 10 | 0.6% |
| Central American | 8 | 0.5% |
| Cuban | 18 | 1.1% |
| Dutch | 37 | 2.3% |
| Eastern European | 3 | 0.2% |
| English | 295 | 18.0% |
| European | 3 | 0.2% |
| French | 45 | 2.8% |
| French Canadian | 5 | 0.3% |
| German | 265 | 16.2% |
| Guamanian / Chamorro | 5 | 0.3% |
| Hungarian | 9 | 0.5% |
| Irish | 326 | 19.9% |
| Italian | 120 | 7.3% |
| Jamaican | 5 | 0.3% |
| Japanese | 22 | 1.3% |
| Korean | 9 | 0.5% |
| Lithuanian | 8 | 0.5% |
| Mexican | 2 | 0.1% |
| Norwegian | 10 | 0.6% |
| Pennsylvania German | 53 | 3.2% |
| Polish | 219 | 13.4% |
| Portuguese | 3 | 0.2% |
| Puerto Rican | 26 | 1.6% |
| Romanian | 10 | 0.6% |
| Russian | 25 | 1.5% |
| Salvadoran | 8 | 0.5% |
| Scandinavian | 10 | 0.6% |
| Scotch-Irish | 15 | 0.9% |
| Scottish | 32 | 2.0% |
| Slovak | 39 | 2.4% |
| Swedish | 8 | 0.5% |
| Ukrainian | 22 | 1.3% |
| Welsh | 36 | 2.2% | View All 38 Rows |
Immigrants in Tunkhannock borough
The most numerous immigrant groups reported in Tunkhannock borough came from Canada (15 | 0.9%), Europe (10 | 0.6%), Central America (8 | 0.5%), El Salvador (8 | 0.5%), and Latin America (8 | 0.5%), together accounting for 3.0% of all Tunkhannock borough residents.
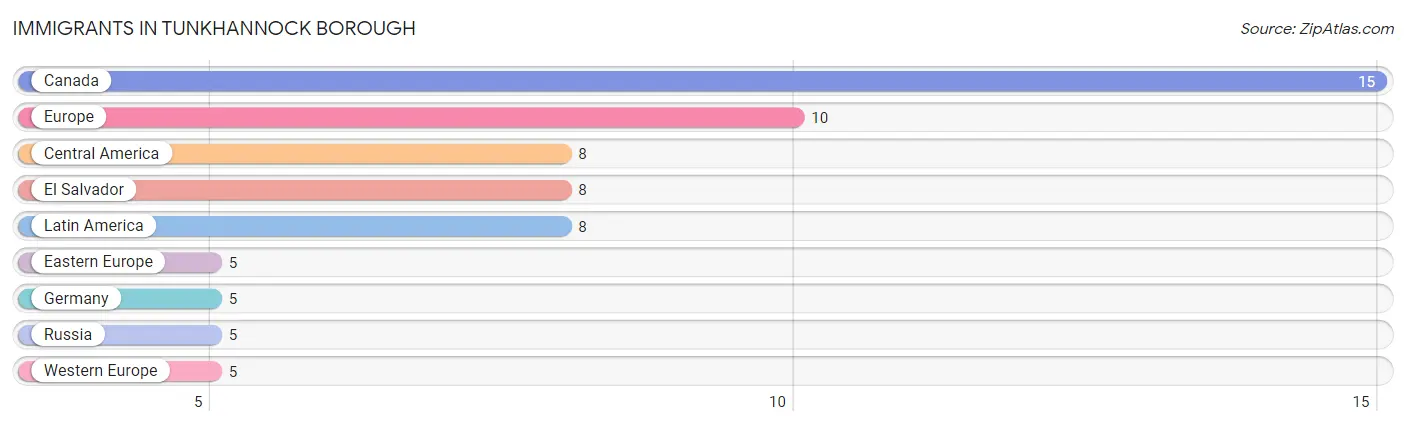
| Immigration Origin | # Population | % Population |
| Canada | 15 | 0.9% |
| Central America | 8 | 0.5% |
| Eastern Europe | 5 | 0.3% |
| El Salvador | 8 | 0.5% |
| Europe | 10 | 0.6% |
| Germany | 5 | 0.3% |
| Latin America | 8 | 0.5% |
| Russia | 5 | 0.3% |
| Western Europe | 5 | 0.3% | View All 9 Rows |
Sex and Age in Tunkhannock borough
Sex and Age in Tunkhannock borough
The most populous age groups in Tunkhannock borough are 70 to 74 Years (86 | 10.9%) for men and 15 to 19 Years (85 | 10.1%) for women.
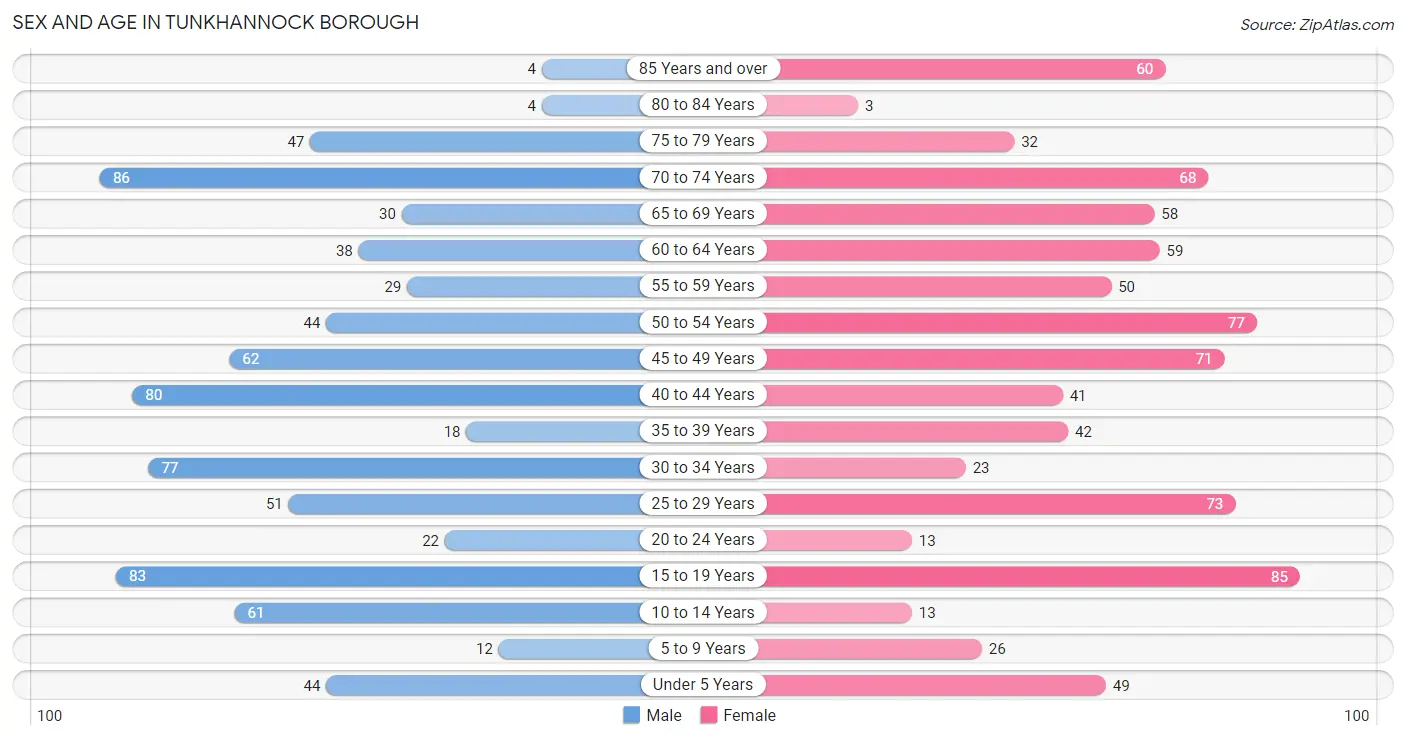
| Age Bracket | Male | Female |
| Under 5 Years | 44 (5.6%) | 49 (5.8%) |
| 5 to 9 Years | 12 (1.5%) | 26 (3.1%) |
| 10 to 14 Years | 61 (7.7%) | 13 (1.5%) |
| 15 to 19 Years | 83 (10.5%) | 85 (10.1%) |
| 20 to 24 Years | 22 (2.8%) | 13 (1.5%) |
| 25 to 29 Years | 51 (6.4%) | 73 (8.7%) |
| 30 to 34 Years | 77 (9.7%) | 23 (2.7%) |
| 35 to 39 Years | 18 (2.3%) | 42 (5.0%) |
| 40 to 44 Years | 80 (10.1%) | 41 (4.9%) |
| 45 to 49 Years | 62 (7.8%) | 71 (8.4%) |
| 50 to 54 Years | 44 (5.6%) | 77 (9.1%) |
| 55 to 59 Years | 29 (3.7%) | 50 (5.9%) |
| 60 to 64 Years | 38 (4.8%) | 59 (7.0%) |
| 65 to 69 Years | 30 (3.8%) | 58 (6.9%) |
| 70 to 74 Years | 86 (10.9%) | 68 (8.1%) |
| 75 to 79 Years | 47 (5.9%) | 32 (3.8%) |
| 80 to 84 Years | 4 (0.5%) | 3 (0.4%) |
| 85 Years and over | 4 (0.5%) | 60 (7.1%) |
| Total | 792 (100.0%) | 843 (100.0%) |
Families and Households in Tunkhannock borough
Median Family Size in Tunkhannock borough
The median family size in Tunkhannock borough is 2.75 persons per family, with married-couple families (275 | 69.3%) accounting for the largest median family size of 2.79 persons per family. On the other hand, single female/mother families (97 | 24.4%) represent the smallest median family size with 2.63 persons per family.
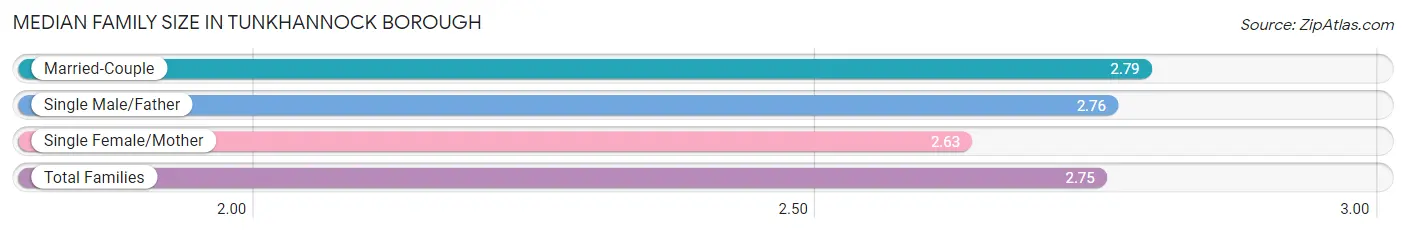
| Family Type | # Families | Family Size |
| Married-Couple | 275 (69.3%) | 2.79 |
| Single Male/Father | 25 (6.3%) | 2.76 |
| Single Female/Mother | 97 (24.4%) | 2.63 |
| Total Families | 397 (100.0%) | 2.75 |
Median Household Size in Tunkhannock borough
The median household size in Tunkhannock borough is 2.08 persons per household, with single male/father households (25 | 3.3%) accounting for the largest median household size of 3.36 persons per household. non-family households (352 | 47.0%) represent the smallest median household size with 1.18 persons per household.
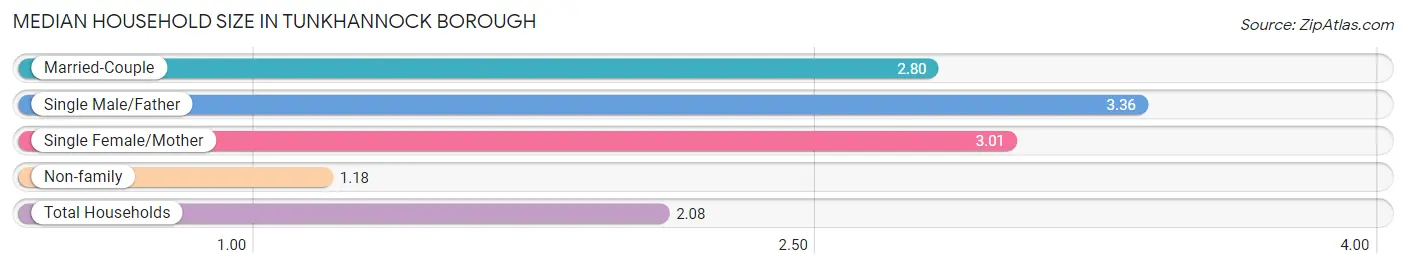
| Household Type | # Households | Household Size |
| Married-Couple | 275 (36.7%) | 2.80 |
| Single Male/Father | 25 (3.3%) | 3.36 |
| Single Female/Mother | 97 (13.0%) | 3.01 |
| Non-family | 352 (47.0%) | 1.18 |
| Total Households | 749 (100.0%) | 2.08 |
Household Size by Marriage Status in Tunkhannock borough
Out of a total of 749 households in Tunkhannock borough, 397 (53.0%) are family households, while 352 (47.0%) are nonfamily households. The most numerous type of family households are 2-person households, comprising 193, and the most common type of nonfamily households are 1-person households, comprising 303.
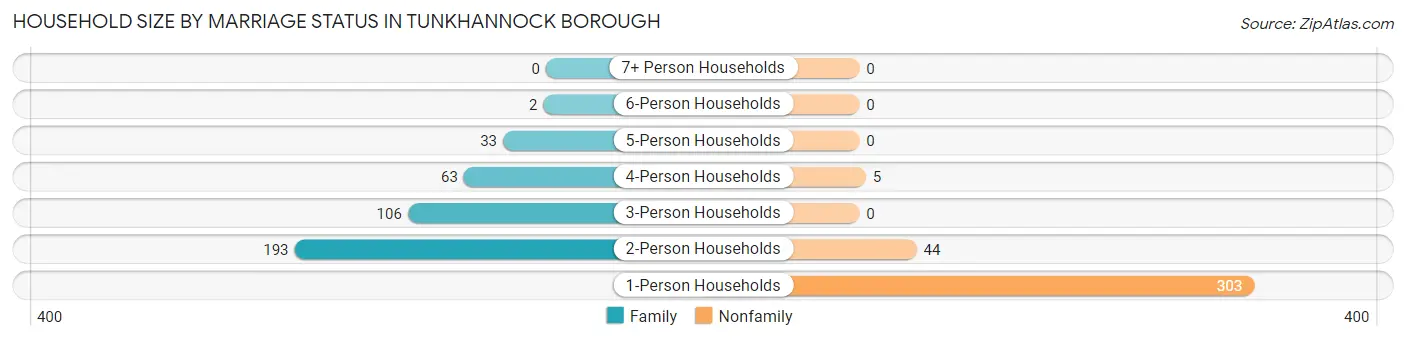
| Household Size | Family Households | Nonfamily Households |
| 1-Person Households | - | 303 (40.5%) |
| 2-Person Households | 193 (25.8%) | 44 (5.9%) |
| 3-Person Households | 106 (14.1%) | 0 (0.0%) |
| 4-Person Households | 63 (8.4%) | 5 (0.7%) |
| 5-Person Households | 33 (4.4%) | 0 (0.0%) |
| 6-Person Households | 2 (0.3%) | 0 (0.0%) |
| 7+ Person Households | 0 (0.0%) | 0 (0.0%) |
| Total | 397 (53.0%) | 352 (47.0%) |
Female Fertility in Tunkhannock borough
Fertility by Age in Tunkhannock borough
Average fertility rate in Tunkhannock borough is 24.0 births per 1,000 women. Women in the age bracket of 20 to 34 years have the highest fertility rate with 83.0 births per 1,000 women. Women in the age bracket of 20 to 34 years acount for 100.0% of all women with births.
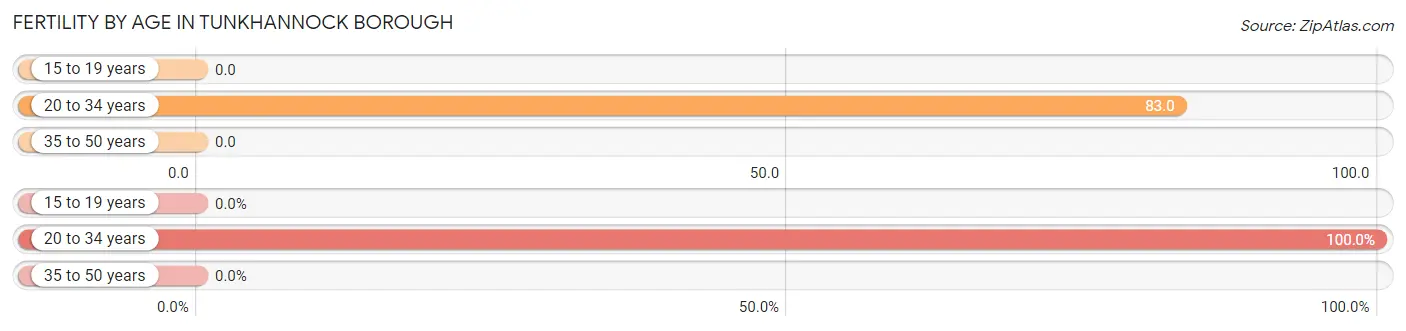
| Age Bracket | Women with Births | Births / 1,000 Women |
| 15 to 19 years | 0 (0.0%) | 0.0 |
| 20 to 34 years | 9 (100.0%) | 83.0 |
| 35 to 50 years | 0 (0.0%) | 0.0 |
| Total | 9 (100.0%) | 24.0 |
Fertility by Age by Marriage Status in Tunkhannock borough
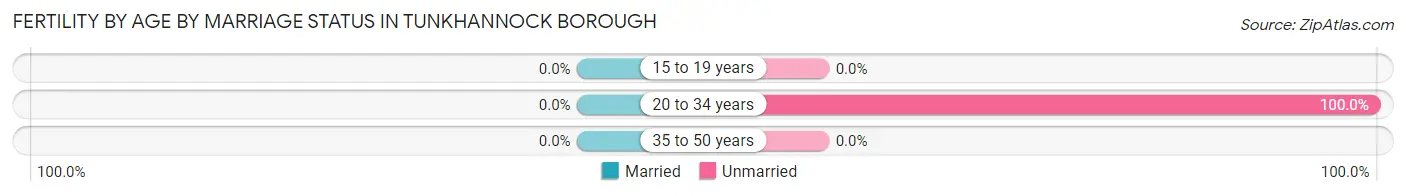
| Age Bracket | Married | Unmarried |
| 15 to 19 years | 0 (0.0%) | 0 (0.0%) |
| 20 to 34 years | 0 (0.0%) | 9 (100.0%) |
| 35 to 50 years | 0 (0.0%) | 0 (0.0%) |
| Total | 0 (0.0%) | 9 (100.0%) |
Fertility by Education in Tunkhannock borough
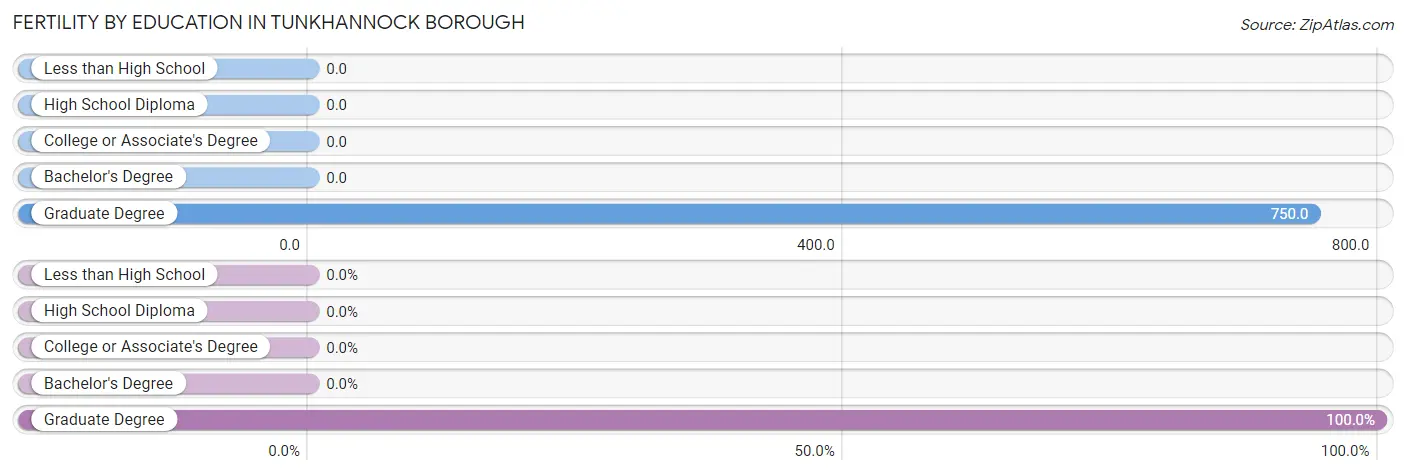
| Educational Attainment | Women with Births | Births / 1,000 Women |
| Less than High School | 0 (0.0%) | 0.0 |
| High School Diploma | 0 (0.0%) | 0.0 |
| College or Associate's Degree | 0 (0.0%) | 0.0 |
| Bachelor's Degree | 0 (0.0%) | 0.0 |
| Graduate Degree | 9 (100.0%) | 750.0 |
| Total | 9 (100.0%) | 24.0 |
Fertility by Education by Marriage Status in Tunkhannock borough
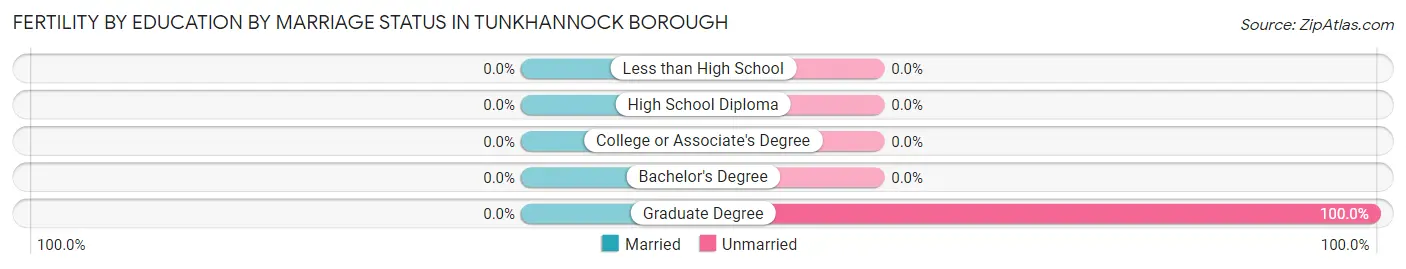
| Educational Attainment | Married | Unmarried |
| Less than High School | 0 (0.0%) | 0 (0.0%) |
| High School Diploma | 0 (0.0%) | 0 (0.0%) |
| College or Associate's Degree | 0 (0.0%) | 0 (0.0%) |
| Bachelor's Degree | 0 (0.0%) | 0 (0.0%) |
| Graduate Degree | 0 (0.0%) | 9 (100.0%) |
| Total | 0 (0.0%) | 9 (100.0%) |
Employment Characteristics in Tunkhannock borough
Employment by Class of Employer in Tunkhannock borough
Among the 701 employed individuals in Tunkhannock borough, private company employees (582 | 83.0%), local government employees (41 | 5.9%), and not-for-profit organizations (33 | 4.7%) make up the most common classes of employment.
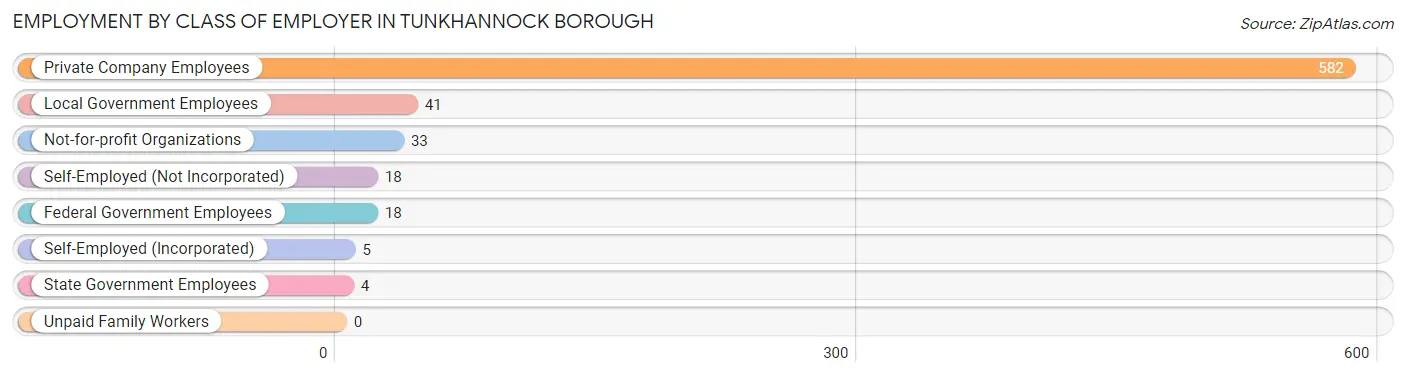
| Employer Class | # Employees | % Employees |
| Private Company Employees | 582 | 83.0% |
| Self-Employed (Incorporated) | 5 | 0.7% |
| Self-Employed (Not Incorporated) | 18 | 2.6% |
| Not-for-profit Organizations | 33 | 4.7% |
| Local Government Employees | 41 | 5.9% |
| State Government Employees | 4 | 0.6% |
| Federal Government Employees | 18 | 2.6% |
| Unpaid Family Workers | 0 | 0.0% |
| Total | 701 | 100.0% |
Employment Status by Age in Tunkhannock borough
According to the labor force statistics for Tunkhannock borough, out of the total population over 16 years of age (1,394), 52.8% or 736 individuals are in the labor force, with 4.5% or 33 of them unemployed. The age group with the highest labor force participation rate is 25 to 29 years, with 87.9% or 109 individuals in the labor force. Within the labor force, the 75 years and over age range has the highest percentage of unemployed individuals, with 100.0% or 3 of them being unemployed.
| Age Bracket | In Labor Force | Unemployed |
| 16 to 19 Years | 69 (52.3%) | 5 (7.2%) |
| 20 to 24 Years | 17 (48.6%) | 0 (0.0%) |
| 25 to 29 Years | 109 (87.9%) | 10 (9.2%) |
| 30 to 34 Years | 55 (55.0%) | 0 (0.0%) |
| 35 to 44 Years | 153 (84.5%) | 0 (0.0%) |
| 45 to 54 Years | 192 (75.6%) | 6 (3.1%) |
| 55 to 59 Years | 46 (58.2%) | 0 (0.0%) |
| 60 to 64 Years | 43 (44.3%) | 0 (0.0%) |
| 65 to 74 Years | 49 (20.2%) | 9 (18.4%) |
| 75 Years and over | 3 (2.0%) | 3 (100.0%) |
| Total | 736 (52.8%) | 33 (4.5%) |
Employment Status by Educational Attainment in Tunkhannock borough
According to labor force statistics for Tunkhannock borough, 71.6% of individuals (598) out of the total population between 25 and 64 years of age (835) are in the labor force, with 2.7% or 16 of them being unemployed. The group with the highest labor force participation rate are those with the educational attainment of college / associate degree, with 83.4% or 201 individuals in the labor force. Within the labor force, individuals with college / associate degree education have the highest percentage of unemployment, with 8.0% or 16 of them being unemployed.
| Educational Attainment | In Labor Force | Unemployed |
| Less than High School | 35 (63.6%) | 0 (0.0%) |
| High School Diploma | 203 (58.3%) | 0 (0.0%) |
| College / Associate Degree | 201 (83.4%) | 19 (8.0%) |
| Bachelor's Degree or higher | 159 (83.2%) | 0 (0.0%) |
| Total | 598 (71.6%) | 23 (2.7%) |
Employment Occupations by Sex in Tunkhannock borough
Management, Business, Science and Arts Occupations
The most common Management, Business, Science and Arts occupations in Tunkhannock borough are Health Diagnosing & Treating (63 | 9.0%), Business & Financial (54 | 7.7%), Health Technologists (54 | 7.7%), Community & Social Service (47 | 6.7%), and Management (45 | 6.4%).
Management, Business, Science and Arts Occupations by Sex
Within the Management, Business, Science and Arts occupations in Tunkhannock borough, the most male-oriented occupations are Architecture & Engineering (76.9%), Business & Financial (66.7%), and Computers, Engineering & Science (47.1%), while the most female-oriented occupations are Legal Services & Support (100.0%), Community & Social Service (83.0%), and Management (80.0%).
| Occupation | Male | Female |
| Management | 9 (20.0%) | 36 (80.0%) |
| Business & Financial | 36 (66.7%) | 18 (33.3%) |
| Computers, Engineering & Science | 16 (47.1%) | 18 (52.9%) |
| Computers & Mathematics | 6 (28.6%) | 15 (71.4%) |
| Architecture & Engineering | 10 (76.9%) | 3 (23.1%) |
| Life, Physical & Social Science | 0 (0.0%) | 0 (0.0%) |
| Community & Social Service | 8 (17.0%) | 39 (83.0%) |
| Education, Arts & Media | 0 (0.0%) | 0 (0.0%) |
| Legal Services & Support | 0 (0.0%) | 20 (100.0%) |
| Education Instruction & Library | 8 (29.6%) | 19 (70.4%) |
| Arts, Media & Entertainment | 0 (0.0%) | 0 (0.0%) |
| Health Diagnosing & Treating | 15 (23.8%) | 48 (76.2%) |
| Health Technologists | 15 (27.8%) | 39 (72.2%) |
| Total (Category) | 84 (34.6%) | 159 (65.4%) |
| Total (Overall) | 342 (48.6%) | 361 (51.3%) |
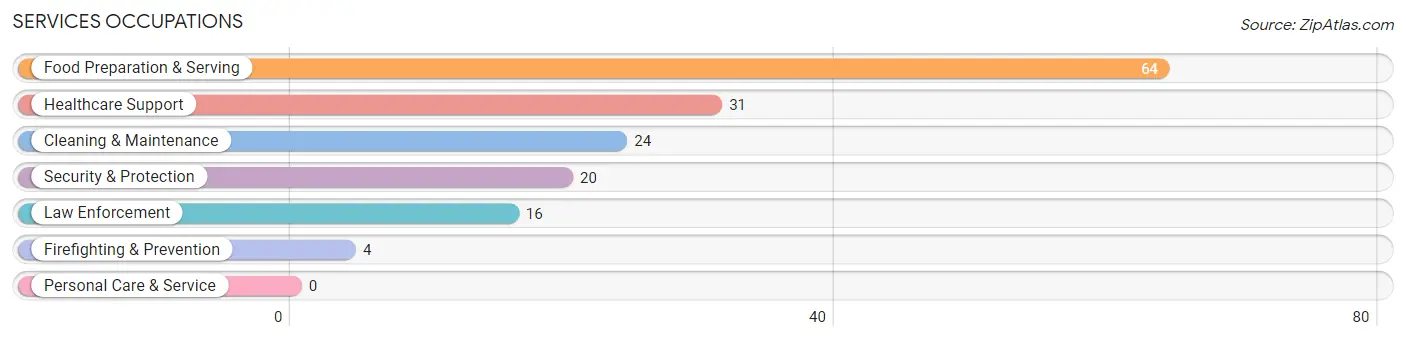
Services Occupations
The most common Services occupations in Tunkhannock borough are Food Preparation & Serving (64 | 9.1%), Healthcare Support (31 | 4.4%), Cleaning & Maintenance (24 | 3.4%), Security & Protection (20 | 2.8%), and Law Enforcement (16 | 2.3%).
Services Occupations by Sex
Within the Services occupations in Tunkhannock borough, the most male-oriented occupations are Healthcare Support (41.9%), Cleaning & Maintenance (41.7%), and Food Preparation & Serving (28.1%), while the most female-oriented occupations are Firefighting & Prevention (100.0%), Security & Protection (80.0%), and Law Enforcement (75.0%).
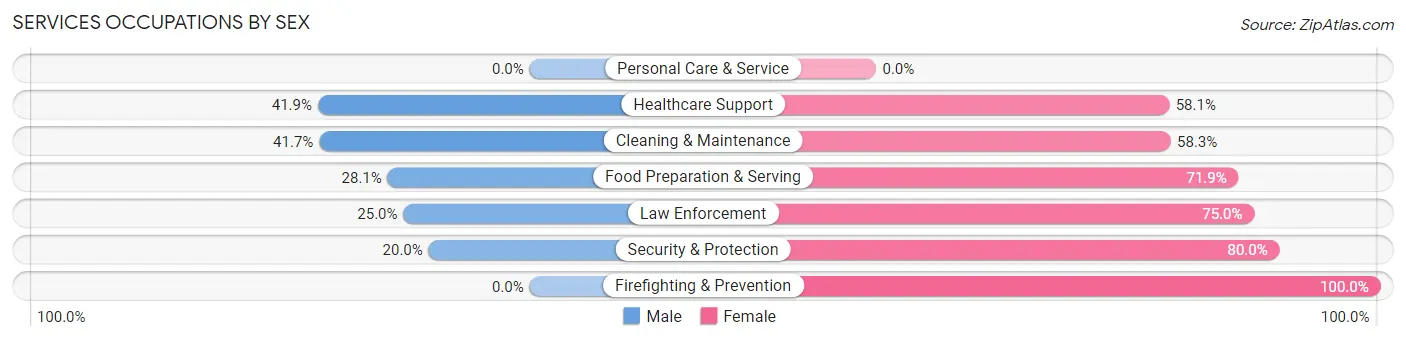
| Occupation | Male | Female |
| Healthcare Support | 13 (41.9%) | 18 (58.1%) |
| Security & Protection | 4 (20.0%) | 16 (80.0%) |
| Firefighting & Prevention | 0 (0.0%) | 4 (100.0%) |
| Law Enforcement | 4 (25.0%) | 12 (75.0%) |
| Food Preparation & Serving | 18 (28.1%) | 46 (71.9%) |
| Cleaning & Maintenance | 10 (41.7%) | 14 (58.3%) |
| Personal Care & Service | 0 (0.0%) | 0 (0.0%) |
| Total (Category) | 45 (32.4%) | 94 (67.6%) |
| Total (Overall) | 342 (48.6%) | 361 (51.3%) |
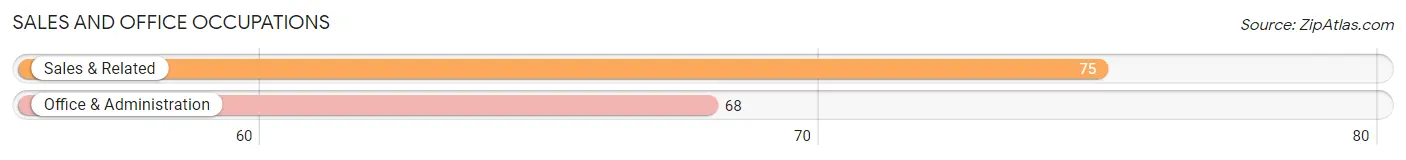
Sales and Office Occupations
The most common Sales and Office occupations in Tunkhannock borough are Sales & Related (75 | 10.7%), and Office & Administration (68 | 9.7%).
Sales and Office Occupations by Sex
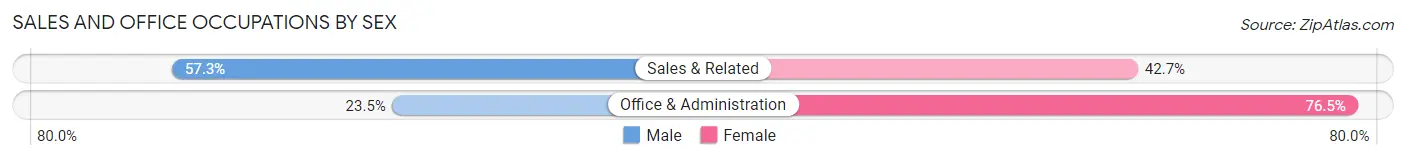
| Occupation | Male | Female |
| Sales & Related | 43 (57.3%) | 32 (42.7%) |
| Office & Administration | 16 (23.5%) | 52 (76.5%) |
| Total (Category) | 59 (41.3%) | 84 (58.7%) |
| Total (Overall) | 342 (48.6%) | 361 (51.3%) |
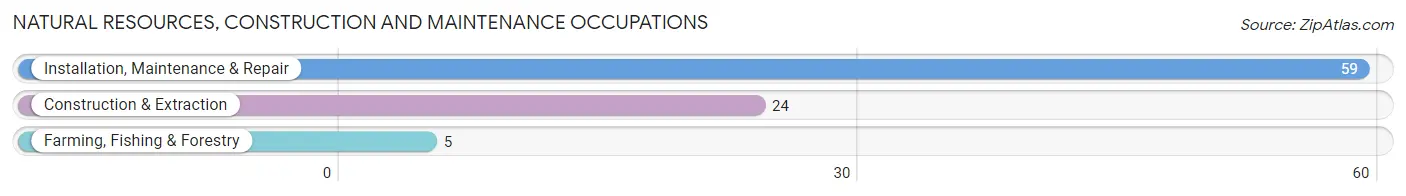
Natural Resources, Construction and Maintenance Occupations
The most common Natural Resources, Construction and Maintenance occupations in Tunkhannock borough are Installation, Maintenance & Repair (59 | 8.4%), Construction & Extraction (24 | 3.4%), and Farming, Fishing & Forestry (5 | 0.7%).
Natural Resources, Construction and Maintenance Occupations by Sex
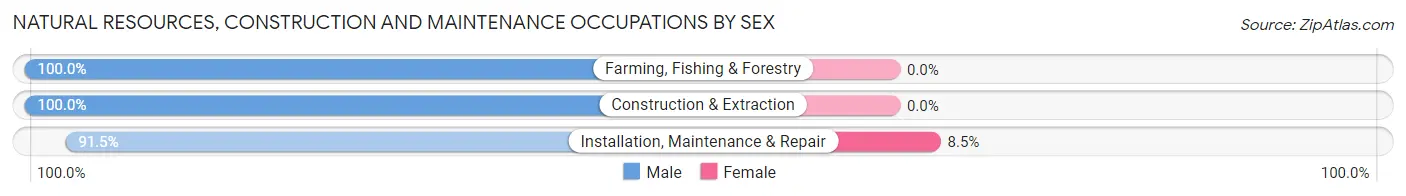
| Occupation | Male | Female |
| Farming, Fishing & Forestry | 5 (100.0%) | 0 (0.0%) |
| Construction & Extraction | 24 (100.0%) | 0 (0.0%) |
| Installation, Maintenance & Repair | 54 (91.5%) | 5 (8.5%) |
| Total (Category) | 83 (94.3%) | 5 (5.7%) |
| Total (Overall) | 342 (48.6%) | 361 (51.3%) |
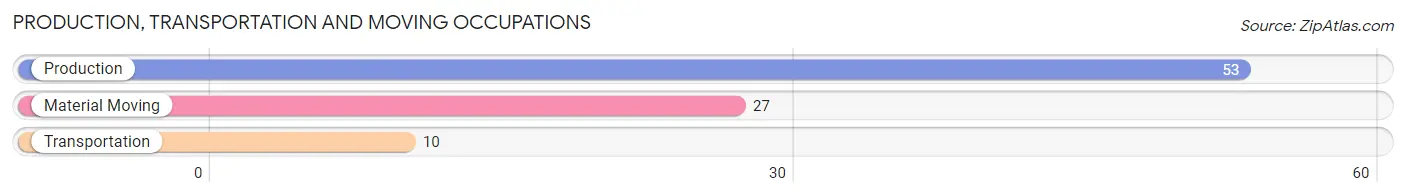
Production, Transportation and Moving Occupations
The most common Production, Transportation and Moving occupations in Tunkhannock borough are Production (53 | 7.5%), Material Moving (27 | 3.8%), and Transportation (10 | 1.4%).
Production, Transportation and Moving Occupations by Sex
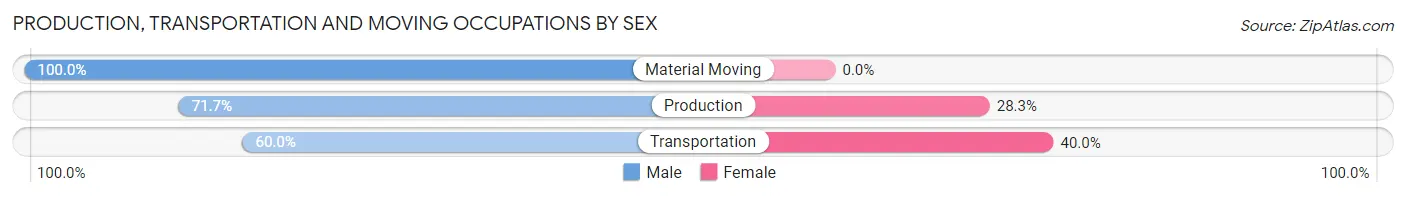
| Occupation | Male | Female |
| Production | 38 (71.7%) | 15 (28.3%) |
| Transportation | 6 (60.0%) | 4 (40.0%) |
| Material Moving | 27 (100.0%) | 0 (0.0%) |
| Total (Category) | 71 (78.9%) | 19 (21.1%) |
| Total (Overall) | 342 (48.6%) | 361 (51.3%) |
Employment Industries by Sex in Tunkhannock borough
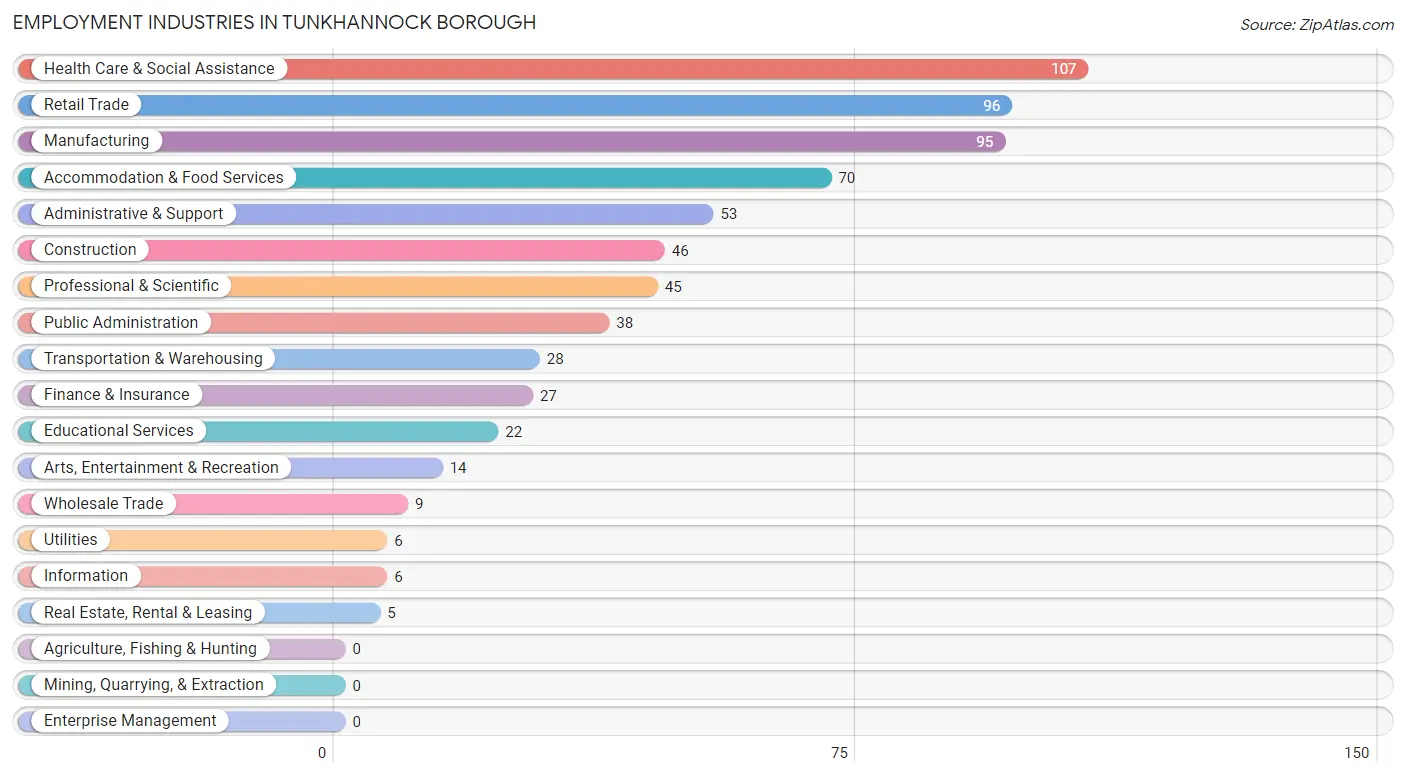
Employment Industries in Tunkhannock borough
The major employment industries in Tunkhannock borough include Health Care & Social Assistance (107 | 15.2%), Retail Trade (96 | 13.7%), Manufacturing (95 | 13.5%), Accommodation & Food Services (70 | 10.0%), and Administrative & Support (53 | 7.5%).
Employment Industries by Sex in Tunkhannock borough
The Tunkhannock borough industries that see more men than women are Construction (100.0%), Wholesale Trade (100.0%), and Utilities (100.0%), whereas the industries that tend to have a higher number of women are Real Estate, Rental & Leasing (100.0%), Arts, Entertainment & Recreation (78.6%), and Administrative & Support (75.5%).
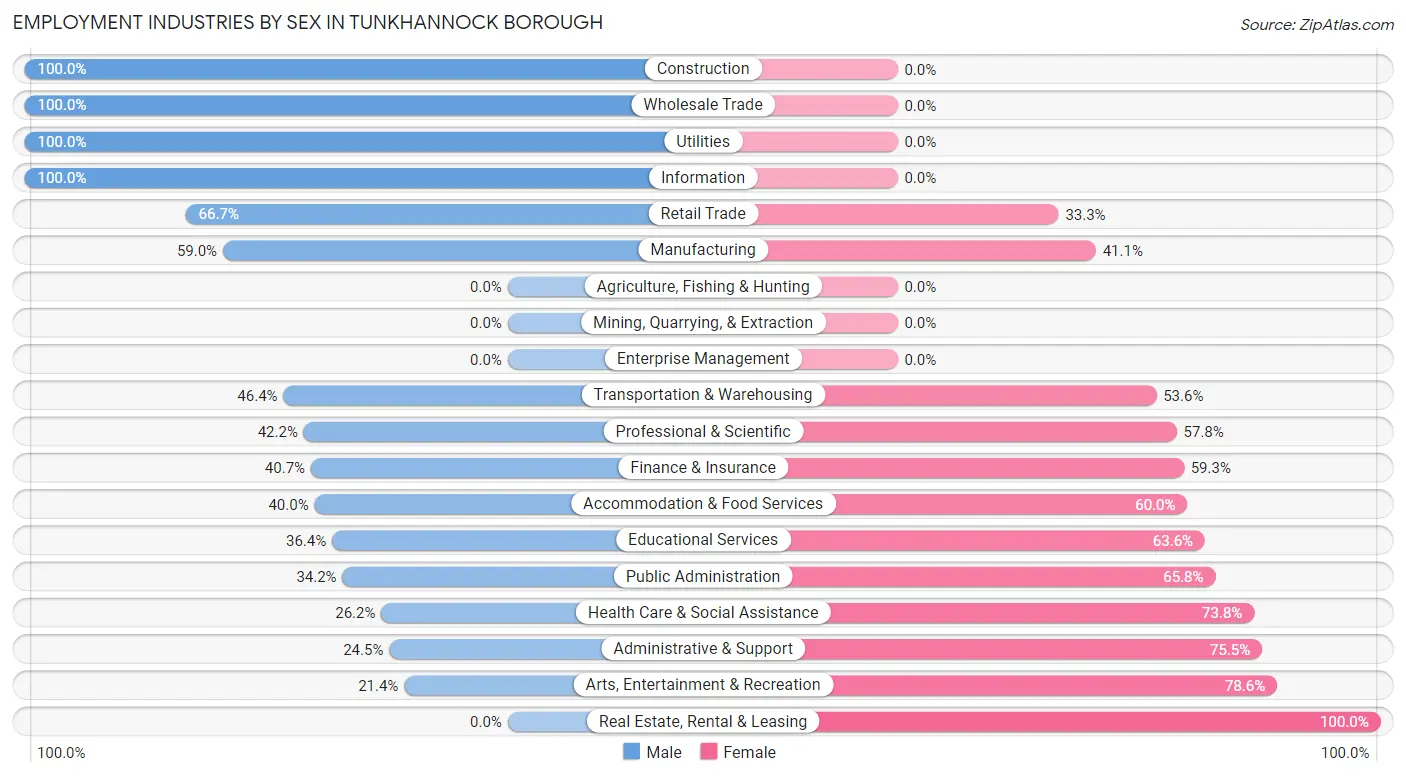
| Industry | Male | Female |
| Agriculture, Fishing & Hunting | 0 (0.0%) | 0 (0.0%) |
| Mining, Quarrying, & Extraction | 0 (0.0%) | 0 (0.0%) |
| Construction | 46 (100.0%) | 0 (0.0%) |
| Manufacturing | 56 (59.0%) | 39 (41.0%) |
| Wholesale Trade | 9 (100.0%) | 0 (0.0%) |
| Retail Trade | 64 (66.7%) | 32 (33.3%) |
| Transportation & Warehousing | 13 (46.4%) | 15 (53.6%) |
| Utilities | 6 (100.0%) | 0 (0.0%) |
| Information | 6 (100.0%) | 0 (0.0%) |
| Finance & Insurance | 11 (40.7%) | 16 (59.3%) |
| Real Estate, Rental & Leasing | 0 (0.0%) | 5 (100.0%) |
| Professional & Scientific | 19 (42.2%) | 26 (57.8%) |
| Enterprise Management | 0 (0.0%) | 0 (0.0%) |
| Administrative & Support | 13 (24.5%) | 40 (75.5%) |
| Educational Services | 8 (36.4%) | 14 (63.6%) |
| Health Care & Social Assistance | 28 (26.2%) | 79 (73.8%) |
| Arts, Entertainment & Recreation | 3 (21.4%) | 11 (78.6%) |
| Accommodation & Food Services | 28 (40.0%) | 42 (60.0%) |
| Public Administration | 13 (34.2%) | 25 (65.8%) |
| Total | 342 (48.6%) | 361 (51.3%) |
Education in Tunkhannock borough
School Enrollment in Tunkhannock borough
The most common levels of schooling among the 272 students in Tunkhannock borough are high school (121 | 44.5%), middle school (53 | 19.5%), and elementary school (44 | 16.2%).
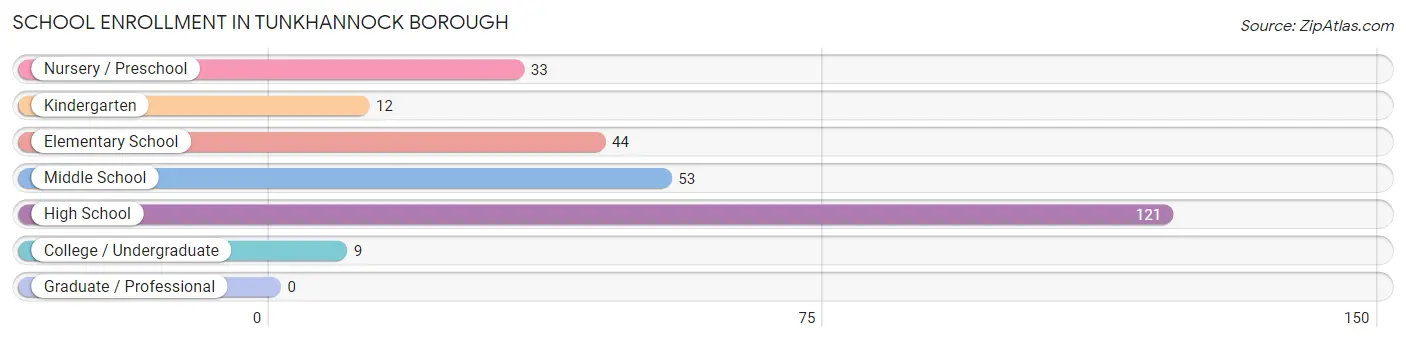
| School Level | # Students | % Students |
| Nursery / Preschool | 33 | 12.1% |
| Kindergarten | 12 | 4.4% |
| Elementary School | 44 | 16.2% |
| Middle School | 53 | 19.5% |
| High School | 121 | 44.5% |
| College / Undergraduate | 9 | 3.3% |
| Graduate / Professional | 0 | 0.0% |
| Total | 272 | 100.0% |
School Enrollment by Age by Funding Source in Tunkhannock borough
Out of a total of 272 students who are enrolled in schools in Tunkhannock borough, 18 (6.6%) attend a private institution, while the remaining 254 (93.4%) are enrolled in public schools. The age group of 18 to 19 year olds has the highest likelihood of being enrolled in private schools, with 1 (16.7% in the age bracket) enrolled. Conversely, the age group of 3 to 4 year olds has the lowest likelihood of being enrolled in a private school, with 33 (100.0% in the age bracket) attending a public institution.
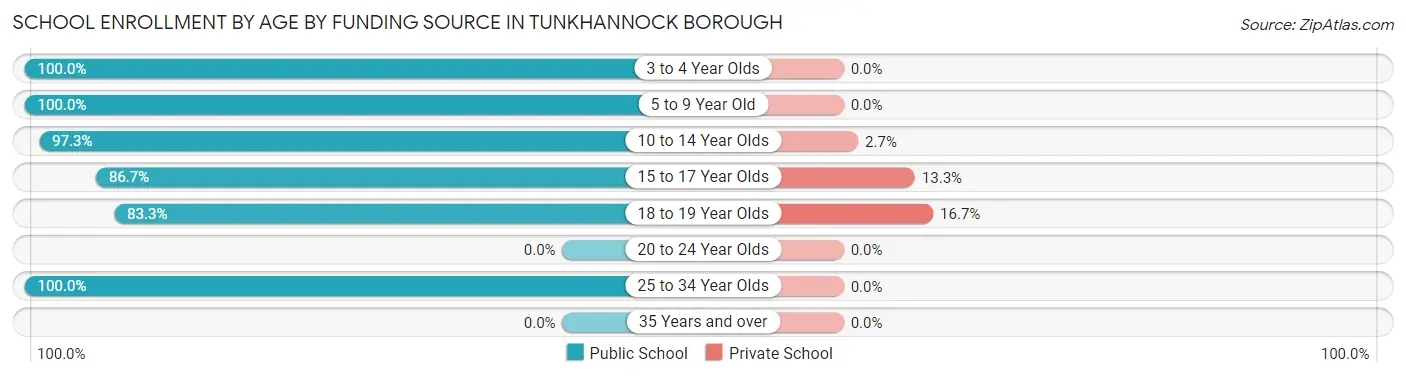
| Age Bracket | Public School | Private School |
| 3 to 4 Year Olds | 33 (100.0%) | 0 (0.0%) |
| 5 to 9 Year Old | 38 (100.0%) | 0 (0.0%) |
| 10 to 14 Year Olds | 72 (97.3%) | 2 (2.7%) |
| 15 to 17 Year Olds | 98 (86.7%) | 15 (13.3%) |
| 18 to 19 Year Olds | 5 (83.3%) | 1 (16.7%) |
| 20 to 24 Year Olds | 0 (0.0%) | 0 (0.0%) |
| 25 to 34 Year Olds | 8 (100.0%) | 0 (0.0%) |
| 35 Years and over | 0 (0.0%) | 0 (0.0%) |
| Total | 254 (93.4%) | 18 (6.6%) |
Educational Attainment by Field of Study in Tunkhannock borough
Education (79 | 20.6%), business (49 | 12.8%), psychology (47 | 12.2%), computers & mathematics (36 | 9.4%), and literature & languages (34 | 8.8%) are the most common fields of study among 384 individuals in Tunkhannock borough who have obtained a bachelor's degree or higher.
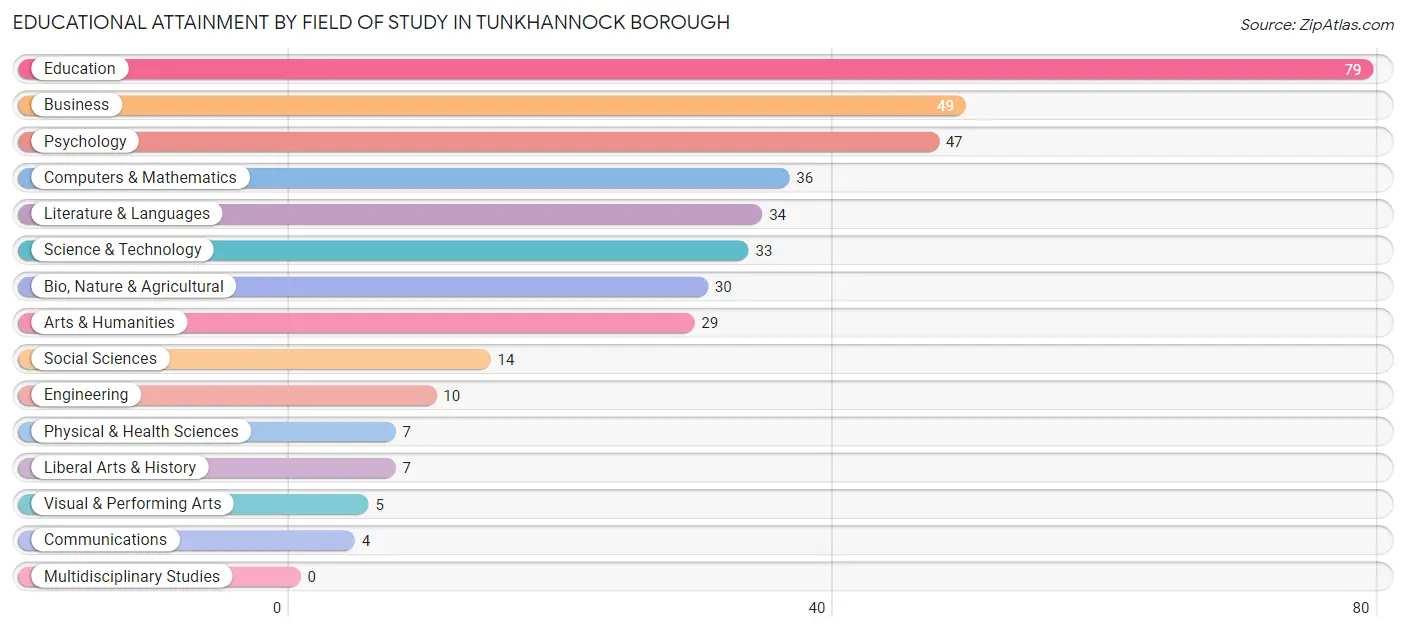
| Field of Study | # Graduates | % Graduates |
| Computers & Mathematics | 36 | 9.4% |
| Bio, Nature & Agricultural | 30 | 7.8% |
| Physical & Health Sciences | 7 | 1.8% |
| Psychology | 47 | 12.2% |
| Social Sciences | 14 | 3.6% |
| Engineering | 10 | 2.6% |
| Multidisciplinary Studies | 0 | 0.0% |
| Science & Technology | 33 | 8.6% |
| Business | 49 | 12.8% |
| Education | 79 | 20.6% |
| Literature & Languages | 34 | 8.8% |
| Liberal Arts & History | 7 | 1.8% |
| Visual & Performing Arts | 5 | 1.3% |
| Communications | 4 | 1.0% |
| Arts & Humanities | 29 | 7.5% |
| Total | 384 | 100.0% |
Transportation & Commute in Tunkhannock borough
Vehicle Availability by Sex in Tunkhannock borough
The most prevalent vehicle ownership categories in Tunkhannock borough are males with 2 vehicles (177, accounting for 51.7%) and females with 2 vehicles (157, making up 49.9%).
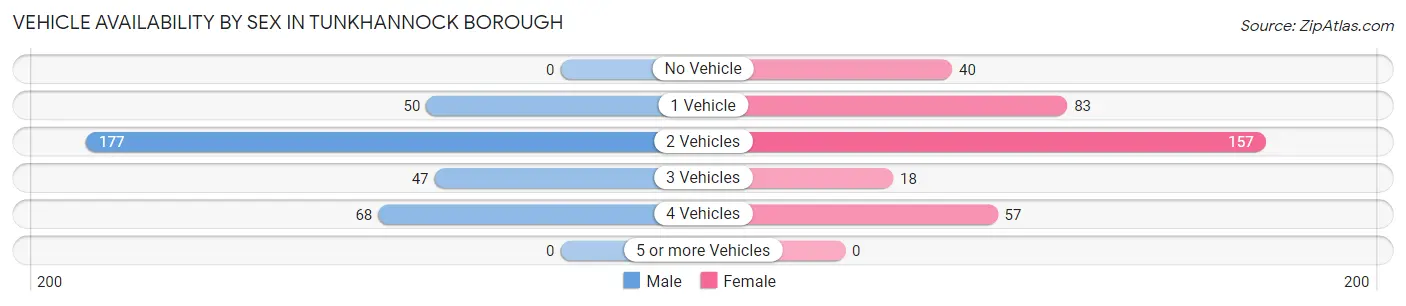
| Vehicles Available | Male | Female |
| No Vehicle | 0 (0.0%) | 40 (11.3%) |
| 1 Vehicle | 50 (14.6%) | 83 (23.4%) |
| 2 Vehicles | 177 (51.7%) | 157 (44.2%) |
| 3 Vehicles | 47 (13.7%) | 18 (5.1%) |
| 4 Vehicles | 68 (19.9%) | 57 (16.1%) |
| 5 or more Vehicles | 0 (0.0%) | 0 (0.0%) |
| Total | 342 (100.0%) | 355 (100.0%) |
Commute Time in Tunkhannock borough
The most frequently occuring commute durations in Tunkhannock borough are 5 to 9 minutes (176 commuters, 26.8%), 10 to 14 minutes (110 commuters, 16.7%), and 15 to 19 minutes (93 commuters, 14.2%).
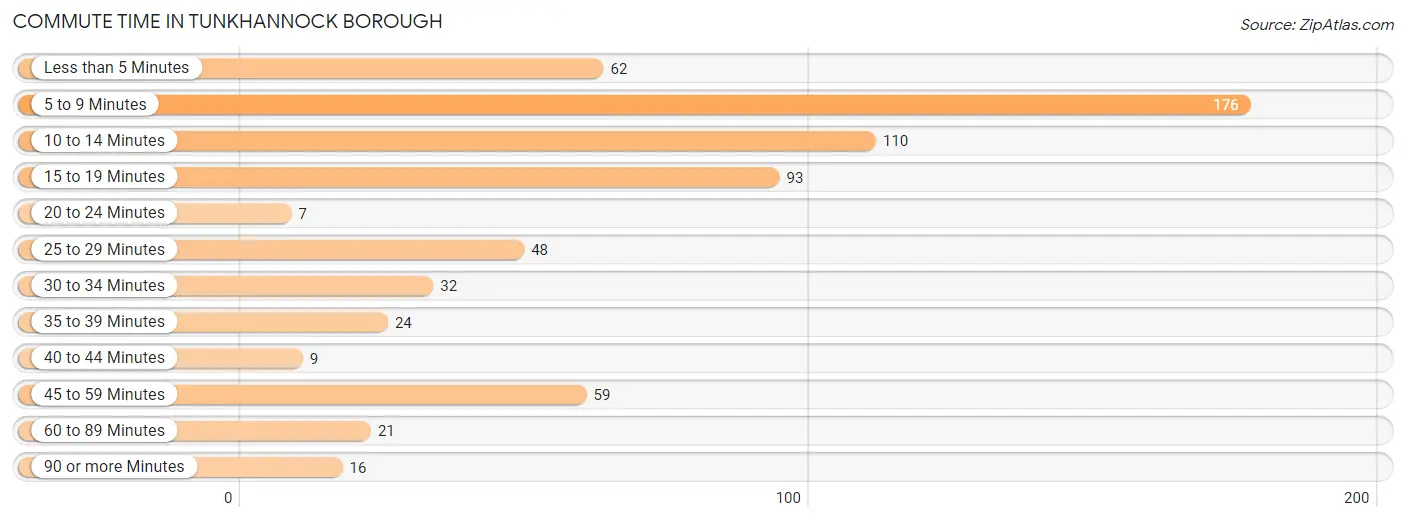
| Commute Time | # Commuters | % Commuters |
| Less than 5 Minutes | 62 | 9.4% |
| 5 to 9 Minutes | 176 | 26.8% |
| 10 to 14 Minutes | 110 | 16.7% |
| 15 to 19 Minutes | 93 | 14.2% |
| 20 to 24 Minutes | 7 | 1.1% |
| 25 to 29 Minutes | 48 | 7.3% |
| 30 to 34 Minutes | 32 | 4.9% |
| 35 to 39 Minutes | 24 | 3.6% |
| 40 to 44 Minutes | 9 | 1.4% |
| 45 to 59 Minutes | 59 | 9.0% |
| 60 to 89 Minutes | 21 | 3.2% |
| 90 or more Minutes | 16 | 2.4% |
Commute Time by Sex in Tunkhannock borough
The most common commute times in Tunkhannock borough are 5 to 9 minutes (61 commuters, 18.8%) for males and 5 to 9 minutes (115 commuters, 34.5%) for females.
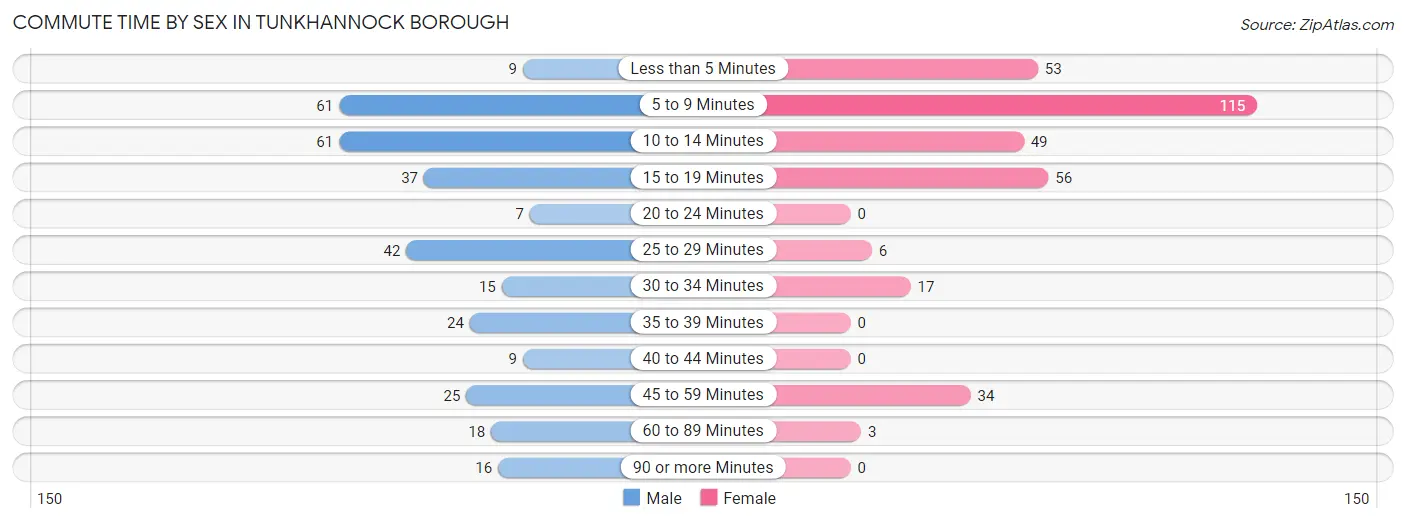
| Commute Time | Male | Female |
| Less than 5 Minutes | 9 (2.8%) | 53 (15.9%) |
| 5 to 9 Minutes | 61 (18.8%) | 115 (34.5%) |
| 10 to 14 Minutes | 61 (18.8%) | 49 (14.7%) |
| 15 to 19 Minutes | 37 (11.4%) | 56 (16.8%) |
| 20 to 24 Minutes | 7 (2.2%) | 0 (0.0%) |
| 25 to 29 Minutes | 42 (13.0%) | 6 (1.8%) |
| 30 to 34 Minutes | 15 (4.6%) | 17 (5.1%) |
| 35 to 39 Minutes | 24 (7.4%) | 0 (0.0%) |
| 40 to 44 Minutes | 9 (2.8%) | 0 (0.0%) |
| 45 to 59 Minutes | 25 (7.7%) | 34 (10.2%) |
| 60 to 89 Minutes | 18 (5.6%) | 3 (0.9%) |
| 90 or more Minutes | 16 (4.9%) | 0 (0.0%) |
Time of Departure to Work by Sex in Tunkhannock borough
The most frequent times of departure to work in Tunkhannock borough are 6:00 AM to 6:29 AM (58, 17.9%) for males and 4:00 PM to 11:59 PM (78, 23.4%) for females.
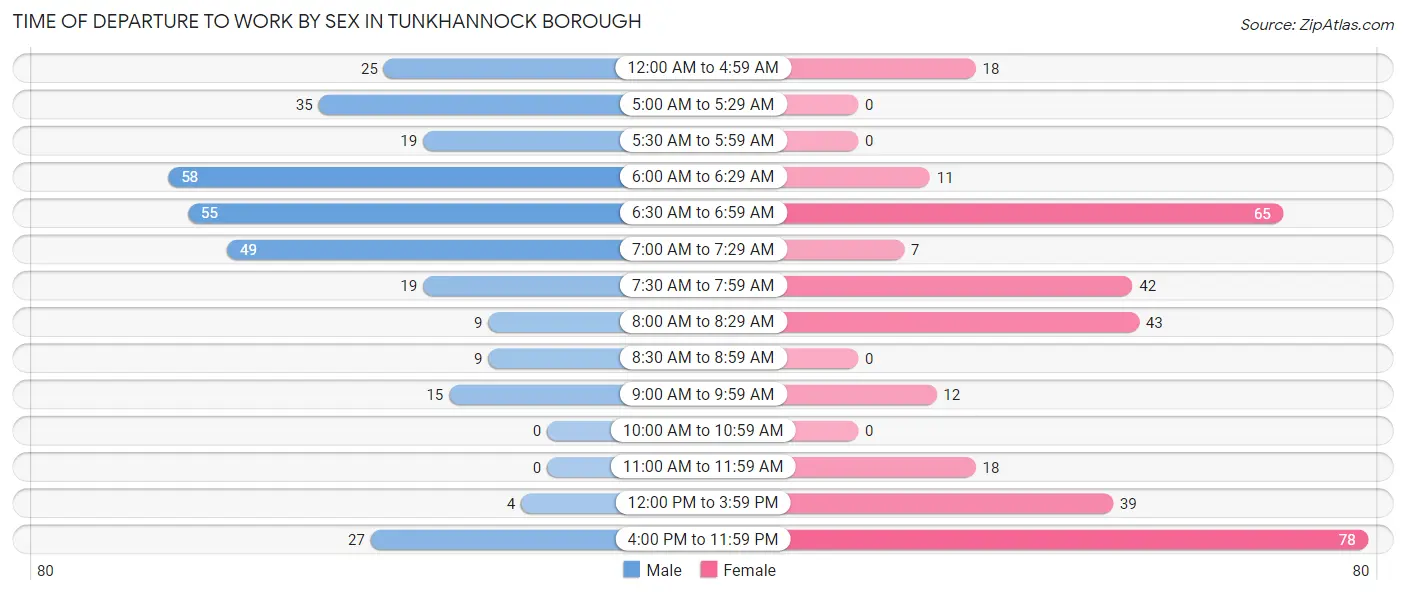
| Time of Departure | Male | Female |
| 12:00 AM to 4:59 AM | 25 (7.7%) | 18 (5.4%) |
| 5:00 AM to 5:29 AM | 35 (10.8%) | 0 (0.0%) |
| 5:30 AM to 5:59 AM | 19 (5.9%) | 0 (0.0%) |
| 6:00 AM to 6:29 AM | 58 (17.9%) | 11 (3.3%) |
| 6:30 AM to 6:59 AM | 55 (17.0%) | 65 (19.5%) |
| 7:00 AM to 7:29 AM | 49 (15.1%) | 7 (2.1%) |
| 7:30 AM to 7:59 AM | 19 (5.9%) | 42 (12.6%) |
| 8:00 AM to 8:29 AM | 9 (2.8%) | 43 (12.9%) |
| 8:30 AM to 8:59 AM | 9 (2.8%) | 0 (0.0%) |
| 9:00 AM to 9:59 AM | 15 (4.6%) | 12 (3.6%) |
| 10:00 AM to 10:59 AM | 0 (0.0%) | 0 (0.0%) |
| 11:00 AM to 11:59 AM | 0 (0.0%) | 18 (5.4%) |
| 12:00 PM to 3:59 PM | 4 (1.2%) | 39 (11.7%) |
| 4:00 PM to 11:59 PM | 27 (8.3%) | 78 (23.4%) |
| Total | 324 (100.0%) | 333 (100.0%) |
Housing Occupancy in Tunkhannock borough
Occupancy by Ownership in Tunkhannock borough
Of the total 749 dwellings in Tunkhannock borough, owner-occupied units account for 417 (55.7%), while renter-occupied units make up 332 (44.3%).
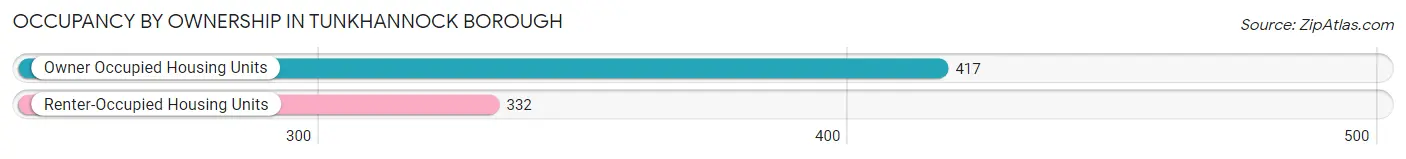
| Occupancy | # Housing Units | % Housing Units |
| Owner Occupied Housing Units | 417 | 55.7% |
| Renter-Occupied Housing Units | 332 | 44.3% |
| Total Occupied Housing Units | 749 | 100.0% |
Occupancy by Household Size in Tunkhannock borough
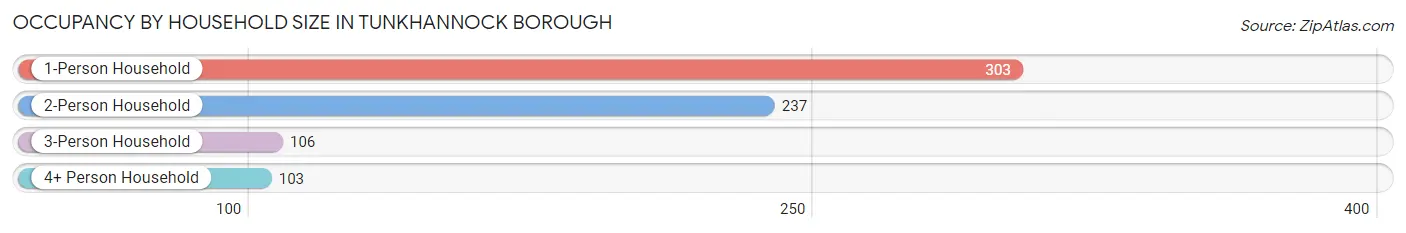
| Household Size | # Housing Units | % Housing Units |
| 1-Person Household | 303 | 40.5% |
| 2-Person Household | 237 | 31.6% |
| 3-Person Household | 106 | 14.1% |
| 4+ Person Household | 103 | 13.8% |
| Total Housing Units | 749 | 100.0% |
Occupancy by Ownership by Household Size in Tunkhannock borough
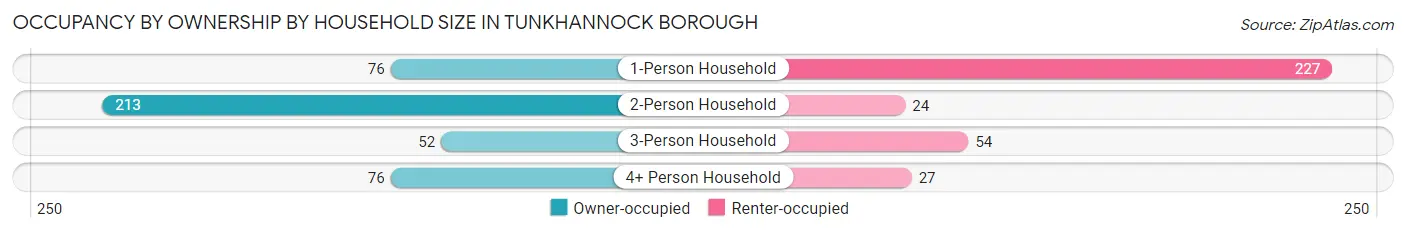
| Household Size | Owner-occupied | Renter-occupied |
| 1-Person Household | 76 (25.1%) | 227 (74.9%) |
| 2-Person Household | 213 (89.9%) | 24 (10.1%) |
| 3-Person Household | 52 (49.1%) | 54 (50.9%) |
| 4+ Person Household | 76 (73.8%) | 27 (26.2%) |
| Total Housing Units | 417 (55.7%) | 332 (44.3%) |
Occupancy by Educational Attainment in Tunkhannock borough
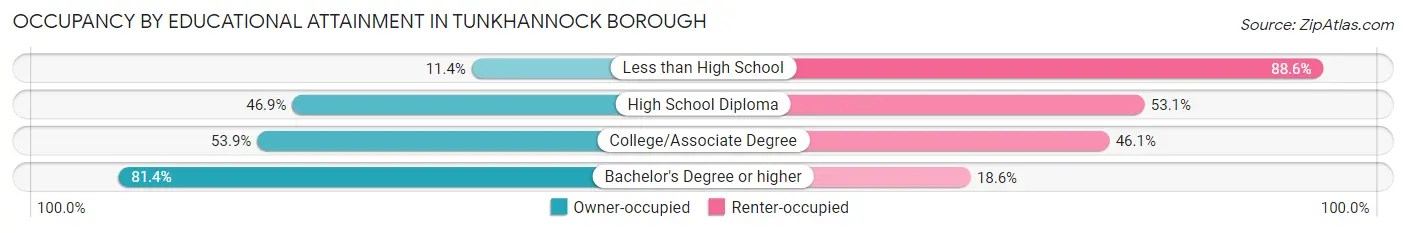
| Household Size | Owner-occupied | Renter-occupied |
| Less than High School | 5 (11.4%) | 39 (88.6%) |
| High School Diploma | 153 (46.9%) | 173 (53.1%) |
| College/Associate Degree | 97 (53.9%) | 83 (46.1%) |
| Bachelor's Degree or higher | 162 (81.4%) | 37 (18.6%) |
Occupancy by Age of Householder in Tunkhannock borough
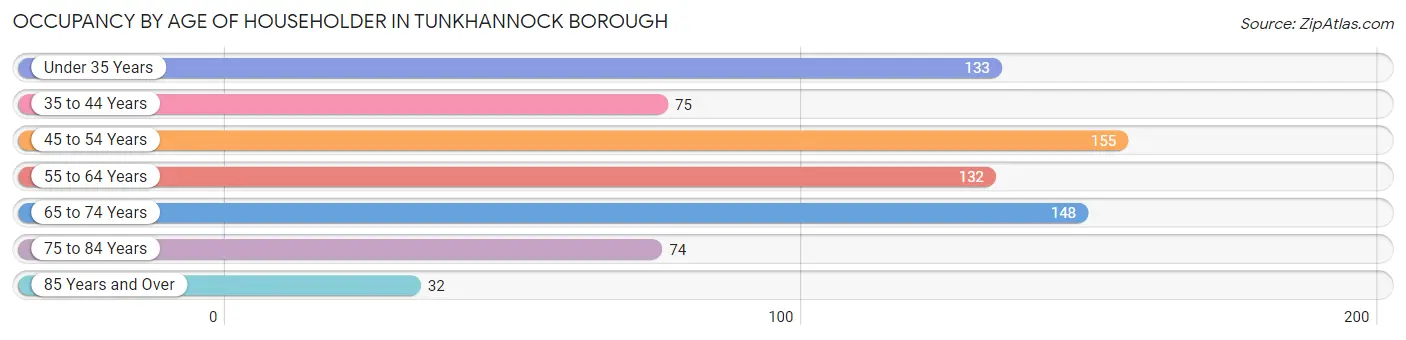
| Age Bracket | # Households | % Households |
| Under 35 Years | 133 | 17.8% |
| 35 to 44 Years | 75 | 10.0% |
| 45 to 54 Years | 155 | 20.7% |
| 55 to 64 Years | 132 | 17.6% |
| 65 to 74 Years | 148 | 19.8% |
| 75 to 84 Years | 74 | 9.9% |
| 85 Years and Over | 32 | 4.3% |
| Total | 749 | 100.0% |
Housing Finances in Tunkhannock borough
Median Income by Occupancy in Tunkhannock borough
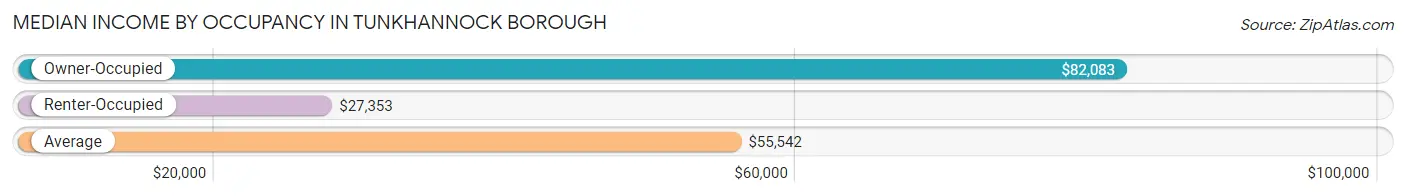
| Occupancy Type | # Households | Median Income |
| Owner-Occupied | 417 (55.7%) | $82,083 |
| Renter-Occupied | 332 (44.3%) | $27,353 |
| Average | 749 (100.0%) | $55,542 |
Occupancy by Householder Income Bracket in Tunkhannock borough
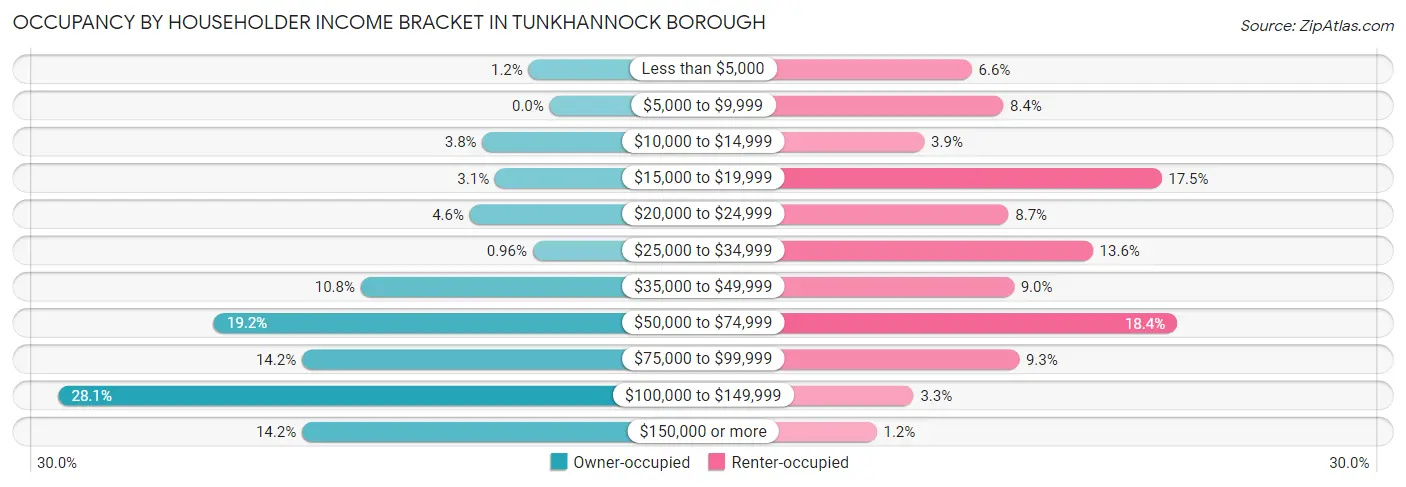
| Income Bracket | Owner-occupied | Renter-occupied |
| Less than $5,000 | 5 (1.2%) | 22 (6.6%) |
| $5,000 to $9,999 | 0 (0.0%) | 28 (8.4%) |
| $10,000 to $14,999 | 16 (3.8%) | 13 (3.9%) |
| $15,000 to $19,999 | 13 (3.1%) | 58 (17.5%) |
| $20,000 to $24,999 | 19 (4.6%) | 29 (8.7%) |
| $25,000 to $34,999 | 4 (1.0%) | 45 (13.6%) |
| $35,000 to $49,999 | 45 (10.8%) | 30 (9.0%) |
| $50,000 to $74,999 | 80 (19.2%) | 61 (18.4%) |
| $75,000 to $99,999 | 59 (14.1%) | 31 (9.3%) |
| $100,000 to $149,999 | 117 (28.1%) | 11 (3.3%) |
| $150,000 or more | 59 (14.1%) | 4 (1.2%) |
| Total | 417 (100.0%) | 332 (100.0%) |
Monthly Housing Cost Tiers in Tunkhannock borough
| Monthly Cost | Owner-occupied | Renter-occupied |
| Less than $300 | 5 (1.2%) | 11 (3.3%) |
| $300 to $499 | 71 (17.0%) | 50 (15.1%) |
| $500 to $799 | 84 (20.1%) | 94 (28.3%) |
| $800 to $999 | 22 (5.3%) | 88 (26.5%) |
| $1,000 to $1,499 | 116 (27.8%) | 52 (15.7%) |
| $1,500 to $1,999 | 57 (13.7%) | 4 (1.2%) |
| $2,000 to $2,499 | 41 (9.8%) | 9 (2.7%) |
| $2,500 to $2,999 | 12 (2.9%) | 0 (0.0%) |
| $3,000 or more | 9 (2.2%) | 0 (0.0%) |
| Total | 417 (100.0%) | 332 (100.0%) |
Physical Housing Characteristics in Tunkhannock borough
Housing Structures in Tunkhannock borough
| Structure Type | # Housing Units | % Housing Units |
| Single Unit, Detached | 482 | 64.3% |
| Single Unit, Attached | 41 | 5.5% |
| 2 Unit Apartments | 74 | 9.9% |
| 3 or 4 Unit Apartments | 58 | 7.7% |
| 5 to 9 Unit Apartments | 54 | 7.2% |
| 10 or more Apartments | 40 | 5.3% |
| Mobile Home / Other | 0 | 0.0% |
| Total | 749 | 100.0% |
Housing Structures by Occupancy in Tunkhannock borough
| Structure Type | Owner-occupied | Renter-occupied |
| Single Unit, Detached | 413 (85.7%) | 69 (14.3%) |
| Single Unit, Attached | 4 (9.8%) | 37 (90.2%) |
| 2 Unit Apartments | 0 (0.0%) | 74 (100.0%) |
| 3 or 4 Unit Apartments | 0 (0.0%) | 58 (100.0%) |
| 5 to 9 Unit Apartments | 0 (0.0%) | 54 (100.0%) |
| 10 or more Apartments | 0 (0.0%) | 40 (100.0%) |
| Mobile Home / Other | 0 (0.0%) | 0 (0.0%) |
| Total | 417 (55.7%) | 332 (44.3%) |
Housing Structures by Number of Rooms in Tunkhannock borough
| Number of Rooms | Owner-occupied | Renter-occupied |
| 1 Room | 0 (0.0%) | 1 (0.3%) |
| 2 or 3 Rooms | 0 (0.0%) | 74 (22.3%) |
| 4 or 5 Rooms | 38 (9.1%) | 144 (43.4%) |
| 6 or 7 Rooms | 184 (44.1%) | 67 (20.2%) |
| 8 or more Rooms | 195 (46.8%) | 46 (13.9%) |
| Total | 417 (100.0%) | 332 (100.0%) |
Housing Structure by Heating Type in Tunkhannock borough
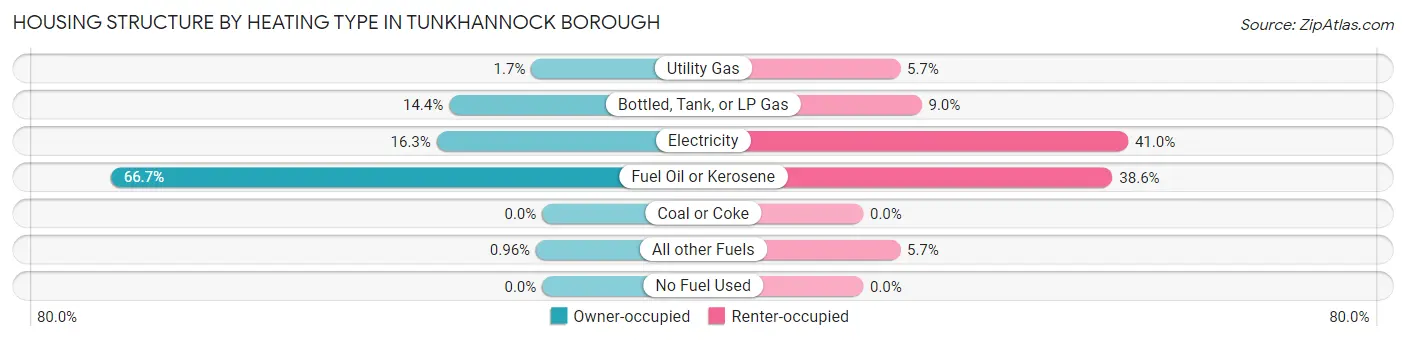
| Heating Type | Owner-occupied | Renter-occupied |
| Utility Gas | 7 (1.7%) | 19 (5.7%) |
| Bottled, Tank, or LP Gas | 60 (14.4%) | 30 (9.0%) |
| Electricity | 68 (16.3%) | 136 (41.0%) |
| Fuel Oil or Kerosene | 278 (66.7%) | 128 (38.6%) |
| Coal or Coke | 0 (0.0%) | 0 (0.0%) |
| All other Fuels | 4 (1.0%) | 19 (5.7%) |
| No Fuel Used | 0 (0.0%) | 0 (0.0%) |
| Total | 417 (100.0%) | 332 (100.0%) |
Household Vehicle Usage in Tunkhannock borough
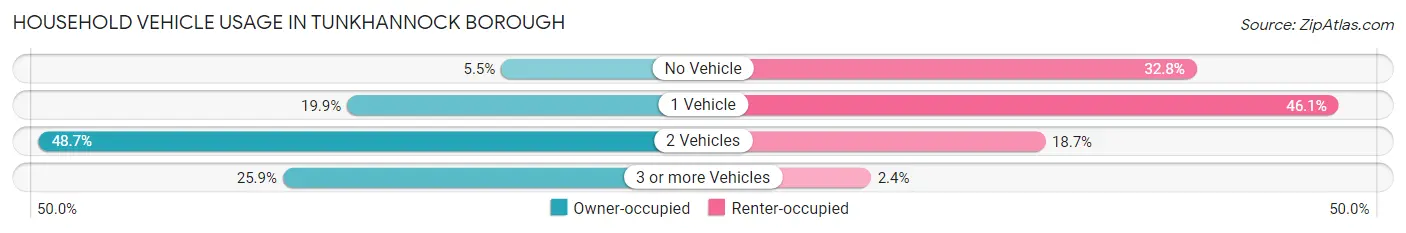
| Vehicles per Household | Owner-occupied | Renter-occupied |
| No Vehicle | 23 (5.5%) | 109 (32.8%) |
| 1 Vehicle | 83 (19.9%) | 153 (46.1%) |
| 2 Vehicles | 203 (48.7%) | 62 (18.7%) |
| 3 or more Vehicles | 108 (25.9%) | 8 (2.4%) |
| Total | 417 (100.0%) | 332 (100.0%) |
Real Estate & Mortgages in Tunkhannock borough
Real Estate and Mortgage Overview in Tunkhannock borough
| Characteristic | Without Mortgage | With Mortgage |
| Housing Units | 207 | 210 |
| Median Property Value | $172,600 | $183,000 |
| Median Household Income | $59,531 | $44 |
| Monthly Housing Costs | $618 | $9 |
| Real Estate Taxes | $2,862 | $0 |
Property Value by Mortgage Status in Tunkhannock borough
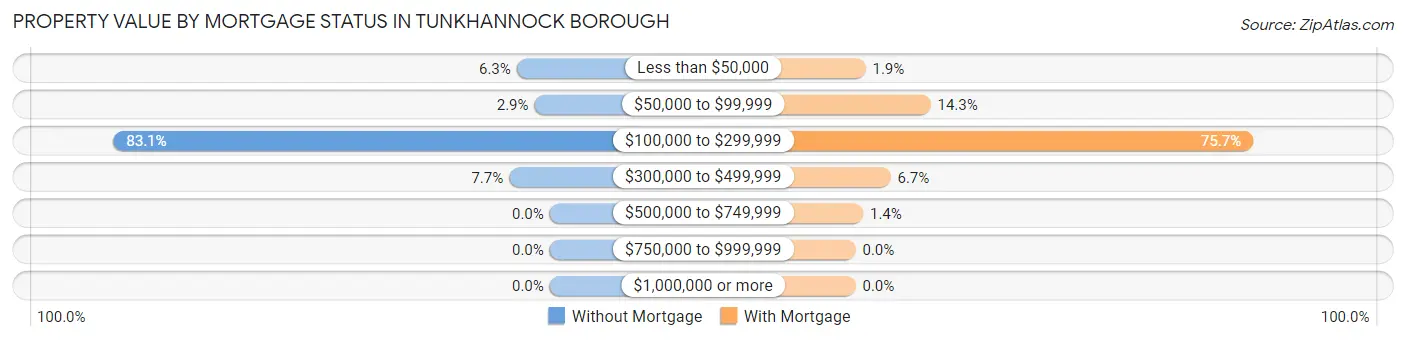
| Property Value | Without Mortgage | With Mortgage |
| Less than $50,000 | 13 (6.3%) | 4 (1.9%) |
| $50,000 to $99,999 | 6 (2.9%) | 30 (14.3%) |
| $100,000 to $299,999 | 172 (83.1%) | 159 (75.7%) |
| $300,000 to $499,999 | 16 (7.7%) | 14 (6.7%) |
| $500,000 to $749,999 | 0 (0.0%) | 3 (1.4%) |
| $750,000 to $999,999 | 0 (0.0%) | 0 (0.0%) |
| $1,000,000 or more | 0 (0.0%) | 0 (0.0%) |
| Total | 207 (100.0%) | 210 (100.0%) |
Household Income by Mortgage Status in Tunkhannock borough
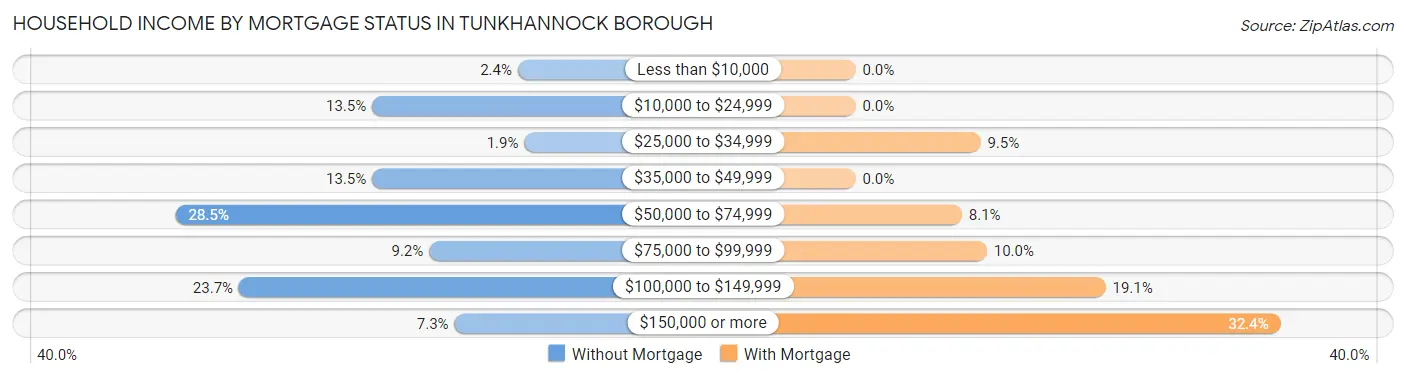
| Household Income | Without Mortgage | With Mortgage |
| Less than $10,000 | 5 (2.4%) | 0 (0.0%) |
| $10,000 to $24,999 | 28 (13.5%) | 0 (0.0%) |
| $25,000 to $34,999 | 4 (1.9%) | 20 (9.5%) |
| $35,000 to $49,999 | 28 (13.5%) | 0 (0.0%) |
| $50,000 to $74,999 | 59 (28.5%) | 17 (8.1%) |
| $75,000 to $99,999 | 19 (9.2%) | 21 (10.0%) |
| $100,000 to $149,999 | 49 (23.7%) | 40 (19.1%) |
| $150,000 or more | 15 (7.2%) | 68 (32.4%) |
| Total | 207 (100.0%) | 210 (100.0%) |
Property Value to Household Income Ratio in Tunkhannock borough
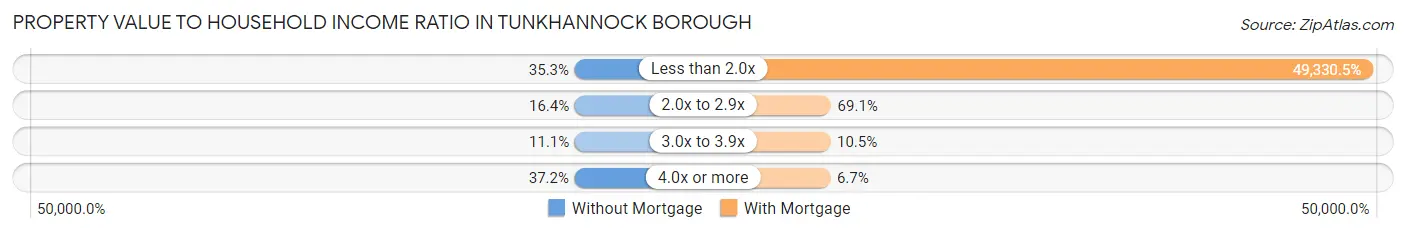
| Value-to-Income Ratio | Without Mortgage | With Mortgage |
| Less than 2.0x | 73 (35.3%) | 103,594 (49,330.5%) |
| 2.0x to 2.9x | 34 (16.4%) | 145 (69.1%) |
| 3.0x to 3.9x | 23 (11.1%) | 22 (10.5%) |
| 4.0x or more | 77 (37.2%) | 14 (6.7%) |
| Total | 207 (100.0%) | 210 (100.0%) |
Real Estate Taxes by Mortgage Status in Tunkhannock borough
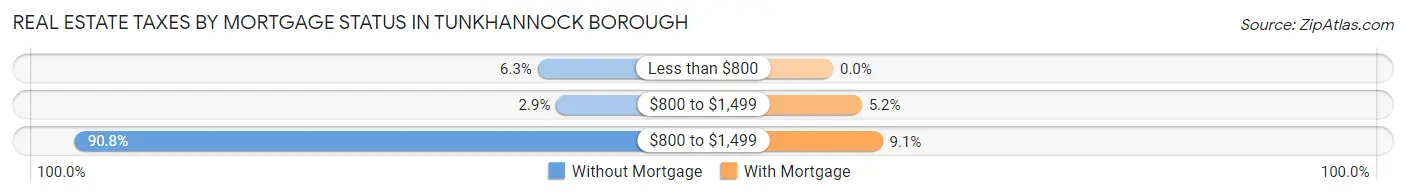
| Property Taxes | Without Mortgage | With Mortgage |
| Less than $800 | 13 (6.3%) | 0 (0.0%) |
| $800 to $1,499 | 6 (2.9%) | 11 (5.2%) |
| $800 to $1,499 | 188 (90.8%) | 19 (9.0%) |
| Total | 207 (100.0%) | 210 (100.0%) |
Health & Disability in Tunkhannock borough
Health Insurance Coverage by Age in Tunkhannock borough
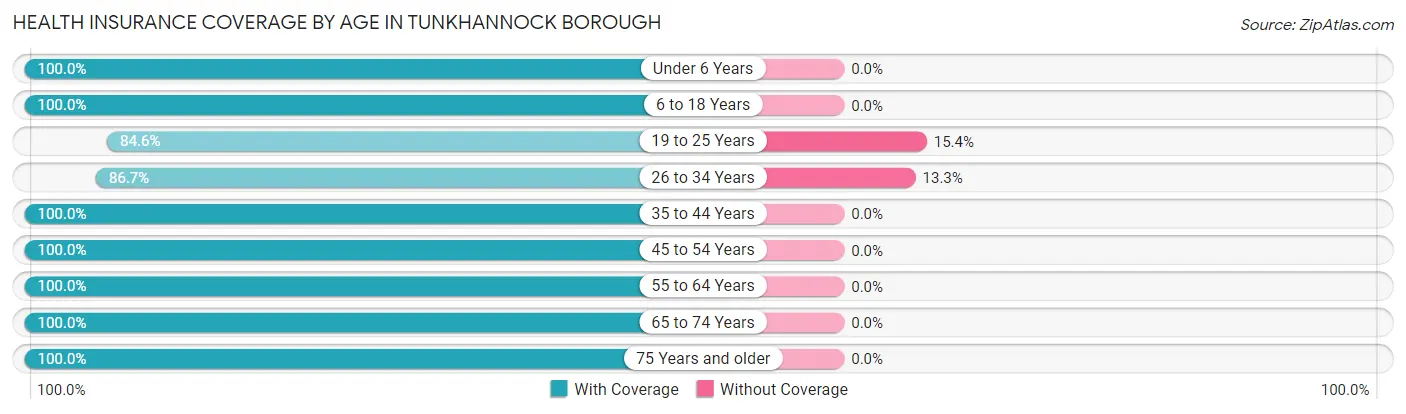
| Age Bracket | With Coverage | Without Coverage |
| Under 6 Years | 93 (100.0%) | 0 (0.0%) |
| 6 to 18 Years | 261 (100.0%) | 0 (0.0%) |
| 19 to 25 Years | 55 (84.6%) | 10 (15.4%) |
| 26 to 34 Years | 163 (86.7%) | 25 (13.3%) |
| 35 to 44 Years | 156 (100.0%) | 0 (0.0%) |
| 45 to 54 Years | 254 (100.0%) | 0 (0.0%) |
| 55 to 64 Years | 176 (100.0%) | 0 (0.0%) |
| 65 to 74 Years | 242 (100.0%) | 0 (0.0%) |
| 75 Years and older | 150 (100.0%) | 0 (0.0%) |
| Total | 1,550 (97.8%) | 35 (2.2%) |
Health Insurance Coverage by Citizenship Status in Tunkhannock borough
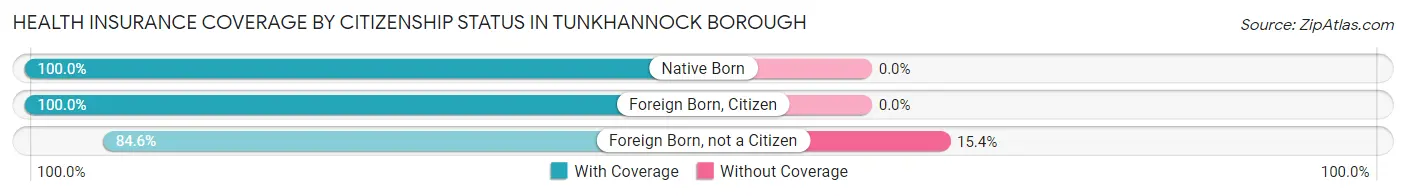
| Citizenship Status | With Coverage | Without Coverage |
| Native Born | 93 (100.0%) | 0 (0.0%) |
| Foreign Born, Citizen | 261 (100.0%) | 0 (0.0%) |
| Foreign Born, not a Citizen | 55 (84.6%) | 10 (15.4%) |
Health Insurance Coverage by Household Income in Tunkhannock borough
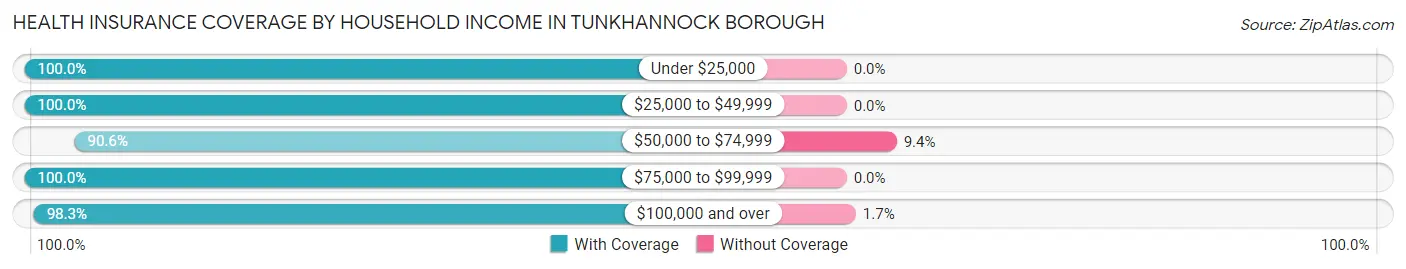
| Household Income | With Coverage | Without Coverage |
| Under $25,000 | 316 (100.0%) | 0 (0.0%) |
| $25,000 to $49,999 | 193 (100.0%) | 0 (0.0%) |
| $50,000 to $74,999 | 242 (90.6%) | 25 (9.4%) |
| $75,000 to $99,999 | 199 (100.0%) | 0 (0.0%) |
| $100,000 and over | 576 (98.3%) | 10 (1.7%) |
Public vs Private Health Insurance Coverage by Age in Tunkhannock borough
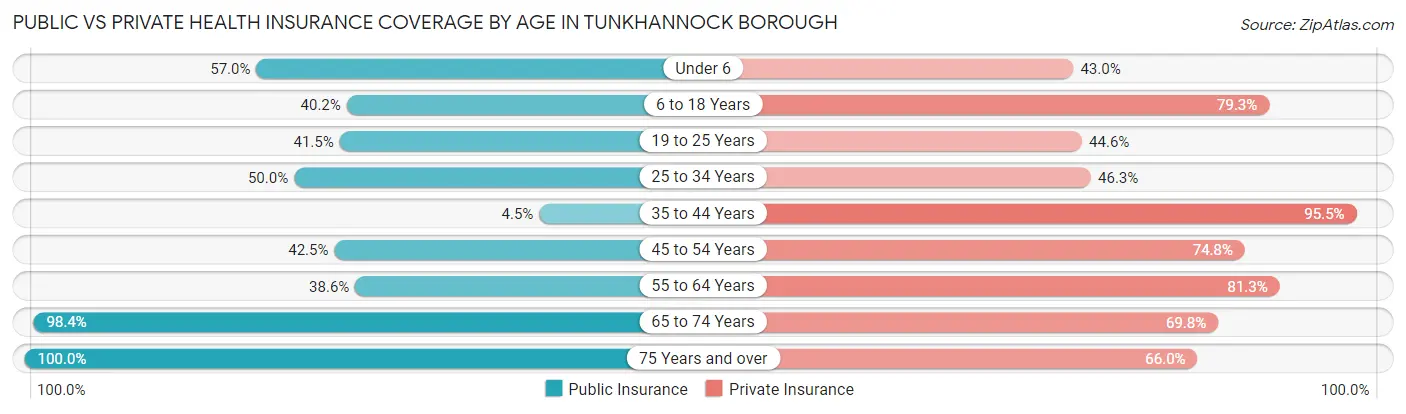
| Age Bracket | Public Insurance | Private Insurance |
| Under 6 | 53 (57.0%) | 40 (43.0%) |
| 6 to 18 Years | 105 (40.2%) | 207 (79.3%) |
| 19 to 25 Years | 27 (41.5%) | 29 (44.6%) |
| 25 to 34 Years | 94 (50.0%) | 87 (46.3%) |
| 35 to 44 Years | 7 (4.5%) | 149 (95.5%) |
| 45 to 54 Years | 108 (42.5%) | 190 (74.8%) |
| 55 to 64 Years | 68 (38.6%) | 143 (81.2%) |
| 65 to 74 Years | 238 (98.4%) | 169 (69.8%) |
| 75 Years and over | 150 (100.0%) | 99 (66.0%) |
| Total | 850 (53.6%) | 1,113 (70.2%) |
Disability Status by Sex by Age in Tunkhannock borough
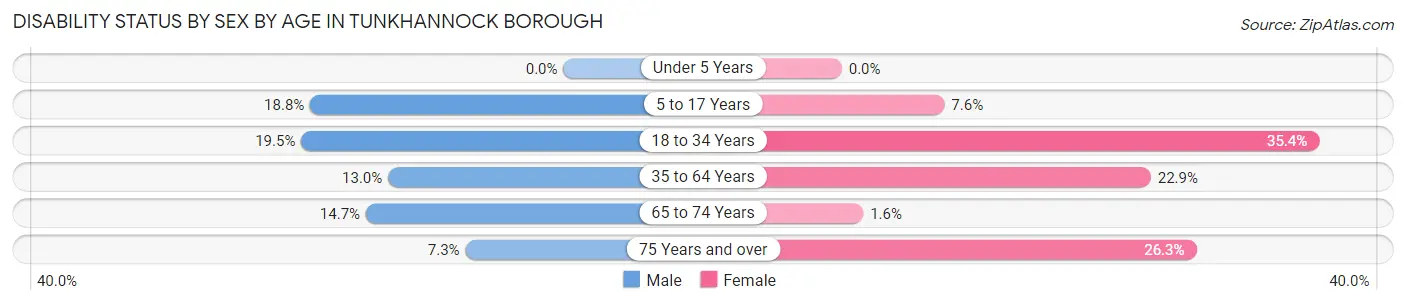
| Age Bracket | Male | Female |
| Under 5 Years | 0 (0.0%) | 0 (0.0%) |
| 5 to 17 Years | 25 (18.8%) | 8 (7.6%) |
| 18 to 34 Years | 29 (19.5%) | 45 (35.4%) |
| 35 to 64 Years | 32 (13.0%) | 78 (22.9%) |
| 65 to 74 Years | 17 (14.7%) | 2 (1.6%) |
| 75 Years and over | 4 (7.3%) | 25 (26.3%) |
Disability Class by Sex by Age in Tunkhannock borough
Disability Class: Hearing Difficulty
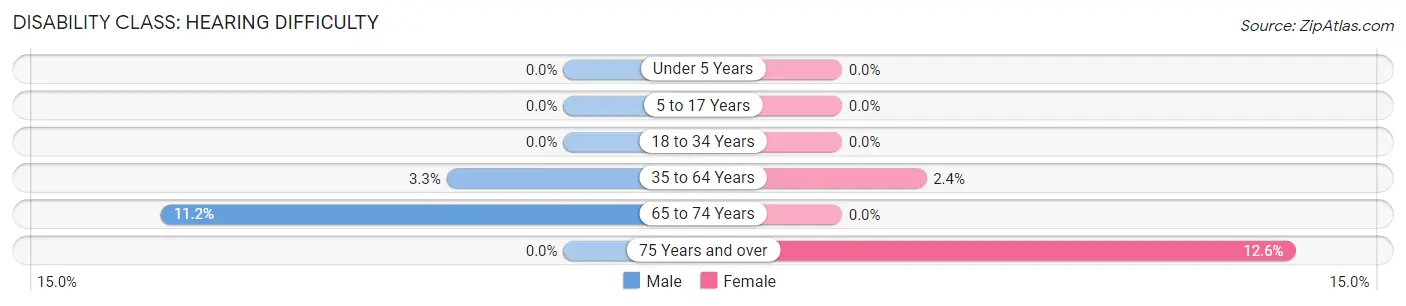
| Age Bracket | Male | Female |
| Under 5 Years | 0 (0.0%) | 0 (0.0%) |
| 5 to 17 Years | 0 (0.0%) | 0 (0.0%) |
| 18 to 34 Years | 0 (0.0%) | 0 (0.0%) |
| 35 to 64 Years | 8 (3.3%) | 8 (2.4%) |
| 65 to 74 Years | 13 (11.2%) | 0 (0.0%) |
| 75 Years and over | 0 (0.0%) | 12 (12.6%) |
Disability Class: Vision Difficulty
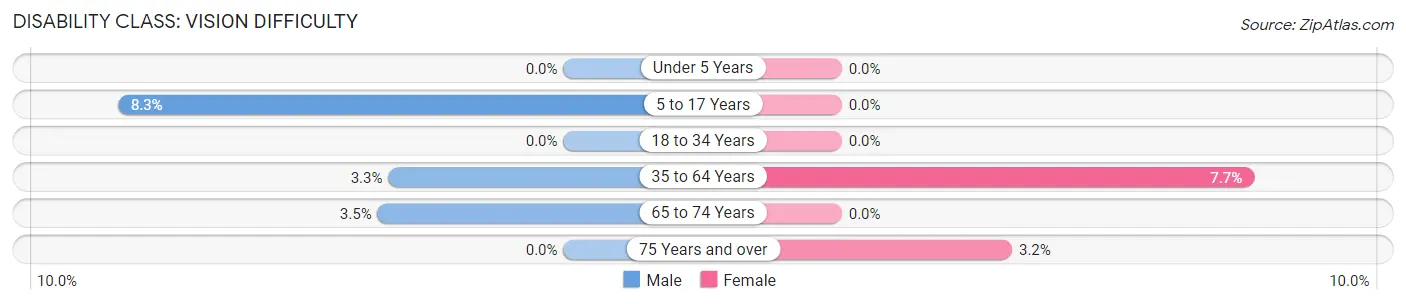
| Age Bracket | Male | Female |
| Under 5 Years | 0 (0.0%) | 0 (0.0%) |
| 5 to 17 Years | 11 (8.3%) | 0 (0.0%) |
| 18 to 34 Years | 0 (0.0%) | 0 (0.0%) |
| 35 to 64 Years | 8 (3.3%) | 26 (7.6%) |
| 65 to 74 Years | 4 (3.5%) | 0 (0.0%) |
| 75 Years and over | 0 (0.0%) | 3 (3.2%) |
Disability Class: Cognitive Difficulty
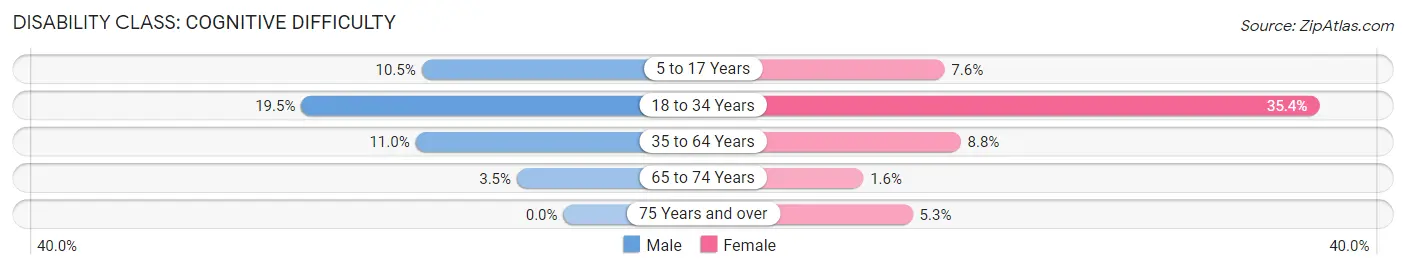
| Age Bracket | Male | Female |
| 5 to 17 Years | 14 (10.5%) | 8 (7.6%) |
| 18 to 34 Years | 29 (19.5%) | 45 (35.4%) |
| 35 to 64 Years | 27 (11.0%) | 30 (8.8%) |
| 65 to 74 Years | 4 (3.5%) | 2 (1.6%) |
| 75 Years and over | 0 (0.0%) | 5 (5.3%) |
Disability Class: Ambulatory Difficulty
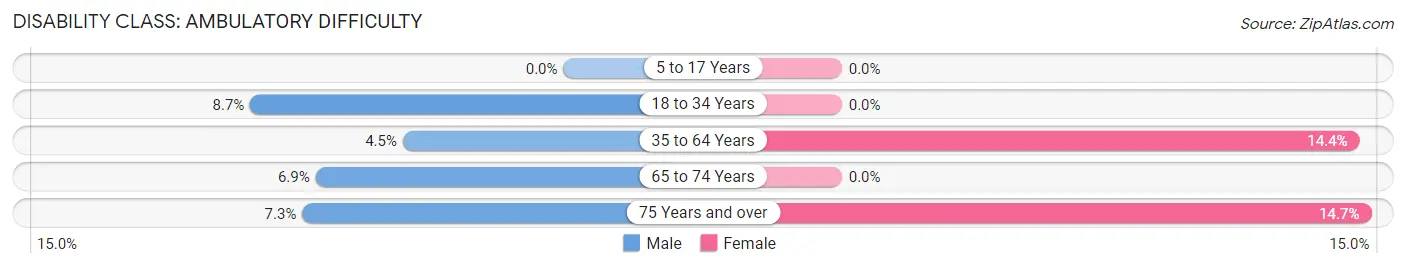
| Age Bracket | Male | Female |
| 5 to 17 Years | 0 (0.0%) | 0 (0.0%) |
| 18 to 34 Years | 13 (8.7%) | 0 (0.0%) |
| 35 to 64 Years | 11 (4.5%) | 49 (14.4%) |
| 65 to 74 Years | 8 (6.9%) | 0 (0.0%) |
| 75 Years and over | 4 (7.3%) | 14 (14.7%) |
Disability Class: Self-Care Difficulty
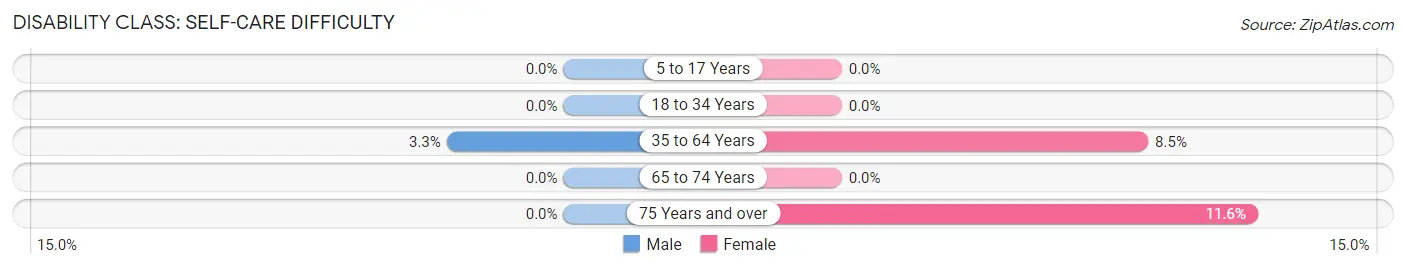
| Age Bracket | Male | Female |
| 5 to 17 Years | 0 (0.0%) | 0 (0.0%) |
| 18 to 34 Years | 0 (0.0%) | 0 (0.0%) |
| 35 to 64 Years | 8 (3.3%) | 29 (8.5%) |
| 65 to 74 Years | 0 (0.0%) | 0 (0.0%) |
| 75 Years and over | 0 (0.0%) | 11 (11.6%) |
Technology Access in Tunkhannock borough
Computing Device Access in Tunkhannock borough
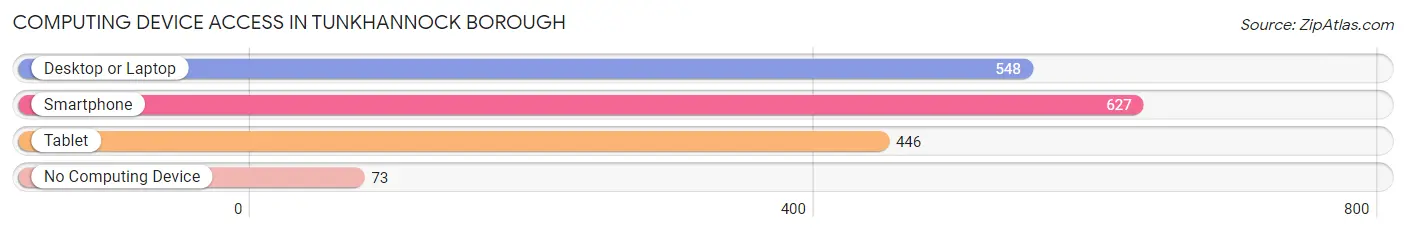
| Device Type | # Households | % Households |
| Desktop or Laptop | 548 | 73.2% |
| Smartphone | 627 | 83.7% |
| Tablet | 446 | 59.6% |
| No Computing Device | 73 | 9.8% |
| Total | 749 | 100.0% |
Internet Access in Tunkhannock borough
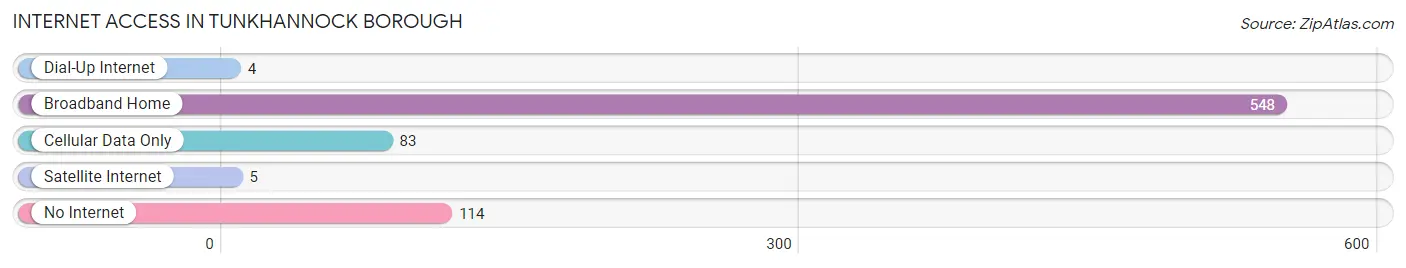
| Internet Type | # Households | % Households |
| Dial-Up Internet | 4 | 0.5% |
| Broadband Home | 548 | 73.2% |
| Cellular Data Only | 83 | 11.1% |
| Satellite Internet | 5 | 0.7% |
| No Internet | 114 | 15.2% |
| Total | 749 | 100.0% |
Tunkhannock borough Summary
Tunkhannock Borough is a small borough located in Wyoming County, Pennsylvania. It is situated in the Endless Mountains region of the state, and is the county seat of Wyoming County. The borough is located along the Susquehanna River, and is home to a population of approximately 1,800 people.
History
The area that is now Tunkhannock Borough was first settled in 1769 by a group of settlers from Connecticut. The settlers named the area Tunkhannock, which is derived from the Native American term for “meeting place”. The borough was officially incorporated in 1845, and was named the county seat of Wyoming County in 1842.
During the 19th century, Tunkhannock Borough was an important center of commerce and industry. The borough was home to several mills, including a grist mill, a saw mill, and a woolen mill. The borough was also home to several tanneries, which produced leather goods for the local market. In addition, the borough was home to several stores, hotels, and other businesses.
Geography
Tunkhannock Borough is located in the Endless Mountains region of Pennsylvania. The borough is situated along the Susquehanna River, and is surrounded by the townships of Eaton, Lemon, Meshoppen, and Tunkhannock. The borough covers an area of 1.2 square miles, and has an elevation of 1,068 feet.
The climate in Tunkhannock Borough is classified as humid continental, with cold winters and warm summers. The average annual temperature is 48 degrees Fahrenheit, and the average annual precipitation is 40 inches.
Economy
The economy of Tunkhannock Borough is largely based on tourism and retail. The borough is home to several small businesses, including restaurants, shops, and galleries. In addition, the borough is home to several manufacturing companies, including a plastics manufacturer and a paper mill.
The borough is also home to several educational institutions, including a community college and a vocational school. The borough is served by the Tunkhannock Area School District, which includes four elementary schools, one middle school, and one high school.
Demographics
As of the 2010 census, the population of Tunkhannock Borough was 1,836. The racial makeup of the borough was 97.3% White, 0.7% African American, 0.3% Native American, 0.3% Asian, and 1.4% from other races. The median household income was $37,917, and the median family income was $45,938.
The population of Tunkhannock Borough is largely Christian, with the majority of residents belonging to the Roman Catholic Church. The borough is also home to a small Jewish community. The borough is served by several churches, including the First Presbyterian Church, the First United Methodist Church, and the St. Paul’s Episcopal Church.
Common Questions
What is Per Capita Income in Tunkhannock borough?
Per Capita income in Tunkhannock borough is $32,278.
What is the Median Family Income in Tunkhannock borough?
Median Family Income in Tunkhannock borough is $78,798.
What is the Median Household income in Tunkhannock borough?
Median Household Income in Tunkhannock borough is $55,542.
What is Income or Wage Gap in Tunkhannock borough?
Income or Wage Gap in Tunkhannock borough is 30.0%.
Women in Tunkhannock borough earn 70.0 cents for every dollar earned by a man.
What is Inequality or Gini Index in Tunkhannock borough?
Inequality or Gini Index in Tunkhannock borough is 0.44.
What is the Total Population of Tunkhannock borough?
Total Population of Tunkhannock borough is 1,635.
What is the Total Male Population of Tunkhannock borough?
Total Male Population of Tunkhannock borough is 792.
What is the Total Female Population of Tunkhannock borough?
Total Female Population of Tunkhannock borough is 843.
What is the Ratio of Males per 100 Females in Tunkhannock borough?
There are 93.95 Males per 100 Females in Tunkhannock borough.
What is the Ratio of Females per 100 Males in Tunkhannock borough?
There are 106.44 Females per 100 Males in Tunkhannock borough.
What is the Median Population Age in Tunkhannock borough?
Median Population Age in Tunkhannock borough is 45.2 Years.
What is the Average Family Size in Tunkhannock borough
Average Family Size in Tunkhannock borough is 2.8 People.
What is the Average Household Size in Tunkhannock borough
Average Household Size in Tunkhannock borough is 2.1 People.
How Large is the Labor Force in Tunkhannock borough?
There are 736 People in the Labor Forcein in Tunkhannock borough.
What is the Percentage of People in the Labor Force in Tunkhannock borough?
52.8% of People are in the Labor Force in Tunkhannock borough.
What is the Unemployment Rate in Tunkhannock borough?
Unemployment Rate in Tunkhannock borough is 4.5%.