Freeport borough, PA Map & Demographics
Freeport borough Overview
$26,122
PER CAPITA INCOME
$46,563
AVG FAMILY INCOME
$37,336
AVG HOUSEHOLD INCOME
43.2%
WAGE / INCOME GAP [ % ]
56.8¢/ $1
WAGE / INCOME GAP [ $ ]
0.45
INEQUALITY / GINI INDEX
1,725
TOTAL POPULATION
774
MALE POPULATION
951
FEMALE POPULATION
81.39
MALES / 100 FEMALES
122.87
FEMALES / 100 MALES
38.1
MEDIAN AGE
2.8
AVG FAMILY SIZE
2.1
AVG HOUSEHOLD SIZE
813
LABOR FORCE [ PEOPLE ]
60.2%
PERCENT IN LABOR FORCE
9.2%
UNEMPLOYMENT RATE
Income in Freeport borough
Income Overview in Freeport borough
Per Capita Income in Freeport borough is $26,122, while median incomes of families and households are $46,563 and $37,336 respectively.
| Characteristic | Number | Measure |
| Per Capita Income | 1,725 | $26,122 |
| Median Family Income | 449 | $46,563 |
| Mean Family Income | 449 | $68,994 |
| Median Household Income | 827 | $37,336 |
| Mean Household Income | 827 | $54,725 |
| Income Deficit | 449 | $0 |
| Wage / Income Gap (%) | 1,725 | 43.21% |
| Wage / Income Gap ($) | 1,725 | 56.79¢ per $1 |
| Gini / Inequality Index | 1,725 | 0.45 |
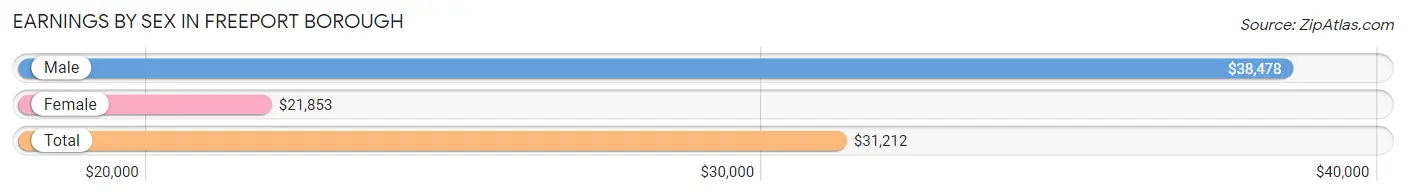
Earnings by Sex in Freeport borough
Average Earnings in Freeport borough are $31,212, $38,478 for men and $21,853 for women, a difference of 43.2%.
| Sex | Number | Average Earnings |
| Male | 436 (50.2%) | $38,478 |
| Female | 433 (49.8%) | $21,853 |
| Total | 869 (100.0%) | $31,212 |
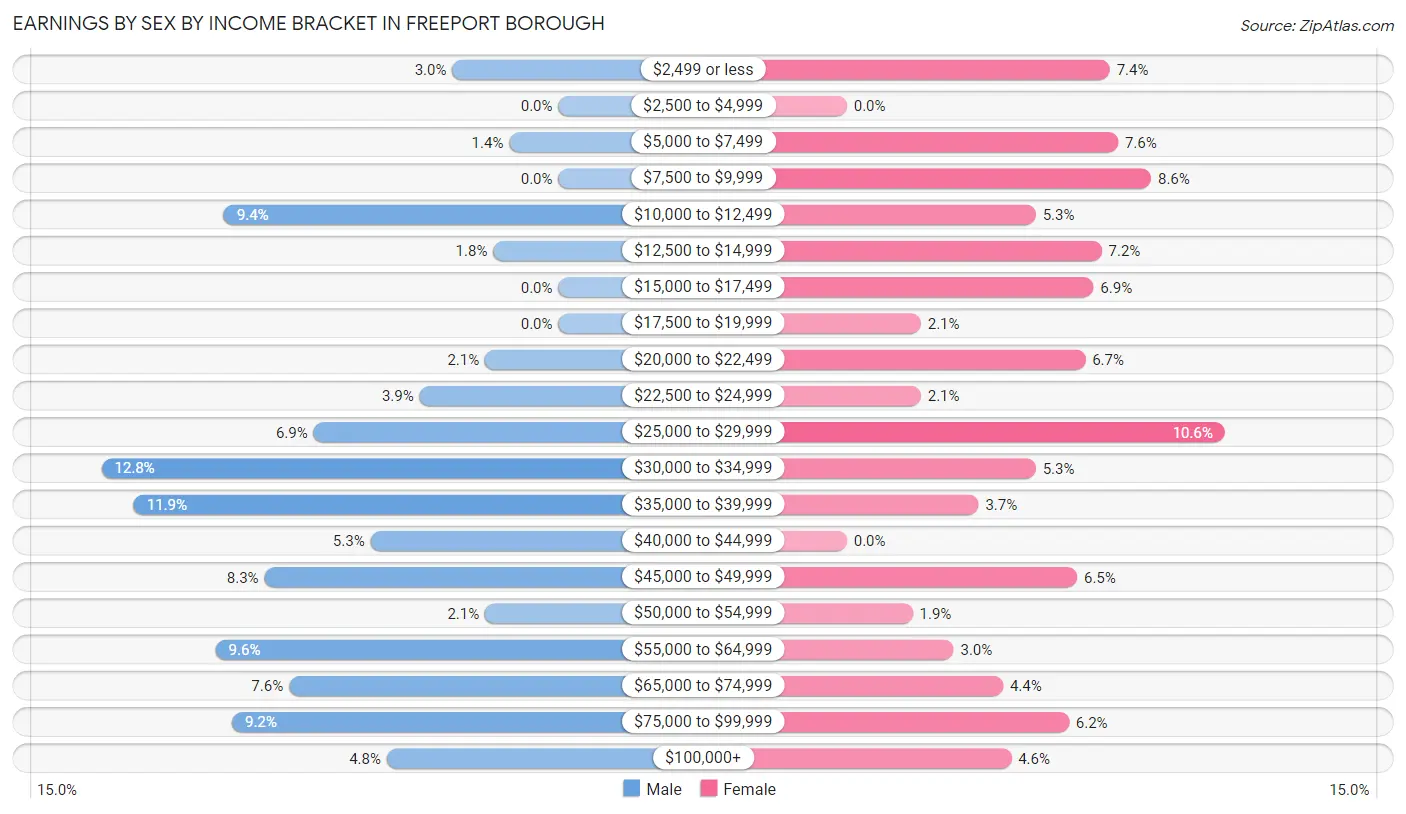
Earnings by Sex by Income Bracket in Freeport borough
The most common earnings brackets in Freeport borough are $30,000 to $34,999 for men (56 | 12.8%) and $25,000 to $29,999 for women (46 | 10.6%).
| Income | Male | Female |
| $2,499 or less | 13 (3.0%) | 32 (7.4%) |
| $2,500 to $4,999 | 0 (0.0%) | 0 (0.0%) |
| $5,000 to $7,499 | 6 (1.4%) | 33 (7.6%) |
| $7,500 to $9,999 | 0 (0.0%) | 37 (8.6%) |
| $10,000 to $12,499 | 41 (9.4%) | 23 (5.3%) |
| $12,500 to $14,999 | 8 (1.8%) | 31 (7.2%) |
| $15,000 to $17,499 | 0 (0.0%) | 30 (6.9%) |
| $17,500 to $19,999 | 0 (0.0%) | 9 (2.1%) |
| $20,000 to $22,499 | 9 (2.1%) | 29 (6.7%) |
| $22,500 to $24,999 | 17 (3.9%) | 9 (2.1%) |
| $25,000 to $29,999 | 30 (6.9%) | 46 (10.6%) |
| $30,000 to $34,999 | 56 (12.8%) | 23 (5.3%) |
| $35,000 to $39,999 | 52 (11.9%) | 16 (3.7%) |
| $40,000 to $44,999 | 23 (5.3%) | 0 (0.0%) |
| $45,000 to $49,999 | 36 (8.3%) | 28 (6.5%) |
| $50,000 to $54,999 | 9 (2.1%) | 8 (1.8%) |
| $55,000 to $64,999 | 42 (9.6%) | 13 (3.0%) |
| $65,000 to $74,999 | 33 (7.6%) | 19 (4.4%) |
| $75,000 to $99,999 | 40 (9.2%) | 27 (6.2%) |
| $100,000+ | 21 (4.8%) | 20 (4.6%) |
| Total | 436 (100.0%) | 433 (100.0%) |
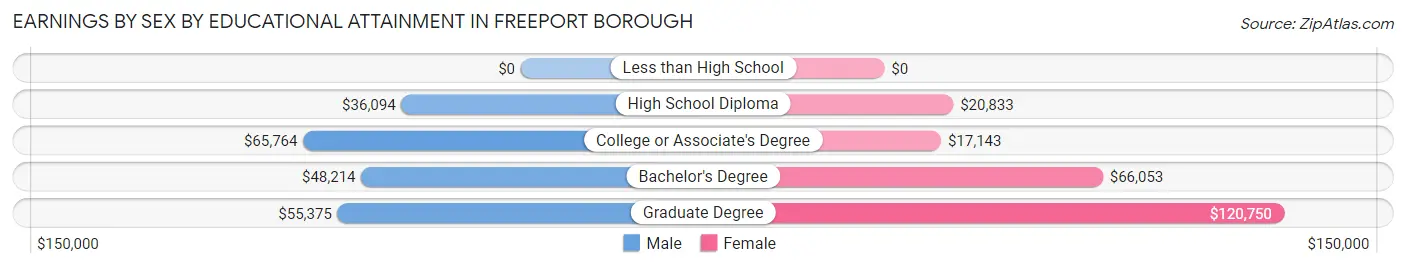
Earnings by Sex by Educational Attainment in Freeport borough
Average earnings in Freeport borough are $39,837 for men and $22,328 for women, a difference of 44.0%. Men with an educational attainment of college or associate's degree enjoy the highest average annual earnings of $65,764, while those with high school diploma education earn the least with $36,094. Women with an educational attainment of graduate degree earn the most with the average annual earnings of $120,750, while those with college or associate's degree education have the smallest earnings of $17,143.
| Educational Attainment | Male Income | Female Income |
| Less than High School | - | - |
| High School Diploma | $36,094 | $20,833 |
| College or Associate's Degree | $65,764 | $17,143 |
| Bachelor's Degree | $48,214 | $66,053 |
| Graduate Degree | $55,375 | $120,750 |
| Total | $39,837 | $22,328 |
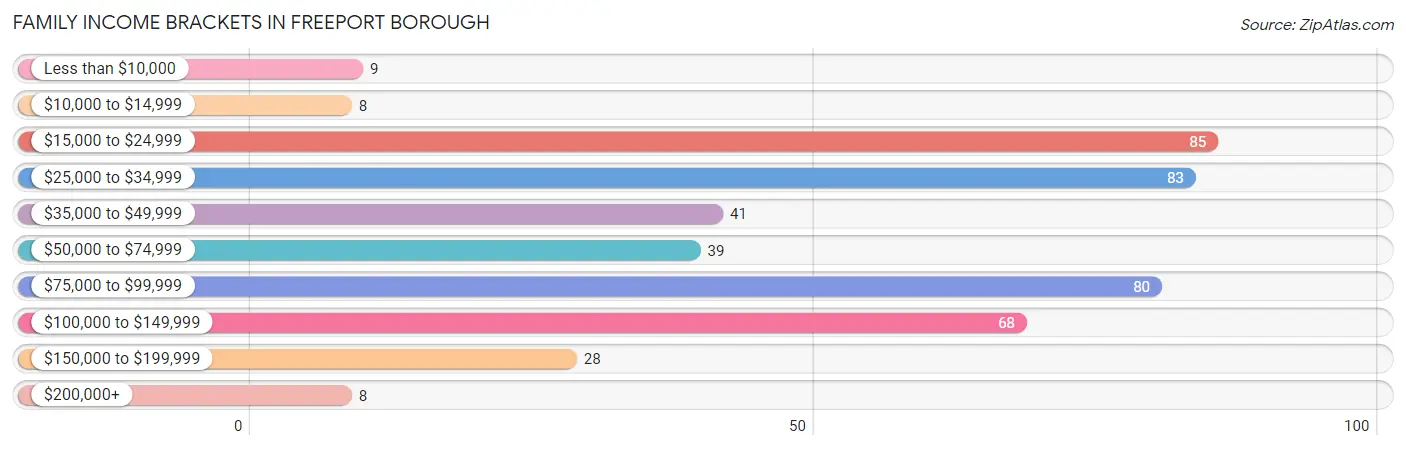
Family Income in Freeport borough
Family Income Brackets in Freeport borough
According to the Freeport borough family income data, there are 85 families falling into the $15,000 to $24,999 income range, which is the most common income bracket and makes up 18.9% of all families. Conversely, the $10,000 to $14,999 income bracket is the least frequent group with only 8 families (1.8%) belonging to this category.
| Income Bracket | # Families | % Families |
| Less than $10,000 | 9 | 2.0% |
| $10,000 to $14,999 | 8 | 1.8% |
| $15,000 to $24,999 | 85 | 18.9% |
| $25,000 to $34,999 | 83 | 18.5% |
| $35,000 to $49,999 | 41 | 9.1% |
| $50,000 to $74,999 | 39 | 8.7% |
| $75,000 to $99,999 | 80 | 17.8% |
| $100,000 to $149,999 | 68 | 15.1% |
| $150,000 to $199,999 | 28 | 6.2% |
| $200,000+ | 8 | 1.8% |
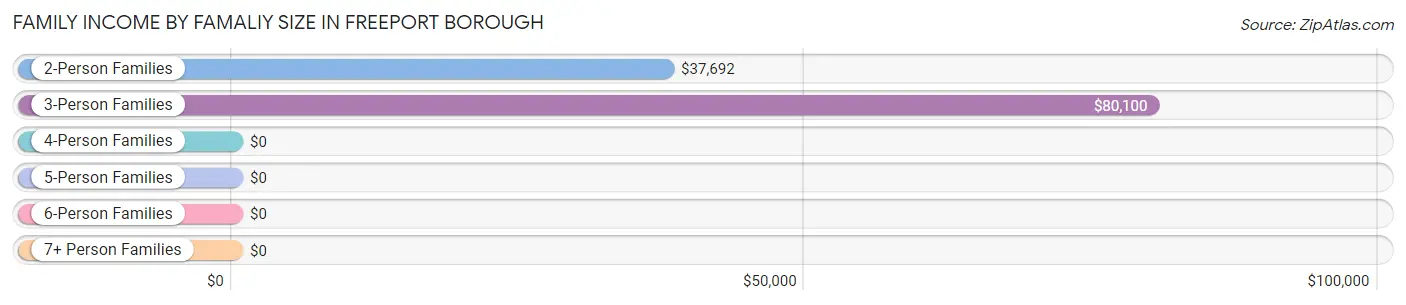
Family Income by Famaliy Size in Freeport borough
3-person families (96 | 21.4%) account for the highest median family income in Freeport borough with $80,100 per family, while 3-person families (96 | 21.4%) have the highest median income of $26,700 per family member.
| Income Bracket | # Families | Median Income |
| 2-Person Families | 246 (54.8%) | $37,692 |
| 3-Person Families | 96 (21.4%) | $80,100 |
| 4-Person Families | 89 (19.8%) | $0 |
| 5-Person Families | 12 (2.7%) | $0 |
| 6-Person Families | 6 (1.3%) | $0 |
| 7+ Person Families | 0 (0.0%) | $0 |
| Total | 449 (100.0%) | $46,563 |
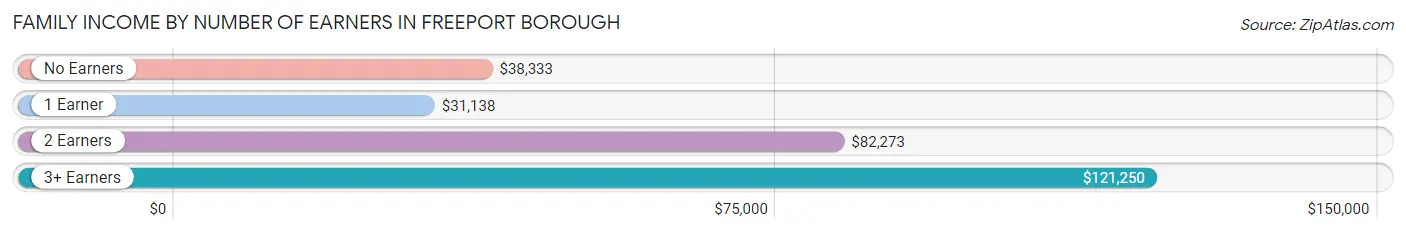
Family Income by Number of Earners in Freeport borough
The median family income in Freeport borough is $46,563, with families comprising 3+ earners (50) having the highest median family income of $121,250, while families with 1 earner (255) have the lowest median family income of $31,138, accounting for 11.1% and 56.8% of families, respectively.
| Number of Earners | # Families | Median Income |
| No Earners | 52 (11.6%) | $38,333 |
| 1 Earner | 255 (56.8%) | $31,138 |
| 2 Earners | 92 (20.5%) | $82,273 |
| 3+ Earners | 50 (11.1%) | $121,250 |
| Total | 449 (100.0%) | $46,563 |
Household Income in Freeport borough
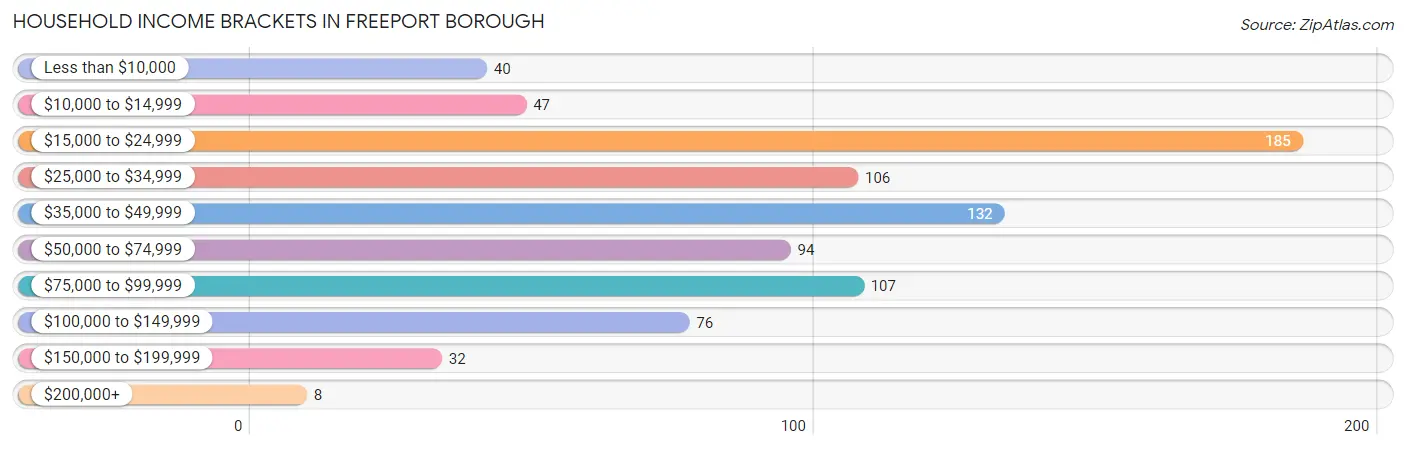
Household Income Brackets in Freeport borough
With 185 households falling in the category, the $15,000 to $24,999 income range is the most frequent in Freeport borough, accounting for 22.4% of all households. In contrast, only 8 households (1.0%) fall into the $200,000+ income bracket, making it the least populous group.
| Income Bracket | # Households | % Households |
| Less than $10,000 | 40 | 4.8% |
| $10,000 to $14,999 | 47 | 5.7% |
| $15,000 to $24,999 | 185 | 22.4% |
| $25,000 to $34,999 | 106 | 12.8% |
| $35,000 to $49,999 | 132 | 16.0% |
| $50,000 to $74,999 | 94 | 11.4% |
| $75,000 to $99,999 | 107 | 12.9% |
| $100,000 to $149,999 | 76 | 9.2% |
| $150,000 to $199,999 | 32 | 3.9% |
| $200,000+ | 8 | 1.0% |
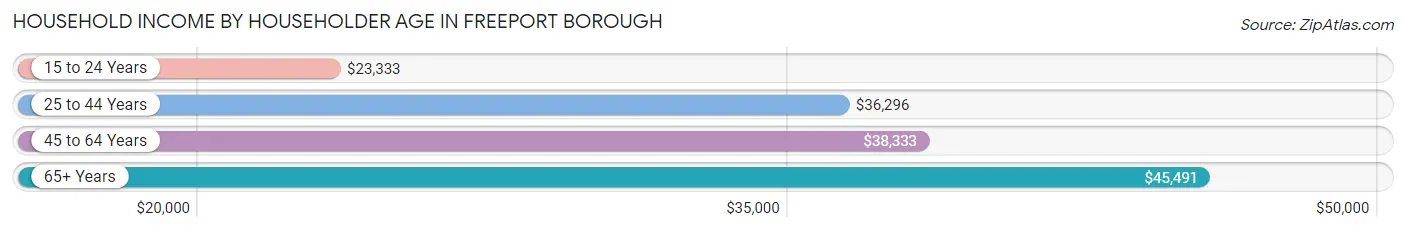
Household Income by Householder Age in Freeport borough
The median household income in Freeport borough is $37,336, with the highest median household income of $45,491 found in the 65+ years age bracket for the primary householder. A total of 179 households (21.6%) fall into this category. Meanwhile, the 15 to 24 years age bracket for the primary householder has the lowest median household income of $23,333, with 22 households (2.7%) in this group.
| Income Bracket | # Households | Median Income |
| 15 to 24 Years | 22 (2.7%) | $23,333 |
| 25 to 44 Years | 332 (40.2%) | $36,296 |
| 45 to 64 Years | 294 (35.5%) | $38,333 |
| 65+ Years | 179 (21.6%) | $45,491 |
| Total | 827 (100.0%) | $37,336 |
Poverty in Freeport borough
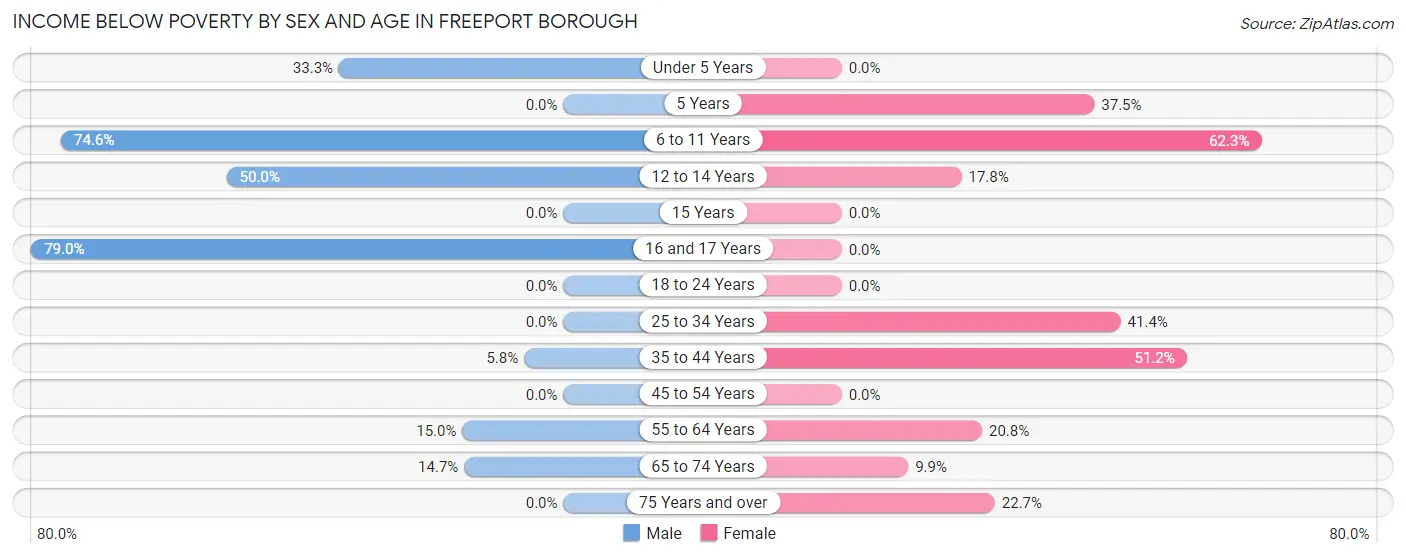
Income Below Poverty by Sex and Age in Freeport borough
With 20.9% poverty level for males and 28.7% for females among the residents of Freeport borough, 16 and 17 year old males and 6 to 11 year old females are the most vulnerable to poverty, with 64 males (79.0%) and 71 females (62.3%) in their respective age groups living below the poverty level.
| Age Bracket | Male | Female |
| Under 5 Years | 7 (33.3%) | 0 (0.0%) |
| 5 Years | 0 (0.0%) | 9 (37.5%) |
| 6 to 11 Years | 44 (74.6%) | 71 (62.3%) |
| 12 to 14 Years | 8 (50.0%) | 8 (17.8%) |
| 15 Years | 0 (0.0%) | 0 (0.0%) |
| 16 and 17 Years | 64 (79.0%) | 0 (0.0%) |
| 18 to 24 Years | 0 (0.0%) | 0 (0.0%) |
| 25 to 34 Years | 0 (0.0%) | 53 (41.4%) |
| 35 to 44 Years | 8 (5.8%) | 85 (51.2%) |
| 45 to 54 Years | 0 (0.0%) | 0 (0.0%) |
| 55 to 64 Years | 12 (15.0%) | 30 (20.8%) |
| 65 to 74 Years | 19 (14.7%) | 7 (9.9%) |
| 75 Years and over | 0 (0.0%) | 10 (22.7%) |
| Total | 162 (20.9%) | 273 (28.7%) |
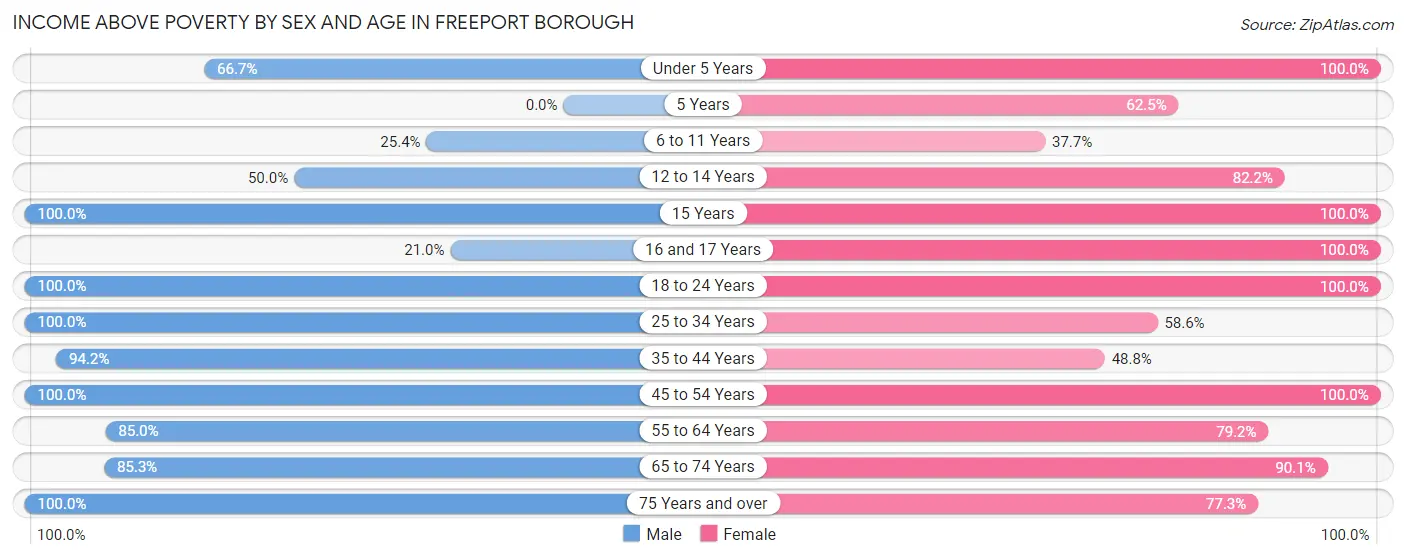
Income Above Poverty by Sex and Age in Freeport borough
According to the poverty statistics in Freeport borough, males aged 15 years and females aged under 5 years are the age groups that are most secure financially, with 100.0% of males and 100.0% of females in these age groups living above the poverty line.
| Age Bracket | Male | Female |
| Under 5 Years | 14 (66.7%) | 67 (100.0%) |
| 5 Years | 0 (0.0%) | 15 (62.5%) |
| 6 to 11 Years | 15 (25.4%) | 43 (37.7%) |
| 12 to 14 Years | 8 (50.0%) | 37 (82.2%) |
| 15 Years | 24 (100.0%) | 4 (100.0%) |
| 16 and 17 Years | 17 (21.0%) | 13 (100.0%) |
| 18 to 24 Years | 21 (100.0%) | 33 (100.0%) |
| 25 to 34 Years | 87 (100.0%) | 75 (58.6%) |
| 35 to 44 Years | 129 (94.2%) | 81 (48.8%) |
| 45 to 54 Years | 103 (100.0%) | 98 (100.0%) |
| 55 to 64 Years | 68 (85.0%) | 114 (79.2%) |
| 65 to 74 Years | 110 (85.3%) | 64 (90.1%) |
| 75 Years and over | 16 (100.0%) | 34 (77.3%) |
| Total | 612 (79.1%) | 678 (71.3%) |
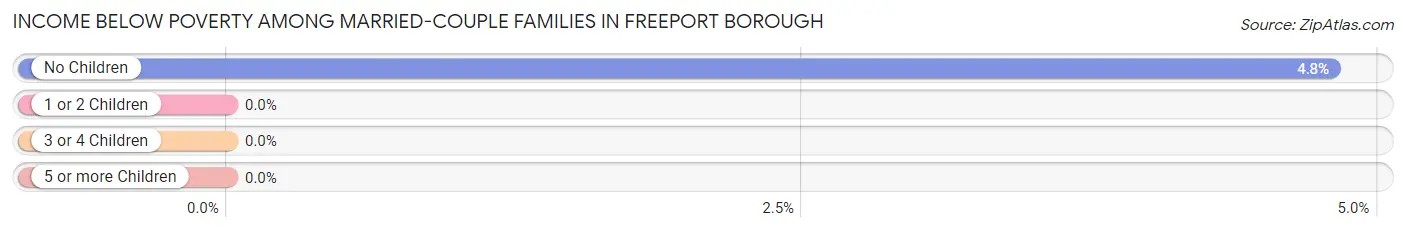
Income Below Poverty Among Married-Couple Families in Freeport borough
The poverty statistics for married-couple families in Freeport borough show that 2.5% or 6 of the total 236 families live below the poverty line. Families with no children have the highest poverty rate of 4.8%, comprising of 6 families. On the other hand, families with 1 or 2 children have the lowest poverty rate of 0.0%, which includes 0 families.
| Children | Above Poverty | Below Poverty |
| No Children | 119 (95.2%) | 6 (4.8%) |
| 1 or 2 Children | 105 (100.0%) | 0 (0.0%) |
| 3 or 4 Children | 6 (100.0%) | 0 (0.0%) |
| 5 or more Children | 0 (0.0%) | 0 (0.0%) |
| Total | 230 (97.5%) | 6 (2.5%) |
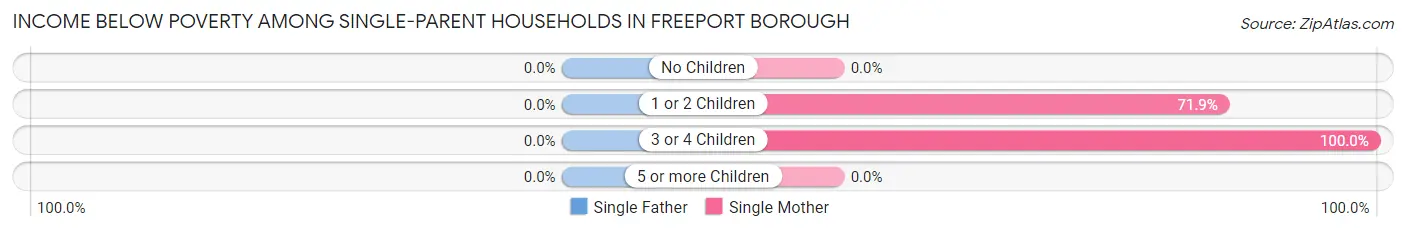
Income Below Poverty Among Single-Parent Households in Freeport borough
| Children | Single Father | Single Mother |
| No Children | 0 (0.0%) | 0 (0.0%) |
| 1 or 2 Children | 0 (0.0%) | 69 (71.9%) |
| 3 or 4 Children | 0 (0.0%) | 27 (100.0%) |
| 5 or more Children | 0 (0.0%) | 0 (0.0%) |
| Total | 0 (0.0%) | 96 (72.2%) |
Income Below Poverty Among Married-Couple vs Single-Parent Households in Freeport borough
The poverty data for Freeport borough shows that 6 of the married-couple family households (2.5%) and 96 of the single-parent households (45.1%) are living below the poverty level. Within the married-couple family households, those with no children have the highest poverty rate, with 6 households (4.8%) falling below the poverty line. Among the single-parent households, those with 3 or 4 children have the highest poverty rate, with 27 household (100.0%) living below poverty.
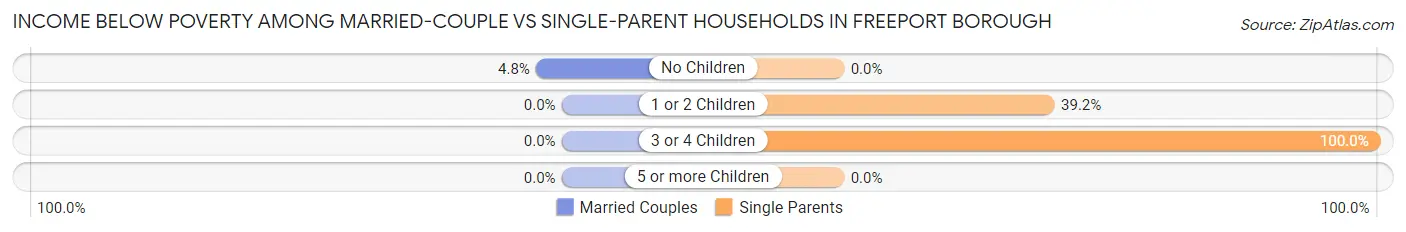
| Children | Married-Couple Families | Single-Parent Households |
| No Children | 6 (4.8%) | 0 (0.0%) |
| 1 or 2 Children | 0 (0.0%) | 69 (39.2%) |
| 3 or 4 Children | 0 (0.0%) | 27 (100.0%) |
| 5 or more Children | 0 (0.0%) | 0 (0.0%) |
| Total | 6 (2.5%) | 96 (45.1%) |
Race in Freeport borough
The most populous races in Freeport borough are White / Caucasian (1,645 | 95.4%), Two or more Races (53 | 3.1%), and Black / African American (27 | 1.6%).
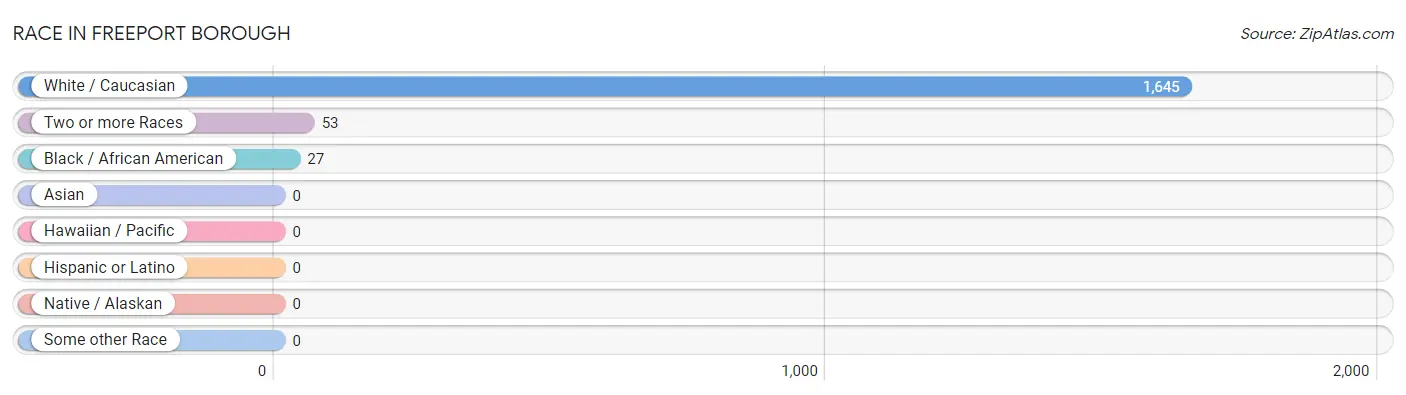
| Race | # Population | % Population |
| Asian | 0 | 0.0% |
| Black / African American | 27 | 1.6% |
| Hawaiian / Pacific | 0 | 0.0% |
| Hispanic or Latino | 0 | 0.0% |
| Native / Alaskan | 0 | 0.0% |
| White / Caucasian | 1,645 | 95.4% |
| Two or more Races | 53 | 3.1% |
| Some other Race | 0 | 0.0% |
| Total | 1,725 | 100.0% |
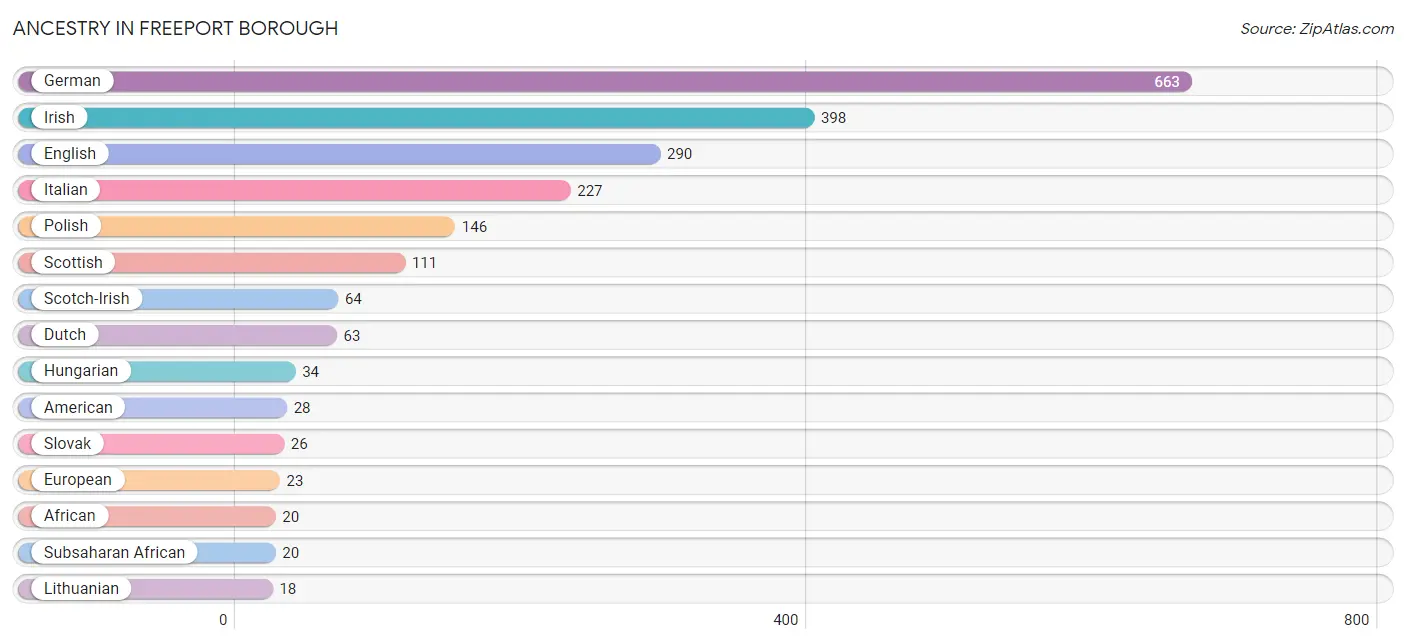
Ancestry in Freeport borough
The most populous ancestries reported in Freeport borough are German (663 | 38.4%), Irish (398 | 23.1%), English (290 | 16.8%), Italian (227 | 13.2%), and Polish (146 | 8.5%), together accounting for 99.9% of all Freeport borough residents.
| Ancestry | # Population | % Population |
| African | 20 | 1.2% |
| American | 28 | 1.6% |
| Belgian | 14 | 0.8% |
| British | 4 | 0.2% |
| Czech | 8 | 0.5% |
| Czechoslovakian | 16 | 0.9% |
| Dutch | 63 | 3.6% |
| English | 290 | 16.8% |
| European | 23 | 1.3% |
| German | 663 | 38.4% |
| Greek | 5 | 0.3% |
| Hungarian | 34 | 2.0% |
| Irish | 398 | 23.1% |
| Iroquois | 4 | 0.2% |
| Italian | 227 | 13.2% |
| Lithuanian | 18 | 1.0% |
| Pennsylvania German | 6 | 0.4% |
| Polish | 146 | 8.5% |
| Russian | 4 | 0.2% |
| Scotch-Irish | 64 | 3.7% |
| Scottish | 111 | 6.4% |
| Slovak | 26 | 1.5% |
| Subsaharan African | 20 | 1.2% |
| Swedish | 18 | 1.0% |
| Welsh | 13 | 0.7% | View All 25 Rows |
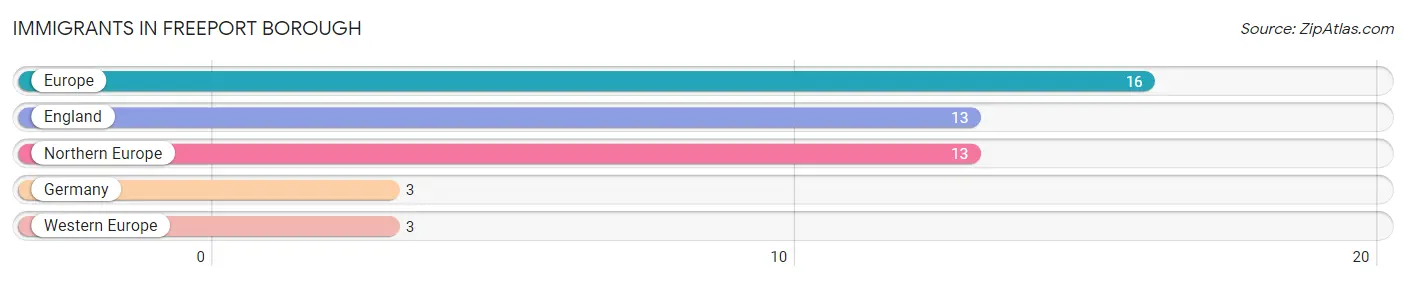
Immigrants in Freeport borough
The most numerous immigrant groups reported in Freeport borough came from Europe (16 | 0.9%), England (13 | 0.7%), Northern Europe (13 | 0.7%), Germany (3 | 0.2%), and Western Europe (3 | 0.2%), together accounting for 2.8% of all Freeport borough residents.
| Immigration Origin | # Population | % Population |
| England | 13 | 0.7% |
| Europe | 16 | 0.9% |
| Germany | 3 | 0.2% |
| Northern Europe | 13 | 0.7% |
| Western Europe | 3 | 0.2% | View All 5 Rows |
Sex and Age in Freeport borough
Sex and Age in Freeport borough
The most populous age groups in Freeport borough are 35 to 39 Years (124 | 16.0%) for men and 10 to 14 Years (137 | 14.4%) for women.
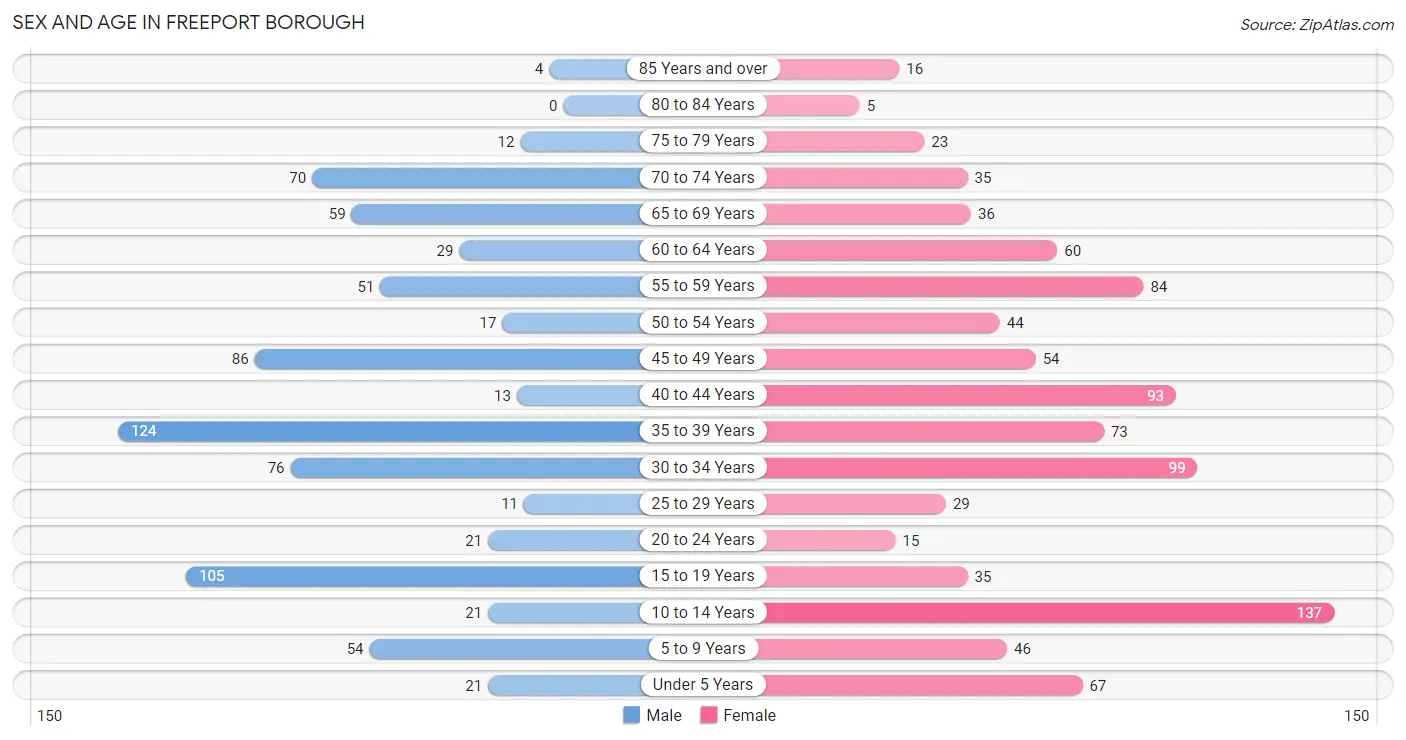
| Age Bracket | Male | Female |
| Under 5 Years | 21 (2.7%) | 67 (7.0%) |
| 5 to 9 Years | 54 (7.0%) | 46 (4.8%) |
| 10 to 14 Years | 21 (2.7%) | 137 (14.4%) |
| 15 to 19 Years | 105 (13.6%) | 35 (3.7%) |
| 20 to 24 Years | 21 (2.7%) | 15 (1.6%) |
| 25 to 29 Years | 11 (1.4%) | 29 (3.0%) |
| 30 to 34 Years | 76 (9.8%) | 99 (10.4%) |
| 35 to 39 Years | 124 (16.0%) | 73 (7.7%) |
| 40 to 44 Years | 13 (1.7%) | 93 (9.8%) |
| 45 to 49 Years | 86 (11.1%) | 54 (5.7%) |
| 50 to 54 Years | 17 (2.2%) | 44 (4.6%) |
| 55 to 59 Years | 51 (6.6%) | 84 (8.8%) |
| 60 to 64 Years | 29 (3.7%) | 60 (6.3%) |
| 65 to 69 Years | 59 (7.6%) | 36 (3.8%) |
| 70 to 74 Years | 70 (9.0%) | 35 (3.7%) |
| 75 to 79 Years | 12 (1.5%) | 23 (2.4%) |
| 80 to 84 Years | 0 (0.0%) | 5 (0.5%) |
| 85 Years and over | 4 (0.5%) | 16 (1.7%) |
| Total | 774 (100.0%) | 951 (100.0%) |
Families and Households in Freeport borough
Median Family Size in Freeport borough
The median family size in Freeport borough is 2.79 persons per family, with single female/mother families (133 | 29.6%) accounting for the largest median family size of 3.02 persons per family. On the other hand, single male/father families (80 | 17.8%) represent the smallest median family size with 1.85 persons per family.
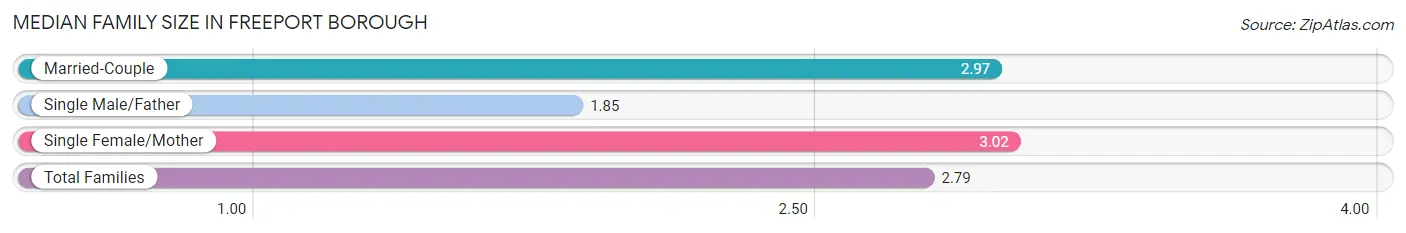
| Family Type | # Families | Family Size |
| Married-Couple | 236 (52.6%) | 2.97 |
| Single Male/Father | 80 (17.8%) | 1.85 |
| Single Female/Mother | 133 (29.6%) | 3.02 |
| Total Families | 449 (100.0%) | 2.79 |
Median Household Size in Freeport borough
The median household size in Freeport borough is 2.09 persons per household, with single female/mother households (133 | 16.1%) accounting for the largest median household size of 3.02 persons per household. non-family households (378 | 45.7%) represent the smallest median household size with 1.08 persons per household.
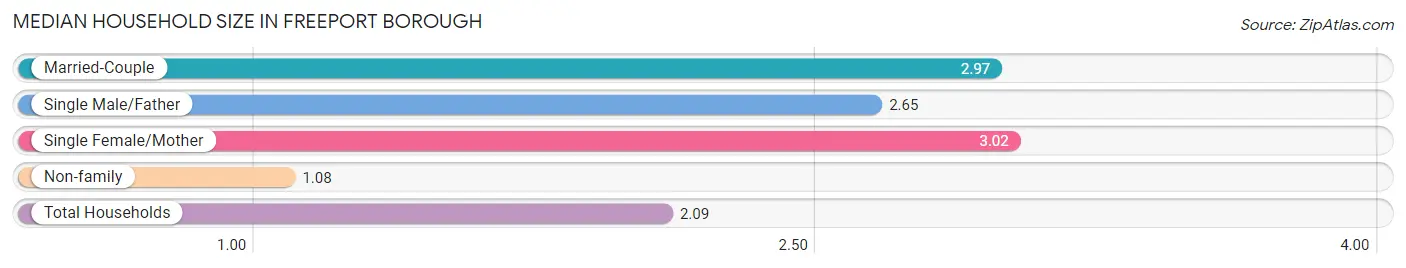
| Household Type | # Households | Household Size |
| Married-Couple | 236 (28.5%) | 2.97 |
| Single Male/Father | 80 (9.7%) | 2.65 |
| Single Female/Mother | 133 (16.1%) | 3.02 |
| Non-family | 378 (45.7%) | 1.08 |
| Total Households | 827 (100.0%) | 2.09 |
Household Size by Marriage Status in Freeport borough
Out of a total of 827 households in Freeport borough, 449 (54.3%) are family households, while 378 (45.7%) are nonfamily households. The most numerous type of family households are 2-person households, comprising 175, and the most common type of nonfamily households are 1-person households, comprising 359.
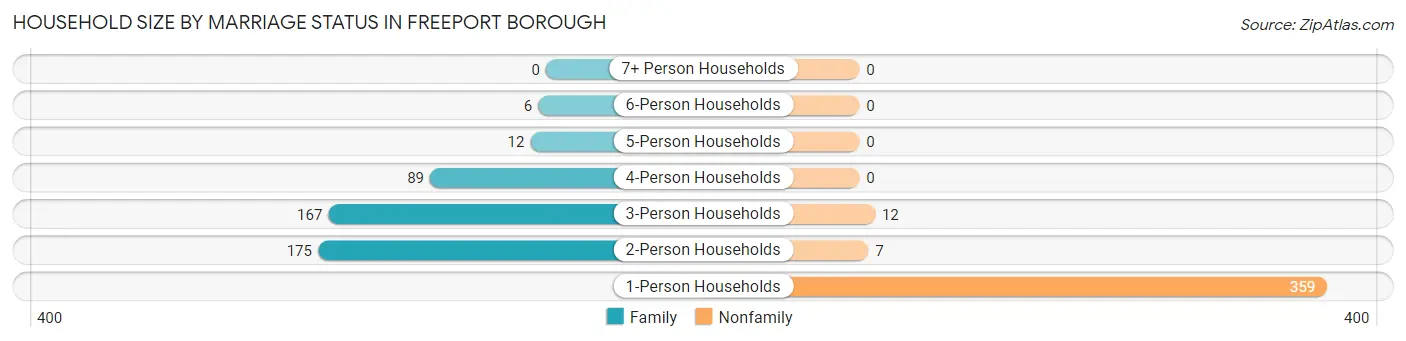
| Household Size | Family Households | Nonfamily Households |
| 1-Person Households | - | 359 (43.4%) |
| 2-Person Households | 175 (21.2%) | 7 (0.9%) |
| 3-Person Households | 167 (20.2%) | 12 (1.5%) |
| 4-Person Households | 89 (10.8%) | 0 (0.0%) |
| 5-Person Households | 12 (1.5%) | 0 (0.0%) |
| 6-Person Households | 6 (0.7%) | 0 (0.0%) |
| 7+ Person Households | 0 (0.0%) | 0 (0.0%) |
| Total | 449 (54.3%) | 378 (45.7%) |
Female Fertility in Freeport borough
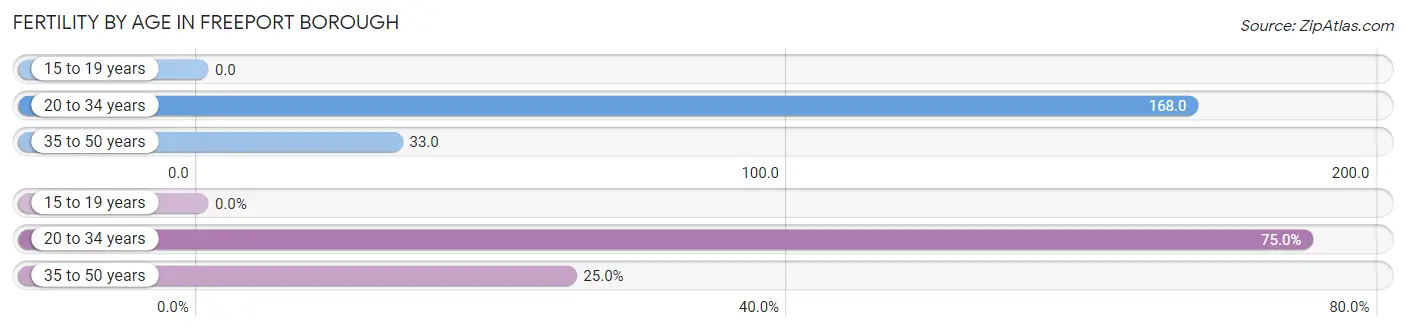
Fertility by Age in Freeport borough
Average fertility rate in Freeport borough is 76.0 births per 1,000 women. Women in the age bracket of 20 to 34 years have the highest fertility rate with 168.0 births per 1,000 women. Women in the age bracket of 20 to 34 years acount for 75.0% of all women with births.
| Age Bracket | Women with Births | Births / 1,000 Women |
| 15 to 19 years | 0 (0.0%) | 0.0 |
| 20 to 34 years | 24 (75.0%) | 168.0 |
| 35 to 50 years | 8 (25.0%) | 33.0 |
| Total | 32 (100.0%) | 76.0 |
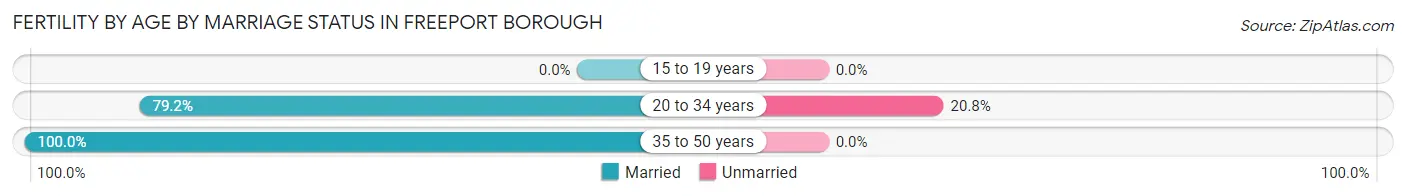
Fertility by Age by Marriage Status in Freeport borough
84.4% of women with births (32) in Freeport borough are married. The highest percentage of unmarried women with births falls into 20 to 34 years age bracket with 20.8% of them unmarried at the time of birth, while the lowest percentage of unmarried women with births belong to 35 to 50 years age bracket with 0.0% of them unmarried.
| Age Bracket | Married | Unmarried |
| 15 to 19 years | 0 (0.0%) | 0 (0.0%) |
| 20 to 34 years | 19 (79.2%) | 5 (20.8%) |
| 35 to 50 years | 8 (100.0%) | 0 (0.0%) |
| Total | 27 (84.4%) | 5 (15.6%) |
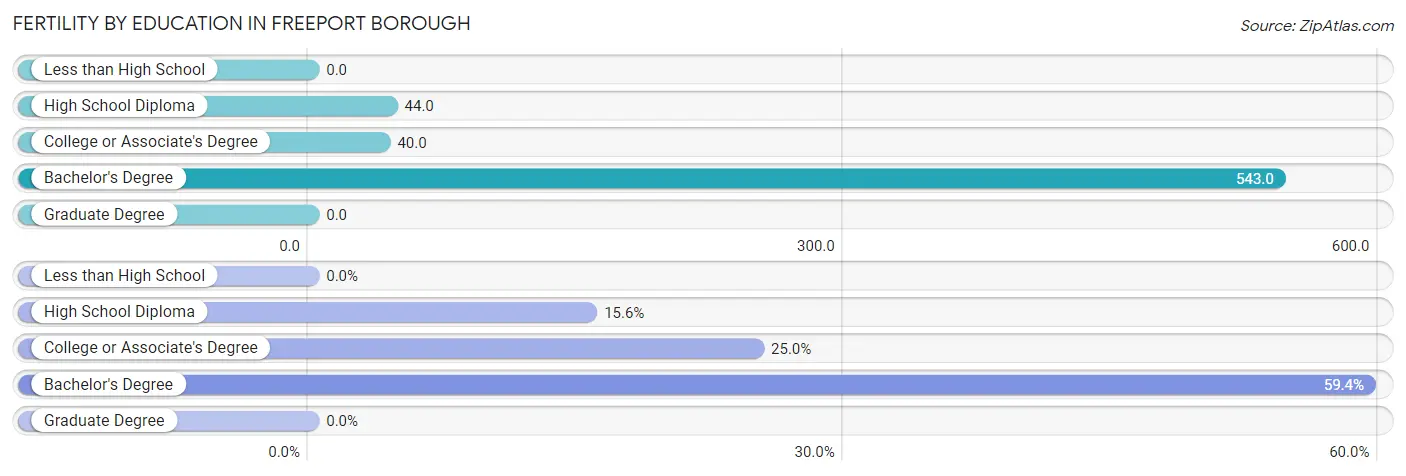
Fertility by Education in Freeport borough
| Educational Attainment | Women with Births | Births / 1,000 Women |
| Less than High School | 0 (0.0%) | 0.0 |
| High School Diploma | 5 (15.6%) | 44.0 |
| College or Associate's Degree | 8 (25.0%) | 40.0 |
| Bachelor's Degree | 19 (59.4%) | 543.0 |
| Graduate Degree | 0 (0.0%) | 0.0 |
| Total | 32 (100.0%) | 76.0 |
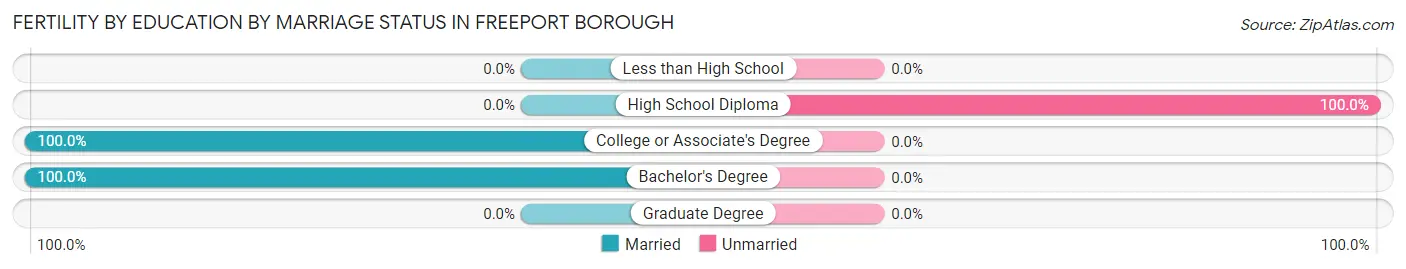
Fertility by Education by Marriage Status in Freeport borough
15.6% of women with births in Freeport borough are unmarried. Women with the educational attainment of college or associate's degree are most likely to be married with 100.0% of them married at childbirth, while women with the educational attainment of high school diploma are least likely to be married with 100.0% of them unmarried at childbirth.
| Educational Attainment | Married | Unmarried |
| Less than High School | 0 (0.0%) | 0 (0.0%) |
| High School Diploma | 0 (0.0%) | 5 (100.0%) |
| College or Associate's Degree | 8 (100.0%) | 0 (0.0%) |
| Bachelor's Degree | 19 (100.0%) | 0 (0.0%) |
| Graduate Degree | 0 (0.0%) | 0 (0.0%) |
| Total | 27 (84.4%) | 5 (15.6%) |
Employment Characteristics in Freeport borough
Employment by Class of Employer in Freeport borough
Among the 730 employed individuals in Freeport borough, private company employees (577 | 79.0%), not-for-profit organizations (48 | 6.6%), and federal government employees (33 | 4.5%) make up the most common classes of employment.
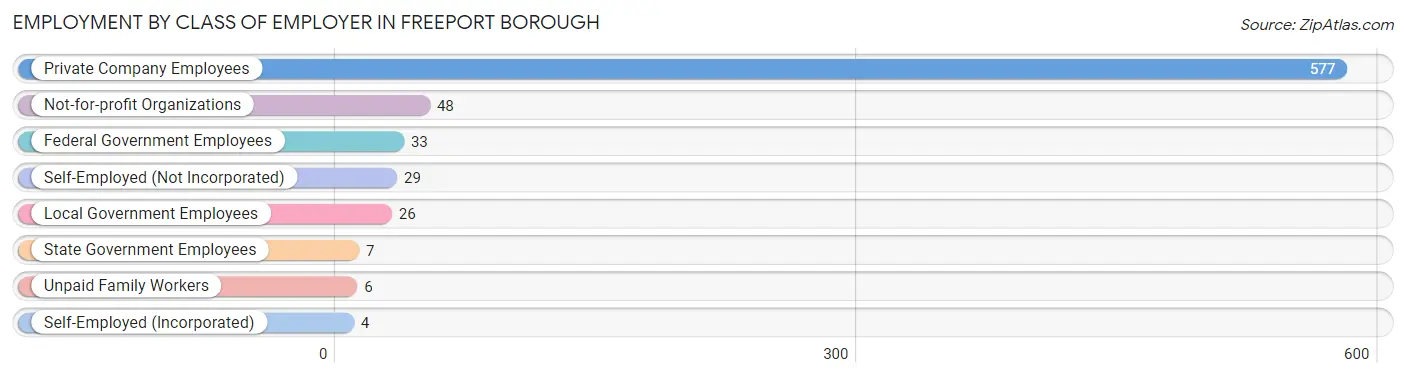
| Employer Class | # Employees | % Employees |
| Private Company Employees | 577 | 79.0% |
| Self-Employed (Incorporated) | 4 | 0.5% |
| Self-Employed (Not Incorporated) | 29 | 4.0% |
| Not-for-profit Organizations | 48 | 6.6% |
| Local Government Employees | 26 | 3.6% |
| State Government Employees | 7 | 1.0% |
| Federal Government Employees | 33 | 4.5% |
| Unpaid Family Workers | 6 | 0.8% |
| Total | 730 | 100.0% |
Employment Status by Age in Freeport borough
According to the labor force statistics for Freeport borough, out of the total population over 16 years of age (1,351), 60.2% or 813 individuals are in the labor force, with 9.2% or 75 of them unemployed. The age group with the highest labor force participation rate is 35 to 44 years, with 89.1% or 270 individuals in the labor force. Within the labor force, the 65 to 74 years age range has the highest percentage of unemployed individuals, with 33.3% or 16 of them being unemployed.
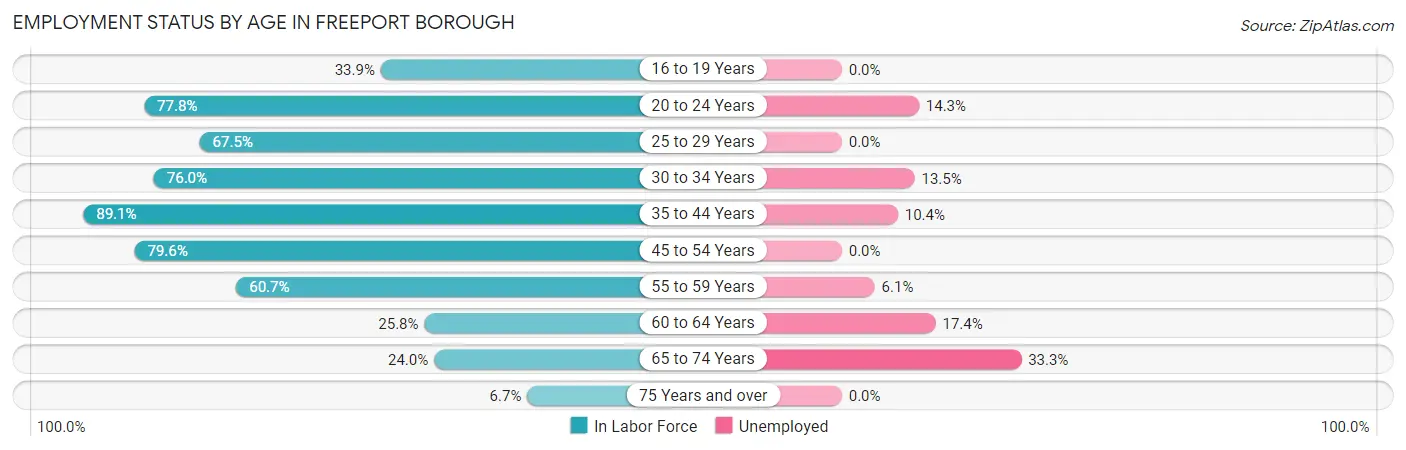
| Age Bracket | In Labor Force | Unemployed |
| 16 to 19 Years | 38 (33.9%) | 0 (0.0%) |
| 20 to 24 Years | 28 (77.8%) | 4 (14.3%) |
| 25 to 29 Years | 27 (67.5%) | 0 (0.0%) |
| 30 to 34 Years | 133 (76.0%) | 18 (13.5%) |
| 35 to 44 Years | 270 (89.1%) | 28 (10.4%) |
| 45 to 54 Years | 160 (79.6%) | 0 (0.0%) |
| 55 to 59 Years | 82 (60.7%) | 5 (6.1%) |
| 60 to 64 Years | 23 (25.8%) | 4 (17.4%) |
| 65 to 74 Years | 48 (24.0%) | 16 (33.3%) |
| 75 Years and over | 4 (6.7%) | 0 (0.0%) |
| Total | 813 (60.2%) | 75 (9.2%) |
Employment Status by Educational Attainment in Freeport borough
According to labor force statistics for Freeport borough, 73.7% of individuals (695) out of the total population between 25 and 64 years of age (943) are in the labor force, with 7.9% or 55 of them being unemployed. The group with the highest labor force participation rate are those with the educational attainment of bachelor's degree or higher, with 78.1% or 143 individuals in the labor force. Within the labor force, individuals with high school diploma education have the highest percentage of unemployment, with 12.7% or 32 of them being unemployed.
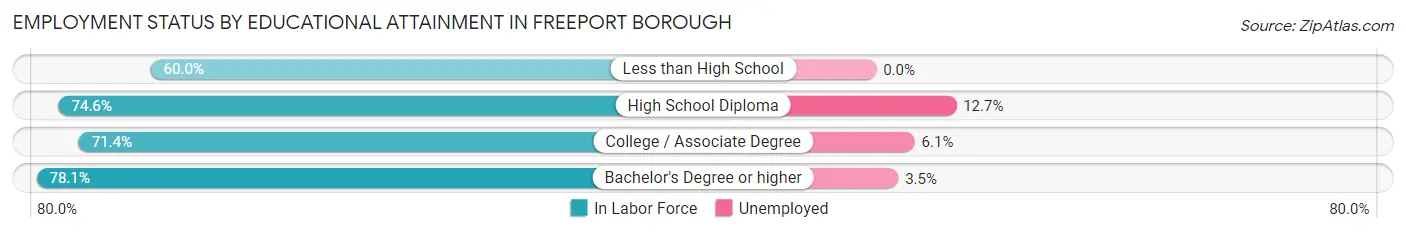
| Educational Attainment | In Labor Force | Unemployed |
| Less than High School | 6 (60.0%) | 0 (0.0%) |
| High School Diploma | 252 (74.6%) | 43 (12.7%) |
| College / Associate Degree | 294 (71.4%) | 25 (6.1%) |
| Bachelor's Degree or higher | 143 (78.1%) | 6 (3.5%) |
| Total | 695 (73.7%) | 74 (7.9%) |
Employment Occupations by Sex in Freeport borough
Management, Business, Science and Arts Occupations
The most common Management, Business, Science and Arts occupations in Freeport borough are Health Diagnosing & Treating (66 | 8.9%), Business & Financial (57 | 7.7%), Computers, Engineering & Science (51 | 6.9%), Health Technologists (51 | 6.9%), and Community & Social Service (49 | 6.6%).
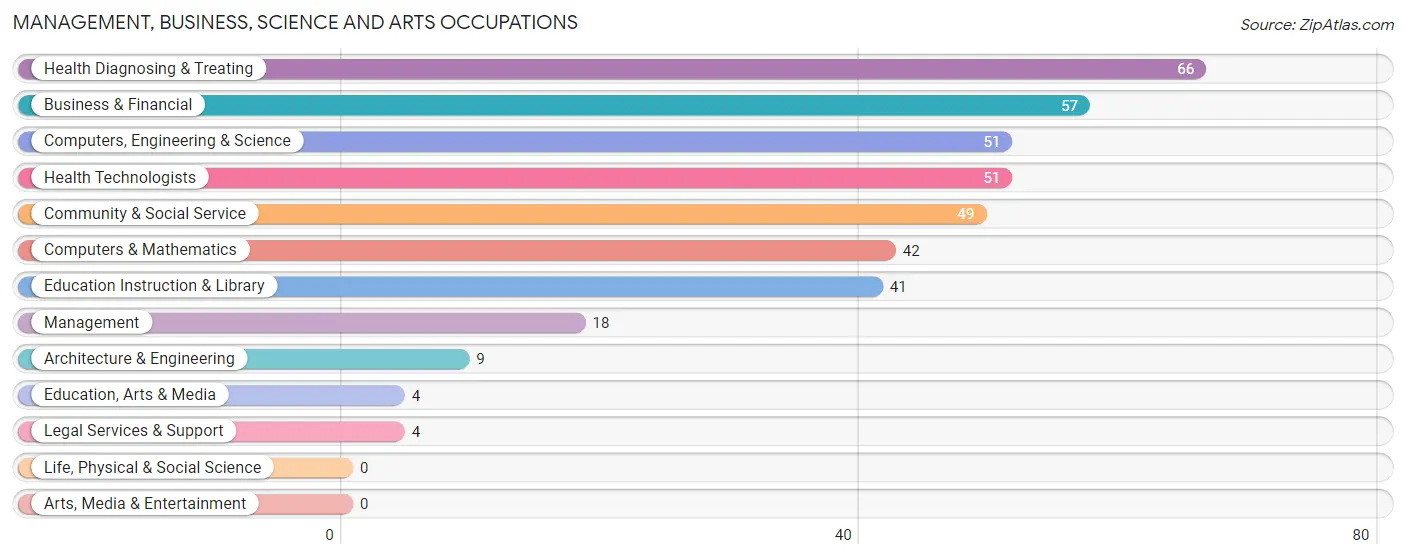
Management, Business, Science and Arts Occupations by Sex
Within the Management, Business, Science and Arts occupations in Freeport borough, the most male-oriented occupations are Architecture & Engineering (100.0%), Legal Services & Support (100.0%), and Business & Financial (96.5%), while the most female-oriented occupations are Education, Arts & Media (100.0%), Health Technologists (78.4%), and Health Diagnosing & Treating (77.3%).
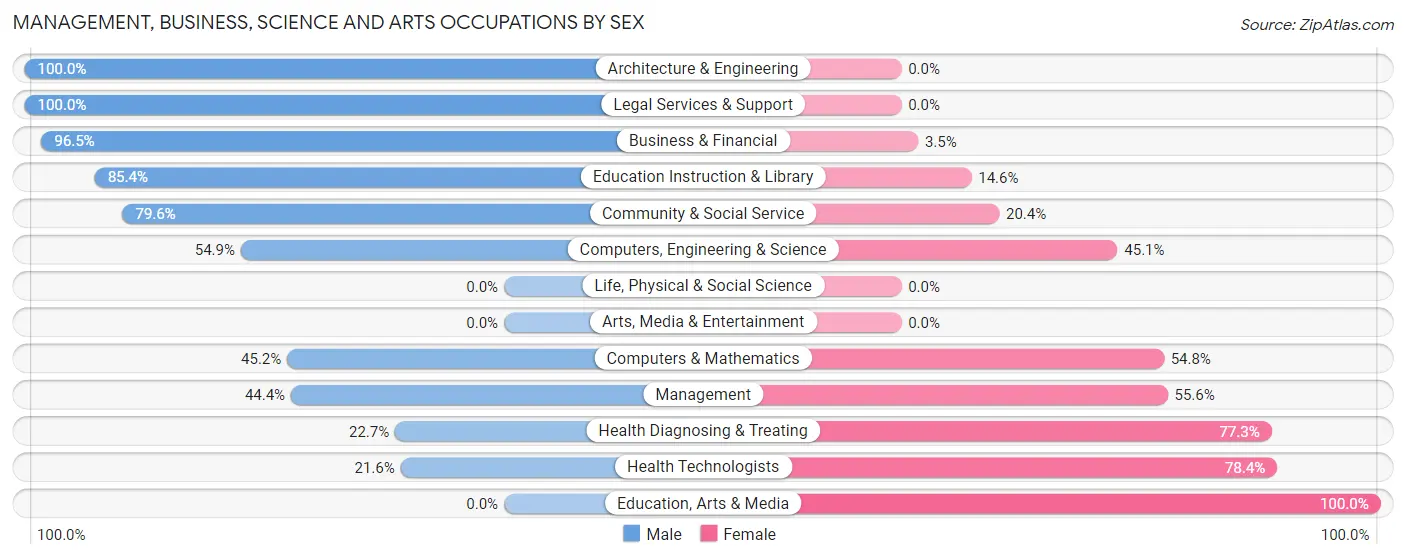
| Occupation | Male | Female |
| Management | 8 (44.4%) | 10 (55.6%) |
| Business & Financial | 55 (96.5%) | 2 (3.5%) |
| Computers, Engineering & Science | 28 (54.9%) | 23 (45.1%) |
| Computers & Mathematics | 19 (45.2%) | 23 (54.8%) |
| Architecture & Engineering | 9 (100.0%) | 0 (0.0%) |
| Life, Physical & Social Science | 0 (0.0%) | 0 (0.0%) |
| Community & Social Service | 39 (79.6%) | 10 (20.4%) |
| Education, Arts & Media | 0 (0.0%) | 4 (100.0%) |
| Legal Services & Support | 4 (100.0%) | 0 (0.0%) |
| Education Instruction & Library | 35 (85.4%) | 6 (14.6%) |
| Arts, Media & Entertainment | 0 (0.0%) | 0 (0.0%) |
| Health Diagnosing & Treating | 15 (22.7%) | 51 (77.3%) |
| Health Technologists | 11 (21.6%) | 40 (78.4%) |
| Total (Category) | 145 (60.2%) | 96 (39.8%) |
| Total (Overall) | 375 (50.8%) | 363 (49.2%) |
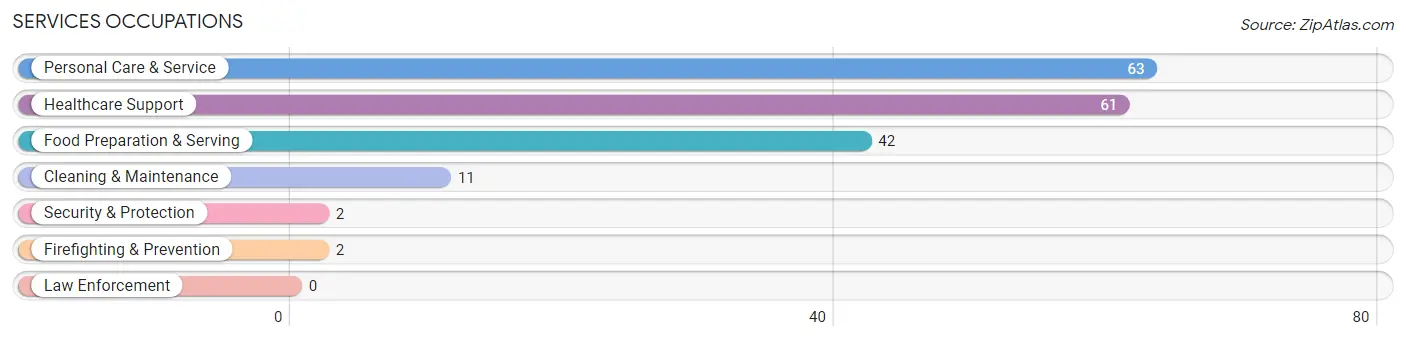
Services Occupations
The most common Services occupations in Freeport borough are Personal Care & Service (63 | 8.5%), Healthcare Support (61 | 8.3%), Food Preparation & Serving (42 | 5.7%), Cleaning & Maintenance (11 | 1.5%), and Security & Protection (2 | 0.3%).
Services Occupations by Sex
Within the Services occupations in Freeport borough, the most male-oriented occupations are Security & Protection (100.0%), Firefighting & Prevention (100.0%), and Food Preparation & Serving (35.7%), while the most female-oriented occupations are Healthcare Support (100.0%), Cleaning & Maintenance (100.0%), and Personal Care & Service (100.0%).
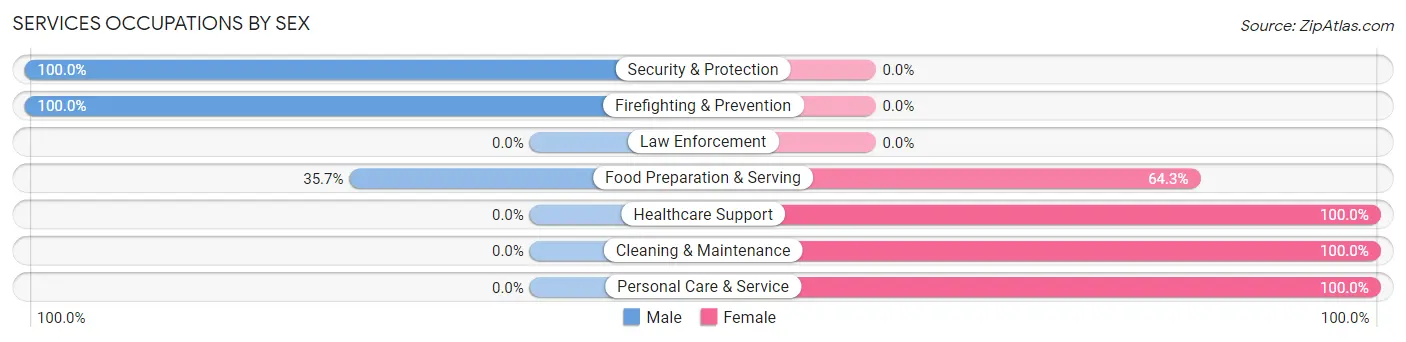
| Occupation | Male | Female |
| Healthcare Support | 0 (0.0%) | 61 (100.0%) |
| Security & Protection | 2 (100.0%) | 0 (0.0%) |
| Firefighting & Prevention | 2 (100.0%) | 0 (0.0%) |
| Law Enforcement | 0 (0.0%) | 0 (0.0%) |
| Food Preparation & Serving | 15 (35.7%) | 27 (64.3%) |
| Cleaning & Maintenance | 0 (0.0%) | 11 (100.0%) |
| Personal Care & Service | 0 (0.0%) | 63 (100.0%) |
| Total (Category) | 17 (9.5%) | 162 (90.5%) |
| Total (Overall) | 375 (50.8%) | 363 (49.2%) |
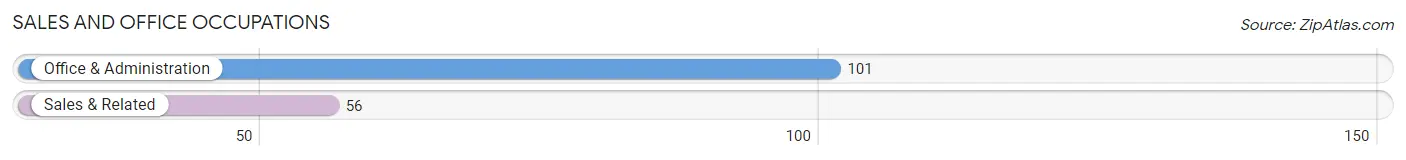
Sales and Office Occupations
The most common Sales and Office occupations in Freeport borough are Office & Administration (101 | 13.7%), and Sales & Related (56 | 7.6%).
Sales and Office Occupations by Sex

| Occupation | Male | Female |
| Sales & Related | 42 (75.0%) | 14 (25.0%) |
| Office & Administration | 18 (17.8%) | 83 (82.2%) |
| Total (Category) | 60 (38.2%) | 97 (61.8%) |
| Total (Overall) | 375 (50.8%) | 363 (49.2%) |
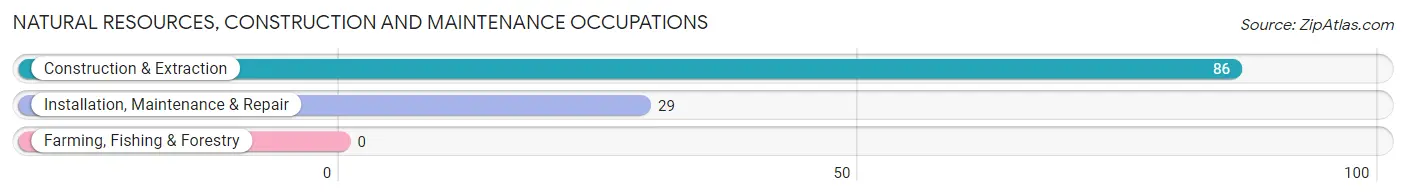
Natural Resources, Construction and Maintenance Occupations
The most common Natural Resources, Construction and Maintenance occupations in Freeport borough are Construction & Extraction (86 | 11.7%), and Installation, Maintenance & Repair (29 | 3.9%).
Natural Resources, Construction and Maintenance Occupations by Sex
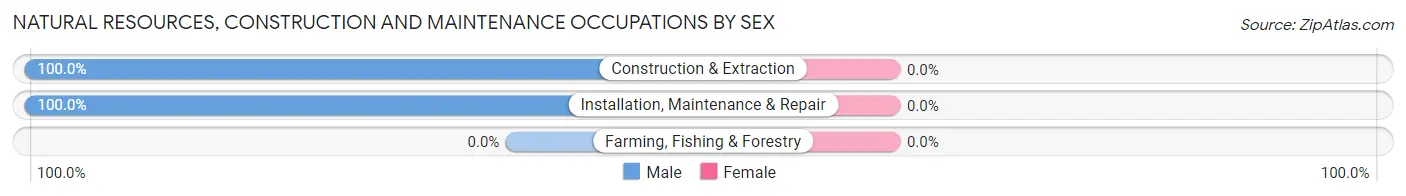
| Occupation | Male | Female |
| Farming, Fishing & Forestry | 0 (0.0%) | 0 (0.0%) |
| Construction & Extraction | 86 (100.0%) | 0 (0.0%) |
| Installation, Maintenance & Repair | 29 (100.0%) | 0 (0.0%) |
| Total (Category) | 115 (100.0%) | 0 (0.0%) |
| Total (Overall) | 375 (50.8%) | 363 (49.2%) |
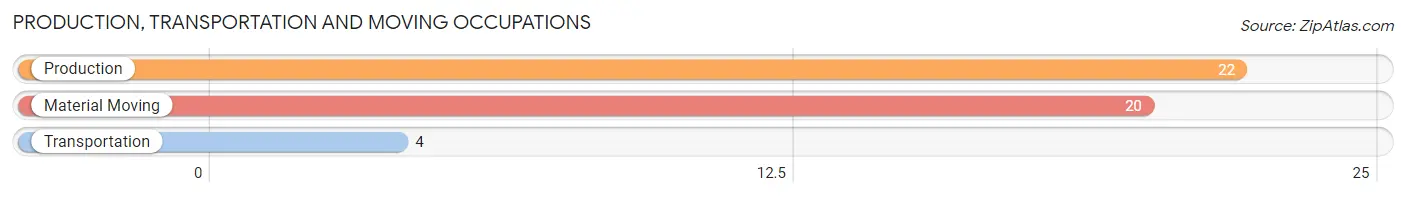
Production, Transportation and Moving Occupations
The most common Production, Transportation and Moving occupations in Freeport borough are Production (22 | 3.0%), Material Moving (20 | 2.7%), and Transportation (4 | 0.5%).
Production, Transportation and Moving Occupations by Sex
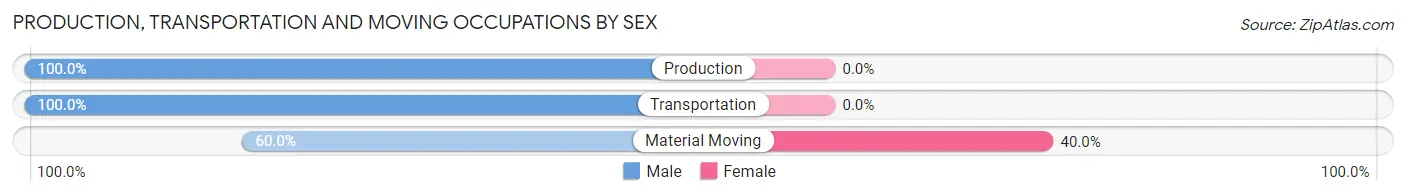
| Occupation | Male | Female |
| Production | 22 (100.0%) | 0 (0.0%) |
| Transportation | 4 (100.0%) | 0 (0.0%) |
| Material Moving | 12 (60.0%) | 8 (40.0%) |
| Total (Category) | 38 (82.6%) | 8 (17.4%) |
| Total (Overall) | 375 (50.8%) | 363 (49.2%) |
Employment Industries by Sex in Freeport borough
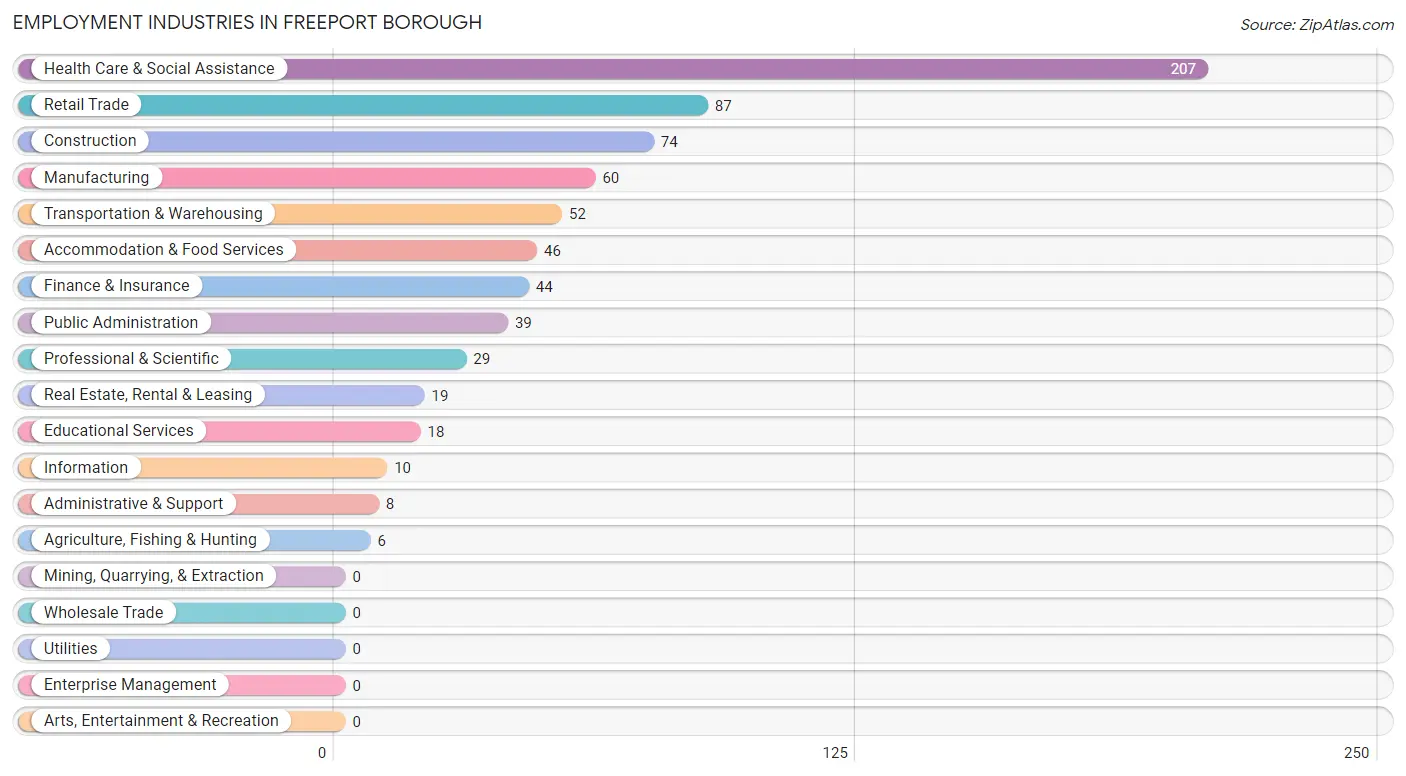
Employment Industries in Freeport borough
The major employment industries in Freeport borough include Health Care & Social Assistance (207 | 28.1%), Retail Trade (87 | 11.8%), Construction (74 | 10.0%), Manufacturing (60 | 8.1%), and Transportation & Warehousing (52 | 7.0%).
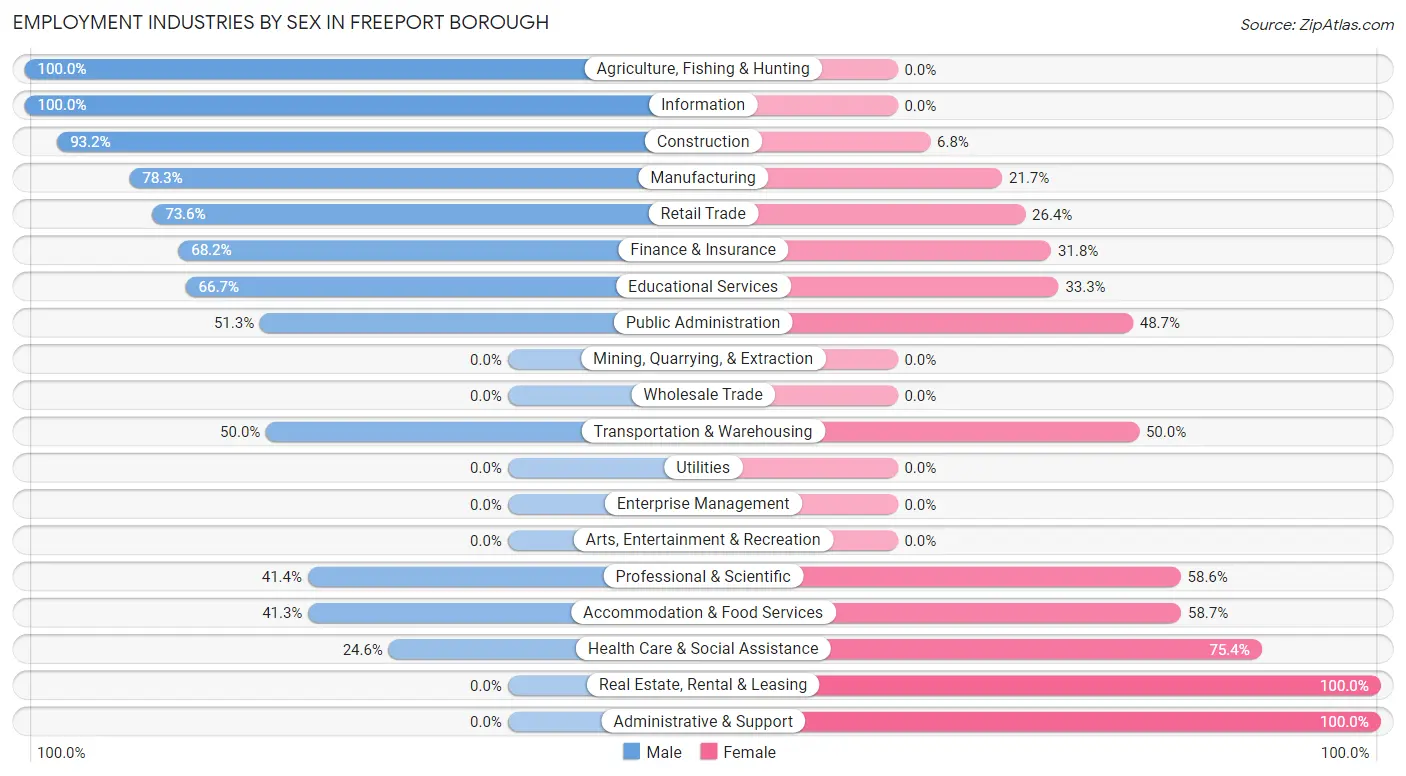
Employment Industries by Sex in Freeport borough
The Freeport borough industries that see more men than women are Agriculture, Fishing & Hunting (100.0%), Information (100.0%), and Construction (93.2%), whereas the industries that tend to have a higher number of women are Real Estate, Rental & Leasing (100.0%), Administrative & Support (100.0%), and Health Care & Social Assistance (75.4%).
| Industry | Male | Female |
| Agriculture, Fishing & Hunting | 6 (100.0%) | 0 (0.0%) |
| Mining, Quarrying, & Extraction | 0 (0.0%) | 0 (0.0%) |
| Construction | 69 (93.2%) | 5 (6.8%) |
| Manufacturing | 47 (78.3%) | 13 (21.7%) |
| Wholesale Trade | 0 (0.0%) | 0 (0.0%) |
| Retail Trade | 64 (73.6%) | 23 (26.4%) |
| Transportation & Warehousing | 26 (50.0%) | 26 (50.0%) |
| Utilities | 0 (0.0%) | 0 (0.0%) |
| Information | 10 (100.0%) | 0 (0.0%) |
| Finance & Insurance | 30 (68.2%) | 14 (31.8%) |
| Real Estate, Rental & Leasing | 0 (0.0%) | 19 (100.0%) |
| Professional & Scientific | 12 (41.4%) | 17 (58.6%) |
| Enterprise Management | 0 (0.0%) | 0 (0.0%) |
| Administrative & Support | 0 (0.0%) | 8 (100.0%) |
| Educational Services | 12 (66.7%) | 6 (33.3%) |
| Health Care & Social Assistance | 51 (24.6%) | 156 (75.4%) |
| Arts, Entertainment & Recreation | 0 (0.0%) | 0 (0.0%) |
| Accommodation & Food Services | 19 (41.3%) | 27 (58.7%) |
| Public Administration | 20 (51.3%) | 19 (48.7%) |
| Total | 375 (50.8%) | 363 (49.2%) |
Education in Freeport borough
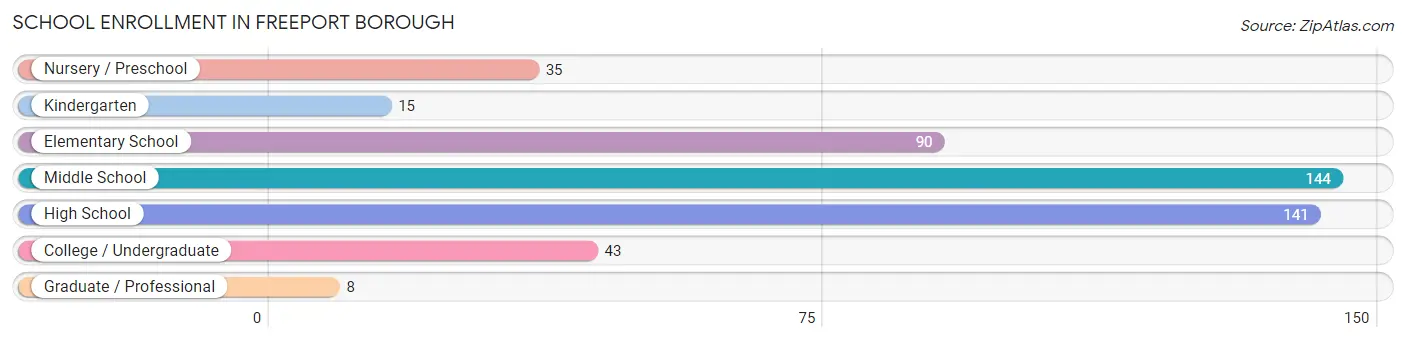
School Enrollment in Freeport borough
The most common levels of schooling among the 476 students in Freeport borough are middle school (144 | 30.2%), high school (141 | 29.6%), and elementary school (90 | 18.9%).
| School Level | # Students | % Students |
| Nursery / Preschool | 35 | 7.3% |
| Kindergarten | 15 | 3.2% |
| Elementary School | 90 | 18.9% |
| Middle School | 144 | 30.2% |
| High School | 141 | 29.6% |
| College / Undergraduate | 43 | 9.0% |
| Graduate / Professional | 8 | 1.7% |
| Total | 476 | 100.0% |
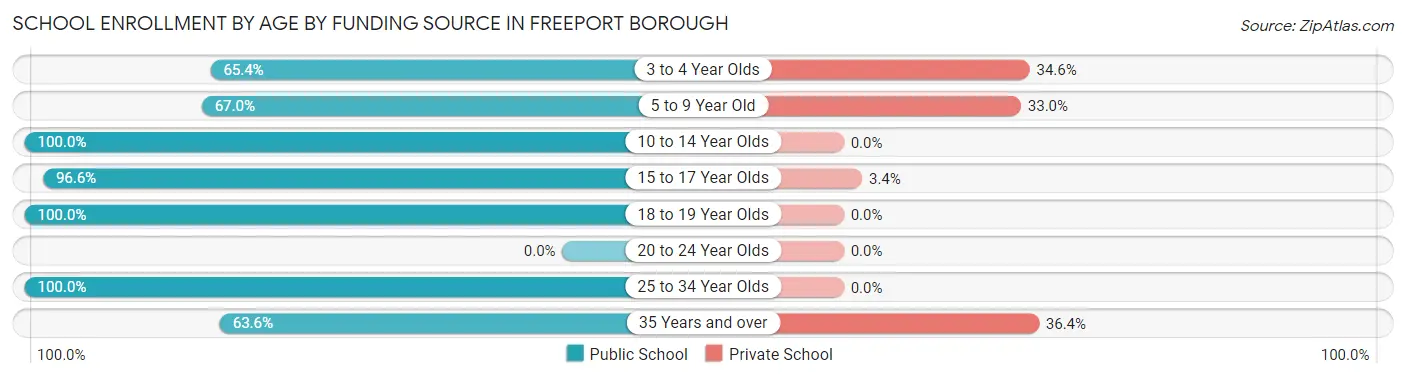
School Enrollment by Age by Funding Source in Freeport borough
Out of a total of 476 students who are enrolled in schools in Freeport borough, 58 (12.2%) attend a private institution, while the remaining 418 (87.8%) are enrolled in public schools. The age group of 35 years and over has the highest likelihood of being enrolled in private schools, with 12 (36.4% in the age bracket) enrolled. Conversely, the age group of 10 to 14 year olds has the lowest likelihood of being enrolled in a private school, with 158 (100.0% in the age bracket) attending a public institution.
| Age Bracket | Public School | Private School |
| 3 to 4 Year Olds | 17 (65.4%) | 9 (34.6%) |
| 5 to 9 Year Old | 67 (67.0%) | 33 (33.0%) |
| 10 to 14 Year Olds | 158 (100.0%) | 0 (0.0%) |
| 15 to 17 Year Olds | 113 (96.6%) | 4 (3.4%) |
| 18 to 19 Year Olds | 18 (100.0%) | 0 (0.0%) |
| 20 to 24 Year Olds | 0 (0.0%) | 0 (0.0%) |
| 25 to 34 Year Olds | 24 (100.0%) | 0 (0.0%) |
| 35 Years and over | 21 (63.6%) | 12 (36.4%) |
| Total | 418 (87.8%) | 58 (12.2%) |
Educational Attainment by Field of Study in Freeport borough
Science & technology (69 | 24.6%), business (50 | 17.9%), psychology (42 | 15.0%), arts & humanities (28 | 10.0%), and bio, nature & agricultural (27 | 9.6%) are the most common fields of study among 280 individuals in Freeport borough who have obtained a bachelor's degree or higher.
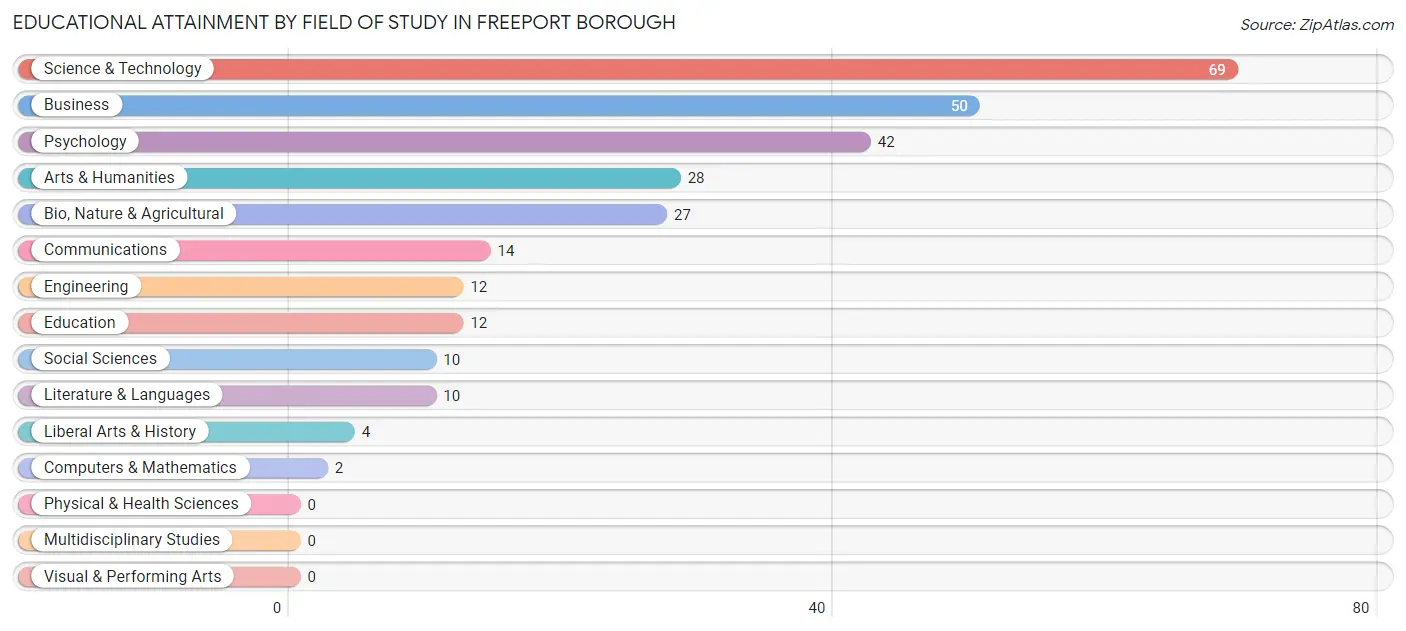
| Field of Study | # Graduates | % Graduates |
| Computers & Mathematics | 2 | 0.7% |
| Bio, Nature & Agricultural | 27 | 9.6% |
| Physical & Health Sciences | 0 | 0.0% |
| Psychology | 42 | 15.0% |
| Social Sciences | 10 | 3.6% |
| Engineering | 12 | 4.3% |
| Multidisciplinary Studies | 0 | 0.0% |
| Science & Technology | 69 | 24.6% |
| Business | 50 | 17.9% |
| Education | 12 | 4.3% |
| Literature & Languages | 10 | 3.6% |
| Liberal Arts & History | 4 | 1.4% |
| Visual & Performing Arts | 0 | 0.0% |
| Communications | 14 | 5.0% |
| Arts & Humanities | 28 | 10.0% |
| Total | 280 | 100.0% |
Transportation & Commute in Freeport borough
Vehicle Availability by Sex in Freeport borough
The most prevalent vehicle ownership categories in Freeport borough are males with 1 vehicle (139, accounting for 37.9%) and females with 1 vehicle (132, making up 38.3%).
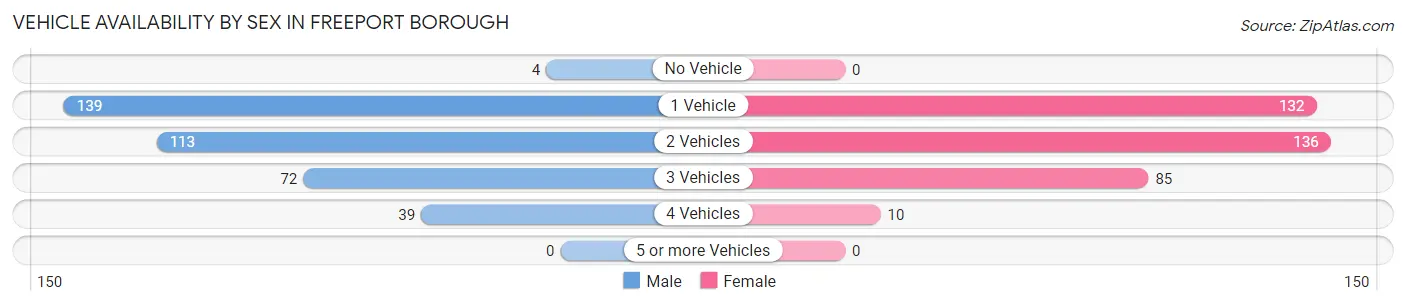
| Vehicles Available | Male | Female |
| No Vehicle | 4 (1.1%) | 0 (0.0%) |
| 1 Vehicle | 139 (37.9%) | 132 (36.4%) |
| 2 Vehicles | 113 (30.8%) | 136 (37.5%) |
| 3 Vehicles | 72 (19.6%) | 85 (23.4%) |
| 4 Vehicles | 39 (10.6%) | 10 (2.8%) |
| 5 or more Vehicles | 0 (0.0%) | 0 (0.0%) |
| Total | 367 (100.0%) | 363 (100.0%) |
Commute Time in Freeport borough
The most frequently occuring commute durations in Freeport borough are 5 to 9 minutes (149 commuters, 22.3%), 15 to 19 minutes (104 commuters, 15.6%), and 45 to 59 minutes (96 commuters, 14.4%).
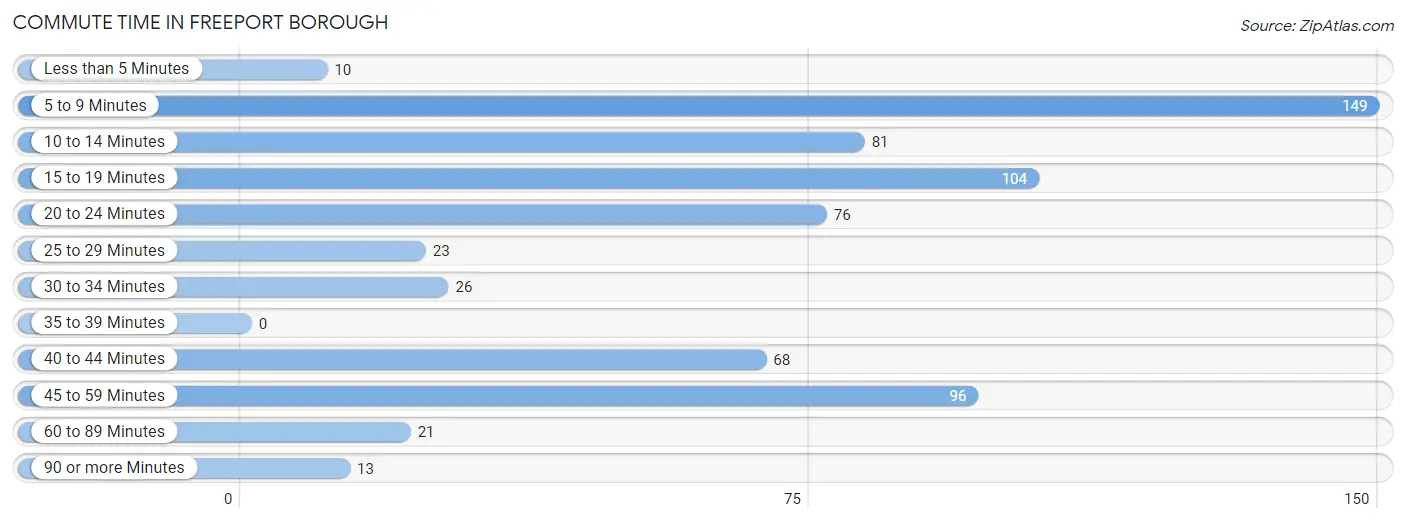
| Commute Time | # Commuters | % Commuters |
| Less than 5 Minutes | 10 | 1.5% |
| 5 to 9 Minutes | 149 | 22.3% |
| 10 to 14 Minutes | 81 | 12.1% |
| 15 to 19 Minutes | 104 | 15.6% |
| 20 to 24 Minutes | 76 | 11.4% |
| 25 to 29 Minutes | 23 | 3.5% |
| 30 to 34 Minutes | 26 | 3.9% |
| 35 to 39 Minutes | 0 | 0.0% |
| 40 to 44 Minutes | 68 | 10.2% |
| 45 to 59 Minutes | 96 | 14.4% |
| 60 to 89 Minutes | 21 | 3.2% |
| 90 or more Minutes | 13 | 1.9% |
Commute Time by Sex in Freeport borough
The most common commute times in Freeport borough are 15 to 19 minutes (87 commuters, 24.3%) for males and 5 to 9 minutes (99 commuters, 32.0%) for females.
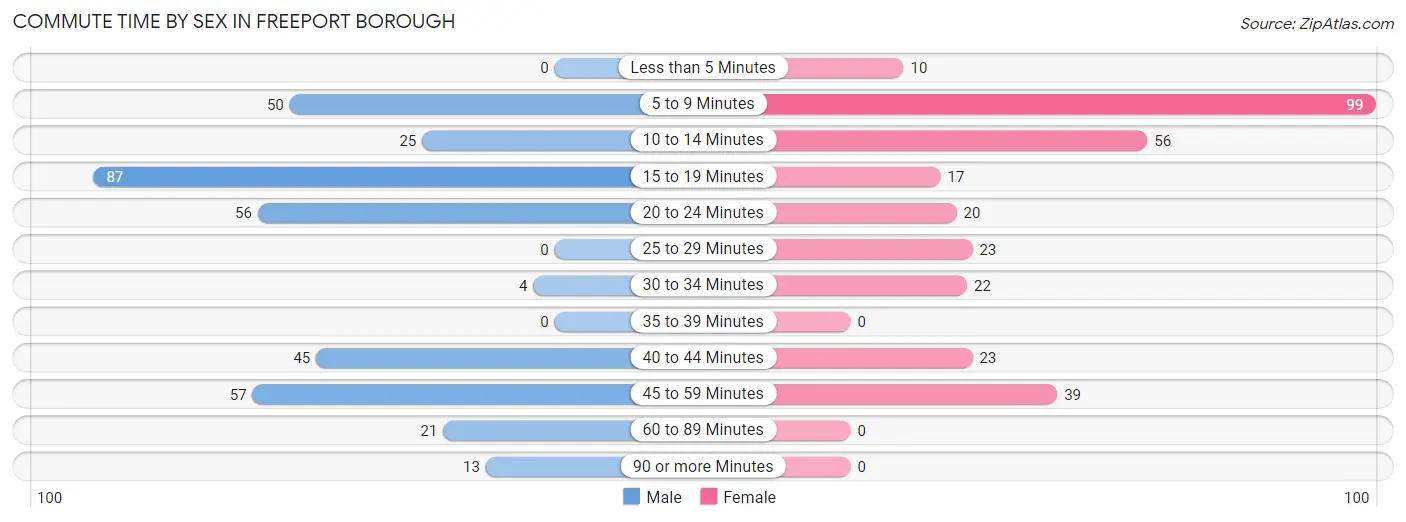
| Commute Time | Male | Female |
| Less than 5 Minutes | 0 (0.0%) | 10 (3.2%) |
| 5 to 9 Minutes | 50 (14.0%) | 99 (32.0%) |
| 10 to 14 Minutes | 25 (7.0%) | 56 (18.1%) |
| 15 to 19 Minutes | 87 (24.3%) | 17 (5.5%) |
| 20 to 24 Minutes | 56 (15.6%) | 20 (6.5%) |
| 25 to 29 Minutes | 0 (0.0%) | 23 (7.4%) |
| 30 to 34 Minutes | 4 (1.1%) | 22 (7.1%) |
| 35 to 39 Minutes | 0 (0.0%) | 0 (0.0%) |
| 40 to 44 Minutes | 45 (12.6%) | 23 (7.4%) |
| 45 to 59 Minutes | 57 (15.9%) | 39 (12.6%) |
| 60 to 89 Minutes | 21 (5.9%) | 0 (0.0%) |
| 90 or more Minutes | 13 (3.6%) | 0 (0.0%) |
Time of Departure to Work by Sex in Freeport borough
The most frequent times of departure to work in Freeport borough are 5:30 AM to 5:59 AM (95, 26.5%) for males and 8:00 AM to 8:29 AM (77, 24.9%) for females.
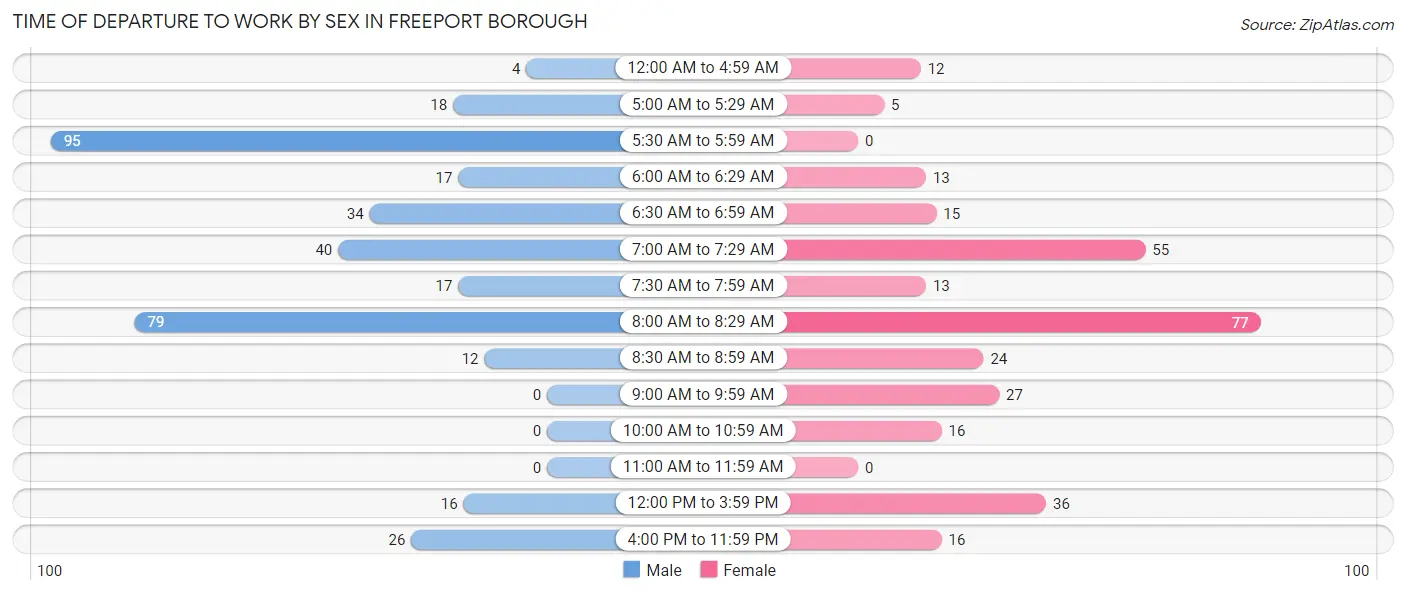
| Time of Departure | Male | Female |
| 12:00 AM to 4:59 AM | 4 (1.1%) | 12 (3.9%) |
| 5:00 AM to 5:29 AM | 18 (5.0%) | 5 (1.6%) |
| 5:30 AM to 5:59 AM | 95 (26.5%) | 0 (0.0%) |
| 6:00 AM to 6:29 AM | 17 (4.8%) | 13 (4.2%) |
| 6:30 AM to 6:59 AM | 34 (9.5%) | 15 (4.9%) |
| 7:00 AM to 7:29 AM | 40 (11.2%) | 55 (17.8%) |
| 7:30 AM to 7:59 AM | 17 (4.8%) | 13 (4.2%) |
| 8:00 AM to 8:29 AM | 79 (22.1%) | 77 (24.9%) |
| 8:30 AM to 8:59 AM | 12 (3.4%) | 24 (7.8%) |
| 9:00 AM to 9:59 AM | 0 (0.0%) | 27 (8.7%) |
| 10:00 AM to 10:59 AM | 0 (0.0%) | 16 (5.2%) |
| 11:00 AM to 11:59 AM | 0 (0.0%) | 0 (0.0%) |
| 12:00 PM to 3:59 PM | 16 (4.5%) | 36 (11.7%) |
| 4:00 PM to 11:59 PM | 26 (7.3%) | 16 (5.2%) |
| Total | 358 (100.0%) | 309 (100.0%) |
Housing Occupancy in Freeport borough
Occupancy by Ownership in Freeport borough
Of the total 827 dwellings in Freeport borough, owner-occupied units account for 413 (49.9%), while renter-occupied units make up 414 (50.1%).
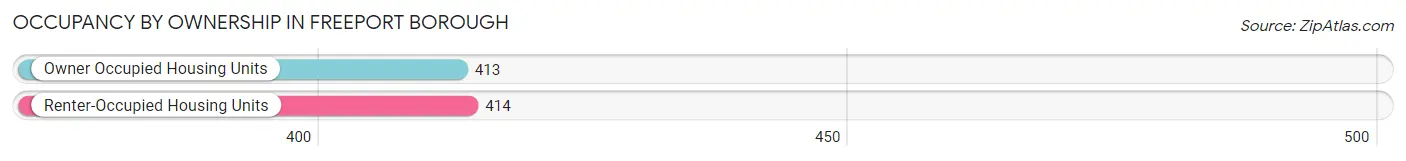
| Occupancy | # Housing Units | % Housing Units |
| Owner Occupied Housing Units | 413 | 49.9% |
| Renter-Occupied Housing Units | 414 | 50.1% |
| Total Occupied Housing Units | 827 | 100.0% |
Occupancy by Household Size in Freeport borough
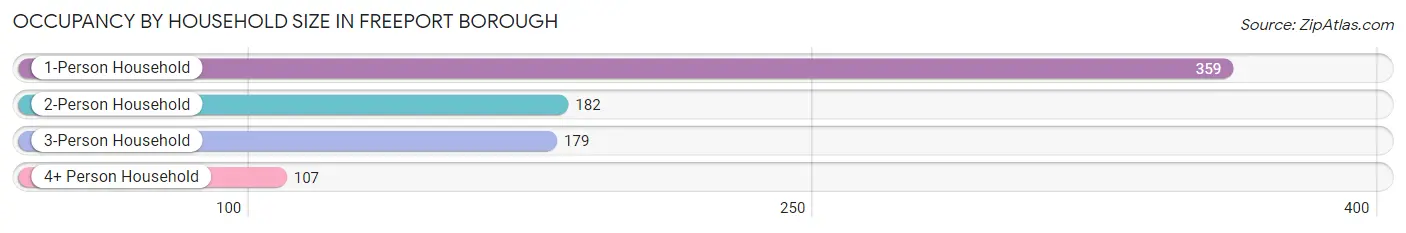
| Household Size | # Housing Units | % Housing Units |
| 1-Person Household | 359 | 43.4% |
| 2-Person Household | 182 | 22.0% |
| 3-Person Household | 179 | 21.6% |
| 4+ Person Household | 107 | 12.9% |
| Total Housing Units | 827 | 100.0% |
Occupancy by Ownership by Household Size in Freeport borough
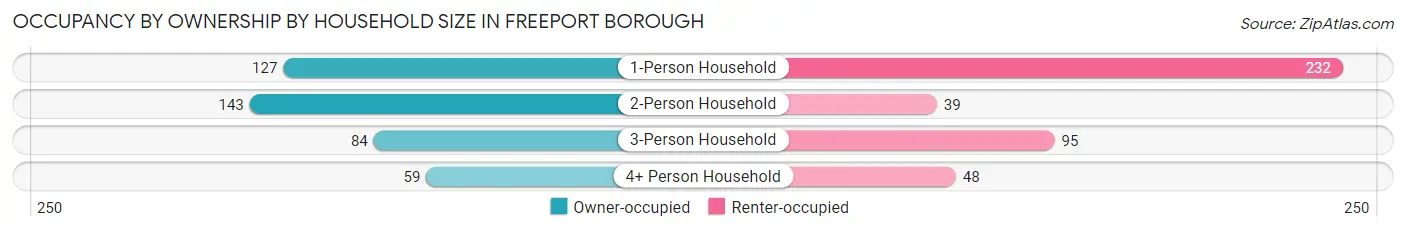
| Household Size | Owner-occupied | Renter-occupied |
| 1-Person Household | 127 (35.4%) | 232 (64.6%) |
| 2-Person Household | 143 (78.6%) | 39 (21.4%) |
| 3-Person Household | 84 (46.9%) | 95 (53.1%) |
| 4+ Person Household | 59 (55.1%) | 48 (44.9%) |
| Total Housing Units | 413 (49.9%) | 414 (50.1%) |
Occupancy by Educational Attainment in Freeport borough
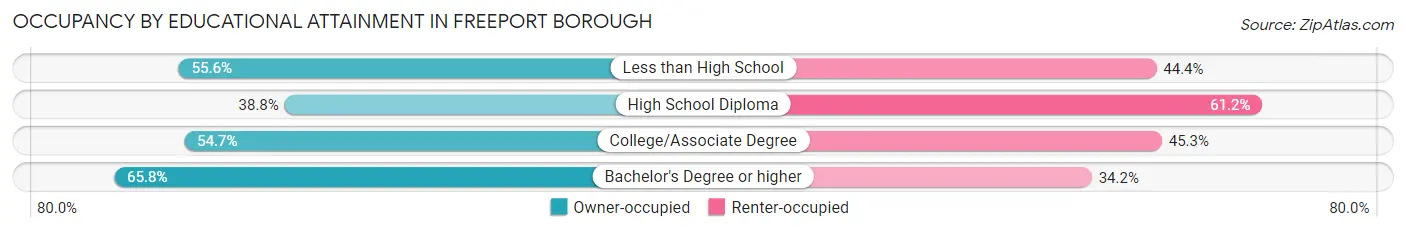
| Household Size | Owner-occupied | Renter-occupied |
| Less than High School | 10 (55.6%) | 8 (44.4%) |
| High School Diploma | 138 (38.8%) | 218 (61.2%) |
| College/Associate Degree | 163 (54.7%) | 135 (45.3%) |
| Bachelor's Degree or higher | 102 (65.8%) | 53 (34.2%) |
Occupancy by Age of Householder in Freeport borough
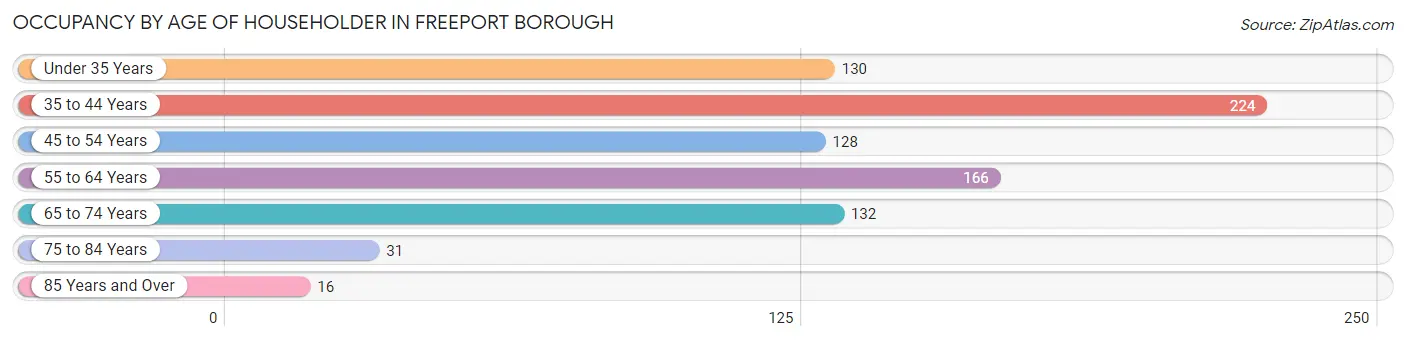
| Age Bracket | # Households | % Households |
| Under 35 Years | 130 | 15.7% |
| 35 to 44 Years | 224 | 27.1% |
| 45 to 54 Years | 128 | 15.5% |
| 55 to 64 Years | 166 | 20.1% |
| 65 to 74 Years | 132 | 16.0% |
| 75 to 84 Years | 31 | 3.7% |
| 85 Years and Over | 16 | 1.9% |
| Total | 827 | 100.0% |
Housing Finances in Freeport borough
Median Income by Occupancy in Freeport borough
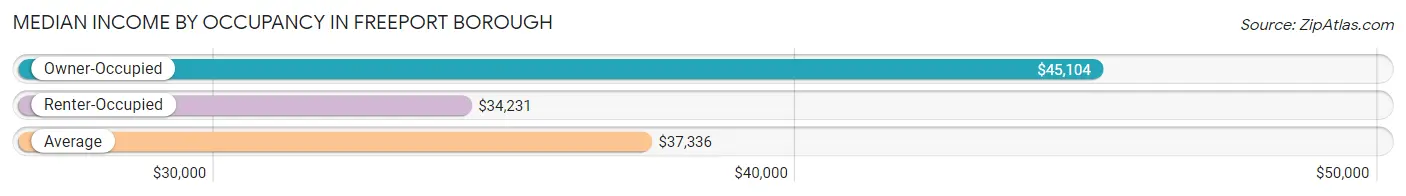
| Occupancy Type | # Households | Median Income |
| Owner-Occupied | 413 (49.9%) | $45,104 |
| Renter-Occupied | 414 (50.1%) | $34,231 |
| Average | 827 (100.0%) | $37,336 |
Occupancy by Householder Income Bracket in Freeport borough
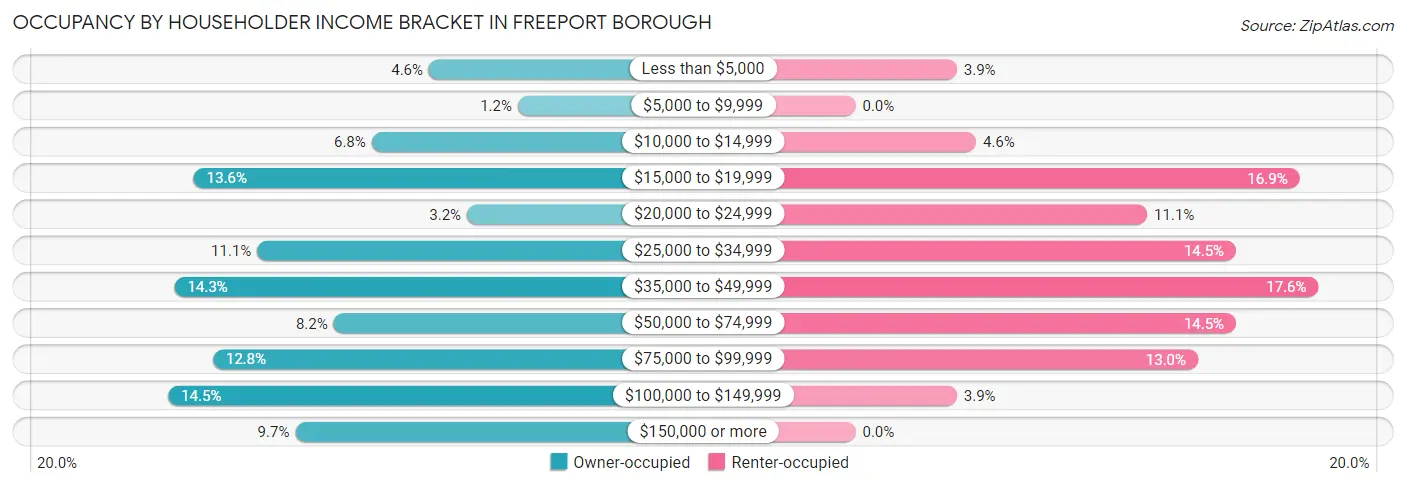
| Income Bracket | Owner-occupied | Renter-occupied |
| Less than $5,000 | 19 (4.6%) | 16 (3.9%) |
| $5,000 to $9,999 | 5 (1.2%) | 0 (0.0%) |
| $10,000 to $14,999 | 28 (6.8%) | 19 (4.6%) |
| $15,000 to $19,999 | 56 (13.6%) | 70 (16.9%) |
| $20,000 to $24,999 | 13 (3.2%) | 46 (11.1%) |
| $25,000 to $34,999 | 46 (11.1%) | 60 (14.5%) |
| $35,000 to $49,999 | 59 (14.3%) | 73 (17.6%) |
| $50,000 to $74,999 | 34 (8.2%) | 60 (14.5%) |
| $75,000 to $99,999 | 53 (12.8%) | 54 (13.0%) |
| $100,000 to $149,999 | 60 (14.5%) | 16 (3.9%) |
| $150,000 or more | 40 (9.7%) | 0 (0.0%) |
| Total | 413 (100.0%) | 414 (100.0%) |
Monthly Housing Cost Tiers in Freeport borough
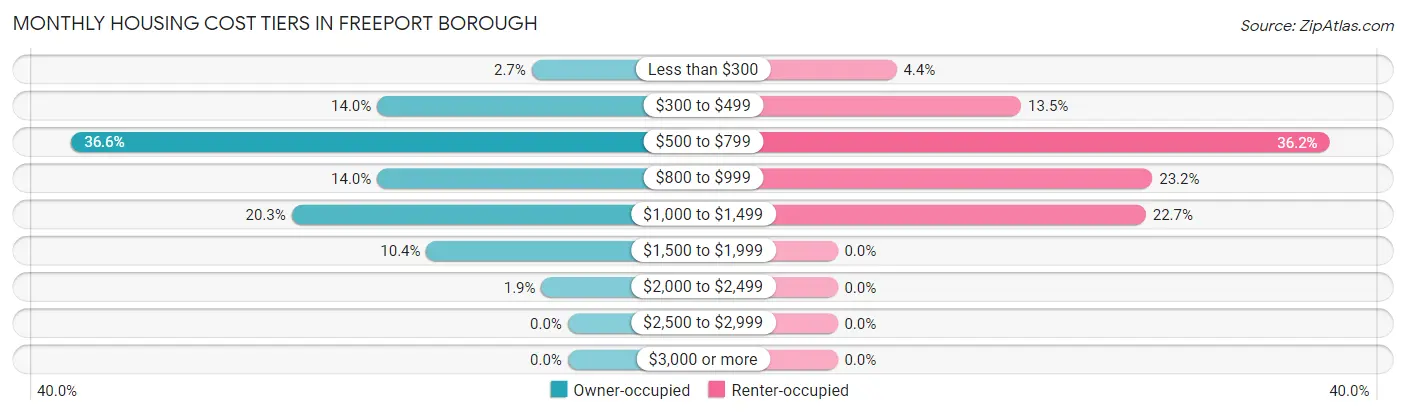
| Monthly Cost | Owner-occupied | Renter-occupied |
| Less than $300 | 11 (2.7%) | 18 (4.3%) |
| $300 to $499 | 58 (14.0%) | 56 (13.5%) |
| $500 to $799 | 151 (36.6%) | 150 (36.2%) |
| $800 to $999 | 58 (14.0%) | 96 (23.2%) |
| $1,000 to $1,499 | 84 (20.3%) | 94 (22.7%) |
| $1,500 to $1,999 | 43 (10.4%) | 0 (0.0%) |
| $2,000 to $2,499 | 8 (1.9%) | 0 (0.0%) |
| $2,500 to $2,999 | 0 (0.0%) | 0 (0.0%) |
| $3,000 or more | 0 (0.0%) | 0 (0.0%) |
| Total | 413 (100.0%) | 414 (100.0%) |
Physical Housing Characteristics in Freeport borough
Housing Structures in Freeport borough
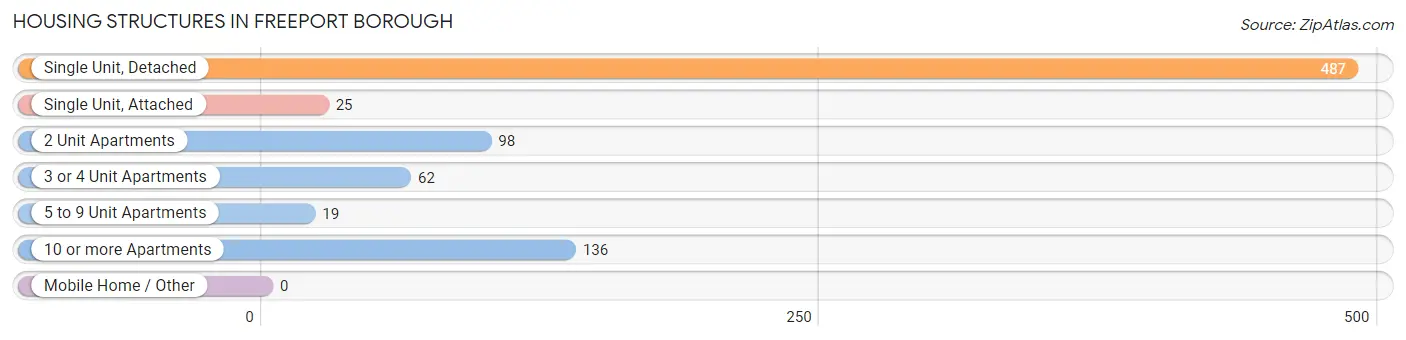
| Structure Type | # Housing Units | % Housing Units |
| Single Unit, Detached | 487 | 58.9% |
| Single Unit, Attached | 25 | 3.0% |
| 2 Unit Apartments | 98 | 11.8% |
| 3 or 4 Unit Apartments | 62 | 7.5% |
| 5 to 9 Unit Apartments | 19 | 2.3% |
| 10 or more Apartments | 136 | 16.4% |
| Mobile Home / Other | 0 | 0.0% |
| Total | 827 | 100.0% |
Housing Structures by Occupancy in Freeport borough
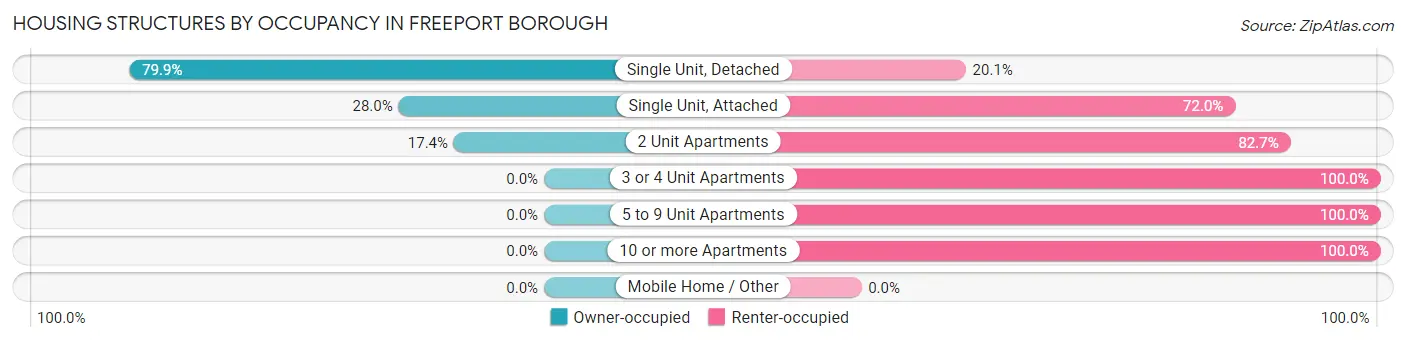
| Structure Type | Owner-occupied | Renter-occupied |
| Single Unit, Detached | 389 (79.9%) | 98 (20.1%) |
| Single Unit, Attached | 7 (28.0%) | 18 (72.0%) |
| 2 Unit Apartments | 17 (17.3%) | 81 (82.7%) |
| 3 or 4 Unit Apartments | 0 (0.0%) | 62 (100.0%) |
| 5 to 9 Unit Apartments | 0 (0.0%) | 19 (100.0%) |
| 10 or more Apartments | 0 (0.0%) | 136 (100.0%) |
| Mobile Home / Other | 0 (0.0%) | 0 (0.0%) |
| Total | 413 (49.9%) | 414 (50.1%) |
Housing Structures by Number of Rooms in Freeport borough
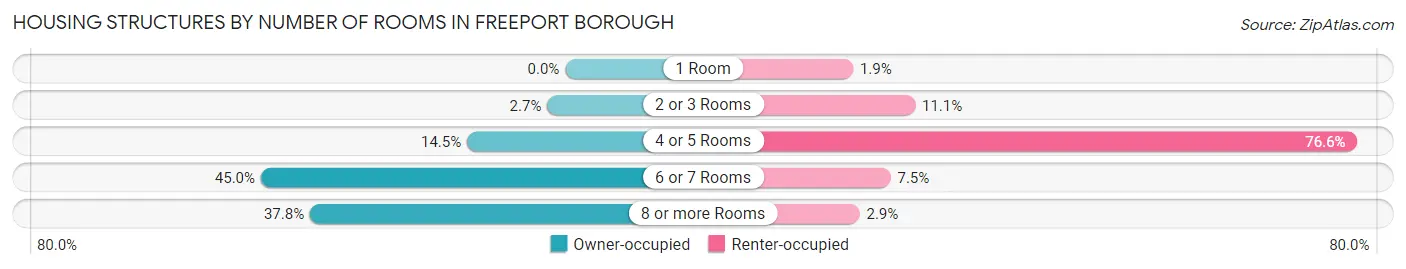
| Number of Rooms | Owner-occupied | Renter-occupied |
| 1 Room | 0 (0.0%) | 8 (1.9%) |
| 2 or 3 Rooms | 11 (2.7%) | 46 (11.1%) |
| 4 or 5 Rooms | 60 (14.5%) | 317 (76.6%) |
| 6 or 7 Rooms | 186 (45.0%) | 31 (7.5%) |
| 8 or more Rooms | 156 (37.8%) | 12 (2.9%) |
| Total | 413 (100.0%) | 414 (100.0%) |
Housing Structure by Heating Type in Freeport borough
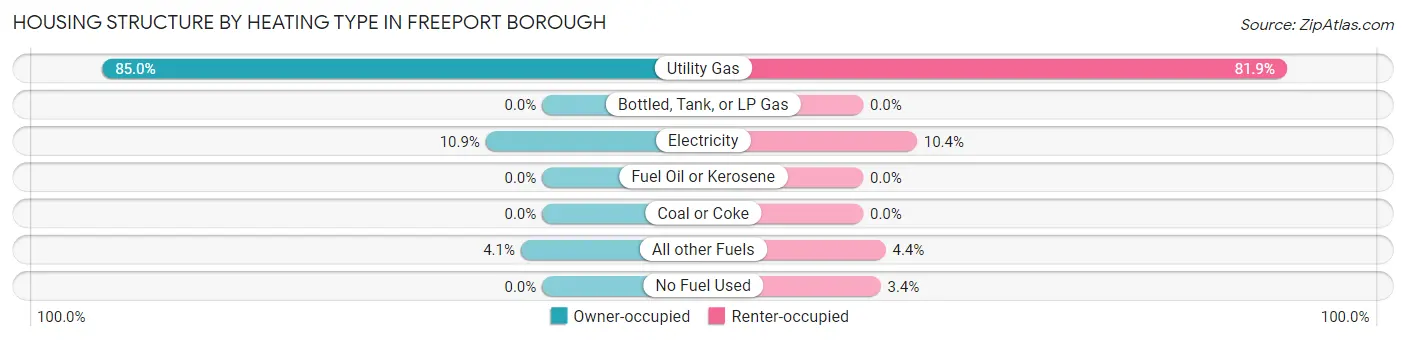
| Heating Type | Owner-occupied | Renter-occupied |
| Utility Gas | 351 (85.0%) | 339 (81.9%) |
| Bottled, Tank, or LP Gas | 0 (0.0%) | 0 (0.0%) |
| Electricity | 45 (10.9%) | 43 (10.4%) |
| Fuel Oil or Kerosene | 0 (0.0%) | 0 (0.0%) |
| Coal or Coke | 0 (0.0%) | 0 (0.0%) |
| All other Fuels | 17 (4.1%) | 18 (4.3%) |
| No Fuel Used | 0 (0.0%) | 14 (3.4%) |
| Total | 413 (100.0%) | 414 (100.0%) |
Household Vehicle Usage in Freeport borough
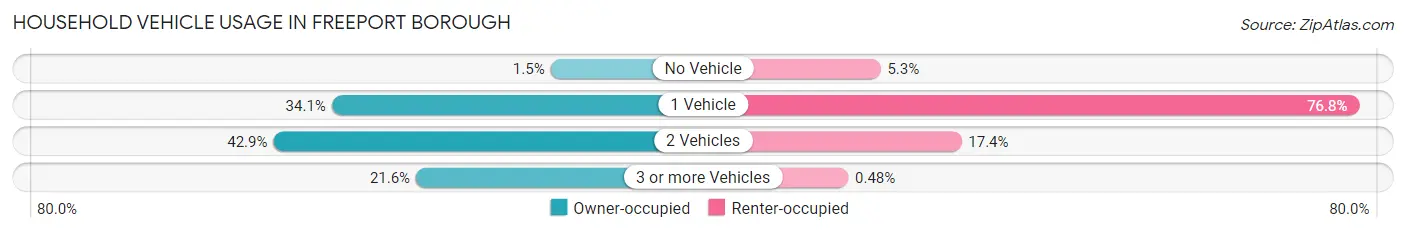
| Vehicles per Household | Owner-occupied | Renter-occupied |
| No Vehicle | 6 (1.5%) | 22 (5.3%) |
| 1 Vehicle | 141 (34.1%) | 318 (76.8%) |
| 2 Vehicles | 177 (42.9%) | 72 (17.4%) |
| 3 or more Vehicles | 89 (21.5%) | 2 (0.5%) |
| Total | 413 (100.0%) | 414 (100.0%) |
Real Estate & Mortgages in Freeport borough
Real Estate and Mortgage Overview in Freeport borough
| Characteristic | Without Mortgage | With Mortgage |
| Housing Units | 198 | 215 |
| Median Property Value | $85,400 | $130,900 |
| Median Household Income | $26,591 | $32 |
| Monthly Housing Costs | $597 | $0 |
| Real Estate Taxes | $2,289 | $0 |
Property Value by Mortgage Status in Freeport borough
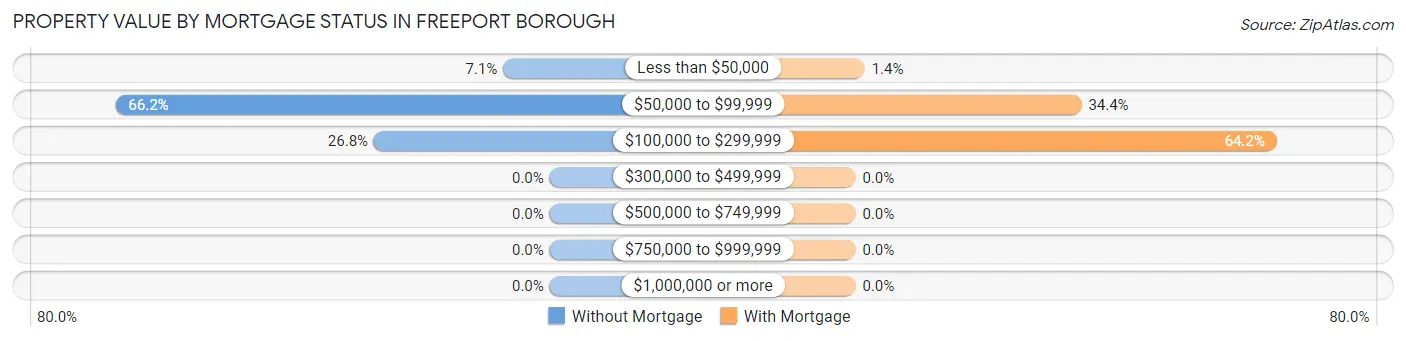
| Property Value | Without Mortgage | With Mortgage |
| Less than $50,000 | 14 (7.1%) | 3 (1.4%) |
| $50,000 to $99,999 | 131 (66.2%) | 74 (34.4%) |
| $100,000 to $299,999 | 53 (26.8%) | 138 (64.2%) |
| $300,000 to $499,999 | 0 (0.0%) | 0 (0.0%) |
| $500,000 to $749,999 | 0 (0.0%) | 0 (0.0%) |
| $750,000 to $999,999 | 0 (0.0%) | 0 (0.0%) |
| $1,000,000 or more | 0 (0.0%) | 0 (0.0%) |
| Total | 198 (100.0%) | 215 (100.0%) |
Household Income by Mortgage Status in Freeport borough
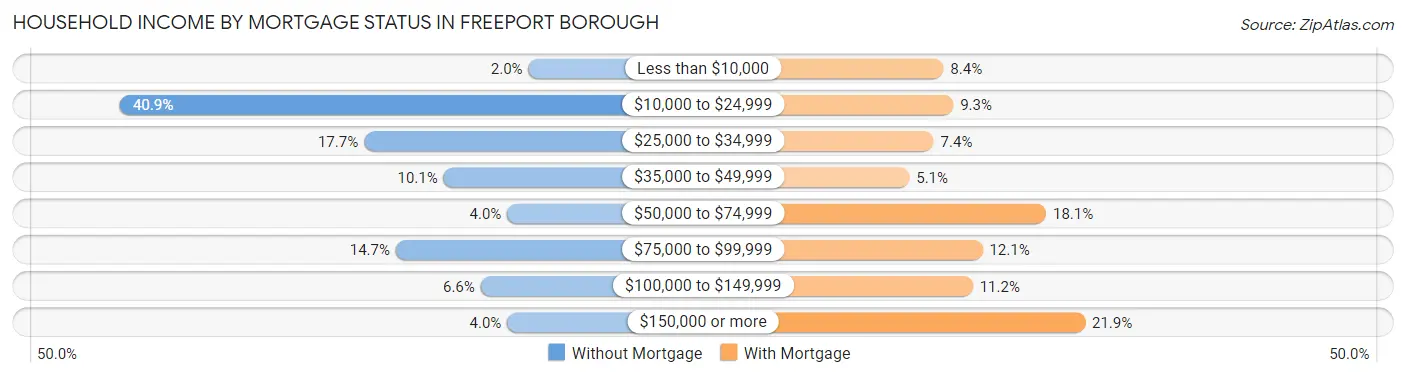
| Household Income | Without Mortgage | With Mortgage |
| Less than $10,000 | 4 (2.0%) | 18 (8.4%) |
| $10,000 to $24,999 | 81 (40.9%) | 20 (9.3%) |
| $25,000 to $34,999 | 35 (17.7%) | 16 (7.4%) |
| $35,000 to $49,999 | 20 (10.1%) | 11 (5.1%) |
| $50,000 to $74,999 | 8 (4.0%) | 39 (18.1%) |
| $75,000 to $99,999 | 29 (14.6%) | 26 (12.1%) |
| $100,000 to $149,999 | 13 (6.6%) | 24 (11.2%) |
| $150,000 or more | 8 (4.0%) | 47 (21.9%) |
| Total | 198 (100.0%) | 215 (100.0%) |
Property Value to Household Income Ratio in Freeport borough
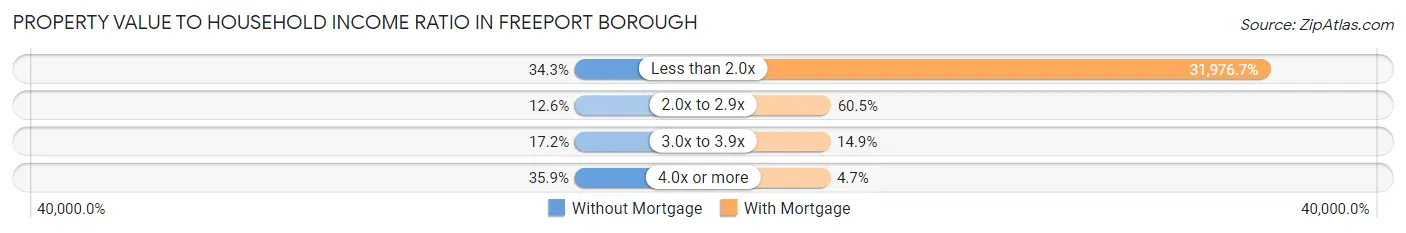
| Value-to-Income Ratio | Without Mortgage | With Mortgage |
| Less than 2.0x | 68 (34.3%) | 68,750 (31,976.7%) |
| 2.0x to 2.9x | 25 (12.6%) | 130 (60.5%) |
| 3.0x to 3.9x | 34 (17.2%) | 32 (14.9%) |
| 4.0x or more | 71 (35.9%) | 10 (4.6%) |
| Total | 198 (100.0%) | 215 (100.0%) |
Real Estate Taxes by Mortgage Status in Freeport borough
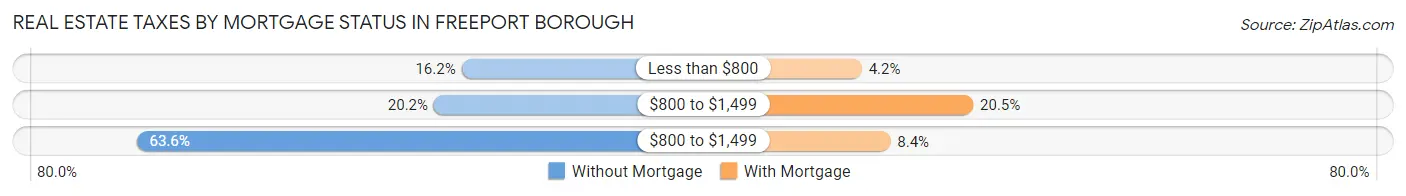
| Property Taxes | Without Mortgage | With Mortgage |
| Less than $800 | 32 (16.2%) | 9 (4.2%) |
| $800 to $1,499 | 40 (20.2%) | 44 (20.5%) |
| $800 to $1,499 | 126 (63.6%) | 18 (8.4%) |
| Total | 198 (100.0%) | 215 (100.0%) |
Health & Disability in Freeport borough
Health Insurance Coverage by Age in Freeport borough
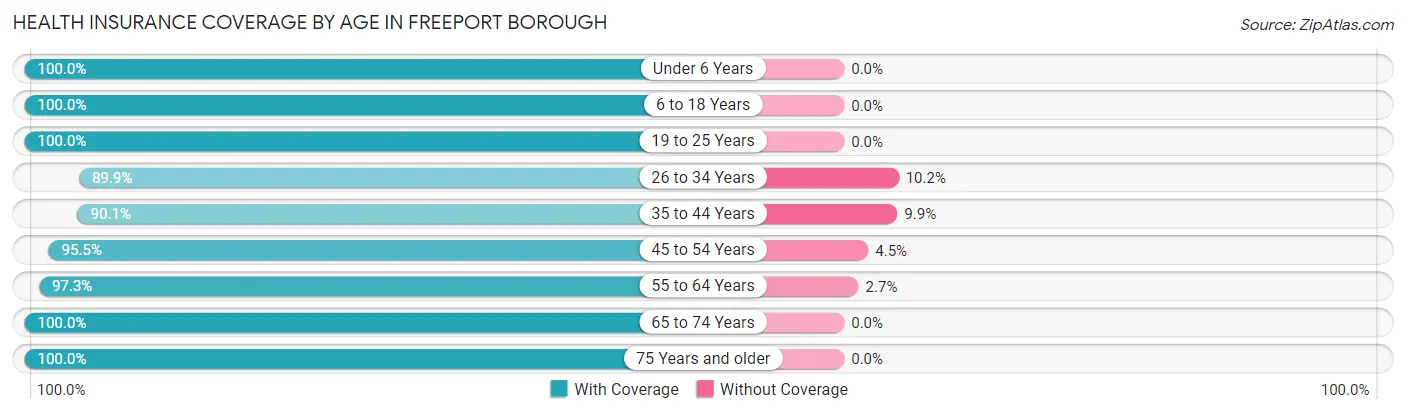
| Age Bracket | With Coverage | Without Coverage |
| Under 6 Years | 112 (100.0%) | 0 (0.0%) |
| 6 to 18 Years | 374 (100.0%) | 0 (0.0%) |
| 19 to 25 Years | 54 (100.0%) | 0 (0.0%) |
| 26 to 34 Years | 177 (89.8%) | 20 (10.2%) |
| 35 to 44 Years | 273 (90.1%) | 30 (9.9%) |
| 45 to 54 Years | 192 (95.5%) | 9 (4.5%) |
| 55 to 64 Years | 218 (97.3%) | 6 (2.7%) |
| 65 to 74 Years | 200 (100.0%) | 0 (0.0%) |
| 75 Years and older | 60 (100.0%) | 0 (0.0%) |
| Total | 1,660 (96.2%) | 65 (3.8%) |
Health Insurance Coverage by Citizenship Status in Freeport borough
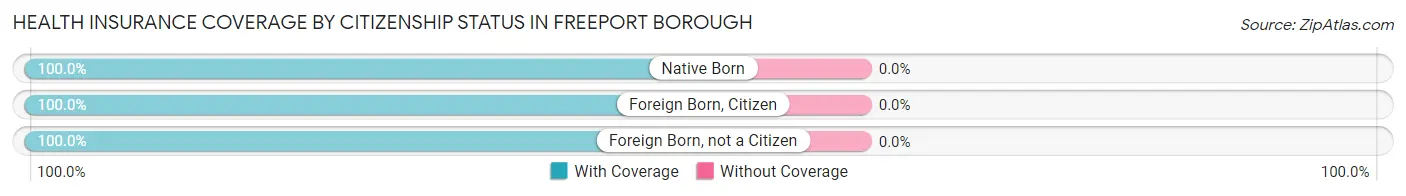
| Citizenship Status | With Coverage | Without Coverage |
| Native Born | 112 (100.0%) | 0 (0.0%) |
| Foreign Born, Citizen | 374 (100.0%) | 0 (0.0%) |
| Foreign Born, not a Citizen | 54 (100.0%) | 0 (0.0%) |
Health Insurance Coverage by Household Income in Freeport borough
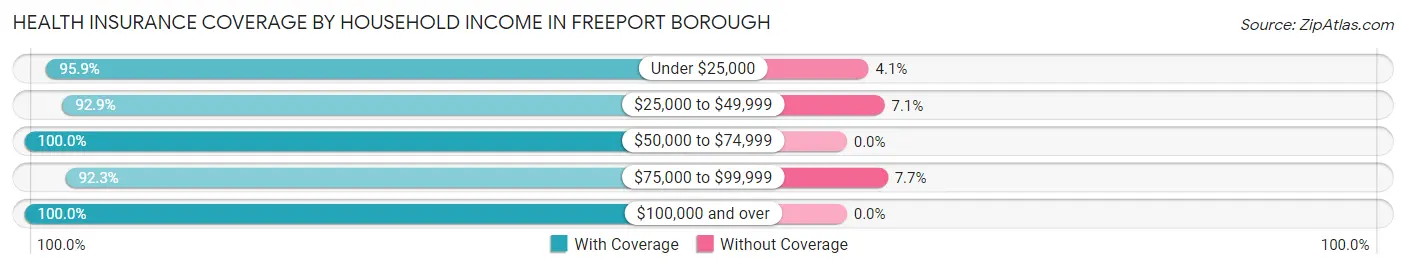
| Household Income | With Coverage | Without Coverage |
| Under $25,000 | 469 (95.9%) | 20 (4.1%) |
| $25,000 to $49,999 | 381 (92.9%) | 29 (7.1%) |
| $50,000 to $74,999 | 249 (100.0%) | 0 (0.0%) |
| $75,000 to $99,999 | 193 (92.3%) | 16 (7.7%) |
| $100,000 and over | 368 (100.0%) | 0 (0.0%) |
Public vs Private Health Insurance Coverage by Age in Freeport borough
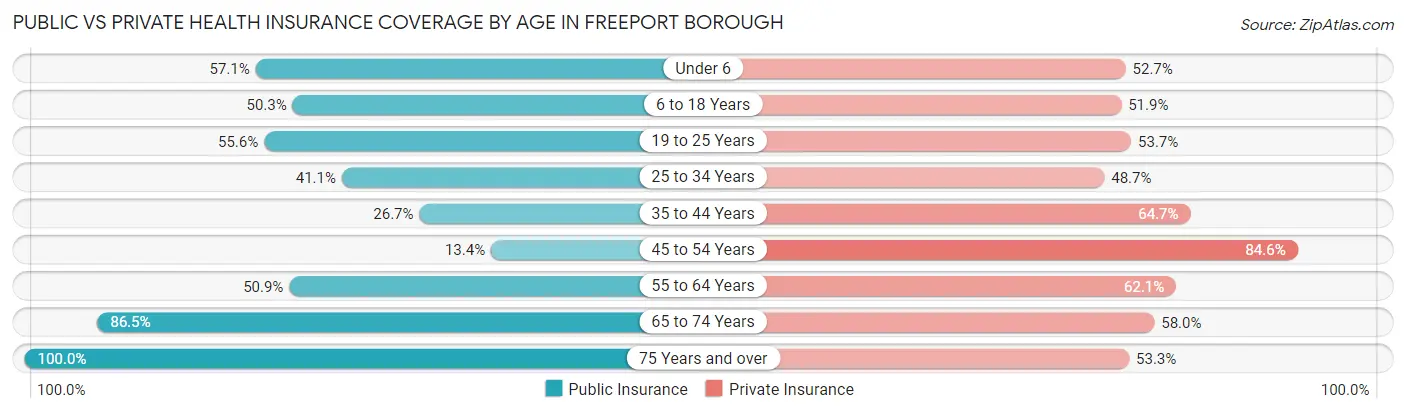
| Age Bracket | Public Insurance | Private Insurance |
| Under 6 | 64 (57.1%) | 59 (52.7%) |
| 6 to 18 Years | 188 (50.3%) | 194 (51.9%) |
| 19 to 25 Years | 30 (55.6%) | 29 (53.7%) |
| 25 to 34 Years | 81 (41.1%) | 96 (48.7%) |
| 35 to 44 Years | 81 (26.7%) | 196 (64.7%) |
| 45 to 54 Years | 27 (13.4%) | 170 (84.6%) |
| 55 to 64 Years | 114 (50.9%) | 139 (62.1%) |
| 65 to 74 Years | 173 (86.5%) | 116 (58.0%) |
| 75 Years and over | 60 (100.0%) | 32 (53.3%) |
| Total | 818 (47.4%) | 1,031 (59.8%) |
Disability Status by Sex by Age in Freeport borough
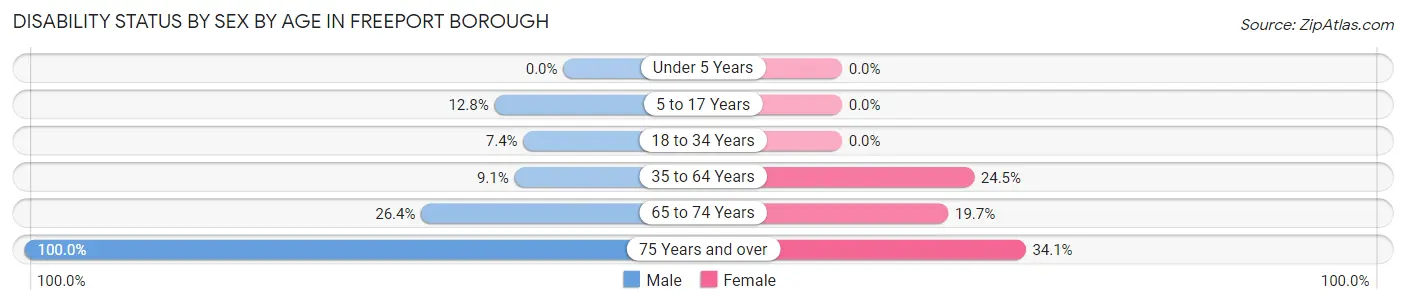
| Age Bracket | Male | Female |
| Under 5 Years | 0 (0.0%) | 0 (0.0%) |
| 5 to 17 Years | 23 (12.8%) | 0 (0.0%) |
| 18 to 34 Years | 8 (7.4%) | 0 (0.0%) |
| 35 to 64 Years | 29 (9.1%) | 100 (24.5%) |
| 65 to 74 Years | 34 (26.4%) | 14 (19.7%) |
| 75 Years and over | 16 (100.0%) | 15 (34.1%) |
Disability Class by Sex by Age in Freeport borough
Disability Class: Hearing Difficulty
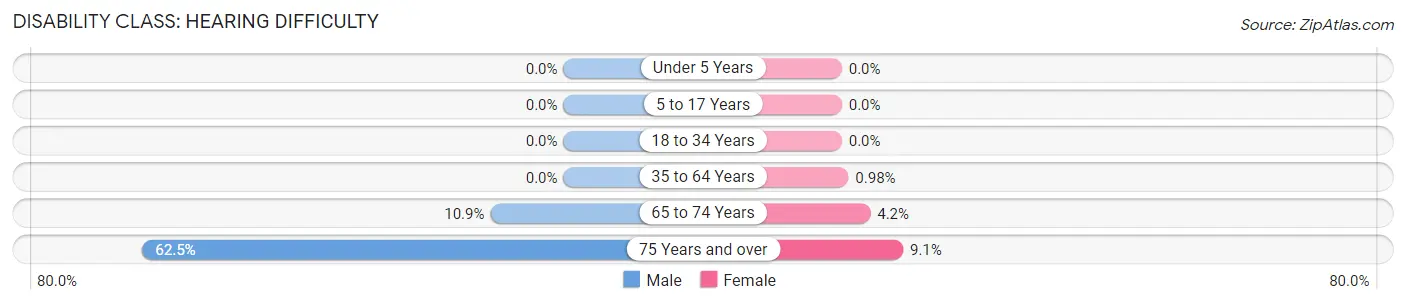
| Age Bracket | Male | Female |
| Under 5 Years | 0 (0.0%) | 0 (0.0%) |
| 5 to 17 Years | 0 (0.0%) | 0 (0.0%) |
| 18 to 34 Years | 0 (0.0%) | 0 (0.0%) |
| 35 to 64 Years | 0 (0.0%) | 4 (1.0%) |
| 65 to 74 Years | 14 (10.8%) | 3 (4.2%) |
| 75 Years and over | 10 (62.5%) | 4 (9.1%) |
Disability Class: Vision Difficulty
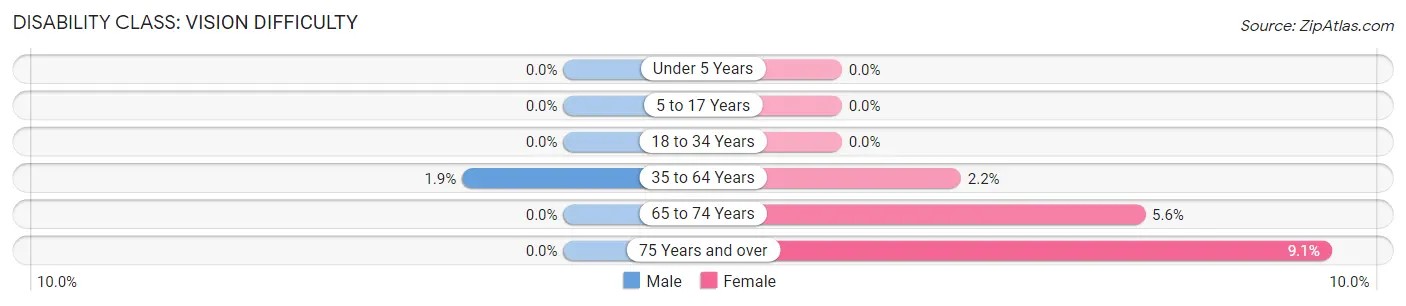
| Age Bracket | Male | Female |
| Under 5 Years | 0 (0.0%) | 0 (0.0%) |
| 5 to 17 Years | 0 (0.0%) | 0 (0.0%) |
| 18 to 34 Years | 0 (0.0%) | 0 (0.0%) |
| 35 to 64 Years | 6 (1.9%) | 9 (2.2%) |
| 65 to 74 Years | 0 (0.0%) | 4 (5.6%) |
| 75 Years and over | 0 (0.0%) | 4 (9.1%) |
Disability Class: Cognitive Difficulty
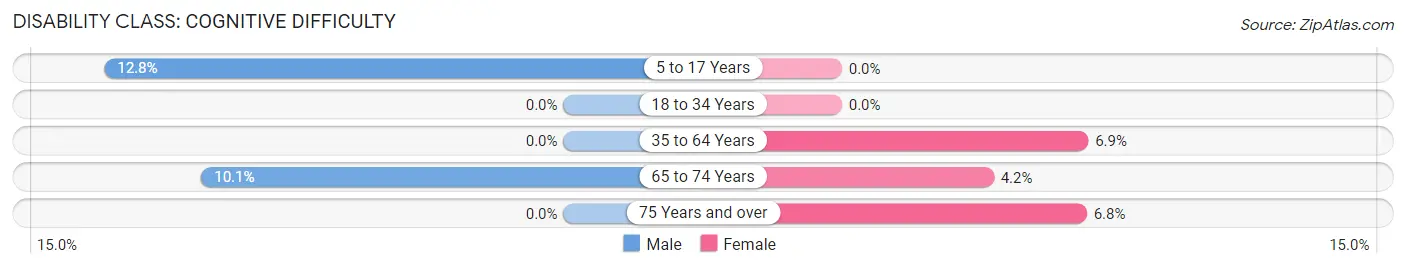
| Age Bracket | Male | Female |
| 5 to 17 Years | 23 (12.8%) | 0 (0.0%) |
| 18 to 34 Years | 0 (0.0%) | 0 (0.0%) |
| 35 to 64 Years | 0 (0.0%) | 28 (6.9%) |
| 65 to 74 Years | 13 (10.1%) | 3 (4.2%) |
| 75 Years and over | 0 (0.0%) | 3 (6.8%) |
Disability Class: Ambulatory Difficulty
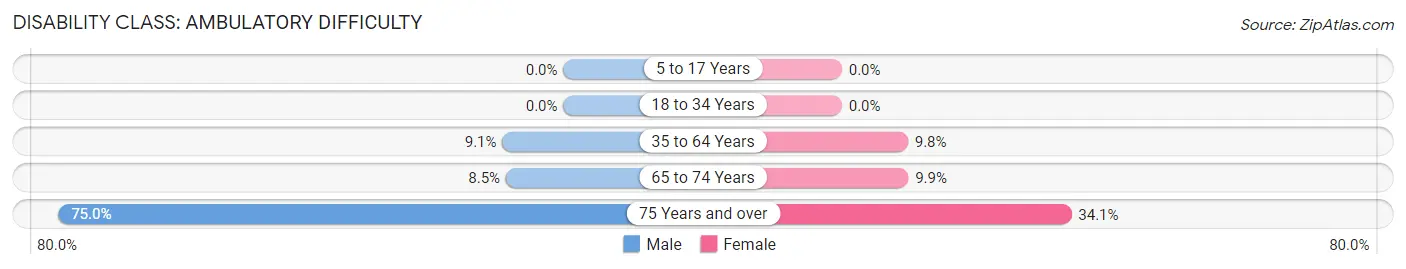
| Age Bracket | Male | Female |
| 5 to 17 Years | 0 (0.0%) | 0 (0.0%) |
| 18 to 34 Years | 0 (0.0%) | 0 (0.0%) |
| 35 to 64 Years | 29 (9.1%) | 40 (9.8%) |
| 65 to 74 Years | 11 (8.5%) | 7 (9.9%) |
| 75 Years and over | 12 (75.0%) | 15 (34.1%) |
Disability Class: Self-Care Difficulty
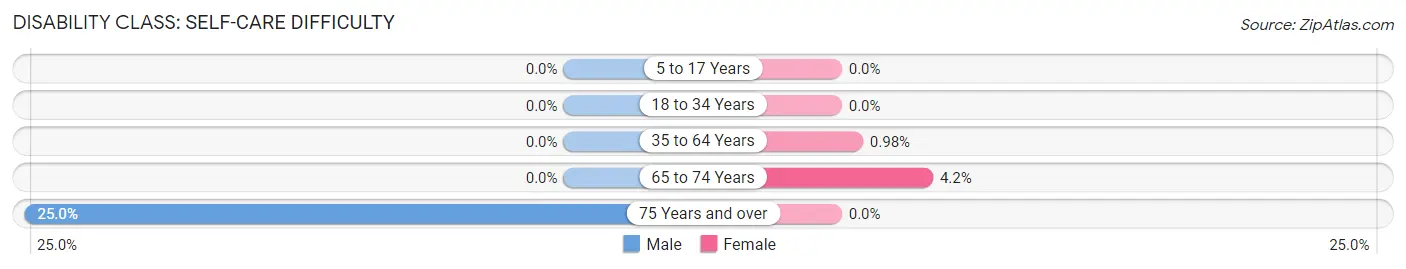
| Age Bracket | Male | Female |
| 5 to 17 Years | 0 (0.0%) | 0 (0.0%) |
| 18 to 34 Years | 0 (0.0%) | 0 (0.0%) |
| 35 to 64 Years | 0 (0.0%) | 4 (1.0%) |
| 65 to 74 Years | 0 (0.0%) | 3 (4.2%) |
| 75 Years and over | 4 (25.0%) | 0 (0.0%) |
Technology Access in Freeport borough
Computing Device Access in Freeport borough
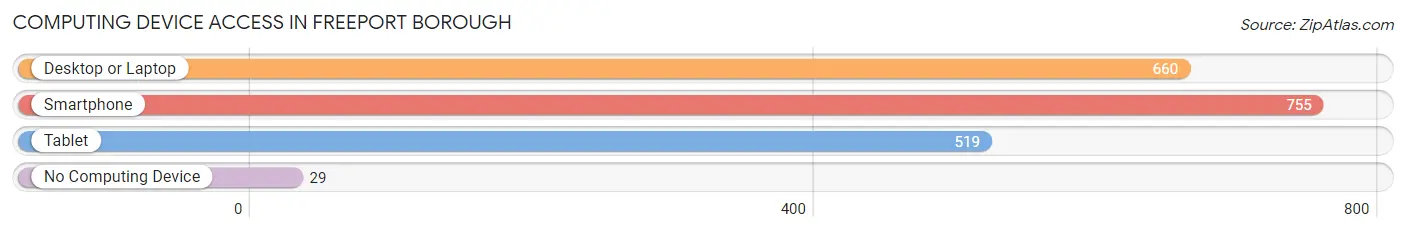
| Device Type | # Households | % Households |
| Desktop or Laptop | 660 | 79.8% |
| Smartphone | 755 | 91.3% |
| Tablet | 519 | 62.8% |
| No Computing Device | 29 | 3.5% |
| Total | 827 | 100.0% |
Internet Access in Freeport borough
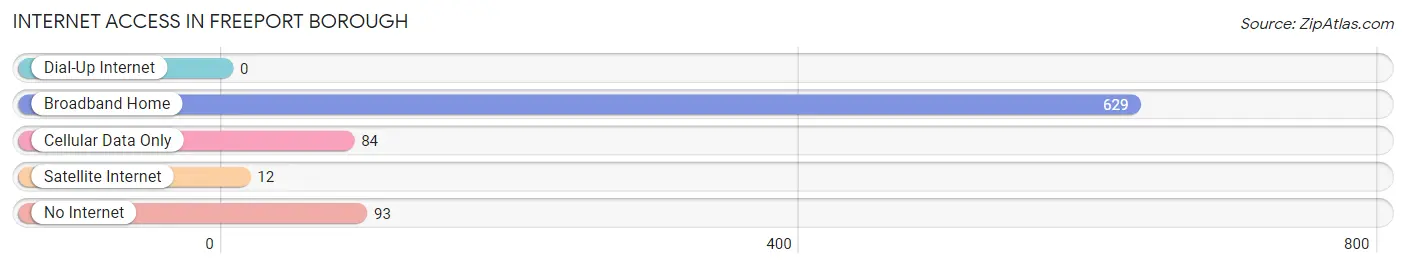
| Internet Type | # Households | % Households |
| Dial-Up Internet | 0 | 0.0% |
| Broadband Home | 629 | 76.1% |
| Cellular Data Only | 84 | 10.2% |
| Satellite Internet | 12 | 1.5% |
| No Internet | 93 | 11.3% |
| Total | 827 | 100.0% |
Freeport borough Summary
Freeport Borough is a small borough located in Armstrong County, Pennsylvania. It is situated in the Allegheny Plateau region of the state, and is part of the Pittsburgh Metropolitan Statistical Area. The borough has a population of 1,845 as of the 2010 census, and is the smallest borough in Armstrong County.
History
Freeport Borough was founded in 1832 by a group of settlers from Freeport, New York. The settlers were attracted to the area by the abundance of natural resources, including timber, coal, and iron ore. The borough was officially incorporated in 1845, and the first mayor was elected in 1846.
The borough was an important center of industry in the 19th century, with several factories and mills operating in the area. The most important of these was the Freeport Iron Works, which was established in 1848 and produced iron products for the railroad industry. The iron works closed in 1891, but the borough continued to be an important center of industry, with several other factories and mills operating in the area.
Geography
Freeport Borough is located in the Allegheny Plateau region of Pennsylvania. It is situated in the southwestern corner of Armstrong County, and is bordered by the boroughs of East Franklin, South Buffalo, and West Kittanning. The borough is located approximately 40 miles northeast of Pittsburgh.
The borough has a total area of 0.7 square miles, all of which is land. The terrain is mostly flat, with some rolling hills in the northern part of the borough. The borough is drained by the Allegheny River, which forms its western boundary.
Economy
Freeport Borough is a small, rural community with a limited economy. The borough is home to several small businesses, including a grocery store, a hardware store, and a few restaurants. The borough also has a few light industrial businesses, including a metal fabrication shop and a printing company.
The borough is also home to several small farms, which produce a variety of crops, including corn, soybeans, and hay. The borough is also home to several wineries, which produce a variety of wines.
Demographics
As of the 2010 census, Freeport Borough had a population of 1,845. The racial makeup of the borough was 97.3% White, 0.9% African American, 0.2% Native American, 0.2% Asian, 0.1% from other races, and 1.3% from two or more races. Hispanic or Latino of any race were 0.7% of the population.
The median household income in the borough was $37,917, and the median family income was $45,000. The per capita income in the borough was $18,945. About 11.3% of families and 14.2% of the population were below the poverty line, including 19.2% of those under age 18 and 8.3% of those age 65 or over.
Common Questions
What is Per Capita Income in Freeport borough?
Per Capita income in Freeport borough is $26,122.
What is the Median Family Income in Freeport borough?
Median Family Income in Freeport borough is $46,563.
What is the Median Household income in Freeport borough?
Median Household Income in Freeport borough is $37,336.
What is Income or Wage Gap in Freeport borough?
Income or Wage Gap in Freeport borough is 43.2%.
Women in Freeport borough earn 56.8 cents for every dollar earned by a man.
What is Inequality or Gini Index in Freeport borough?
Inequality or Gini Index in Freeport borough is 0.45.
What is the Total Population of Freeport borough?
Total Population of Freeport borough is 1,725.
What is the Total Male Population of Freeport borough?
Total Male Population of Freeport borough is 774.
What is the Total Female Population of Freeport borough?
Total Female Population of Freeport borough is 951.
What is the Ratio of Males per 100 Females in Freeport borough?
There are 81.39 Males per 100 Females in Freeport borough.
What is the Ratio of Females per 100 Males in Freeport borough?
There are 122.87 Females per 100 Males in Freeport borough.
What is the Median Population Age in Freeport borough?
Median Population Age in Freeport borough is 38.1 Years.
What is the Average Family Size in Freeport borough
Average Family Size in Freeport borough is 2.8 People.
What is the Average Household Size in Freeport borough
Average Household Size in Freeport borough is 2.1 People.
How Large is the Labor Force in Freeport borough?
There are 813 People in the Labor Forcein in Freeport borough.
What is the Percentage of People in the Labor Force in Freeport borough?
60.2% of People are in the Labor Force in Freeport borough.
What is the Unemployment Rate in Freeport borough?
Unemployment Rate in Freeport borough is 9.2%.