West Brownsville borough, PA Map & Demographics
West Brownsville borough Overview
$32,907
PER CAPITA INCOME
$86,339
AVG FAMILY INCOME
$67,109
AVG HOUSEHOLD INCOME
49.7%
WAGE / INCOME GAP [ % ]
50.3¢/ $1
WAGE / INCOME GAP [ $ ]
0.35
INEQUALITY / GINI INDEX
1,091
TOTAL POPULATION
460
MALE POPULATION
631
FEMALE POPULATION
72.90
MALES / 100 FEMALES
137.17
FEMALES / 100 MALES
44.2
MEDIAN AGE
2.8
AVG FAMILY SIZE
2.4
AVG HOUSEHOLD SIZE
593
LABOR FORCE [ PEOPLE ]
65.3%
PERCENT IN LABOR FORCE
5.1%
UNEMPLOYMENT RATE
Income in West Brownsville borough
Income Overview in West Brownsville borough
Per Capita Income in West Brownsville borough is $32,907, while median incomes of families and households are $86,339 and $67,109 respectively.
| Characteristic | Number | Measure |
| Per Capita Income | 1,091 | $32,907 |
| Median Family Income | 309 | $86,339 |
| Mean Family Income | 309 | $85,433 |
| Median Household Income | 453 | $67,109 |
| Mean Household Income | 453 | $79,827 |
| Income Deficit | 309 | $0 |
| Wage / Income Gap (%) | 1,091 | 49.67% |
| Wage / Income Gap ($) | 1,091 | 50.33¢ per $1 |
| Gini / Inequality Index | 1,091 | 0.35 |
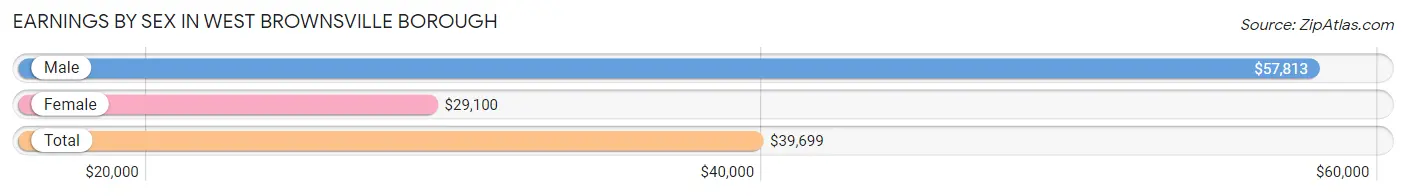
Earnings by Sex in West Brownsville borough
Average Earnings in West Brownsville borough are $39,699, $57,813 for men and $29,100 for women, a difference of 49.7%.
| Sex | Number | Average Earnings |
| Male | 305 (49.6%) | $57,813 |
| Female | 310 (50.4%) | $29,100 |
| Total | 615 (100.0%) | $39,699 |
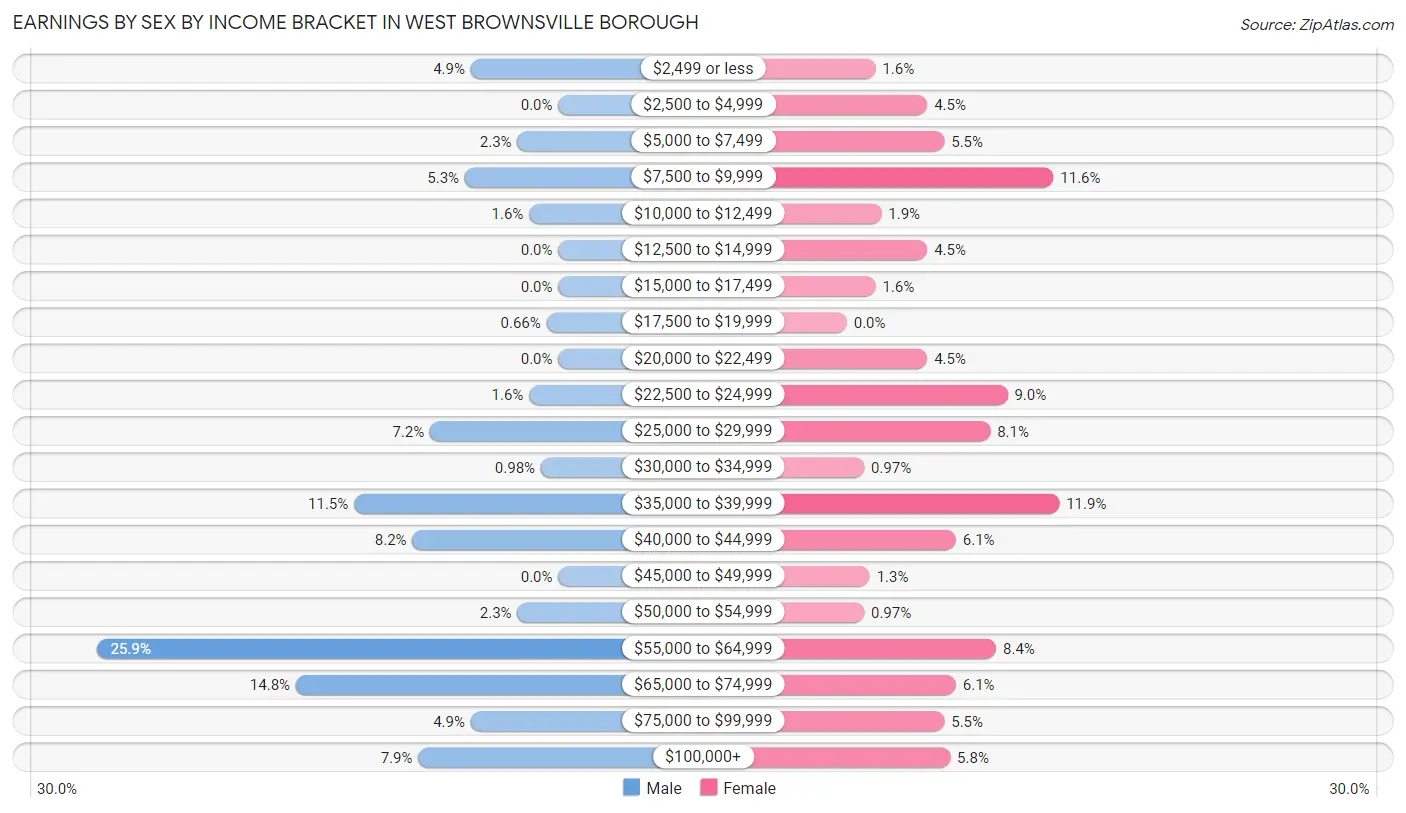
Earnings by Sex by Income Bracket in West Brownsville borough
The most common earnings brackets in West Brownsville borough are $55,000 to $64,999 for men (79 | 25.9%) and $35,000 to $39,999 for women (37 | 11.9%).
| Income | Male | Female |
| $2,499 or less | 15 (4.9%) | 5 (1.6%) |
| $2,500 to $4,999 | 0 (0.0%) | 14 (4.5%) |
| $5,000 to $7,499 | 7 (2.3%) | 17 (5.5%) |
| $7,500 to $9,999 | 16 (5.2%) | 36 (11.6%) |
| $10,000 to $12,499 | 5 (1.6%) | 6 (1.9%) |
| $12,500 to $14,999 | 0 (0.0%) | 14 (4.5%) |
| $15,000 to $17,499 | 0 (0.0%) | 5 (1.6%) |
| $17,500 to $19,999 | 2 (0.7%) | 0 (0.0%) |
| $20,000 to $22,499 | 0 (0.0%) | 14 (4.5%) |
| $22,500 to $24,999 | 5 (1.6%) | 28 (9.0%) |
| $25,000 to $29,999 | 22 (7.2%) | 25 (8.1%) |
| $30,000 to $34,999 | 3 (1.0%) | 3 (1.0%) |
| $35,000 to $39,999 | 35 (11.5%) | 37 (11.9%) |
| $40,000 to $44,999 | 25 (8.2%) | 19 (6.1%) |
| $45,000 to $49,999 | 0 (0.0%) | 4 (1.3%) |
| $50,000 to $54,999 | 7 (2.3%) | 3 (1.0%) |
| $55,000 to $64,999 | 79 (25.9%) | 26 (8.4%) |
| $65,000 to $74,999 | 45 (14.7%) | 19 (6.1%) |
| $75,000 to $99,999 | 15 (4.9%) | 17 (5.5%) |
| $100,000+ | 24 (7.9%) | 18 (5.8%) |
| Total | 305 (100.0%) | 310 (100.0%) |
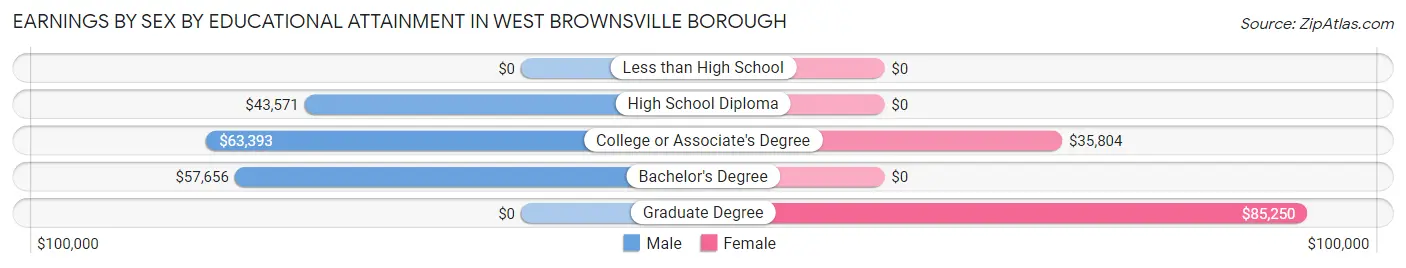
Earnings by Sex by Educational Attainment in West Brownsville borough
Average earnings in West Brownsville borough are $58,403 for men and $29,250 for women, a difference of 49.9%. Men with an educational attainment of college or associate's degree enjoy the highest average annual earnings of $63,393, while those with high school diploma education earn the least with $43,571. Women with an educational attainment of graduate degree earn the most with the average annual earnings of $85,250, while those with college or associate's degree education have the smallest earnings of $35,804.
| Educational Attainment | Male Income | Female Income |
| Less than High School | - | - |
| High School Diploma | $43,571 | $0 |
| College or Associate's Degree | $63,393 | $35,804 |
| Bachelor's Degree | $57,656 | $0 |
| Graduate Degree | - | - |
| Total | $58,403 | $29,250 |
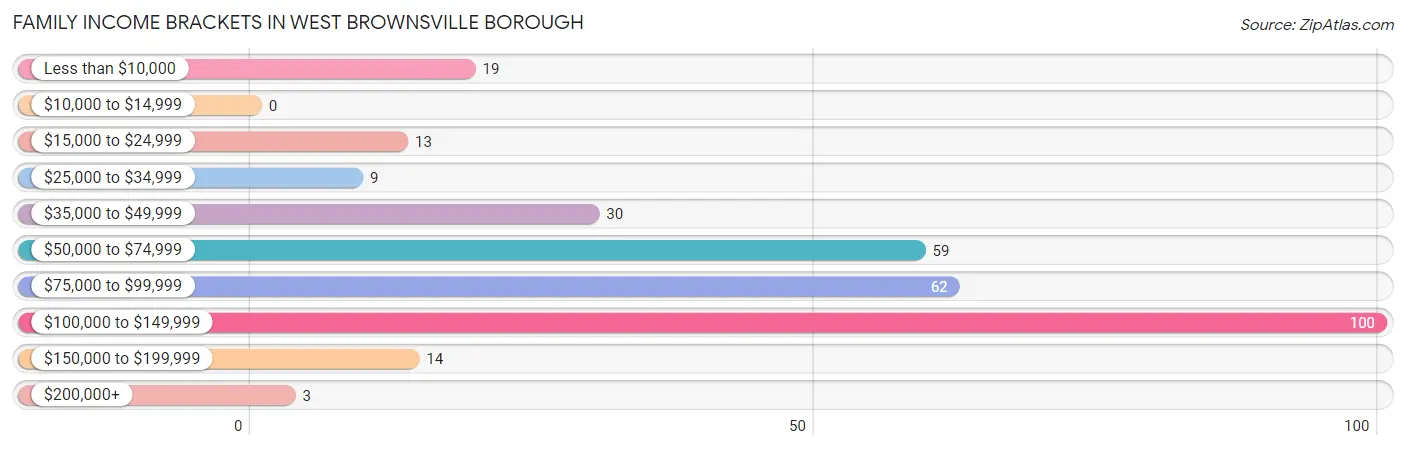
Family Income in West Brownsville borough
Family Income Brackets in West Brownsville borough
According to the West Brownsville borough family income data, there are 100 families falling into the $100,000 to $149,999 income range, which is the most common income bracket and makes up 32.4% of all families.
| Income Bracket | # Families | % Families |
| Less than $10,000 | 19 | 6.1% |
| $10,000 to $14,999 | 0 | 0.0% |
| $15,000 to $24,999 | 13 | 4.2% |
| $25,000 to $34,999 | 9 | 2.9% |
| $35,000 to $49,999 | 30 | 9.7% |
| $50,000 to $74,999 | 59 | 19.1% |
| $75,000 to $99,999 | 62 | 20.1% |
| $100,000 to $149,999 | 100 | 32.4% |
| $150,000 to $199,999 | 14 | 4.5% |
| $200,000+ | 3 | 1.0% |
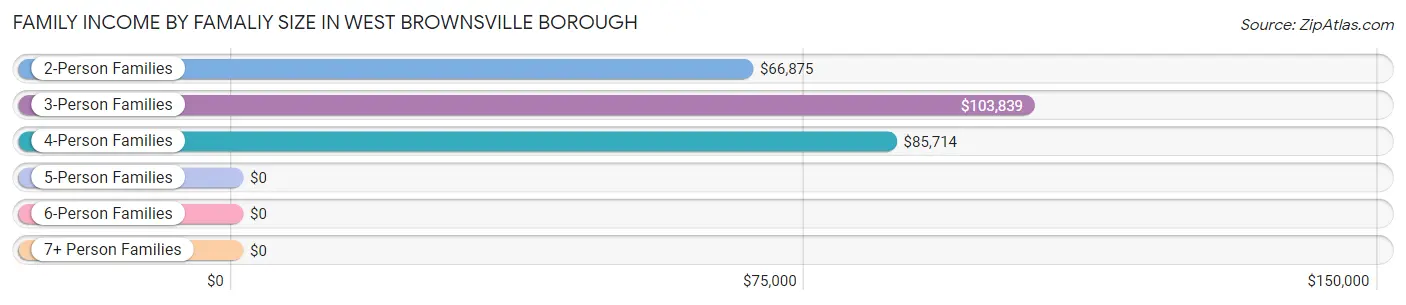
Family Income by Famaliy Size in West Brownsville borough
3-person families (89 | 28.8%) account for the highest median family income in West Brownsville borough with $103,839 per family, while 3-person families (89 | 28.8%) have the highest median income of $34,613 per family member.
| Income Bracket | # Families | Median Income |
| 2-Person Families | 150 (48.5%) | $66,875 |
| 3-Person Families | 89 (28.8%) | $103,839 |
| 4-Person Families | 58 (18.8%) | $85,714 |
| 5-Person Families | 8 (2.6%) | $0 |
| 6-Person Families | 4 (1.3%) | $0 |
| 7+ Person Families | 0 (0.0%) | $0 |
| Total | 309 (100.0%) | $86,339 |
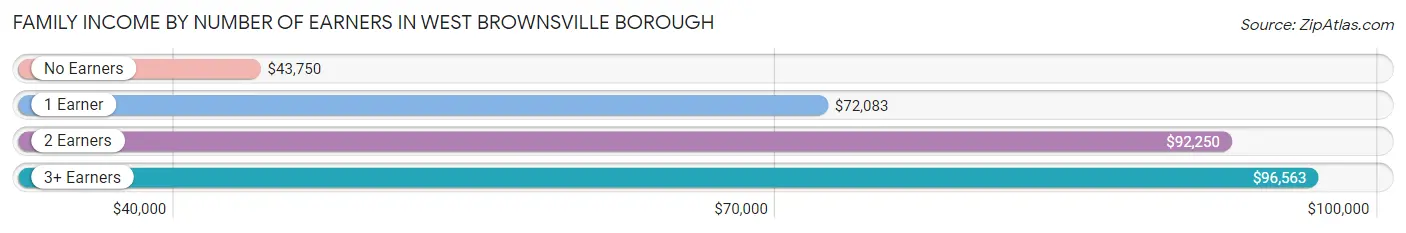
Family Income by Number of Earners in West Brownsville borough
The median family income in West Brownsville borough is $86,339, with families comprising 3+ earners (15) having the highest median family income of $96,563, while families with no earners (24) have the lowest median family income of $43,750, accounting for 4.9% and 7.8% of families, respectively.
| Number of Earners | # Families | Median Income |
| No Earners | 24 (7.8%) | $43,750 |
| 1 Earner | 129 (41.7%) | $72,083 |
| 2 Earners | 141 (45.6%) | $92,250 |
| 3+ Earners | 15 (4.9%) | $96,563 |
| Total | 309 (100.0%) | $86,339 |
Household Income in West Brownsville borough
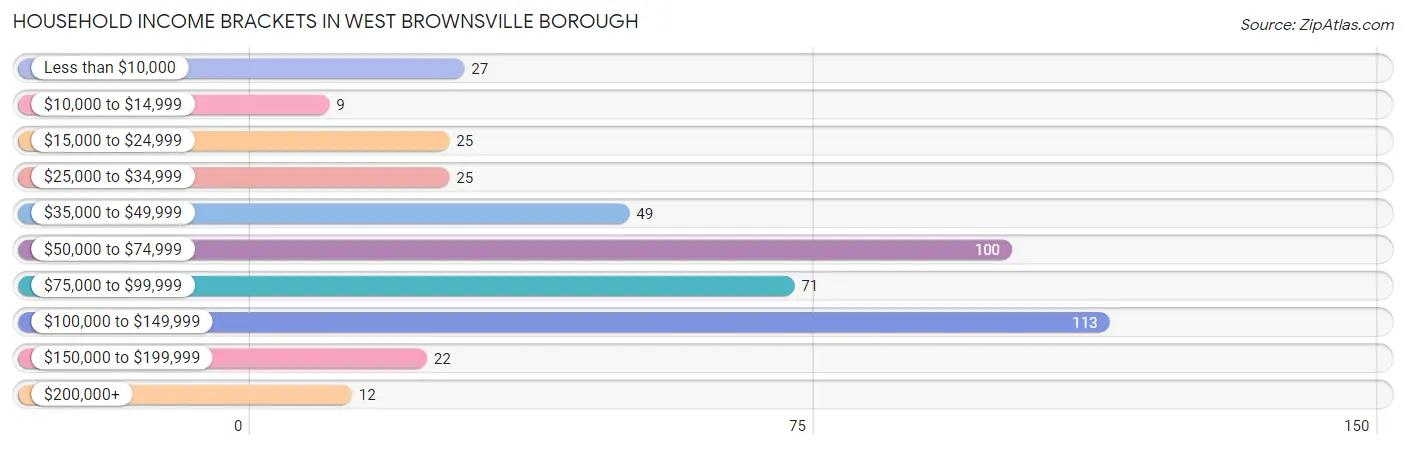
Household Income Brackets in West Brownsville borough
With 113 households falling in the category, the $100,000 to $149,999 income range is the most frequent in West Brownsville borough, accounting for 24.9% of all households. In contrast, only 9 households (2.0%) fall into the $10,000 to $14,999 income bracket, making it the least populous group.
| Income Bracket | # Households | % Households |
| Less than $10,000 | 27 | 6.0% |
| $10,000 to $14,999 | 9 | 2.0% |
| $15,000 to $24,999 | 25 | 5.5% |
| $25,000 to $34,999 | 25 | 5.5% |
| $35,000 to $49,999 | 49 | 10.8% |
| $50,000 to $74,999 | 100 | 22.1% |
| $75,000 to $99,999 | 71 | 15.7% |
| $100,000 to $149,999 | 113 | 24.9% |
| $150,000 to $199,999 | 22 | 4.9% |
| $200,000+ | 12 | 2.6% |
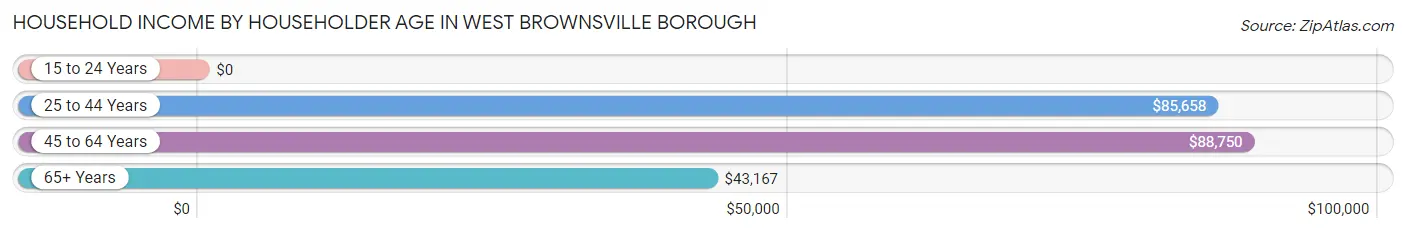
Household Income by Householder Age in West Brownsville borough
The median household income in West Brownsville borough is $67,109, with the highest median household income of $88,750 found in the 45 to 64 years age bracket for the primary householder. A total of 193 households (42.6%) fall into this category. Meanwhile, the 15 to 24 years age bracket for the primary householder has the lowest median household income of $0, with 8 households (1.8%) in this group.
| Income Bracket | # Households | Median Income |
| 15 to 24 Years | 8 (1.8%) | $0 |
| 25 to 44 Years | 126 (27.8%) | $85,658 |
| 45 to 64 Years | 193 (42.6%) | $88,750 |
| 65+ Years | 126 (27.8%) | $43,167 |
| Total | 453 (100.0%) | $67,109 |
Poverty in West Brownsville borough
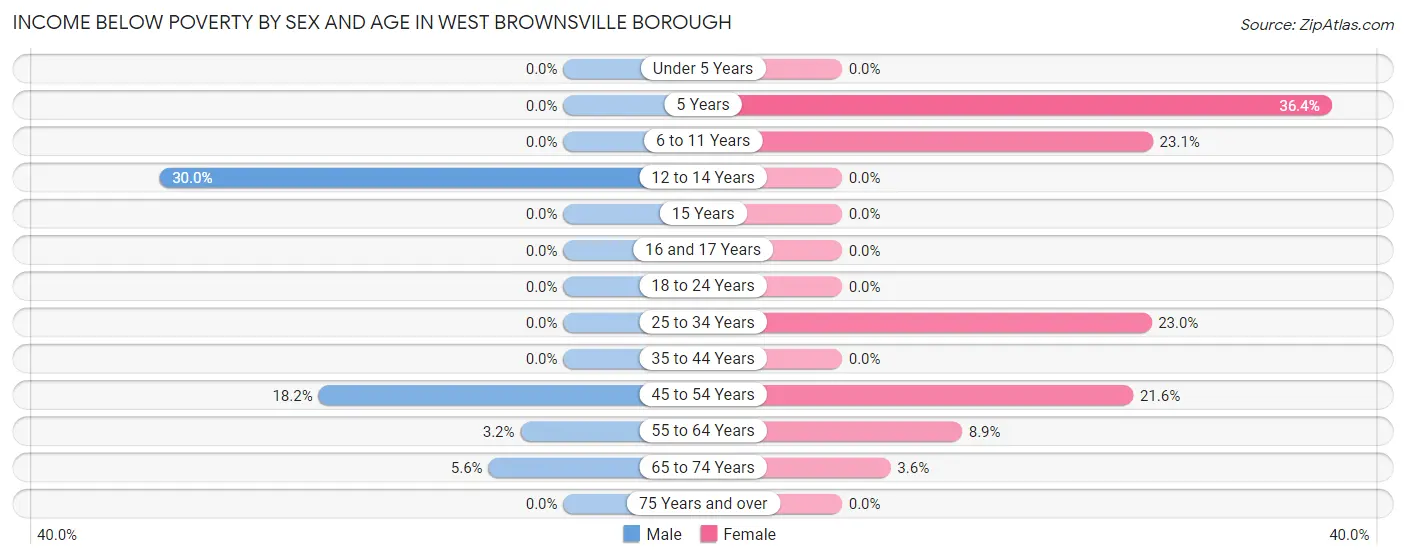
Income Below Poverty by Sex and Age in West Brownsville borough
With 4.8% poverty level for males and 9.7% for females among the residents of West Brownsville borough, 12 to 14 year old males and 5 year old females are the most vulnerable to poverty, with 6 males (30.0%) and 4 females (36.4%) in their respective age groups living below the poverty level.
| Age Bracket | Male | Female |
| Under 5 Years | 0 (0.0%) | 0 (0.0%) |
| 5 Years | 0 (0.0%) | 4 (36.4%) |
| 6 to 11 Years | 0 (0.0%) | 12 (23.1%) |
| 12 to 14 Years | 6 (30.0%) | 0 (0.0%) |
| 15 Years | 0 (0.0%) | 0 (0.0%) |
| 16 and 17 Years | 0 (0.0%) | 0 (0.0%) |
| 18 to 24 Years | 0 (0.0%) | 0 (0.0%) |
| 25 to 34 Years | 0 (0.0%) | 17 (23.0%) |
| 35 to 44 Years | 0 (0.0%) | 0 (0.0%) |
| 45 to 54 Years | 10 (18.2%) | 16 (21.6%) |
| 55 to 64 Years | 3 (3.2%) | 9 (8.9%) |
| 65 to 74 Years | 3 (5.6%) | 3 (3.6%) |
| 75 Years and over | 0 (0.0%) | 0 (0.0%) |
| Total | 22 (4.8%) | 61 (9.7%) |
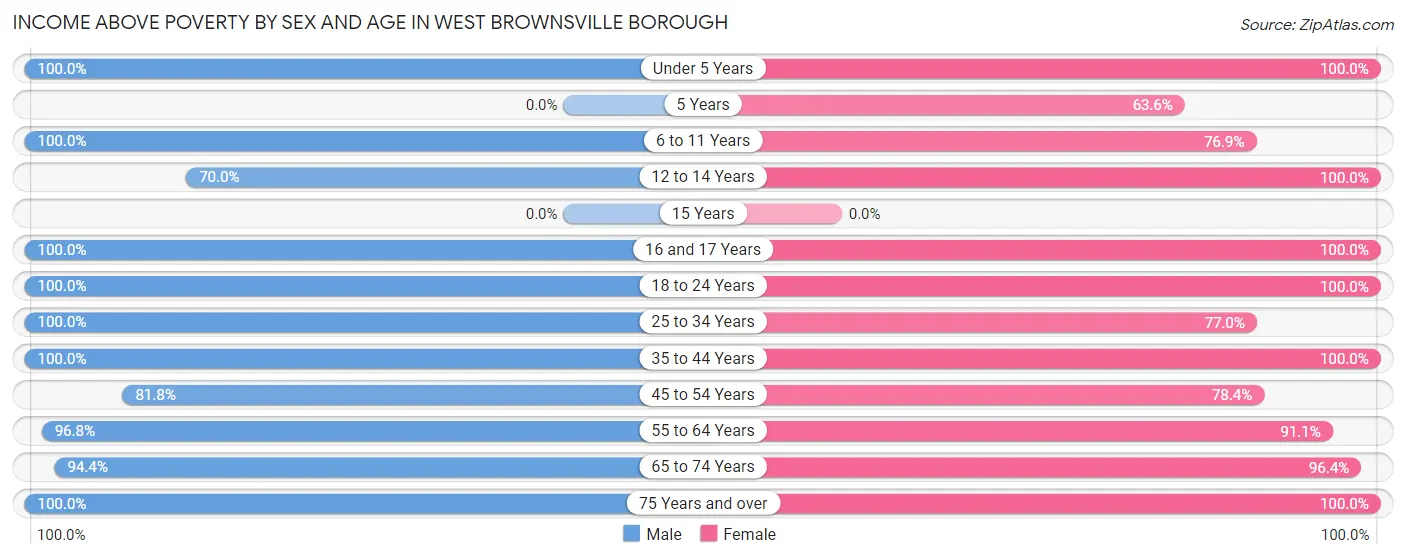
Income Above Poverty by Sex and Age in West Brownsville borough
According to the poverty statistics in West Brownsville borough, males aged under 5 years and females aged under 5 years are the age groups that are most secure financially, with 100.0% of males and 100.0% of females in these age groups living above the poverty line.
| Age Bracket | Male | Female |
| Under 5 Years | 16 (100.0%) | 15 (100.0%) |
| 5 Years | 0 (0.0%) | 7 (63.6%) |
| 6 to 11 Years | 27 (100.0%) | 40 (76.9%) |
| 12 to 14 Years | 14 (70.0%) | 37 (100.0%) |
| 15 Years | 0 (0.0%) | 0 (0.0%) |
| 16 and 17 Years | 8 (100.0%) | 24 (100.0%) |
| 18 to 24 Years | 17 (100.0%) | 28 (100.0%) |
| 25 to 34 Years | 38 (100.0%) | 57 (77.0%) |
| 35 to 44 Years | 111 (100.0%) | 87 (100.0%) |
| 45 to 54 Years | 45 (81.8%) | 58 (78.4%) |
| 55 to 64 Years | 91 (96.8%) | 92 (91.1%) |
| 65 to 74 Years | 51 (94.4%) | 80 (96.4%) |
| 75 Years and over | 20 (100.0%) | 40 (100.0%) |
| Total | 438 (95.2%) | 565 (90.3%) |
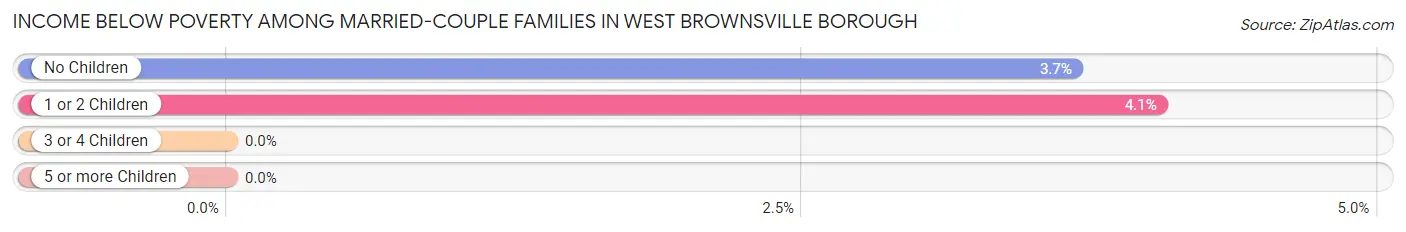
Income Below Poverty Among Married-Couple Families in West Brownsville borough
The poverty statistics for married-couple families in West Brownsville borough show that 3.6% or 8 of the total 219 families live below the poverty line. Families with 1 or 2 children have the highest poverty rate of 4.1%, comprising of 3 families. On the other hand, families with 3 or 4 children have the lowest poverty rate of 0.0%, which includes 0 families.
| Children | Above Poverty | Below Poverty |
| No Children | 131 (96.3%) | 5 (3.7%) |
| 1 or 2 Children | 71 (96.0%) | 3 (4.1%) |
| 3 or 4 Children | 9 (100.0%) | 0 (0.0%) |
| 5 or more Children | 0 (0.0%) | 0 (0.0%) |
| Total | 211 (96.4%) | 8 (3.6%) |
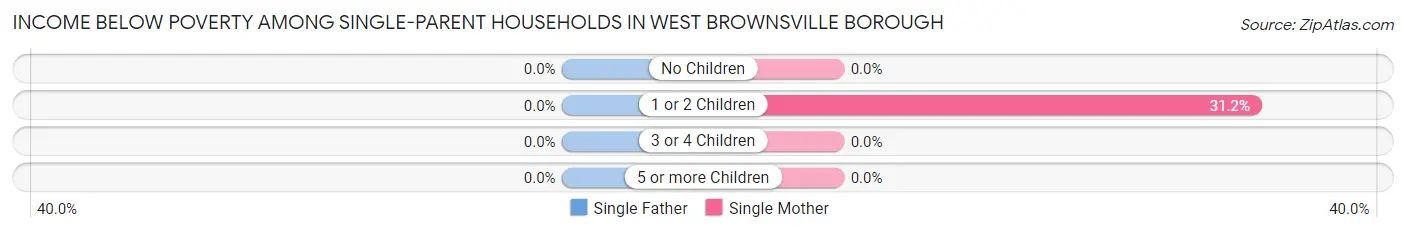
Income Below Poverty Among Single-Parent Households in West Brownsville borough
| Children | Single Father | Single Mother |
| No Children | 0 (0.0%) | 0 (0.0%) |
| 1 or 2 Children | 0 (0.0%) | 19 (31.1%) |
| 3 or 4 Children | 0 (0.0%) | 0 (0.0%) |
| 5 or more Children | 0 (0.0%) | 0 (0.0%) |
| Total | 0 (0.0%) | 19 (22.4%) |
Income Below Poverty Among Married-Couple vs Single-Parent Households in West Brownsville borough
The poverty data for West Brownsville borough shows that 8 of the married-couple family households (3.6%) and 19 of the single-parent households (21.1%) are living below the poverty level. Within the married-couple family households, those with 1 or 2 children have the highest poverty rate, with 3 households (4.1%) falling below the poverty line. Among the single-parent households, those with 1 or 2 children have the highest poverty rate, with 19 household (31.1%) living below poverty.
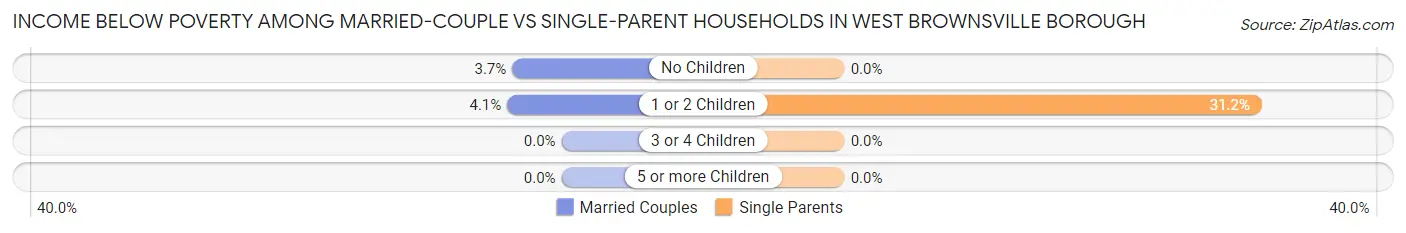
| Children | Married-Couple Families | Single-Parent Households |
| No Children | 5 (3.7%) | 0 (0.0%) |
| 1 or 2 Children | 3 (4.1%) | 19 (31.1%) |
| 3 or 4 Children | 0 (0.0%) | 0 (0.0%) |
| 5 or more Children | 0 (0.0%) | 0 (0.0%) |
| Total | 8 (3.6%) | 19 (21.1%) |
Race in West Brownsville borough
The most populous races in West Brownsville borough are White / Caucasian (1,039 | 95.2%), Two or more Races (20 | 1.8%), and Hispanic or Latino (18 | 1.7%).
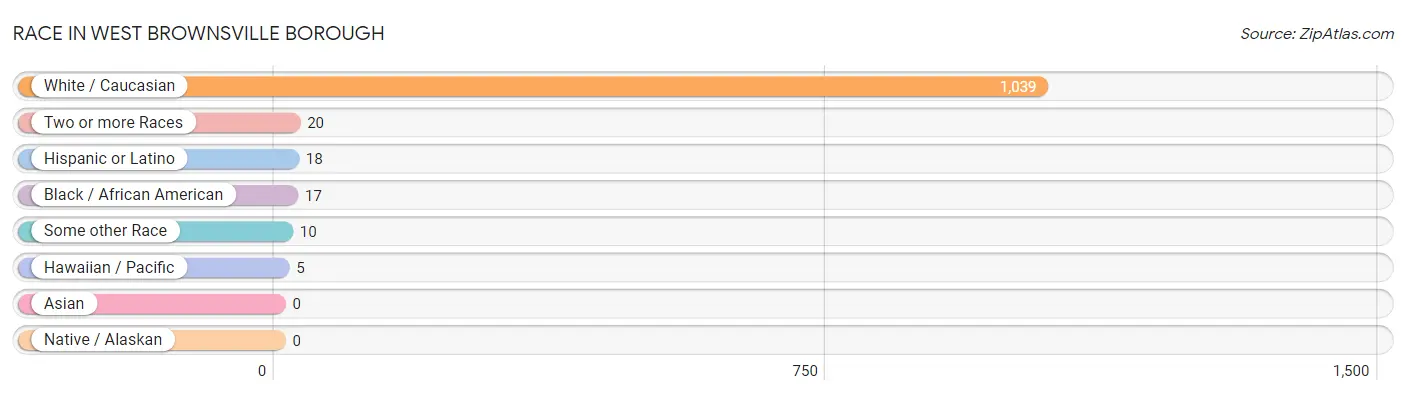
| Race | # Population | % Population |
| Asian | 0 | 0.0% |
| Black / African American | 17 | 1.6% |
| Hawaiian / Pacific | 5 | 0.5% |
| Hispanic or Latino | 18 | 1.7% |
| Native / Alaskan | 0 | 0.0% |
| White / Caucasian | 1,039 | 95.2% |
| Two or more Races | 20 | 1.8% |
| Some other Race | 10 | 0.9% |
| Total | 1,091 | 100.0% |
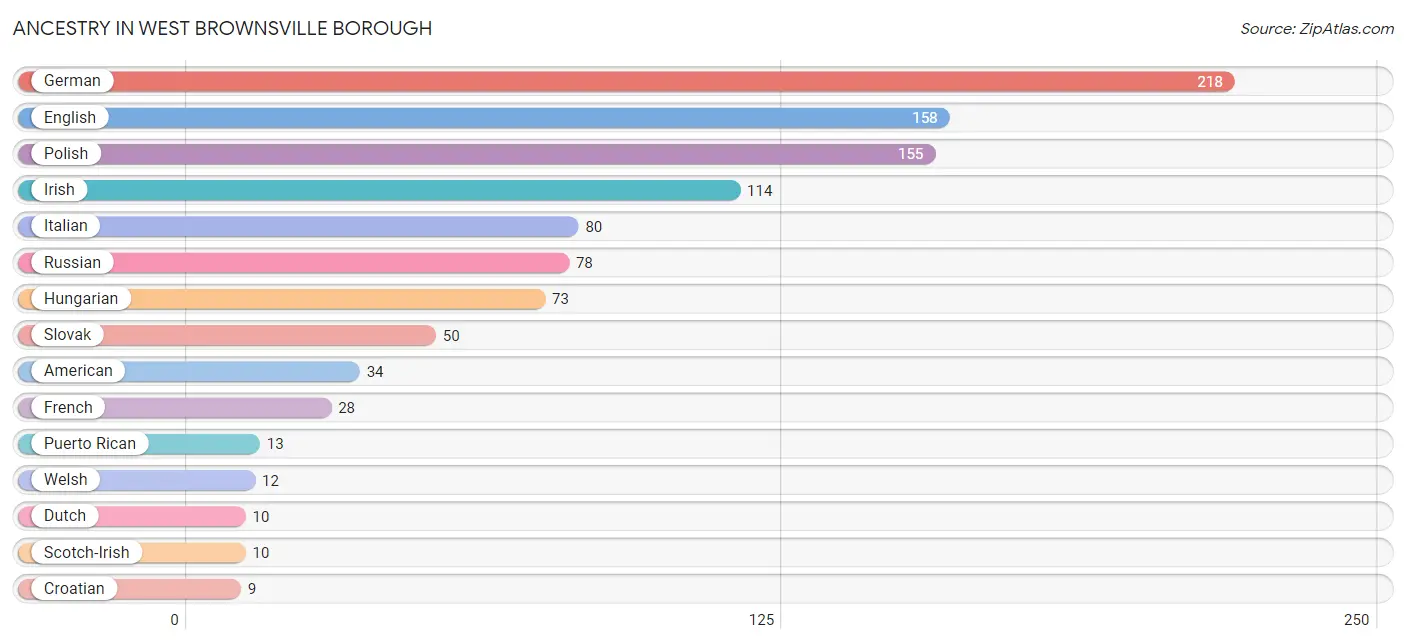
Ancestry in West Brownsville borough
The most populous ancestries reported in West Brownsville borough are German (218 | 20.0%), English (158 | 14.5%), Polish (155 | 14.2%), Irish (114 | 10.4%), and Italian (80 | 7.3%), together accounting for 66.5% of all West Brownsville borough residents.
| Ancestry | # Population | % Population |
| American | 34 | 3.1% |
| Austrian | 6 | 0.5% |
| Belgian | 2 | 0.2% |
| Croatian | 9 | 0.8% |
| Czech | 2 | 0.2% |
| Czechoslovakian | 6 | 0.5% |
| Dutch | 10 | 0.9% |
| English | 158 | 14.5% |
| European | 4 | 0.4% |
| French | 28 | 2.6% |
| French Canadian | 6 | 0.5% |
| German | 218 | 20.0% |
| Hungarian | 73 | 6.7% |
| Irish | 114 | 10.4% |
| Italian | 80 | 7.3% |
| Polish | 155 | 14.2% |
| Puerto Rican | 13 | 1.2% |
| Russian | 78 | 7.1% |
| Scotch-Irish | 10 | 0.9% |
| Scottish | 6 | 0.5% |
| Slovak | 50 | 4.6% |
| Slovene | 3 | 0.3% |
| Spaniard | 5 | 0.5% |
| Swedish | 5 | 0.5% |
| Ukrainian | 3 | 0.3% |
| Welsh | 12 | 1.1% |
| Yugoslavian | 9 | 0.8% | View All 27 Rows |
Immigrants in West Brownsville borough

| Immigration Origin | # Population | % Population | View All 0 Rows |
Sex and Age in West Brownsville borough
Sex and Age in West Brownsville borough
The most populous age groups in West Brownsville borough are 40 to 44 Years (73 | 15.9%) for men and 65 to 69 Years (59 | 9.3%) for women.
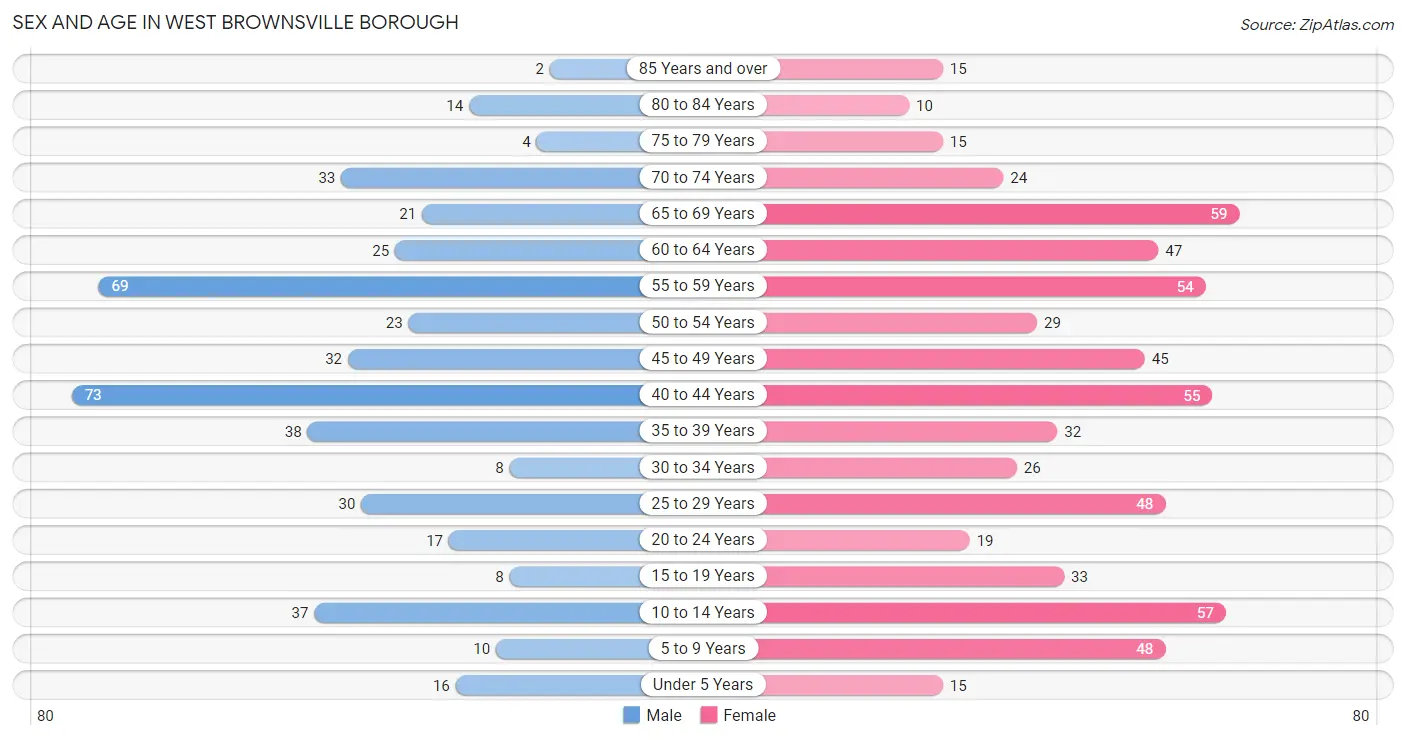
| Age Bracket | Male | Female |
| Under 5 Years | 16 (3.5%) | 15 (2.4%) |
| 5 to 9 Years | 10 (2.2%) | 48 (7.6%) |
| 10 to 14 Years | 37 (8.0%) | 57 (9.0%) |
| 15 to 19 Years | 8 (1.7%) | 33 (5.2%) |
| 20 to 24 Years | 17 (3.7%) | 19 (3.0%) |
| 25 to 29 Years | 30 (6.5%) | 48 (7.6%) |
| 30 to 34 Years | 8 (1.7%) | 26 (4.1%) |
| 35 to 39 Years | 38 (8.3%) | 32 (5.1%) |
| 40 to 44 Years | 73 (15.9%) | 55 (8.7%) |
| 45 to 49 Years | 32 (7.0%) | 45 (7.1%) |
| 50 to 54 Years | 23 (5.0%) | 29 (4.6%) |
| 55 to 59 Years | 69 (15.0%) | 54 (8.6%) |
| 60 to 64 Years | 25 (5.4%) | 47 (7.4%) |
| 65 to 69 Years | 21 (4.6%) | 59 (9.3%) |
| 70 to 74 Years | 33 (7.2%) | 24 (3.8%) |
| 75 to 79 Years | 4 (0.9%) | 15 (2.4%) |
| 80 to 84 Years | 14 (3.0%) | 10 (1.6%) |
| 85 Years and over | 2 (0.4%) | 15 (2.4%) |
| Total | 460 (100.0%) | 631 (100.0%) |
Families and Households in West Brownsville borough
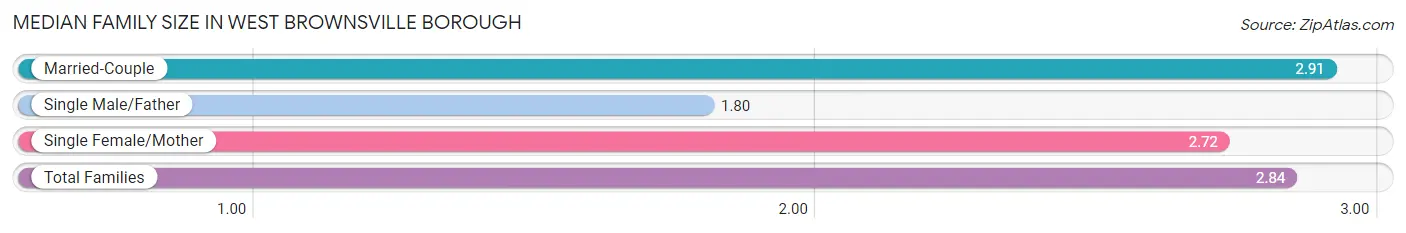
Median Family Size in West Brownsville borough
The median family size in West Brownsville borough is 2.84 persons per family, with married-couple families (219 | 70.9%) accounting for the largest median family size of 2.91 persons per family. On the other hand, single male/father families (5 | 1.6%) represent the smallest median family size with 1.80 persons per family.
| Family Type | # Families | Family Size |
| Married-Couple | 219 (70.9%) | 2.91 |
| Single Male/Father | 5 (1.6%) | 1.80 |
| Single Female/Mother | 85 (27.5%) | 2.72 |
| Total Families | 309 (100.0%) | 2.84 |
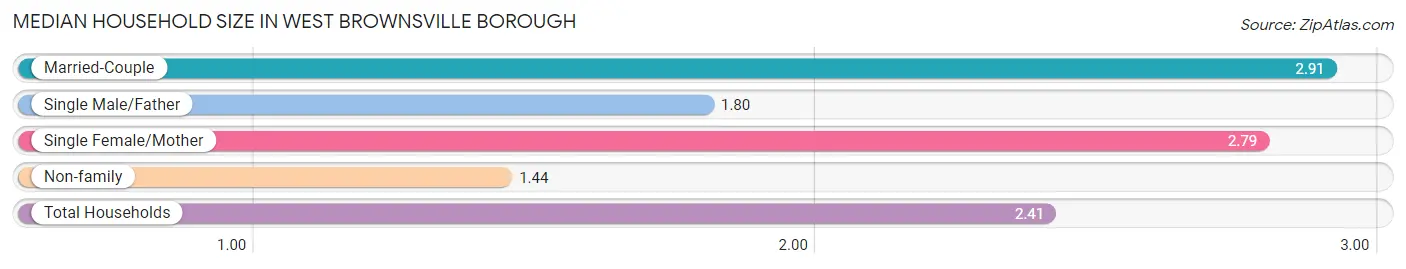
Median Household Size in West Brownsville borough
The median household size in West Brownsville borough is 2.41 persons per household, with married-couple households (219 | 48.3%) accounting for the largest median household size of 2.91 persons per household. non-family households (144 | 31.8%) represent the smallest median household size with 1.44 persons per household.
| Household Type | # Households | Household Size |
| Married-Couple | 219 (48.3%) | 2.91 |
| Single Male/Father | 5 (1.1%) | 1.80 |
| Single Female/Mother | 85 (18.8%) | 2.79 |
| Non-family | 144 (31.8%) | 1.44 |
| Total Households | 453 (100.0%) | 2.41 |
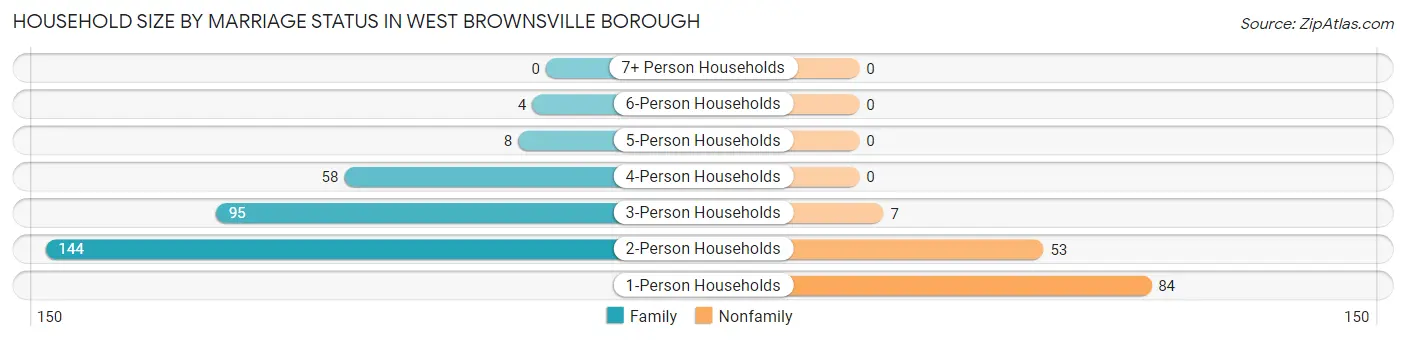
Household Size by Marriage Status in West Brownsville borough
Out of a total of 453 households in West Brownsville borough, 309 (68.2%) are family households, while 144 (31.8%) are nonfamily households. The most numerous type of family households are 2-person households, comprising 144, and the most common type of nonfamily households are 1-person households, comprising 84.
| Household Size | Family Households | Nonfamily Households |
| 1-Person Households | - | 84 (18.5%) |
| 2-Person Households | 144 (31.8%) | 53 (11.7%) |
| 3-Person Households | 95 (21.0%) | 7 (1.5%) |
| 4-Person Households | 58 (12.8%) | 0 (0.0%) |
| 5-Person Households | 8 (1.8%) | 0 (0.0%) |
| 6-Person Households | 4 (0.9%) | 0 (0.0%) |
| 7+ Person Households | 0 (0.0%) | 0 (0.0%) |
| Total | 309 (68.2%) | 144 (31.8%) |
Female Fertility in West Brownsville borough
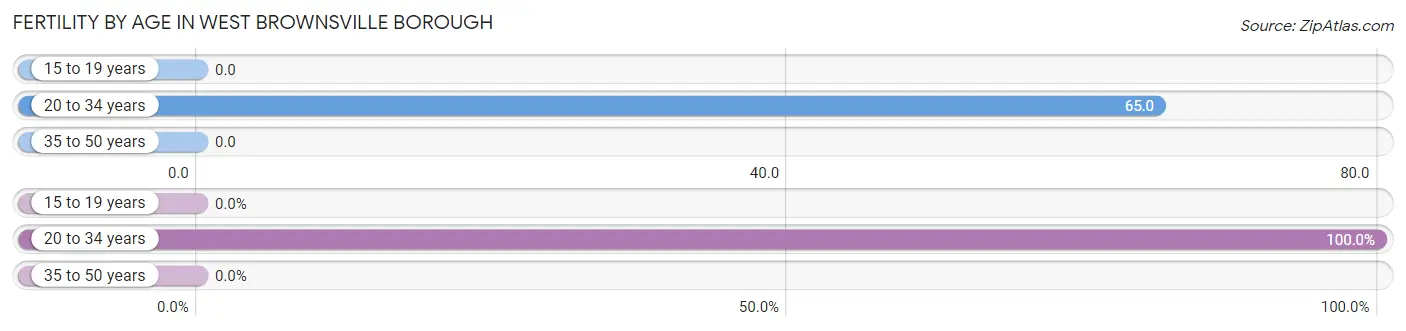
Fertility by Age in West Brownsville borough
Average fertility rate in West Brownsville borough is 23.0 births per 1,000 women. Women in the age bracket of 20 to 34 years have the highest fertility rate with 65.0 births per 1,000 women. Women in the age bracket of 20 to 34 years acount for 100.0% of all women with births.
| Age Bracket | Women with Births | Births / 1,000 Women |
| 15 to 19 years | 0 (0.0%) | 0.0 |
| 20 to 34 years | 6 (100.0%) | 65.0 |
| 35 to 50 years | 0 (0.0%) | 0.0 |
| Total | 6 (100.0%) | 23.0 |
Fertility by Age by Marriage Status in West Brownsville borough
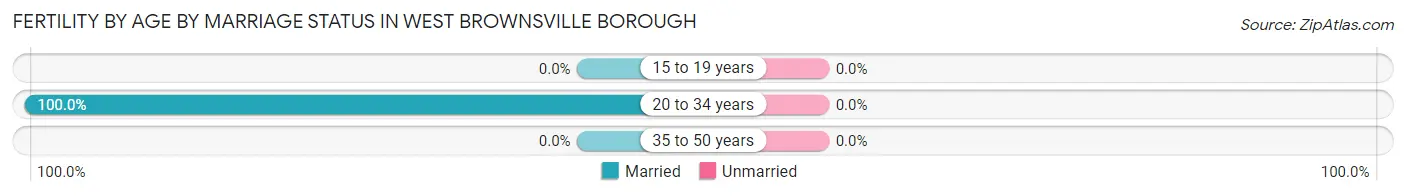
| Age Bracket | Married | Unmarried |
| 15 to 19 years | 0 (0.0%) | 0 (0.0%) |
| 20 to 34 years | 6 (100.0%) | 0 (0.0%) |
| 35 to 50 years | 0 (0.0%) | 0 (0.0%) |
| Total | 6 (100.0%) | 0 (0.0%) |
Fertility by Education in West Brownsville borough
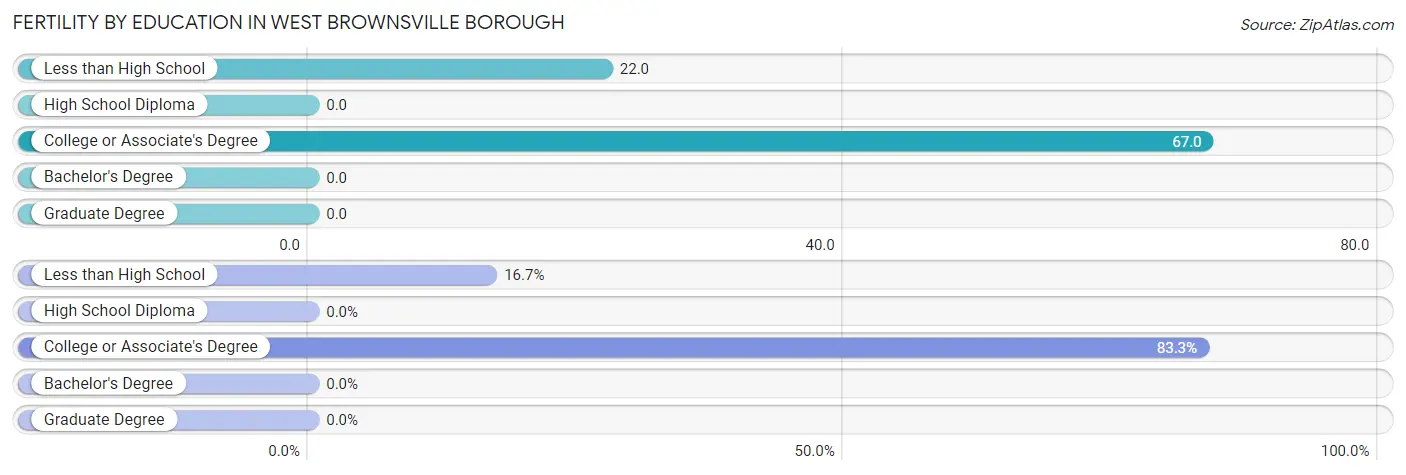
| Educational Attainment | Women with Births | Births / 1,000 Women |
| Less than High School | 1 (16.7%) | 22.0 |
| High School Diploma | 0 (0.0%) | 0.0 |
| College or Associate's Degree | 5 (83.3%) | 67.0 |
| Bachelor's Degree | 0 (0.0%) | 0.0 |
| Graduate Degree | 0 (0.0%) | 0.0 |
| Total | 6 (100.0%) | 23.0 |
Fertility by Education by Marriage Status in West Brownsville borough
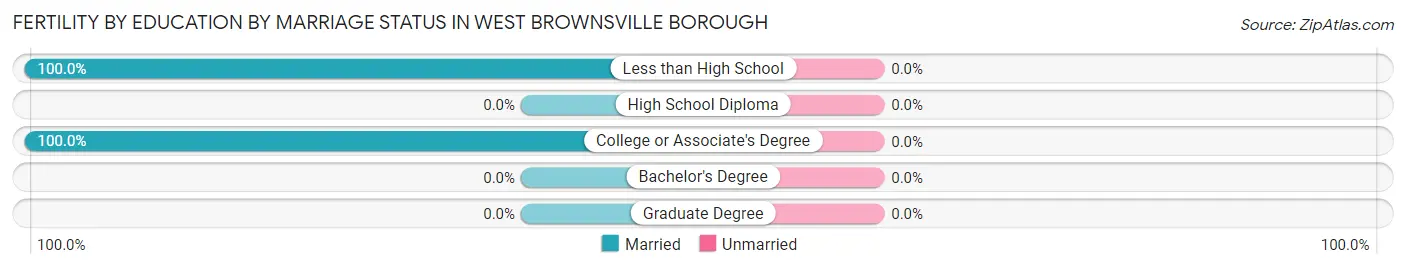
| Educational Attainment | Married | Unmarried |
| Less than High School | 1 (100.0%) | 0 (0.0%) |
| High School Diploma | 0 (0.0%) | 0 (0.0%) |
| College or Associate's Degree | 5 (100.0%) | 0 (0.0%) |
| Bachelor's Degree | 0 (0.0%) | 0 (0.0%) |
| Graduate Degree | 0 (0.0%) | 0 (0.0%) |
| Total | 6 (100.0%) | 0 (0.0%) |
Employment Characteristics in West Brownsville borough
Employment by Class of Employer in West Brownsville borough
Among the 558 employed individuals in West Brownsville borough, private company employees (430 | 77.1%), state government employees (43 | 7.7%), and self-employed (not incorporated) (38 | 6.8%) make up the most common classes of employment.
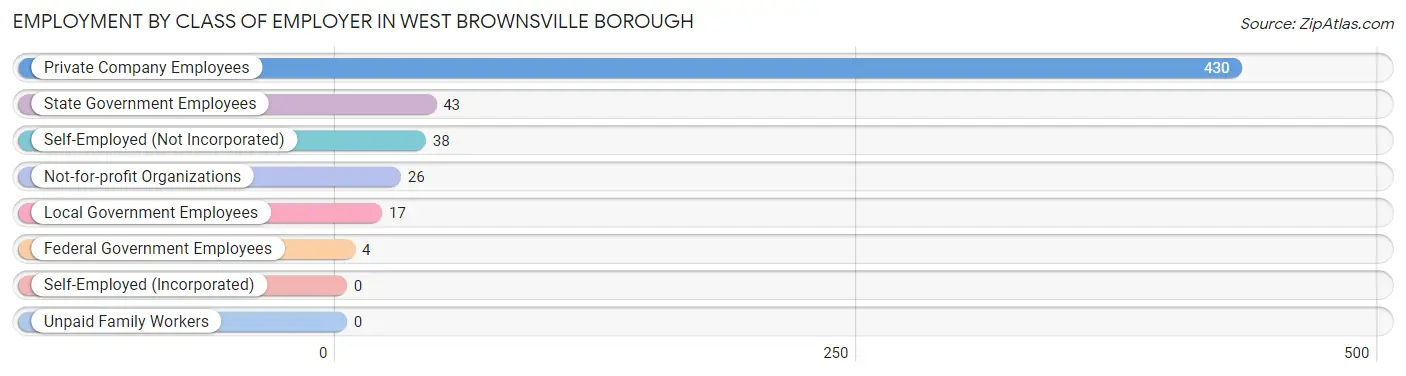
| Employer Class | # Employees | % Employees |
| Private Company Employees | 430 | 77.1% |
| Self-Employed (Incorporated) | 0 | 0.0% |
| Self-Employed (Not Incorporated) | 38 | 6.8% |
| Not-for-profit Organizations | 26 | 4.7% |
| Local Government Employees | 17 | 3.0% |
| State Government Employees | 43 | 7.7% |
| Federal Government Employees | 4 | 0.7% |
| Unpaid Family Workers | 0 | 0.0% |
| Total | 558 | 100.0% |
Employment Status by Age in West Brownsville borough
According to the labor force statistics for West Brownsville borough, out of the total population over 16 years of age (908), 65.3% or 593 individuals are in the labor force, with 5.1% or 30 of them unemployed. The age group with the highest labor force participation rate is 20 to 24 years, with 100.0% or 36 individuals in the labor force. Within the labor force, the 65 to 74 years age range has the highest percentage of unemployed individuals, with 30.6% or 11 of them being unemployed.
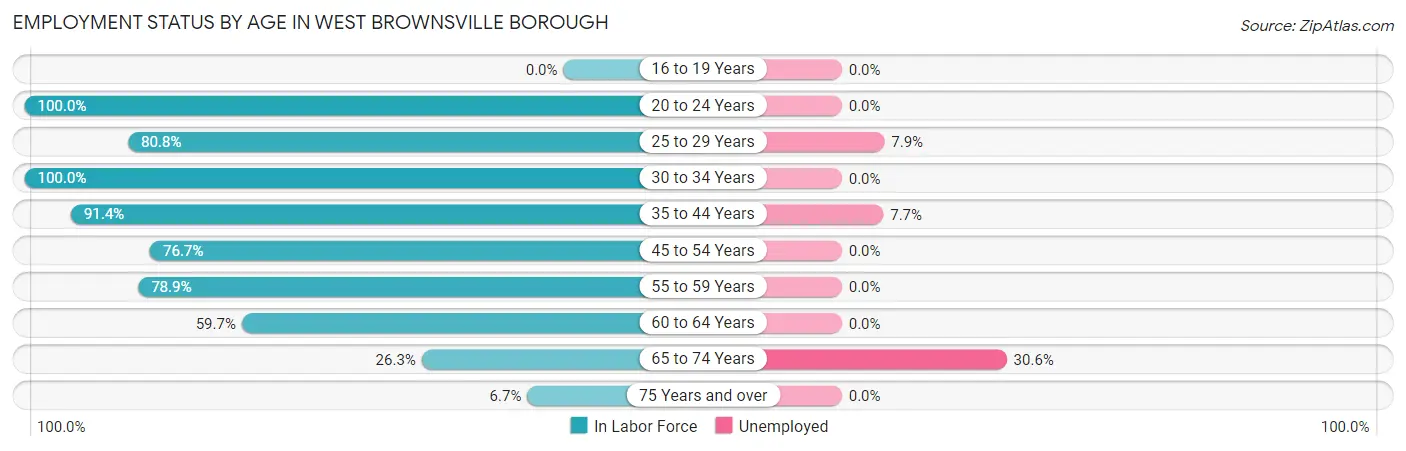
| Age Bracket | In Labor Force | Unemployed |
| 16 to 19 Years | 0 (0.0%) | 0 (0.0%) |
| 20 to 24 Years | 36 (100.0%) | 0 (0.0%) |
| 25 to 29 Years | 63 (80.8%) | 5 (7.9%) |
| 30 to 34 Years | 34 (100.0%) | 0 (0.0%) |
| 35 to 44 Years | 181 (91.4%) | 14 (7.7%) |
| 45 to 54 Years | 99 (76.7%) | 0 (0.0%) |
| 55 to 59 Years | 97 (78.9%) | 0 (0.0%) |
| 60 to 64 Years | 43 (59.7%) | 0 (0.0%) |
| 65 to 74 Years | 36 (26.3%) | 11 (30.6%) |
| 75 Years and over | 4 (6.7%) | 0 (0.0%) |
| Total | 593 (65.3%) | 30 (5.1%) |
Employment Status by Educational Attainment in West Brownsville borough
According to labor force statistics for West Brownsville borough, 81.5% of individuals (517) out of the total population between 25 and 64 years of age (634) are in the labor force, with 3.7% or 19 of them being unemployed. The group with the highest labor force participation rate are those with the educational attainment of bachelor's degree or higher, with 90.4% or 132 individuals in the labor force. Within the labor force, individuals with high school diploma education have the highest percentage of unemployment, with 6.6% or 14 of them being unemployed.
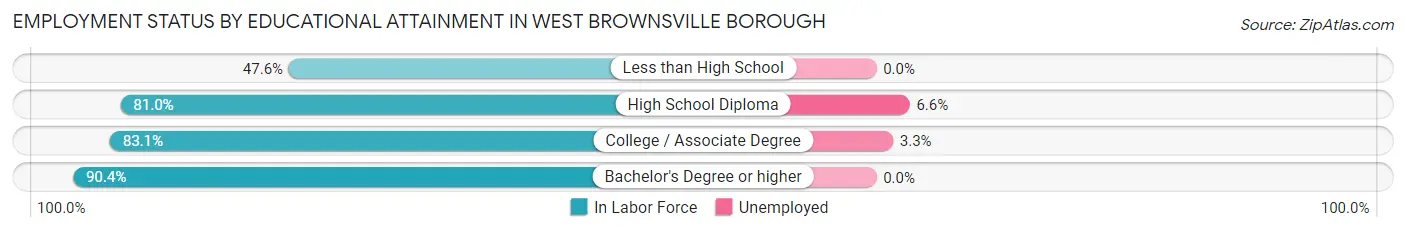
| Educational Attainment | In Labor Force | Unemployed |
| Less than High School | 20 (47.6%) | 0 (0.0%) |
| High School Diploma | 213 (81.0%) | 17 (6.6%) |
| College / Associate Degree | 152 (83.1%) | 6 (3.3%) |
| Bachelor's Degree or higher | 132 (90.4%) | 0 (0.0%) |
| Total | 517 (81.5%) | 23 (3.7%) |
Employment Occupations by Sex in West Brownsville borough
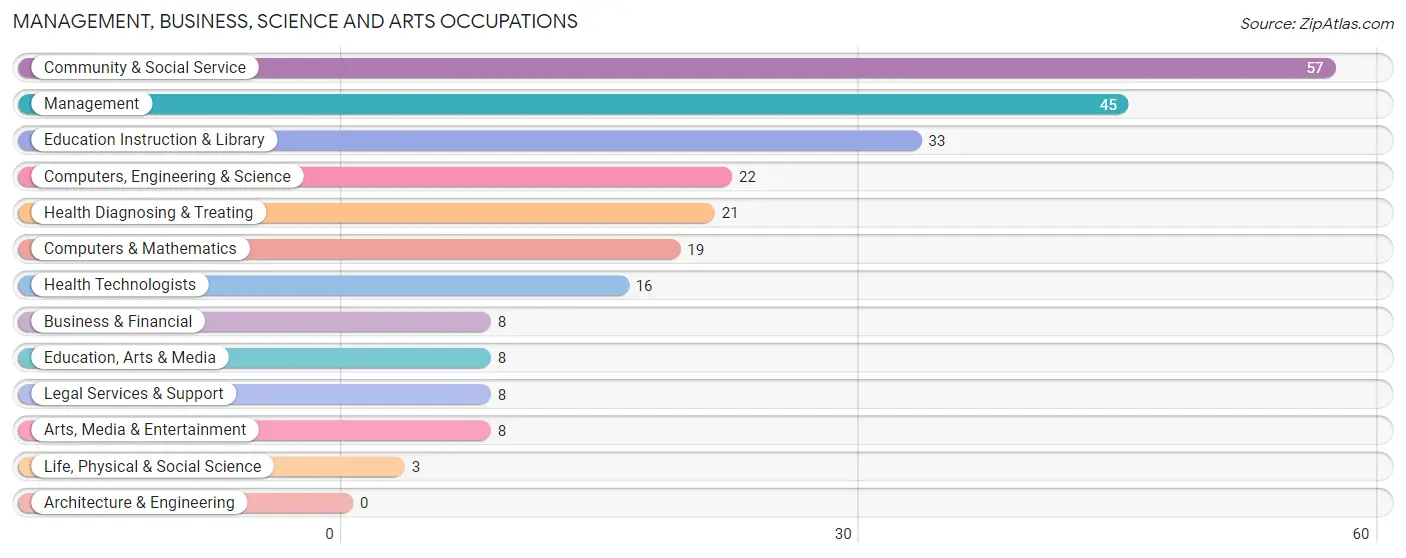
Management, Business, Science and Arts Occupations
The most common Management, Business, Science and Arts occupations in West Brownsville borough are Community & Social Service (57 | 10.1%), Management (45 | 8.0%), Education Instruction & Library (33 | 5.9%), Computers, Engineering & Science (22 | 3.9%), and Health Diagnosing & Treating (21 | 3.7%).
Management, Business, Science and Arts Occupations by Sex
Within the Management, Business, Science and Arts occupations in West Brownsville borough, the most male-oriented occupations are Computers, Engineering & Science (100.0%), Computers & Mathematics (100.0%), and Life, Physical & Social Science (100.0%), while the most female-oriented occupations are Business & Financial (100.0%), Legal Services & Support (100.0%), and Education Instruction & Library (100.0%).
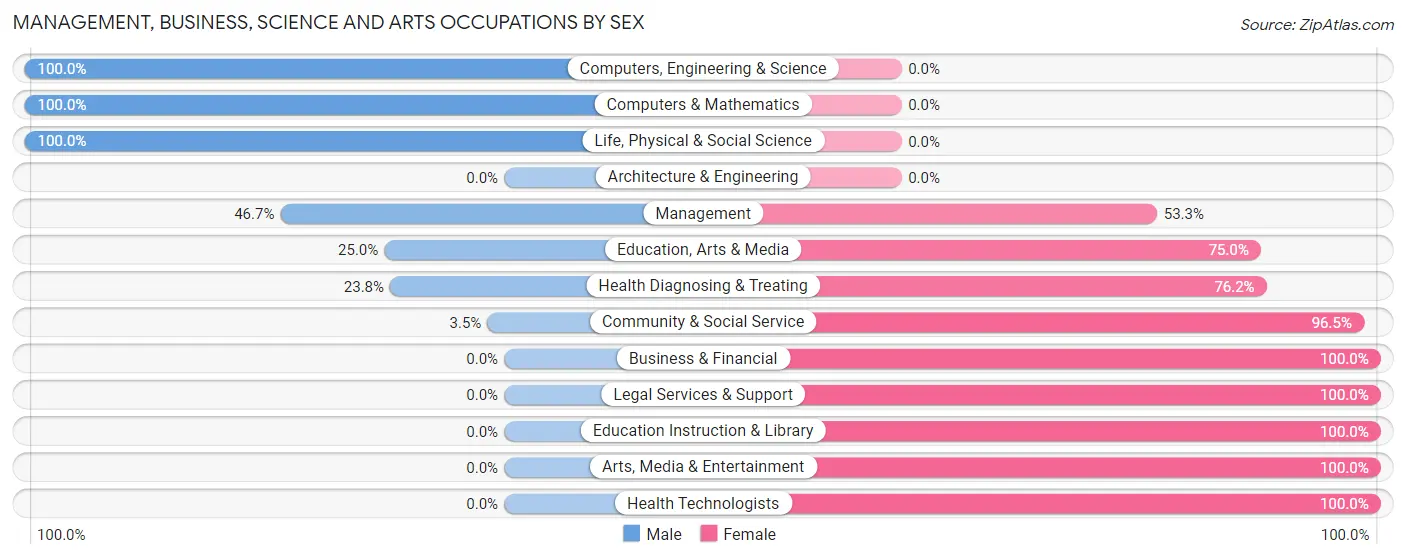
| Occupation | Male | Female |
| Management | 21 (46.7%) | 24 (53.3%) |
| Business & Financial | 0 (0.0%) | 8 (100.0%) |
| Computers, Engineering & Science | 22 (100.0%) | 0 (0.0%) |
| Computers & Mathematics | 19 (100.0%) | 0 (0.0%) |
| Architecture & Engineering | 0 (0.0%) | 0 (0.0%) |
| Life, Physical & Social Science | 3 (100.0%) | 0 (0.0%) |
| Community & Social Service | 2 (3.5%) | 55 (96.5%) |
| Education, Arts & Media | 2 (25.0%) | 6 (75.0%) |
| Legal Services & Support | 0 (0.0%) | 8 (100.0%) |
| Education Instruction & Library | 0 (0.0%) | 33 (100.0%) |
| Arts, Media & Entertainment | 0 (0.0%) | 8 (100.0%) |
| Health Diagnosing & Treating | 5 (23.8%) | 16 (76.2%) |
| Health Technologists | 0 (0.0%) | 16 (100.0%) |
| Total (Category) | 50 (32.7%) | 103 (67.3%) |
| Total (Overall) | 283 (50.3%) | 280 (49.7%) |
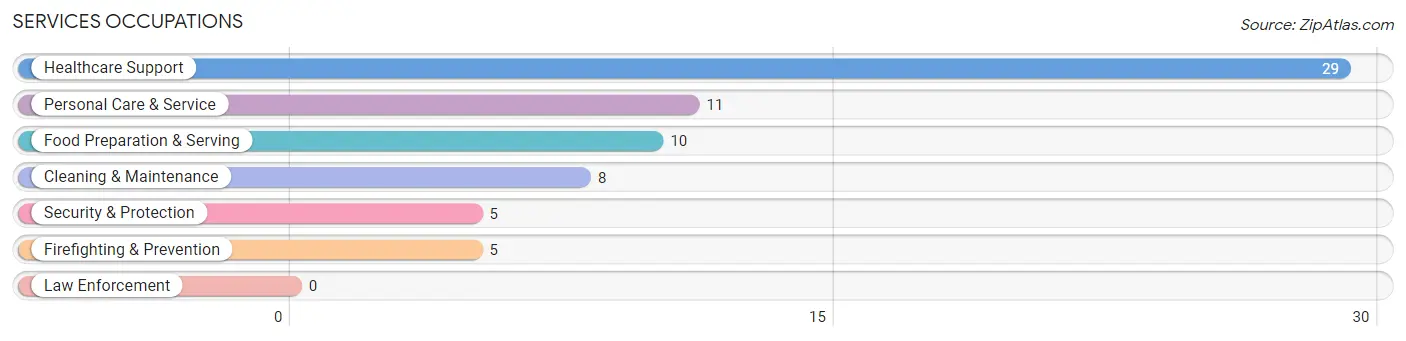
Services Occupations
The most common Services occupations in West Brownsville borough are Healthcare Support (29 | 5.1%), Personal Care & Service (11 | 1.9%), Food Preparation & Serving (10 | 1.8%), Cleaning & Maintenance (8 | 1.4%), and Security & Protection (5 | 0.9%).
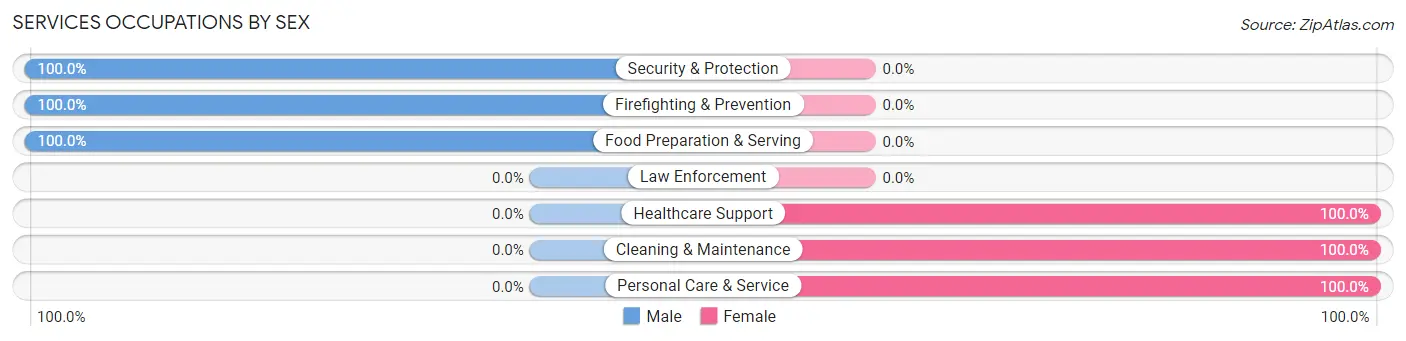
Services Occupations by Sex
Within the Services occupations in West Brownsville borough, the most male-oriented occupations are Security & Protection (100.0%), Firefighting & Prevention (100.0%), and Food Preparation & Serving (100.0%), while the most female-oriented occupations are Healthcare Support (100.0%), Cleaning & Maintenance (100.0%), and Personal Care & Service (100.0%).
| Occupation | Male | Female |
| Healthcare Support | 0 (0.0%) | 29 (100.0%) |
| Security & Protection | 5 (100.0%) | 0 (0.0%) |
| Firefighting & Prevention | 5 (100.0%) | 0 (0.0%) |
| Law Enforcement | 0 (0.0%) | 0 (0.0%) |
| Food Preparation & Serving | 10 (100.0%) | 0 (0.0%) |
| Cleaning & Maintenance | 0 (0.0%) | 8 (100.0%) |
| Personal Care & Service | 0 (0.0%) | 11 (100.0%) |
| Total (Category) | 15 (23.8%) | 48 (76.2%) |
| Total (Overall) | 283 (50.3%) | 280 (49.7%) |
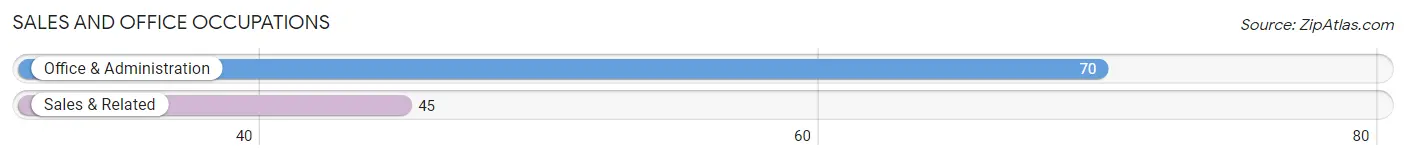
Sales and Office Occupations
The most common Sales and Office occupations in West Brownsville borough are Office & Administration (70 | 12.4%), and Sales & Related (45 | 8.0%).
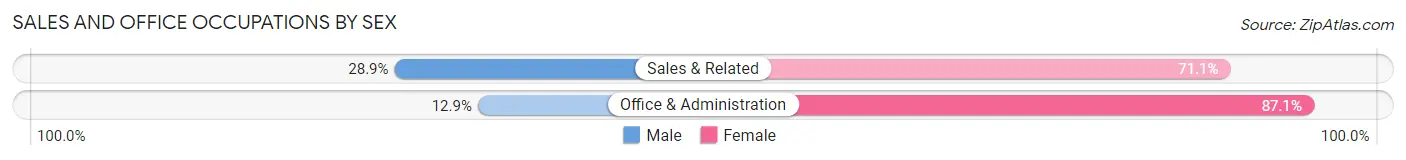
Sales and Office Occupations by Sex
| Occupation | Male | Female |
| Sales & Related | 13 (28.9%) | 32 (71.1%) |
| Office & Administration | 9 (12.9%) | 61 (87.1%) |
| Total (Category) | 22 (19.1%) | 93 (80.9%) |
| Total (Overall) | 283 (50.3%) | 280 (49.7%) |
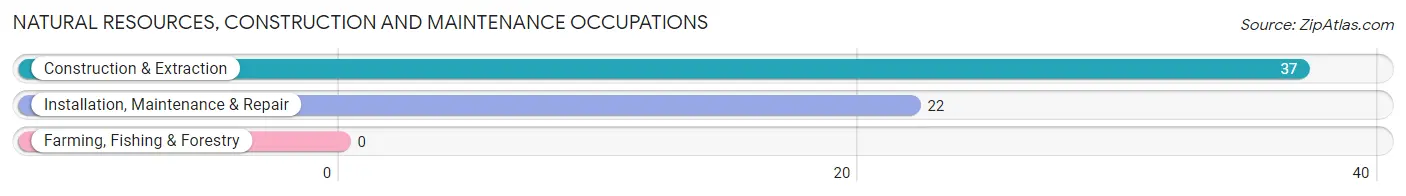
Natural Resources, Construction and Maintenance Occupations
The most common Natural Resources, Construction and Maintenance occupations in West Brownsville borough are Construction & Extraction (37 | 6.6%), and Installation, Maintenance & Repair (22 | 3.9%).
Natural Resources, Construction and Maintenance Occupations by Sex
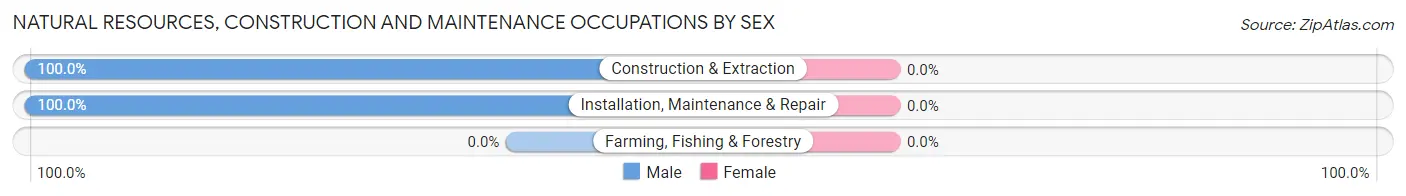
| Occupation | Male | Female |
| Farming, Fishing & Forestry | 0 (0.0%) | 0 (0.0%) |
| Construction & Extraction | 37 (100.0%) | 0 (0.0%) |
| Installation, Maintenance & Repair | 22 (100.0%) | 0 (0.0%) |
| Total (Category) | 59 (100.0%) | 0 (0.0%) |
| Total (Overall) | 283 (50.3%) | 280 (49.7%) |
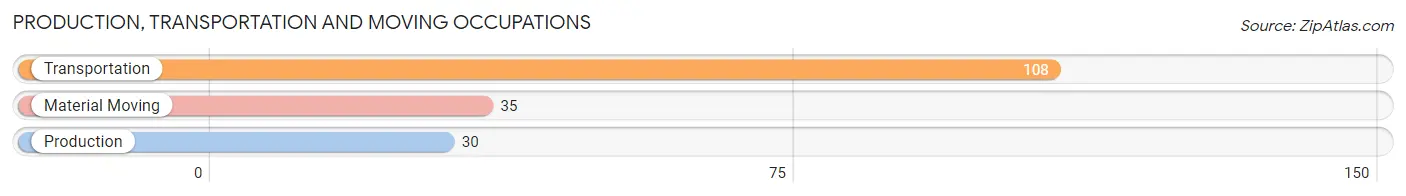
Production, Transportation and Moving Occupations
The most common Production, Transportation and Moving occupations in West Brownsville borough are Transportation (108 | 19.2%), Material Moving (35 | 6.2%), and Production (30 | 5.3%).
Production, Transportation and Moving Occupations by Sex
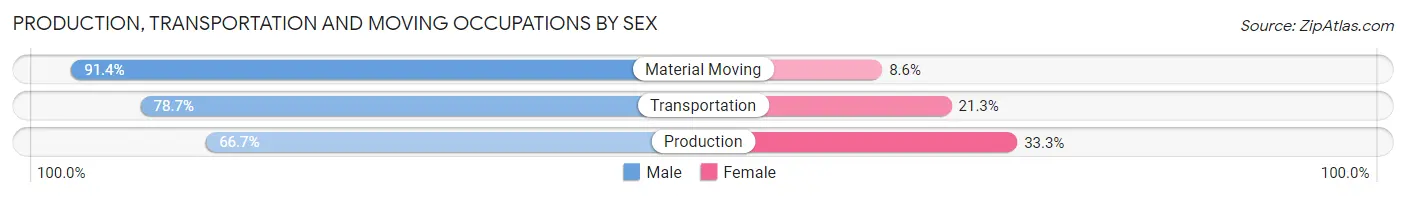
| Occupation | Male | Female |
| Production | 20 (66.7%) | 10 (33.3%) |
| Transportation | 85 (78.7%) | 23 (21.3%) |
| Material Moving | 32 (91.4%) | 3 (8.6%) |
| Total (Category) | 137 (79.2%) | 36 (20.8%) |
| Total (Overall) | 283 (50.3%) | 280 (49.7%) |
Employment Industries by Sex in West Brownsville borough
Employment Industries in West Brownsville borough
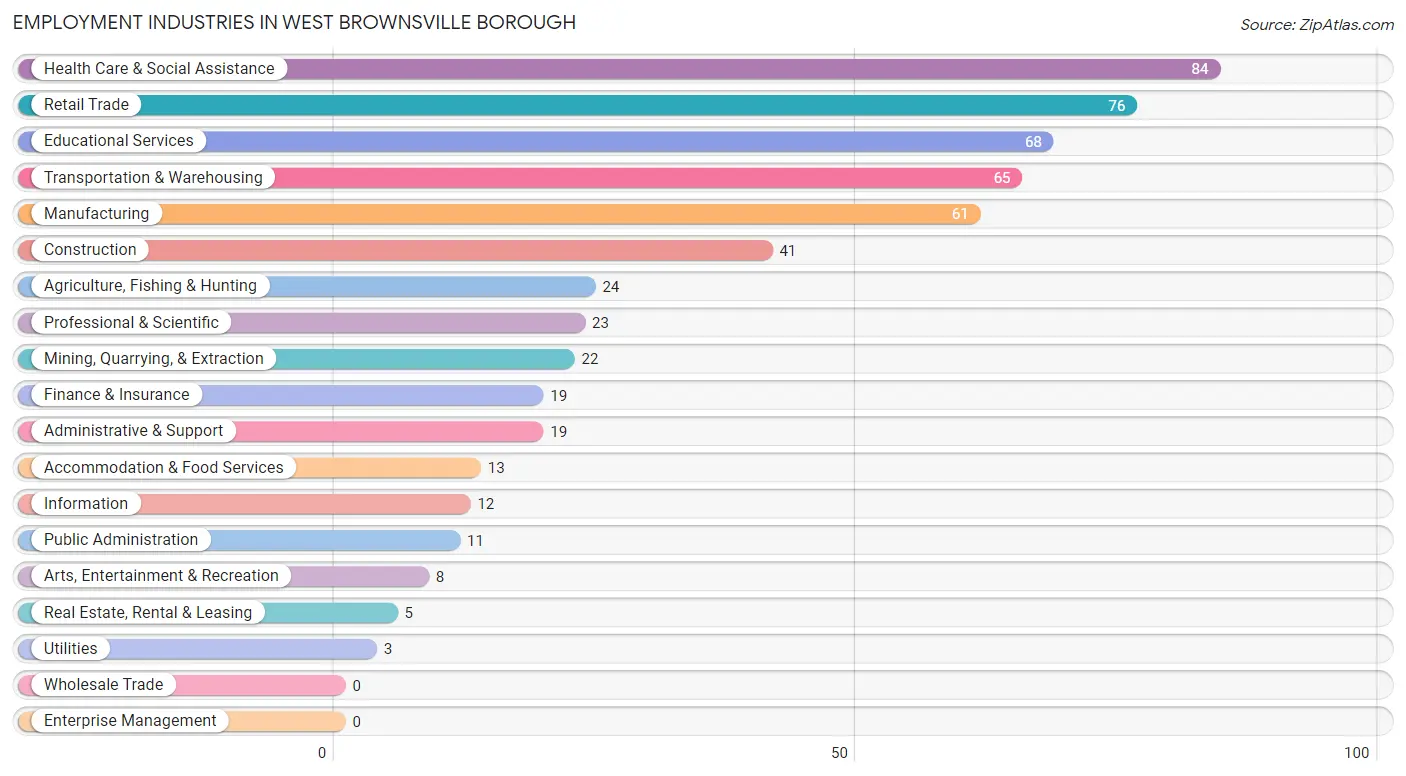
The major employment industries in West Brownsville borough include Health Care & Social Assistance (84 | 14.9%), Retail Trade (76 | 13.5%), Educational Services (68 | 12.1%), Transportation & Warehousing (65 | 11.6%), and Manufacturing (61 | 10.8%).
Employment Industries by Sex in West Brownsville borough
The West Brownsville borough industries that see more men than women are Agriculture, Fishing & Hunting (100.0%), Mining, Quarrying, & Extraction (100.0%), and Construction (100.0%), whereas the industries that tend to have a higher number of women are Real Estate, Rental & Leasing (100.0%), Educational Services (92.6%), and Health Care & Social Assistance (84.5%).
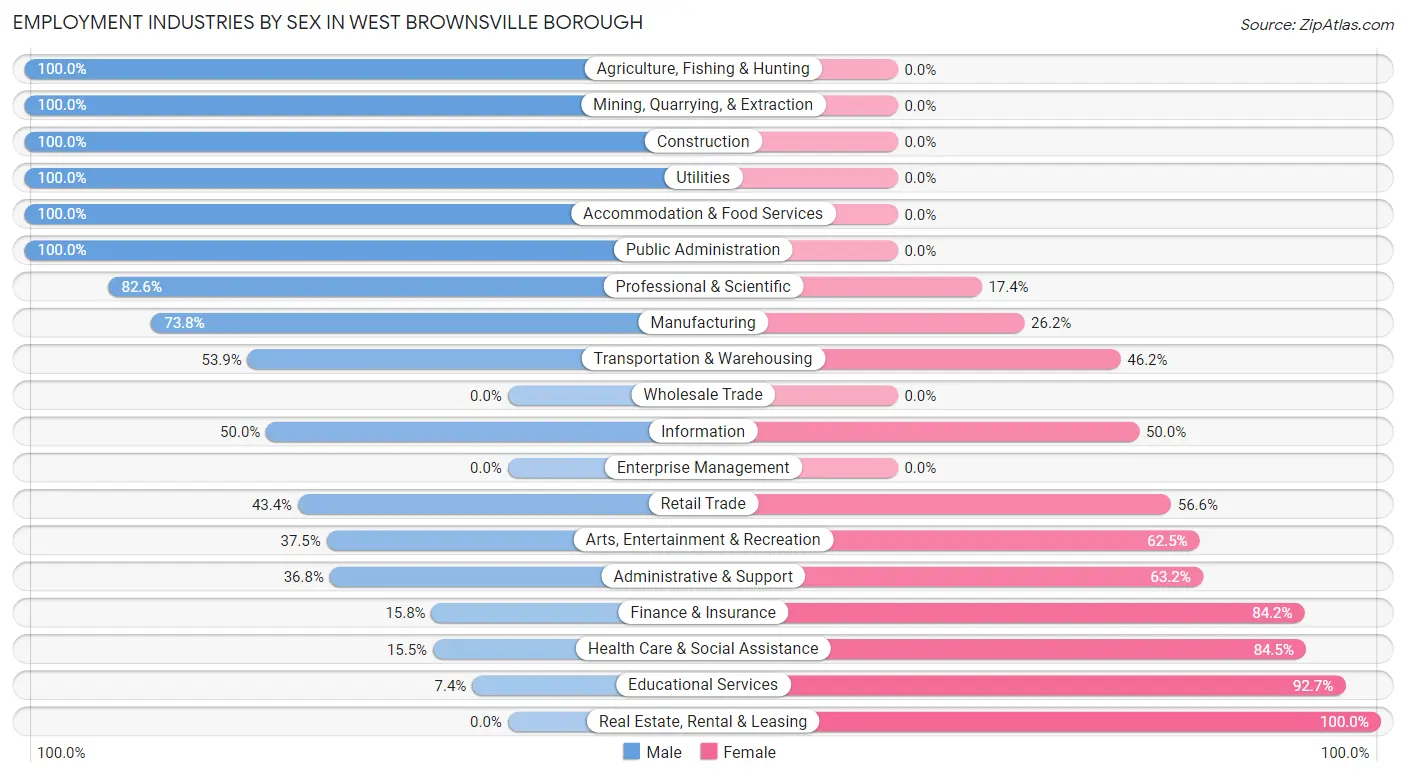
| Industry | Male | Female |
| Agriculture, Fishing & Hunting | 24 (100.0%) | 0 (0.0%) |
| Mining, Quarrying, & Extraction | 22 (100.0%) | 0 (0.0%) |
| Construction | 41 (100.0%) | 0 (0.0%) |
| Manufacturing | 45 (73.8%) | 16 (26.2%) |
| Wholesale Trade | 0 (0.0%) | 0 (0.0%) |
| Retail Trade | 33 (43.4%) | 43 (56.6%) |
| Transportation & Warehousing | 35 (53.8%) | 30 (46.2%) |
| Utilities | 3 (100.0%) | 0 (0.0%) |
| Information | 6 (50.0%) | 6 (50.0%) |
| Finance & Insurance | 3 (15.8%) | 16 (84.2%) |
| Real Estate, Rental & Leasing | 0 (0.0%) | 5 (100.0%) |
| Professional & Scientific | 19 (82.6%) | 4 (17.4%) |
| Enterprise Management | 0 (0.0%) | 0 (0.0%) |
| Administrative & Support | 7 (36.8%) | 12 (63.2%) |
| Educational Services | 5 (7.3%) | 63 (92.6%) |
| Health Care & Social Assistance | 13 (15.5%) | 71 (84.5%) |
| Arts, Entertainment & Recreation | 3 (37.5%) | 5 (62.5%) |
| Accommodation & Food Services | 13 (100.0%) | 0 (0.0%) |
| Public Administration | 11 (100.0%) | 0 (0.0%) |
| Total | 283 (50.3%) | 280 (49.7%) |
Education in West Brownsville borough
School Enrollment in West Brownsville borough
The most common levels of schooling among the 201 students in West Brownsville borough are middle school (75 | 37.3%), high school (49 | 24.4%), and elementary school (30 | 14.9%).
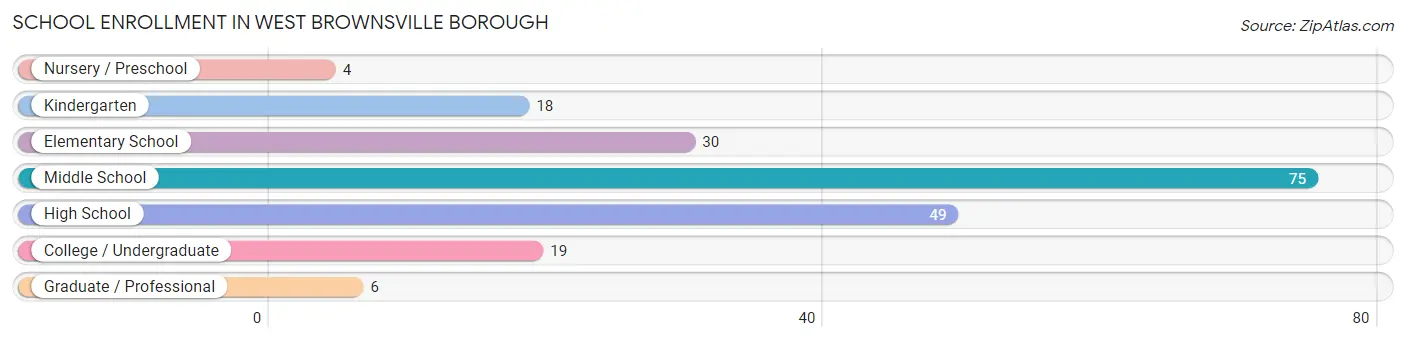
| School Level | # Students | % Students |
| Nursery / Preschool | 4 | 2.0% |
| Kindergarten | 18 | 9.0% |
| Elementary School | 30 | 14.9% |
| Middle School | 75 | 37.3% |
| High School | 49 | 24.4% |
| College / Undergraduate | 19 | 9.5% |
| Graduate / Professional | 6 | 3.0% |
| Total | 201 | 100.0% |
School Enrollment by Age by Funding Source in West Brownsville borough
Out of a total of 201 students who are enrolled in schools in West Brownsville borough, 11 (5.5%) attend a private institution, while the remaining 190 (94.5%) are enrolled in public schools. The age group of 20 to 24 year olds has the highest likelihood of being enrolled in private schools, with 4 (40.0% in the age bracket) enrolled. Conversely, the age group of 15 to 17 year olds has the lowest likelihood of being enrolled in a private school, with 32 (100.0% in the age bracket) attending a public institution.
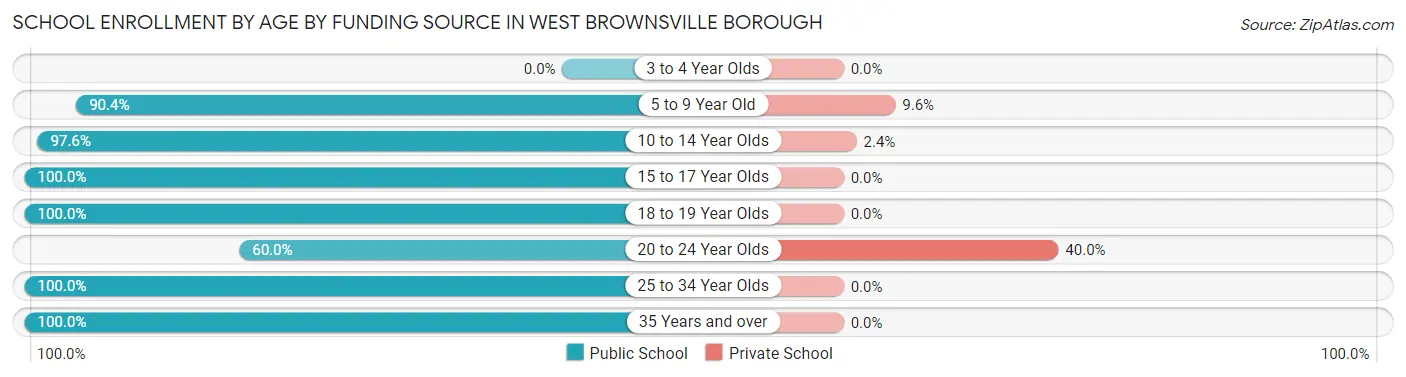
| Age Bracket | Public School | Private School |
| 3 to 4 Year Olds | 0 (0.0%) | 0 (0.0%) |
| 5 to 9 Year Old | 47 (90.4%) | 5 (9.6%) |
| 10 to 14 Year Olds | 81 (97.6%) | 2 (2.4%) |
| 15 to 17 Year Olds | 32 (100.0%) | 0 (0.0%) |
| 18 to 19 Year Olds | 9 (100.0%) | 0 (0.0%) |
| 20 to 24 Year Olds | 6 (60.0%) | 4 (40.0%) |
| 25 to 34 Year Olds | 5 (100.0%) | 0 (0.0%) |
| 35 Years and over | 10 (100.0%) | 0 (0.0%) |
| Total | 190 (94.5%) | 11 (5.5%) |
Educational Attainment by Field of Study in West Brownsville borough
Education (55 | 29.3%), physical & health sciences (25 | 13.3%), liberal arts & history (24 | 12.8%), psychology (17 | 9.0%), and business (10 | 5.3%) are the most common fields of study among 188 individuals in West Brownsville borough who have obtained a bachelor's degree or higher.
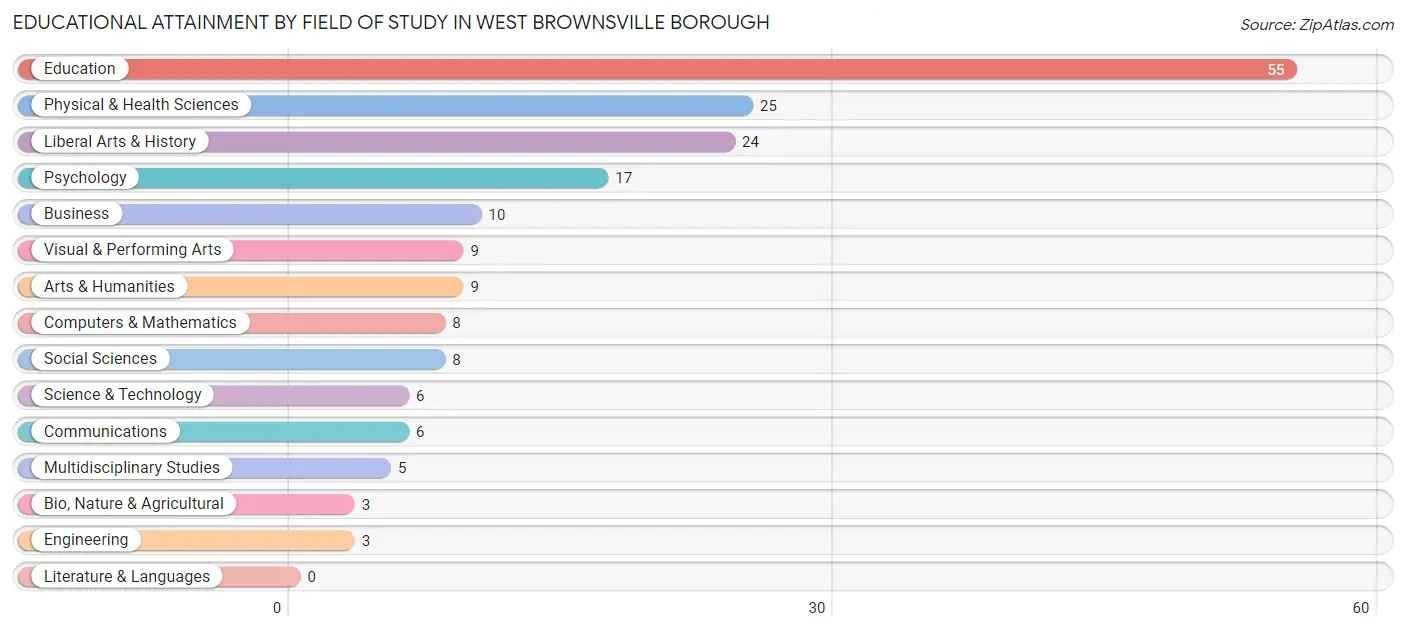
| Field of Study | # Graduates | % Graduates |
| Computers & Mathematics | 8 | 4.3% |
| Bio, Nature & Agricultural | 3 | 1.6% |
| Physical & Health Sciences | 25 | 13.3% |
| Psychology | 17 | 9.0% |
| Social Sciences | 8 | 4.3% |
| Engineering | 3 | 1.6% |
| Multidisciplinary Studies | 5 | 2.7% |
| Science & Technology | 6 | 3.2% |
| Business | 10 | 5.3% |
| Education | 55 | 29.3% |
| Literature & Languages | 0 | 0.0% |
| Liberal Arts & History | 24 | 12.8% |
| Visual & Performing Arts | 9 | 4.8% |
| Communications | 6 | 3.2% |
| Arts & Humanities | 9 | 4.8% |
| Total | 188 | 100.0% |
Transportation & Commute in West Brownsville borough
Vehicle Availability by Sex in West Brownsville borough
The most prevalent vehicle ownership categories in West Brownsville borough are males with 2 vehicles (145, accounting for 51.2%) and females with 2 vehicles (118, making up 52.7%).
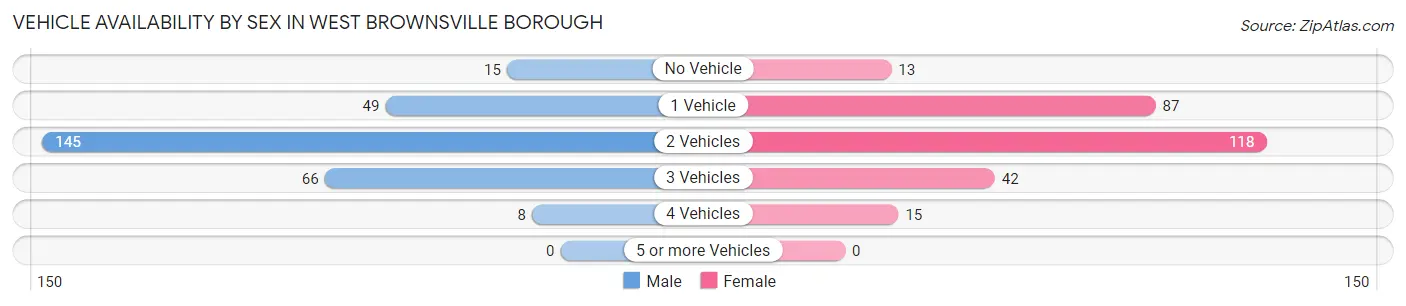
| Vehicles Available | Male | Female |
| No Vehicle | 15 (5.3%) | 13 (4.7%) |
| 1 Vehicle | 49 (17.3%) | 87 (31.6%) |
| 2 Vehicles | 145 (51.2%) | 118 (42.9%) |
| 3 Vehicles | 66 (23.3%) | 42 (15.3%) |
| 4 Vehicles | 8 (2.8%) | 15 (5.4%) |
| 5 or more Vehicles | 0 (0.0%) | 0 (0.0%) |
| Total | 283 (100.0%) | 275 (100.0%) |
Commute Time in West Brownsville borough
The most frequently occuring commute durations in West Brownsville borough are 5 to 9 minutes (120 commuters, 23.4%), 25 to 29 minutes (55 commuters, 10.7%), and 10 to 14 minutes (54 commuters, 10.5%).
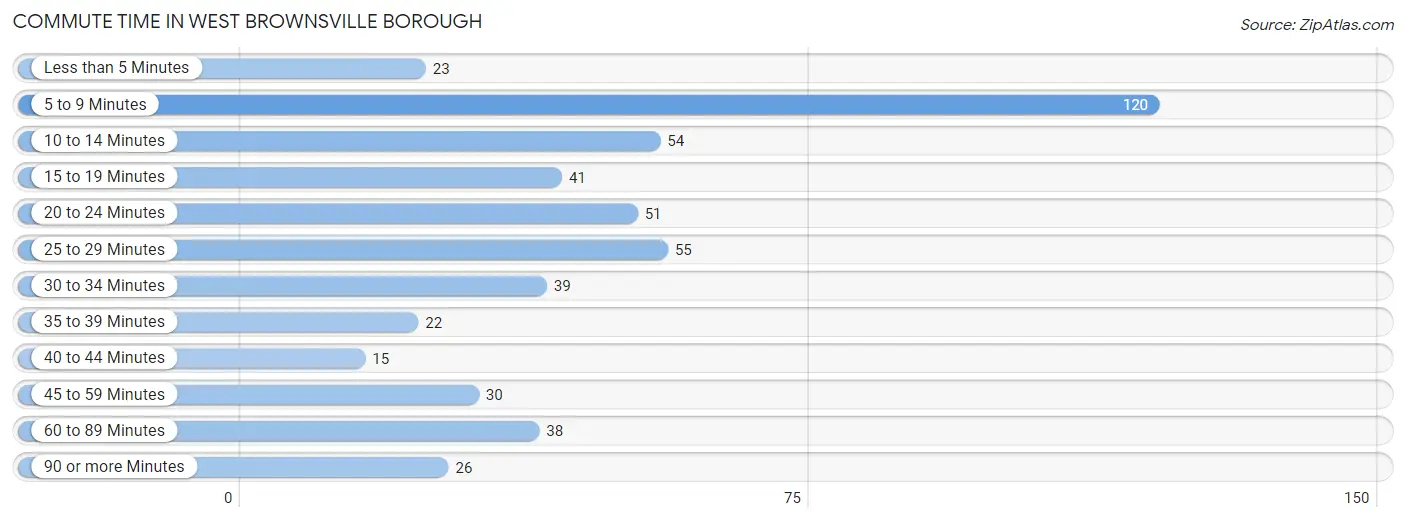
| Commute Time | # Commuters | % Commuters |
| Less than 5 Minutes | 23 | 4.5% |
| 5 to 9 Minutes | 120 | 23.4% |
| 10 to 14 Minutes | 54 | 10.5% |
| 15 to 19 Minutes | 41 | 8.0% |
| 20 to 24 Minutes | 51 | 9.9% |
| 25 to 29 Minutes | 55 | 10.7% |
| 30 to 34 Minutes | 39 | 7.6% |
| 35 to 39 Minutes | 22 | 4.3% |
| 40 to 44 Minutes | 15 | 2.9% |
| 45 to 59 Minutes | 30 | 5.8% |
| 60 to 89 Minutes | 38 | 7.4% |
| 90 or more Minutes | 26 | 5.1% |
Commute Time by Sex in West Brownsville borough
The most common commute times in West Brownsville borough are 25 to 29 minutes (51 commuters, 19.3%) for males and 5 to 9 minutes (78 commuters, 31.2%) for females.
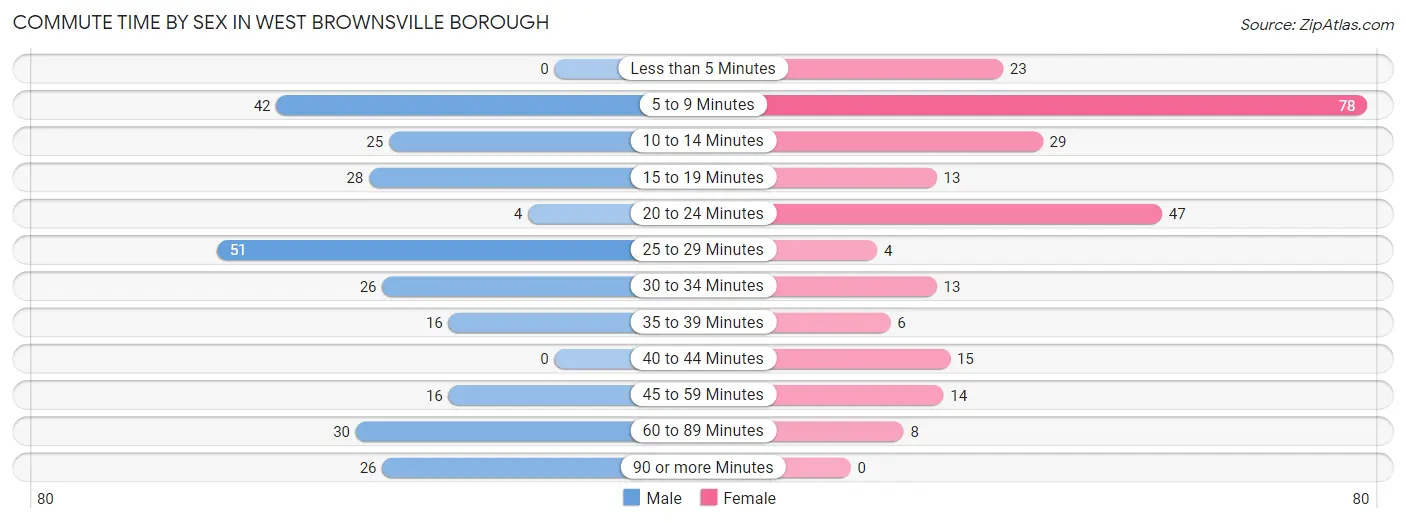
| Commute Time | Male | Female |
| Less than 5 Minutes | 0 (0.0%) | 23 (9.2%) |
| 5 to 9 Minutes | 42 (15.9%) | 78 (31.2%) |
| 10 to 14 Minutes | 25 (9.5%) | 29 (11.6%) |
| 15 to 19 Minutes | 28 (10.6%) | 13 (5.2%) |
| 20 to 24 Minutes | 4 (1.5%) | 47 (18.8%) |
| 25 to 29 Minutes | 51 (19.3%) | 4 (1.6%) |
| 30 to 34 Minutes | 26 (9.9%) | 13 (5.2%) |
| 35 to 39 Minutes | 16 (6.1%) | 6 (2.4%) |
| 40 to 44 Minutes | 0 (0.0%) | 15 (6.0%) |
| 45 to 59 Minutes | 16 (6.1%) | 14 (5.6%) |
| 60 to 89 Minutes | 30 (11.4%) | 8 (3.2%) |
| 90 or more Minutes | 26 (9.9%) | 0 (0.0%) |
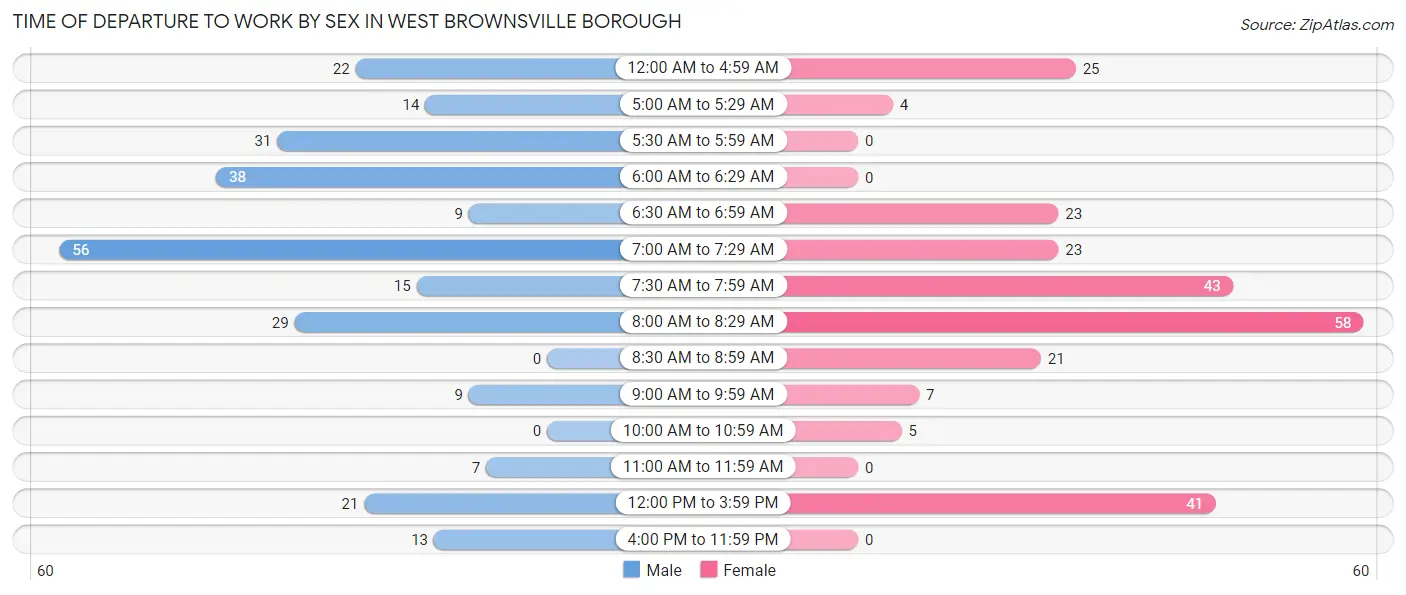
Time of Departure to Work by Sex in West Brownsville borough
The most frequent times of departure to work in West Brownsville borough are 7:00 AM to 7:29 AM (56, 21.2%) for males and 8:00 AM to 8:29 AM (58, 23.2%) for females.
| Time of Departure | Male | Female |
| 12:00 AM to 4:59 AM | 22 (8.3%) | 25 (10.0%) |
| 5:00 AM to 5:29 AM | 14 (5.3%) | 4 (1.6%) |
| 5:30 AM to 5:59 AM | 31 (11.7%) | 0 (0.0%) |
| 6:00 AM to 6:29 AM | 38 (14.4%) | 0 (0.0%) |
| 6:30 AM to 6:59 AM | 9 (3.4%) | 23 (9.2%) |
| 7:00 AM to 7:29 AM | 56 (21.2%) | 23 (9.2%) |
| 7:30 AM to 7:59 AM | 15 (5.7%) | 43 (17.2%) |
| 8:00 AM to 8:29 AM | 29 (11.0%) | 58 (23.2%) |
| 8:30 AM to 8:59 AM | 0 (0.0%) | 21 (8.4%) |
| 9:00 AM to 9:59 AM | 9 (3.4%) | 7 (2.8%) |
| 10:00 AM to 10:59 AM | 0 (0.0%) | 5 (2.0%) |
| 11:00 AM to 11:59 AM | 7 (2.6%) | 0 (0.0%) |
| 12:00 PM to 3:59 PM | 21 (8.0%) | 41 (16.4%) |
| 4:00 PM to 11:59 PM | 13 (4.9%) | 0 (0.0%) |
| Total | 264 (100.0%) | 250 (100.0%) |
Housing Occupancy in West Brownsville borough
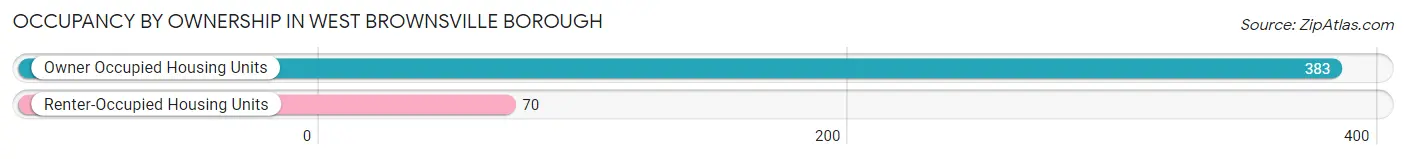
Occupancy by Ownership in West Brownsville borough
Of the total 453 dwellings in West Brownsville borough, owner-occupied units account for 383 (84.6%), while renter-occupied units make up 70 (15.4%).
| Occupancy | # Housing Units | % Housing Units |
| Owner Occupied Housing Units | 383 | 84.6% |
| Renter-Occupied Housing Units | 70 | 15.4% |
| Total Occupied Housing Units | 453 | 100.0% |
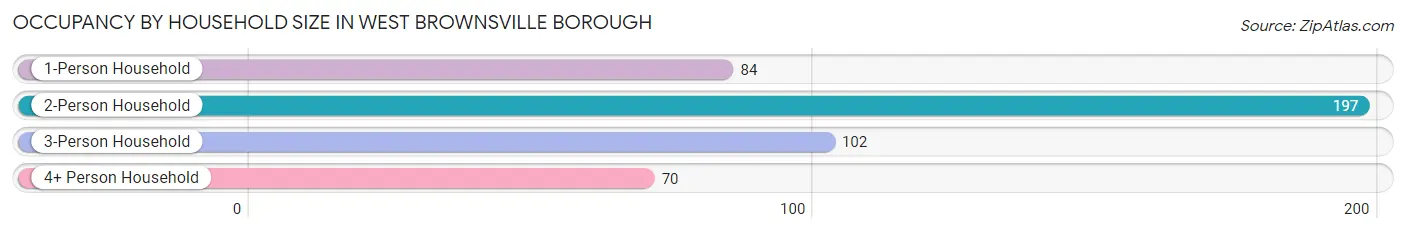
Occupancy by Household Size in West Brownsville borough
| Household Size | # Housing Units | % Housing Units |
| 1-Person Household | 84 | 18.5% |
| 2-Person Household | 197 | 43.5% |
| 3-Person Household | 102 | 22.5% |
| 4+ Person Household | 70 | 15.4% |
| Total Housing Units | 453 | 100.0% |
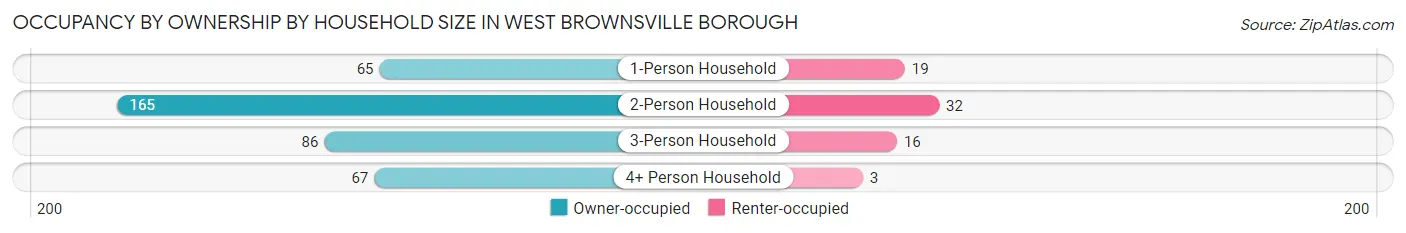
Occupancy by Ownership by Household Size in West Brownsville borough
| Household Size | Owner-occupied | Renter-occupied |
| 1-Person Household | 65 (77.4%) | 19 (22.6%) |
| 2-Person Household | 165 (83.8%) | 32 (16.2%) |
| 3-Person Household | 86 (84.3%) | 16 (15.7%) |
| 4+ Person Household | 67 (95.7%) | 3 (4.3%) |
| Total Housing Units | 383 (84.6%) | 70 (15.4%) |
Occupancy by Educational Attainment in West Brownsville borough
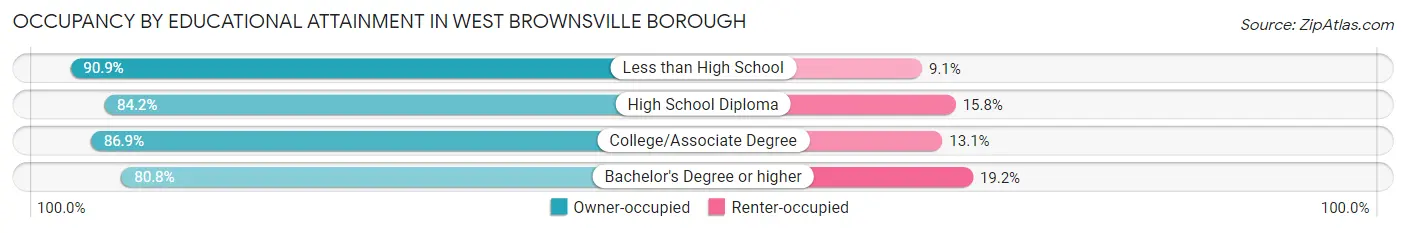
| Household Size | Owner-occupied | Renter-occupied |
| Less than High School | 30 (90.9%) | 3 (9.1%) |
| High School Diploma | 187 (84.2%) | 35 (15.8%) |
| College/Associate Degree | 86 (86.9%) | 13 (13.1%) |
| Bachelor's Degree or higher | 80 (80.8%) | 19 (19.2%) |
Occupancy by Age of Householder in West Brownsville borough
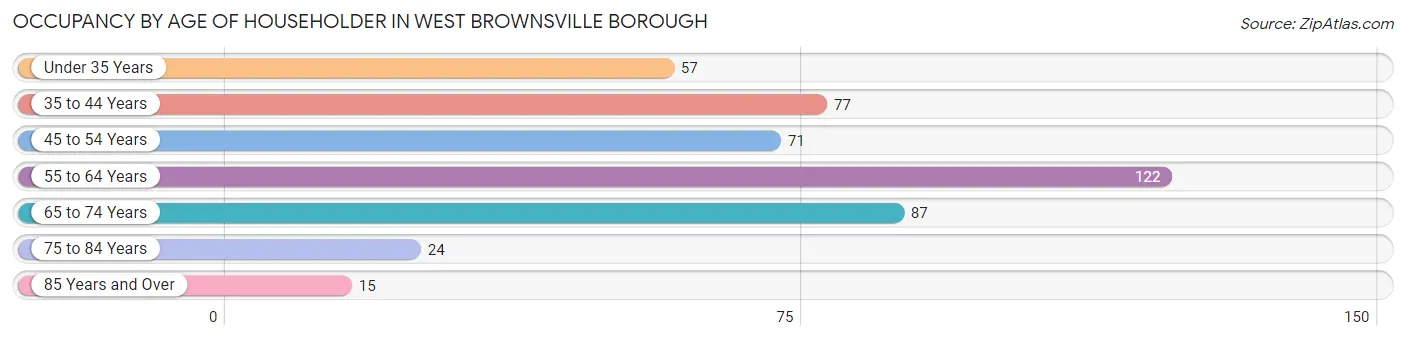
| Age Bracket | # Households | % Households |
| Under 35 Years | 57 | 12.6% |
| 35 to 44 Years | 77 | 17.0% |
| 45 to 54 Years | 71 | 15.7% |
| 55 to 64 Years | 122 | 26.9% |
| 65 to 74 Years | 87 | 19.2% |
| 75 to 84 Years | 24 | 5.3% |
| 85 Years and Over | 15 | 3.3% |
| Total | 453 | 100.0% |
Housing Finances in West Brownsville borough
Median Income by Occupancy in West Brownsville borough
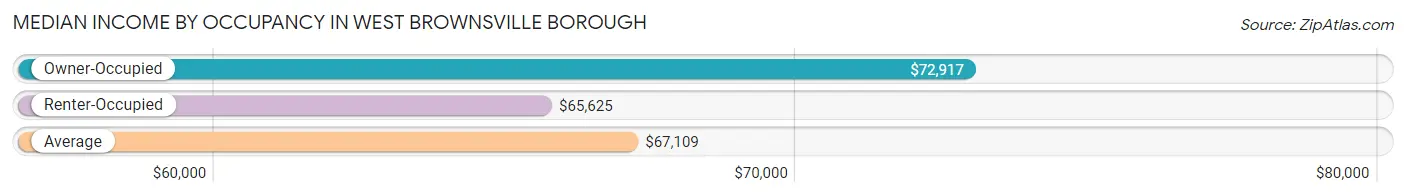
| Occupancy Type | # Households | Median Income |
| Owner-Occupied | 383 (84.6%) | $72,917 |
| Renter-Occupied | 70 (15.4%) | $65,625 |
| Average | 453 (100.0%) | $67,109 |
Occupancy by Householder Income Bracket in West Brownsville borough
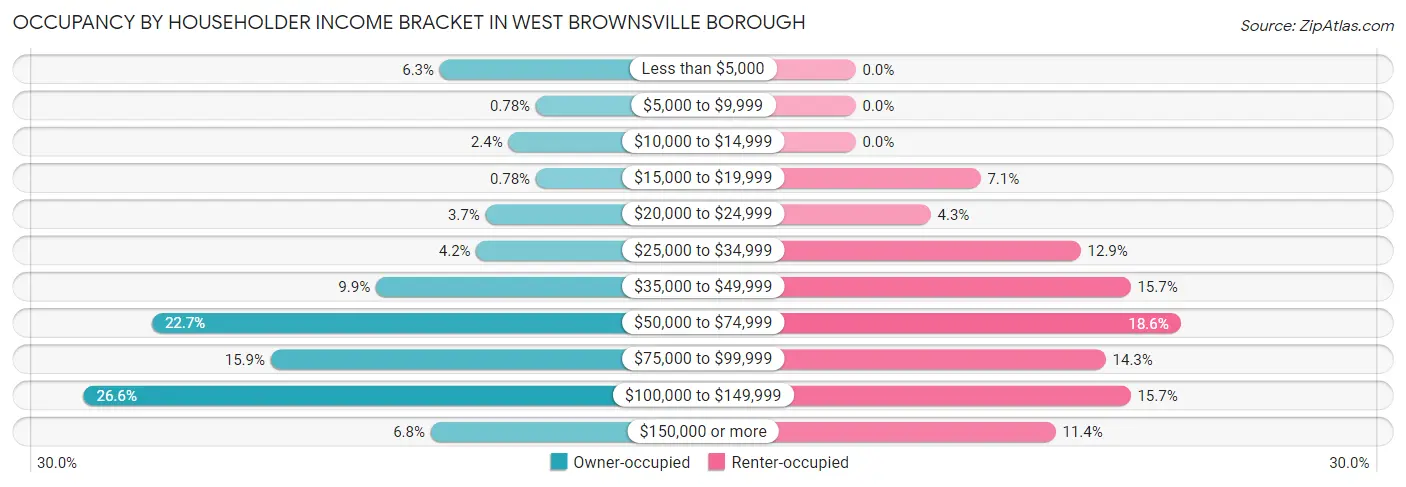
| Income Bracket | Owner-occupied | Renter-occupied |
| Less than $5,000 | 24 (6.3%) | 0 (0.0%) |
| $5,000 to $9,999 | 3 (0.8%) | 0 (0.0%) |
| $10,000 to $14,999 | 9 (2.4%) | 0 (0.0%) |
| $15,000 to $19,999 | 3 (0.8%) | 5 (7.1%) |
| $20,000 to $24,999 | 14 (3.7%) | 3 (4.3%) |
| $25,000 to $34,999 | 16 (4.2%) | 9 (12.9%) |
| $35,000 to $49,999 | 38 (9.9%) | 11 (15.7%) |
| $50,000 to $74,999 | 87 (22.7%) | 13 (18.6%) |
| $75,000 to $99,999 | 61 (15.9%) | 10 (14.3%) |
| $100,000 to $149,999 | 102 (26.6%) | 11 (15.7%) |
| $150,000 or more | 26 (6.8%) | 8 (11.4%) |
| Total | 383 (100.0%) | 70 (100.0%) |
Monthly Housing Cost Tiers in West Brownsville borough
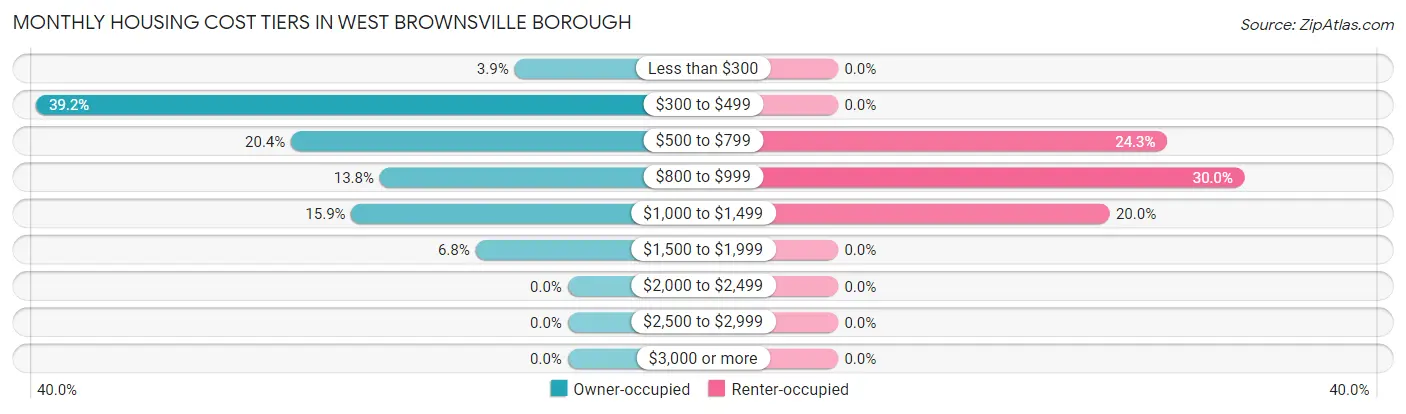
| Monthly Cost | Owner-occupied | Renter-occupied |
| Less than $300 | 15 (3.9%) | 0 (0.0%) |
| $300 to $499 | 150 (39.2%) | 0 (0.0%) |
| $500 to $799 | 78 (20.4%) | 17 (24.3%) |
| $800 to $999 | 53 (13.8%) | 21 (30.0%) |
| $1,000 to $1,499 | 61 (15.9%) | 14 (20.0%) |
| $1,500 to $1,999 | 26 (6.8%) | 0 (0.0%) |
| $2,000 to $2,499 | 0 (0.0%) | 0 (0.0%) |
| $2,500 to $2,999 | 0 (0.0%) | 0 (0.0%) |
| $3,000 or more | 0 (0.0%) | 0 (0.0%) |
| Total | 383 (100.0%) | 70 (100.0%) |
Physical Housing Characteristics in West Brownsville borough
Housing Structures in West Brownsville borough
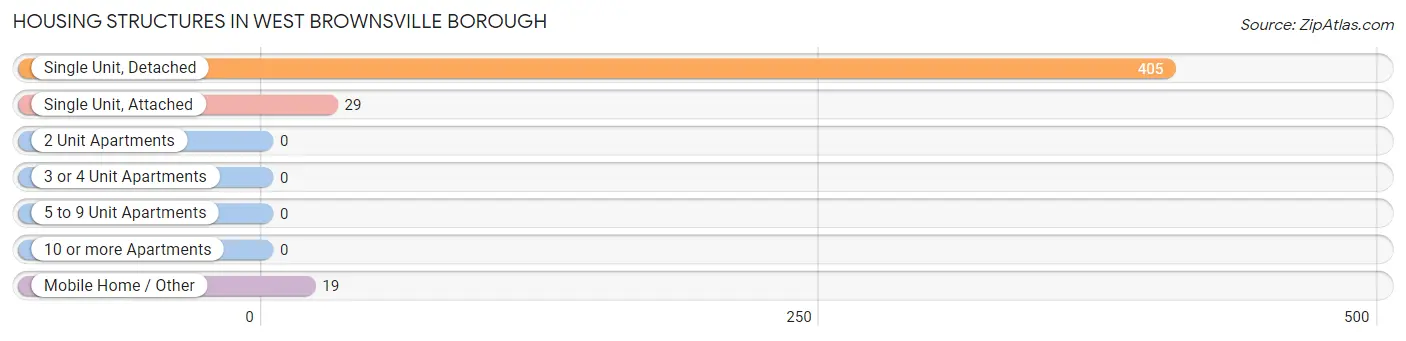
| Structure Type | # Housing Units | % Housing Units |
| Single Unit, Detached | 405 | 89.4% |
| Single Unit, Attached | 29 | 6.4% |
| 2 Unit Apartments | 0 | 0.0% |
| 3 or 4 Unit Apartments | 0 | 0.0% |
| 5 to 9 Unit Apartments | 0 | 0.0% |
| 10 or more Apartments | 0 | 0.0% |
| Mobile Home / Other | 19 | 4.2% |
| Total | 453 | 100.0% |
Housing Structures by Occupancy in West Brownsville borough
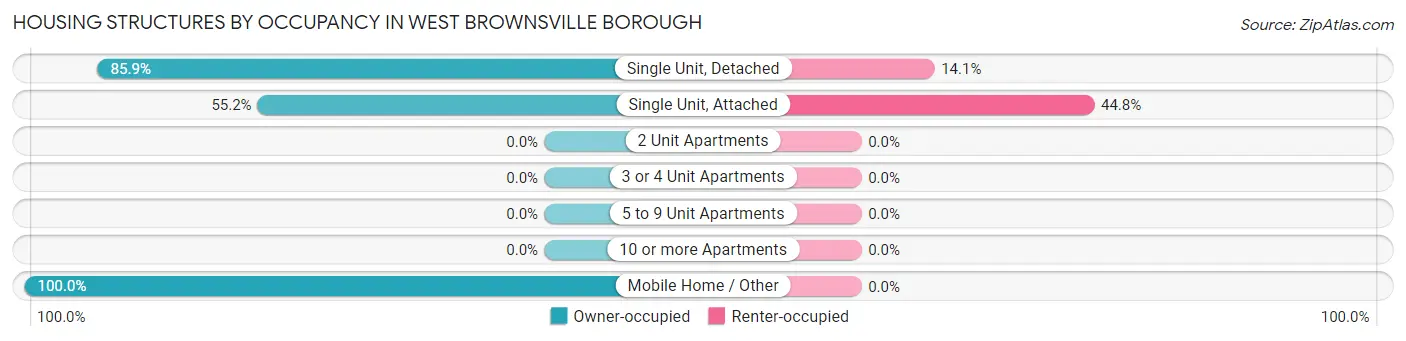
| Structure Type | Owner-occupied | Renter-occupied |
| Single Unit, Detached | 348 (85.9%) | 57 (14.1%) |
| Single Unit, Attached | 16 (55.2%) | 13 (44.8%) |
| 2 Unit Apartments | 0 (0.0%) | 0 (0.0%) |
| 3 or 4 Unit Apartments | 0 (0.0%) | 0 (0.0%) |
| 5 to 9 Unit Apartments | 0 (0.0%) | 0 (0.0%) |
| 10 or more Apartments | 0 (0.0%) | 0 (0.0%) |
| Mobile Home / Other | 19 (100.0%) | 0 (0.0%) |
| Total | 383 (84.6%) | 70 (15.4%) |
Housing Structures by Number of Rooms in West Brownsville borough
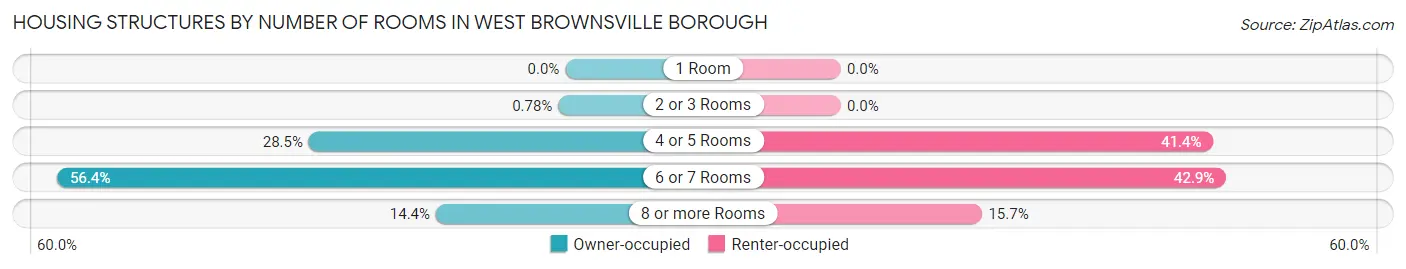
| Number of Rooms | Owner-occupied | Renter-occupied |
| 1 Room | 0 (0.0%) | 0 (0.0%) |
| 2 or 3 Rooms | 3 (0.8%) | 0 (0.0%) |
| 4 or 5 Rooms | 109 (28.5%) | 29 (41.4%) |
| 6 or 7 Rooms | 216 (56.4%) | 30 (42.9%) |
| 8 or more Rooms | 55 (14.4%) | 11 (15.7%) |
| Total | 383 (100.0%) | 70 (100.0%) |
Housing Structure by Heating Type in West Brownsville borough
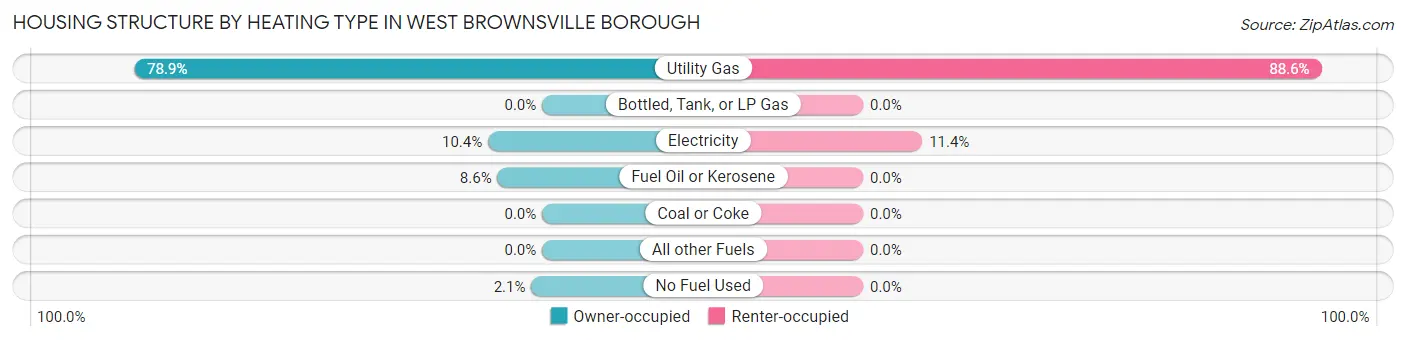
| Heating Type | Owner-occupied | Renter-occupied |
| Utility Gas | 302 (78.8%) | 62 (88.6%) |
| Bottled, Tank, or LP Gas | 0 (0.0%) | 0 (0.0%) |
| Electricity | 40 (10.4%) | 8 (11.4%) |
| Fuel Oil or Kerosene | 33 (8.6%) | 0 (0.0%) |
| Coal or Coke | 0 (0.0%) | 0 (0.0%) |
| All other Fuels | 0 (0.0%) | 0 (0.0%) |
| No Fuel Used | 8 (2.1%) | 0 (0.0%) |
| Total | 383 (100.0%) | 70 (100.0%) |
Household Vehicle Usage in West Brownsville borough
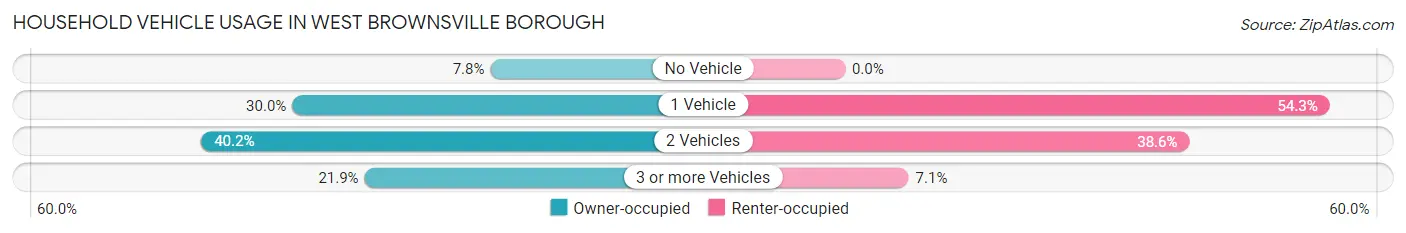
| Vehicles per Household | Owner-occupied | Renter-occupied |
| No Vehicle | 30 (7.8%) | 0 (0.0%) |
| 1 Vehicle | 115 (30.0%) | 38 (54.3%) |
| 2 Vehicles | 154 (40.2%) | 27 (38.6%) |
| 3 or more Vehicles | 84 (21.9%) | 5 (7.1%) |
| Total | 383 (100.0%) | 70 (100.0%) |
Real Estate & Mortgages in West Brownsville borough
Real Estate and Mortgage Overview in West Brownsville borough
| Characteristic | Without Mortgage | With Mortgage |
| Housing Units | 237 | 146 |
| Median Property Value | $65,800 | $98,600 |
| Median Household Income | $63,281 | $13 |
| Monthly Housing Costs | $461 | $0 |
| Real Estate Taxes | $917 | $10 |
Property Value by Mortgage Status in West Brownsville borough
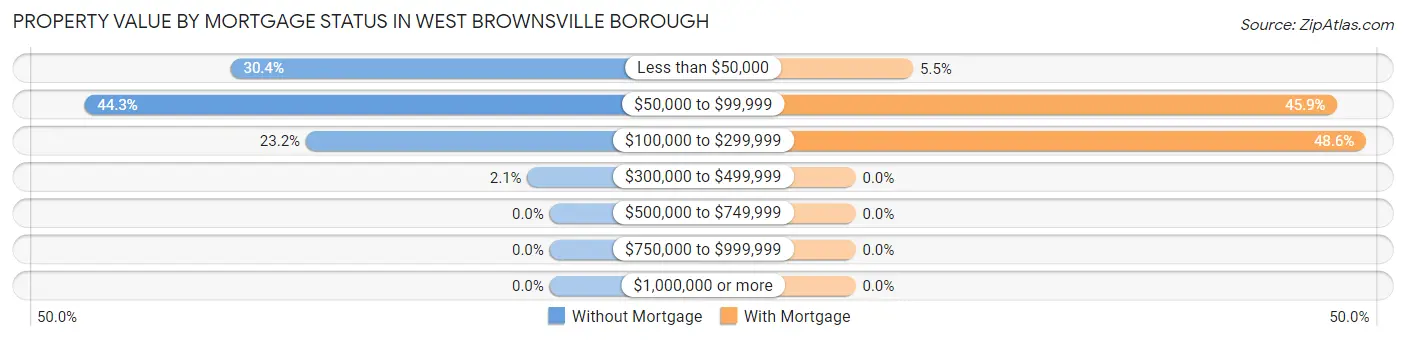
| Property Value | Without Mortgage | With Mortgage |
| Less than $50,000 | 72 (30.4%) | 8 (5.5%) |
| $50,000 to $99,999 | 105 (44.3%) | 67 (45.9%) |
| $100,000 to $299,999 | 55 (23.2%) | 71 (48.6%) |
| $300,000 to $499,999 | 5 (2.1%) | 0 (0.0%) |
| $500,000 to $749,999 | 0 (0.0%) | 0 (0.0%) |
| $750,000 to $999,999 | 0 (0.0%) | 0 (0.0%) |
| $1,000,000 or more | 0 (0.0%) | 0 (0.0%) |
| Total | 237 (100.0%) | 146 (100.0%) |
Household Income by Mortgage Status in West Brownsville borough
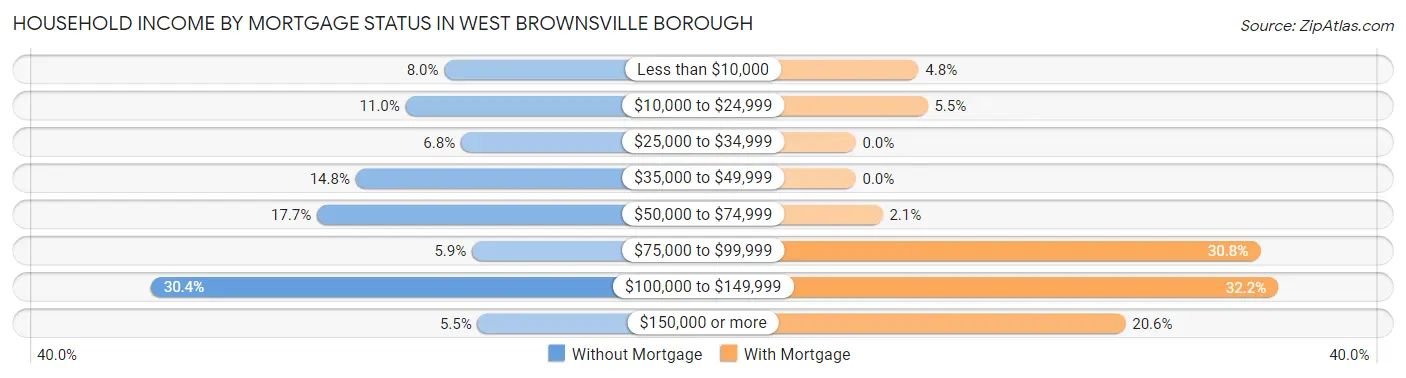
| Household Income | Without Mortgage | With Mortgage |
| Less than $10,000 | 19 (8.0%) | 7 (4.8%) |
| $10,000 to $24,999 | 26 (11.0%) | 8 (5.5%) |
| $25,000 to $34,999 | 16 (6.8%) | 0 (0.0%) |
| $35,000 to $49,999 | 35 (14.8%) | 0 (0.0%) |
| $50,000 to $74,999 | 42 (17.7%) | 3 (2.1%) |
| $75,000 to $99,999 | 14 (5.9%) | 45 (30.8%) |
| $100,000 to $149,999 | 72 (30.4%) | 47 (32.2%) |
| $150,000 or more | 13 (5.5%) | 30 (20.5%) |
| Total | 237 (100.0%) | 146 (100.0%) |
Property Value to Household Income Ratio in West Brownsville borough
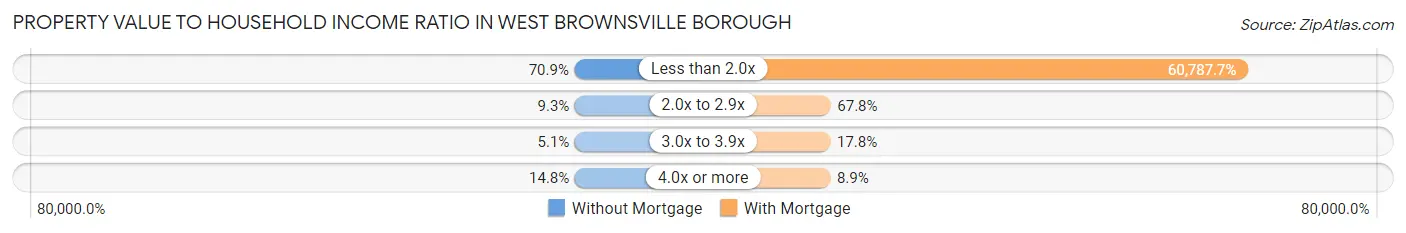
| Value-to-Income Ratio | Without Mortgage | With Mortgage |
| Less than 2.0x | 168 (70.9%) | 88,750 (60,787.7%) |
| 2.0x to 2.9x | 22 (9.3%) | 99 (67.8%) |
| 3.0x to 3.9x | 12 (5.1%) | 26 (17.8%) |
| 4.0x or more | 35 (14.8%) | 13 (8.9%) |
| Total | 237 (100.0%) | 146 (100.0%) |
Real Estate Taxes by Mortgage Status in West Brownsville borough
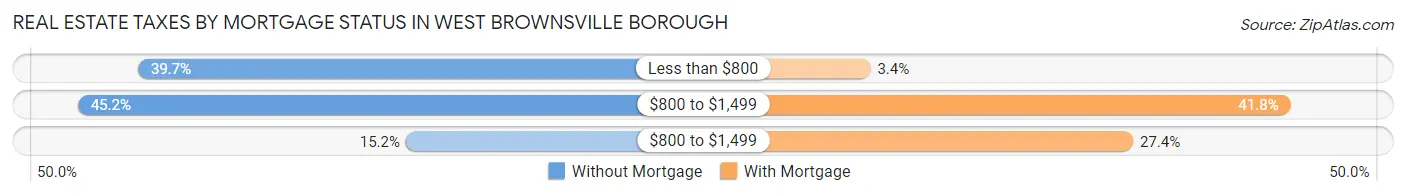
| Property Taxes | Without Mortgage | With Mortgage |
| Less than $800 | 94 (39.7%) | 5 (3.4%) |
| $800 to $1,499 | 107 (45.2%) | 61 (41.8%) |
| $800 to $1,499 | 36 (15.2%) | 40 (27.4%) |
| Total | 237 (100.0%) | 146 (100.0%) |
Health & Disability in West Brownsville borough
Health Insurance Coverage by Age in West Brownsville borough
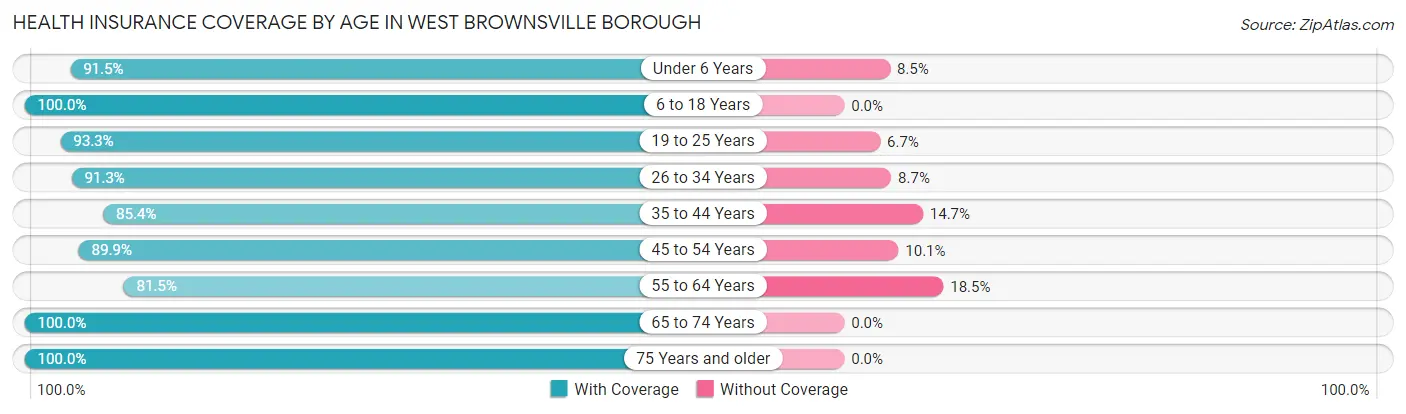
| Age Bracket | With Coverage | Without Coverage |
| Under 6 Years | 43 (91.5%) | 4 (8.5%) |
| 6 to 18 Years | 177 (100.0%) | 0 (0.0%) |
| 19 to 25 Years | 42 (93.3%) | 3 (6.7%) |
| 26 to 34 Years | 94 (91.3%) | 9 (8.7%) |
| 35 to 44 Years | 169 (85.4%) | 29 (14.6%) |
| 45 to 54 Years | 116 (89.9%) | 13 (10.1%) |
| 55 to 64 Years | 159 (81.5%) | 36 (18.5%) |
| 65 to 74 Years | 137 (100.0%) | 0 (0.0%) |
| 75 Years and older | 60 (100.0%) | 0 (0.0%) |
| Total | 997 (91.4%) | 94 (8.6%) |
Health Insurance Coverage by Citizenship Status in West Brownsville borough
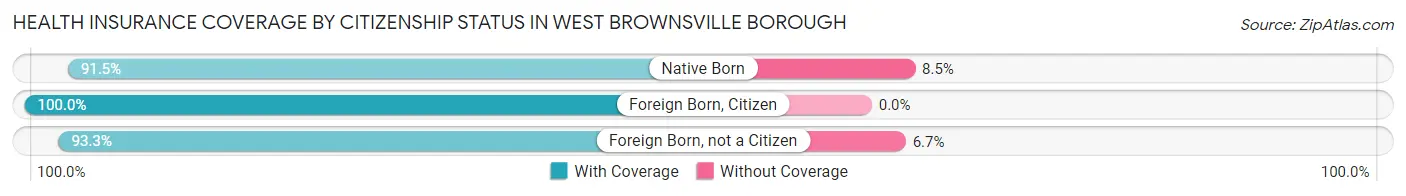
| Citizenship Status | With Coverage | Without Coverage |
| Native Born | 43 (91.5%) | 4 (8.5%) |
| Foreign Born, Citizen | 177 (100.0%) | 0 (0.0%) |
| Foreign Born, not a Citizen | 42 (93.3%) | 3 (6.7%) |
Health Insurance Coverage by Household Income in West Brownsville borough
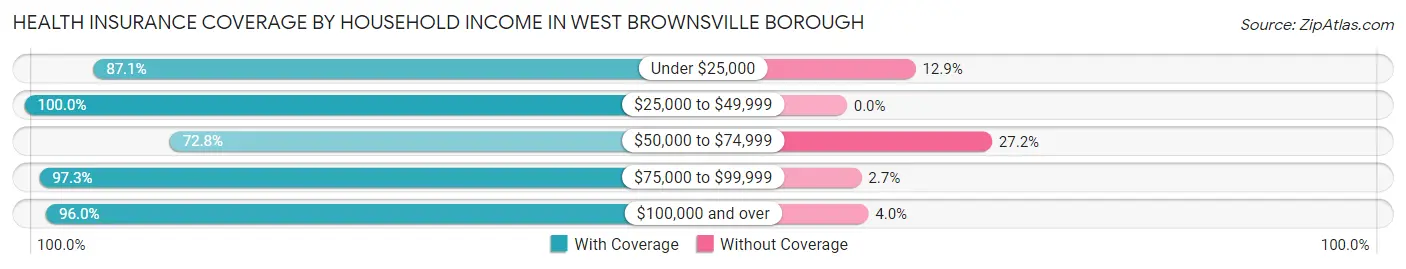
| Household Income | With Coverage | Without Coverage |
| Under $25,000 | 88 (87.1%) | 13 (12.9%) |
| $25,000 to $49,999 | 158 (100.0%) | 0 (0.0%) |
| $50,000 to $74,999 | 158 (72.8%) | 59 (27.2%) |
| $75,000 to $99,999 | 213 (97.3%) | 6 (2.7%) |
| $100,000 and over | 380 (96.0%) | 16 (4.0%) |
Public vs Private Health Insurance Coverage by Age in West Brownsville borough
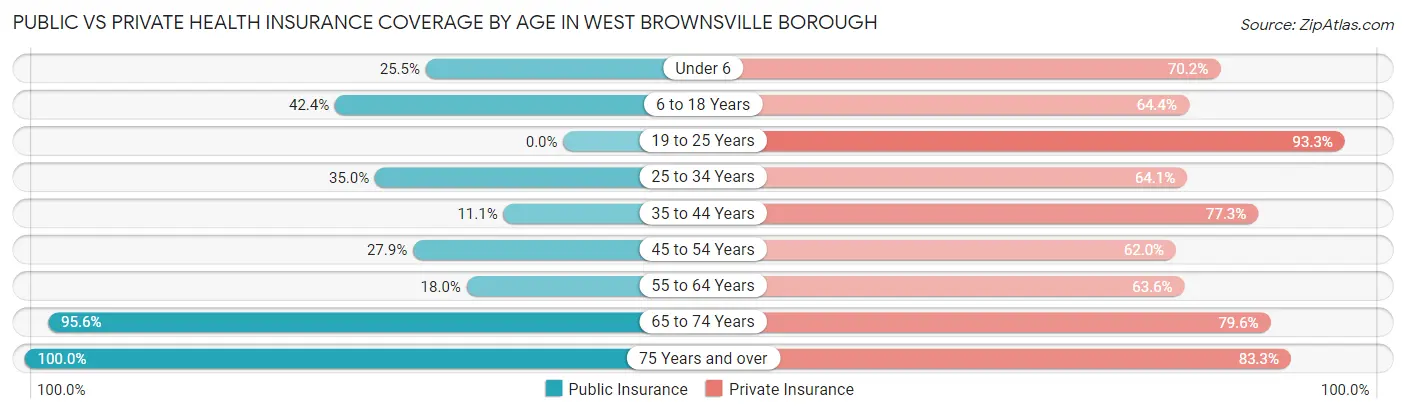
| Age Bracket | Public Insurance | Private Insurance |
| Under 6 | 12 (25.5%) | 33 (70.2%) |
| 6 to 18 Years | 75 (42.4%) | 114 (64.4%) |
| 19 to 25 Years | 0 (0.0%) | 42 (93.3%) |
| 25 to 34 Years | 36 (34.9%) | 66 (64.1%) |
| 35 to 44 Years | 22 (11.1%) | 153 (77.3%) |
| 45 to 54 Years | 36 (27.9%) | 80 (62.0%) |
| 55 to 64 Years | 35 (17.9%) | 124 (63.6%) |
| 65 to 74 Years | 131 (95.6%) | 109 (79.6%) |
| 75 Years and over | 60 (100.0%) | 50 (83.3%) |
| Total | 407 (37.3%) | 771 (70.7%) |
Disability Status by Sex by Age in West Brownsville borough
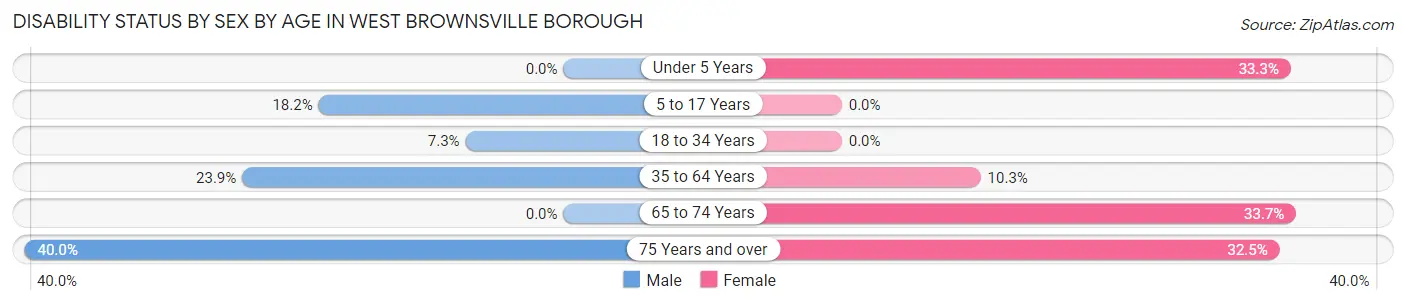
| Age Bracket | Male | Female |
| Under 5 Years | 0 (0.0%) | 5 (33.3%) |
| 5 to 17 Years | 10 (18.2%) | 0 (0.0%) |
| 18 to 34 Years | 4 (7.3%) | 0 (0.0%) |
| 35 to 64 Years | 62 (23.8%) | 27 (10.3%) |
| 65 to 74 Years | 0 (0.0%) | 28 (33.7%) |
| 75 Years and over | 8 (40.0%) | 13 (32.5%) |
Disability Class by Sex by Age in West Brownsville borough
Disability Class: Hearing Difficulty
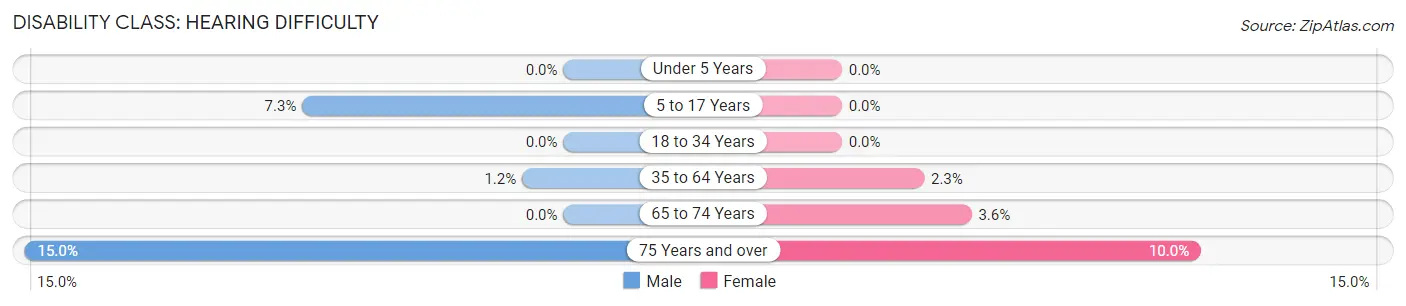
| Age Bracket | Male | Female |
| Under 5 Years | 0 (0.0%) | 0 (0.0%) |
| 5 to 17 Years | 4 (7.3%) | 0 (0.0%) |
| 18 to 34 Years | 0 (0.0%) | 0 (0.0%) |
| 35 to 64 Years | 3 (1.1%) | 6 (2.3%) |
| 65 to 74 Years | 0 (0.0%) | 3 (3.6%) |
| 75 Years and over | 3 (15.0%) | 4 (10.0%) |
Disability Class: Vision Difficulty
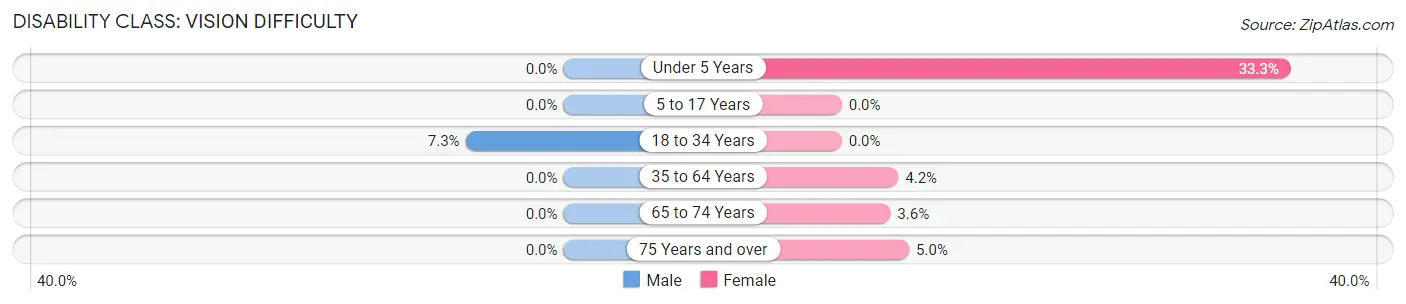
| Age Bracket | Male | Female |
| Under 5 Years | 0 (0.0%) | 5 (33.3%) |
| 5 to 17 Years | 0 (0.0%) | 0 (0.0%) |
| 18 to 34 Years | 4 (7.3%) | 0 (0.0%) |
| 35 to 64 Years | 0 (0.0%) | 11 (4.2%) |
| 65 to 74 Years | 0 (0.0%) | 3 (3.6%) |
| 75 Years and over | 0 (0.0%) | 2 (5.0%) |
Disability Class: Cognitive Difficulty
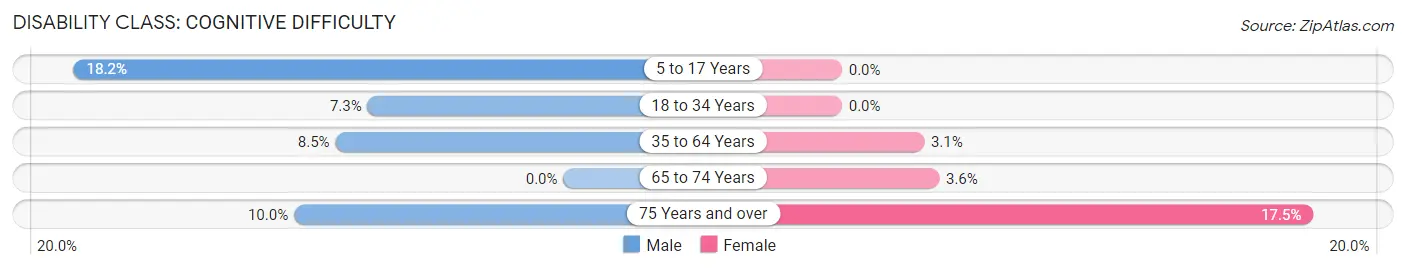
| Age Bracket | Male | Female |
| 5 to 17 Years | 10 (18.2%) | 0 (0.0%) |
| 18 to 34 Years | 4 (7.3%) | 0 (0.0%) |
| 35 to 64 Years | 22 (8.5%) | 8 (3.0%) |
| 65 to 74 Years | 0 (0.0%) | 3 (3.6%) |
| 75 Years and over | 2 (10.0%) | 7 (17.5%) |
Disability Class: Ambulatory Difficulty
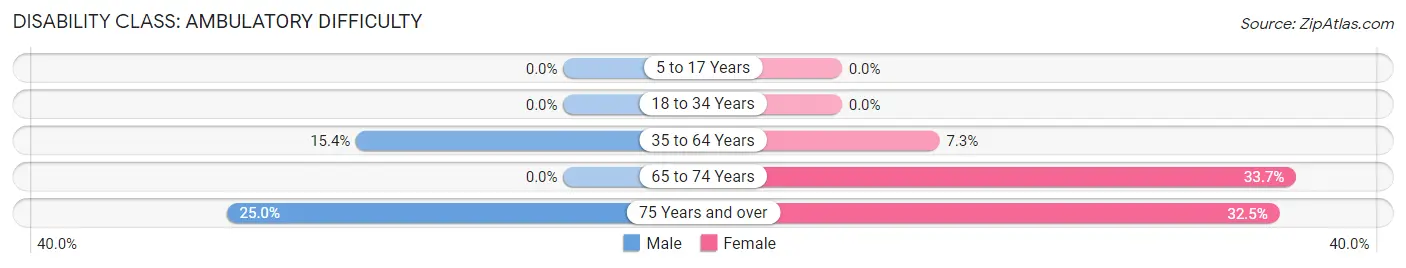
| Age Bracket | Male | Female |
| 5 to 17 Years | 0 (0.0%) | 0 (0.0%) |
| 18 to 34 Years | 0 (0.0%) | 0 (0.0%) |
| 35 to 64 Years | 40 (15.4%) | 19 (7.2%) |
| 65 to 74 Years | 0 (0.0%) | 28 (33.7%) |
| 75 Years and over | 5 (25.0%) | 13 (32.5%) |
Disability Class: Self-Care Difficulty
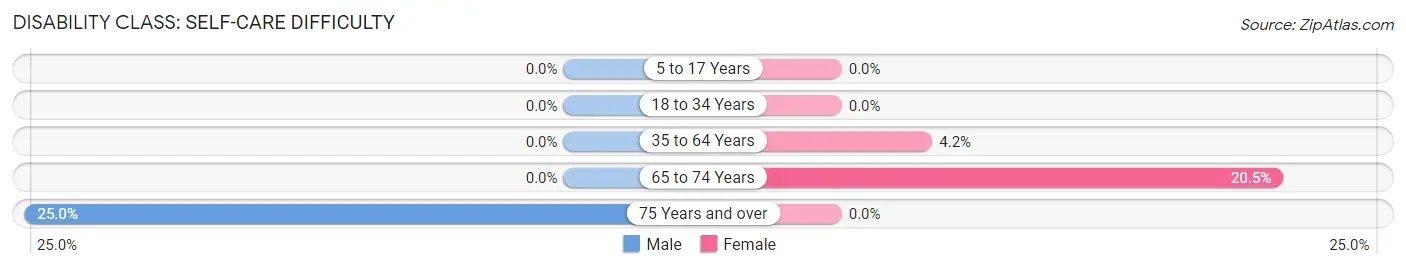
| Age Bracket | Male | Female |
| 5 to 17 Years | 0 (0.0%) | 0 (0.0%) |
| 18 to 34 Years | 0 (0.0%) | 0 (0.0%) |
| 35 to 64 Years | 0 (0.0%) | 11 (4.2%) |
| 65 to 74 Years | 0 (0.0%) | 17 (20.5%) |
| 75 Years and over | 5 (25.0%) | 0 (0.0%) |
Technology Access in West Brownsville borough
Computing Device Access in West Brownsville borough
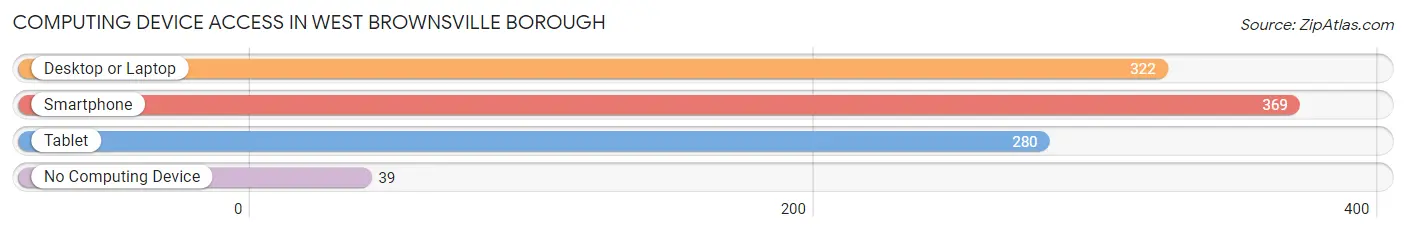
| Device Type | # Households | % Households |
| Desktop or Laptop | 322 | 71.1% |
| Smartphone | 369 | 81.5% |
| Tablet | 280 | 61.8% |
| No Computing Device | 39 | 8.6% |
| Total | 453 | 100.0% |
Internet Access in West Brownsville borough
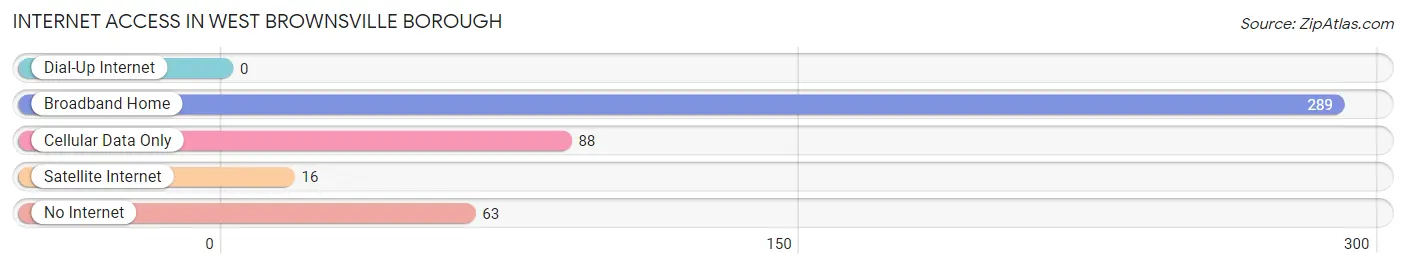
| Internet Type | # Households | % Households |
| Dial-Up Internet | 0 | 0.0% |
| Broadband Home | 289 | 63.8% |
| Cellular Data Only | 88 | 19.4% |
| Satellite Internet | 16 | 3.5% |
| No Internet | 63 | 13.9% |
| Total | 453 | 100.0% |
West Brownsville borough Summary
Brownsville Borough is a borough located in Fayette County, Pennsylvania, United States. The population was 2,919 at the 2010 census. It is part of the Pittsburgh Metropolitan Statistical Area.
History
The area that is now Brownsville Borough was first settled in 1785 by William Jack, a Revolutionary War veteran. The town was originally known as Redstone Old Fort, named after the nearby Redstone Creek. The town was later renamed Brownsville after Jacob Brown, a local landowner. The town was incorporated as a borough in 1831.
During the 19th century, Brownsville was a major transportation hub, with the National Road, the Pennsylvania Canal, and the Baltimore and Ohio Railroad all passing through the town. The town was also home to several iron and steel mills, which provided employment for many of the town's residents.
Geography
Brownsville Borough is located at 39 53 25 North 79 51 45 West 39 890278 79 862472
According to the United States Census Bureau, the borough has a total area of 1.2 square miles (3.1 km2), all of it land.
Demographics
As of the census of 2000, there were 3,072 people, 1,323 households, and 845 families residing in the borough. The population density was 2,541.2 people per square mile (982.2/km2). There were 1,457 housing units at an average density of 1,203.2 per square mile (465.2/km2). The racial makeup of the borough was 97.90% White, 0.90% African American, 0.13% Native American, 0.10% Asian, 0.03% Pacific Islander, 0.10% from other races, and 0.83% from two or more races. Hispanic or Latino of any race were 0.36% of the population.
There were 1,323 households, out of which 28.2% had children under the age of 18 living with them, 44.2% were married couples living together, 15.2% had a female householder with no husband present, and 36.2% were non-families. 32.2% of all households were made up of individuals, and 16.2% had someone living alone who was 65 years of age or older. The average household size was 2.31 and the average family size was 2.93.
In the borough the population was spread out, with 23.2% under the age of 18, 7.2% from 18 to 24, 27.2% from 25 to 44, 22.7% from 45 to 64, and 19.7% who were 65 years of age or older. The median age was 40 years. For every 100 females, there were 87.2 males. For every 100 females age 18 and over, there were 82.2 males.
The median income for a household in the borough was $25,938, and the median income for a family was $32,917. Males had a median income of $30,000 versus $20,917 for females. The per capita income for the borough was $14,945. About 14.2% of families and 17.2% of the population were below the poverty line, including 24.2% of those under age 18 and 11.2% of those age 65 or over.
Economy
Brownsville Borough is home to several businesses, including a number of small retail stores, restaurants, and service providers. The town is also home to a number of manufacturing companies, including a steel mill and a paper mill. The town is also home to a number of small businesses, including a number of antique stores.
The town is also home to a number of recreational facilities, including a golf course, a swimming pool, and a number of parks. The town is also home to a number of historic sites, including the Brownsville Historic District, which is listed on the National Register of Historic Places.
Conclusion
Brownsville Borough is a small borough located in Fayette County, Pennsylvania. The town has a long history, dating back to the late 18th century, and has been an important transportation hub since the 19th century. The town is home to a number of businesses, including a number of small retail stores, restaurants, and service providers. The town is also home to a number of manufacturing companies, including a steel mill and a paper mill. The town is also home to a number of recreational facilities, including a golf course, a swimming pool, and a number of parks. The town is also home to a number of historic sites, including the Brownsville Historic District, which is listed on the National Register of Historic Places.
Common Questions
What is Per Capita Income in West Brownsville borough?
Per Capita income in West Brownsville borough is $32,907.
What is the Median Family Income in West Brownsville borough?
Median Family Income in West Brownsville borough is $86,339.
What is the Median Household income in West Brownsville borough?
Median Household Income in West Brownsville borough is $67,109.
What is Income or Wage Gap in West Brownsville borough?
Income or Wage Gap in West Brownsville borough is 49.7%.
Women in West Brownsville borough earn 50.3 cents for every dollar earned by a man.
What is Inequality or Gini Index in West Brownsville borough?
Inequality or Gini Index in West Brownsville borough is 0.35.
What is the Total Population of West Brownsville borough?
Total Population of West Brownsville borough is 1,091.
What is the Total Male Population of West Brownsville borough?
Total Male Population of West Brownsville borough is 460.
What is the Total Female Population of West Brownsville borough?
Total Female Population of West Brownsville borough is 631.
What is the Ratio of Males per 100 Females in West Brownsville borough?
There are 72.90 Males per 100 Females in West Brownsville borough.
What is the Ratio of Females per 100 Males in West Brownsville borough?
There are 137.17 Females per 100 Males in West Brownsville borough.
What is the Median Population Age in West Brownsville borough?
Median Population Age in West Brownsville borough is 44.2 Years.
What is the Average Family Size in West Brownsville borough
Average Family Size in West Brownsville borough is 2.8 People.
What is the Average Household Size in West Brownsville borough
Average Household Size in West Brownsville borough is 2.4 People.
How Large is the Labor Force in West Brownsville borough?
There are 593 People in the Labor Forcein in West Brownsville borough.
What is the Percentage of People in the Labor Force in West Brownsville borough?
65.3% of People are in the Labor Force in West Brownsville borough.
What is the Unemployment Rate in West Brownsville borough?
Unemployment Rate in West Brownsville borough is 5.1%.