Ashland, OH Map & Demographics
Ashland Map
Ashland Overview
$28,100
PER CAPITA INCOME
$73,075
AVG FAMILY INCOME
$56,040
AVG HOUSEHOLD INCOME
31.8%
WAGE / INCOME GAP [ % ]
68.2¢/ $1
WAGE / INCOME GAP [ $ ]
$9,754
FAMILY INCOME DEFICIT
0.41
INEQUALITY / GINI INDEX
19,270
TOTAL POPULATION
9,337
MALE POPULATION
9,933
FEMALE POPULATION
94.00
MALES / 100 FEMALES
106.38
FEMALES / 100 MALES
38.8
MEDIAN AGE
3.0
AVG FAMILY SIZE
2.2
AVG HOUSEHOLD SIZE
9,706
LABOR FORCE [ PEOPLE ]
61.0%
PERCENT IN LABOR FORCE
3.8%
UNEMPLOYMENT RATE
Ashland Zip Codes
Income in Ashland
Income Overview in Ashland
Per Capita Income in Ashland is $28,100, while median incomes of families and households are $73,075 and $56,040 respectively.
| Characteristic | Number | Measure |
| Per Capita Income | 19,270 | $28,100 |
| Median Family Income | 4,374 | $73,075 |
| Mean Family Income | 4,374 | $83,935 |
| Median Household Income | 7,944 | $56,040 |
| Mean Household Income | 7,944 | $67,075 |
| Income Deficit | 4,374 | $9,754 |
| Wage / Income Gap (%) | 19,270 | 31.77% |
| Wage / Income Gap ($) | 19,270 | 68.23¢ per $1 |
| Gini / Inequality Index | 19,270 | 0.41 |
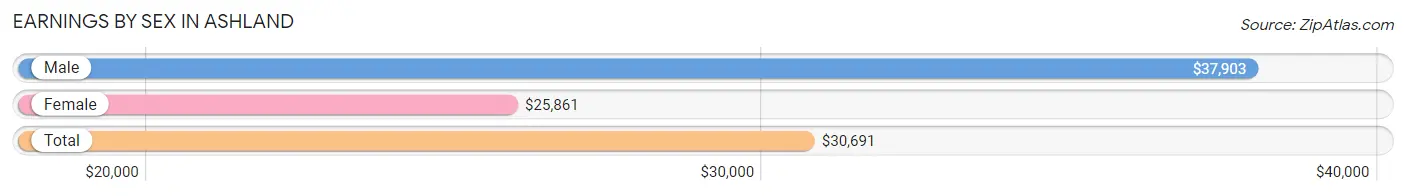
Earnings by Sex in Ashland
Average Earnings in Ashland are $30,691, $37,903 for men and $25,861 for women, a difference of 31.8%.
| Sex | Number | Average Earnings |
| Male | 5,207 (50.3%) | $37,903 |
| Female | 5,153 (49.7%) | $25,861 |
| Total | 10,360 (100.0%) | $30,691 |
Earnings by Sex by Income Bracket in Ashland
The most common earnings brackets in Ashland are $55,000 to $64,999 for men (682 | 13.1%) and $25,000 to $29,999 for women (551 | 10.7%).
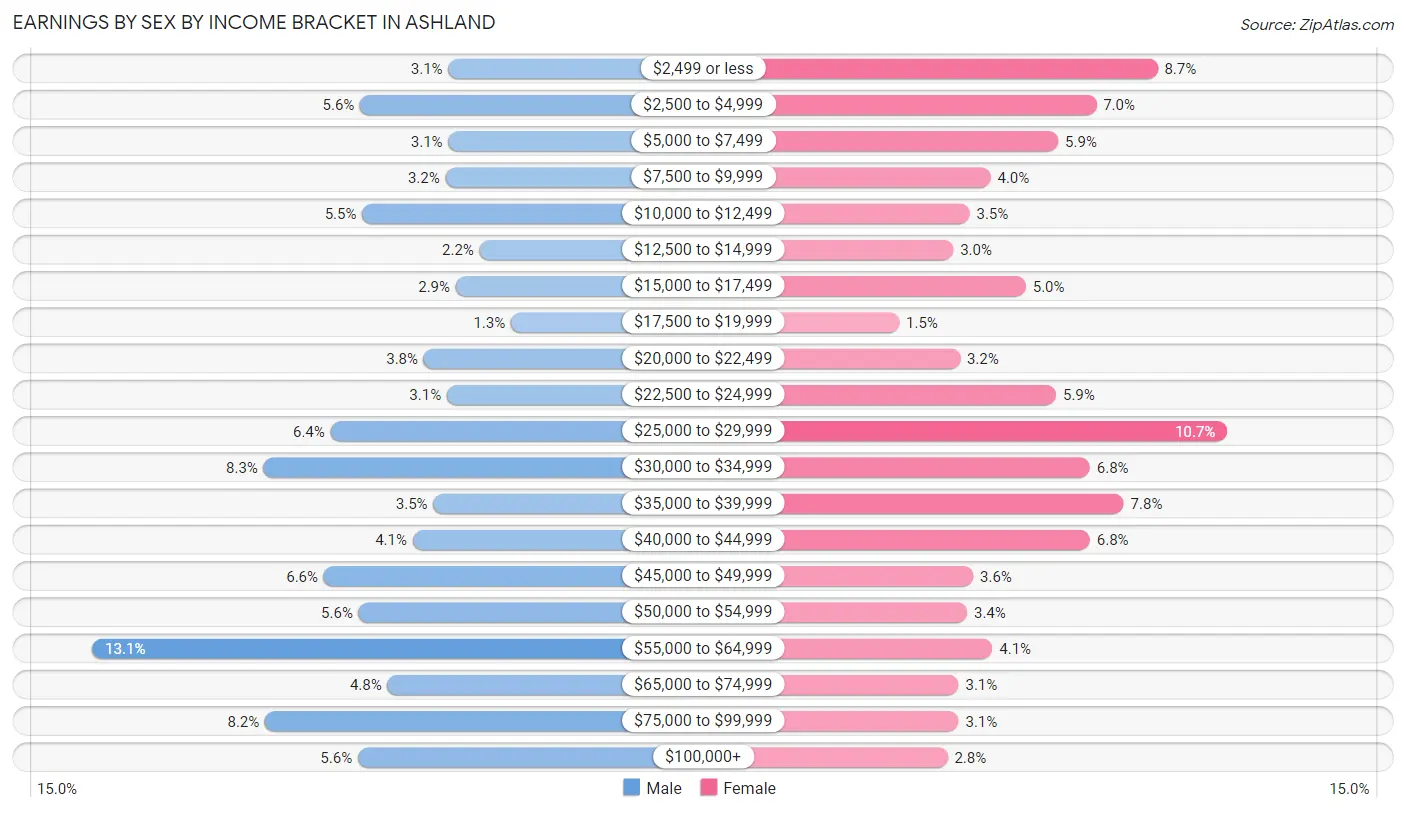
| Income | Male | Female |
| $2,499 or less | 161 (3.1%) | 450 (8.7%) |
| $2,500 to $4,999 | 290 (5.6%) | 361 (7.0%) |
| $5,000 to $7,499 | 161 (3.1%) | 306 (5.9%) |
| $7,500 to $9,999 | 165 (3.2%) | 208 (4.0%) |
| $10,000 to $12,499 | 287 (5.5%) | 178 (3.5%) |
| $12,500 to $14,999 | 115 (2.2%) | 154 (3.0%) |
| $15,000 to $17,499 | 150 (2.9%) | 259 (5.0%) |
| $17,500 to $19,999 | 69 (1.3%) | 76 (1.5%) |
| $20,000 to $22,499 | 197 (3.8%) | 164 (3.2%) |
| $22,500 to $24,999 | 163 (3.1%) | 303 (5.9%) |
| $25,000 to $29,999 | 333 (6.4%) | 551 (10.7%) |
| $30,000 to $34,999 | 431 (8.3%) | 352 (6.8%) |
| $35,000 to $39,999 | 183 (3.5%) | 401 (7.8%) |
| $40,000 to $44,999 | 213 (4.1%) | 352 (6.8%) |
| $45,000 to $49,999 | 343 (6.6%) | 183 (3.5%) |
| $50,000 to $54,999 | 292 (5.6%) | 174 (3.4%) |
| $55,000 to $64,999 | 682 (13.1%) | 211 (4.1%) |
| $65,000 to $74,999 | 250 (4.8%) | 162 (3.1%) |
| $75,000 to $99,999 | 429 (8.2%) | 162 (3.1%) |
| $100,000+ | 293 (5.6%) | 146 (2.8%) |
| Total | 5,207 (100.0%) | 5,153 (100.0%) |
Earnings by Sex by Educational Attainment in Ashland
Average earnings in Ashland are $47,215 for men and $33,188 for women, a difference of 29.7%. Men with an educational attainment of graduate degree enjoy the highest average annual earnings of $67,167, while those with less than high school education earn the least with $29,609. Women with an educational attainment of graduate degree earn the most with the average annual earnings of $56,250, while those with high school diploma education have the smallest earnings of $27,465.
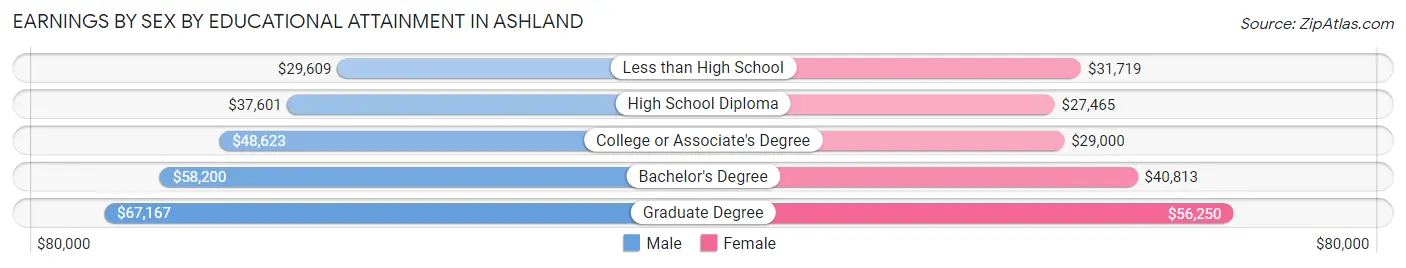
| Educational Attainment | Male Income | Female Income |
| Less than High School | $29,609 | $31,719 |
| High School Diploma | $37,601 | $27,465 |
| College or Associate's Degree | $48,623 | $29,000 |
| Bachelor's Degree | $58,200 | $40,813 |
| Graduate Degree | $67,167 | $56,250 |
| Total | $47,215 | $33,188 |
Family Income in Ashland
Family Income Brackets in Ashland
According to the Ashland family income data, there are 1,015 families falling into the $50,000 to $74,999 income range, which is the most common income bracket and makes up 23.2% of all families. Conversely, the less than $10,000 income bracket is the least frequent group with only 92 families (2.1%) belonging to this category.
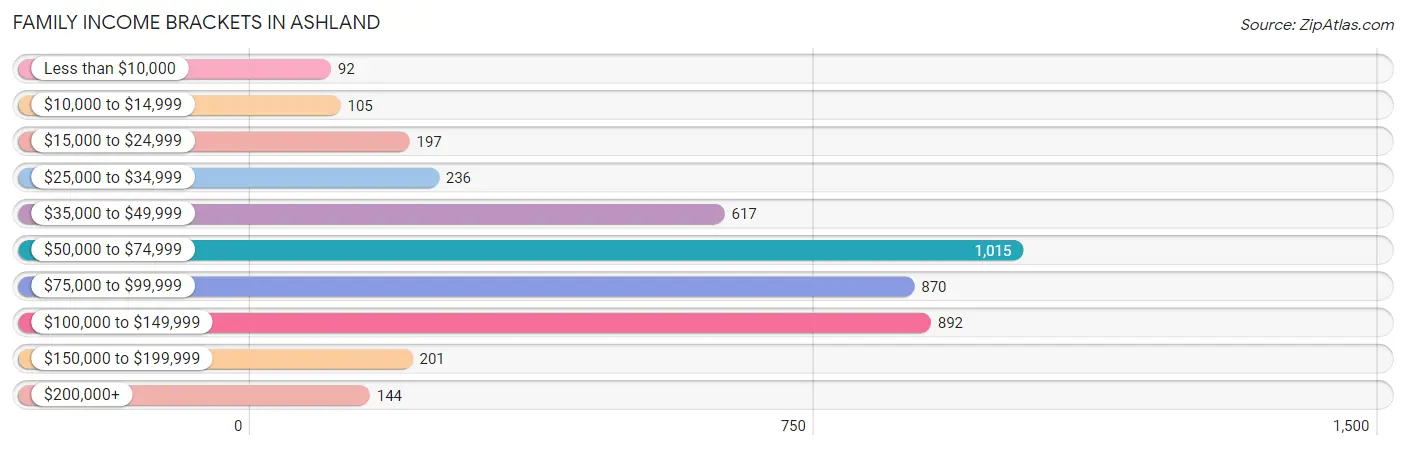
| Income Bracket | # Families | % Families |
| Less than $10,000 | 92 | 2.1% |
| $10,000 to $14,999 | 105 | 2.4% |
| $15,000 to $24,999 | 197 | 4.5% |
| $25,000 to $34,999 | 236 | 5.4% |
| $35,000 to $49,999 | 617 | 14.1% |
| $50,000 to $74,999 | 1,015 | 23.2% |
| $75,000 to $99,999 | 870 | 19.9% |
| $100,000 to $149,999 | 892 | 20.4% |
| $150,000 to $199,999 | 201 | 4.6% |
| $200,000+ | 144 | 3.3% |
Family Income by Famaliy Size in Ashland
7+ person families (87 | 2.0%) account for the highest median family income in Ashland with $93,447 per family, while 2-person families (2,449 | 56.0%) have the highest median income of $33,440 per family member.
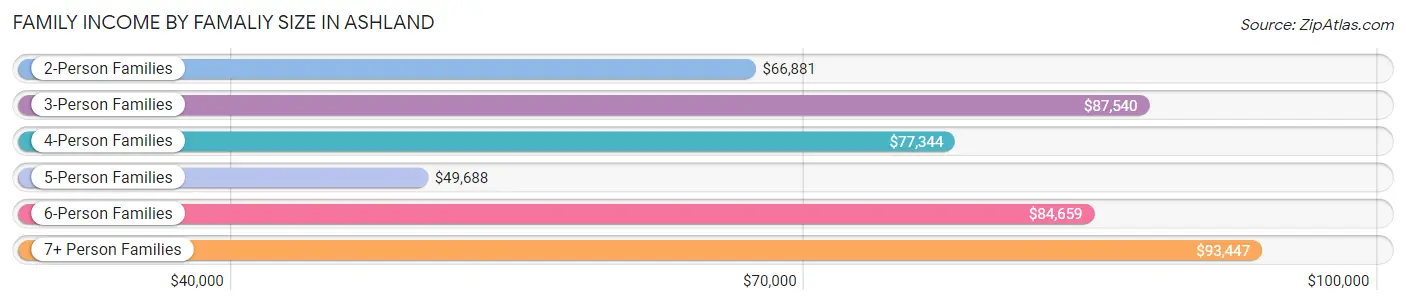
| Income Bracket | # Families | Median Income |
| 2-Person Families | 2,449 (56.0%) | $66,881 |
| 3-Person Families | 903 (20.6%) | $87,540 |
| 4-Person Families | 559 (12.8%) | $77,344 |
| 5-Person Families | 238 (5.4%) | $49,688 |
| 6-Person Families | 138 (3.2%) | $84,659 |
| 7+ Person Families | 87 (2.0%) | $93,447 |
| Total | 4,374 (100.0%) | $73,075 |
Family Income by Number of Earners in Ashland
The median family income in Ashland is $73,075, with families comprising 3+ earners (327) having the highest median family income of $94,053, while families with no earners (755) have the lowest median family income of $46,250, accounting for 7.5% and 17.3% of families, respectively.
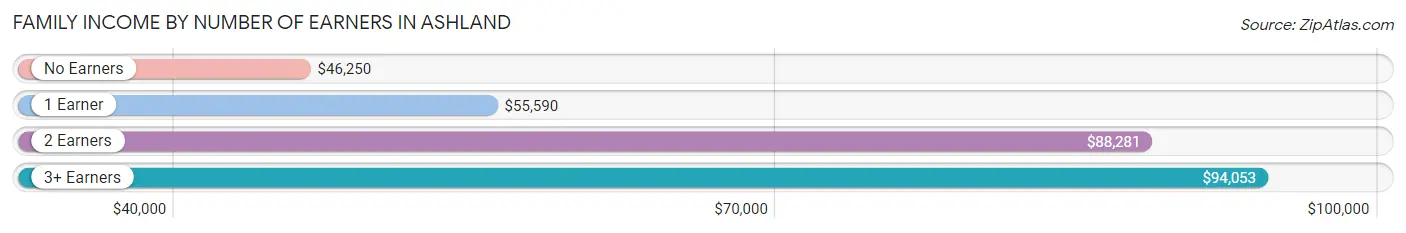
| Number of Earners | # Families | Median Income |
| No Earners | 755 (17.3%) | $46,250 |
| 1 Earner | 1,359 (31.1%) | $55,590 |
| 2 Earners | 1,933 (44.2%) | $88,281 |
| 3+ Earners | 327 (7.5%) | $94,053 |
| Total | 4,374 (100.0%) | $73,075 |
Household Income in Ashland
Household Income Brackets in Ashland
With 1,621 households falling in the category, the $50,000 to $74,999 income range is the most frequent in Ashland, accounting for 20.4% of all households. In contrast, only 183 households (2.3%) fall into the $200,000+ income bracket, making it the least populous group.
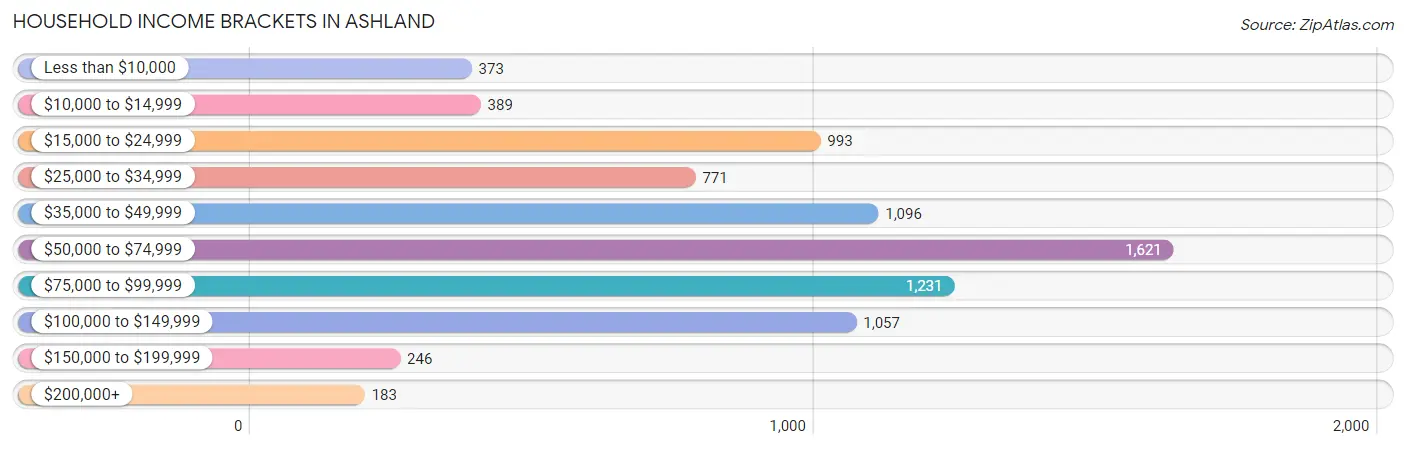
| Income Bracket | # Households | % Households |
| Less than $10,000 | 373 | 4.7% |
| $10,000 to $14,999 | 389 | 4.9% |
| $15,000 to $24,999 | 993 | 12.5% |
| $25,000 to $34,999 | 771 | 9.7% |
| $35,000 to $49,999 | 1,096 | 13.8% |
| $50,000 to $74,999 | 1,621 | 20.4% |
| $75,000 to $99,999 | 1,231 | 15.5% |
| $100,000 to $149,999 | 1,057 | 13.3% |
| $150,000 to $199,999 | 246 | 3.1% |
| $200,000+ | 183 | 2.3% |
Household Income by Householder Age in Ashland
The median household income in Ashland is $56,040, with the highest median household income of $66,364 found in the 25 to 44 years age bracket for the primary householder. A total of 2,380 households (30.0%) fall into this category. Meanwhile, the 15 to 24 years age bracket for the primary householder has the lowest median household income of $32,500, with 536 households (6.8%) in this group.
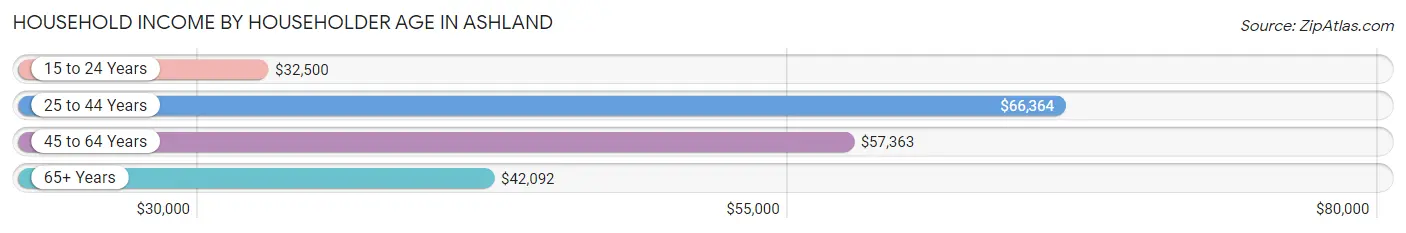
| Income Bracket | # Households | Median Income |
| 15 to 24 Years | 536 (6.8%) | $32,500 |
| 25 to 44 Years | 2,380 (30.0%) | $66,364 |
| 45 to 64 Years | 2,578 (32.5%) | $57,363 |
| 65+ Years | 2,450 (30.8%) | $42,092 |
| Total | 7,944 (100.0%) | $56,040 |
Poverty in Ashland
Income Below Poverty by Sex and Age in Ashland
With 14.0% poverty level for males and 13.8% for females among the residents of Ashland, 15 year old males and 18 to 24 year old females are the most vulnerable to poverty, with 76 males (48.1%) and 289 females (42.7%) in their respective age groups living below the poverty level.
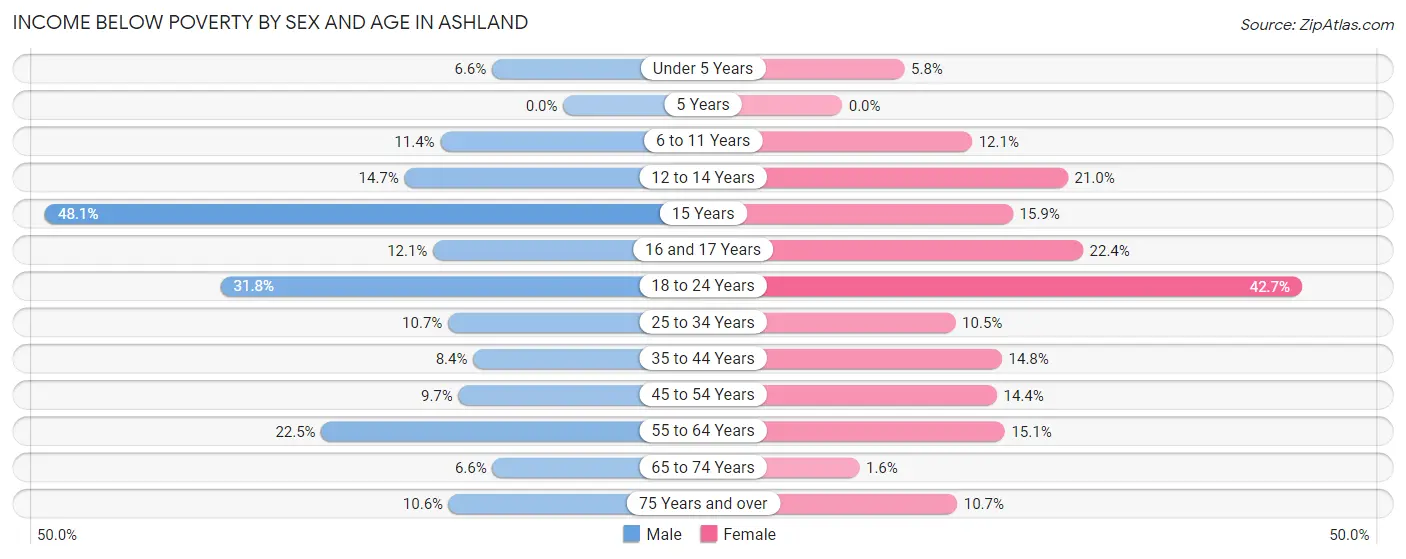
| Age Bracket | Male | Female |
| Under 5 Years | 24 (6.6%) | 31 (5.8%) |
| 5 Years | 0 (0.0%) | 0 (0.0%) |
| 6 to 11 Years | 86 (11.4%) | 65 (12.1%) |
| 12 to 14 Years | 66 (14.7%) | 44 (20.9%) |
| 15 Years | 76 (48.1%) | 13 (15.9%) |
| 16 and 17 Years | 32 (12.1%) | 57 (22.4%) |
| 18 to 24 Years | 263 (31.8%) | 289 (42.7%) |
| 25 to 34 Years | 130 (10.7%) | 131 (10.5%) |
| 35 to 44 Years | 91 (8.4%) | 168 (14.8%) |
| 45 to 54 Years | 91 (9.7%) | 130 (14.4%) |
| 55 to 64 Years | 246 (22.5%) | 174 (15.1%) |
| 65 to 74 Years | 65 (6.6%) | 16 (1.6%) |
| 75 Years and over | 65 (10.6%) | 113 (10.7%) |
| Total | 1,235 (14.0%) | 1,231 (13.8%) |
Income Above Poverty by Sex and Age in Ashland
According to the poverty statistics in Ashland, males aged 5 years and females aged 5 years are the age groups that are most secure financially, with 100.0% of males and 100.0% of females in these age groups living above the poverty line.
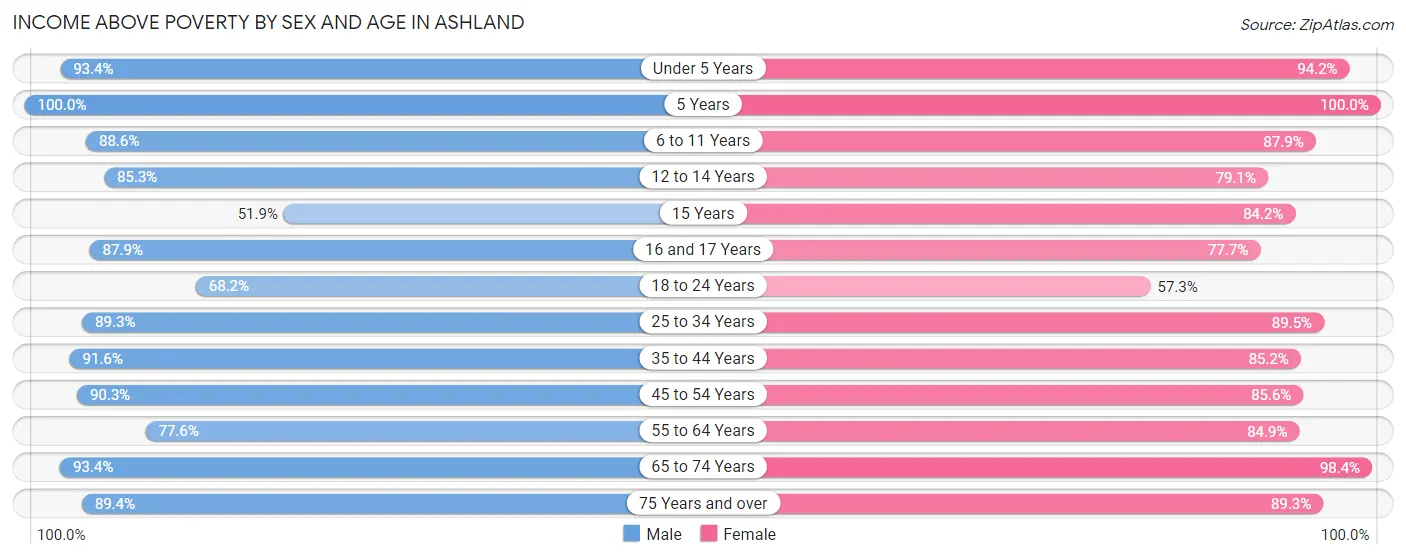
| Age Bracket | Male | Female |
| Under 5 Years | 339 (93.4%) | 505 (94.2%) |
| 5 Years | 53 (100.0%) | 162 (100.0%) |
| 6 to 11 Years | 668 (88.6%) | 474 (87.9%) |
| 12 to 14 Years | 382 (85.3%) | 166 (79.0%) |
| 15 Years | 82 (51.9%) | 69 (84.2%) |
| 16 and 17 Years | 233 (87.9%) | 198 (77.6%) |
| 18 to 24 Years | 564 (68.2%) | 388 (57.3%) |
| 25 to 34 Years | 1,086 (89.3%) | 1,114 (89.5%) |
| 35 to 44 Years | 998 (91.6%) | 965 (85.2%) |
| 45 to 54 Years | 845 (90.3%) | 775 (85.6%) |
| 55 to 64 Years | 850 (77.5%) | 978 (84.9%) |
| 65 to 74 Years | 924 (93.4%) | 982 (98.4%) |
| 75 Years and over | 547 (89.4%) | 946 (89.3%) |
| Total | 7,571 (86.0%) | 7,722 (86.3%) |
Income Below Poverty Among Married-Couple Families in Ashland
The poverty statistics for married-couple families in Ashland show that 2.6% or 87 of the total 3,373 families live below the poverty line. Families with no children have the highest poverty rate of 3.6%, comprising of 75 families. On the other hand, families with 3 or 4 children have the lowest poverty rate of 0.0%, which includes 0 families.
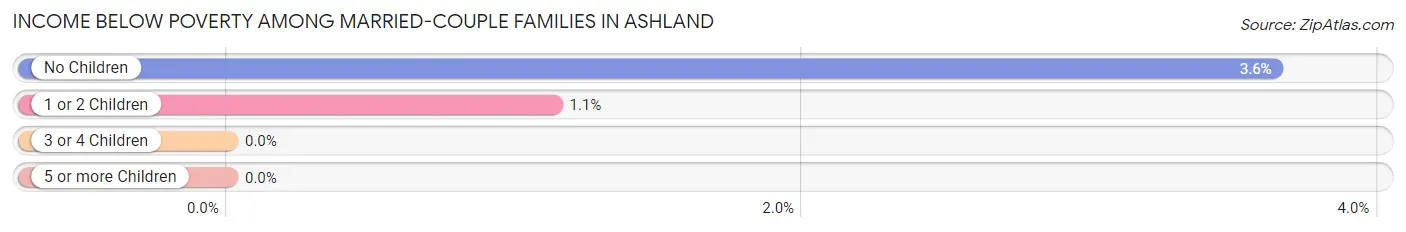
| Children | Above Poverty | Below Poverty |
| No Children | 1,983 (96.4%) | 75 (3.6%) |
| 1 or 2 Children | 1,047 (98.9%) | 12 (1.1%) |
| 3 or 4 Children | 201 (100.0%) | 0 (0.0%) |
| 5 or more Children | 55 (100.0%) | 0 (0.0%) |
| Total | 3,286 (97.4%) | 87 (2.6%) |
Income Below Poverty Among Single-Parent Households in Ashland
According to the poverty data in Ashland, 15.6% or 31 single-father households and 25.1% or 201 single-mother households are living below the poverty line. Among single-father households, those with no children have the highest poverty rate, with 9 households (22.5%) experiencing poverty. Likewise, among single-mother households, those with 5 or more children have the highest poverty rate, with 43 households (100.0%) falling below the poverty line.
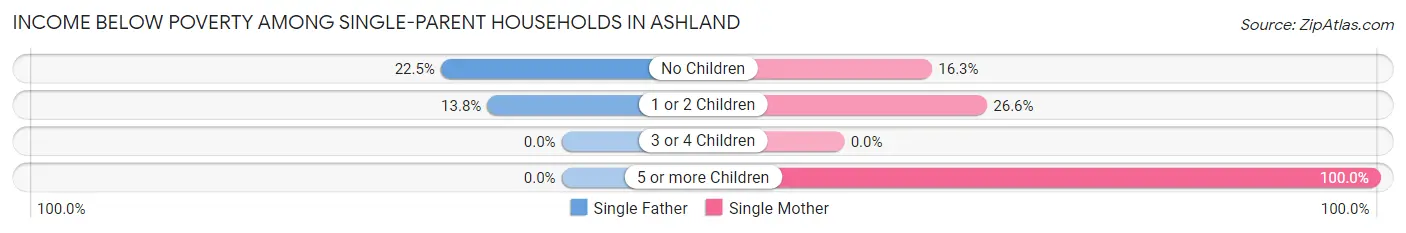
| Children | Single Father | Single Mother |
| No Children | 9 (22.5%) | 57 (16.3%) |
| 1 or 2 Children | 22 (13.8%) | 101 (26.6%) |
| 3 or 4 Children | 0 (0.0%) | 0 (0.0%) |
| 5 or more Children | 0 (0.0%) | 43 (100.0%) |
| Total | 31 (15.6%) | 201 (25.1%) |
Income Below Poverty Among Married-Couple vs Single-Parent Households in Ashland
The poverty data for Ashland shows that 87 of the married-couple family households (2.6%) and 232 of the single-parent households (23.2%) are living below the poverty level. Within the married-couple family households, those with no children have the highest poverty rate, with 75 households (3.6%) falling below the poverty line. Among the single-parent households, those with 5 or more children have the highest poverty rate, with 43 household (100.0%) living below poverty.
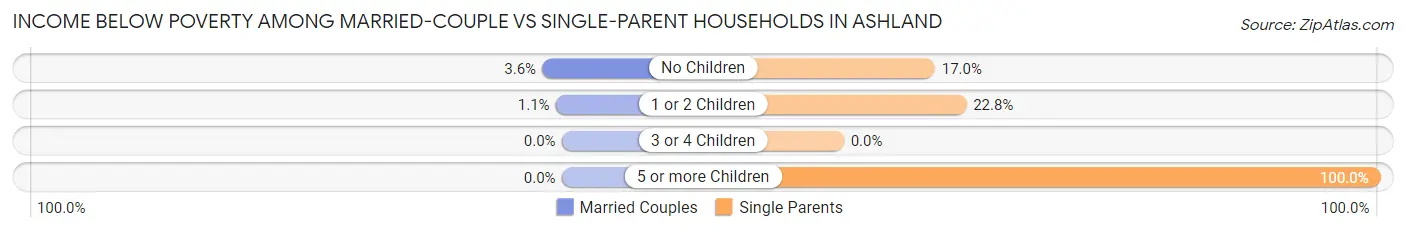
| Children | Married-Couple Families | Single-Parent Households |
| No Children | 75 (3.6%) | 66 (17.0%) |
| 1 or 2 Children | 12 (1.1%) | 123 (22.8%) |
| 3 or 4 Children | 0 (0.0%) | 0 (0.0%) |
| 5 or more Children | 0 (0.0%) | 43 (100.0%) |
| Total | 87 (2.6%) | 232 (23.2%) |
Race in Ashland
The most populous races in Ashland are White / Caucasian (17,821 | 92.5%), Two or more Races (806 | 4.2%), and Hispanic or Latino (431 | 2.2%).
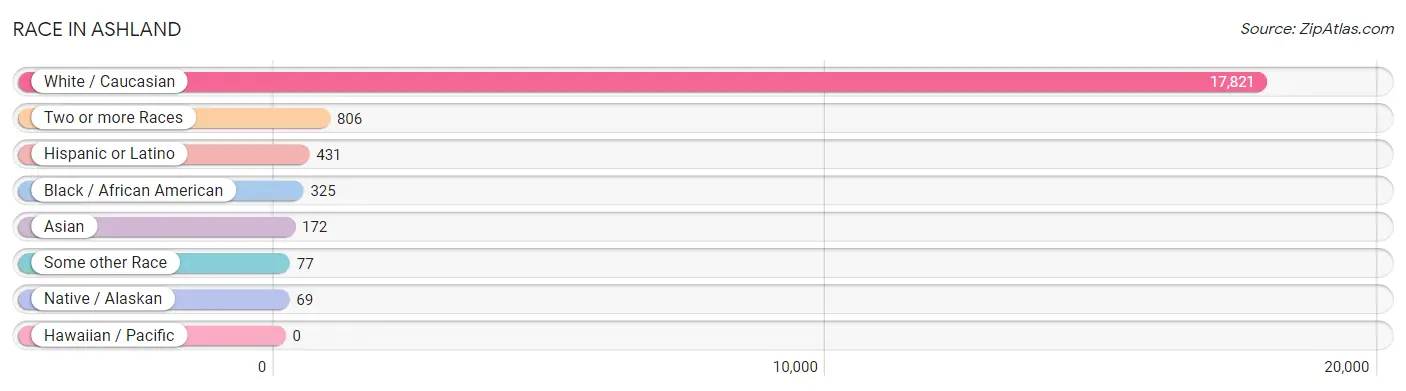
| Race | # Population | % Population |
| Asian | 172 | 0.9% |
| Black / African American | 325 | 1.7% |
| Hawaiian / Pacific | 0 | 0.0% |
| Hispanic or Latino | 431 | 2.2% |
| Native / Alaskan | 69 | 0.4% |
| White / Caucasian | 17,821 | 92.5% |
| Two or more Races | 806 | 4.2% |
| Some other Race | 77 | 0.4% |
| Total | 19,270 | 100.0% |
Ancestry in Ashland
The most populous ancestries reported in Ashland are German (5,333 | 27.7%), English (2,298 | 11.9%), Irish (2,071 | 10.7%), American (885 | 4.6%), and Italian (646 | 3.4%), together accounting for 58.3% of all Ashland residents.
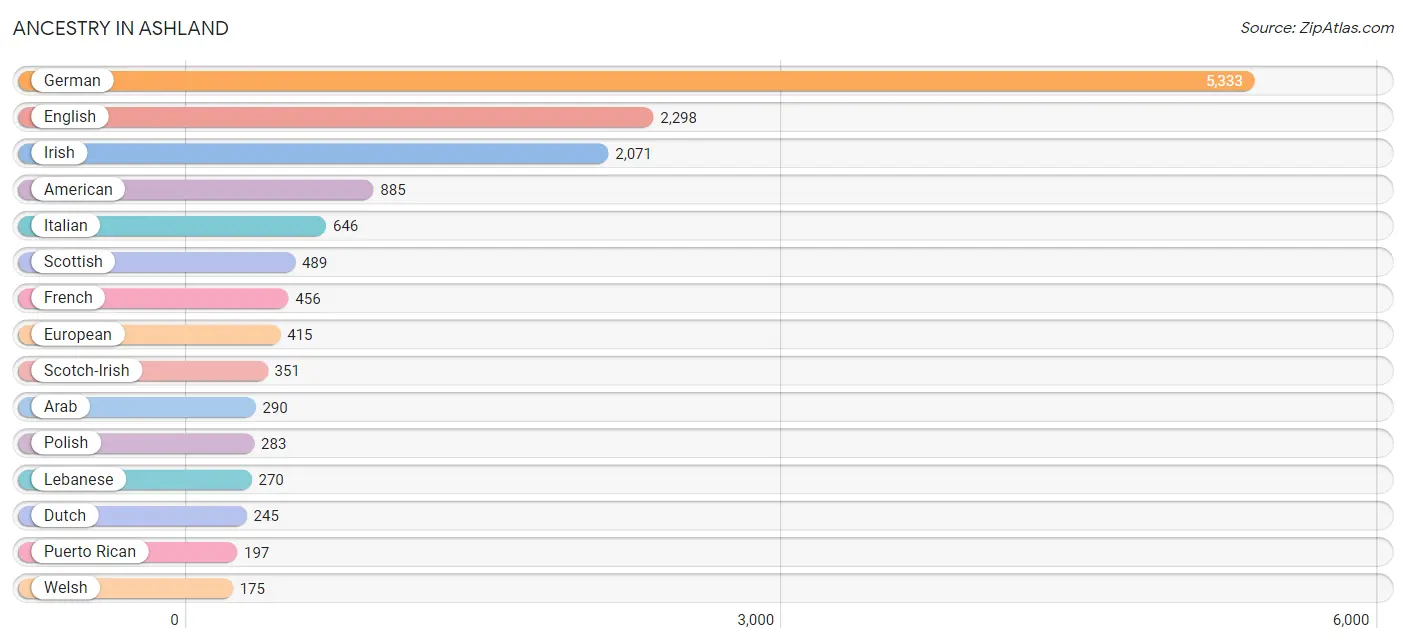
| Ancestry | # Population | % Population |
| American | 885 | 4.6% |
| Arab | 290 | 1.5% |
| Austrian | 79 | 0.4% |
| Belgian | 44 | 0.2% |
| Bhutanese | 33 | 0.2% |
| British | 54 | 0.3% |
| Burmese | 32 | 0.2% |
| Carpatho Rusyn | 6 | 0.0% |
| Central American | 28 | 0.2% |
| Cherokee | 68 | 0.4% |
| Costa Rican | 28 | 0.2% |
| Croatian | 7 | 0.0% |
| Czech | 68 | 0.4% |
| Czechoslovakian | 40 | 0.2% |
| Danish | 40 | 0.2% |
| Dutch | 245 | 1.3% |
| English | 2,298 | 11.9% |
| European | 415 | 2.1% |
| Finnish | 9 | 0.1% |
| French | 456 | 2.4% |
| German | 5,333 | 27.7% |
| Greek | 20 | 0.1% |
| Hungarian | 117 | 0.6% |
| Indian (Asian) | 91 | 0.5% |
| Iranian | 8 | 0.0% |
| Irish | 2,071 | 10.7% |
| Iroquois | 9 | 0.1% |
| Italian | 646 | 3.4% |
| Jamaican | 33 | 0.2% |
| Japanese | 129 | 0.7% |
| Jordanian | 12 | 0.1% |
| Lebanese | 270 | 1.4% |
| Lithuanian | 19 | 0.1% |
| Malaysian | 68 | 0.4% |
| Mexican | 137 | 0.7% |
| Northern European | 57 | 0.3% |
| Norwegian | 122 | 0.6% |
| Pakistani | 83 | 0.4% |
| Pennsylvania German | 36 | 0.2% |
| Peruvian | 38 | 0.2% |
| Polish | 283 | 1.5% |
| Portuguese | 9 | 0.1% |
| Puerto Rican | 197 | 1.0% |
| Romanian | 11 | 0.1% |
| Russian | 42 | 0.2% |
| Scandinavian | 64 | 0.3% |
| Scotch-Irish | 351 | 1.8% |
| Scottish | 489 | 2.5% |
| Slavic | 14 | 0.1% |
| Slovak | 22 | 0.1% |
| Slovene | 25 | 0.1% |
| South American | 38 | 0.2% |
| Sri Lankan | 12 | 0.1% |
| Swedish | 46 | 0.2% |
| Swiss | 170 | 0.9% |
| Syrian | 8 | 0.0% |
| Thai | 14 | 0.1% |
| Ukrainian | 23 | 0.1% |
| Welsh | 175 | 0.9% | View All 59 Rows |
Immigrants in Ashland
The most numerous immigrant groups reported in Ashland came from Asia (140 | 0.7%), Latin America (97 | 0.5%), Europe (86 | 0.4%), Central America (79 | 0.4%), and Mexico (79 | 0.4%), together accounting for 2.5% of all Ashland residents.
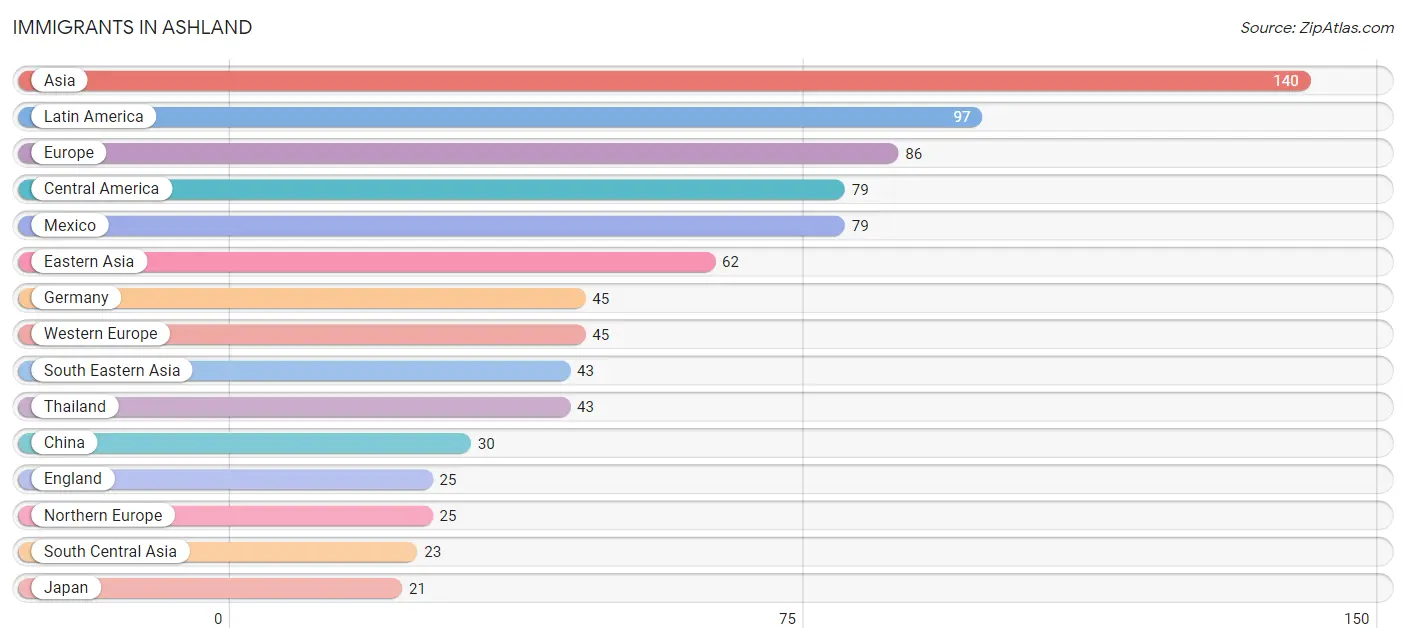
| Immigration Origin | # Population | % Population |
| Asia | 140 | 0.7% |
| Canada | 13 | 0.1% |
| Central America | 79 | 0.4% |
| China | 30 | 0.2% |
| Eastern Asia | 62 | 0.3% |
| England | 25 | 0.1% |
| Europe | 86 | 0.4% |
| Germany | 45 | 0.2% |
| Greece | 16 | 0.1% |
| India | 15 | 0.1% |
| Iran | 8 | 0.0% |
| Japan | 21 | 0.1% |
| Korea | 11 | 0.1% |
| Kuwait | 12 | 0.1% |
| Latin America | 97 | 0.5% |
| Mexico | 79 | 0.4% |
| Northern Europe | 25 | 0.1% |
| Peru | 18 | 0.1% |
| South America | 18 | 0.1% |
| South Central Asia | 23 | 0.1% |
| South Eastern Asia | 43 | 0.2% |
| Southern Europe | 16 | 0.1% |
| Taiwan | 15 | 0.1% |
| Thailand | 43 | 0.2% |
| Western Asia | 12 | 0.1% |
| Western Europe | 45 | 0.2% | View All 26 Rows |
Sex and Age in Ashland
Sex and Age in Ashland
The most populous age groups in Ashland are 20 to 24 Years (871 | 9.3%) for men and 20 to 24 Years (894 | 9.0%) for women.
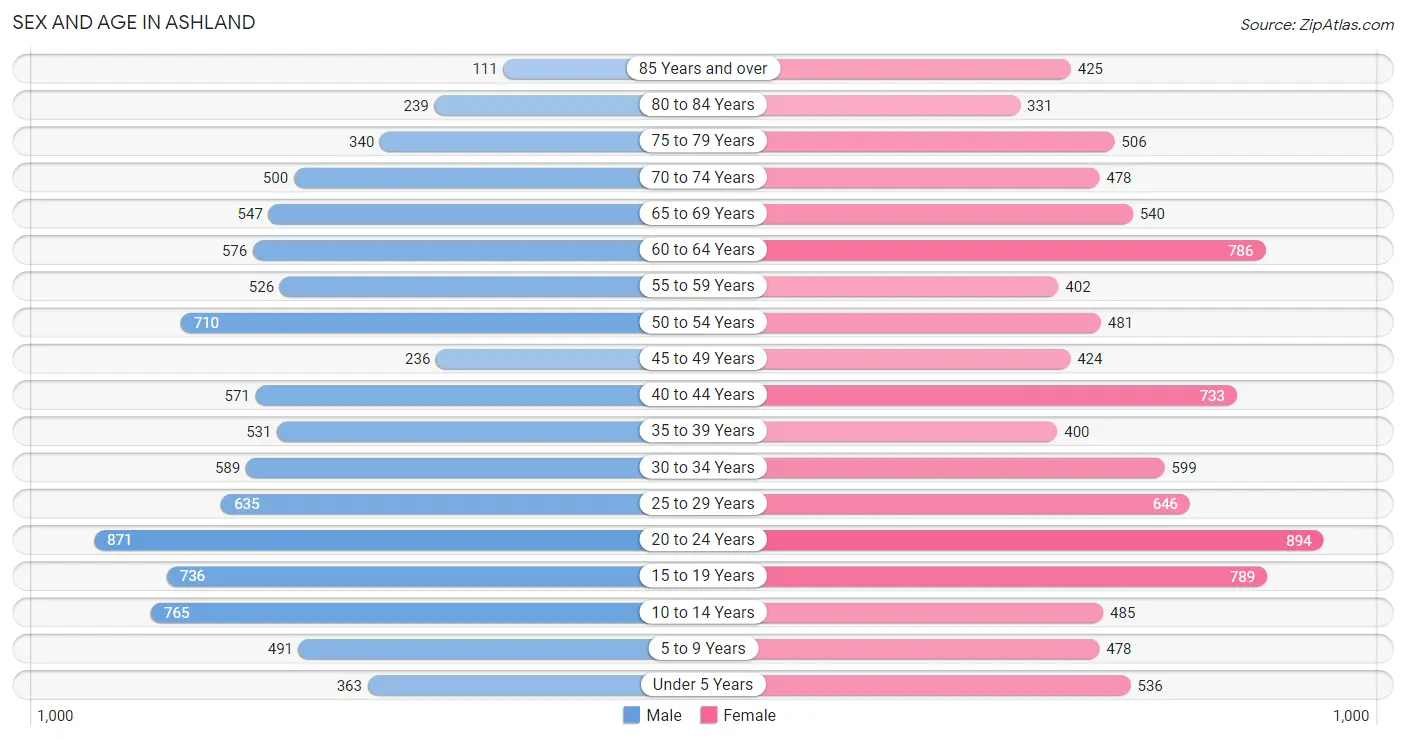
| Age Bracket | Male | Female |
| Under 5 Years | 363 (3.9%) | 536 (5.4%) |
| 5 to 9 Years | 491 (5.3%) | 478 (4.8%) |
| 10 to 14 Years | 765 (8.2%) | 485 (4.9%) |
| 15 to 19 Years | 736 (7.9%) | 789 (7.9%) |
| 20 to 24 Years | 871 (9.3%) | 894 (9.0%) |
| 25 to 29 Years | 635 (6.8%) | 646 (6.5%) |
| 30 to 34 Years | 589 (6.3%) | 599 (6.0%) |
| 35 to 39 Years | 531 (5.7%) | 400 (4.0%) |
| 40 to 44 Years | 571 (6.1%) | 733 (7.4%) |
| 45 to 49 Years | 236 (2.5%) | 424 (4.3%) |
| 50 to 54 Years | 710 (7.6%) | 481 (4.8%) |
| 55 to 59 Years | 526 (5.6%) | 402 (4.1%) |
| 60 to 64 Years | 576 (6.2%) | 786 (7.9%) |
| 65 to 69 Years | 547 (5.9%) | 540 (5.4%) |
| 70 to 74 Years | 500 (5.4%) | 478 (4.8%) |
| 75 to 79 Years | 340 (3.6%) | 506 (5.1%) |
| 80 to 84 Years | 239 (2.6%) | 331 (3.3%) |
| 85 Years and over | 111 (1.2%) | 425 (4.3%) |
| Total | 9,337 (100.0%) | 9,933 (100.0%) |
Families and Households in Ashland
Median Family Size in Ashland
The median family size in Ashland is 2.96 persons per family, with married-couple families (3,373 | 77.1%) accounting for the largest median family size of 3.02 persons per family. On the other hand, single male/father families (199 | 4.5%) represent the smallest median family size with 2.43 persons per family.
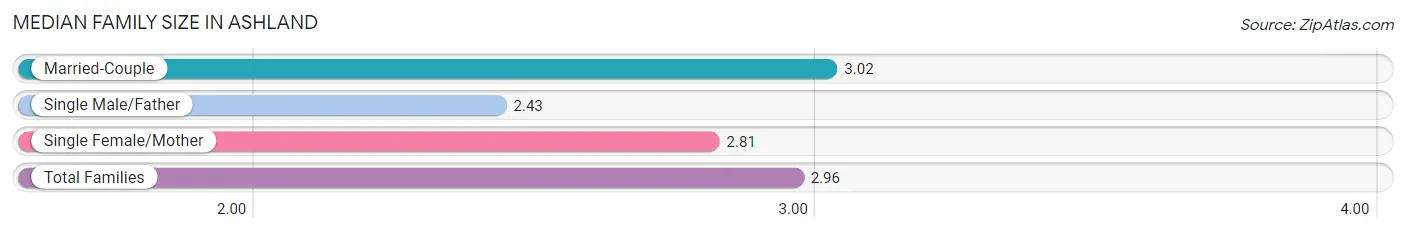
| Family Type | # Families | Family Size |
| Married-Couple | 3,373 (77.1%) | 3.02 |
| Single Male/Father | 199 (4.5%) | 2.43 |
| Single Female/Mother | 802 (18.3%) | 2.81 |
| Total Families | 4,374 (100.0%) | 2.96 |
Median Household Size in Ashland
The median household size in Ashland is 2.23 persons per household, with married-couple households (3,373 | 42.5%) accounting for the largest median household size of 3.04 persons per household. non-family households (3,570 | 44.9%) represent the smallest median household size with 1.26 persons per household.
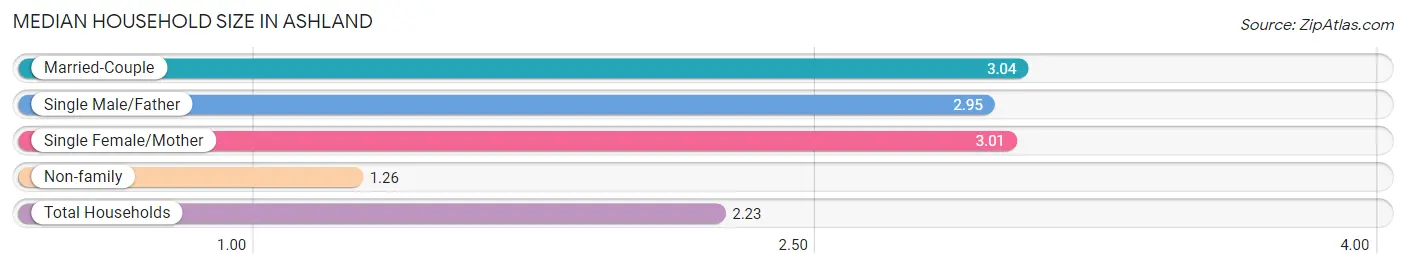
| Household Type | # Households | Household Size |
| Married-Couple | 3,373 (42.5%) | 3.04 |
| Single Male/Father | 199 (2.5%) | 2.95 |
| Single Female/Mother | 802 (10.1%) | 3.01 |
| Non-family | 3,570 (44.9%) | 1.26 |
| Total Households | 7,944 (100.0%) | 2.23 |
Household Size by Marriage Status in Ashland
Out of a total of 7,944 households in Ashland, 4,374 (55.1%) are family households, while 3,570 (44.9%) are nonfamily households. The most numerous type of family households are 2-person households, comprising 2,235, and the most common type of nonfamily households are 1-person households, comprising 2,901.
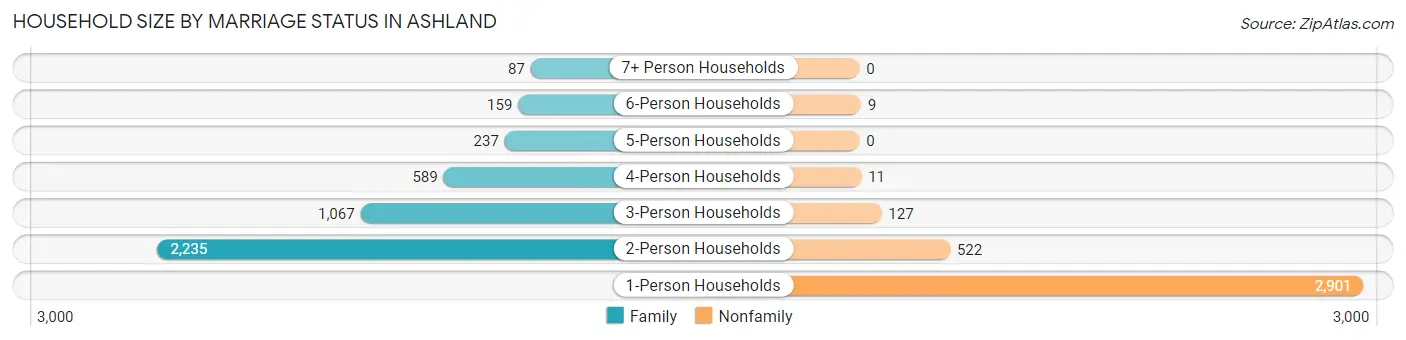
| Household Size | Family Households | Nonfamily Households |
| 1-Person Households | - | 2,901 (36.5%) |
| 2-Person Households | 2,235 (28.1%) | 522 (6.6%) |
| 3-Person Households | 1,067 (13.4%) | 127 (1.6%) |
| 4-Person Households | 589 (7.4%) | 11 (0.1%) |
| 5-Person Households | 237 (3.0%) | 0 (0.0%) |
| 6-Person Households | 159 (2.0%) | 9 (0.1%) |
| 7+ Person Households | 87 (1.1%) | 0 (0.0%) |
| Total | 4,374 (55.1%) | 3,570 (44.9%) |
Female Fertility in Ashland
Fertility by Age in Ashland
Average fertility rate in Ashland is 53.0 births per 1,000 women. Women in the age bracket of 20 to 34 years have the highest fertility rate with 99.0 births per 1,000 women. Women in the age bracket of 20 to 34 years acount for 88.0% of all women with births.
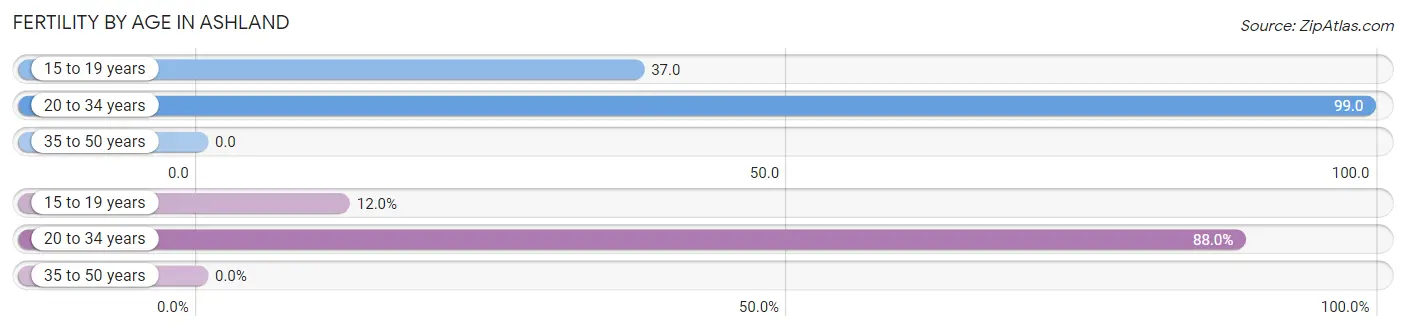
| Age Bracket | Women with Births | Births / 1,000 Women |
| 15 to 19 years | 29 (12.0%) | 37.0 |
| 20 to 34 years | 212 (88.0%) | 99.0 |
| 35 to 50 years | 0 (0.0%) | 0.0 |
| Total | 241 (100.0%) | 53.0 |
Fertility by Age by Marriage Status in Ashland
41.1% of women with births (241) in Ashland are married. The highest percentage of unmarried women with births falls into 15 to 19 years age bracket with 100.0% of them unmarried at the time of birth, while the lowest percentage of unmarried women with births belong to 20 to 34 years age bracket with 53.3% of them unmarried.
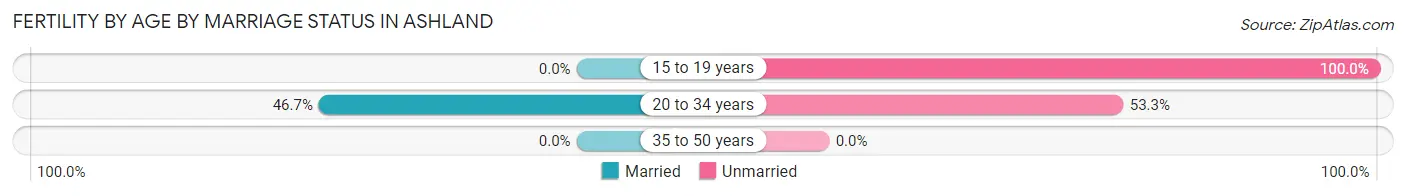
| Age Bracket | Married | Unmarried |
| 15 to 19 years | 0 (0.0%) | 29 (100.0%) |
| 20 to 34 years | 99 (46.7%) | 113 (53.3%) |
| 35 to 50 years | 0 (0.0%) | 0 (0.0%) |
| Total | 99 (41.1%) | 142 (58.9%) |
Fertility by Education in Ashland
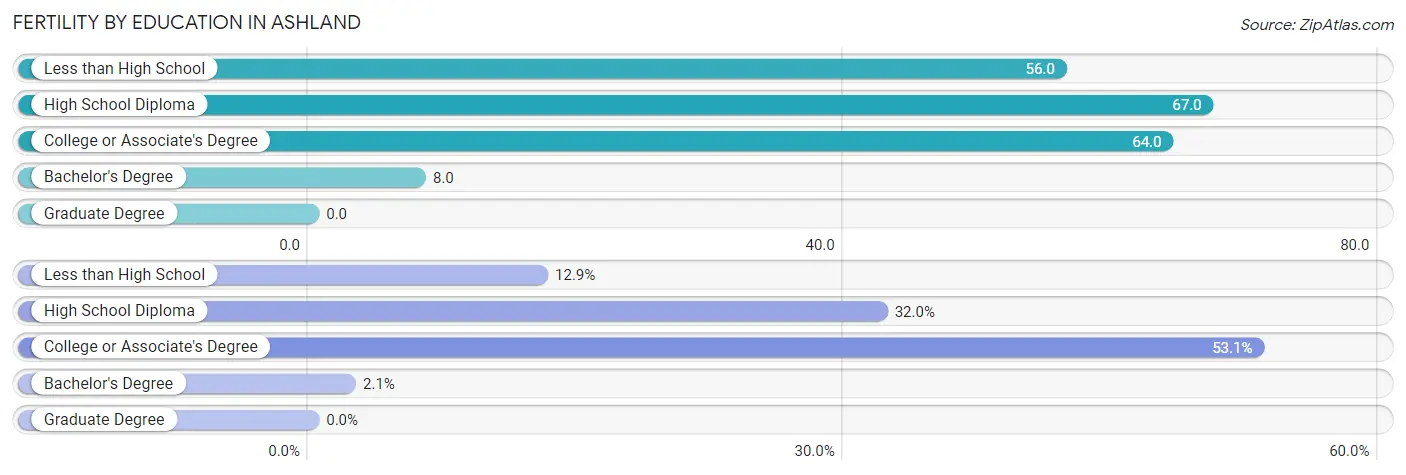
| Educational Attainment | Women with Births | Births / 1,000 Women |
| Less than High School | 31 (12.9%) | 56.0 |
| High School Diploma | 77 (32.0%) | 67.0 |
| College or Associate's Degree | 128 (53.1%) | 64.0 |
| Bachelor's Degree | 5 (2.1%) | 8.0 |
| Graduate Degree | 0 (0.0%) | 0.0 |
| Total | 241 (100.0%) | 53.0 |
Fertility by Education by Marriage Status in Ashland
58.9% of women with births in Ashland are unmarried. Women with the educational attainment of bachelor's degree are most likely to be married with 100.0% of them married at childbirth, while women with the educational attainment of less than high school are least likely to be married with 100.0% of them unmarried at childbirth.
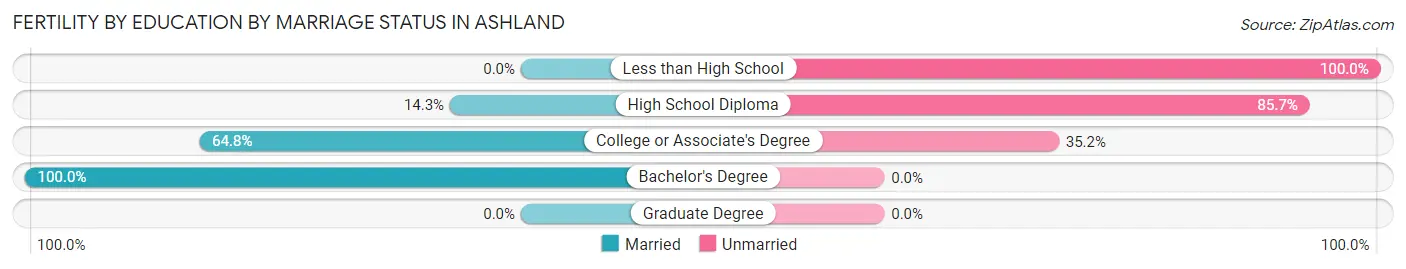
| Educational Attainment | Married | Unmarried |
| Less than High School | 0 (0.0%) | 31 (100.0%) |
| High School Diploma | 11 (14.3%) | 66 (85.7%) |
| College or Associate's Degree | 83 (64.8%) | 45 (35.2%) |
| Bachelor's Degree | 5 (100.0%) | 0 (0.0%) |
| Graduate Degree | 0 (0.0%) | 0 (0.0%) |
| Total | 99 (41.1%) | 142 (58.9%) |
Employment Characteristics in Ashland
Employment by Class of Employer in Ashland
Among the 9,097 employed individuals in Ashland, private company employees (6,586 | 72.4%), not-for-profit organizations (1,101 | 12.1%), and local government employees (623 | 6.9%) make up the most common classes of employment.
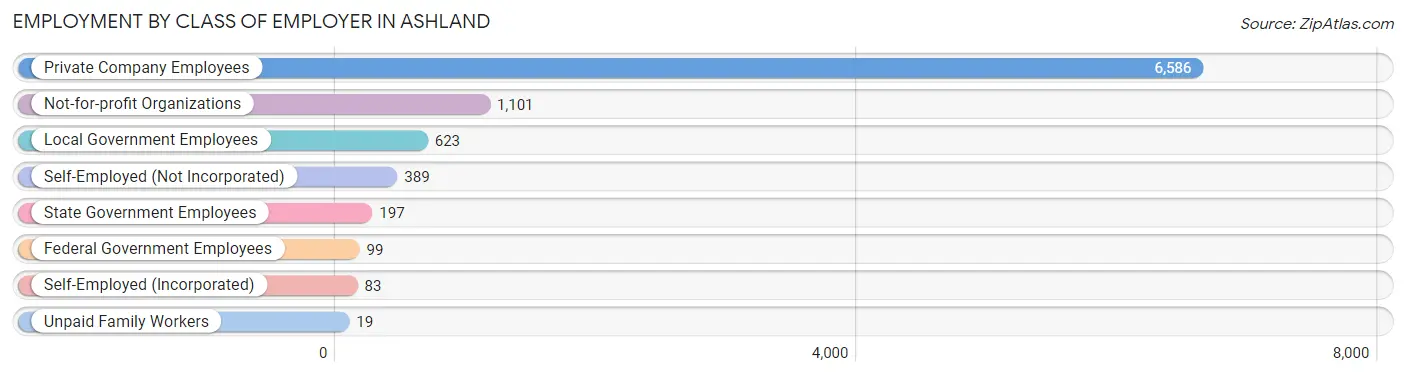
| Employer Class | # Employees | % Employees |
| Private Company Employees | 6,586 | 72.4% |
| Self-Employed (Incorporated) | 83 | 0.9% |
| Self-Employed (Not Incorporated) | 389 | 4.3% |
| Not-for-profit Organizations | 1,101 | 12.1% |
| Local Government Employees | 623 | 6.9% |
| State Government Employees | 197 | 2.2% |
| Federal Government Employees | 99 | 1.1% |
| Unpaid Family Workers | 19 | 0.2% |
| Total | 9,097 | 100.0% |
Employment Status by Age in Ashland
According to the labor force statistics for Ashland, out of the total population over 16 years of age (15,912), 61.0% or 9,706 individuals are in the labor force, with 3.8% or 369 of them unemployed. The age group with the highest labor force participation rate is 25 to 29 years, with 92.3% or 1,182 individuals in the labor force. Within the labor force, the 75 years and over age range has the highest percentage of unemployed individuals, with 23.7% or 22 of them being unemployed.
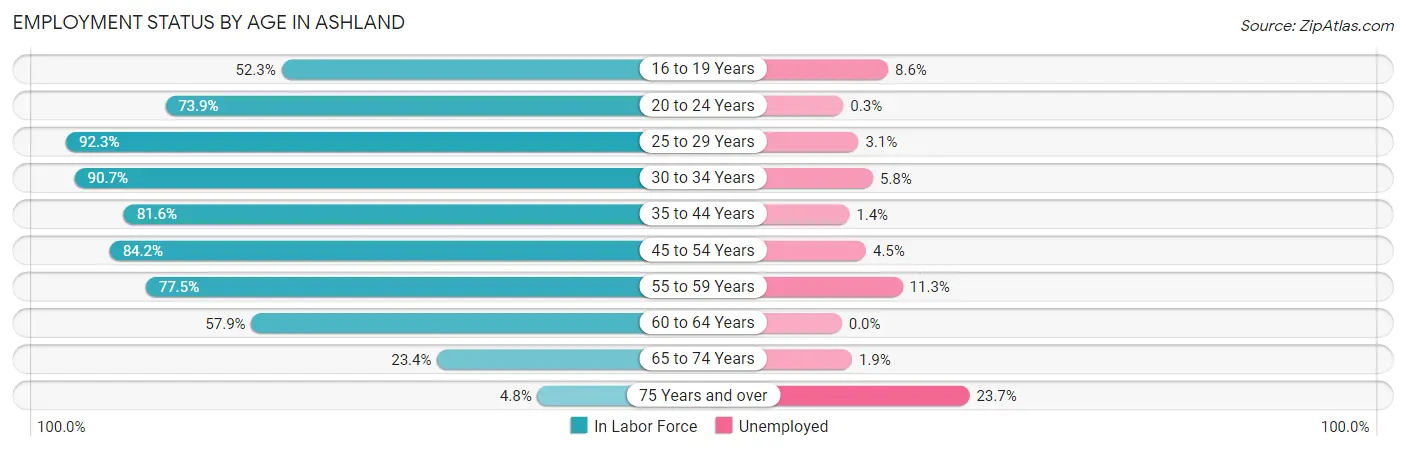
| Age Bracket | In Labor Force | Unemployed |
| 16 to 19 Years | 672 (52.3%) | 58 (8.6%) |
| 20 to 24 Years | 1,304 (73.9%) | 4 (0.3%) |
| 25 to 29 Years | 1,182 (92.3%) | 37 (3.1%) |
| 30 to 34 Years | 1,078 (90.7%) | 63 (5.8%) |
| 35 to 44 Years | 1,824 (81.6%) | 26 (1.4%) |
| 45 to 54 Years | 1,559 (84.2%) | 70 (4.5%) |
| 55 to 59 Years | 719 (77.5%) | 81 (11.3%) |
| 60 to 64 Years | 789 (57.9%) | 0 (0.0%) |
| 65 to 74 Years | 483 (23.4%) | 9 (1.9%) |
| 75 Years and over | 94 (4.8%) | 22 (23.7%) |
| Total | 9,706 (61.0%) | 369 (3.8%) |
Employment Status by Educational Attainment in Ashland
According to labor force statistics for Ashland, 80.8% of individuals (7,147) out of the total population between 25 and 64 years of age (8,845) are in the labor force, with 3.9% or 279 of them being unemployed. The group with the highest labor force participation rate are those with the educational attainment of bachelor's degree or higher, with 92.3% or 2,054 individuals in the labor force. Within the labor force, individuals with high school diploma education have the highest percentage of unemployment, with 6.1% or 152 of them being unemployed.
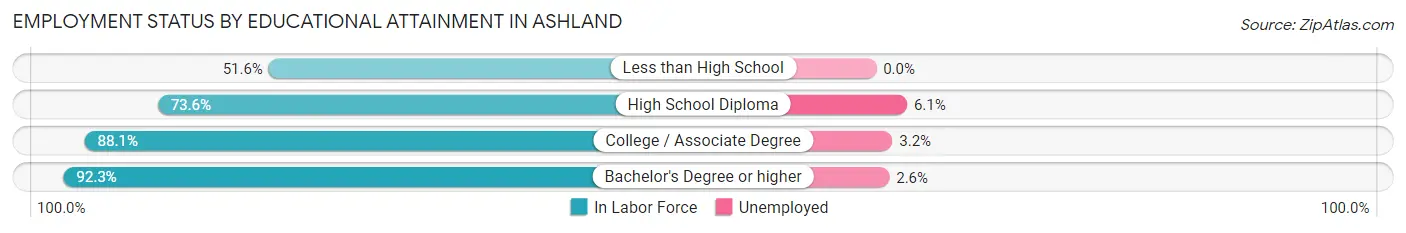
| Educational Attainment | In Labor Force | Unemployed |
| Less than High School | 349 (51.6%) | 0 (0.0%) |
| High School Diploma | 2,487 (73.6%) | 206 (6.1%) |
| College / Associate Degree | 2,260 (88.1%) | 82 (3.2%) |
| Bachelor's Degree or higher | 2,054 (92.3%) | 58 (2.6%) |
| Total | 7,147 (80.8%) | 345 (3.9%) |
Employment Occupations by Sex in Ashland
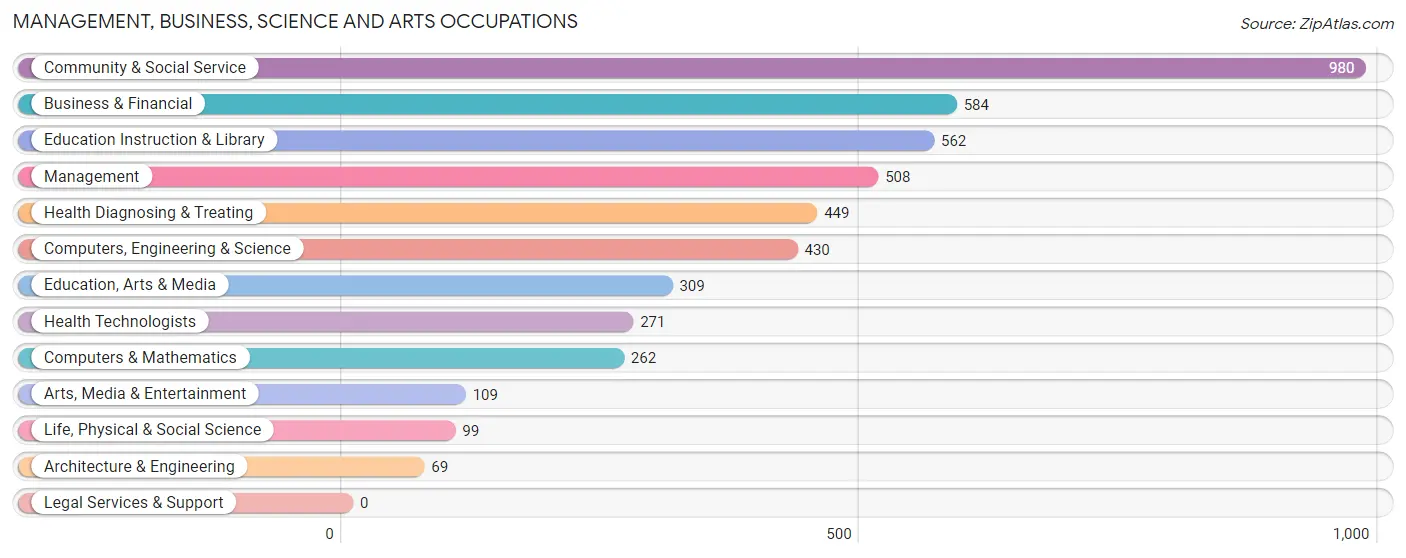
Management, Business, Science and Arts Occupations
The most common Management, Business, Science and Arts occupations in Ashland are Community & Social Service (980 | 10.5%), Business & Financial (584 | 6.3%), Education Instruction & Library (562 | 6.0%), Management (508 | 5.4%), and Health Diagnosing & Treating (449 | 4.8%).
Management, Business, Science and Arts Occupations by Sex
Within the Management, Business, Science and Arts occupations in Ashland, the most male-oriented occupations are Architecture & Engineering (100.0%), Computers & Mathematics (87.0%), and Computers, Engineering & Science (78.1%), while the most female-oriented occupations are Education Instruction & Library (71.9%), Community & Social Service (64.8%), and Health Technologists (63.5%).
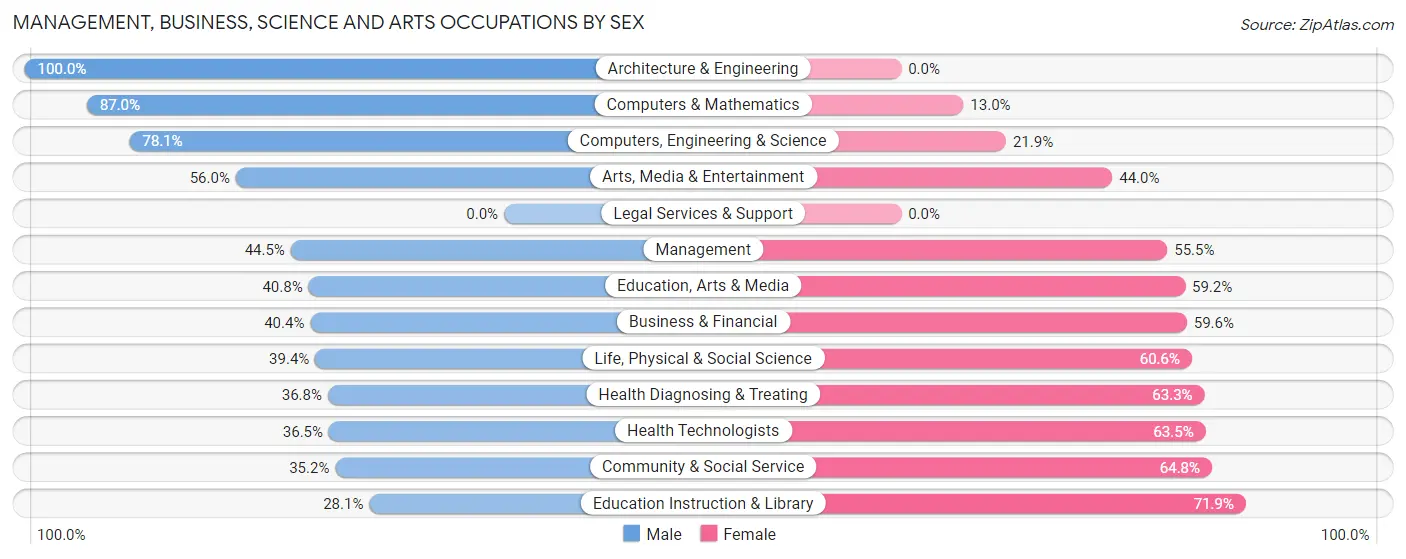
| Occupation | Male | Female |
| Management | 226 (44.5%) | 282 (55.5%) |
| Business & Financial | 236 (40.4%) | 348 (59.6%) |
| Computers, Engineering & Science | 336 (78.1%) | 94 (21.9%) |
| Computers & Mathematics | 228 (87.0%) | 34 (13.0%) |
| Architecture & Engineering | 69 (100.0%) | 0 (0.0%) |
| Life, Physical & Social Science | 39 (39.4%) | 60 (60.6%) |
| Community & Social Service | 345 (35.2%) | 635 (64.8%) |
| Education, Arts & Media | 126 (40.8%) | 183 (59.2%) |
| Legal Services & Support | 0 (0.0%) | 0 (0.0%) |
| Education Instruction & Library | 158 (28.1%) | 404 (71.9%) |
| Arts, Media & Entertainment | 61 (56.0%) | 48 (44.0%) |
| Health Diagnosing & Treating | 165 (36.7%) | 284 (63.2%) |
| Health Technologists | 99 (36.5%) | 172 (63.5%) |
| Total (Category) | 1,308 (44.3%) | 1,643 (55.7%) |
| Total (Overall) | 4,685 (50.3%) | 4,637 (49.7%) |
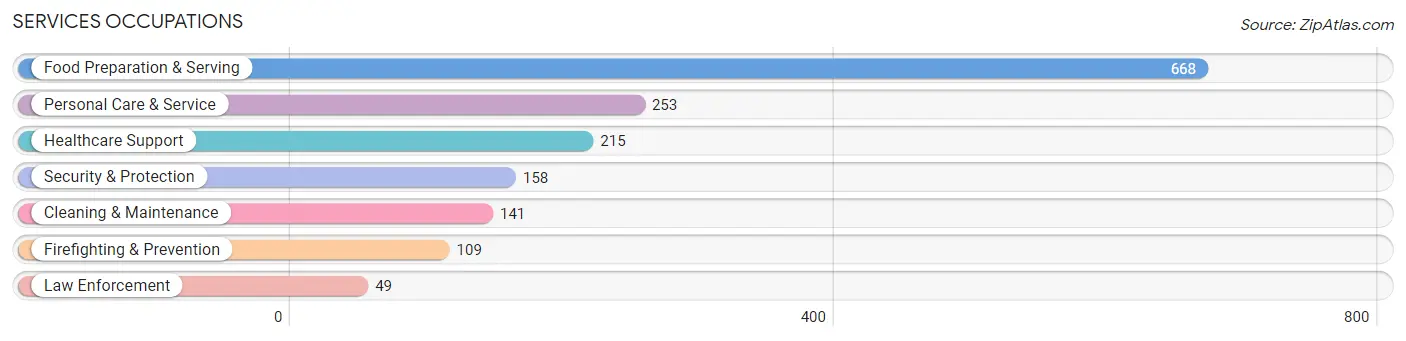
Services Occupations
The most common Services occupations in Ashland are Food Preparation & Serving (668 | 7.2%), Personal Care & Service (253 | 2.7%), Healthcare Support (215 | 2.3%), Security & Protection (158 | 1.7%), and Cleaning & Maintenance (141 | 1.5%).
Services Occupations by Sex
Within the Services occupations in Ashland, the most male-oriented occupations are Law Enforcement (100.0%), Security & Protection (94.3%), and Firefighting & Prevention (91.7%), while the most female-oriented occupations are Healthcare Support (90.2%), Food Preparation & Serving (69.8%), and Personal Care & Service (66.8%).
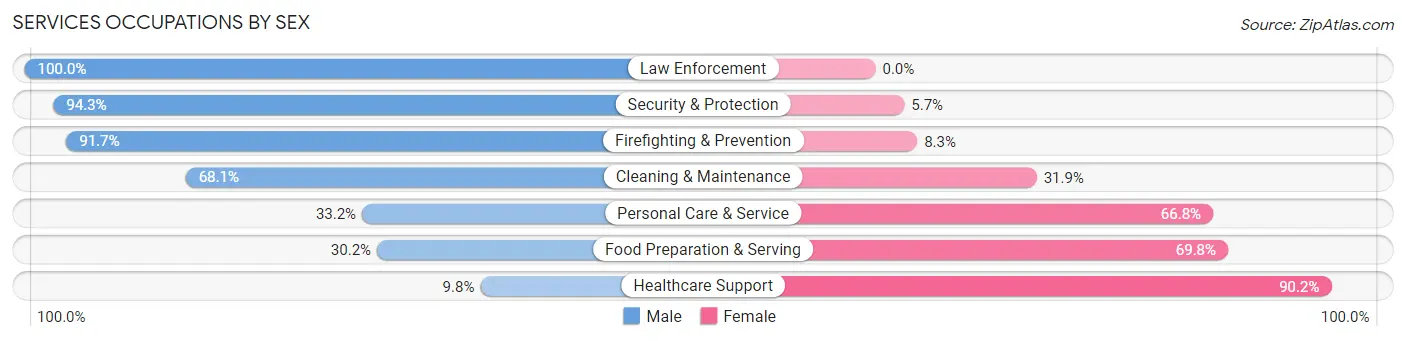
| Occupation | Male | Female |
| Healthcare Support | 21 (9.8%) | 194 (90.2%) |
| Security & Protection | 149 (94.3%) | 9 (5.7%) |
| Firefighting & Prevention | 100 (91.7%) | 9 (8.3%) |
| Law Enforcement | 49 (100.0%) | 0 (0.0%) |
| Food Preparation & Serving | 202 (30.2%) | 466 (69.8%) |
| Cleaning & Maintenance | 96 (68.1%) | 45 (31.9%) |
| Personal Care & Service | 84 (33.2%) | 169 (66.8%) |
| Total (Category) | 552 (38.5%) | 883 (61.5%) |
| Total (Overall) | 4,685 (50.3%) | 4,637 (49.7%) |
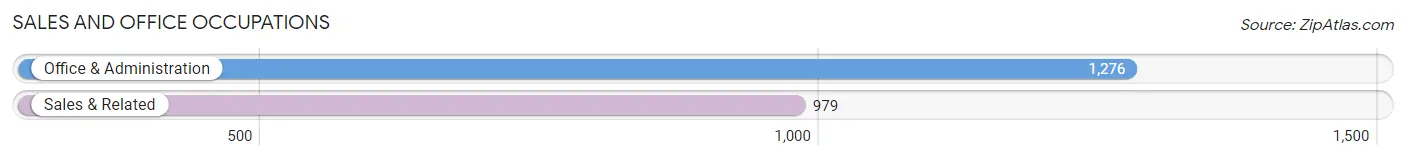
Sales and Office Occupations
The most common Sales and Office occupations in Ashland are Office & Administration (1,276 | 13.7%), and Sales & Related (979 | 10.5%).
Sales and Office Occupations by Sex
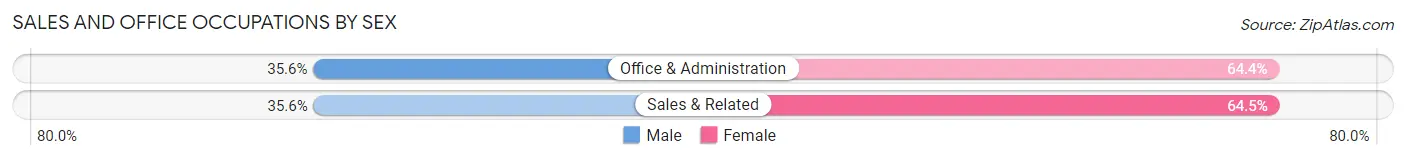
| Occupation | Male | Female |
| Sales & Related | 348 (35.5%) | 631 (64.4%) |
| Office & Administration | 454 (35.6%) | 822 (64.4%) |
| Total (Category) | 802 (35.6%) | 1,453 (64.4%) |
| Total (Overall) | 4,685 (50.3%) | 4,637 (49.7%) |
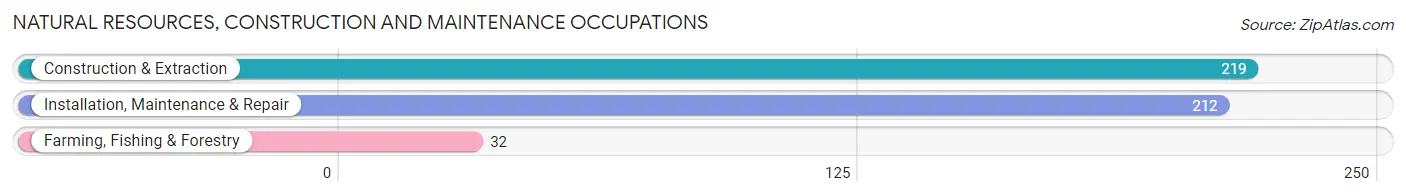
Natural Resources, Construction and Maintenance Occupations
The most common Natural Resources, Construction and Maintenance occupations in Ashland are Construction & Extraction (219 | 2.4%), Installation, Maintenance & Repair (212 | 2.3%), and Farming, Fishing & Forestry (32 | 0.3%).
Natural Resources, Construction and Maintenance Occupations by Sex
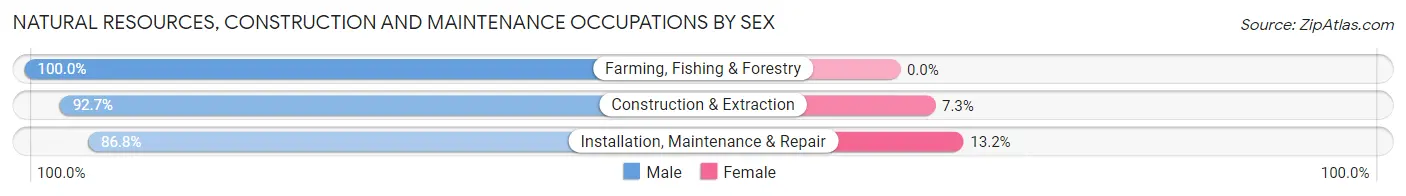
| Occupation | Male | Female |
| Farming, Fishing & Forestry | 32 (100.0%) | 0 (0.0%) |
| Construction & Extraction | 203 (92.7%) | 16 (7.3%) |
| Installation, Maintenance & Repair | 184 (86.8%) | 28 (13.2%) |
| Total (Category) | 419 (90.5%) | 44 (9.5%) |
| Total (Overall) | 4,685 (50.3%) | 4,637 (49.7%) |
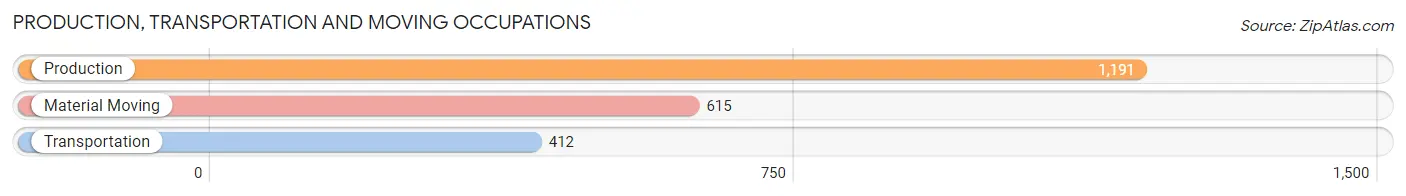
Production, Transportation and Moving Occupations
The most common Production, Transportation and Moving occupations in Ashland are Production (1,191 | 12.8%), Material Moving (615 | 6.6%), and Transportation (412 | 4.4%).
Production, Transportation and Moving Occupations by Sex
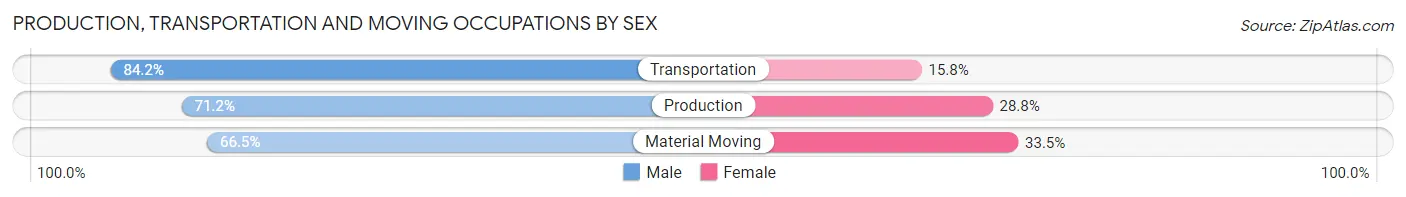
| Occupation | Male | Female |
| Production | 848 (71.2%) | 343 (28.8%) |
| Transportation | 347 (84.2%) | 65 (15.8%) |
| Material Moving | 409 (66.5%) | 206 (33.5%) |
| Total (Category) | 1,604 (72.3%) | 614 (27.7%) |
| Total (Overall) | 4,685 (50.3%) | 4,637 (49.7%) |
Employment Industries by Sex in Ashland
Employment Industries in Ashland
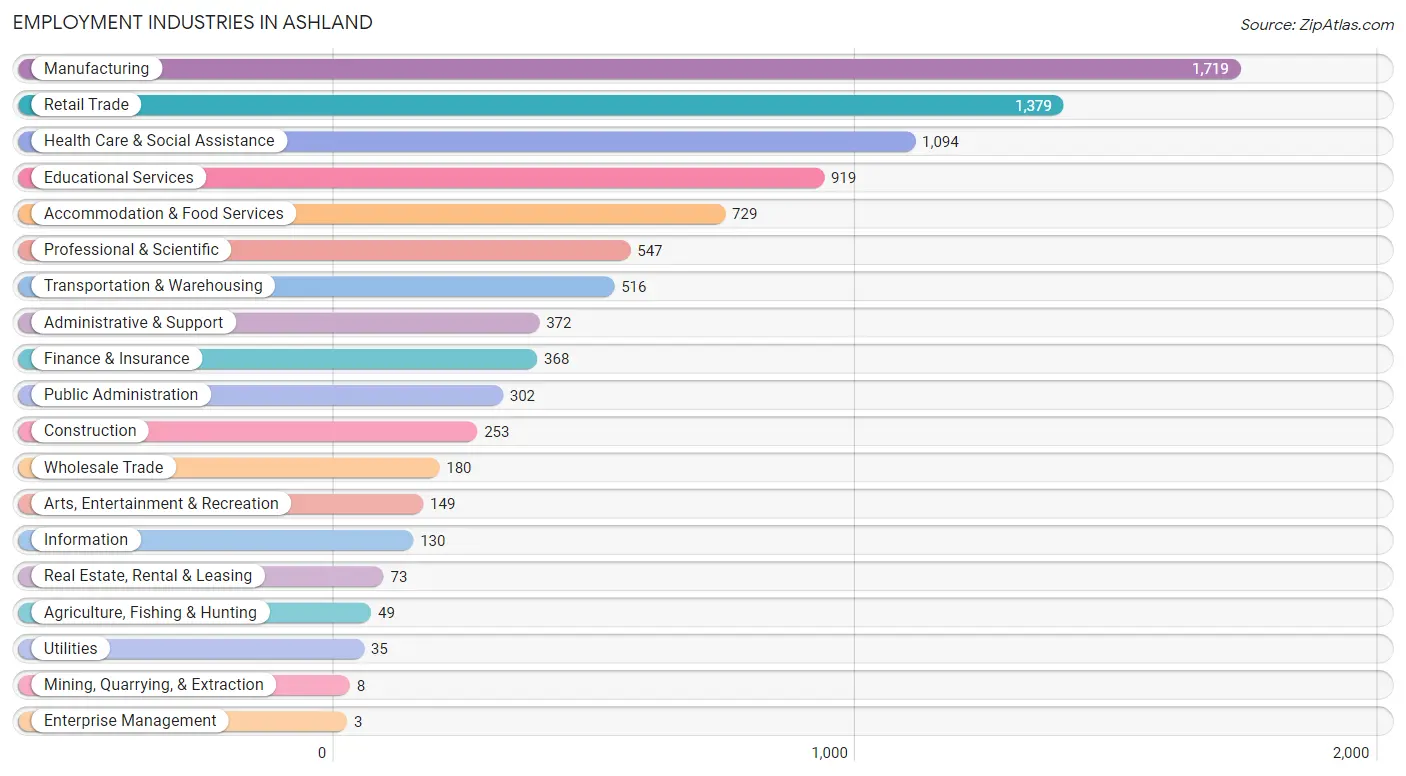
The major employment industries in Ashland include Manufacturing (1,719 | 18.4%), Retail Trade (1,379 | 14.8%), Health Care & Social Assistance (1,094 | 11.7%), Educational Services (919 | 9.9%), and Accommodation & Food Services (729 | 7.8%).
Employment Industries by Sex in Ashland
The Ashland industries that see more men than women are Mining, Quarrying, & Extraction (100.0%), Utilities (100.0%), and Enterprise Management (100.0%), whereas the industries that tend to have a higher number of women are Real Estate, Rental & Leasing (91.8%), Health Care & Social Assistance (80.2%), and Accommodation & Food Services (67.8%).
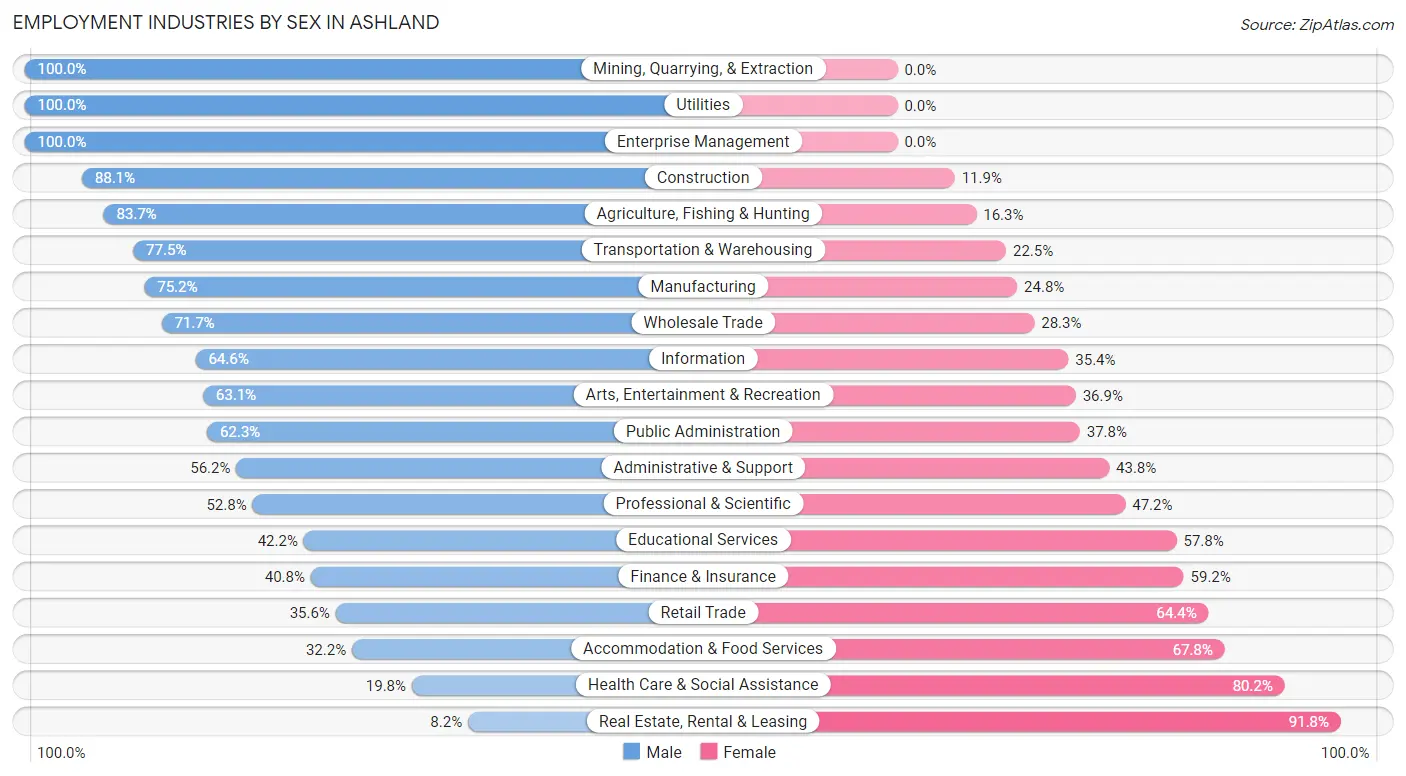
| Industry | Male | Female |
| Agriculture, Fishing & Hunting | 41 (83.7%) | 8 (16.3%) |
| Mining, Quarrying, & Extraction | 8 (100.0%) | 0 (0.0%) |
| Construction | 223 (88.1%) | 30 (11.9%) |
| Manufacturing | 1,293 (75.2%) | 426 (24.8%) |
| Wholesale Trade | 129 (71.7%) | 51 (28.3%) |
| Retail Trade | 491 (35.6%) | 888 (64.4%) |
| Transportation & Warehousing | 400 (77.5%) | 116 (22.5%) |
| Utilities | 35 (100.0%) | 0 (0.0%) |
| Information | 84 (64.6%) | 46 (35.4%) |
| Finance & Insurance | 150 (40.8%) | 218 (59.2%) |
| Real Estate, Rental & Leasing | 6 (8.2%) | 67 (91.8%) |
| Professional & Scientific | 289 (52.8%) | 258 (47.2%) |
| Enterprise Management | 3 (100.0%) | 0 (0.0%) |
| Administrative & Support | 209 (56.2%) | 163 (43.8%) |
| Educational Services | 388 (42.2%) | 531 (57.8%) |
| Health Care & Social Assistance | 217 (19.8%) | 877 (80.2%) |
| Arts, Entertainment & Recreation | 94 (63.1%) | 55 (36.9%) |
| Accommodation & Food Services | 235 (32.2%) | 494 (67.8%) |
| Public Administration | 188 (62.3%) | 114 (37.8%) |
| Total | 4,685 (50.3%) | 4,637 (49.7%) |
Education in Ashland
School Enrollment in Ashland
The most common levels of schooling among the 5,083 students in Ashland are college / undergraduate (1,682 | 33.1%), middle school (1,098 | 21.6%), and high school (878 | 17.3%).
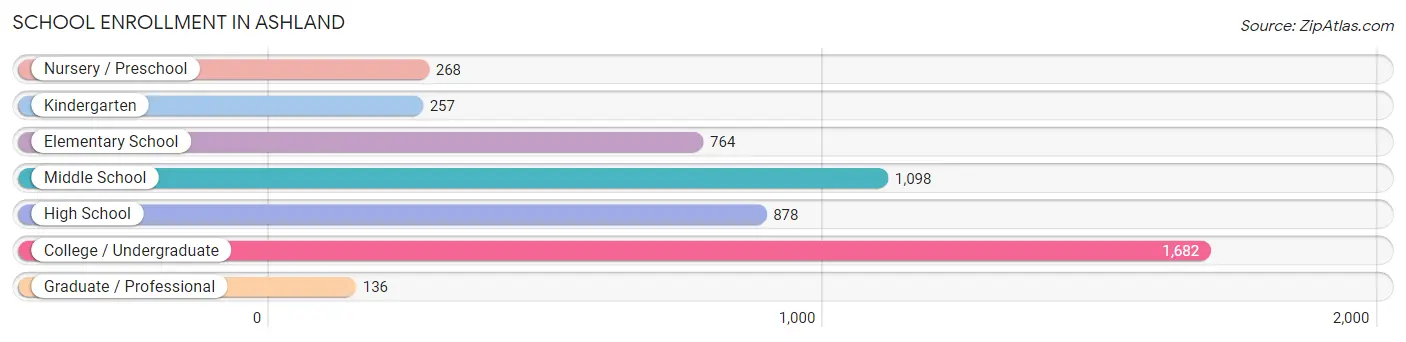
| School Level | # Students | % Students |
| Nursery / Preschool | 268 | 5.3% |
| Kindergarten | 257 | 5.1% |
| Elementary School | 764 | 15.0% |
| Middle School | 1,098 | 21.6% |
| High School | 878 | 17.3% |
| College / Undergraduate | 1,682 | 33.1% |
| Graduate / Professional | 136 | 2.7% |
| Total | 5,083 | 100.0% |
School Enrollment by Age by Funding Source in Ashland
Out of a total of 5,083 students who are enrolled in schools in Ashland, 1,850 (36.4%) attend a private institution, while the remaining 3,233 (63.6%) are enrolled in public schools. The age group of 20 to 24 year olds has the highest likelihood of being enrolled in private schools, with 774 (86.6% in the age bracket) enrolled. Conversely, the age group of 15 to 17 year olds has the lowest likelihood of being enrolled in a private school, with 763 (100.0% in the age bracket) attending a public institution.
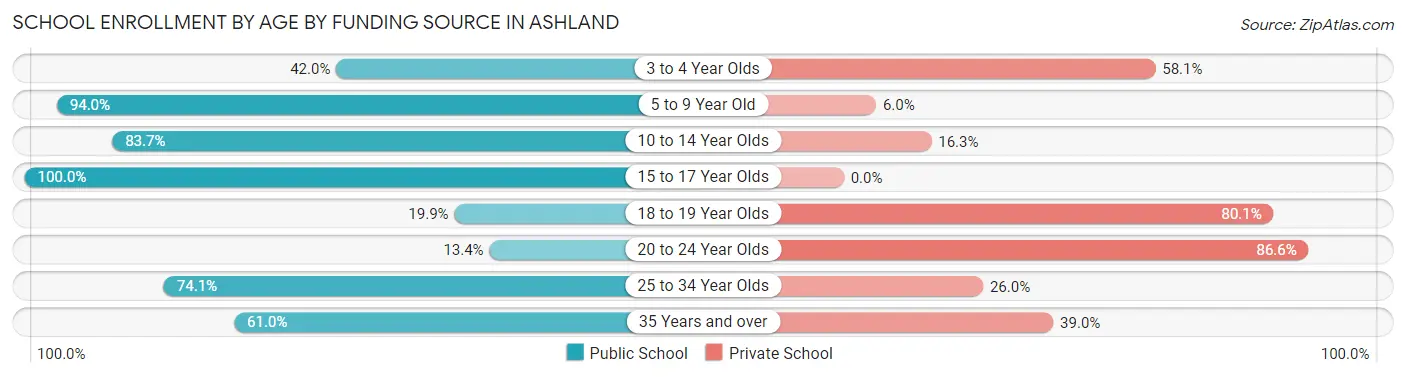
| Age Bracket | Public School | Private School |
| 3 to 4 Year Olds | 99 (41.9%) | 137 (58.1%) |
| 5 to 9 Year Old | 843 (94.0%) | 54 (6.0%) |
| 10 to 14 Year Olds | 1,046 (83.7%) | 204 (16.3%) |
| 15 to 17 Year Olds | 763 (100.0%) | 0 (0.0%) |
| 18 to 19 Year Olds | 141 (19.9%) | 566 (80.1%) |
| 20 to 24 Year Olds | 120 (13.4%) | 774 (86.6%) |
| 25 to 34 Year Olds | 97 (74.1%) | 34 (26.0%) |
| 35 Years and over | 125 (61.0%) | 80 (39.0%) |
| Total | 3,233 (63.6%) | 1,850 (36.4%) |
Educational Attainment by Field of Study in Ashland
Education (811 | 23.2%), business (732 | 20.9%), science & technology (457 | 13.1%), psychology (246 | 7.0%), and bio, nature & agricultural (209 | 6.0%) are the most common fields of study among 3,495 individuals in Ashland who have obtained a bachelor's degree or higher.
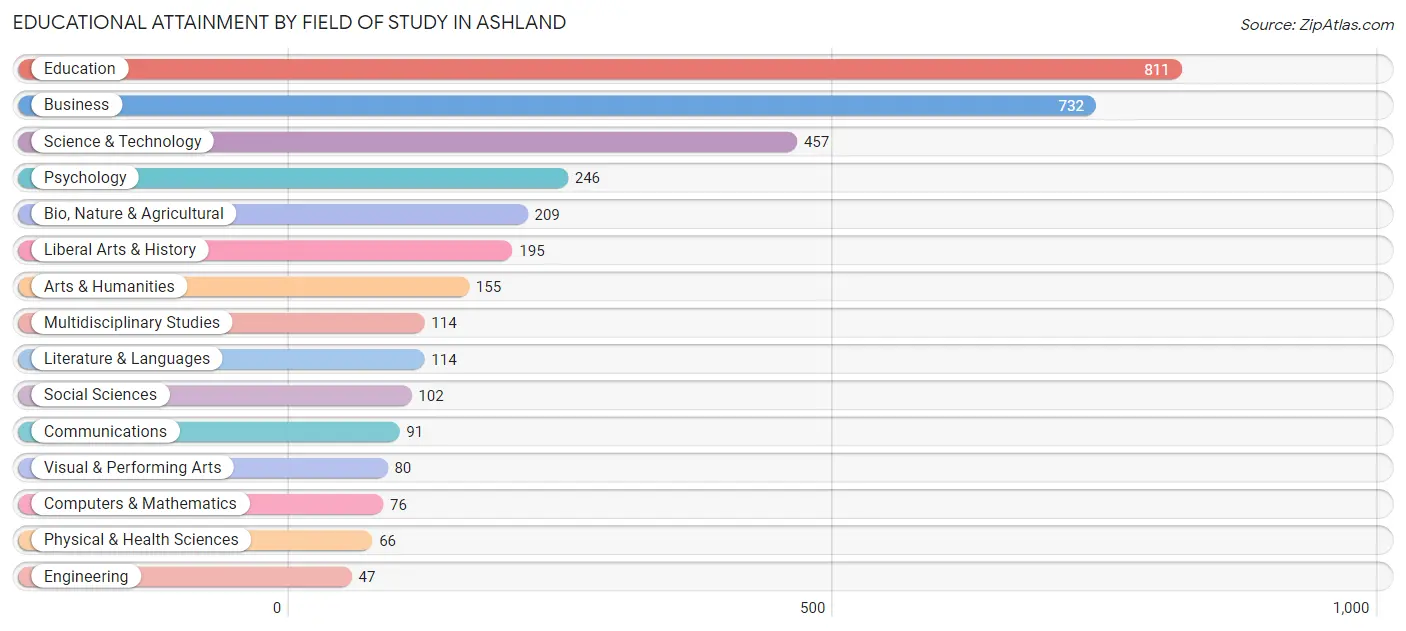
| Field of Study | # Graduates | % Graduates |
| Computers & Mathematics | 76 | 2.2% |
| Bio, Nature & Agricultural | 209 | 6.0% |
| Physical & Health Sciences | 66 | 1.9% |
| Psychology | 246 | 7.0% |
| Social Sciences | 102 | 2.9% |
| Engineering | 47 | 1.3% |
| Multidisciplinary Studies | 114 | 3.3% |
| Science & Technology | 457 | 13.1% |
| Business | 732 | 20.9% |
| Education | 811 | 23.2% |
| Literature & Languages | 114 | 3.3% |
| Liberal Arts & History | 195 | 5.6% |
| Visual & Performing Arts | 80 | 2.3% |
| Communications | 91 | 2.6% |
| Arts & Humanities | 155 | 4.4% |
| Total | 3,495 | 100.0% |
Transportation & Commute in Ashland
Vehicle Availability by Sex in Ashland
The most prevalent vehicle ownership categories in Ashland are males with 2 vehicles (2,239, accounting for 50.3%) and females with 2 vehicles (2,060, making up 54.2%).
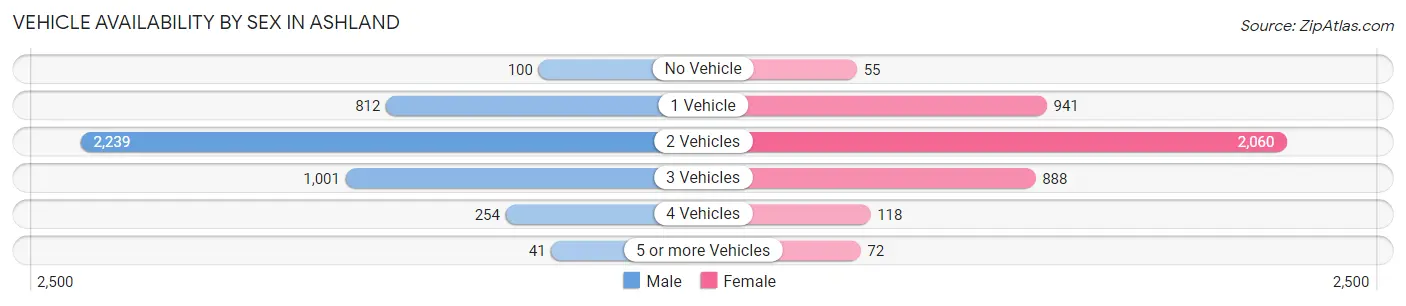
| Vehicles Available | Male | Female |
| No Vehicle | 100 (2.2%) | 55 (1.3%) |
| 1 Vehicle | 812 (18.3%) | 941 (22.8%) |
| 2 Vehicles | 2,239 (50.3%) | 2,060 (49.8%) |
| 3 Vehicles | 1,001 (22.5%) | 888 (21.5%) |
| 4 Vehicles | 254 (5.7%) | 118 (2.9%) |
| 5 or more Vehicles | 41 (0.9%) | 72 (1.7%) |
| Total | 4,447 (100.0%) | 4,134 (100.0%) |
Commute Time in Ashland
The most frequently occuring commute durations in Ashland are 5 to 9 minutes (2,447 commuters, 29.0%), 10 to 14 minutes (1,702 commuters, 20.2%), and less than 5 minutes (922 commuters, 10.9%).
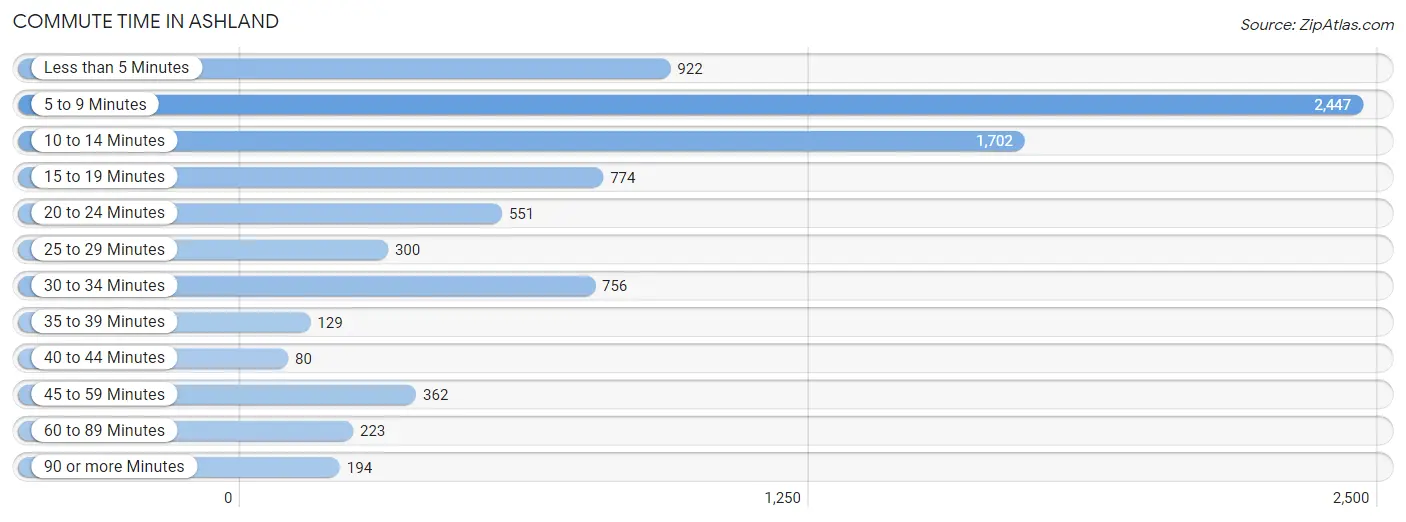
| Commute Time | # Commuters | % Commuters |
| Less than 5 Minutes | 922 | 10.9% |
| 5 to 9 Minutes | 2,447 | 29.0% |
| 10 to 14 Minutes | 1,702 | 20.2% |
| 15 to 19 Minutes | 774 | 9.2% |
| 20 to 24 Minutes | 551 | 6.5% |
| 25 to 29 Minutes | 300 | 3.5% |
| 30 to 34 Minutes | 756 | 9.0% |
| 35 to 39 Minutes | 129 | 1.5% |
| 40 to 44 Minutes | 80 | 0.9% |
| 45 to 59 Minutes | 362 | 4.3% |
| 60 to 89 Minutes | 223 | 2.6% |
| 90 or more Minutes | 194 | 2.3% |
Commute Time by Sex in Ashland
The most common commute times in Ashland are 5 to 9 minutes (1,252 commuters, 29.2%) for males and 5 to 9 minutes (1,195 commuters, 28.8%) for females.
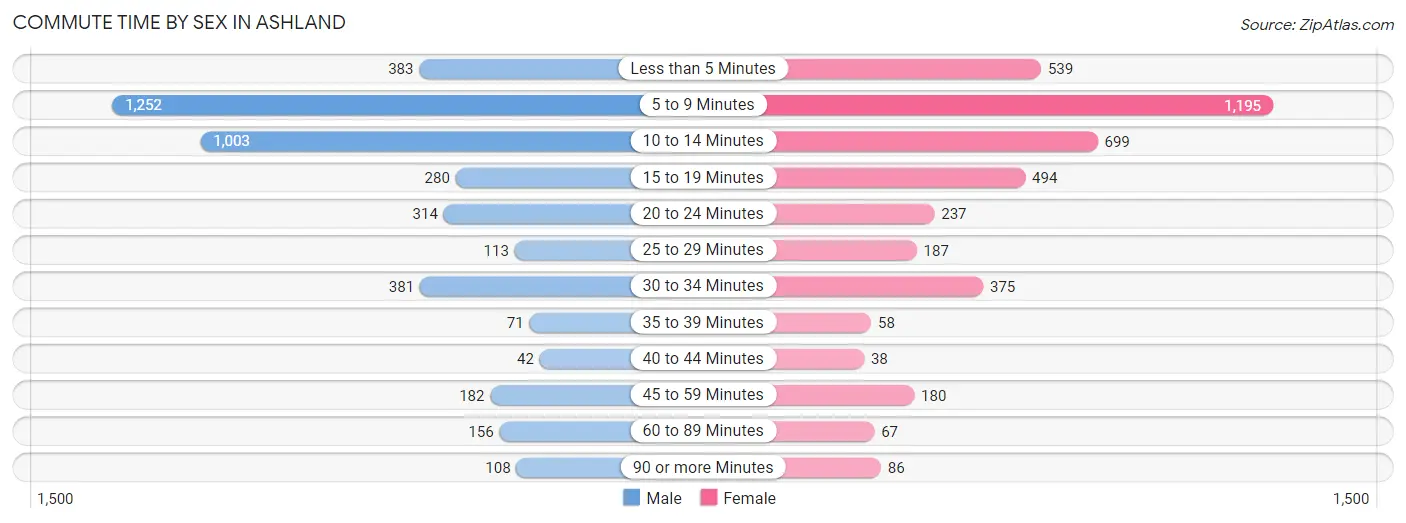
| Commute Time | Male | Female |
| Less than 5 Minutes | 383 (8.9%) | 539 (13.0%) |
| 5 to 9 Minutes | 1,252 (29.2%) | 1,195 (28.8%) |
| 10 to 14 Minutes | 1,003 (23.4%) | 699 (16.8%) |
| 15 to 19 Minutes | 280 (6.5%) | 494 (11.9%) |
| 20 to 24 Minutes | 314 (7.3%) | 237 (5.7%) |
| 25 to 29 Minutes | 113 (2.6%) | 187 (4.5%) |
| 30 to 34 Minutes | 381 (8.9%) | 375 (9.0%) |
| 35 to 39 Minutes | 71 (1.7%) | 58 (1.4%) |
| 40 to 44 Minutes | 42 (1.0%) | 38 (0.9%) |
| 45 to 59 Minutes | 182 (4.3%) | 180 (4.3%) |
| 60 to 89 Minutes | 156 (3.6%) | 67 (1.6%) |
| 90 or more Minutes | 108 (2.5%) | 86 (2.1%) |
Time of Departure to Work by Sex in Ashland
The most frequent times of departure to work in Ashland are 7:30 AM to 7:59 AM (715, 16.7%) for males and 7:30 AM to 7:59 AM (744, 17.9%) for females.
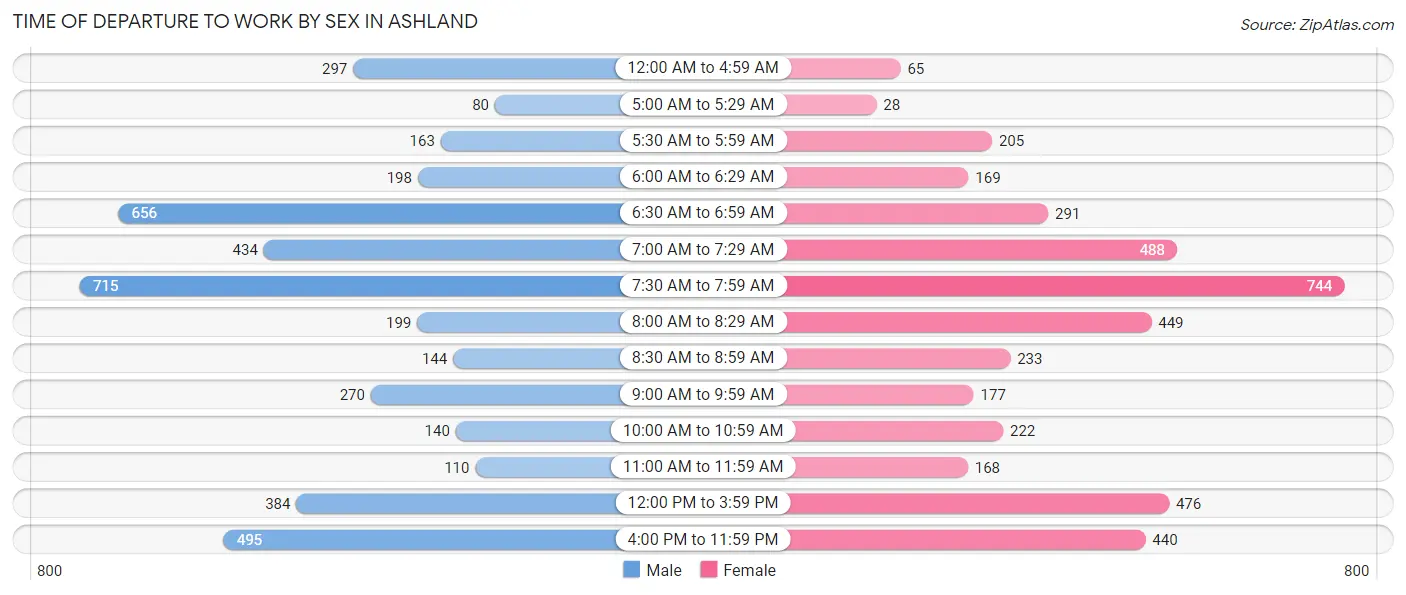
| Time of Departure | Male | Female |
| 12:00 AM to 4:59 AM | 297 (6.9%) | 65 (1.6%) |
| 5:00 AM to 5:29 AM | 80 (1.9%) | 28 (0.7%) |
| 5:30 AM to 5:59 AM | 163 (3.8%) | 205 (4.9%) |
| 6:00 AM to 6:29 AM | 198 (4.6%) | 169 (4.1%) |
| 6:30 AM to 6:59 AM | 656 (15.3%) | 291 (7.0%) |
| 7:00 AM to 7:29 AM | 434 (10.1%) | 488 (11.7%) |
| 7:30 AM to 7:59 AM | 715 (16.7%) | 744 (17.9%) |
| 8:00 AM to 8:29 AM | 199 (4.6%) | 449 (10.8%) |
| 8:30 AM to 8:59 AM | 144 (3.4%) | 233 (5.6%) |
| 9:00 AM to 9:59 AM | 270 (6.3%) | 177 (4.3%) |
| 10:00 AM to 10:59 AM | 140 (3.3%) | 222 (5.3%) |
| 11:00 AM to 11:59 AM | 110 (2.6%) | 168 (4.0%) |
| 12:00 PM to 3:59 PM | 384 (9.0%) | 476 (11.5%) |
| 4:00 PM to 11:59 PM | 495 (11.6%) | 440 (10.6%) |
| Total | 4,285 (100.0%) | 4,155 (100.0%) |
Housing Occupancy in Ashland
Occupancy by Ownership in Ashland
Of the total 7,944 dwellings in Ashland, owner-occupied units account for 5,054 (63.6%), while renter-occupied units make up 2,890 (36.4%).
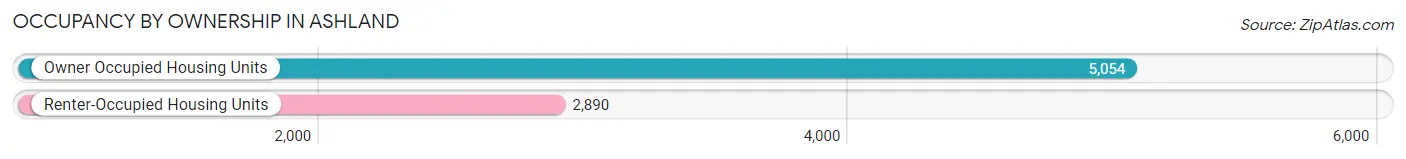
| Occupancy | # Housing Units | % Housing Units |
| Owner Occupied Housing Units | 5,054 | 63.6% |
| Renter-Occupied Housing Units | 2,890 | 36.4% |
| Total Occupied Housing Units | 7,944 | 100.0% |
Occupancy by Household Size in Ashland
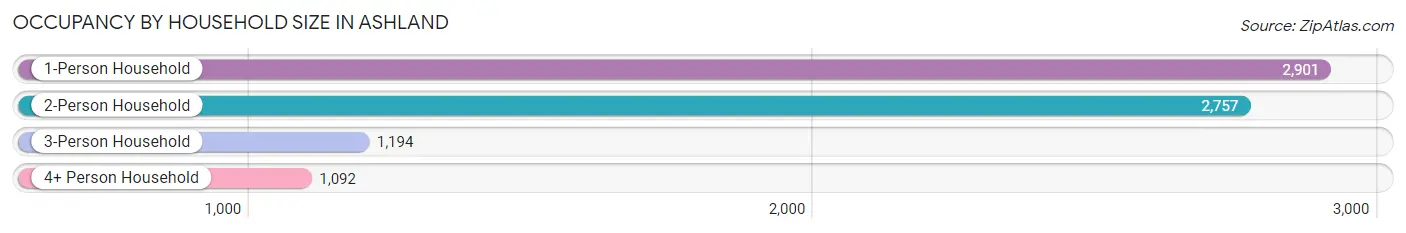
| Household Size | # Housing Units | % Housing Units |
| 1-Person Household | 2,901 | 36.5% |
| 2-Person Household | 2,757 | 34.7% |
| 3-Person Household | 1,194 | 15.0% |
| 4+ Person Household | 1,092 | 13.8% |
| Total Housing Units | 7,944 | 100.0% |
Occupancy by Ownership by Household Size in Ashland
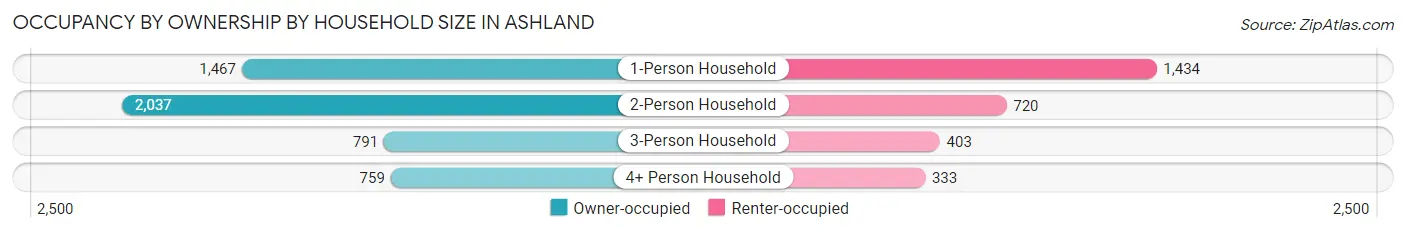
| Household Size | Owner-occupied | Renter-occupied |
| 1-Person Household | 1,467 (50.6%) | 1,434 (49.4%) |
| 2-Person Household | 2,037 (73.9%) | 720 (26.1%) |
| 3-Person Household | 791 (66.2%) | 403 (33.8%) |
| 4+ Person Household | 759 (69.5%) | 333 (30.5%) |
| Total Housing Units | 5,054 (63.6%) | 2,890 (36.4%) |
Occupancy by Educational Attainment in Ashland
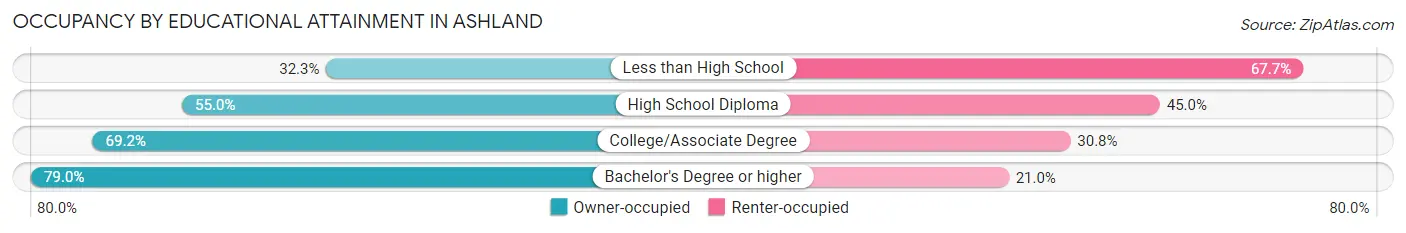
| Household Size | Owner-occupied | Renter-occupied |
| Less than High School | 211 (32.3%) | 442 (67.7%) |
| High School Diploma | 1,597 (55.0%) | 1,306 (45.0%) |
| College/Associate Degree | 1,555 (69.2%) | 692 (30.8%) |
| Bachelor's Degree or higher | 1,691 (79.0%) | 450 (21.0%) |
Occupancy by Age of Householder in Ashland
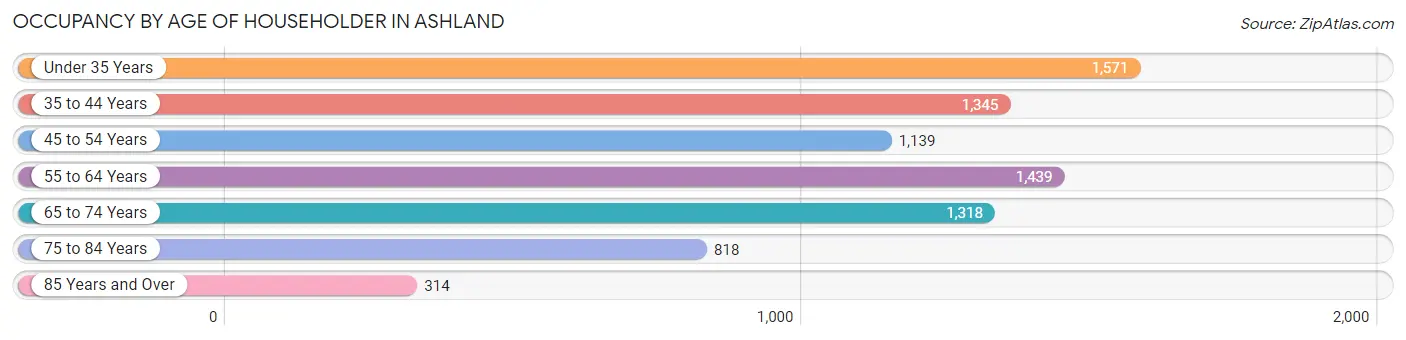
| Age Bracket | # Households | % Households |
| Under 35 Years | 1,571 | 19.8% |
| 35 to 44 Years | 1,345 | 16.9% |
| 45 to 54 Years | 1,139 | 14.3% |
| 55 to 64 Years | 1,439 | 18.1% |
| 65 to 74 Years | 1,318 | 16.6% |
| 75 to 84 Years | 818 | 10.3% |
| 85 Years and Over | 314 | 4.0% |
| Total | 7,944 | 100.0% |
Housing Finances in Ashland
Median Income by Occupancy in Ashland
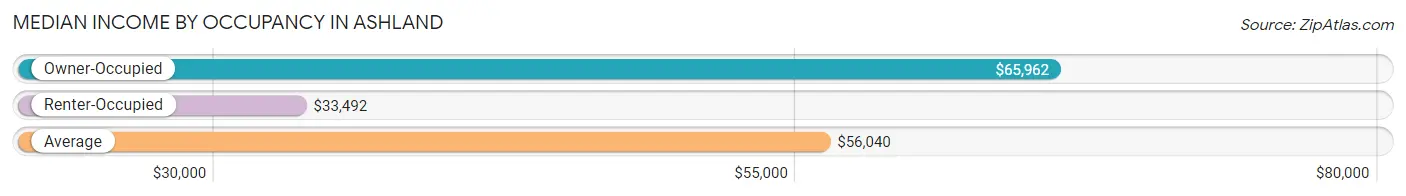
| Occupancy Type | # Households | Median Income |
| Owner-Occupied | 5,054 (63.6%) | $65,962 |
| Renter-Occupied | 2,890 (36.4%) | $33,492 |
| Average | 7,944 (100.0%) | $56,040 |
Occupancy by Householder Income Bracket in Ashland
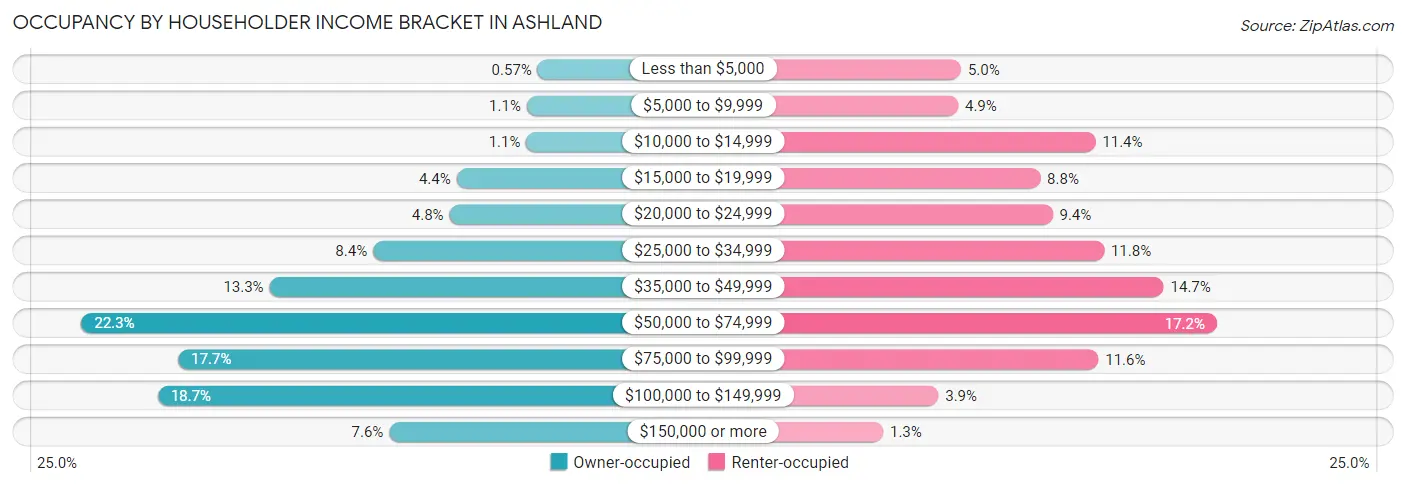
| Income Bracket | Owner-occupied | Renter-occupied |
| Less than $5,000 | 29 (0.6%) | 145 (5.0%) |
| $5,000 to $9,999 | 55 (1.1%) | 141 (4.9%) |
| $10,000 to $14,999 | 56 (1.1%) | 330 (11.4%) |
| $15,000 to $19,999 | 224 (4.4%) | 254 (8.8%) |
| $20,000 to $24,999 | 241 (4.8%) | 271 (9.4%) |
| $25,000 to $34,999 | 425 (8.4%) | 342 (11.8%) |
| $35,000 to $49,999 | 674 (13.3%) | 424 (14.7%) |
| $50,000 to $74,999 | 1,127 (22.3%) | 497 (17.2%) |
| $75,000 to $99,999 | 894 (17.7%) | 334 (11.6%) |
| $100,000 to $149,999 | 943 (18.7%) | 114 (3.9%) |
| $150,000 or more | 386 (7.6%) | 38 (1.3%) |
| Total | 5,054 (100.0%) | 2,890 (100.0%) |
Monthly Housing Cost Tiers in Ashland
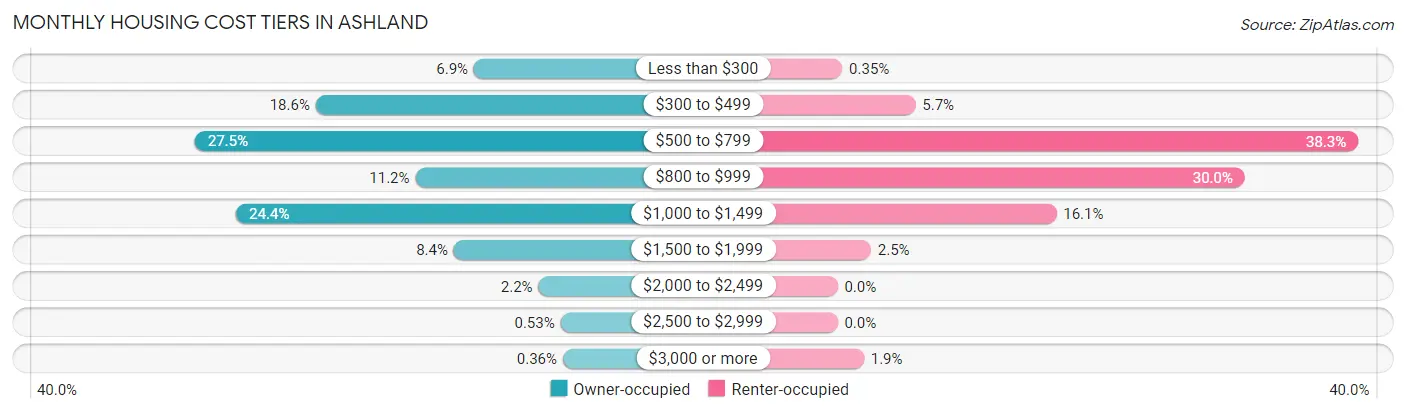
| Monthly Cost | Owner-occupied | Renter-occupied |
| Less than $300 | 349 (6.9%) | 10 (0.4%) |
| $300 to $499 | 938 (18.6%) | 166 (5.7%) |
| $500 to $799 | 1,388 (27.5%) | 1,108 (38.3%) |
| $800 to $999 | 567 (11.2%) | 867 (30.0%) |
| $1,000 to $1,499 | 1,234 (24.4%) | 466 (16.1%) |
| $1,500 to $1,999 | 424 (8.4%) | 71 (2.5%) |
| $2,000 to $2,499 | 109 (2.2%) | 0 (0.0%) |
| $2,500 to $2,999 | 27 (0.5%) | 0 (0.0%) |
| $3,000 or more | 18 (0.4%) | 56 (1.9%) |
| Total | 5,054 (100.0%) | 2,890 (100.0%) |
Physical Housing Characteristics in Ashland
Housing Structures in Ashland
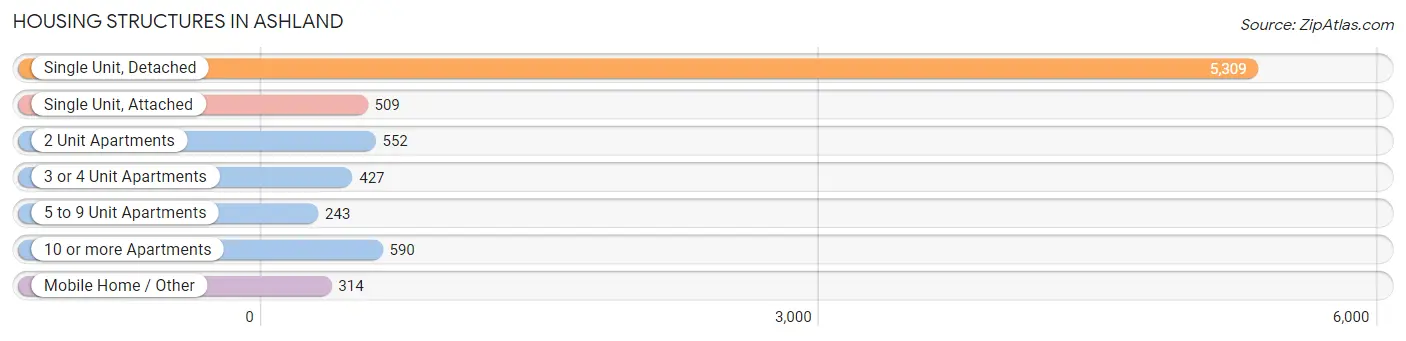
| Structure Type | # Housing Units | % Housing Units |
| Single Unit, Detached | 5,309 | 66.8% |
| Single Unit, Attached | 509 | 6.4% |
| 2 Unit Apartments | 552 | 7.0% |
| 3 or 4 Unit Apartments | 427 | 5.4% |
| 5 to 9 Unit Apartments | 243 | 3.1% |
| 10 or more Apartments | 590 | 7.4% |
| Mobile Home / Other | 314 | 4.0% |
| Total | 7,944 | 100.0% |
Housing Structures by Occupancy in Ashland
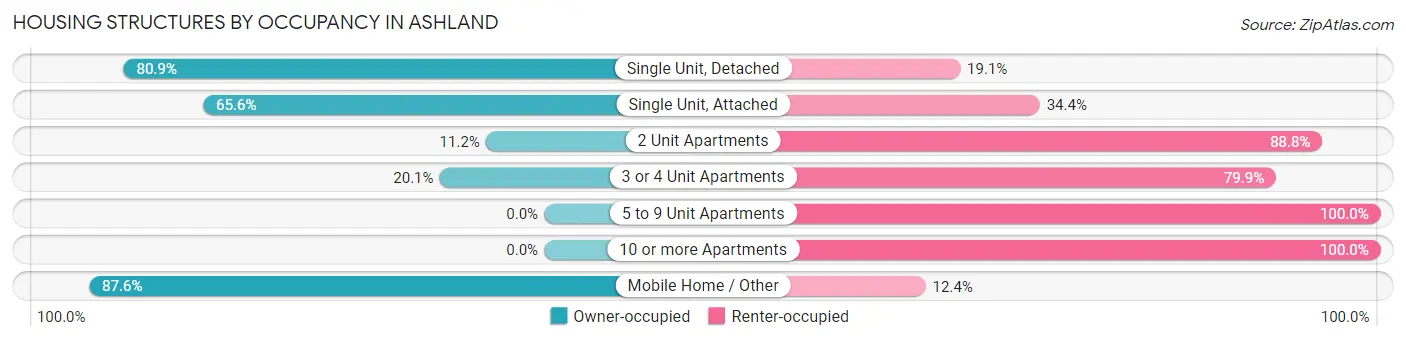
| Structure Type | Owner-occupied | Renter-occupied |
| Single Unit, Detached | 4,297 (80.9%) | 1,012 (19.1%) |
| Single Unit, Attached | 334 (65.6%) | 175 (34.4%) |
| 2 Unit Apartments | 62 (11.2%) | 490 (88.8%) |
| 3 or 4 Unit Apartments | 86 (20.1%) | 341 (79.9%) |
| 5 to 9 Unit Apartments | 0 (0.0%) | 243 (100.0%) |
| 10 or more Apartments | 0 (0.0%) | 590 (100.0%) |
| Mobile Home / Other | 275 (87.6%) | 39 (12.4%) |
| Total | 5,054 (63.6%) | 2,890 (36.4%) |
Housing Structures by Number of Rooms in Ashland
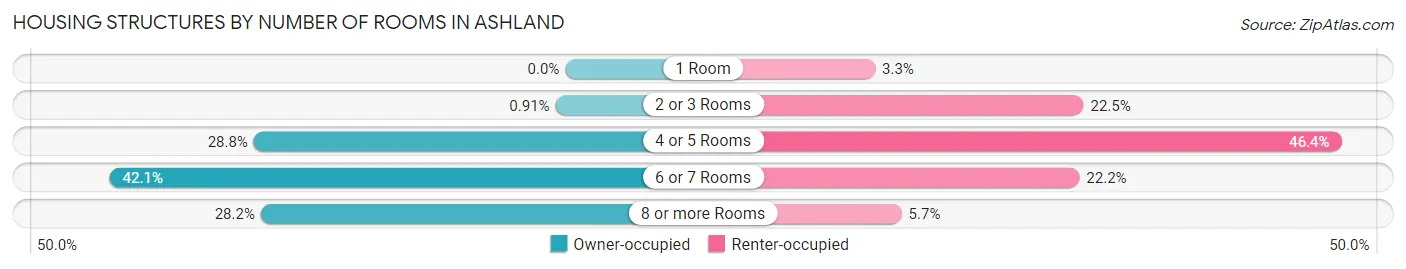
| Number of Rooms | Owner-occupied | Renter-occupied |
| 1 Room | 0 (0.0%) | 94 (3.3%) |
| 2 or 3 Rooms | 46 (0.9%) | 651 (22.5%) |
| 4 or 5 Rooms | 1,456 (28.8%) | 1,340 (46.4%) |
| 6 or 7 Rooms | 2,129 (42.1%) | 640 (22.2%) |
| 8 or more Rooms | 1,423 (28.2%) | 165 (5.7%) |
| Total | 5,054 (100.0%) | 2,890 (100.0%) |
Housing Structure by Heating Type in Ashland
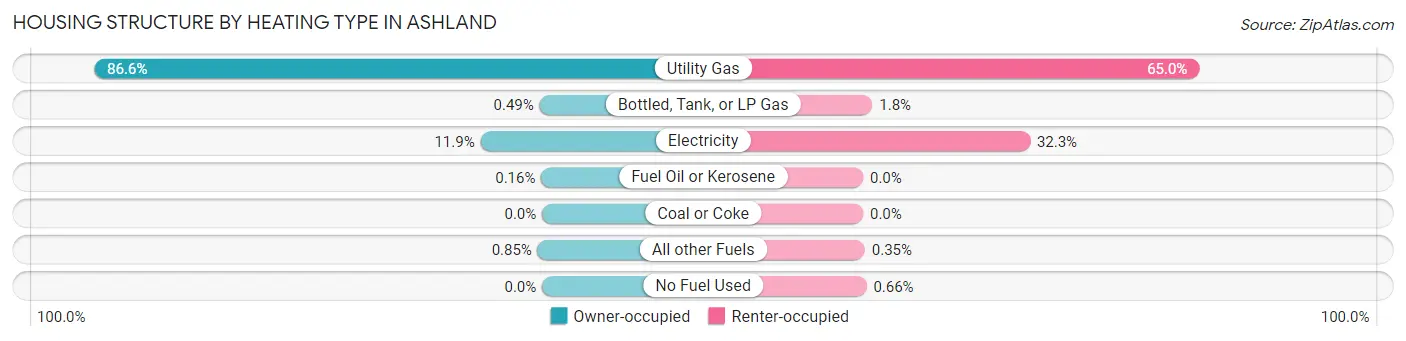
| Heating Type | Owner-occupied | Renter-occupied |
| Utility Gas | 4,376 (86.6%) | 1,877 (64.9%) |
| Bottled, Tank, or LP Gas | 25 (0.5%) | 52 (1.8%) |
| Electricity | 602 (11.9%) | 932 (32.3%) |
| Fuel Oil or Kerosene | 8 (0.2%) | 0 (0.0%) |
| Coal or Coke | 0 (0.0%) | 0 (0.0%) |
| All other Fuels | 43 (0.9%) | 10 (0.4%) |
| No Fuel Used | 0 (0.0%) | 19 (0.7%) |
| Total | 5,054 (100.0%) | 2,890 (100.0%) |
Household Vehicle Usage in Ashland
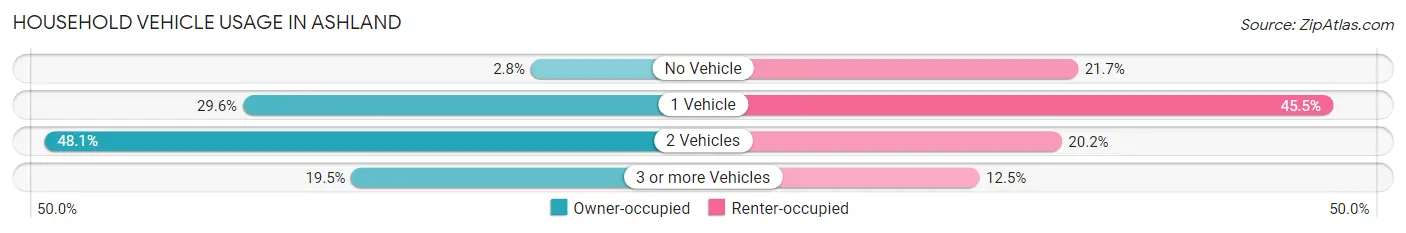
| Vehicles per Household | Owner-occupied | Renter-occupied |
| No Vehicle | 139 (2.8%) | 628 (21.7%) |
| 1 Vehicle | 1,497 (29.6%) | 1,316 (45.5%) |
| 2 Vehicles | 2,433 (48.1%) | 584 (20.2%) |
| 3 or more Vehicles | 985 (19.5%) | 362 (12.5%) |
| Total | 5,054 (100.0%) | 2,890 (100.0%) |
Real Estate & Mortgages in Ashland
Real Estate and Mortgage Overview in Ashland
| Characteristic | Without Mortgage | With Mortgage |
| Housing Units | 1,958 | 3,096 |
| Median Property Value | $130,700 | $138,900 |
| Median Household Income | $56,581 | $276 |
| Monthly Housing Costs | $444 | $18 |
| Real Estate Taxes | $1,478 | $69 |
Property Value by Mortgage Status in Ashland
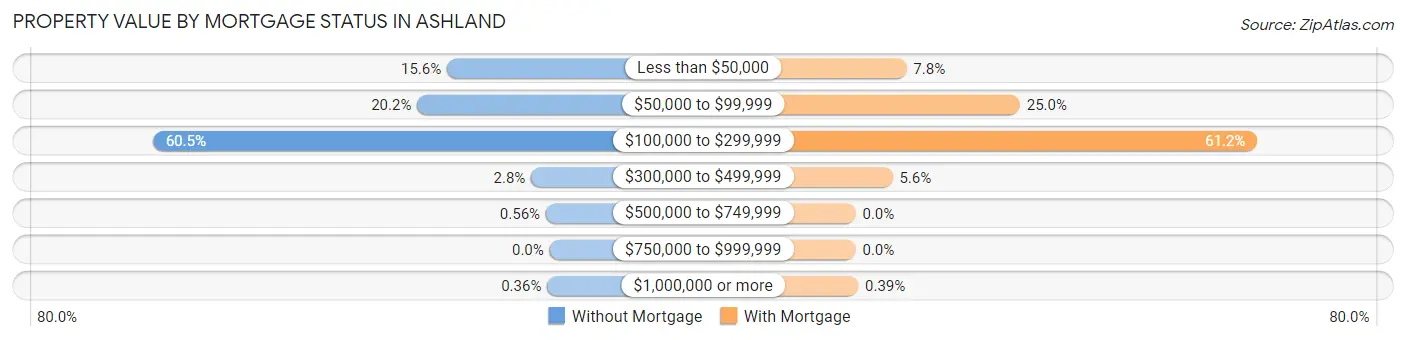
| Property Value | Without Mortgage | With Mortgage |
| Less than $50,000 | 306 (15.6%) | 240 (7.7%) |
| $50,000 to $99,999 | 395 (20.2%) | 775 (25.0%) |
| $100,000 to $299,999 | 1,184 (60.5%) | 1,895 (61.2%) |
| $300,000 to $499,999 | 55 (2.8%) | 174 (5.6%) |
| $500,000 to $749,999 | 11 (0.6%) | 0 (0.0%) |
| $750,000 to $999,999 | 0 (0.0%) | 0 (0.0%) |
| $1,000,000 or more | 7 (0.4%) | 12 (0.4%) |
| Total | 1,958 (100.0%) | 3,096 (100.0%) |
Household Income by Mortgage Status in Ashland
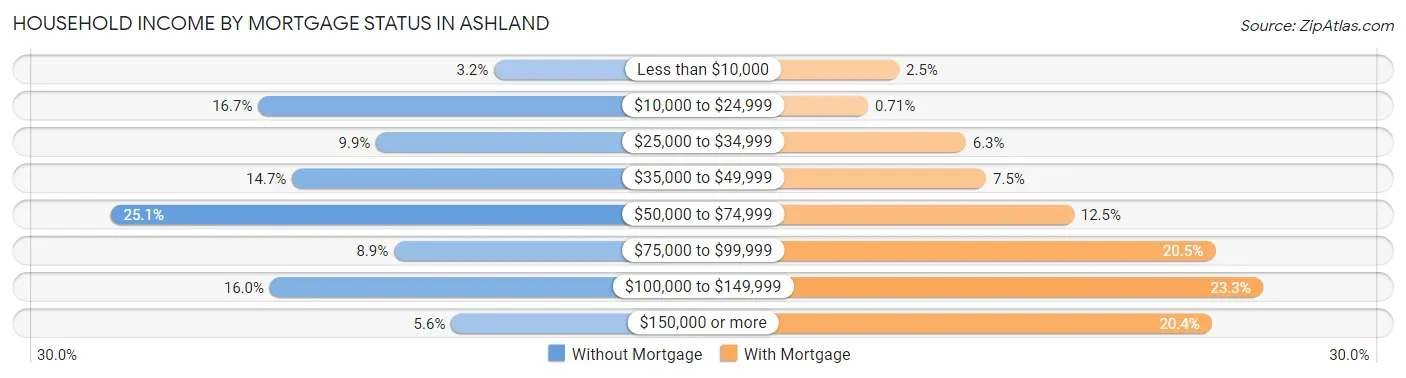
| Household Income | Without Mortgage | With Mortgage |
| Less than $10,000 | 62 (3.2%) | 77 (2.5%) |
| $10,000 to $24,999 | 326 (16.7%) | 22 (0.7%) |
| $25,000 to $34,999 | 194 (9.9%) | 195 (6.3%) |
| $35,000 to $49,999 | 288 (14.7%) | 231 (7.5%) |
| $50,000 to $74,999 | 491 (25.1%) | 386 (12.5%) |
| $75,000 to $99,999 | 174 (8.9%) | 636 (20.5%) |
| $100,000 to $149,999 | 313 (16.0%) | 720 (23.3%) |
| $150,000 or more | 110 (5.6%) | 630 (20.3%) |
| Total | 1,958 (100.0%) | 3,096 (100.0%) |
Property Value to Household Income Ratio in Ashland
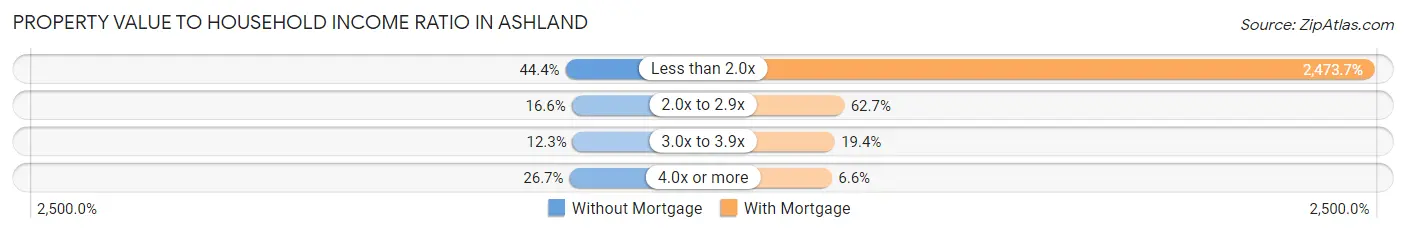
| Value-to-Income Ratio | Without Mortgage | With Mortgage |
| Less than 2.0x | 870 (44.4%) | 76,585 (2,473.7%) |
| 2.0x to 2.9x | 325 (16.6%) | 1,941 (62.7%) |
| 3.0x to 3.9x | 241 (12.3%) | 600 (19.4%) |
| 4.0x or more | 522 (26.7%) | 205 (6.6%) |
| Total | 1,958 (100.0%) | 3,096 (100.0%) |
Real Estate Taxes by Mortgage Status in Ashland
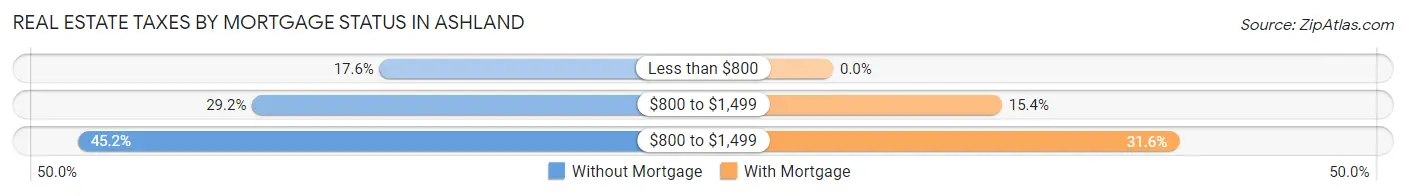
| Property Taxes | Without Mortgage | With Mortgage |
| Less than $800 | 344 (17.6%) | 0 (0.0%) |
| $800 to $1,499 | 572 (29.2%) | 477 (15.4%) |
| $800 to $1,499 | 884 (45.2%) | 978 (31.6%) |
| Total | 1,958 (100.0%) | 3,096 (100.0%) |
Health & Disability in Ashland
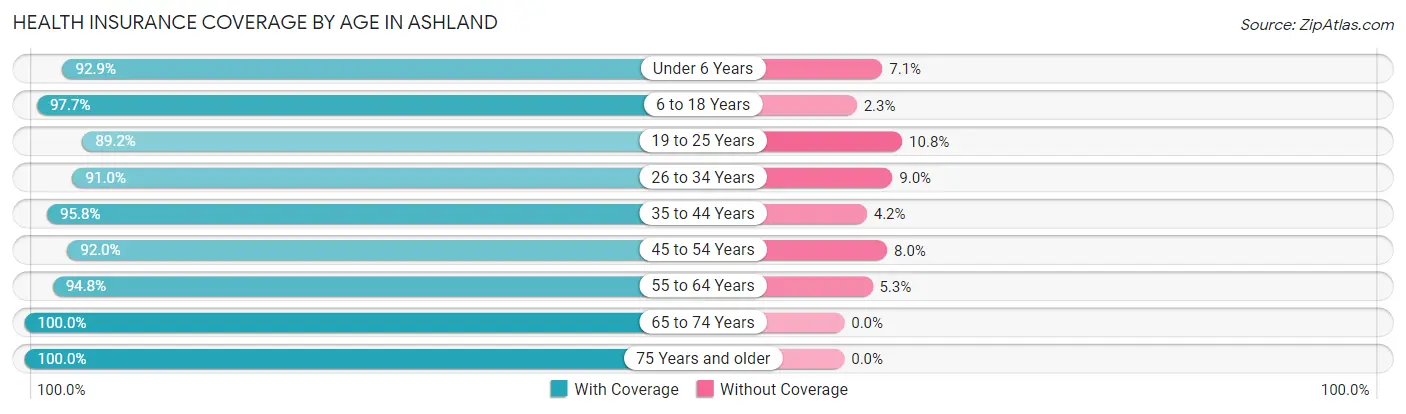
Health Insurance Coverage by Age in Ashland
| Age Bracket | With Coverage | Without Coverage |
| Under 6 Years | 1,035 (92.9%) | 79 (7.1%) |
| 6 to 18 Years | 2,991 (97.7%) | 71 (2.3%) |
| 19 to 25 Years | 2,299 (89.2%) | 278 (10.8%) |
| 26 to 34 Years | 1,911 (91.0%) | 188 (9.0%) |
| 35 to 44 Years | 2,129 (95.8%) | 93 (4.2%) |
| 45 to 54 Years | 1,694 (92.0%) | 147 (8.0%) |
| 55 to 64 Years | 2,130 (94.8%) | 118 (5.2%) |
| 65 to 74 Years | 1,987 (100.0%) | 0 (0.0%) |
| 75 Years and older | 1,671 (100.0%) | 0 (0.0%) |
| Total | 17,847 (94.8%) | 974 (5.2%) |
Health Insurance Coverage by Citizenship Status in Ashland
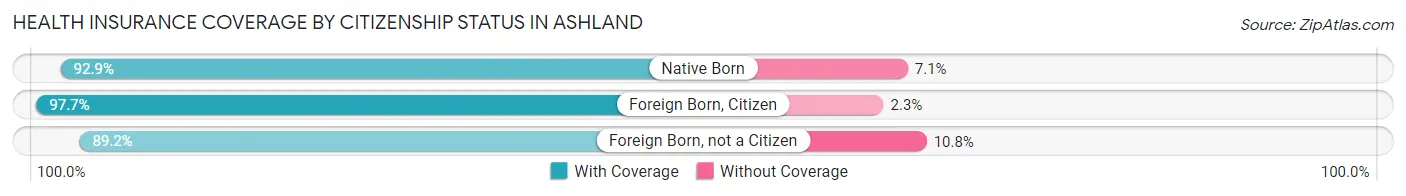
| Citizenship Status | With Coverage | Without Coverage |
| Native Born | 1,035 (92.9%) | 79 (7.1%) |
| Foreign Born, Citizen | 2,991 (97.7%) | 71 (2.3%) |
| Foreign Born, not a Citizen | 2,299 (89.2%) | 278 (10.8%) |
Health Insurance Coverage by Household Income in Ashland
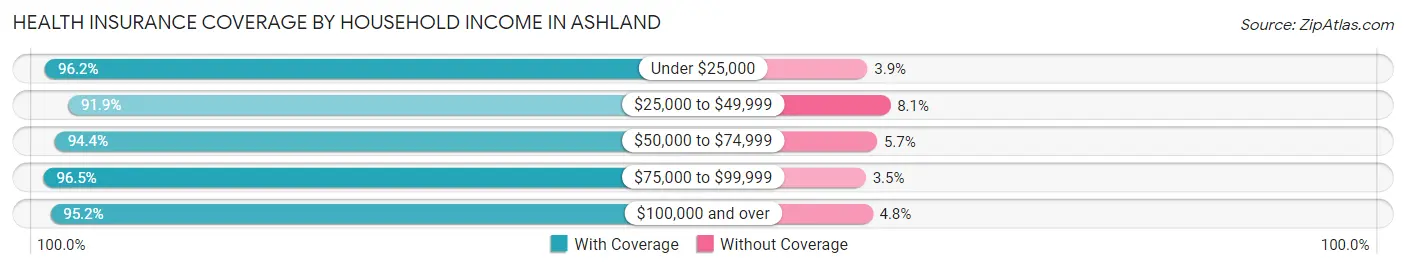
| Household Income | With Coverage | Without Coverage |
| Under $25,000 | 2,598 (96.2%) | 104 (3.8%) |
| $25,000 to $49,999 | 3,384 (91.9%) | 300 (8.1%) |
| $50,000 to $74,999 | 3,507 (94.4%) | 210 (5.7%) |
| $75,000 to $99,999 | 3,486 (96.5%) | 128 (3.5%) |
| $100,000 and over | 3,830 (95.2%) | 194 (4.8%) |
Public vs Private Health Insurance Coverage by Age in Ashland
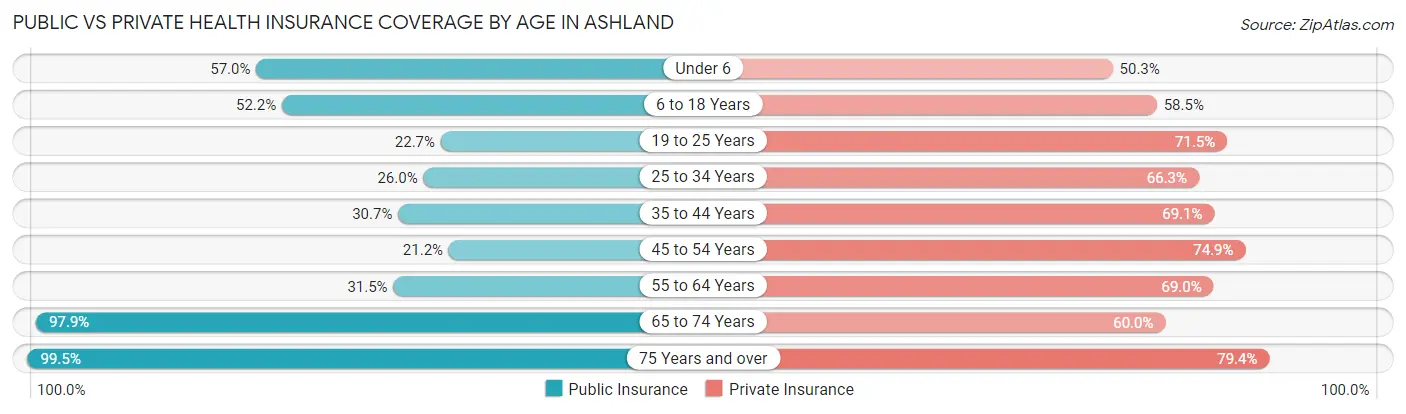
| Age Bracket | Public Insurance | Private Insurance |
| Under 6 | 635 (57.0%) | 560 (50.3%) |
| 6 to 18 Years | 1,599 (52.2%) | 1,790 (58.5%) |
| 19 to 25 Years | 586 (22.7%) | 1,843 (71.5%) |
| 25 to 34 Years | 545 (26.0%) | 1,391 (66.3%) |
| 35 to 44 Years | 681 (30.6%) | 1,536 (69.1%) |
| 45 to 54 Years | 391 (21.2%) | 1,379 (74.9%) |
| 55 to 64 Years | 709 (31.5%) | 1,551 (69.0%) |
| 65 to 74 Years | 1,945 (97.9%) | 1,193 (60.0%) |
| 75 Years and over | 1,662 (99.5%) | 1,326 (79.3%) |
| Total | 8,753 (46.5%) | 12,569 (66.8%) |
Disability Status by Sex by Age in Ashland
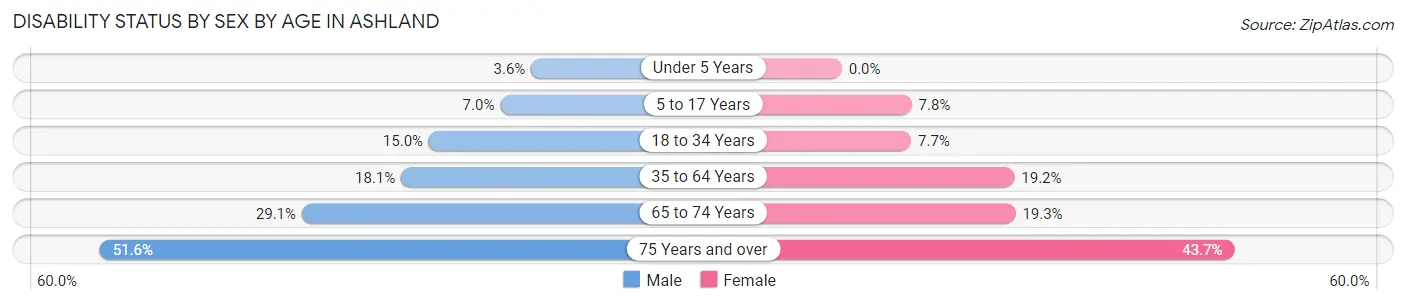
| Age Bracket | Male | Female |
| Under 5 Years | 13 (3.6%) | 0 (0.0%) |
| 5 to 17 Years | 118 (7.0%) | 101 (7.8%) |
| 18 to 34 Years | 357 (15.0%) | 200 (7.7%) |
| 35 to 64 Years | 564 (18.1%) | 613 (19.2%) |
| 65 to 74 Years | 288 (29.1%) | 193 (19.3%) |
| 75 Years and over | 316 (51.6%) | 463 (43.7%) |
Disability Class by Sex by Age in Ashland
Disability Class: Hearing Difficulty
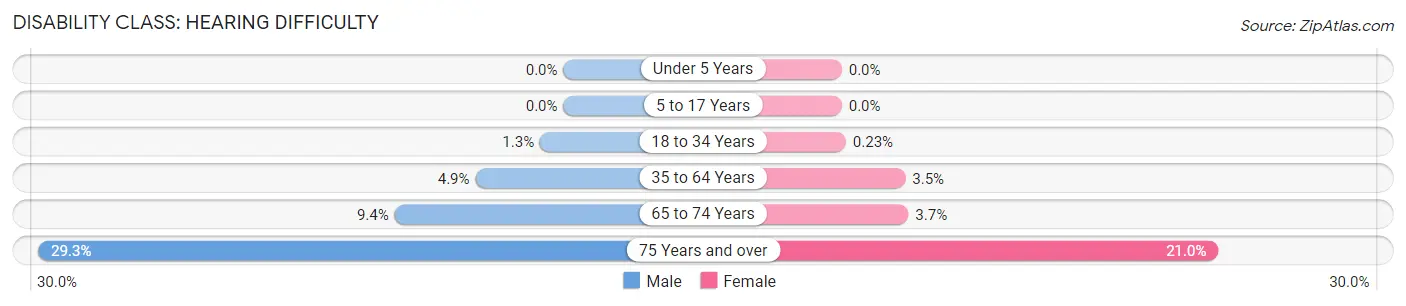
| Age Bracket | Male | Female |
| Under 5 Years | 0 (0.0%) | 0 (0.0%) |
| 5 to 17 Years | 0 (0.0%) | 0 (0.0%) |
| 18 to 34 Years | 31 (1.3%) | 6 (0.2%) |
| 35 to 64 Years | 153 (4.9%) | 113 (3.5%) |
| 65 to 74 Years | 93 (9.4%) | 37 (3.7%) |
| 75 Years and over | 179 (29.2%) | 222 (21.0%) |
Disability Class: Vision Difficulty
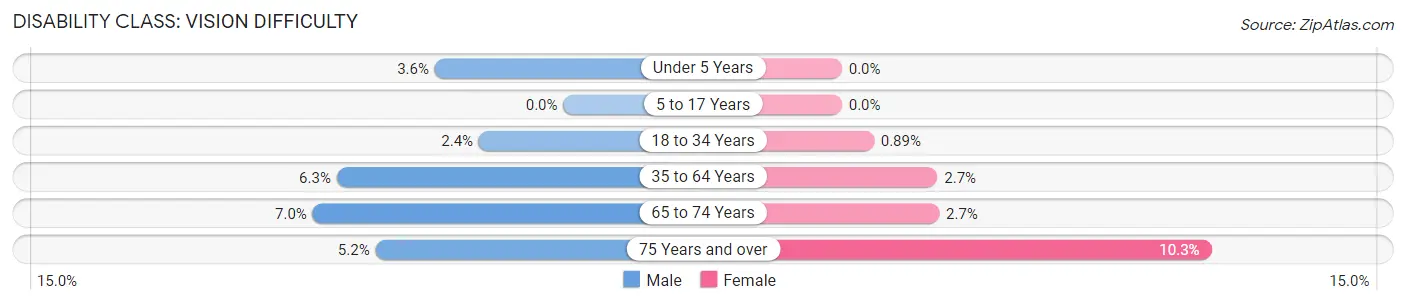
| Age Bracket | Male | Female |
| Under 5 Years | 13 (3.6%) | 0 (0.0%) |
| 5 to 17 Years | 0 (0.0%) | 0 (0.0%) |
| 18 to 34 Years | 56 (2.4%) | 23 (0.9%) |
| 35 to 64 Years | 197 (6.3%) | 85 (2.7%) |
| 65 to 74 Years | 69 (7.0%) | 27 (2.7%) |
| 75 Years and over | 32 (5.2%) | 109 (10.3%) |
Disability Class: Cognitive Difficulty
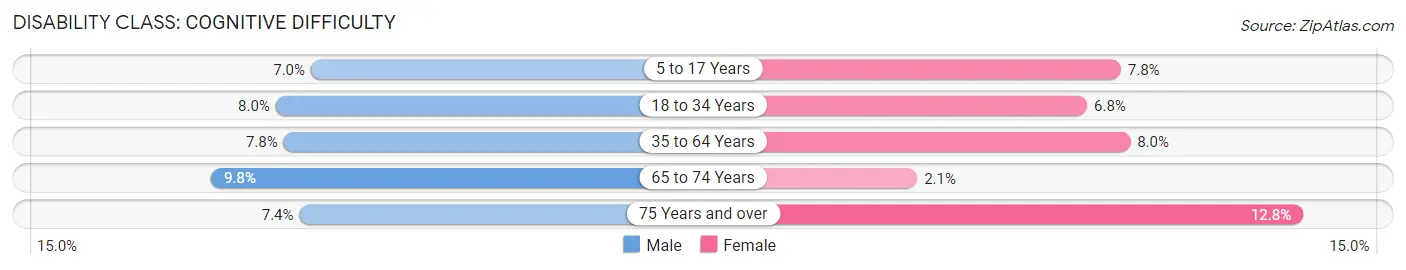
| Age Bracket | Male | Female |
| 5 to 17 Years | 118 (7.0%) | 101 (7.8%) |
| 18 to 34 Years | 191 (8.0%) | 177 (6.8%) |
| 35 to 64 Years | 243 (7.8%) | 256 (8.0%) |
| 65 to 74 Years | 97 (9.8%) | 21 (2.1%) |
| 75 Years and over | 45 (7.3%) | 136 (12.8%) |
Disability Class: Ambulatory Difficulty
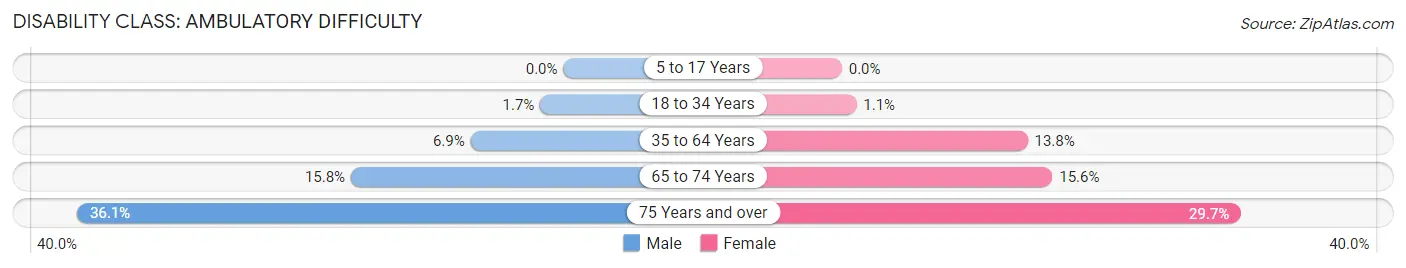
| Age Bracket | Male | Female |
| 5 to 17 Years | 0 (0.0%) | 0 (0.0%) |
| 18 to 34 Years | 41 (1.7%) | 28 (1.1%) |
| 35 to 64 Years | 215 (6.9%) | 440 (13.8%) |
| 65 to 74 Years | 156 (15.8%) | 156 (15.6%) |
| 75 Years and over | 221 (36.1%) | 314 (29.6%) |
Disability Class: Self-Care Difficulty
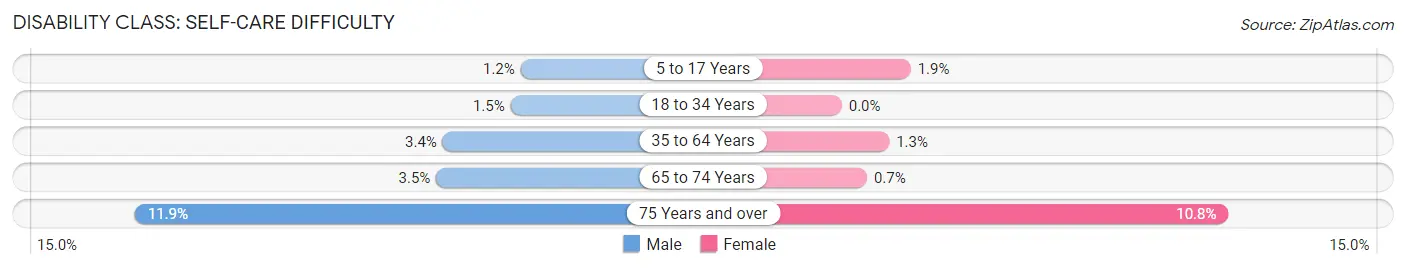
| Age Bracket | Male | Female |
| 5 to 17 Years | 20 (1.2%) | 25 (1.9%) |
| 18 to 34 Years | 35 (1.5%) | 0 (0.0%) |
| 35 to 64 Years | 105 (3.4%) | 42 (1.3%) |
| 65 to 74 Years | 35 (3.5%) | 7 (0.7%) |
| 75 Years and over | 73 (11.9%) | 114 (10.8%) |
Technology Access in Ashland
Computing Device Access in Ashland
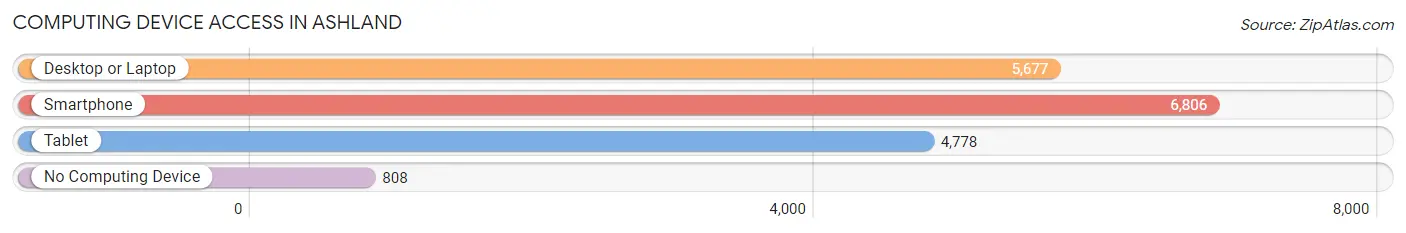
| Device Type | # Households | % Households |
| Desktop or Laptop | 5,677 | 71.5% |
| Smartphone | 6,806 | 85.7% |
| Tablet | 4,778 | 60.2% |
| No Computing Device | 808 | 10.2% |
| Total | 7,944 | 100.0% |
Internet Access in Ashland
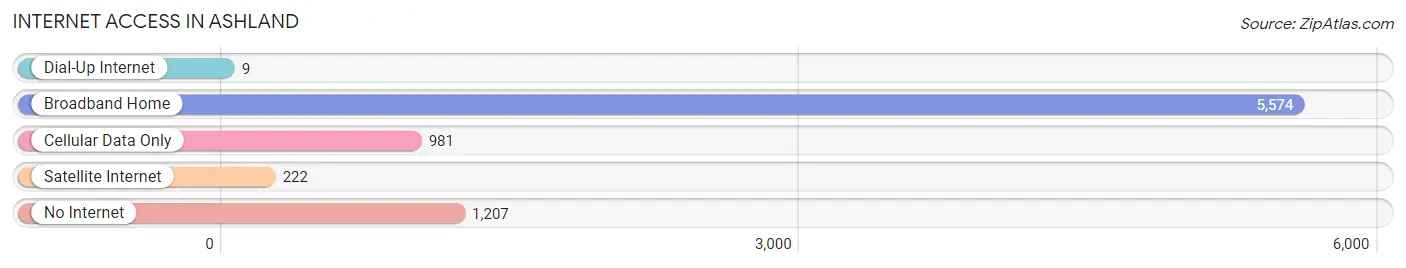
| Internet Type | # Households | % Households |
| Dial-Up Internet | 9 | 0.1% |
| Broadband Home | 5,574 | 70.2% |
| Cellular Data Only | 981 | 12.3% |
| Satellite Internet | 222 | 2.8% |
| No Internet | 1,207 | 15.2% |
| Total | 7,944 | 100.0% |
Ashland Summary
Ashland, Ohio is a city located in the northeastern part of the state, in Ashland County. It is situated along the Mohican River, and is the county seat. The city has a population of approximately 21,000 people, and is part of the Mansfield-Ashland-Bucyrus Combined Statistical Area.
History
The area that is now Ashland was first settled in 1815 by John and Elizabeth Miller, who were among the first settlers in the area. The city was officially founded in 1846, and was named after the Ashland County, which was named after the home of Henry Clay, a prominent politician from Kentucky. The city was incorporated in 1854, and was designated as the county seat in 1866.
In the late 19th century, Ashland was a major center for the production of coal and iron ore. The city was also home to several large manufacturing companies, including the Ashland Iron and Steel Company, which was founded in 1882. The city was also home to the Ashland Oil and Refining Company, which was founded in 1892.
Geography
Ashland is located in the northeastern part of Ohio, in Ashland County. It is situated along the Mohican River, and is approximately 60 miles southwest of Cleveland. The city has a total area of 8.3 square miles, of which 8.2 square miles is land and 0.1 square miles is water.
The city is located in the Appalachian Plateau region of Ohio, and is part of the Appalachian Mountains. The city is located in a hilly area, and is surrounded by forests and rolling hills. The city is also located near several lakes, including Lake Erie, Lake Huron, and Lake Ontario.
Economy
The economy of Ashland is largely based on manufacturing and services. The city is home to several large manufacturing companies, including the Ashland Iron and Steel Company, the Ashland Oil and Refining Company, and the Ashland Chemical Company. The city is also home to several large retail stores, including Walmart, Target, and Kohl’s.
The city is also home to several educational institutions, including Ashland University, which is a private university with an enrollment of approximately 5,000 students. The city is also home to the Ashland County-West Holmes Career Center, which provides vocational and technical training to students.
Demographics
As of the 2010 census, the population of Ashland was 21,067. The racial makeup of the city was 94.2% White, 2.3% African American, 0.3% Native American, 0.7% Asian, 0.1% Pacific Islander, 0.7% from other races, and 1.7% from two or more races. Hispanic or Latino of any race were 2.2% of the population.
The median income for a household in the city was $37,945, and the median income for a family was $45,945. The per capita income for the city was $19,945. About 11.2% of families and 14.2% of the population were below the poverty line, including 19.2% of those under age 18 and 8.2% of those age 65 or over.
Common Questions
What is Per Capita Income in Ashland?
Per Capita income in Ashland is $28,100.
What is the Median Family Income in Ashland?
Median Family Income in Ashland is $73,075.
What is the Median Household income in Ashland?
Median Household Income in Ashland is $56,040.
What is Income or Wage Gap in Ashland?
Income or Wage Gap in Ashland is 31.8%.
Women in Ashland earn 68.2 cents for every dollar earned by a man.
What is Family Income Deficit in Ashland?
Family Income Deficit in Ashland is $9,754.
Families that are below poverty line in Ashland earn $9,754 less on average than the poverty threshold level.
What is Inequality or Gini Index in Ashland?
Inequality or Gini Index in Ashland is 0.41.
What is the Total Population of Ashland?
Total Population of Ashland is 19,270.
What is the Total Male Population of Ashland?
Total Male Population of Ashland is 9,337.
What is the Total Female Population of Ashland?
Total Female Population of Ashland is 9,933.
What is the Ratio of Males per 100 Females in Ashland?
There are 94.00 Males per 100 Females in Ashland.
What is the Ratio of Females per 100 Males in Ashland?
There are 106.38 Females per 100 Males in Ashland.
What is the Median Population Age in Ashland?
Median Population Age in Ashland is 38.8 Years.
What is the Average Family Size in Ashland
Average Family Size in Ashland is 3.0 People.
What is the Average Household Size in Ashland
Average Household Size in Ashland is 2.2 People.
How Large is the Labor Force in Ashland?
There are 9,706 People in the Labor Forcein in Ashland.
What is the Percentage of People in the Labor Force in Ashland?
61.0% of People are in the Labor Force in Ashland.
What is the Unemployment Rate in Ashland?
Unemployment Rate in Ashland is 3.8%.