Columbiana, OH Map & Demographics
Columbiana Map
Columbiana Overview
$41,254
PER CAPITA INCOME
$99,091
AVG FAMILY INCOME
$45,833
AVG HOUSEHOLD INCOME
39.1%
WAGE / INCOME GAP [ % ]
60.9¢/ $1
WAGE / INCOME GAP [ $ ]
0.51
INEQUALITY / GINI INDEX
6,688
TOTAL POPULATION
3,132
MALE POPULATION
3,556
FEMALE POPULATION
88.08
MALES / 100 FEMALES
113.54
FEMALES / 100 MALES
50.3
MEDIAN AGE
2.8
AVG FAMILY SIZE
2.0
AVG HOUSEHOLD SIZE
3,376
LABOR FORCE [ PEOPLE ]
59.7%
PERCENT IN LABOR FORCE
1.2%
UNEMPLOYMENT RATE
Columbiana Zip Codes
Columbiana Area Codes
Income in Columbiana
Income Overview in Columbiana
Per Capita Income in Columbiana is $41,254, while median incomes of families and households are $99,091 and $45,833 respectively.
| Characteristic | Number | Measure |
| Per Capita Income | 6,688 | $41,254 |
| Median Family Income | 1,622 | $99,091 |
| Mean Family Income | 1,622 | $114,494 |
| Median Household Income | 3,238 | $45,833 |
| Mean Household Income | 3,238 | $81,936 |
| Income Deficit | 1,622 | $0 |
| Wage / Income Gap (%) | 6,688 | 39.09% |
| Wage / Income Gap ($) | 6,688 | 60.91¢ per $1 |
| Gini / Inequality Index | 6,688 | 0.51 |
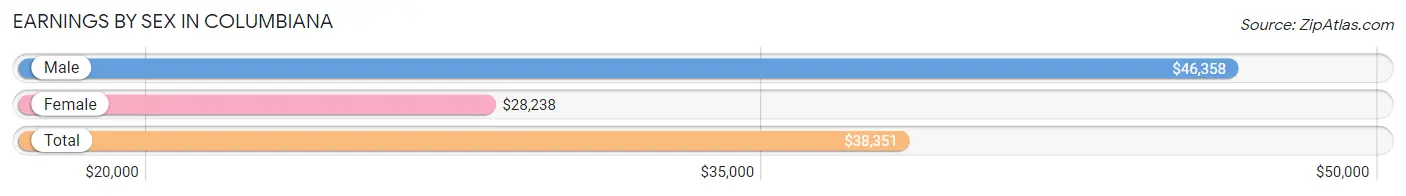
Earnings by Sex in Columbiana
Average Earnings in Columbiana are $38,351, $46,358 for men and $28,238 for women, a difference of 39.1%.
| Sex | Number | Average Earnings |
| Male | 1,993 (56.2%) | $46,358 |
| Female | 1,554 (43.8%) | $28,238 |
| Total | 3,547 (100.0%) | $38,351 |
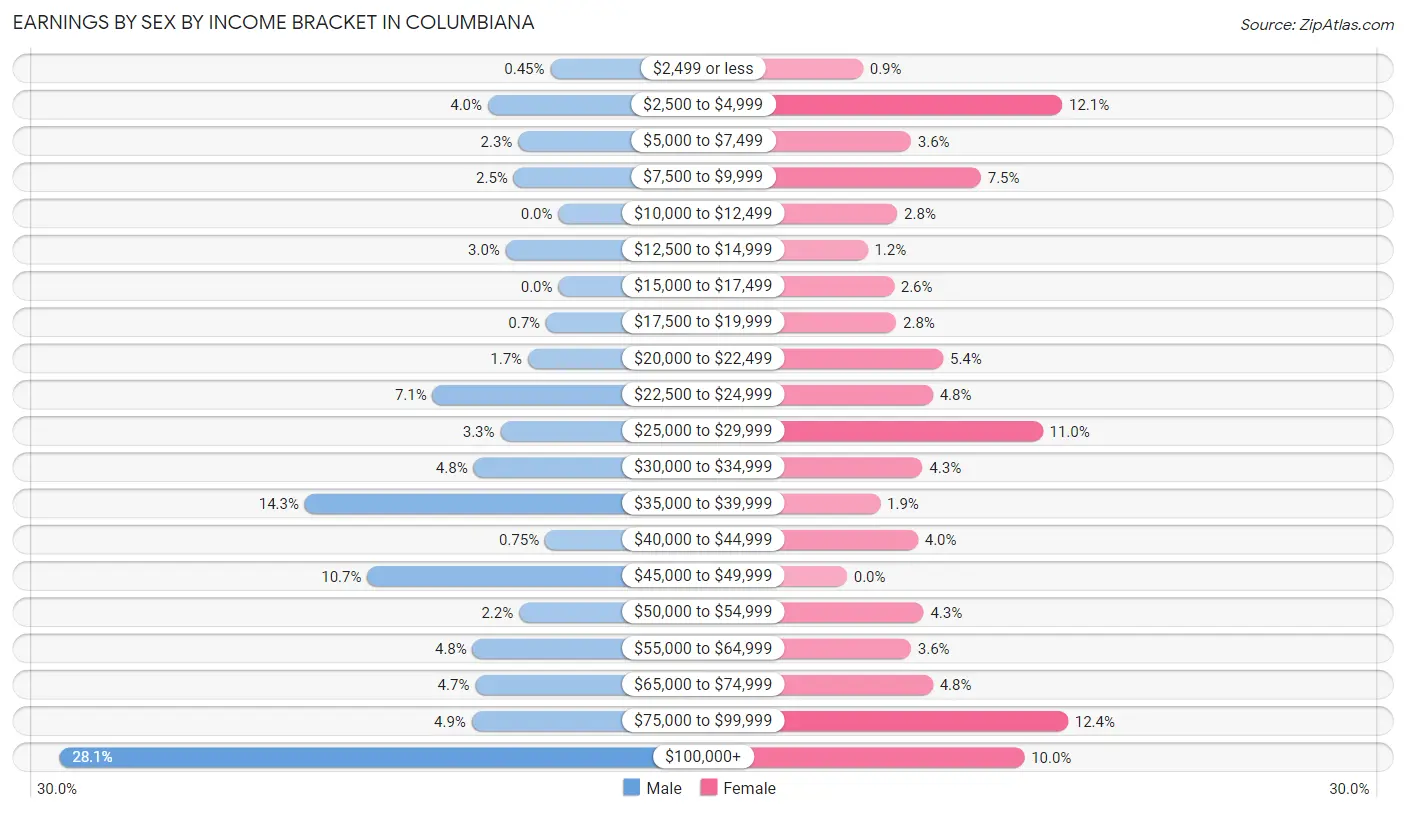
Earnings by Sex by Income Bracket in Columbiana
The most common earnings brackets in Columbiana are $100,000+ for men (559 | 28.1%) and $75,000 to $99,999 for women (193 | 12.4%).
| Income | Male | Female |
| $2,499 or less | 9 (0.4%) | 14 (0.9%) |
| $2,500 to $4,999 | 79 (4.0%) | 188 (12.1%) |
| $5,000 to $7,499 | 45 (2.3%) | 56 (3.6%) |
| $7,500 to $9,999 | 50 (2.5%) | 117 (7.5%) |
| $10,000 to $12,499 | 0 (0.0%) | 44 (2.8%) |
| $12,500 to $14,999 | 59 (3.0%) | 18 (1.2%) |
| $15,000 to $17,499 | 0 (0.0%) | 41 (2.6%) |
| $17,500 to $19,999 | 14 (0.7%) | 43 (2.8%) |
| $20,000 to $22,499 | 34 (1.7%) | 84 (5.4%) |
| $22,500 to $24,999 | 141 (7.1%) | 75 (4.8%) |
| $25,000 to $29,999 | 65 (3.3%) | 171 (11.0%) |
| $30,000 to $34,999 | 95 (4.8%) | 66 (4.3%) |
| $35,000 to $39,999 | 284 (14.2%) | 29 (1.9%) |
| $40,000 to $44,999 | 15 (0.7%) | 62 (4.0%) |
| $45,000 to $49,999 | 214 (10.7%) | 0 (0.0%) |
| $50,000 to $54,999 | 44 (2.2%) | 67 (4.3%) |
| $55,000 to $64,999 | 96 (4.8%) | 56 (3.6%) |
| $65,000 to $74,999 | 93 (4.7%) | 75 (4.8%) |
| $75,000 to $99,999 | 97 (4.9%) | 193 (12.4%) |
| $100,000+ | 559 (28.1%) | 155 (10.0%) |
| Total | 1,993 (100.0%) | 1,554 (100.0%) |
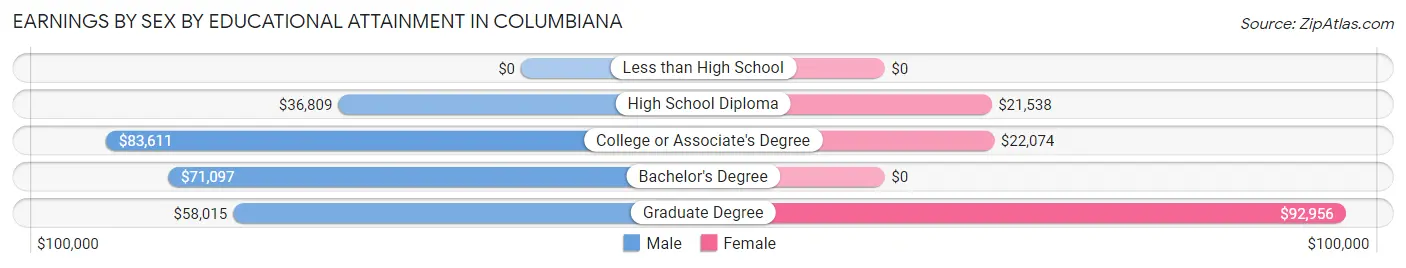
Earnings by Sex by Educational Attainment in Columbiana
Average earnings in Columbiana are $47,443 for men and $29,679 for women, a difference of 37.4%. Men with an educational attainment of college or associate's degree enjoy the highest average annual earnings of $83,611, while those with high school diploma education earn the least with $36,809. Women with an educational attainment of graduate degree earn the most with the average annual earnings of $92,956, while those with high school diploma education have the smallest earnings of $21,538.
| Educational Attainment | Male Income | Female Income |
| Less than High School | - | - |
| High School Diploma | $36,809 | $21,538 |
| College or Associate's Degree | $83,611 | $22,074 |
| Bachelor's Degree | $71,097 | $0 |
| Graduate Degree | $58,015 | $92,956 |
| Total | $47,443 | $29,679 |
Family Income in Columbiana
Family Income Brackets in Columbiana
According to the Columbiana family income data, there are 401 families falling into the $75,000 to $99,999 income range, which is the most common income bracket and makes up 24.7% of all families. Conversely, the less than $10,000 income bracket is the least frequent group with only 16 families (1.0%) belonging to this category.
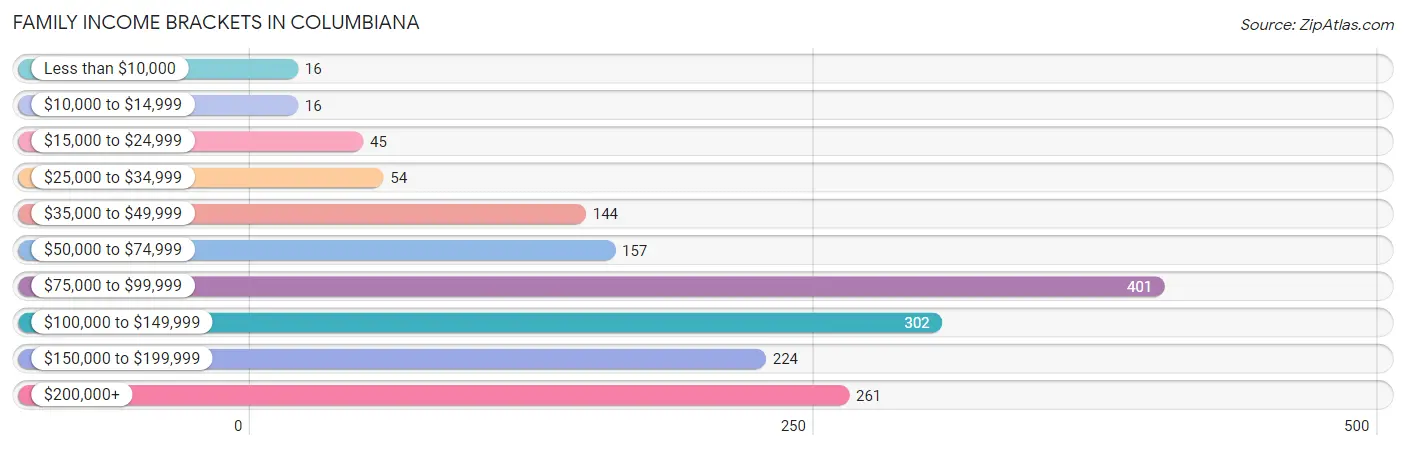
| Income Bracket | # Families | % Families |
| Less than $10,000 | 16 | 1.0% |
| $10,000 to $14,999 | 16 | 1.0% |
| $15,000 to $24,999 | 45 | 2.8% |
| $25,000 to $34,999 | 54 | 3.3% |
| $35,000 to $49,999 | 144 | 8.9% |
| $50,000 to $74,999 | 157 | 9.7% |
| $75,000 to $99,999 | 401 | 24.7% |
| $100,000 to $149,999 | 302 | 18.6% |
| $150,000 to $199,999 | 224 | 13.8% |
| $200,000+ | 261 | 16.1% |
Family Income by Famaliy Size in Columbiana
4-person families (230 | 14.2%) account for the highest median family income in Columbiana with $112,222 per family, while 2-person families (940 | 58.0%) have the highest median income of $43,390 per family member.
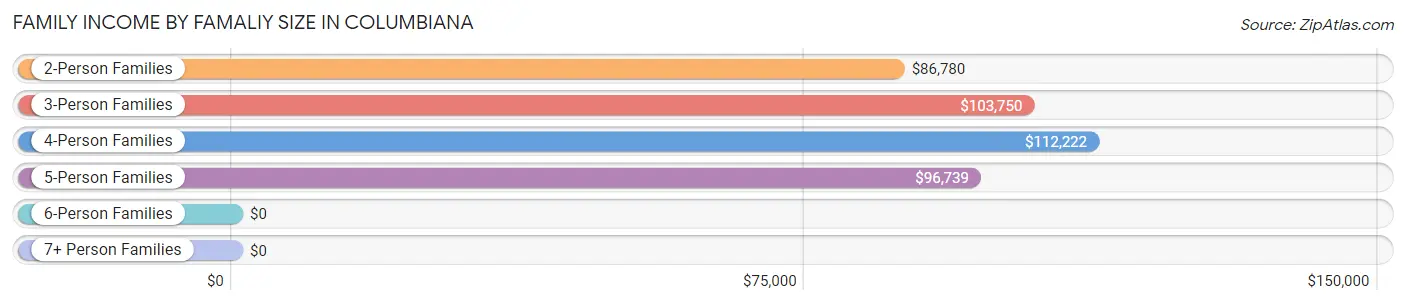
| Income Bracket | # Families | Median Income |
| 2-Person Families | 940 (58.0%) | $86,780 |
| 3-Person Families | 343 (21.1%) | $103,750 |
| 4-Person Families | 230 (14.2%) | $112,222 |
| 5-Person Families | 92 (5.7%) | $96,739 |
| 6-Person Families | 17 (1.1%) | $0 |
| 7+ Person Families | 0 (0.0%) | $0 |
| Total | 1,622 (100.0%) | $99,091 |
Family Income by Number of Earners in Columbiana
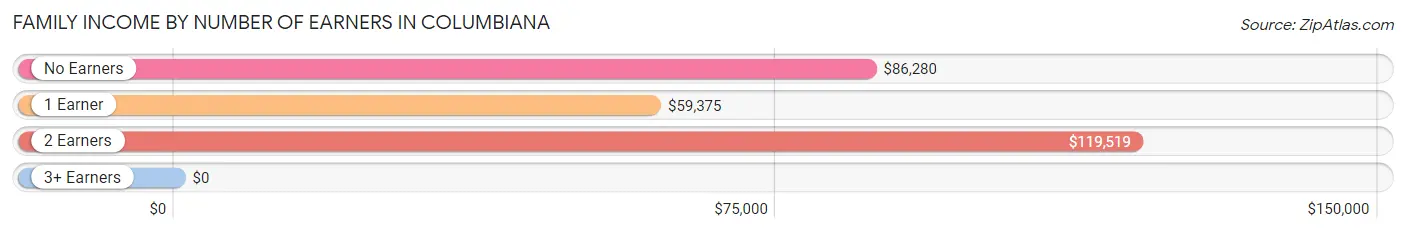
| Number of Earners | # Families | Median Income |
| No Earners | 218 (13.4%) | $86,280 |
| 1 Earner | 337 (20.8%) | $59,375 |
| 2 Earners | 1,036 (63.9%) | $119,519 |
| 3+ Earners | 31 (1.9%) | $0 |
| Total | 1,622 (100.0%) | $99,091 |
Household Income in Columbiana
Household Income Brackets in Columbiana
With 531 households falling in the category, the $35,000 to $49,999 income range is the most frequent in Columbiana, accounting for 16.4% of all households. In contrast, only 58 households (1.8%) fall into the $10,000 to $14,999 income bracket, making it the least populous group.
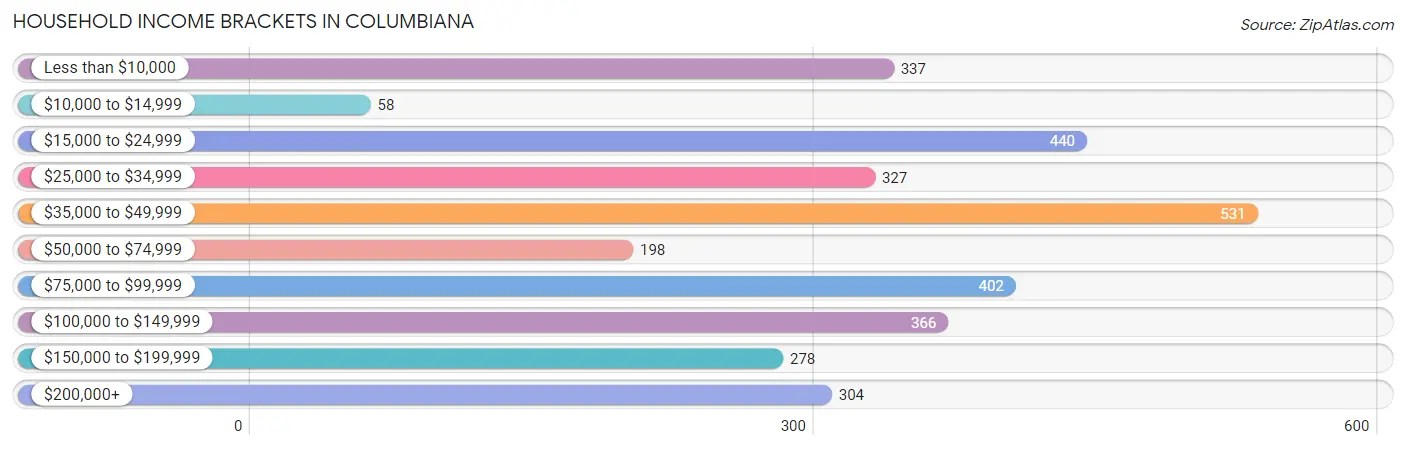
| Income Bracket | # Households | % Households |
| Less than $10,000 | 337 | 10.4% |
| $10,000 to $14,999 | 58 | 1.8% |
| $15,000 to $24,999 | 440 | 13.6% |
| $25,000 to $34,999 | 327 | 10.1% |
| $35,000 to $49,999 | 531 | 16.4% |
| $50,000 to $74,999 | 198 | 6.1% |
| $75,000 to $99,999 | 402 | 12.4% |
| $100,000 to $149,999 | 366 | 11.3% |
| $150,000 to $199,999 | 278 | 8.6% |
| $200,000+ | 304 | 9.4% |
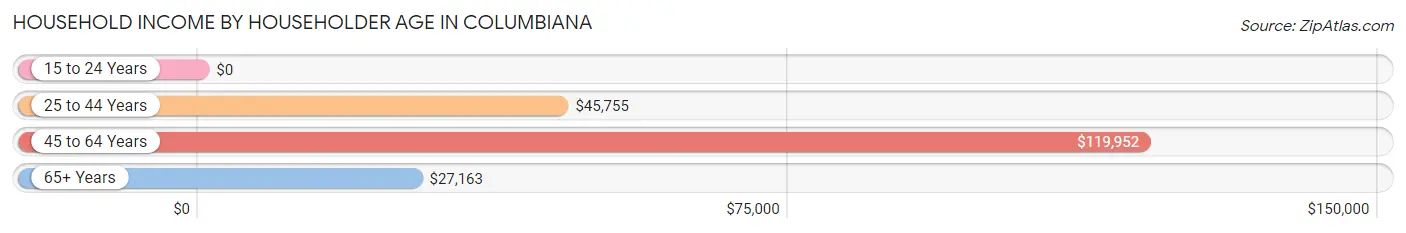
Household Income by Householder Age in Columbiana
The median household income in Columbiana is $45,833, with the highest median household income of $119,952 found in the 45 to 64 years age bracket for the primary householder. A total of 861 households (26.6%) fall into this category. Meanwhile, the 15 to 24 years age bracket for the primary householder has the lowest median household income of $0, with 20 households (0.6%) in this group.
| Income Bracket | # Households | Median Income |
| 15 to 24 Years | 20 (0.6%) | $0 |
| 25 to 44 Years | 954 (29.5%) | $45,755 |
| 45 to 64 Years | 861 (26.6%) | $119,952 |
| 65+ Years | 1,403 (43.3%) | $27,163 |
| Total | 3,238 (100.0%) | $45,833 |
Poverty in Columbiana
Income Below Poverty by Sex and Age in Columbiana
With 5.7% poverty level for males and 10.7% for females among the residents of Columbiana, 16 and 17 year old males and 65 to 74 year old females are the most vulnerable to poverty, with 22 males (100.0%) and 175 females (30.0%) in their respective age groups living below the poverty level.
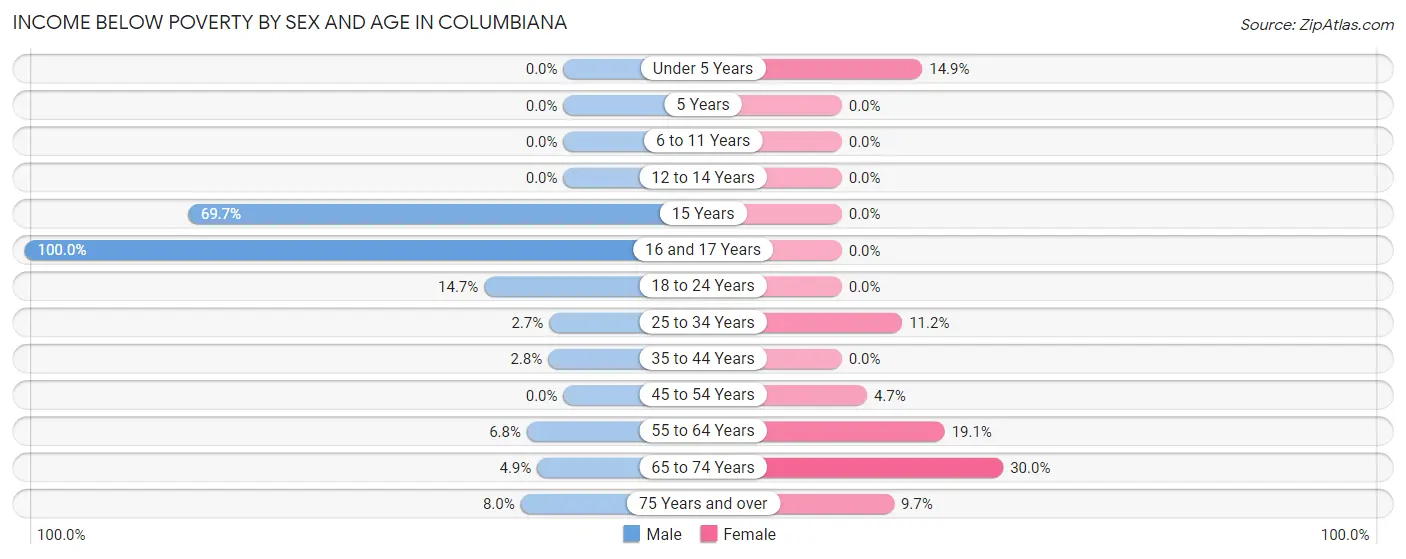
| Age Bracket | Male | Female |
| Under 5 Years | 0 (0.0%) | 13 (14.9%) |
| 5 Years | 0 (0.0%) | 0 (0.0%) |
| 6 to 11 Years | 0 (0.0%) | 0 (0.0%) |
| 12 to 14 Years | 0 (0.0%) | 0 (0.0%) |
| 15 Years | 23 (69.7%) | 0 (0.0%) |
| 16 and 17 Years | 22 (100.0%) | 0 (0.0%) |
| 18 to 24 Years | 25 (14.7%) | 0 (0.0%) |
| 25 to 34 Years | 10 (2.6%) | 34 (11.2%) |
| 35 to 44 Years | 17 (2.8%) | 0 (0.0%) |
| 45 to 54 Years | 0 (0.0%) | 17 (4.7%) |
| 55 to 64 Years | 37 (6.8%) | 64 (19.1%) |
| 65 to 74 Years | 17 (4.9%) | 175 (30.0%) |
| 75 Years and over | 24 (8.0%) | 60 (9.7%) |
| Total | 175 (5.7%) | 363 (10.7%) |
Income Above Poverty by Sex and Age in Columbiana
According to the poverty statistics in Columbiana, males aged under 5 years and females aged 5 years are the age groups that are most secure financially, with 100.0% of males and 100.0% of females in these age groups living above the poverty line.
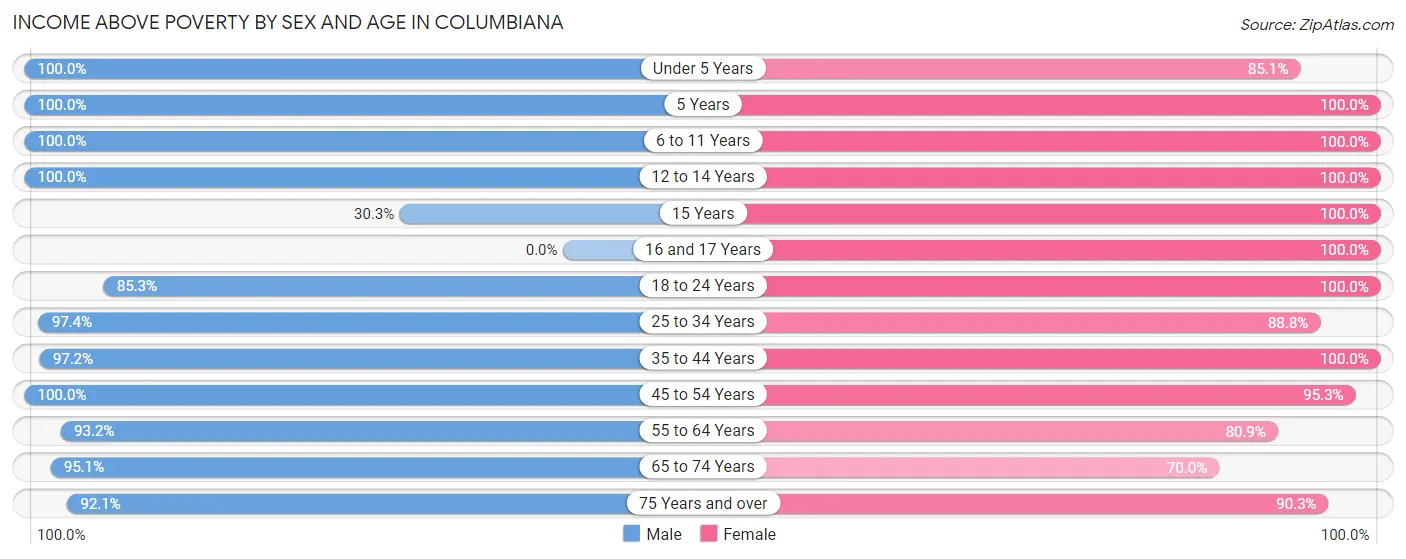
| Age Bracket | Male | Female |
| Under 5 Years | 130 (100.0%) | 74 (85.1%) |
| 5 Years | 27 (100.0%) | 25 (100.0%) |
| 6 to 11 Years | 173 (100.0%) | 236 (100.0%) |
| 12 to 14 Years | 126 (100.0%) | 124 (100.0%) |
| 15 Years | 10 (30.3%) | 34 (100.0%) |
| 16 and 17 Years | 0 (0.0%) | 8 (100.0%) |
| 18 to 24 Years | 145 (85.3%) | 187 (100.0%) |
| 25 to 34 Years | 368 (97.4%) | 269 (88.8%) |
| 35 to 44 Years | 582 (97.2%) | 479 (100.0%) |
| 45 to 54 Years | 199 (100.0%) | 347 (95.3%) |
| 55 to 64 Years | 509 (93.2%) | 271 (80.9%) |
| 65 to 74 Years | 332 (95.1%) | 409 (70.0%) |
| 75 Years and over | 278 (92.0%) | 560 (90.3%) |
| Total | 2,879 (94.3%) | 3,023 (89.3%) |
Income Below Poverty Among Married-Couple Families in Columbiana
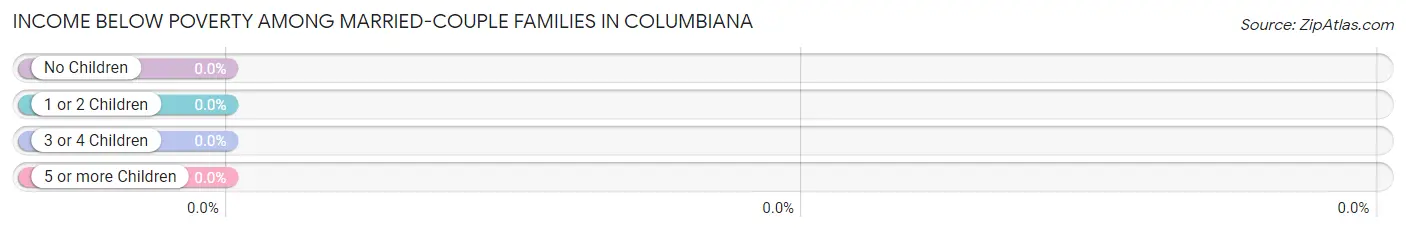
| Children | Above Poverty | Below Poverty |
| No Children | 921 (100.0%) | 0 (0.0%) |
| 1 or 2 Children | 303 (100.0%) | 0 (0.0%) |
| 3 or 4 Children | 56 (100.0%) | 0 (0.0%) |
| 5 or more Children | 0 (0.0%) | 0 (0.0%) |
| Total | 1,280 (100.0%) | 0 (0.0%) |
Income Below Poverty Among Single-Parent Households in Columbiana
According to the poverty data in Columbiana, 15.7% or 17 single-father households and 12.0% or 28 single-mother households are living below the poverty line. Among single-father households, those with 1 or 2 children have the highest poverty rate, with 17 households (39.5%) experiencing poverty. Likewise, among single-mother households, those with 1 or 2 children have the highest poverty rate, with 17 households (17.3%) falling below the poverty line.
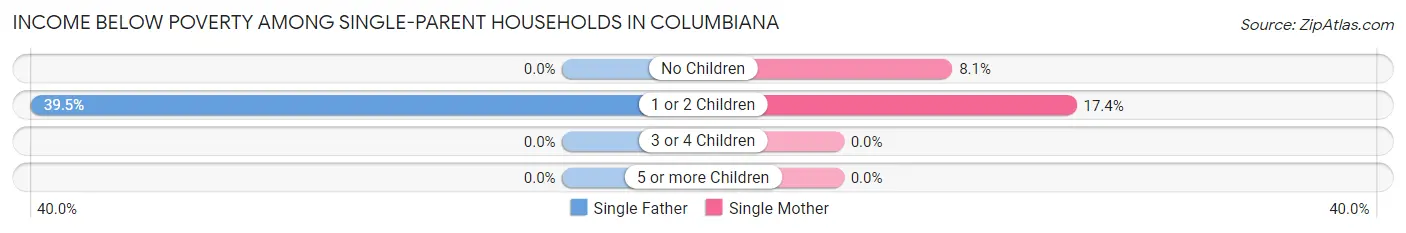
| Children | Single Father | Single Mother |
| No Children | 0 (0.0%) | 11 (8.1%) |
| 1 or 2 Children | 17 (39.5%) | 17 (17.3%) |
| 3 or 4 Children | 0 (0.0%) | 0 (0.0%) |
| 5 or more Children | 0 (0.0%) | 0 (0.0%) |
| Total | 17 (15.7%) | 28 (12.0%) |
Income Below Poverty Among Married-Couple vs Single-Parent Households in Columbiana
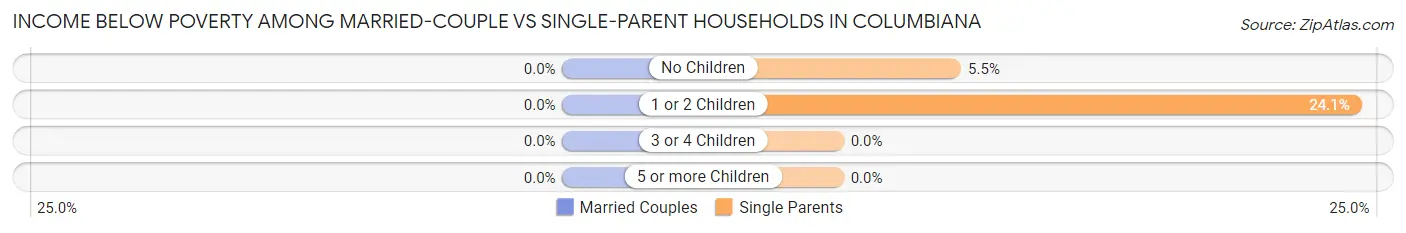
| Children | Married-Couple Families | Single-Parent Households |
| No Children | 0 (0.0%) | 11 (5.5%) |
| 1 or 2 Children | 0 (0.0%) | 34 (24.1%) |
| 3 or 4 Children | 0 (0.0%) | 0 (0.0%) |
| 5 or more Children | 0 (0.0%) | 0 (0.0%) |
| Total | 0 (0.0%) | 45 (13.2%) |
Race in Columbiana
The most populous races in Columbiana are White / Caucasian (6,135 | 91.7%), Hispanic or Latino (339 | 5.1%), and Some other Race (277 | 4.1%).
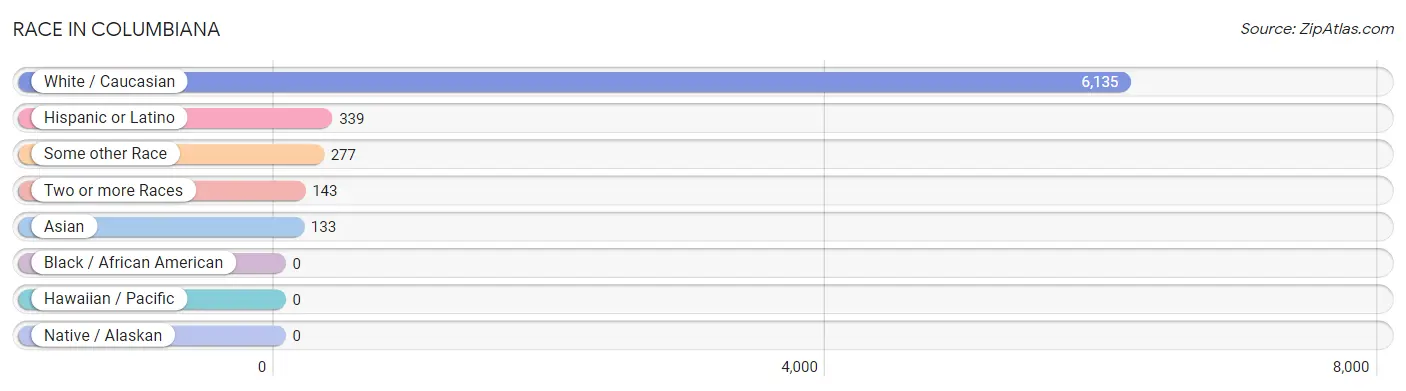
| Race | # Population | % Population |
| Asian | 133 | 2.0% |
| Black / African American | 0 | 0.0% |
| Hawaiian / Pacific | 0 | 0.0% |
| Hispanic or Latino | 339 | 5.1% |
| Native / Alaskan | 0 | 0.0% |
| White / Caucasian | 6,135 | 91.7% |
| Two or more Races | 143 | 2.1% |
| Some other Race | 277 | 4.1% |
| Total | 6,688 | 100.0% |
Ancestry in Columbiana
The most populous ancestries reported in Columbiana are German (1,912 | 28.6%), Irish (1,088 | 16.3%), English (847 | 12.7%), Italian (783 | 11.7%), and Slovak (421 | 6.3%), together accounting for 75.5% of all Columbiana residents.
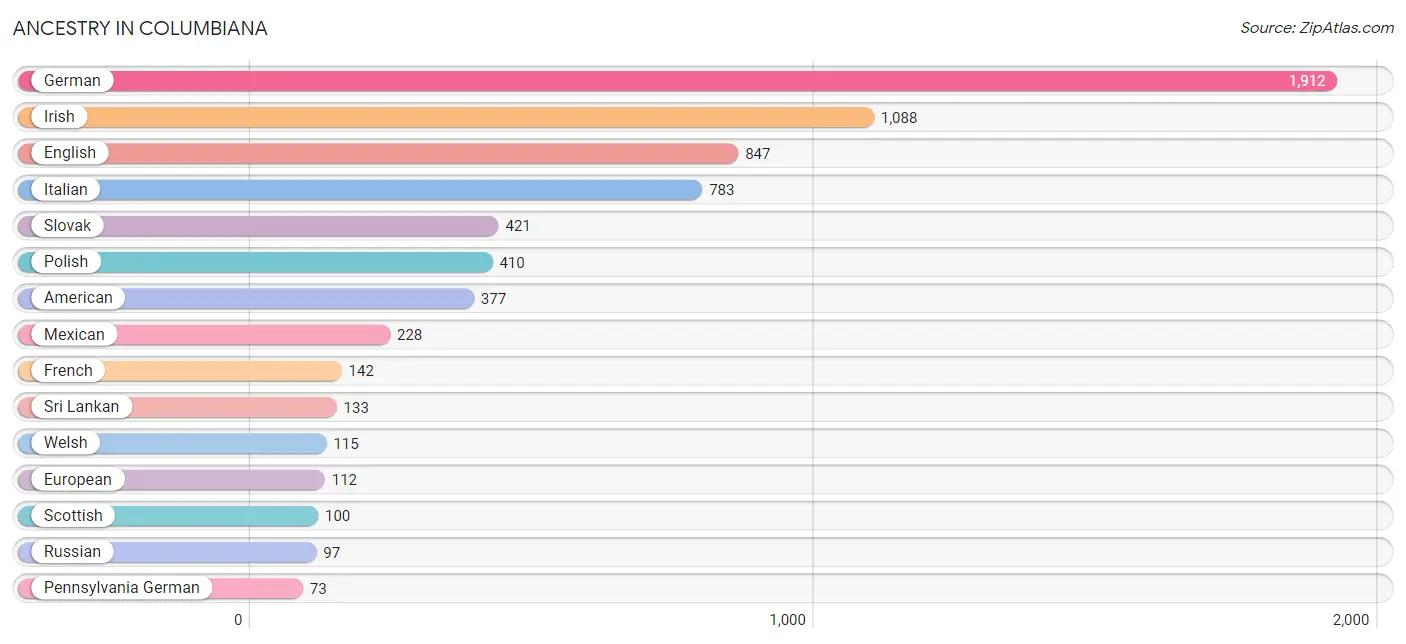
| Ancestry | # Population | % Population |
| American | 377 | 5.6% |
| Canadian | 15 | 0.2% |
| Colombian | 62 | 0.9% |
| Croatian | 16 | 0.2% |
| Cuban | 43 | 0.6% |
| Czech | 43 | 0.6% |
| Dutch | 64 | 1.0% |
| English | 847 | 12.7% |
| European | 112 | 1.7% |
| French | 142 | 2.1% |
| German | 1,912 | 28.6% |
| Hungarian | 62 | 0.9% |
| Irish | 1,088 | 16.3% |
| Italian | 783 | 11.7% |
| Lithuanian | 8 | 0.1% |
| Mexican | 228 | 3.4% |
| Pennsylvania German | 73 | 1.1% |
| Polish | 410 | 6.1% |
| Puerto Rican | 3 | 0.0% |
| Russian | 97 | 1.5% |
| Scandinavian | 52 | 0.8% |
| Scotch-Irish | 27 | 0.4% |
| Scottish | 100 | 1.5% |
| Slovak | 421 | 6.3% |
| Slovene | 20 | 0.3% |
| South American | 62 | 0.9% |
| Sri Lankan | 133 | 2.0% |
| Swedish | 41 | 0.6% |
| Swiss | 23 | 0.3% |
| Thai | 24 | 0.4% |
| Ukrainian | 61 | 0.9% |
| Welsh | 115 | 1.7% | View All 32 Rows |
Immigrants in Columbiana
The most numerous immigrant groups reported in Columbiana came from Colombia (62 | 0.9%), Latin America (62 | 0.9%), South America (62 | 0.9%), Canada (15 | 0.2%), and Europe (13 | 0.2%), together accounting for 3.2% of all Columbiana residents.
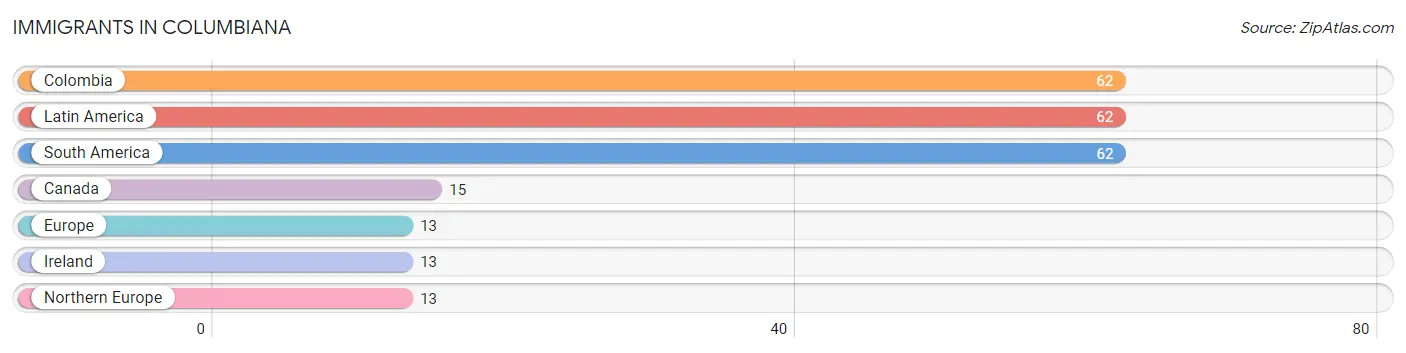
| Immigration Origin | # Population | % Population |
| Canada | 15 | 0.2% |
| Colombia | 62 | 0.9% |
| Europe | 13 | 0.2% |
| Ireland | 13 | 0.2% |
| Latin America | 62 | 0.9% |
| Northern Europe | 13 | 0.2% |
| South America | 62 | 0.9% | View All 7 Rows |
Sex and Age in Columbiana
Sex and Age in Columbiana
The most populous age groups in Columbiana are 35 to 39 Years (442 | 14.1%) for men and 70 to 74 Years (341 | 9.6%) for women.
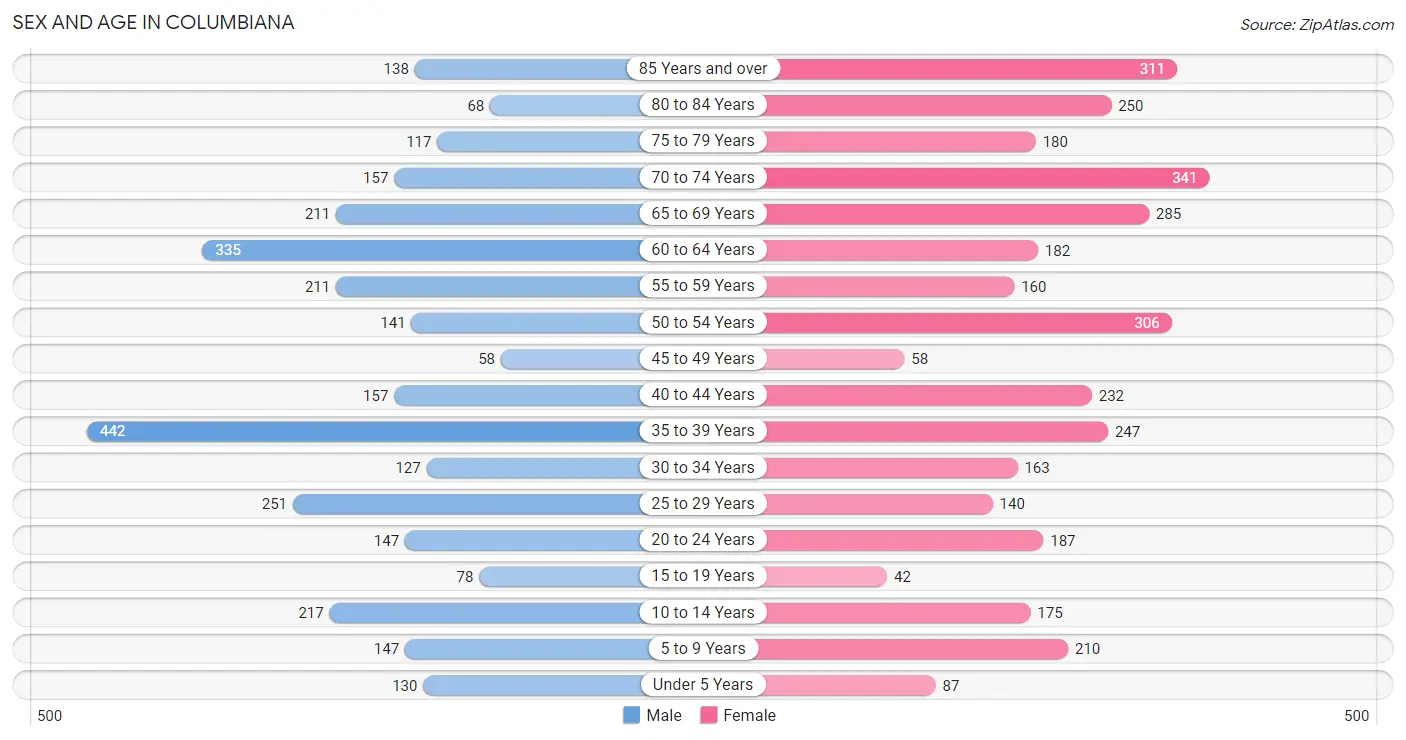
| Age Bracket | Male | Female |
| Under 5 Years | 130 (4.2%) | 87 (2.5%) |
| 5 to 9 Years | 147 (4.7%) | 210 (5.9%) |
| 10 to 14 Years | 217 (6.9%) | 175 (4.9%) |
| 15 to 19 Years | 78 (2.5%) | 42 (1.2%) |
| 20 to 24 Years | 147 (4.7%) | 187 (5.3%) |
| 25 to 29 Years | 251 (8.0%) | 140 (3.9%) |
| 30 to 34 Years | 127 (4.1%) | 163 (4.6%) |
| 35 to 39 Years | 442 (14.1%) | 247 (7.0%) |
| 40 to 44 Years | 157 (5.0%) | 232 (6.5%) |
| 45 to 49 Years | 58 (1.8%) | 58 (1.6%) |
| 50 to 54 Years | 141 (4.5%) | 306 (8.6%) |
| 55 to 59 Years | 211 (6.7%) | 160 (4.5%) |
| 60 to 64 Years | 335 (10.7%) | 182 (5.1%) |
| 65 to 69 Years | 211 (6.7%) | 285 (8.0%) |
| 70 to 74 Years | 157 (5.0%) | 341 (9.6%) |
| 75 to 79 Years | 117 (3.7%) | 180 (5.1%) |
| 80 to 84 Years | 68 (2.2%) | 250 (7.0%) |
| 85 Years and over | 138 (4.4%) | 311 (8.7%) |
| Total | 3,132 (100.0%) | 3,556 (100.0%) |
Families and Households in Columbiana
Median Family Size in Columbiana
The median family size in Columbiana is 2.84 persons per family, with single female/mother families (234 | 14.4%) accounting for the largest median family size of 3 persons per family. On the other hand, single male/father families (108 | 6.7%) represent the smallest median family size with 2.20 persons per family.
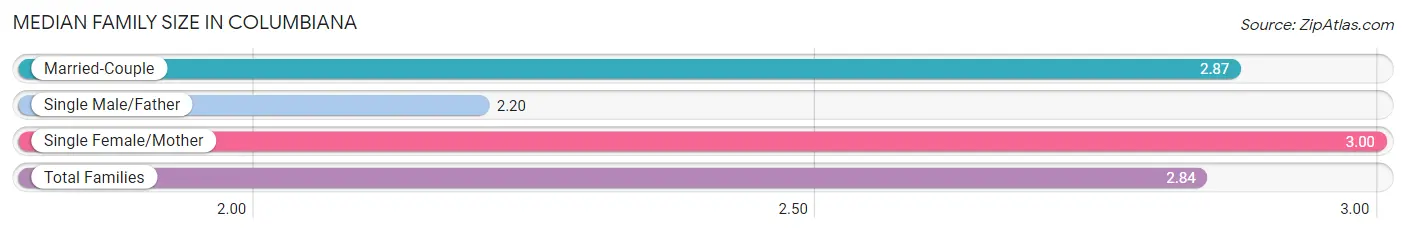
| Family Type | # Families | Family Size |
| Married-Couple | 1,280 (78.9%) | 2.87 |
| Single Male/Father | 108 (6.7%) | 2.20 |
| Single Female/Mother | 234 (14.4%) | 3.00 |
| Total Families | 1,622 (100.0%) | 2.84 |
Median Household Size in Columbiana
The median household size in Columbiana is 2.00 persons per household, with single female/mother households (234 | 7.2%) accounting for the largest median household size of 3 persons per household. non-family households (1,616 | 49.9%) represent the smallest median household size with 1.12 persons per household.
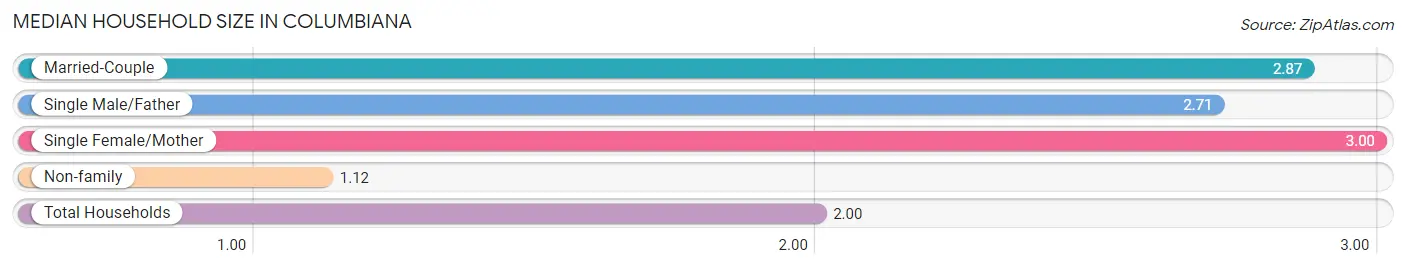
| Household Type | # Households | Household Size |
| Married-Couple | 1,280 (39.5%) | 2.87 |
| Single Male/Father | 108 (3.3%) | 2.71 |
| Single Female/Mother | 234 (7.2%) | 3.00 |
| Non-family | 1,616 (49.9%) | 1.12 |
| Total Households | 3,238 (100.0%) | 2.00 |
Household Size by Marriage Status in Columbiana
Out of a total of 3,238 households in Columbiana, 1,622 (50.1%) are family households, while 1,616 (49.9%) are nonfamily households. The most numerous type of family households are 2-person households, comprising 923, and the most common type of nonfamily households are 1-person households, comprising 1,544.
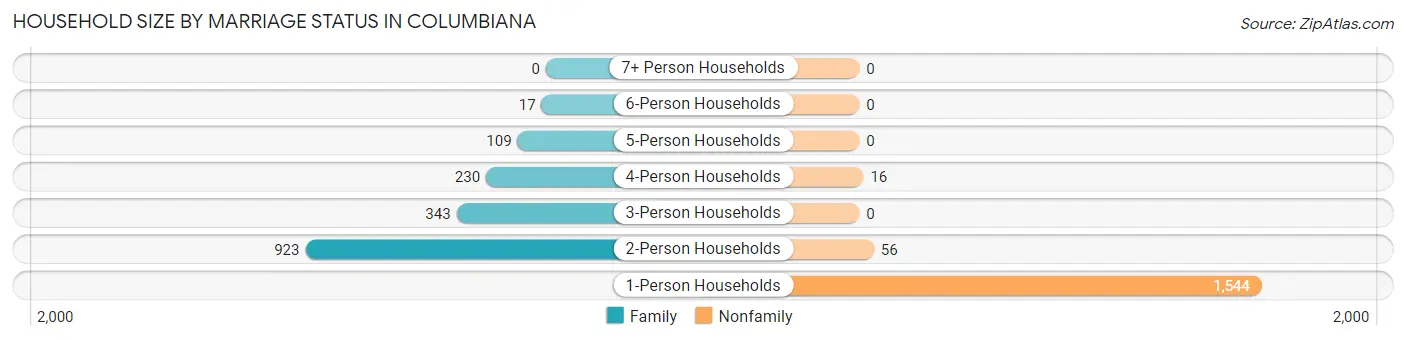
| Household Size | Family Households | Nonfamily Households |
| 1-Person Households | - | 1,544 (47.7%) |
| 2-Person Households | 923 (28.5%) | 56 (1.7%) |
| 3-Person Households | 343 (10.6%) | 0 (0.0%) |
| 4-Person Households | 230 (7.1%) | 16 (0.5%) |
| 5-Person Households | 109 (3.4%) | 0 (0.0%) |
| 6-Person Households | 17 (0.5%) | 0 (0.0%) |
| 7+ Person Households | 0 (0.0%) | 0 (0.0%) |
| Total | 1,622 (50.1%) | 1,616 (49.9%) |
Female Fertility in Columbiana
Fertility by Age in Columbiana
Average fertility rate in Columbiana is 21.0 births per 1,000 women. Women in the age bracket of 20 to 34 years have the highest fertility rate with 29.0 births per 1,000 women. Women in the age bracket of 20 to 34 years acount for 53.8% of all women with births.
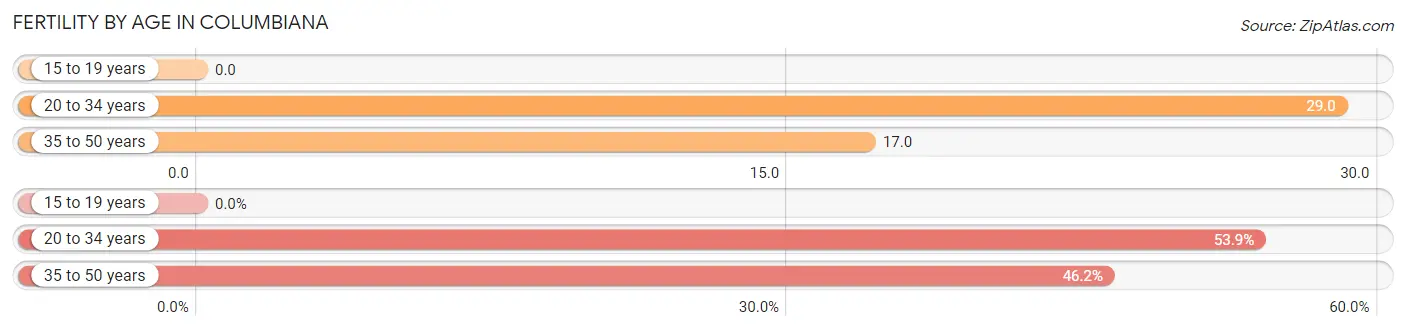
| Age Bracket | Women with Births | Births / 1,000 Women |
| 15 to 19 years | 0 (0.0%) | 0.0 |
| 20 to 34 years | 14 (53.8%) | 29.0 |
| 35 to 50 years | 12 (46.2%) | 17.0 |
| Total | 26 (100.0%) | 21.0 |
Fertility by Age by Marriage Status in Columbiana
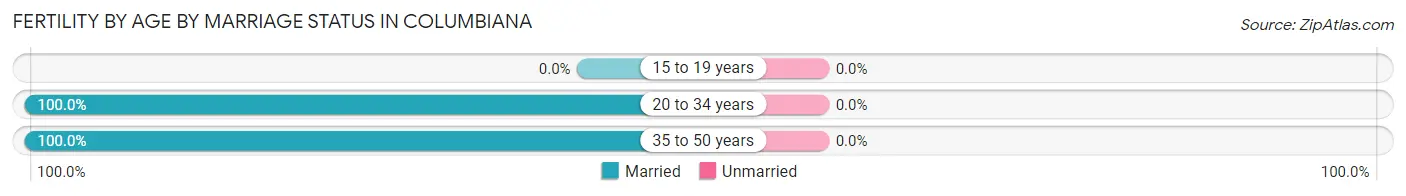
| Age Bracket | Married | Unmarried |
| 15 to 19 years | 0 (0.0%) | 0 (0.0%) |
| 20 to 34 years | 14 (100.0%) | 0 (0.0%) |
| 35 to 50 years | 12 (100.0%) | 0 (0.0%) |
| Total | 26 (100.0%) | 0 (0.0%) |
Fertility by Education in Columbiana
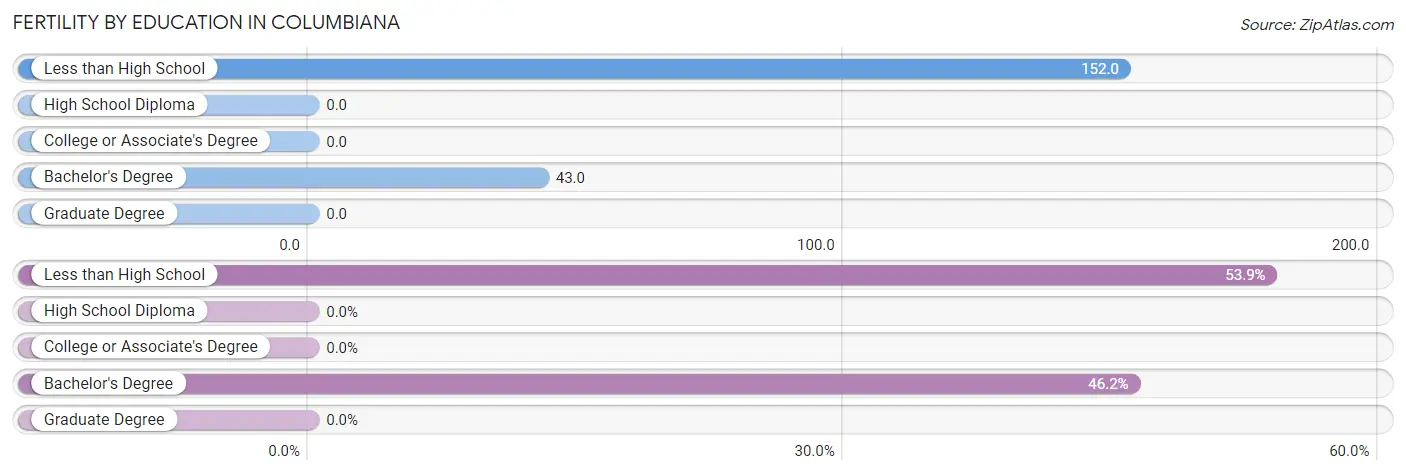
| Educational Attainment | Women with Births | Births / 1,000 Women |
| Less than High School | 14 (53.8%) | 152.0 |
| High School Diploma | 0 (0.0%) | 0.0 |
| College or Associate's Degree | 0 (0.0%) | 0.0 |
| Bachelor's Degree | 12 (46.2%) | 43.0 |
| Graduate Degree | 0 (0.0%) | 0.0 |
| Total | 26 (100.0%) | 21.0 |
Fertility by Education by Marriage Status in Columbiana
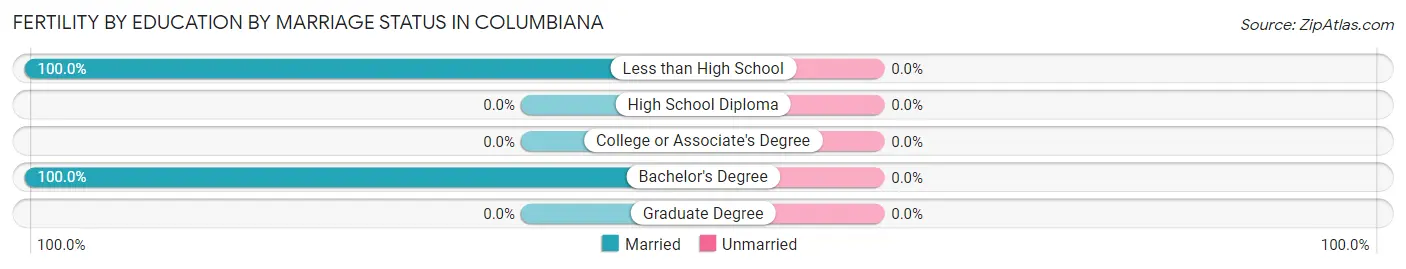
| Educational Attainment | Married | Unmarried |
| Less than High School | 14 (100.0%) | 0 (0.0%) |
| High School Diploma | 0 (0.0%) | 0 (0.0%) |
| College or Associate's Degree | 0 (0.0%) | 0 (0.0%) |
| Bachelor's Degree | 12 (100.0%) | 0 (0.0%) |
| Graduate Degree | 0 (0.0%) | 0 (0.0%) |
| Total | 26 (100.0%) | 0 (0.0%) |
Employment Characteristics in Columbiana
Employment by Class of Employer in Columbiana
Among the 3,303 employed individuals in Columbiana, private company employees (2,094 | 63.4%), self-employed (incorporated) (382 | 11.6%), and not-for-profit organizations (326 | 9.9%) make up the most common classes of employment.
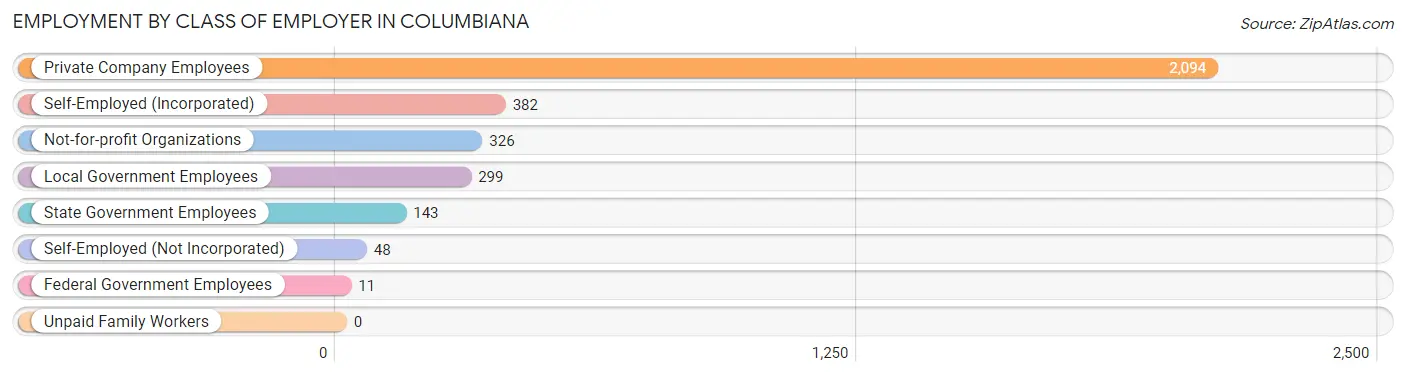
| Employer Class | # Employees | % Employees |
| Private Company Employees | 2,094 | 63.4% |
| Self-Employed (Incorporated) | 382 | 11.6% |
| Self-Employed (Not Incorporated) | 48 | 1.5% |
| Not-for-profit Organizations | 326 | 9.9% |
| Local Government Employees | 299 | 9.0% |
| State Government Employees | 143 | 4.3% |
| Federal Government Employees | 11 | 0.3% |
| Unpaid Family Workers | 0 | 0.0% |
| Total | 3,303 | 100.0% |
Employment Status by Age in Columbiana
According to the labor force statistics for Columbiana, out of the total population over 16 years of age (5,655), 59.7% or 3,376 individuals are in the labor force, with 1.2% or 41 of them unemployed. The age group with the highest labor force participation rate is 35 to 44 years, with 96.5% or 1,040 individuals in the labor force. Within the labor force, the 16 to 19 years age range has the highest percentage of unemployed individuals, with 60.9% or 14 of them being unemployed.
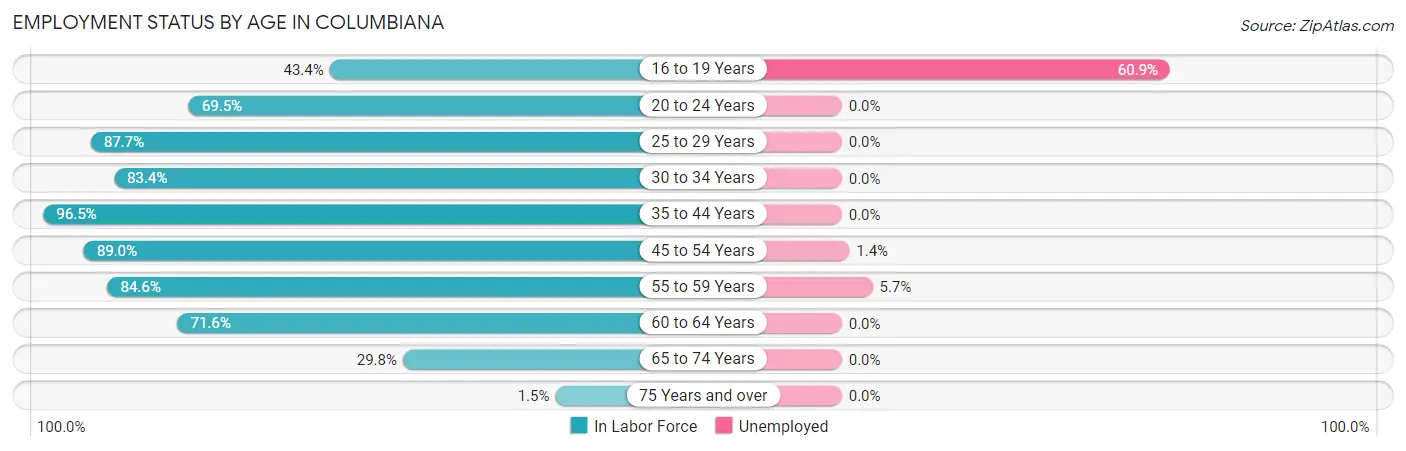
| Age Bracket | In Labor Force | Unemployed |
| 16 to 19 Years | 23 (43.4%) | 14 (60.9%) |
| 20 to 24 Years | 232 (69.5%) | 0 (0.0%) |
| 25 to 29 Years | 343 (87.7%) | 0 (0.0%) |
| 30 to 34 Years | 242 (83.4%) | 0 (0.0%) |
| 35 to 44 Years | 1,040 (96.5%) | 0 (0.0%) |
| 45 to 54 Years | 501 (89.0%) | 7 (1.4%) |
| 55 to 59 Years | 314 (84.6%) | 18 (5.7%) |
| 60 to 64 Years | 370 (71.6%) | 0 (0.0%) |
| 65 to 74 Years | 296 (29.8%) | 0 (0.0%) |
| 75 Years and over | 16 (1.5%) | 0 (0.0%) |
| Total | 3,376 (59.7%) | 41 (1.2%) |
Employment Status by Educational Attainment in Columbiana
According to labor force statistics for Columbiana, 87.5% of individuals (2,809) out of the total population between 25 and 64 years of age (3,210) are in the labor force, with 0.9% or 25 of them being unemployed. The group with the highest labor force participation rate are those with the educational attainment of college / associate degree, with 88.7% or 899 individuals in the labor force. Within the labor force, individuals with high school diploma education have the highest percentage of unemployment, with 2.3% or 18 of them being unemployed.
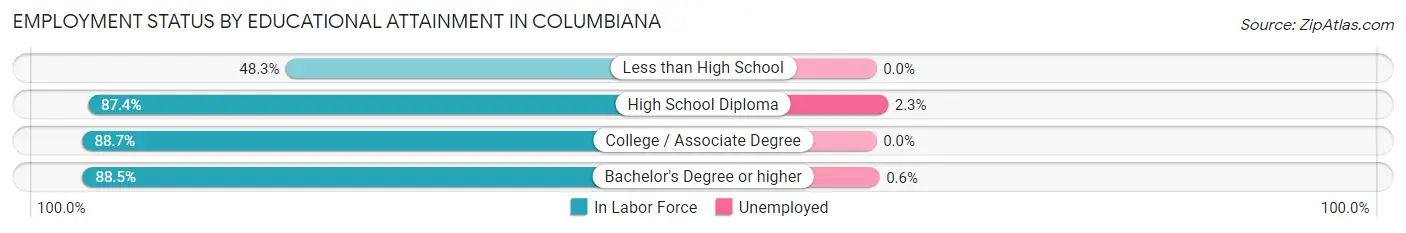
| Educational Attainment | In Labor Force | Unemployed |
| Less than High School | 28 (48.3%) | 0 (0.0%) |
| High School Diploma | 772 (87.4%) | 20 (2.3%) |
| College / Associate Degree | 899 (88.7%) | 0 (0.0%) |
| Bachelor's Degree or higher | 1,112 (88.5%) | 8 (0.6%) |
| Total | 2,809 (87.5%) | 29 (0.9%) |
Employment Occupations by Sex in Columbiana
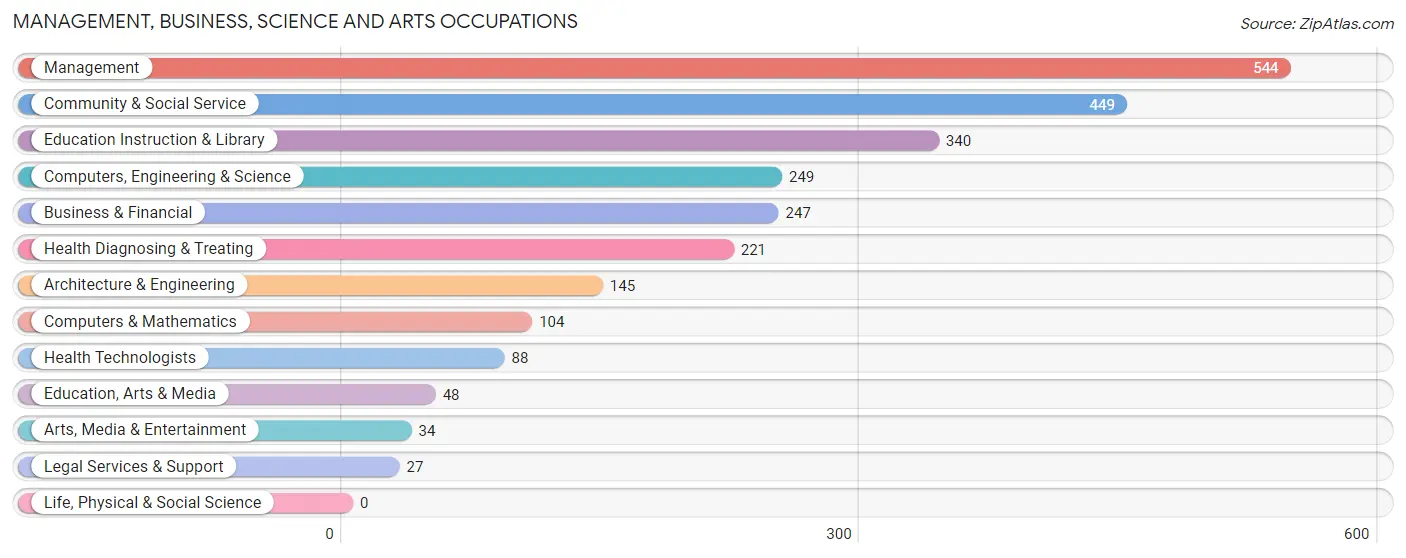
Management, Business, Science and Arts Occupations
The most common Management, Business, Science and Arts occupations in Columbiana are Management (544 | 16.3%), Community & Social Service (449 | 13.5%), Education Instruction & Library (340 | 10.2%), Computers, Engineering & Science (249 | 7.5%), and Business & Financial (247 | 7.4%).
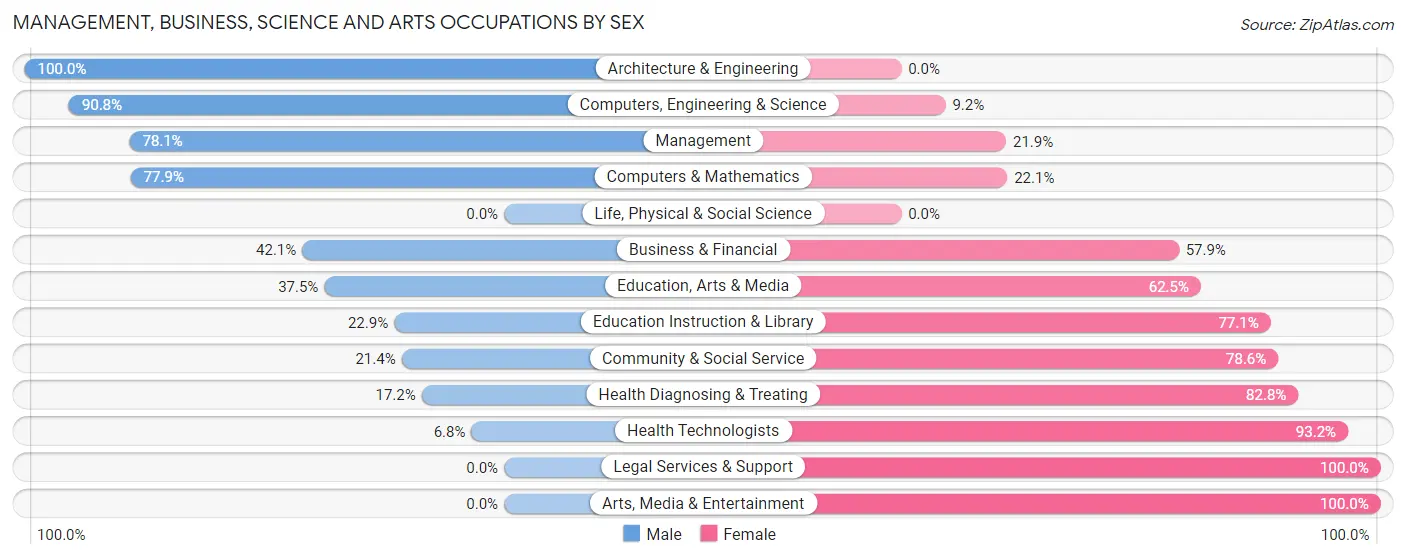
Management, Business, Science and Arts Occupations by Sex
Within the Management, Business, Science and Arts occupations in Columbiana, the most male-oriented occupations are Architecture & Engineering (100.0%), Computers, Engineering & Science (90.8%), and Management (78.1%), while the most female-oriented occupations are Legal Services & Support (100.0%), Arts, Media & Entertainment (100.0%), and Health Technologists (93.2%).
| Occupation | Male | Female |
| Management | 425 (78.1%) | 119 (21.9%) |
| Business & Financial | 104 (42.1%) | 143 (57.9%) |
| Computers, Engineering & Science | 226 (90.8%) | 23 (9.2%) |
| Computers & Mathematics | 81 (77.9%) | 23 (22.1%) |
| Architecture & Engineering | 145 (100.0%) | 0 (0.0%) |
| Life, Physical & Social Science | 0 (0.0%) | 0 (0.0%) |
| Community & Social Service | 96 (21.4%) | 353 (78.6%) |
| Education, Arts & Media | 18 (37.5%) | 30 (62.5%) |
| Legal Services & Support | 0 (0.0%) | 27 (100.0%) |
| Education Instruction & Library | 78 (22.9%) | 262 (77.1%) |
| Arts, Media & Entertainment | 0 (0.0%) | 34 (100.0%) |
| Health Diagnosing & Treating | 38 (17.2%) | 183 (82.8%) |
| Health Technologists | 6 (6.8%) | 82 (93.2%) |
| Total (Category) | 889 (52.0%) | 821 (48.0%) |
| Total (Overall) | 1,938 (58.1%) | 1,400 (41.9%) |
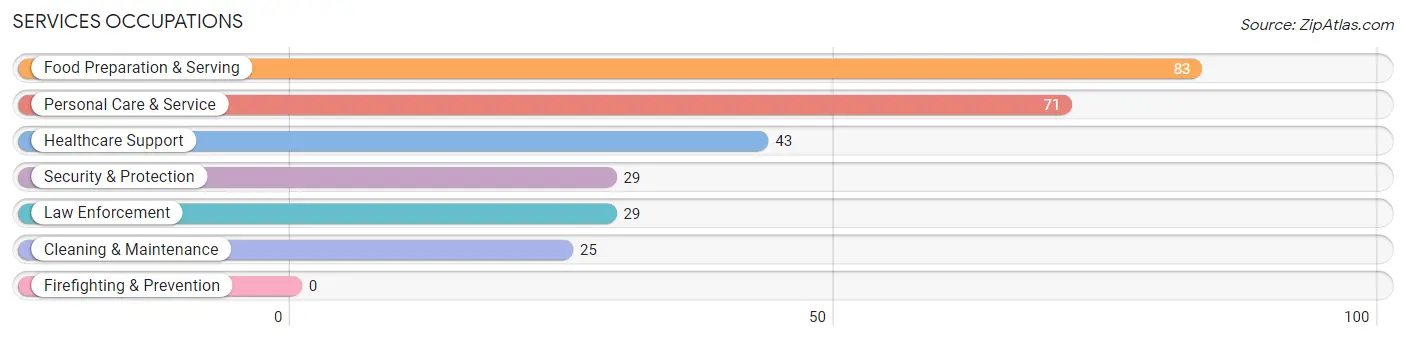
Services Occupations
The most common Services occupations in Columbiana are Food Preparation & Serving (83 | 2.5%), Personal Care & Service (71 | 2.1%), Healthcare Support (43 | 1.3%), Security & Protection (29 | 0.9%), and Law Enforcement (29 | 0.9%).
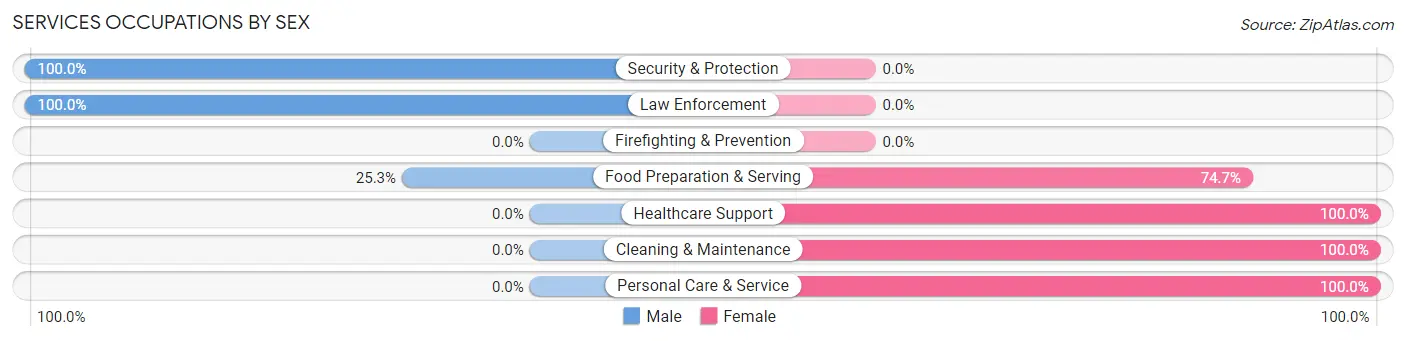
Services Occupations by Sex
Within the Services occupations in Columbiana, the most male-oriented occupations are Security & Protection (100.0%), Law Enforcement (100.0%), and Food Preparation & Serving (25.3%), while the most female-oriented occupations are Healthcare Support (100.0%), Cleaning & Maintenance (100.0%), and Personal Care & Service (100.0%).
| Occupation | Male | Female |
| Healthcare Support | 0 (0.0%) | 43 (100.0%) |
| Security & Protection | 29 (100.0%) | 0 (0.0%) |
| Firefighting & Prevention | 0 (0.0%) | 0 (0.0%) |
| Law Enforcement | 29 (100.0%) | 0 (0.0%) |
| Food Preparation & Serving | 21 (25.3%) | 62 (74.7%) |
| Cleaning & Maintenance | 0 (0.0%) | 25 (100.0%) |
| Personal Care & Service | 0 (0.0%) | 71 (100.0%) |
| Total (Category) | 50 (19.9%) | 201 (80.1%) |
| Total (Overall) | 1,938 (58.1%) | 1,400 (41.9%) |
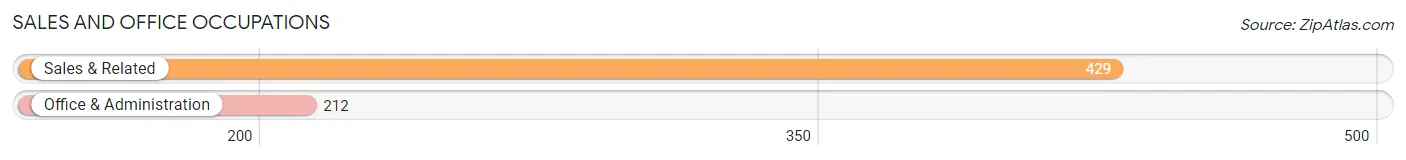
Sales and Office Occupations
The most common Sales and Office occupations in Columbiana are Sales & Related (429 | 12.9%), and Office & Administration (212 | 6.4%).
Sales and Office Occupations by Sex
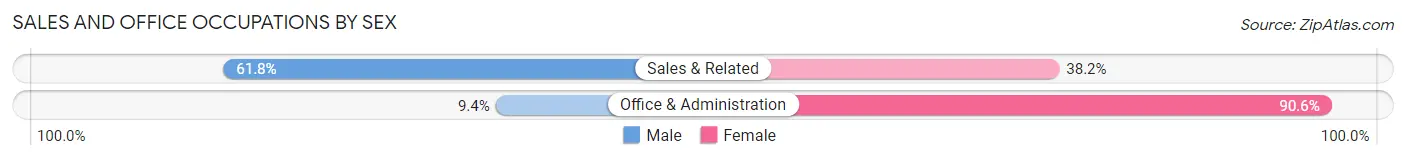
| Occupation | Male | Female |
| Sales & Related | 265 (61.8%) | 164 (38.2%) |
| Office & Administration | 20 (9.4%) | 192 (90.6%) |
| Total (Category) | 285 (44.5%) | 356 (55.5%) |
| Total (Overall) | 1,938 (58.1%) | 1,400 (41.9%) |
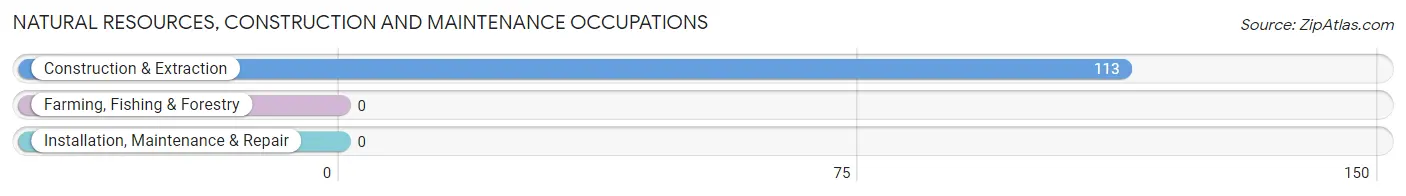
Natural Resources, Construction and Maintenance Occupations
The most common Natural Resources, Construction and Maintenance occupations in Columbiana are , and Construction & Extraction (113 | 3.4%).
Natural Resources, Construction and Maintenance Occupations by Sex
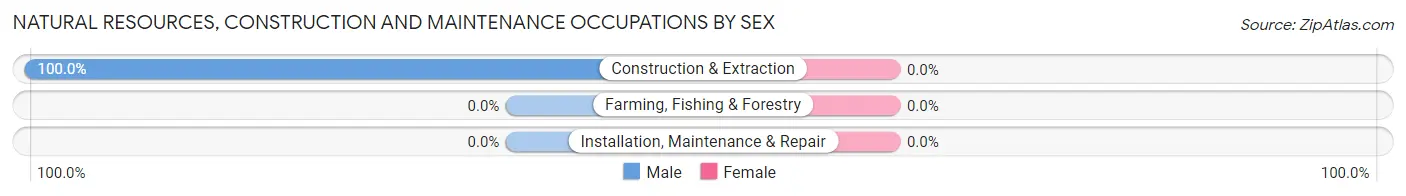
| Occupation | Male | Female |
| Farming, Fishing & Forestry | 0 (0.0%) | 0 (0.0%) |
| Construction & Extraction | 113 (100.0%) | 0 (0.0%) |
| Installation, Maintenance & Repair | 0 (0.0%) | 0 (0.0%) |
| Total (Category) | 113 (100.0%) | 0 (0.0%) |
| Total (Overall) | 1,938 (58.1%) | 1,400 (41.9%) |
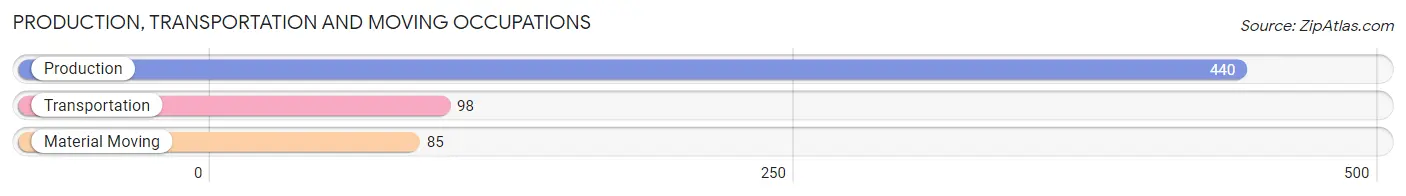
Production, Transportation and Moving Occupations
The most common Production, Transportation and Moving occupations in Columbiana are Production (440 | 13.2%), Transportation (98 | 2.9%), and Material Moving (85 | 2.5%).
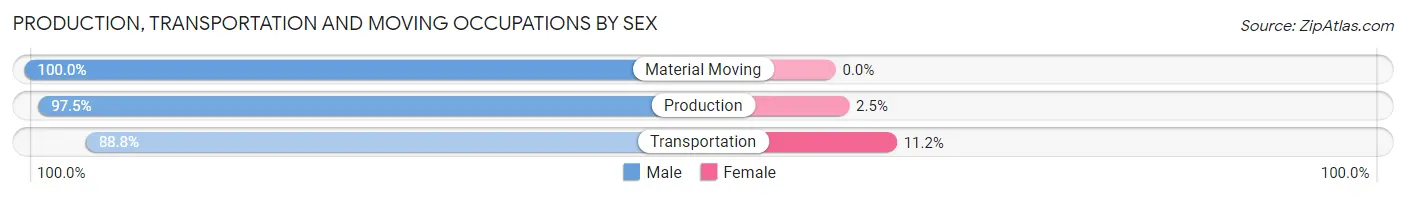
Production, Transportation and Moving Occupations by Sex
| Occupation | Male | Female |
| Production | 429 (97.5%) | 11 (2.5%) |
| Transportation | 87 (88.8%) | 11 (11.2%) |
| Material Moving | 85 (100.0%) | 0 (0.0%) |
| Total (Category) | 601 (96.5%) | 22 (3.5%) |
| Total (Overall) | 1,938 (58.1%) | 1,400 (41.9%) |
Employment Industries by Sex in Columbiana
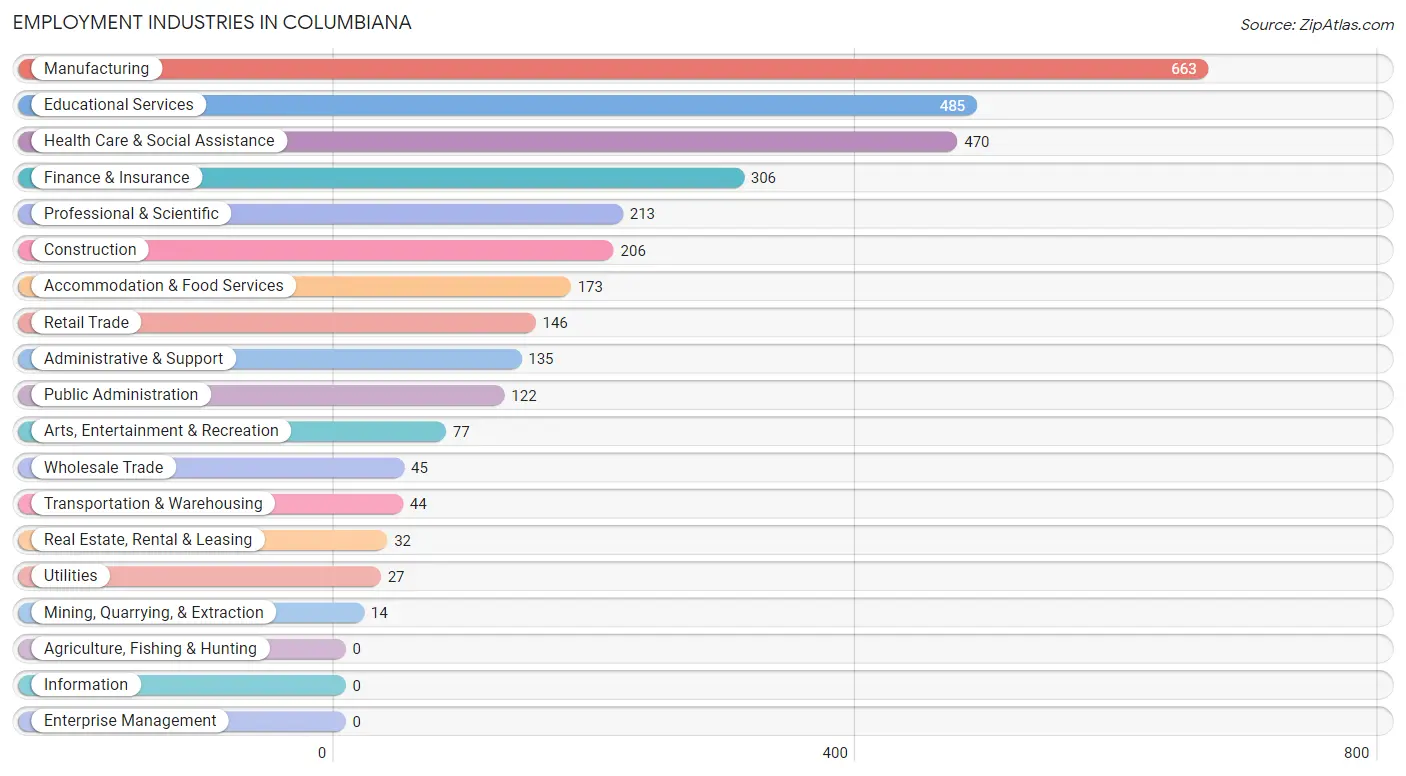
Employment Industries in Columbiana
The major employment industries in Columbiana include Manufacturing (663 | 19.9%), Educational Services (485 | 14.5%), Health Care & Social Assistance (470 | 14.1%), Finance & Insurance (306 | 9.2%), and Professional & Scientific (213 | 6.4%).
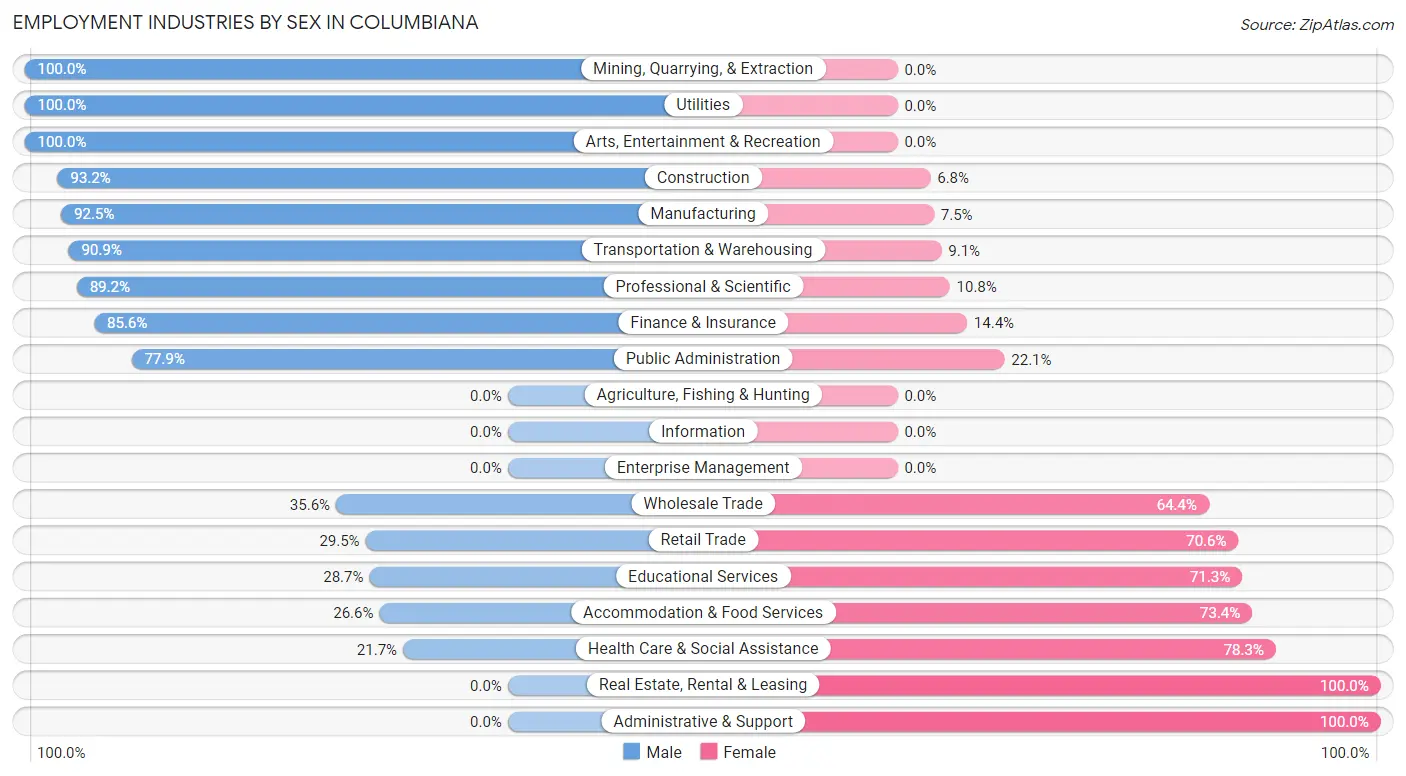
Employment Industries by Sex in Columbiana
The Columbiana industries that see more men than women are Mining, Quarrying, & Extraction (100.0%), Utilities (100.0%), and Arts, Entertainment & Recreation (100.0%), whereas the industries that tend to have a higher number of women are Real Estate, Rental & Leasing (100.0%), Administrative & Support (100.0%), and Health Care & Social Assistance (78.3%).
| Industry | Male | Female |
| Agriculture, Fishing & Hunting | 0 (0.0%) | 0 (0.0%) |
| Mining, Quarrying, & Extraction | 14 (100.0%) | 0 (0.0%) |
| Construction | 192 (93.2%) | 14 (6.8%) |
| Manufacturing | 613 (92.5%) | 50 (7.5%) |
| Wholesale Trade | 16 (35.6%) | 29 (64.4%) |
| Retail Trade | 43 (29.4%) | 103 (70.6%) |
| Transportation & Warehousing | 40 (90.9%) | 4 (9.1%) |
| Utilities | 27 (100.0%) | 0 (0.0%) |
| Information | 0 (0.0%) | 0 (0.0%) |
| Finance & Insurance | 262 (85.6%) | 44 (14.4%) |
| Real Estate, Rental & Leasing | 0 (0.0%) | 32 (100.0%) |
| Professional & Scientific | 190 (89.2%) | 23 (10.8%) |
| Enterprise Management | 0 (0.0%) | 0 (0.0%) |
| Administrative & Support | 0 (0.0%) | 135 (100.0%) |
| Educational Services | 139 (28.7%) | 346 (71.3%) |
| Health Care & Social Assistance | 102 (21.7%) | 368 (78.3%) |
| Arts, Entertainment & Recreation | 77 (100.0%) | 0 (0.0%) |
| Accommodation & Food Services | 46 (26.6%) | 127 (73.4%) |
| Public Administration | 95 (77.9%) | 27 (22.1%) |
| Total | 1,938 (58.1%) | 1,400 (41.9%) |
Education in Columbiana
School Enrollment in Columbiana
The most common levels of schooling among the 1,167 students in Columbiana are middle school (314 | 26.9%), college / undergraduate (267 | 22.9%), and elementary school (259 | 22.2%).
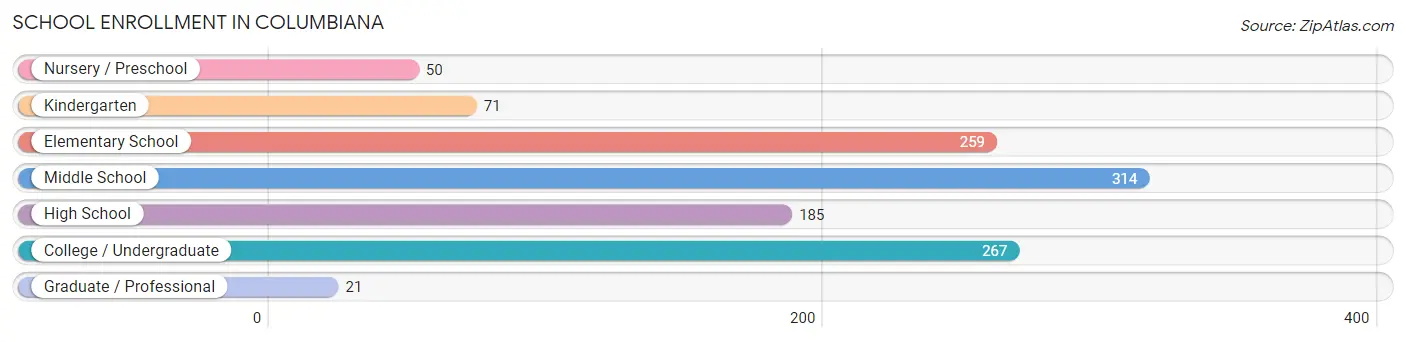
| School Level | # Students | % Students |
| Nursery / Preschool | 50 | 4.3% |
| Kindergarten | 71 | 6.1% |
| Elementary School | 259 | 22.2% |
| Middle School | 314 | 26.9% |
| High School | 185 | 15.9% |
| College / Undergraduate | 267 | 22.9% |
| Graduate / Professional | 21 | 1.8% |
| Total | 1,167 | 100.0% |
School Enrollment by Age by Funding Source in Columbiana
Out of a total of 1,167 students who are enrolled in schools in Columbiana, 125 (10.7%) attend a private institution, while the remaining 1,042 (89.3%) are enrolled in public schools. The age group of 35 years and over has the highest likelihood of being enrolled in private schools, with 14 (50.0% in the age bracket) enrolled. Conversely, the age group of 15 to 17 year olds has the lowest likelihood of being enrolled in a private school, with 97 (100.0% in the age bracket) attending a public institution.
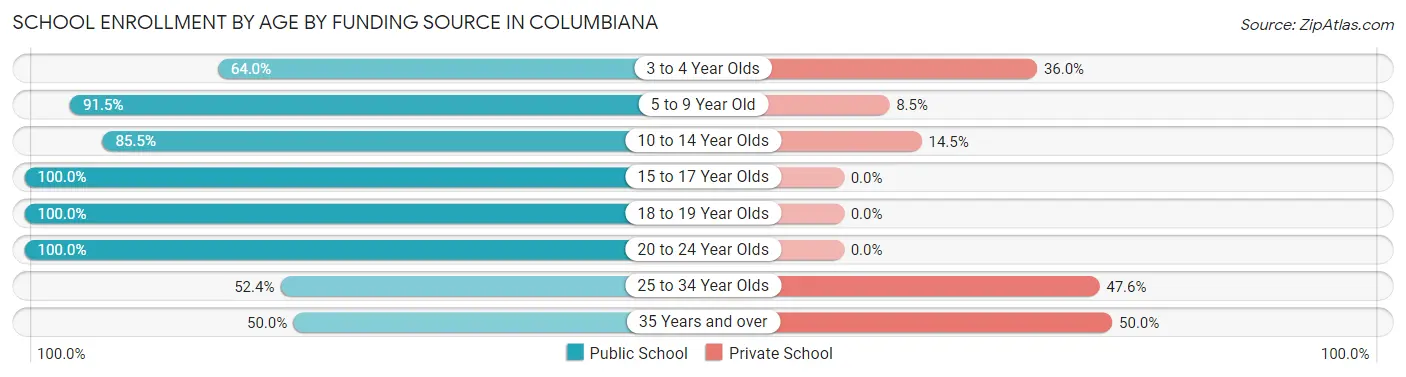
| Age Bracket | Public School | Private School |
| 3 to 4 Year Olds | 32 (64.0%) | 18 (36.0%) |
| 5 to 9 Year Old | 302 (91.5%) | 28 (8.5%) |
| 10 to 14 Year Olds | 324 (85.5%) | 55 (14.5%) |
| 15 to 17 Year Olds | 97 (100.0%) | 0 (0.0%) |
| 18 to 19 Year Olds | 9 (100.0%) | 0 (0.0%) |
| 20 to 24 Year Olds | 253 (100.0%) | 0 (0.0%) |
| 25 to 34 Year Olds | 11 (52.4%) | 10 (47.6%) |
| 35 Years and over | 14 (50.0%) | 14 (50.0%) |
| Total | 1,042 (89.3%) | 125 (10.7%) |
Educational Attainment by Field of Study in Columbiana
Education (557 | 28.7%), business (311 | 16.0%), science & technology (246 | 12.7%), arts & humanities (154 | 7.9%), and bio, nature & agricultural (126 | 6.5%) are the most common fields of study among 1,940 individuals in Columbiana who have obtained a bachelor's degree or higher.
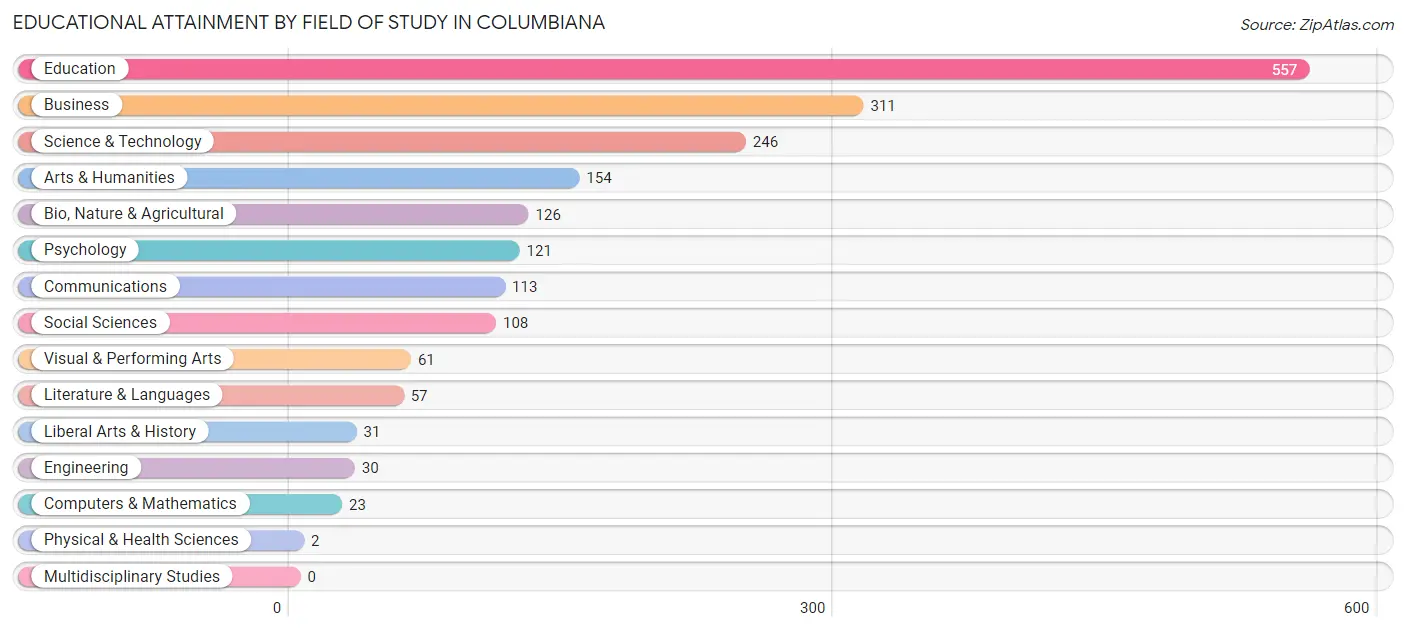
| Field of Study | # Graduates | % Graduates |
| Computers & Mathematics | 23 | 1.2% |
| Bio, Nature & Agricultural | 126 | 6.5% |
| Physical & Health Sciences | 2 | 0.1% |
| Psychology | 121 | 6.2% |
| Social Sciences | 108 | 5.6% |
| Engineering | 30 | 1.5% |
| Multidisciplinary Studies | 0 | 0.0% |
| Science & Technology | 246 | 12.7% |
| Business | 311 | 16.0% |
| Education | 557 | 28.7% |
| Literature & Languages | 57 | 2.9% |
| Liberal Arts & History | 31 | 1.6% |
| Visual & Performing Arts | 61 | 3.1% |
| Communications | 113 | 5.8% |
| Arts & Humanities | 154 | 7.9% |
| Total | 1,940 | 100.0% |
Transportation & Commute in Columbiana
Vehicle Availability by Sex in Columbiana
The most prevalent vehicle ownership categories in Columbiana are males with 2 vehicles (1,249, accounting for 64.4%) and females with 2 vehicles (807, making up 91.6%).
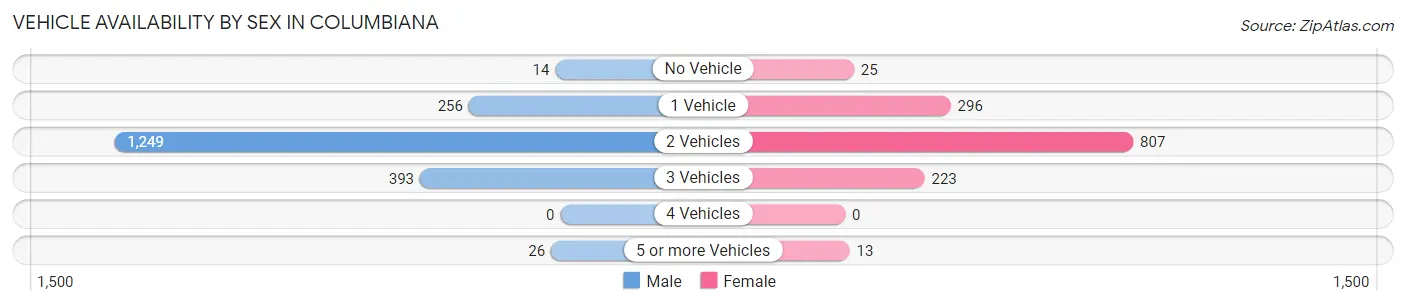
| Vehicles Available | Male | Female |
| No Vehicle | 14 (0.7%) | 25 (1.8%) |
| 1 Vehicle | 256 (13.2%) | 296 (21.7%) |
| 2 Vehicles | 1,249 (64.4%) | 807 (59.2%) |
| 3 Vehicles | 393 (20.3%) | 223 (16.4%) |
| 4 Vehicles | 0 (0.0%) | 0 (0.0%) |
| 5 or more Vehicles | 26 (1.3%) | 13 (0.9%) |
| Total | 1,938 (100.0%) | 1,364 (100.0%) |
Commute Time in Columbiana
The most frequently occuring commute durations in Columbiana are 20 to 24 minutes (620 commuters, 20.6%), 5 to 9 minutes (469 commuters, 15.6%), and 30 to 34 minutes (402 commuters, 13.4%).
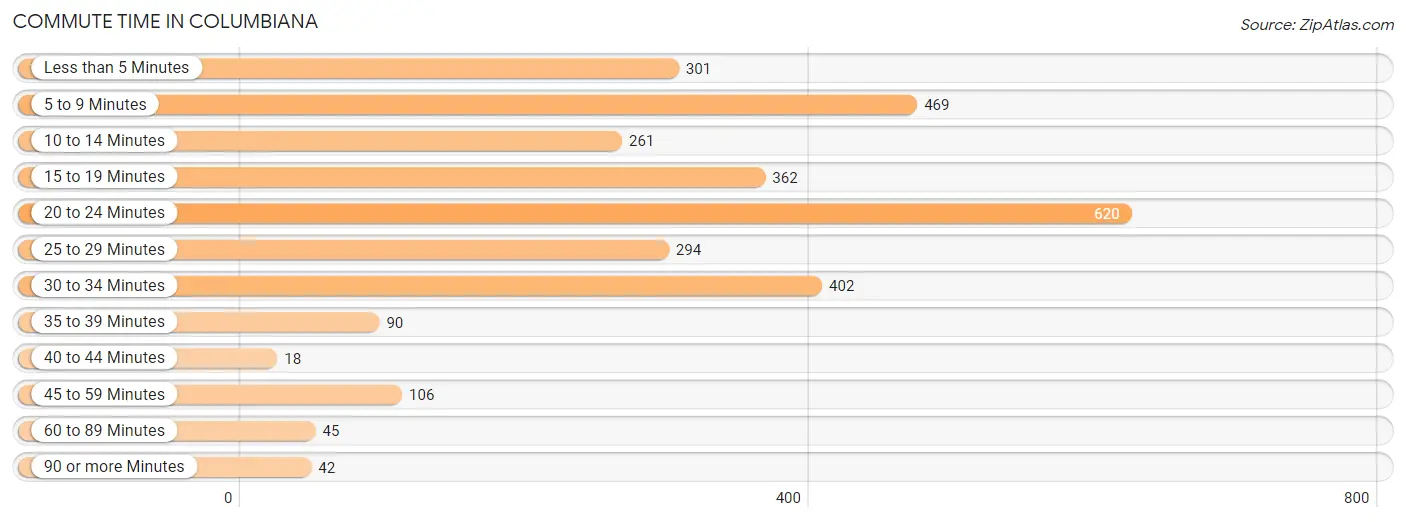
| Commute Time | # Commuters | % Commuters |
| Less than 5 Minutes | 301 | 10.0% |
| 5 to 9 Minutes | 469 | 15.6% |
| 10 to 14 Minutes | 261 | 8.7% |
| 15 to 19 Minutes | 362 | 12.0% |
| 20 to 24 Minutes | 620 | 20.6% |
| 25 to 29 Minutes | 294 | 9.8% |
| 30 to 34 Minutes | 402 | 13.4% |
| 35 to 39 Minutes | 90 | 3.0% |
| 40 to 44 Minutes | 18 | 0.6% |
| 45 to 59 Minutes | 106 | 3.5% |
| 60 to 89 Minutes | 45 | 1.5% |
| 90 or more Minutes | 42 | 1.4% |
Commute Time by Sex in Columbiana
The most common commute times in Columbiana are 20 to 24 minutes (376 commuters, 19.9%) for males and 20 to 24 minutes (244 commuters, 21.8%) for females.
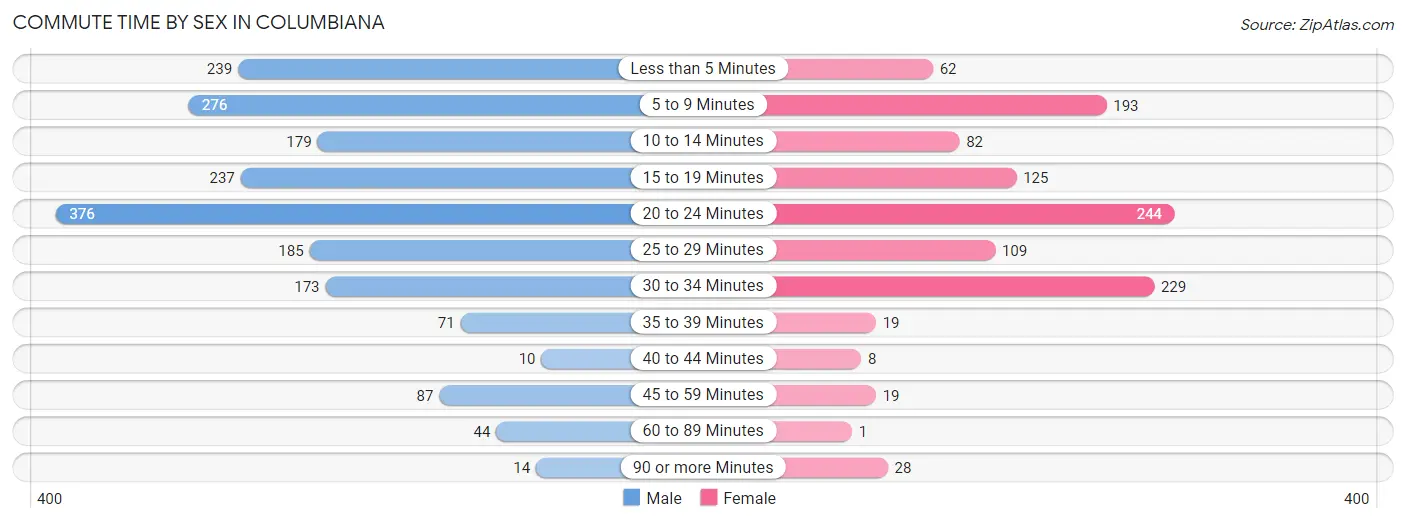
| Commute Time | Male | Female |
| Less than 5 Minutes | 239 (12.6%) | 62 (5.5%) |
| 5 to 9 Minutes | 276 (14.6%) | 193 (17.2%) |
| 10 to 14 Minutes | 179 (9.5%) | 82 (7.3%) |
| 15 to 19 Minutes | 237 (12.5%) | 125 (11.2%) |
| 20 to 24 Minutes | 376 (19.9%) | 244 (21.8%) |
| 25 to 29 Minutes | 185 (9.8%) | 109 (9.7%) |
| 30 to 34 Minutes | 173 (9.1%) | 229 (20.5%) |
| 35 to 39 Minutes | 71 (3.7%) | 19 (1.7%) |
| 40 to 44 Minutes | 10 (0.5%) | 8 (0.7%) |
| 45 to 59 Minutes | 87 (4.6%) | 19 (1.7%) |
| 60 to 89 Minutes | 44 (2.3%) | 1 (0.1%) |
| 90 or more Minutes | 14 (0.7%) | 28 (2.5%) |
Time of Departure to Work by Sex in Columbiana
The most frequent times of departure to work in Columbiana are 6:30 AM to 6:59 AM (294, 15.5%) for males and 7:30 AM to 7:59 AM (206, 18.4%) for females.
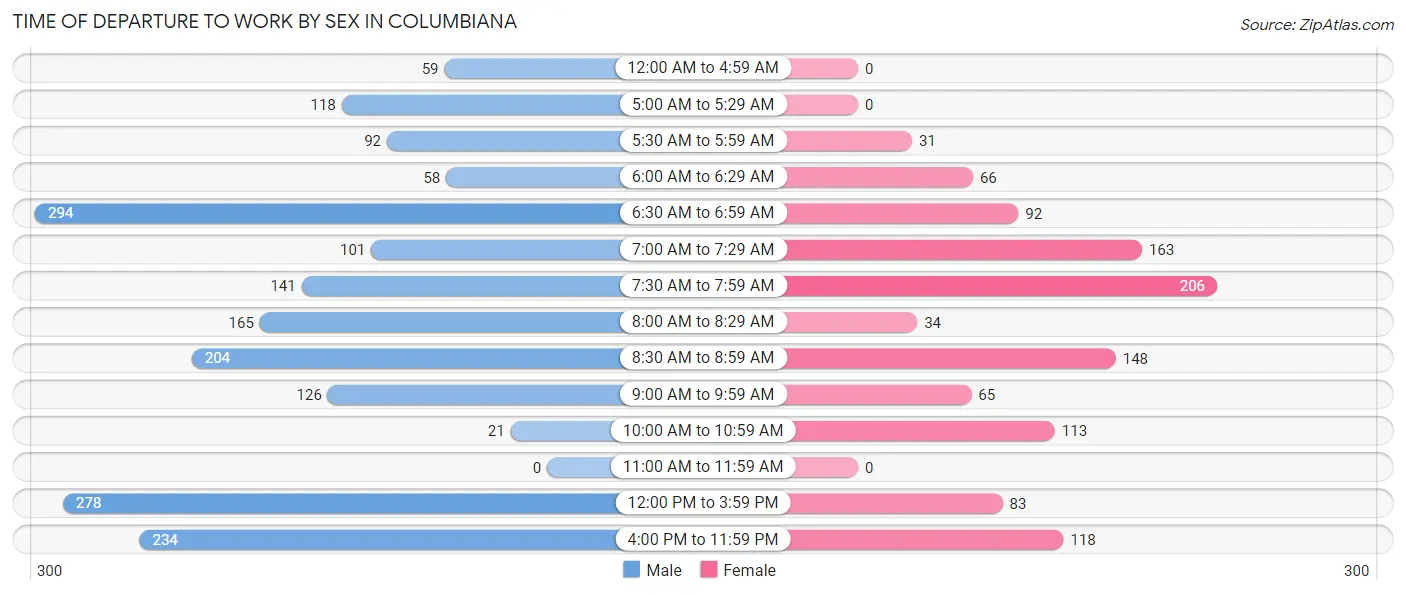
| Time of Departure | Male | Female |
| 12:00 AM to 4:59 AM | 59 (3.1%) | 0 (0.0%) |
| 5:00 AM to 5:29 AM | 118 (6.2%) | 0 (0.0%) |
| 5:30 AM to 5:59 AM | 92 (4.9%) | 31 (2.8%) |
| 6:00 AM to 6:29 AM | 58 (3.1%) | 66 (5.9%) |
| 6:30 AM to 6:59 AM | 294 (15.5%) | 92 (8.2%) |
| 7:00 AM to 7:29 AM | 101 (5.3%) | 163 (14.6%) |
| 7:30 AM to 7:59 AM | 141 (7.5%) | 206 (18.4%) |
| 8:00 AM to 8:29 AM | 165 (8.7%) | 34 (3.0%) |
| 8:30 AM to 8:59 AM | 204 (10.8%) | 148 (13.2%) |
| 9:00 AM to 9:59 AM | 126 (6.7%) | 65 (5.8%) |
| 10:00 AM to 10:59 AM | 21 (1.1%) | 113 (10.1%) |
| 11:00 AM to 11:59 AM | 0 (0.0%) | 0 (0.0%) |
| 12:00 PM to 3:59 PM | 278 (14.7%) | 83 (7.4%) |
| 4:00 PM to 11:59 PM | 234 (12.4%) | 118 (10.5%) |
| Total | 1,891 (100.0%) | 1,119 (100.0%) |
Housing Occupancy in Columbiana
Occupancy by Ownership in Columbiana
Of the total 3,238 dwellings in Columbiana, owner-occupied units account for 2,034 (62.8%), while renter-occupied units make up 1,204 (37.2%).
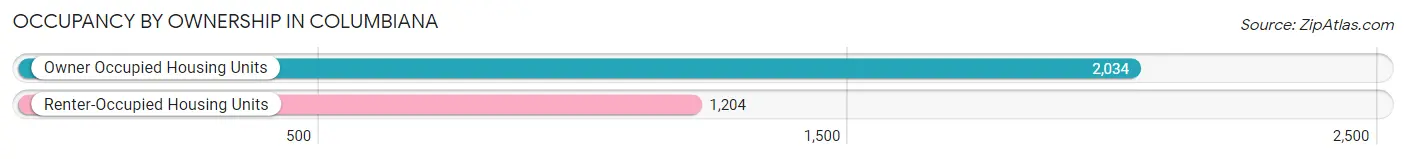
| Occupancy | # Housing Units | % Housing Units |
| Owner Occupied Housing Units | 2,034 | 62.8% |
| Renter-Occupied Housing Units | 1,204 | 37.2% |
| Total Occupied Housing Units | 3,238 | 100.0% |
Occupancy by Household Size in Columbiana
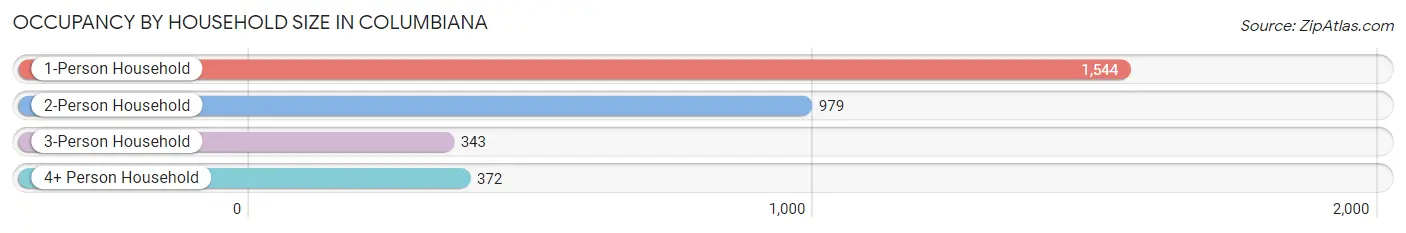
| Household Size | # Housing Units | % Housing Units |
| 1-Person Household | 1,544 | 47.7% |
| 2-Person Household | 979 | 30.2% |
| 3-Person Household | 343 | 10.6% |
| 4+ Person Household | 372 | 11.5% |
| Total Housing Units | 3,238 | 100.0% |
Occupancy by Ownership by Household Size in Columbiana
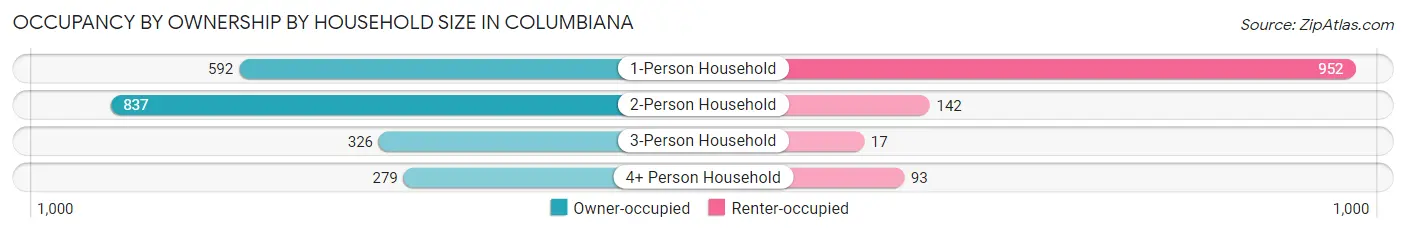
| Household Size | Owner-occupied | Renter-occupied |
| 1-Person Household | 592 (38.3%) | 952 (61.7%) |
| 2-Person Household | 837 (85.5%) | 142 (14.5%) |
| 3-Person Household | 326 (95.0%) | 17 (5.0%) |
| 4+ Person Household | 279 (75.0%) | 93 (25.0%) |
| Total Housing Units | 2,034 (62.8%) | 1,204 (37.2%) |
Occupancy by Educational Attainment in Columbiana
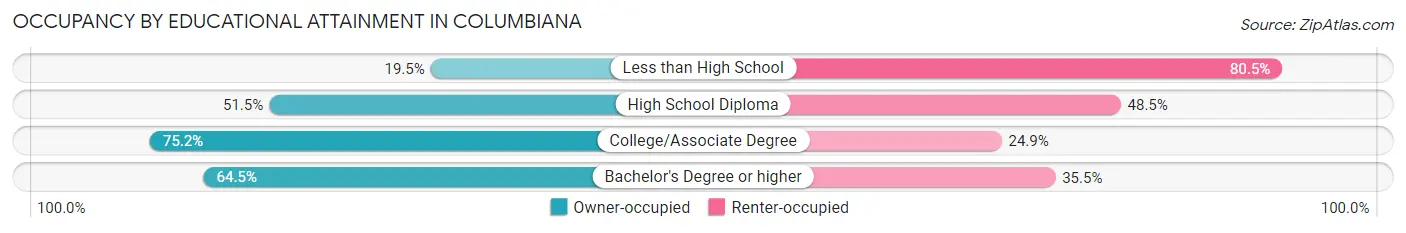
| Household Size | Owner-occupied | Renter-occupied |
| Less than High School | 8 (19.5%) | 33 (80.5%) |
| High School Diploma | 568 (51.5%) | 534 (48.5%) |
| College/Associate Degree | 753 (75.1%) | 249 (24.8%) |
| Bachelor's Degree or higher | 705 (64.5%) | 388 (35.5%) |
Occupancy by Age of Householder in Columbiana
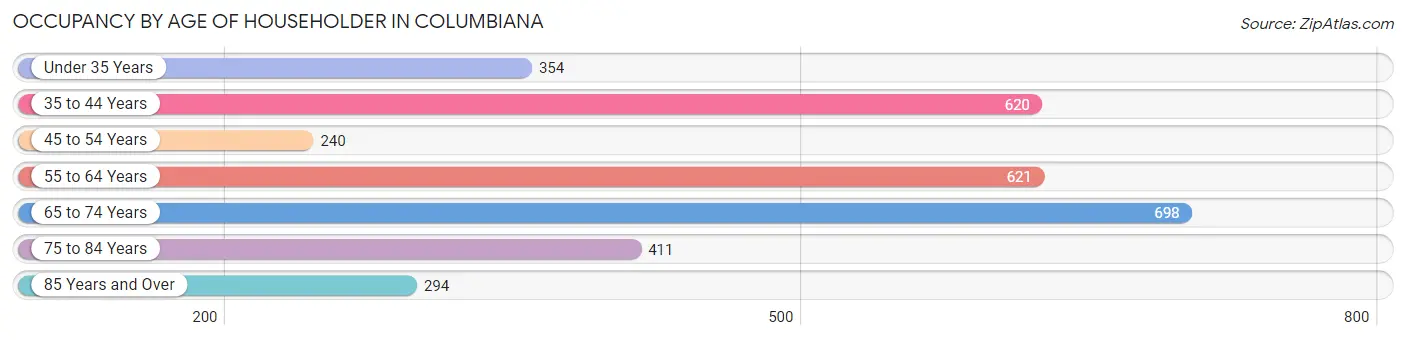
| Age Bracket | # Households | % Households |
| Under 35 Years | 354 | 10.9% |
| 35 to 44 Years | 620 | 19.2% |
| 45 to 54 Years | 240 | 7.4% |
| 55 to 64 Years | 621 | 19.2% |
| 65 to 74 Years | 698 | 21.6% |
| 75 to 84 Years | 411 | 12.7% |
| 85 Years and Over | 294 | 9.1% |
| Total | 3,238 | 100.0% |
Housing Finances in Columbiana
Median Income by Occupancy in Columbiana
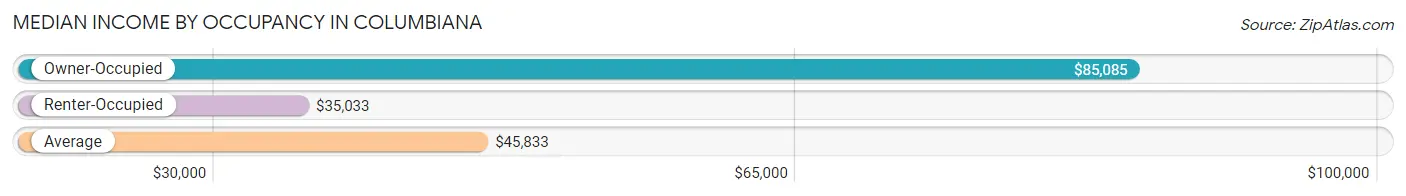
| Occupancy Type | # Households | Median Income |
| Owner-Occupied | 2,034 (62.8%) | $85,085 |
| Renter-Occupied | 1,204 (37.2%) | $35,033 |
| Average | 3,238 (100.0%) | $45,833 |
Occupancy by Householder Income Bracket in Columbiana
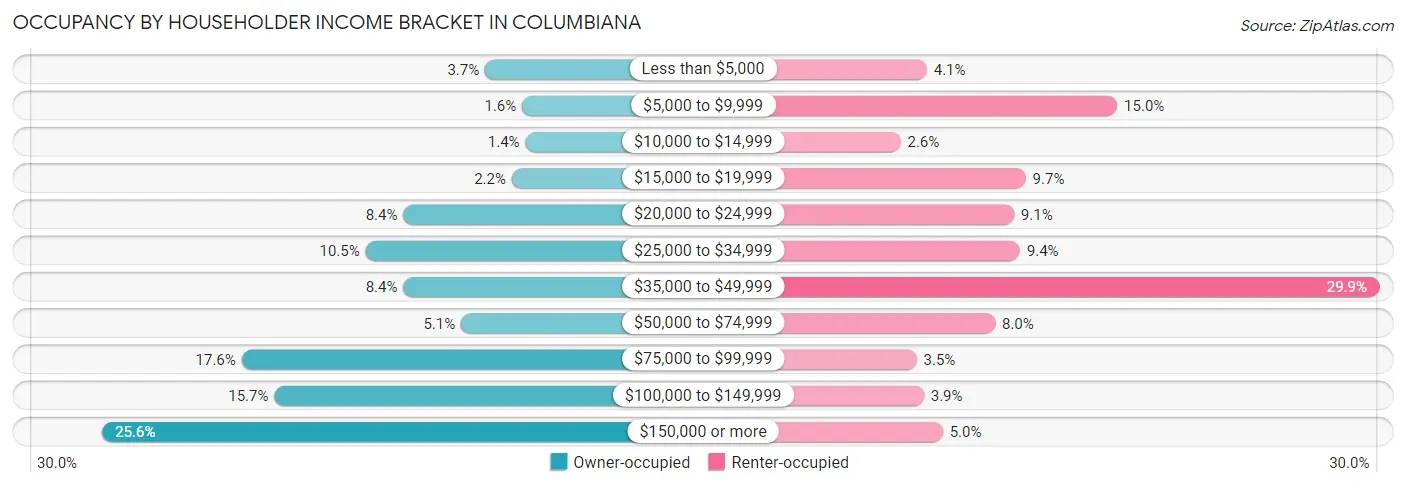
| Income Bracket | Owner-occupied | Renter-occupied |
| Less than $5,000 | 75 (3.7%) | 49 (4.1%) |
| $5,000 to $9,999 | 32 (1.6%) | 180 (14.9%) |
| $10,000 to $14,999 | 28 (1.4%) | 31 (2.6%) |
| $15,000 to $19,999 | 44 (2.2%) | 117 (9.7%) |
| $20,000 to $24,999 | 170 (8.4%) | 109 (9.0%) |
| $25,000 to $34,999 | 214 (10.5%) | 113 (9.4%) |
| $35,000 to $49,999 | 170 (8.4%) | 360 (29.9%) |
| $50,000 to $74,999 | 103 (5.1%) | 96 (8.0%) |
| $75,000 to $99,999 | 358 (17.6%) | 42 (3.5%) |
| $100,000 to $149,999 | 320 (15.7%) | 47 (3.9%) |
| $150,000 or more | 520 (25.6%) | 60 (5.0%) |
| Total | 2,034 (100.0%) | 1,204 (100.0%) |
Monthly Housing Cost Tiers in Columbiana
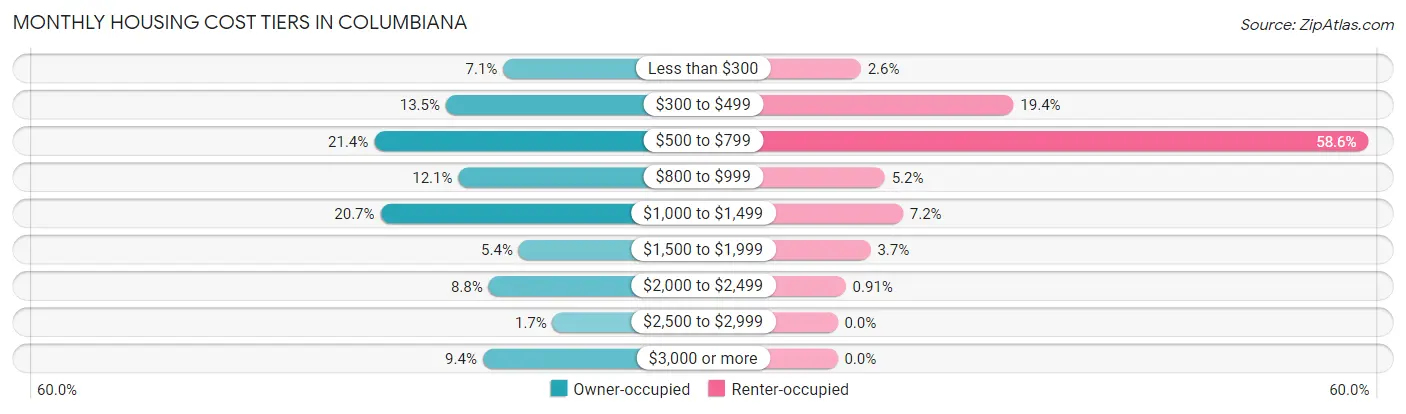
| Monthly Cost | Owner-occupied | Renter-occupied |
| Less than $300 | 145 (7.1%) | 31 (2.6%) |
| $300 to $499 | 274 (13.5%) | 234 (19.4%) |
| $500 to $799 | 435 (21.4%) | 706 (58.6%) |
| $800 to $999 | 246 (12.1%) | 63 (5.2%) |
| $1,000 to $1,499 | 421 (20.7%) | 87 (7.2%) |
| $1,500 to $1,999 | 110 (5.4%) | 44 (3.6%) |
| $2,000 to $2,499 | 178 (8.7%) | 11 (0.9%) |
| $2,500 to $2,999 | 34 (1.7%) | 0 (0.0%) |
| $3,000 or more | 191 (9.4%) | 0 (0.0%) |
| Total | 2,034 (100.0%) | 1,204 (100.0%) |
Physical Housing Characteristics in Columbiana
Housing Structures in Columbiana
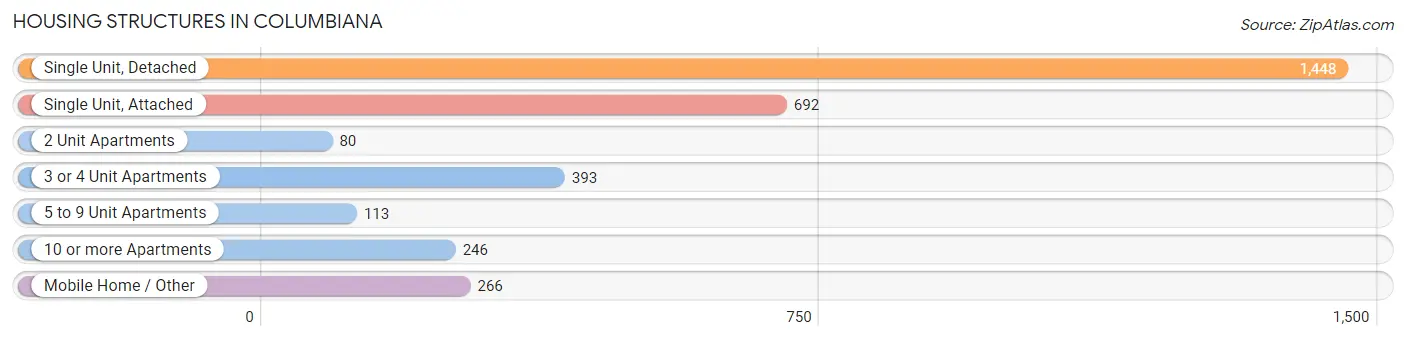
| Structure Type | # Housing Units | % Housing Units |
| Single Unit, Detached | 1,448 | 44.7% |
| Single Unit, Attached | 692 | 21.4% |
| 2 Unit Apartments | 80 | 2.5% |
| 3 or 4 Unit Apartments | 393 | 12.1% |
| 5 to 9 Unit Apartments | 113 | 3.5% |
| 10 or more Apartments | 246 | 7.6% |
| Mobile Home / Other | 266 | 8.2% |
| Total | 3,238 | 100.0% |
Housing Structures by Occupancy in Columbiana
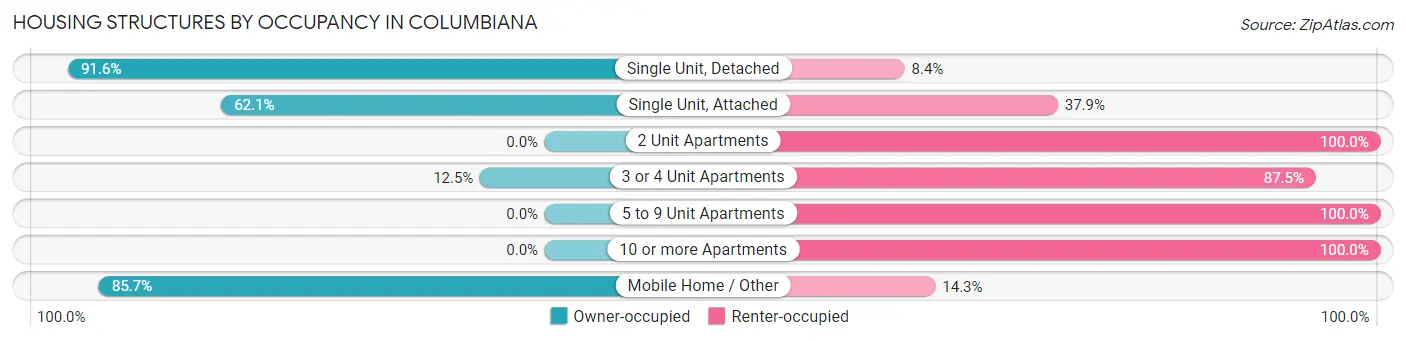
| Structure Type | Owner-occupied | Renter-occupied |
| Single Unit, Detached | 1,327 (91.6%) | 121 (8.4%) |
| Single Unit, Attached | 430 (62.1%) | 262 (37.9%) |
| 2 Unit Apartments | 0 (0.0%) | 80 (100.0%) |
| 3 or 4 Unit Apartments | 49 (12.5%) | 344 (87.5%) |
| 5 to 9 Unit Apartments | 0 (0.0%) | 113 (100.0%) |
| 10 or more Apartments | 0 (0.0%) | 246 (100.0%) |
| Mobile Home / Other | 228 (85.7%) | 38 (14.3%) |
| Total | 2,034 (62.8%) | 1,204 (37.2%) |
Housing Structures by Number of Rooms in Columbiana
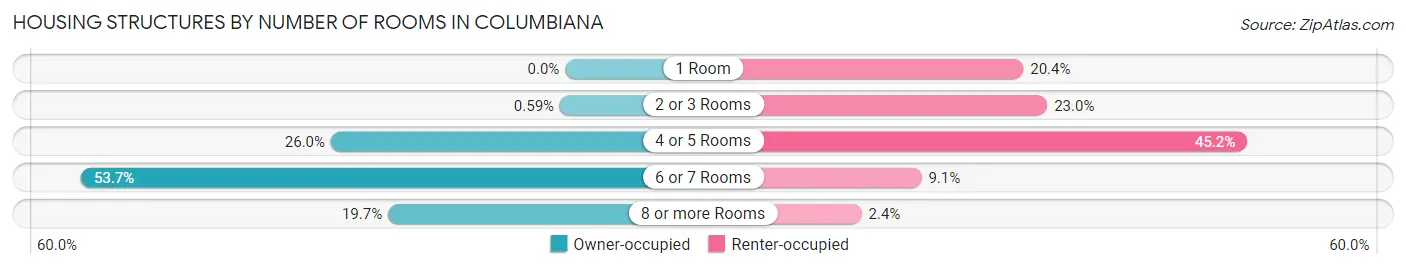
| Number of Rooms | Owner-occupied | Renter-occupied |
| 1 Room | 0 (0.0%) | 245 (20.3%) |
| 2 or 3 Rooms | 12 (0.6%) | 277 (23.0%) |
| 4 or 5 Rooms | 529 (26.0%) | 544 (45.2%) |
| 6 or 7 Rooms | 1,093 (53.7%) | 109 (9.0%) |
| 8 or more Rooms | 400 (19.7%) | 29 (2.4%) |
| Total | 2,034 (100.0%) | 1,204 (100.0%) |
Housing Structure by Heating Type in Columbiana
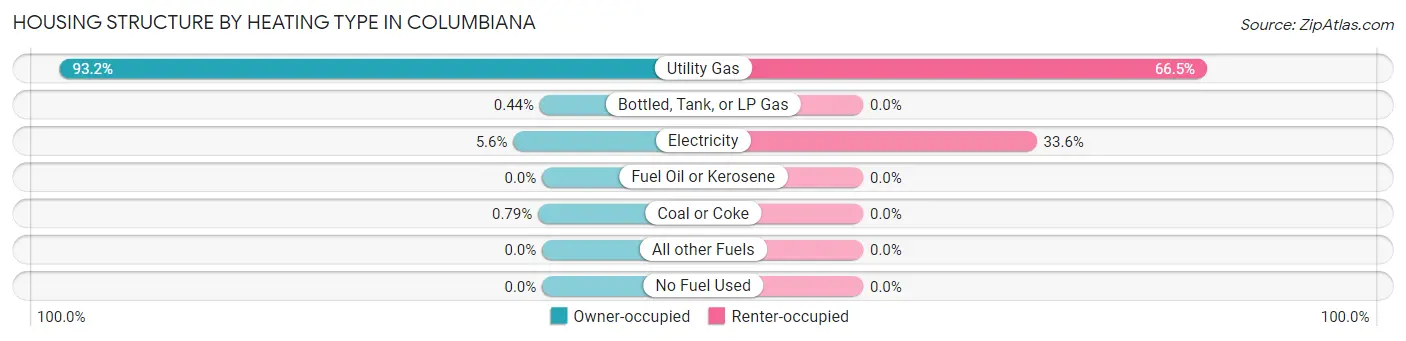
| Heating Type | Owner-occupied | Renter-occupied |
| Utility Gas | 1,896 (93.2%) | 800 (66.4%) |
| Bottled, Tank, or LP Gas | 9 (0.4%) | 0 (0.0%) |
| Electricity | 113 (5.6%) | 404 (33.6%) |
| Fuel Oil or Kerosene | 0 (0.0%) | 0 (0.0%) |
| Coal or Coke | 16 (0.8%) | 0 (0.0%) |
| All other Fuels | 0 (0.0%) | 0 (0.0%) |
| No Fuel Used | 0 (0.0%) | 0 (0.0%) |
| Total | 2,034 (100.0%) | 1,204 (100.0%) |
Household Vehicle Usage in Columbiana
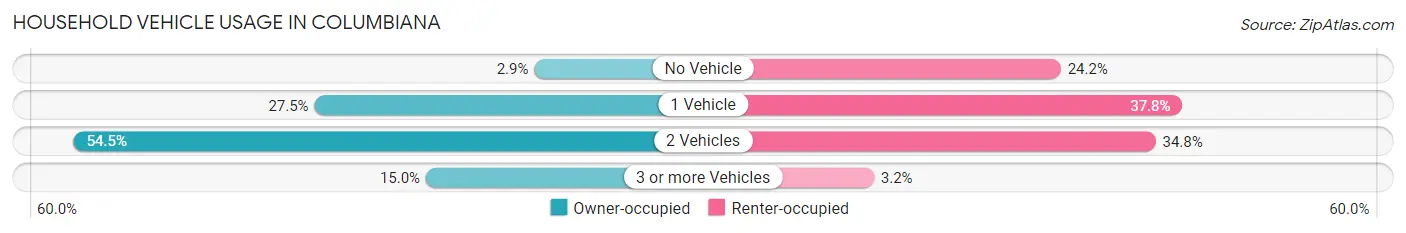
| Vehicles per Household | Owner-occupied | Renter-occupied |
| No Vehicle | 59 (2.9%) | 291 (24.2%) |
| 1 Vehicle | 560 (27.5%) | 455 (37.8%) |
| 2 Vehicles | 1,109 (54.5%) | 419 (34.8%) |
| 3 or more Vehicles | 306 (15.0%) | 39 (3.2%) |
| Total | 2,034 (100.0%) | 1,204 (100.0%) |
Real Estate & Mortgages in Columbiana
Real Estate and Mortgage Overview in Columbiana
| Characteristic | Without Mortgage | With Mortgage |
| Housing Units | 828 | 1,206 |
| Median Property Value | $163,900 | $194,700 |
| Median Household Income | $32,639 | $474 |
| Monthly Housing Costs | $497 | $191 |
| Real Estate Taxes | $1,543 | $22 |
Property Value by Mortgage Status in Columbiana
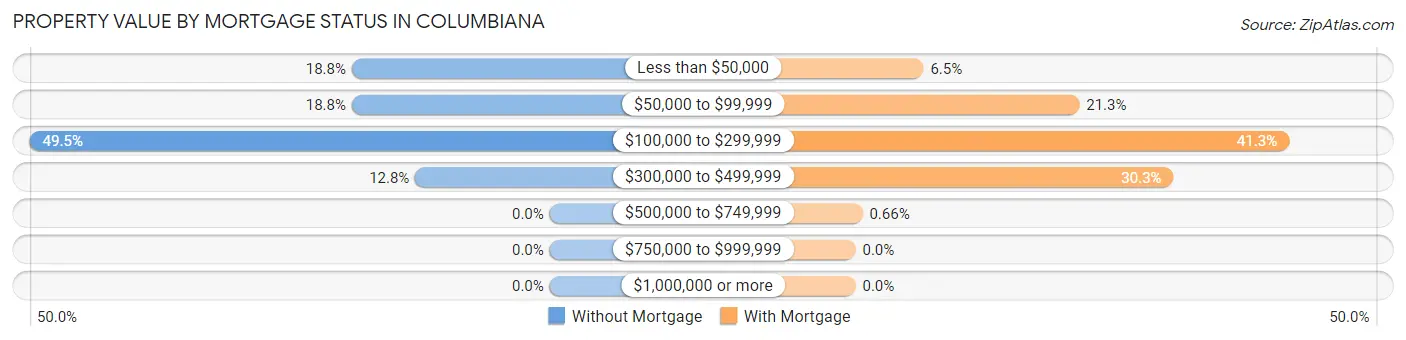
| Property Value | Without Mortgage | With Mortgage |
| Less than $50,000 | 156 (18.8%) | 78 (6.5%) |
| $50,000 to $99,999 | 156 (18.8%) | 257 (21.3%) |
| $100,000 to $299,999 | 410 (49.5%) | 498 (41.3%) |
| $300,000 to $499,999 | 106 (12.8%) | 365 (30.3%) |
| $500,000 to $749,999 | 0 (0.0%) | 8 (0.7%) |
| $750,000 to $999,999 | 0 (0.0%) | 0 (0.0%) |
| $1,000,000 or more | 0 (0.0%) | 0 (0.0%) |
| Total | 828 (100.0%) | 1,206 (100.0%) |
Household Income by Mortgage Status in Columbiana
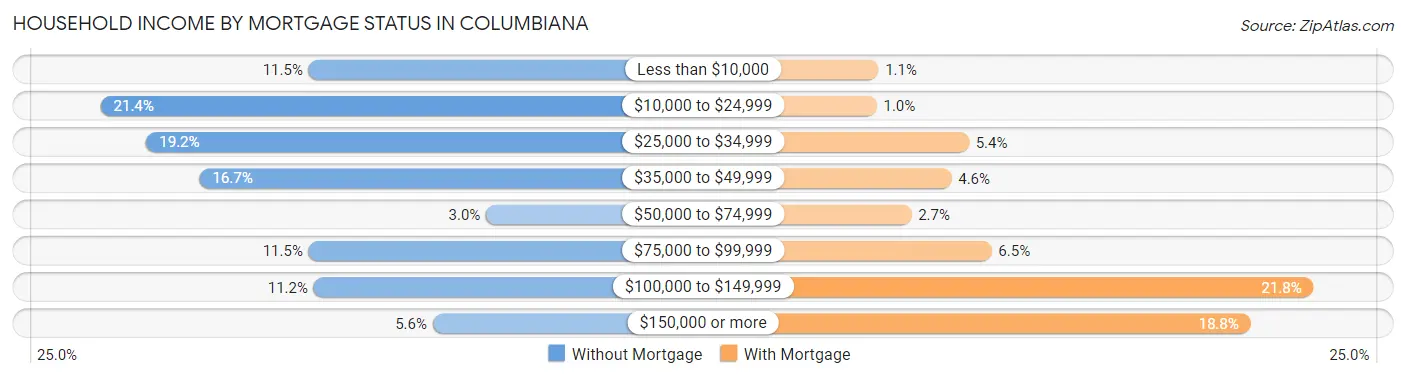
| Household Income | Without Mortgage | With Mortgage |
| Less than $10,000 | 95 (11.5%) | 13 (1.1%) |
| $10,000 to $24,999 | 177 (21.4%) | 12 (1.0%) |
| $25,000 to $34,999 | 159 (19.2%) | 65 (5.4%) |
| $35,000 to $49,999 | 138 (16.7%) | 55 (4.6%) |
| $50,000 to $74,999 | 25 (3.0%) | 32 (2.6%) |
| $75,000 to $99,999 | 95 (11.5%) | 78 (6.5%) |
| $100,000 to $149,999 | 93 (11.2%) | 263 (21.8%) |
| $150,000 or more | 46 (5.6%) | 227 (18.8%) |
| Total | 828 (100.0%) | 1,206 (100.0%) |
Property Value to Household Income Ratio in Columbiana
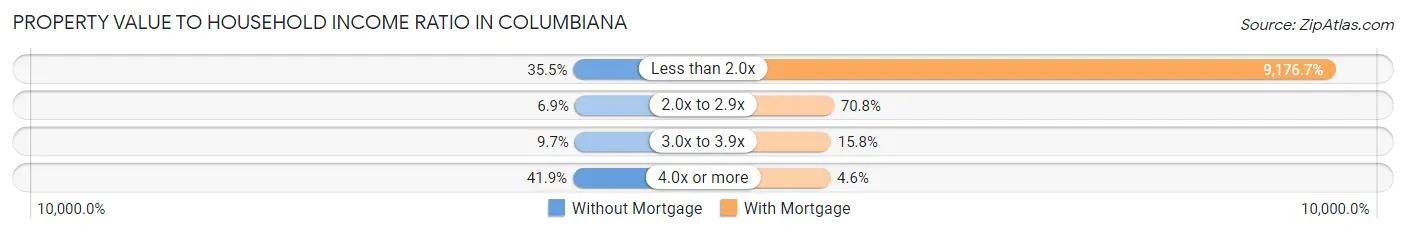
| Value-to-Income Ratio | Without Mortgage | With Mortgage |
| Less than 2.0x | 294 (35.5%) | 110,671 (9,176.7%) |
| 2.0x to 2.9x | 57 (6.9%) | 854 (70.8%) |
| 3.0x to 3.9x | 80 (9.7%) | 191 (15.8%) |
| 4.0x or more | 347 (41.9%) | 55 (4.6%) |
| Total | 828 (100.0%) | 1,206 (100.0%) |
Real Estate Taxes by Mortgage Status in Columbiana
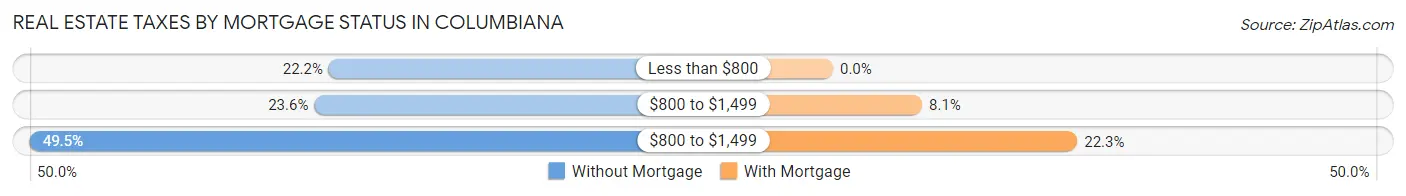
| Property Taxes | Without Mortgage | With Mortgage |
| Less than $800 | 184 (22.2%) | 0 (0.0%) |
| $800 to $1,499 | 195 (23.5%) | 98 (8.1%) |
| $800 to $1,499 | 410 (49.5%) | 269 (22.3%) |
| Total | 828 (100.0%) | 1,206 (100.0%) |
Health & Disability in Columbiana
Health Insurance Coverage by Age in Columbiana
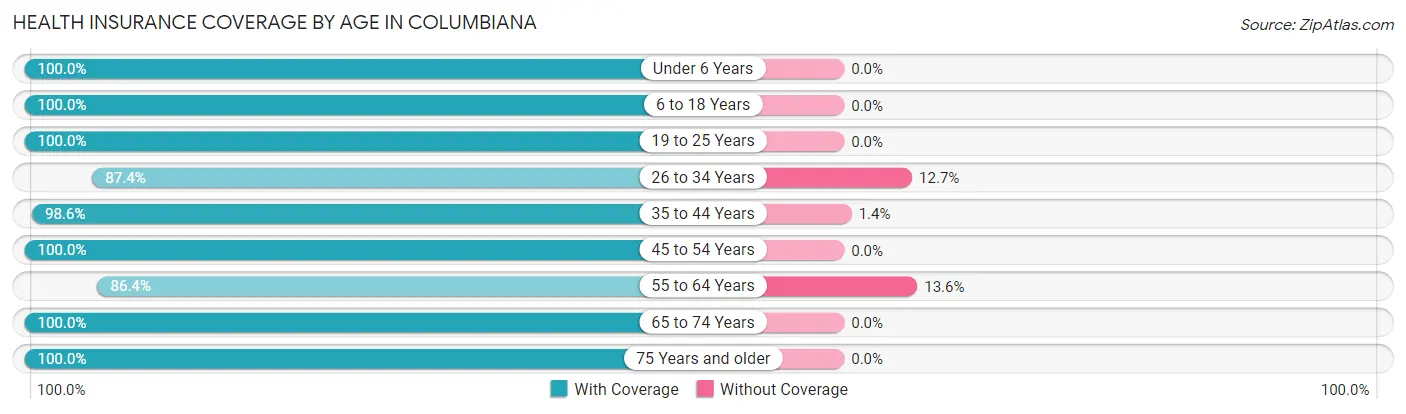
| Age Bracket | With Coverage | Without Coverage |
| Under 6 Years | 269 (100.0%) | 0 (0.0%) |
| 6 to 18 Years | 803 (100.0%) | 0 (0.0%) |
| 19 to 25 Years | 436 (100.0%) | 0 (0.0%) |
| 26 to 34 Years | 518 (87.4%) | 75 (12.7%) |
| 35 to 44 Years | 1,063 (98.6%) | 15 (1.4%) |
| 45 to 54 Years | 563 (100.0%) | 0 (0.0%) |
| 55 to 64 Years | 761 (86.4%) | 120 (13.6%) |
| 65 to 74 Years | 933 (100.0%) | 0 (0.0%) |
| 75 Years and older | 922 (100.0%) | 0 (0.0%) |
| Total | 6,268 (96.8%) | 210 (3.2%) |
Health Insurance Coverage by Citizenship Status in Columbiana
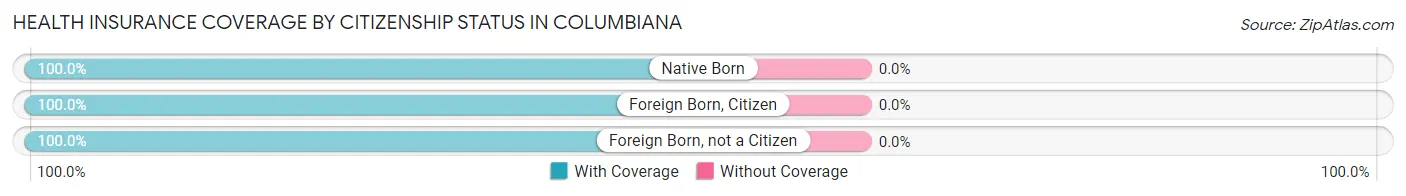
| Citizenship Status | With Coverage | Without Coverage |
| Native Born | 269 (100.0%) | 0 (0.0%) |
| Foreign Born, Citizen | 803 (100.0%) | 0 (0.0%) |
| Foreign Born, not a Citizen | 436 (100.0%) | 0 (0.0%) |
Health Insurance Coverage by Household Income in Columbiana
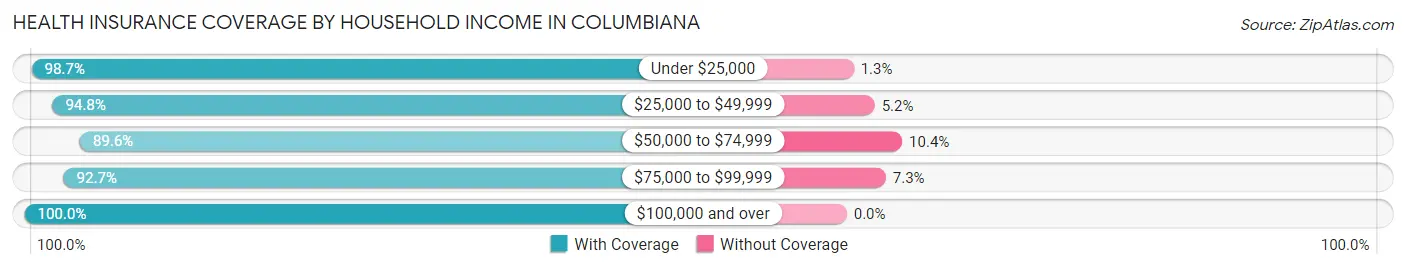
| Household Income | With Coverage | Without Coverage |
| Under $25,000 | 984 (98.7%) | 13 (1.3%) |
| $25,000 to $49,999 | 1,196 (94.8%) | 66 (5.2%) |
| $50,000 to $74,999 | 432 (89.6%) | 50 (10.4%) |
| $75,000 to $99,999 | 1,026 (92.7%) | 81 (7.3%) |
| $100,000 and over | 2,629 (100.0%) | 0 (0.0%) |
Public vs Private Health Insurance Coverage by Age in Columbiana
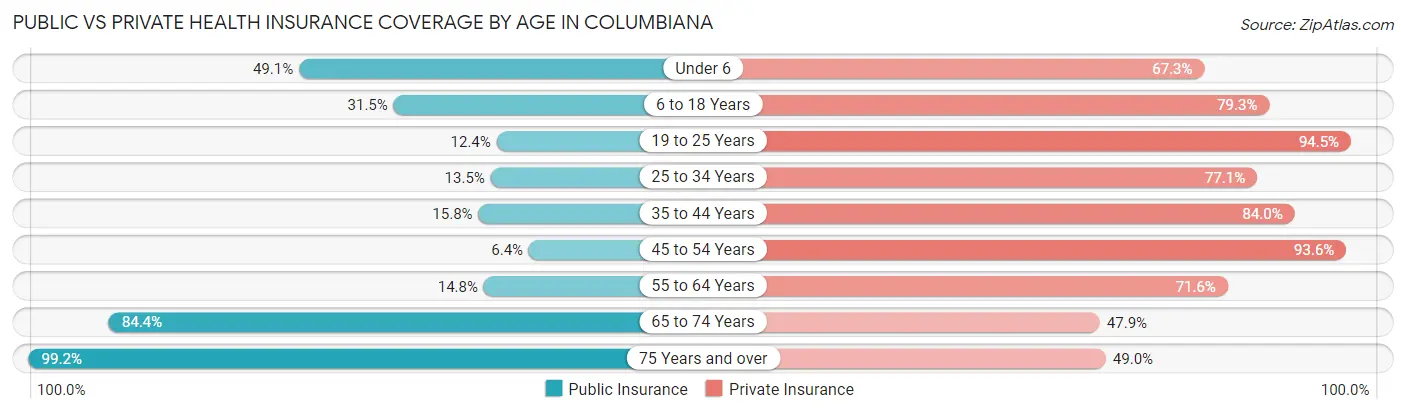
| Age Bracket | Public Insurance | Private Insurance |
| Under 6 | 132 (49.1%) | 181 (67.3%) |
| 6 to 18 Years | 253 (31.5%) | 637 (79.3%) |
| 19 to 25 Years | 54 (12.4%) | 412 (94.5%) |
| 25 to 34 Years | 80 (13.5%) | 457 (77.1%) |
| 35 to 44 Years | 170 (15.8%) | 906 (84.0%) |
| 45 to 54 Years | 36 (6.4%) | 527 (93.6%) |
| 55 to 64 Years | 130 (14.8%) | 631 (71.6%) |
| 65 to 74 Years | 787 (84.4%) | 447 (47.9%) |
| 75 Years and over | 915 (99.2%) | 452 (49.0%) |
| Total | 2,557 (39.5%) | 4,650 (71.8%) |
Disability Status by Sex by Age in Columbiana
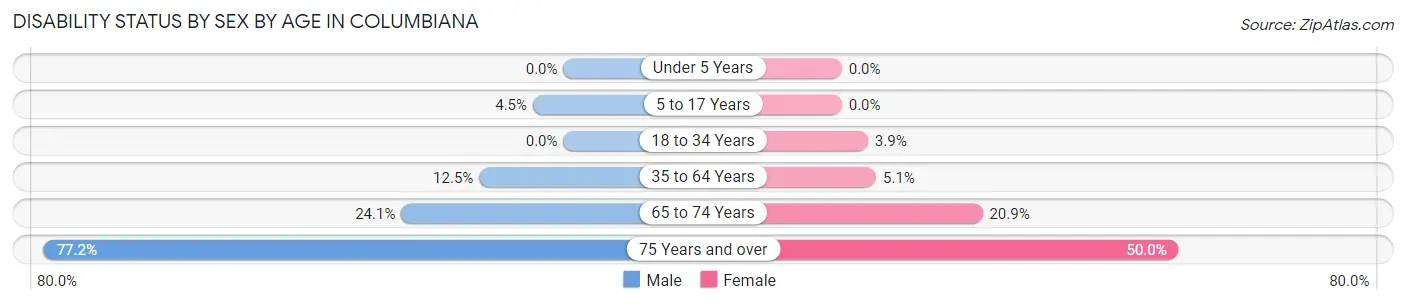
| Age Bracket | Male | Female |
| Under 5 Years | 0 (0.0%) | 0 (0.0%) |
| 5 to 17 Years | 19 (4.5%) | 0 (0.0%) |
| 18 to 34 Years | 0 (0.0%) | 19 (3.9%) |
| 35 to 64 Years | 168 (12.5%) | 60 (5.1%) |
| 65 to 74 Years | 84 (24.1%) | 122 (20.9%) |
| 75 Years and over | 233 (77.1%) | 310 (50.0%) |
Disability Class by Sex by Age in Columbiana
Disability Class: Hearing Difficulty
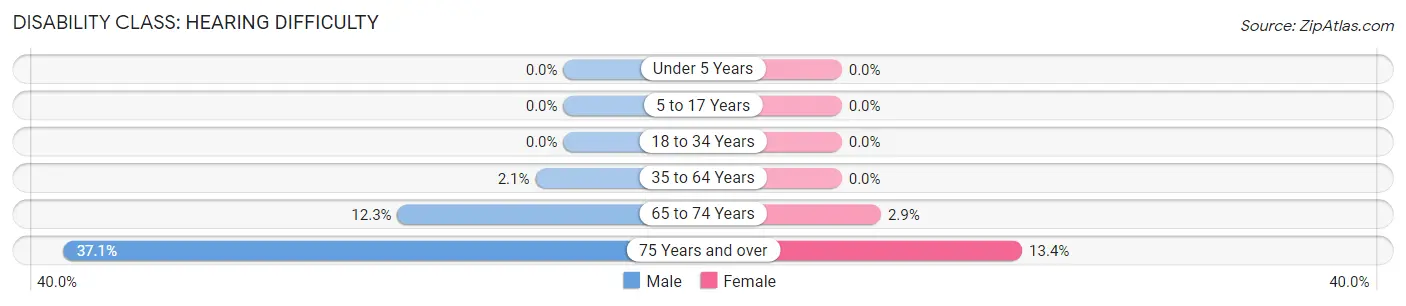
| Age Bracket | Male | Female |
| Under 5 Years | 0 (0.0%) | 0 (0.0%) |
| 5 to 17 Years | 0 (0.0%) | 0 (0.0%) |
| 18 to 34 Years | 0 (0.0%) | 0 (0.0%) |
| 35 to 64 Years | 28 (2.1%) | 0 (0.0%) |
| 65 to 74 Years | 43 (12.3%) | 17 (2.9%) |
| 75 Years and over | 112 (37.1%) | 83 (13.4%) |
Disability Class: Vision Difficulty
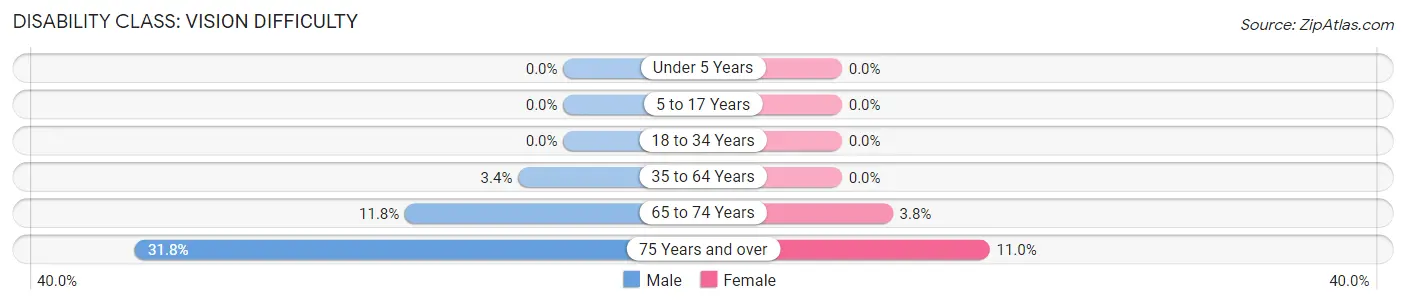
| Age Bracket | Male | Female |
| Under 5 Years | 0 (0.0%) | 0 (0.0%) |
| 5 to 17 Years | 0 (0.0%) | 0 (0.0%) |
| 18 to 34 Years | 0 (0.0%) | 0 (0.0%) |
| 35 to 64 Years | 45 (3.4%) | 0 (0.0%) |
| 65 to 74 Years | 41 (11.7%) | 22 (3.8%) |
| 75 Years and over | 96 (31.8%) | 68 (11.0%) |
Disability Class: Cognitive Difficulty
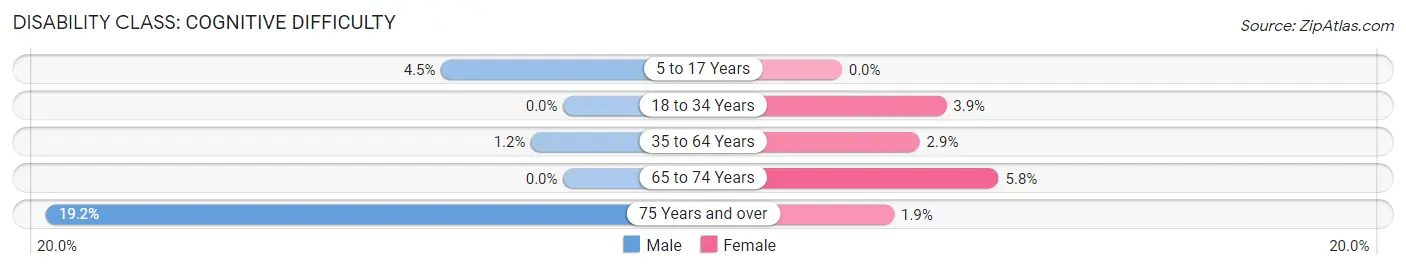
| Age Bracket | Male | Female |
| 5 to 17 Years | 19 (4.5%) | 0 (0.0%) |
| 18 to 34 Years | 0 (0.0%) | 19 (3.9%) |
| 35 to 64 Years | 16 (1.2%) | 34 (2.9%) |
| 65 to 74 Years | 0 (0.0%) | 34 (5.8%) |
| 75 Years and over | 58 (19.2%) | 12 (1.9%) |
Disability Class: Ambulatory Difficulty
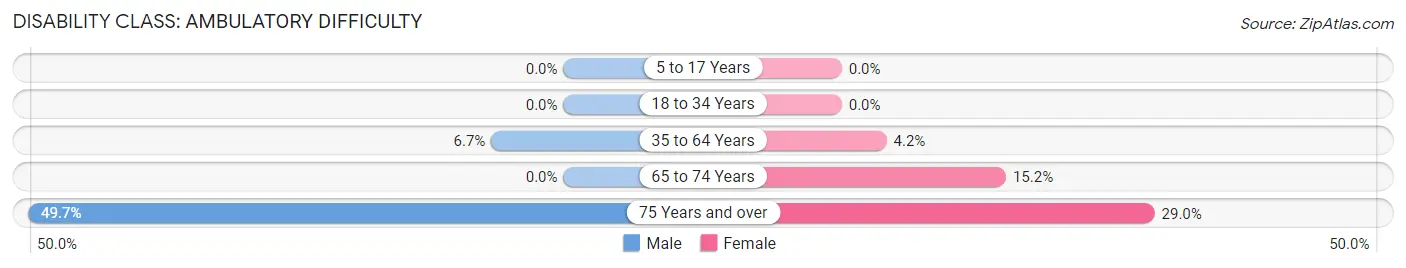
| Age Bracket | Male | Female |
| 5 to 17 Years | 0 (0.0%) | 0 (0.0%) |
| 18 to 34 Years | 0 (0.0%) | 0 (0.0%) |
| 35 to 64 Years | 90 (6.7%) | 49 (4.2%) |
| 65 to 74 Years | 0 (0.0%) | 89 (15.2%) |
| 75 Years and over | 150 (49.7%) | 180 (29.0%) |
Disability Class: Self-Care Difficulty
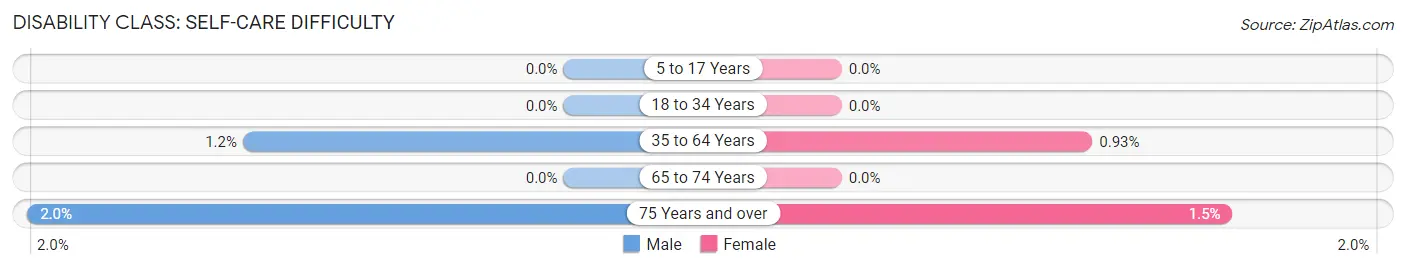
| Age Bracket | Male | Female |
| 5 to 17 Years | 0 (0.0%) | 0 (0.0%) |
| 18 to 34 Years | 0 (0.0%) | 0 (0.0%) |
| 35 to 64 Years | 16 (1.2%) | 11 (0.9%) |
| 65 to 74 Years | 0 (0.0%) | 0 (0.0%) |
| 75 Years and over | 6 (2.0%) | 9 (1.5%) |
Technology Access in Columbiana
Computing Device Access in Columbiana
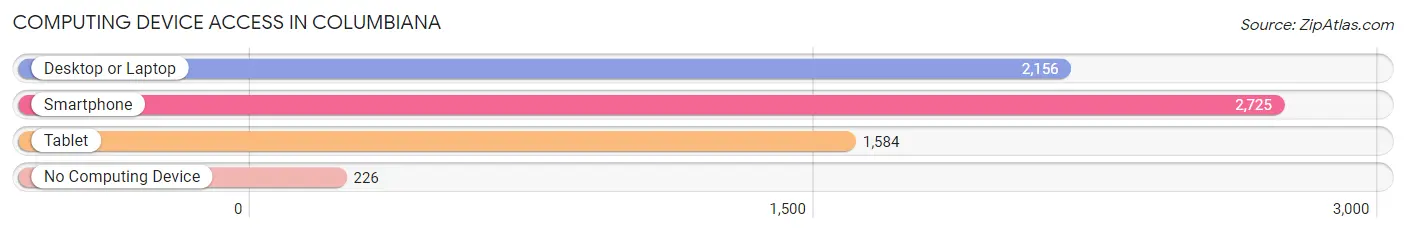
| Device Type | # Households | % Households |
| Desktop or Laptop | 2,156 | 66.6% |
| Smartphone | 2,725 | 84.2% |
| Tablet | 1,584 | 48.9% |
| No Computing Device | 226 | 7.0% |
| Total | 3,238 | 100.0% |
Internet Access in Columbiana
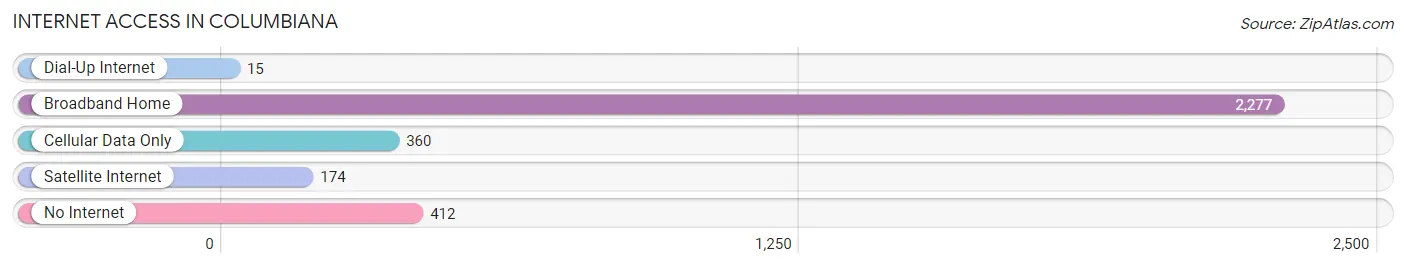
| Internet Type | # Households | % Households |
| Dial-Up Internet | 15 | 0.5% |
| Broadband Home | 2,277 | 70.3% |
| Cellular Data Only | 360 | 11.1% |
| Satellite Internet | 174 | 5.4% |
| No Internet | 412 | 12.7% |
| Total | 3,238 | 100.0% |
Columbiana Summary
Columbiana, Ohio is a small city located in the northeastern part of the state, in Columbiana County. It is situated on the banks of the Little Beaver Creek, and is part of the greater Youngstown-Warren-Boardman metropolitan area. The city has a population of approximately 6,500 people, and is known for its small-town charm and friendly atmosphere.
History
The area that is now Columbiana was first settled in 1802 by a group of Quakers from Pennsylvania. The town was originally known as New Lancaster, and was later renamed Columbiana in 1805 in honor of Christopher Columbus. The town was officially incorporated in 1817, and was the first town in the county to be incorporated.
In the early 19th century, the town was a major center for the production of woolen goods, and was home to several mills. The town also had a thriving agricultural industry, and was known for its production of apples, peaches, and other fruits.
In the late 19th century, the town began to experience a period of growth and prosperity. The town was home to several factories, including a glass factory, a brick factory, and a paper mill. The town also had a thriving business district, with several stores and businesses.
Geography
Columbiana is located in northeastern Ohio, in Columbiana County. The city is situated on the banks of the Little Beaver Creek, and is part of the greater Youngstown-Warren-Boardman metropolitan area. The city has a total area of 2.3 square miles, all of which is land.
The city is located in a hilly region, and is surrounded by several small towns and villages. The city is located approximately 30 miles south of Cleveland, and is about an hour's drive from Pittsburgh, Pennsylvania.
Economy
The economy of Columbiana is largely based on manufacturing and agriculture. The city is home to several factories, including a glass factory, a brick factory, and a paper mill. The city also has a thriving agricultural industry, and is known for its production of apples, peaches, and other fruits.
The city also has a thriving business district, with several stores and businesses. The city is home to several restaurants, bars, and other entertainment venues.
Demographics
As of the 2010 census, the population of Columbiana was 6,500 people. The racial makeup of the city was 97.2% White, 0.7% African American, 0.2% Native American, 0.3% Asian, 0.1% Pacific Islander, 0.4% from other races, and 1.1% from two or more races. Hispanic or Latino of any race were 1.2% of the population.
The median household income in the city was $37,917, and the median family income was $45,938. The per capita income in the city was $19,845. About 11.2% of families and 14.2% of the population were below the poverty line, including 19.2% of those under age 18 and 8.2% of those age 65 or over.
Common Questions
What is Per Capita Income in Columbiana?
Per Capita income in Columbiana is $41,254.
What is the Median Family Income in Columbiana?
Median Family Income in Columbiana is $99,091.
What is the Median Household income in Columbiana?
Median Household Income in Columbiana is $45,833.
What is Income or Wage Gap in Columbiana?
Income or Wage Gap in Columbiana is 39.1%.
Women in Columbiana earn 60.9 cents for every dollar earned by a man.
What is Inequality or Gini Index in Columbiana?
Inequality or Gini Index in Columbiana is 0.51.
What is the Total Population of Columbiana?
Total Population of Columbiana is 6,688.
What is the Total Male Population of Columbiana?
Total Male Population of Columbiana is 3,132.
What is the Total Female Population of Columbiana?
Total Female Population of Columbiana is 3,556.
What is the Ratio of Males per 100 Females in Columbiana?
There are 88.08 Males per 100 Females in Columbiana.
What is the Ratio of Females per 100 Males in Columbiana?
There are 113.54 Females per 100 Males in Columbiana.
What is the Median Population Age in Columbiana?
Median Population Age in Columbiana is 50.3 Years.
What is the Average Family Size in Columbiana
Average Family Size in Columbiana is 2.8 People.
What is the Average Household Size in Columbiana
Average Household Size in Columbiana is 2.0 People.
How Large is the Labor Force in Columbiana?
There are 3,376 People in the Labor Forcein in Columbiana.
What is the Percentage of People in the Labor Force in Columbiana?
59.7% of People are in the Labor Force in Columbiana.
What is the Unemployment Rate in Columbiana?
Unemployment Rate in Columbiana is 1.2%.