Zip Codes with the Lowest Poverty Level Among Children Under the Age of 5 in Ohio
RELATED REPORTS & OPTIONS
Lowest Poverty | Child 0-5
Ohio
Compare Zip Codes
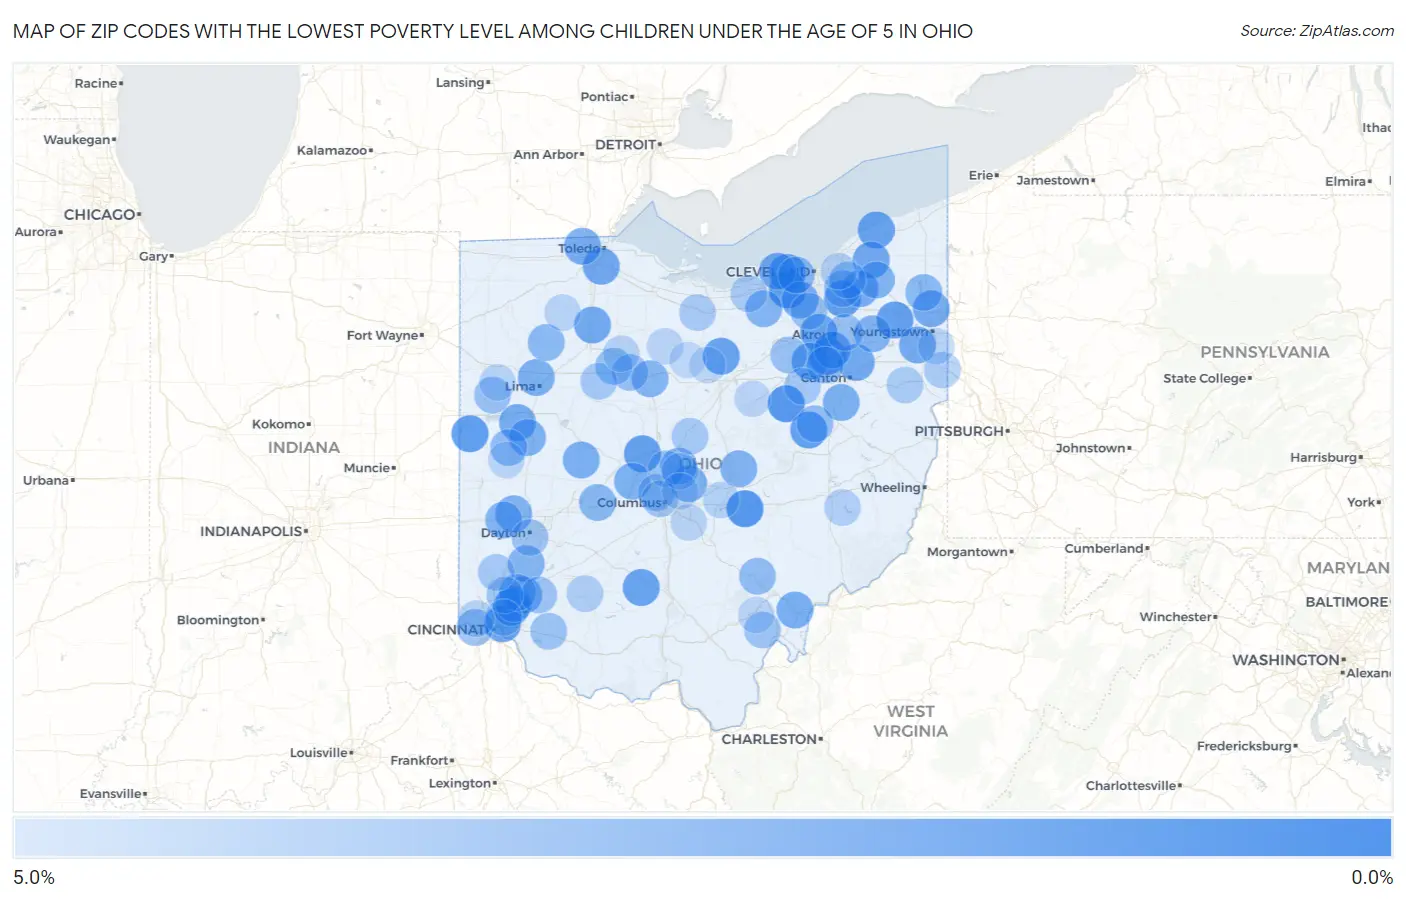
Map of Zip Codes with the Lowest Poverty Level Among Children Under the Age of 5 in Ohio
5.0%
0.0%
Zip Codes with the Lowest Poverty Level Among Children Under the Age of 5 in Ohio
| Zip Code | Child Poverty | vs State | vs National | |
| 1. | 44633 | 0.33% | 20.7%(-20.3)#1 | 18.1%(-17.7)#17 |
| 2. | 43739 | 0.34% | 20.7%(-20.3)#2 | 18.1%(-17.7)#20 |
| 3. | 44138 | 0.57% | 20.7%(-20.1)#3 | 18.1%(-17.5)#82 |
| 4. | 44140 | 0.70% | 20.7%(-20.0)#4 | 18.1%(-17.4)#129 |
| 5. | 45846 | 0.76% | 20.7%(-19.9)#5 | 18.1%(-17.3)#154 |
| 6. | 44087 | 0.83% | 20.7%(-19.8)#6 | 18.1%(-17.2)#190 |
| 7. | 43804 | 0.83% | 20.7%(-19.8)#7 | 18.1%(-17.2)#191 |
| 8. | 44216 | 0.89% | 20.7%(-19.8)#8 | 18.1%(-17.2)#225 |
| 9. | 44444 | 0.89% | 20.7%(-19.8)#9 | 18.1%(-17.2)#226 |
| 10. | 43061 | 0.92% | 20.7%(-19.7)#10 | 18.1%(-17.1)#243 |
| 11. | 44321 | 0.94% | 20.7%(-19.7)#11 | 18.1%(-17.1)#251 |
| 12. | 44878 | 0.98% | 20.7%(-19.7)#12 | 18.1%(-17.1)#266 |
| 13. | 44081 | 1.0% | 20.7%(-19.7)#13 | 18.1%(-17.1)#278 |
| 14. | 45628 | 1.0% | 20.7%(-19.7)#14 | 18.1%(-17.1)#280 |
| 15. | 45208 | 1.0% | 20.7%(-19.6)#15 | 18.1%(-17.0)#300 |
| 16. | 44645 | 1.1% | 20.7%(-19.6)#16 | 18.1%(-17.0)#328 |
| 17. | 45242 | 1.1% | 20.7%(-19.6)#17 | 18.1%(-16.9)#333 |
| 18. | 44024 | 1.3% | 20.7%(-19.4)#18 | 18.1%(-16.8)#410 |
| 19. | 43551 | 1.3% | 20.7%(-19.3)#19 | 18.1%(-16.7)#434 |
| 20. | 45889 | 1.3% | 20.7%(-19.3)#20 | 18.1%(-16.7)#443 |
| 21. | 44012 | 1.4% | 20.7%(-19.3)#21 | 18.1%(-16.7)#472 |
| 22. | 44721 | 1.4% | 20.7%(-19.3)#22 | 18.1%(-16.7)#473 |
| 23. | 44406 | 1.4% | 20.7%(-19.2)#23 | 18.1%(-16.6)#490 |
| 24. | 44319 | 1.5% | 20.7%(-19.2)#24 | 18.1%(-16.6)#511 |
| 25. | 44136 | 1.5% | 20.7%(-19.2)#25 | 18.1%(-16.6)#524 |
| 26. | 44473 | 1.5% | 20.7%(-19.1)#26 | 18.1%(-16.5)#543 |
| 27. | 45871 | 1.5% | 20.7%(-19.1)#27 | 18.1%(-16.5)#555 |
| 28. | 43617 | 1.6% | 20.7%(-19.1)#28 | 18.1%(-16.5)#595 |
| 29. | 44023 | 1.6% | 20.7%(-19.0)#29 | 18.1%(-16.4)#612 |
| 30. | 45723 | 1.7% | 20.7%(-19.0)#30 | 18.1%(-16.4)#631 |
| 31. | 43357 | 1.7% | 20.7%(-18.9)#31 | 18.1%(-16.3)#660 |
| 32. | 45807 | 1.8% | 20.7%(-18.9)#32 | 18.1%(-16.3)#678 |
| 33. | 43064 | 1.8% | 20.7%(-18.9)#33 | 18.1%(-16.3)#684 |
| 34. | 43054 | 1.8% | 20.7%(-18.9)#34 | 18.1%(-16.3)#689 |
| 35. | 44612 | 1.8% | 20.7%(-18.9)#35 | 18.1%(-16.3)#700 |
| 36. | 45302 | 1.8% | 20.7%(-18.8)#36 | 18.1%(-16.2)#721 |
| 37. | 45322 | 1.9% | 20.7%(-18.8)#37 | 18.1%(-16.2)#765 |
| 38. | 43071 | 1.9% | 20.7%(-18.7)#38 | 18.1%(-16.1)#784 |
| 39. | 45039 | 2.0% | 20.7%(-18.7)#39 | 18.1%(-16.1)#809 |
| 40. | 43021 | 2.0% | 20.7%(-18.7)#40 | 18.1%(-16.1)#817 |
| 41. | 45309 | 2.0% | 20.7%(-18.7)#41 | 18.1%(-16.1)#826 |
| 42. | 44021 | 2.0% | 20.7%(-18.7)#42 | 18.1%(-16.1)#839 |
| 43. | 44272 | 2.0% | 20.7%(-18.6)#43 | 18.1%(-16.0)#863 |
| 44. | 45066 | 2.1% | 20.7%(-18.6)#44 | 18.1%(-16.0)#893 |
| 45. | 44849 | 2.1% | 20.7%(-18.5)#45 | 18.1%(-15.9)#918 |
| 46. | 44050 | 2.1% | 20.7%(-18.5)#46 | 18.1%(-15.9)#925 |
| 47. | 45249 | 2.2% | 20.7%(-18.4)#47 | 18.1%(-15.8)#994 |
| 48. | 45369 | 2.3% | 20.7%(-18.4)#48 | 18.1%(-15.8)#1,009 |
| 49. | 45875 | 2.3% | 20.7%(-18.4)#49 | 18.1%(-15.8)#1,039 |
| 50. | 44410 | 2.3% | 20.7%(-18.3)#50 | 18.1%(-15.7)#1,051 |
| 51. | 45040 | 2.4% | 20.7%(-18.3)#51 | 18.1%(-15.7)#1,065 |
| 52. | 44614 | 2.4% | 20.7%(-18.2)#52 | 18.1%(-15.6)#1,112 |
| 53. | 44116 | 2.4% | 20.7%(-18.2)#53 | 18.1%(-15.6)#1,117 |
| 54. | 45845 | 2.5% | 20.7%(-18.2)#54 | 18.1%(-15.6)#1,147 |
| 55. | 45716 | 2.6% | 20.7%(-18.1)#55 | 18.1%(-15.5)#1,202 |
| 56. | 44681 | 2.7% | 20.7%(-18.0)#56 | 18.1%(-15.4)#1,277 |
| 57. | 45233 | 2.7% | 20.7%(-17.9)#57 | 18.1%(-15.3)#1,323 |
| 58. | 43359 | 2.8% | 20.7%(-17.9)#58 | 18.1%(-15.3)#1,355 |
| 59. | 44278 | 2.8% | 20.7%(-17.9)#59 | 18.1%(-15.3)#1,357 |
| 60. | 44139 | 2.8% | 20.7%(-17.9)#60 | 18.1%(-15.3)#1,360 |
| 61. | 45862 | 2.8% | 20.7%(-17.9)#61 | 18.1%(-15.2)#1,380 |
| 62. | 43351 | 2.9% | 20.7%(-17.8)#62 | 18.1%(-15.2)#1,405 |
| 63. | 43221 | 2.9% | 20.7%(-17.8)#63 | 18.1%(-15.1)#1,450 |
| 64. | 44233 | 2.9% | 20.7%(-17.7)#64 | 18.1%(-15.1)#1,457 |
| 65. | 44217 | 2.9% | 20.7%(-17.7)#65 | 18.1%(-15.1)#1,460 |
| 66. | 44022 | 3.0% | 20.7%(-17.7)#66 | 18.1%(-15.1)#1,475 |
| 67. | 45176 | 3.0% | 20.7%(-17.7)#67 | 18.1%(-15.1)#1,486 |
| 68. | 43035 | 3.0% | 20.7%(-17.7)#68 | 18.1%(-15.1)#1,500 |
| 69. | 45775 | 3.0% | 20.7%(-17.6)#69 | 18.1%(-15.0)#1,519 |
| 70. | 45152 | 3.0% | 20.7%(-17.6)#70 | 18.1%(-15.0)#1,531 |
| 71. | 45409 | 3.1% | 20.7%(-17.6)#71 | 18.1%(-15.0)#1,555 |
| 72. | 43212 | 3.2% | 20.7%(-17.5)#72 | 18.1%(-14.9)#1,621 |
| 73. | 45069 | 3.2% | 20.7%(-17.4)#73 | 18.1%(-14.8)#1,667 |
| 74. | 44606 | 3.3% | 20.7%(-17.4)#74 | 18.1%(-14.8)#1,700 |
| 75. | 45067 | 3.3% | 20.7%(-17.4)#75 | 18.1%(-14.8)#1,704 |
| 76. | 45843 | 3.3% | 20.7%(-17.3)#76 | 18.1%(-14.7)#1,720 |
| 77. | 43334 | 3.4% | 20.7%(-17.3)#77 | 18.1%(-14.6)#1,772 |
| 78. | 44001 | 3.4% | 20.7%(-17.2)#78 | 18.1%(-14.6)#1,788 |
| 79. | 44847 | 3.5% | 20.7%(-17.2)#79 | 18.1%(-14.6)#1,813 |
| 80. | 44413 | 3.5% | 20.7%(-17.1)#80 | 18.1%(-14.5)#1,834 |
| 81. | 44423 | 3.5% | 20.7%(-17.1)#81 | 18.1%(-14.5)#1,846 |
| 82. | 45213 | 3.6% | 20.7%(-17.0)#82 | 18.1%(-14.4)#1,914 |
| 83. | 45159 | 3.7% | 20.7%(-17.0)#83 | 18.1%(-14.4)#1,925 |
| 84. | 43082 | 3.8% | 20.7%(-16.9)#84 | 18.1%(-14.3)#2,008 |
| 85. | 43780 | 3.8% | 20.7%(-16.9)#85 | 18.1%(-14.3)#2,030 |
| 86. | 44124 | 3.8% | 20.7%(-16.8)#86 | 18.1%(-14.2)#2,035 |
| 87. | 43025 | 3.9% | 20.7%(-16.8)#87 | 18.1%(-14.2)#2,073 |
| 88. | 45248 | 3.9% | 20.7%(-16.7)#88 | 18.1%(-14.1)#2,102 |
| 89. | 43316 | 3.9% | 20.7%(-16.7)#89 | 18.1%(-14.1)#2,104 |
| 90. | 43516 | 4.0% | 20.7%(-16.7)#90 | 18.1%(-14.1)#2,169 |
| 91. | 45894 | 4.0% | 20.7%(-16.7)#91 | 18.1%(-14.1)#2,180 |
| 92. | 43110 | 4.0% | 20.7%(-16.7)#92 | 18.1%(-14.0)#2,189 |
| 93. | 45710 | 4.1% | 20.7%(-16.6)#93 | 18.1%(-14.0)#2,217 |
| 94. | 44818 | 4.1% | 20.7%(-16.6)#94 | 18.1%(-14.0)#2,226 |
| 95. | 44842 | 4.1% | 20.7%(-16.6)#95 | 18.1%(-14.0)#2,236 |
| 96. | 45363 | 4.1% | 20.7%(-16.5)#96 | 18.1%(-13.9)#2,284 |
| 97. | 44514 | 4.1% | 20.7%(-16.5)#97 | 18.1%(-13.9)#2,286 |
| 98. | 43230 | 4.2% | 20.7%(-16.5)#98 | 18.1%(-13.9)#2,321 |
| 99. | 44875 | 4.2% | 20.7%(-16.4)#99 | 18.1%(-13.8)#2,366 |
| 100. | 44887 | 4.3% | 20.7%(-16.3)#100 | 18.1%(-13.7)#2,445 |
Common Questions
What are the Top 10 Zip Codes with the Lowest Poverty Level Among Children Under the Age of 5 in Ohio?
Top 10 Zip Codes with the Lowest Poverty Level Among Children Under the Age of 5 in Ohio are:
What zip code has the Lowest Poverty Level Among Children Under the Age of 5 in Ohio?
44633 has the Lowest Poverty Level Among Children Under the Age of 5 in Ohio with 0.33%.
What is the Poverty Level Among Children Under the Age of 5 in the State of Ohio?
Poverty Level Among Children Under the Age of 5 in Ohio is 20.7%.
What is the Poverty Level Among Children Under the Age of 5 in the United States?
Poverty Level Among Children Under the Age of 5 in the United States is 18.1%.