Bridgetown, OH Map & Demographics
Bridgetown Map
Bridgetown Overview
$37,482
PER CAPITA INCOME
$85,521
AVG FAMILY INCOME
$76,270
AVG HOUSEHOLD INCOME
23.3%
WAGE / INCOME GAP [ % ]
76.7¢/ $1
WAGE / INCOME GAP [ $ ]
0.37
INEQUALITY / GINI INDEX
13,526
TOTAL POPULATION
6,748
MALE POPULATION
6,778
FEMALE POPULATION
99.56
MALES / 100 FEMALES
100.44
FEMALES / 100 MALES
36.9
MEDIAN AGE
3.1
AVG FAMILY SIZE
2.5
AVG HOUSEHOLD SIZE
7,146
LABOR FORCE [ PEOPLE ]
67.6%
PERCENT IN LABOR FORCE
3.1%
UNEMPLOYMENT RATE
Income in Bridgetown
Income Overview in Bridgetown
Per Capita Income in Bridgetown is $37,482, while median incomes of families and households are $85,521 and $76,270 respectively.
| Characteristic | Number | Measure |
| Per Capita Income | 13,526 | $37,482 |
| Median Family Income | 3,395 | $85,521 |
| Mean Family Income | 3,395 | $100,157 |
| Median Household Income | 5,450 | $76,270 |
| Mean Household Income | 5,450 | $93,050 |
| Income Deficit | 3,395 | $0 |
| Wage / Income Gap (%) | 13,526 | 23.28% |
| Wage / Income Gap ($) | 13,526 | 76.72¢ per $1 |
| Gini / Inequality Index | 13,526 | 0.37 |
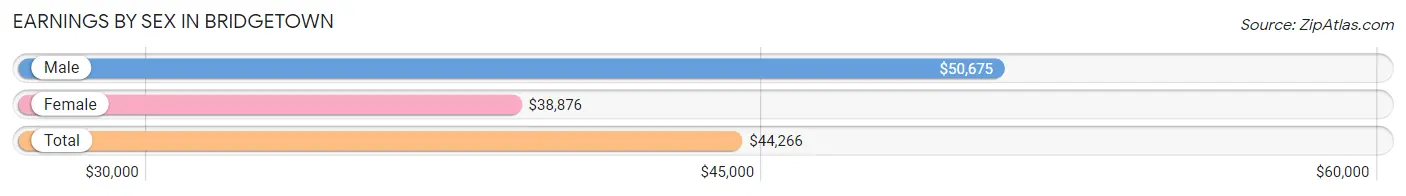
Earnings by Sex in Bridgetown
Average Earnings in Bridgetown are $44,266, $50,675 for men and $38,876 for women, a difference of 23.3%.
| Sex | Number | Average Earnings |
| Male | 3,978 (53.7%) | $50,675 |
| Female | 3,431 (46.3%) | $38,876 |
| Total | 7,409 (100.0%) | $44,266 |
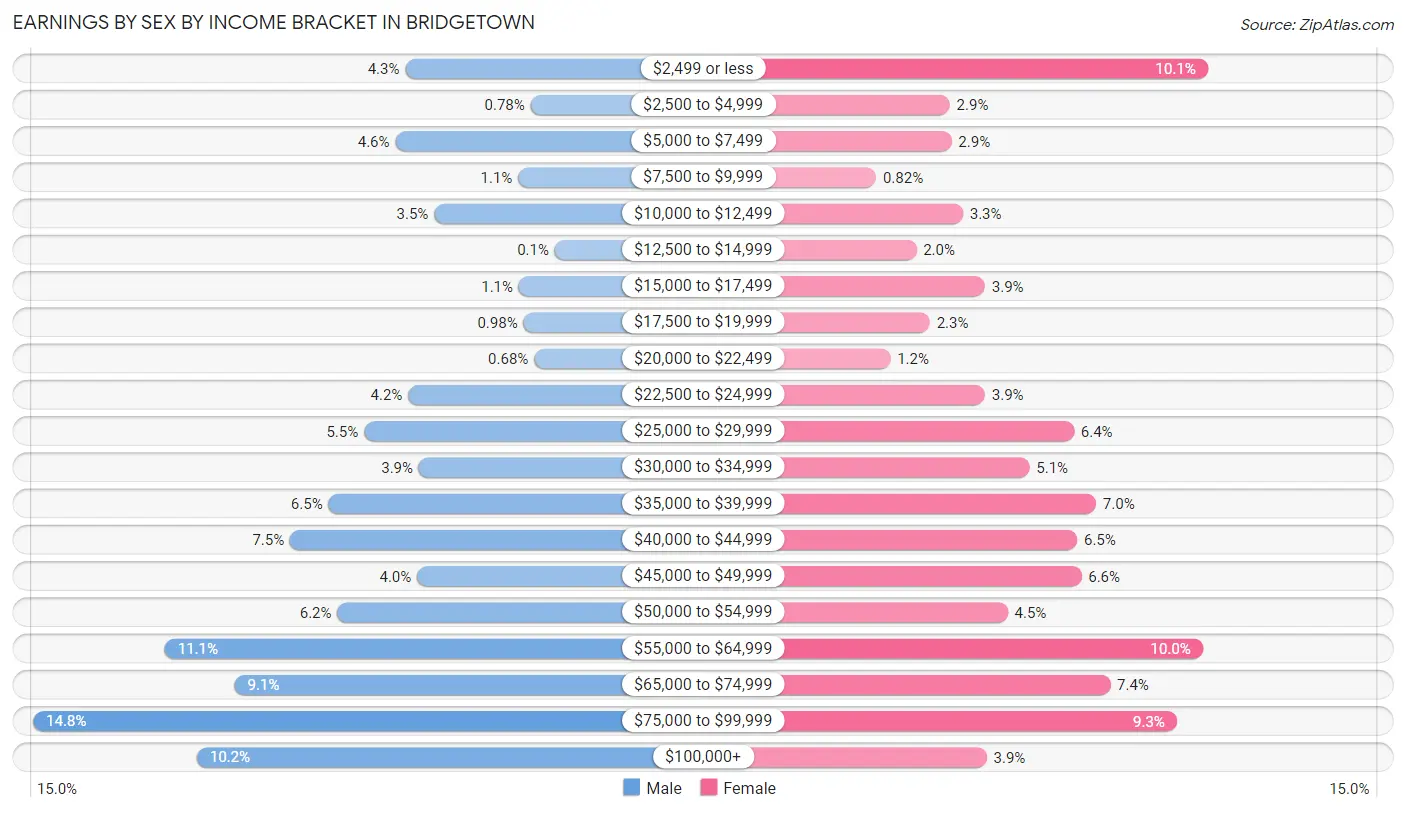
Earnings by Sex by Income Bracket in Bridgetown
The most common earnings brackets in Bridgetown are $75,000 to $99,999 for men (587 | 14.8%) and $2,499 or less for women (348 | 10.1%).
| Income | Male | Female |
| $2,499 or less | 171 (4.3%) | 348 (10.1%) |
| $2,500 to $4,999 | 31 (0.8%) | 99 (2.9%) |
| $5,000 to $7,499 | 182 (4.6%) | 101 (2.9%) |
| $7,500 to $9,999 | 45 (1.1%) | 28 (0.8%) |
| $10,000 to $12,499 | 139 (3.5%) | 112 (3.3%) |
| $12,500 to $14,999 | 4 (0.1%) | 67 (1.9%) |
| $15,000 to $17,499 | 44 (1.1%) | 133 (3.9%) |
| $17,500 to $19,999 | 39 (1.0%) | 80 (2.3%) |
| $20,000 to $22,499 | 27 (0.7%) | 42 (1.2%) |
| $22,500 to $24,999 | 168 (4.2%) | 133 (3.9%) |
| $25,000 to $29,999 | 217 (5.5%) | 219 (6.4%) |
| $30,000 to $34,999 | 156 (3.9%) | 176 (5.1%) |
| $35,000 to $39,999 | 257 (6.5%) | 240 (7.0%) |
| $40,000 to $44,999 | 300 (7.5%) | 222 (6.5%) |
| $45,000 to $49,999 | 158 (4.0%) | 226 (6.6%) |
| $50,000 to $54,999 | 247 (6.2%) | 155 (4.5%) |
| $55,000 to $64,999 | 440 (11.1%) | 343 (10.0%) |
| $65,000 to $74,999 | 362 (9.1%) | 254 (7.4%) |
| $75,000 to $99,999 | 587 (14.8%) | 318 (9.3%) |
| $100,000+ | 404 (10.2%) | 135 (3.9%) |
| Total | 3,978 (100.0%) | 3,431 (100.0%) |
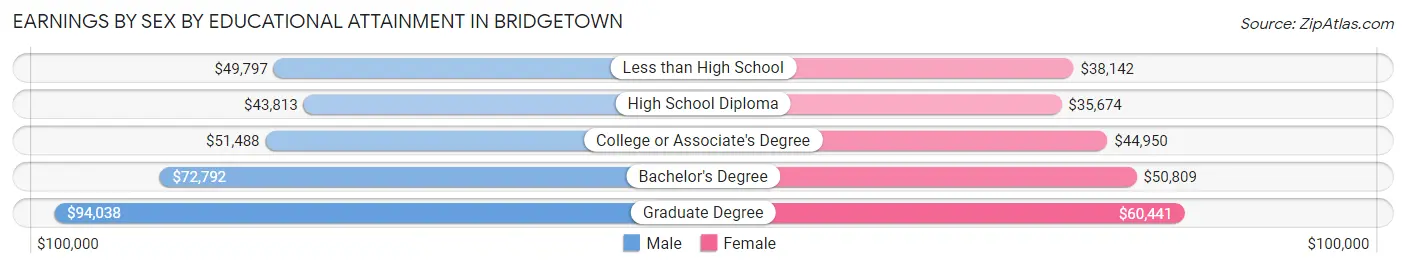
Earnings by Sex by Educational Attainment in Bridgetown
Average earnings in Bridgetown are $55,121 for men and $43,159 for women, a difference of 21.7%. Men with an educational attainment of graduate degree enjoy the highest average annual earnings of $94,038, while those with high school diploma education earn the least with $43,813. Women with an educational attainment of graduate degree earn the most with the average annual earnings of $60,441, while those with high school diploma education have the smallest earnings of $35,674.
| Educational Attainment | Male Income | Female Income |
| Less than High School | $49,797 | $38,142 |
| High School Diploma | $43,813 | $35,674 |
| College or Associate's Degree | $51,488 | $44,950 |
| Bachelor's Degree | $72,792 | $50,809 |
| Graduate Degree | $94,038 | $60,441 |
| Total | $55,121 | $43,159 |
Family Income in Bridgetown
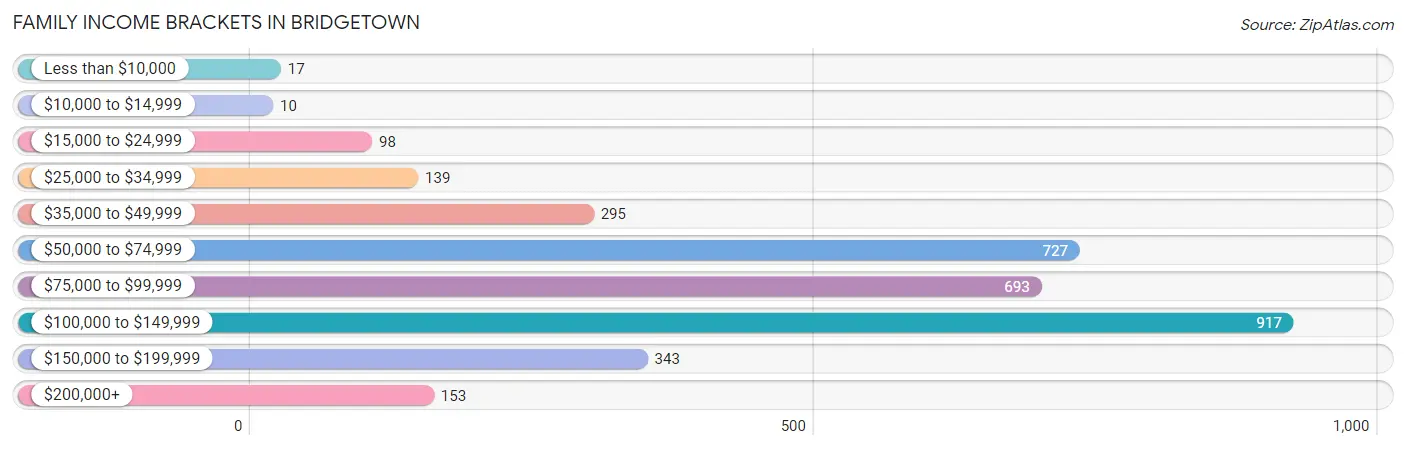
Family Income Brackets in Bridgetown
According to the Bridgetown family income data, there are 917 families falling into the $100,000 to $149,999 income range, which is the most common income bracket and makes up 27.0% of all families. Conversely, the $10,000 to $14,999 income bracket is the least frequent group with only 10 families (0.3%) belonging to this category.
| Income Bracket | # Families | % Families |
| Less than $10,000 | 17 | 0.5% |
| $10,000 to $14,999 | 10 | 0.3% |
| $15,000 to $24,999 | 98 | 2.9% |
| $25,000 to $34,999 | 139 | 4.1% |
| $35,000 to $49,999 | 295 | 8.7% |
| $50,000 to $74,999 | 727 | 21.4% |
| $75,000 to $99,999 | 693 | 20.4% |
| $100,000 to $149,999 | 917 | 27.0% |
| $150,000 to $199,999 | 343 | 10.1% |
| $200,000+ | 153 | 4.5% |
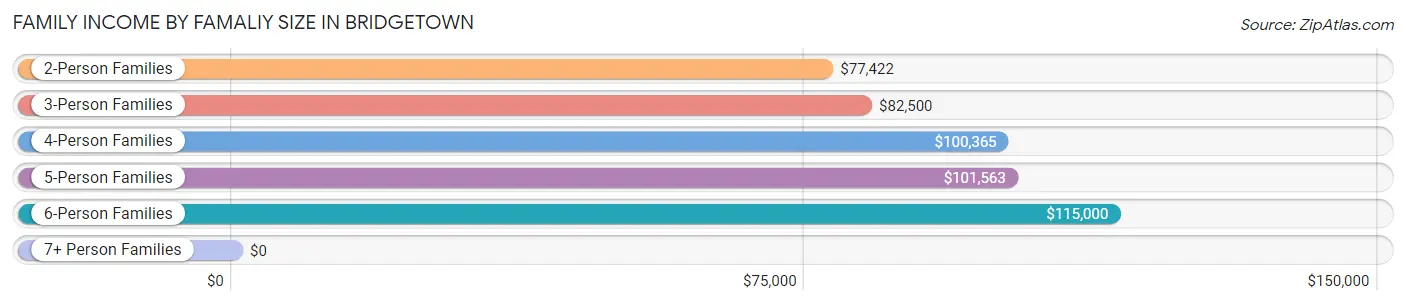
Family Income by Famaliy Size in Bridgetown
6-person families (92 | 2.7%) account for the highest median family income in Bridgetown with $115,000 per family, while 2-person families (1,591 | 46.9%) have the highest median income of $38,711 per family member.
| Income Bracket | # Families | Median Income |
| 2-Person Families | 1,591 (46.9%) | $77,422 |
| 3-Person Families | 588 (17.3%) | $82,500 |
| 4-Person Families | 728 (21.4%) | $100,365 |
| 5-Person Families | 352 (10.4%) | $101,563 |
| 6-Person Families | 92 (2.7%) | $115,000 |
| 7+ Person Families | 44 (1.3%) | $0 |
| Total | 3,395 (100.0%) | $85,521 |
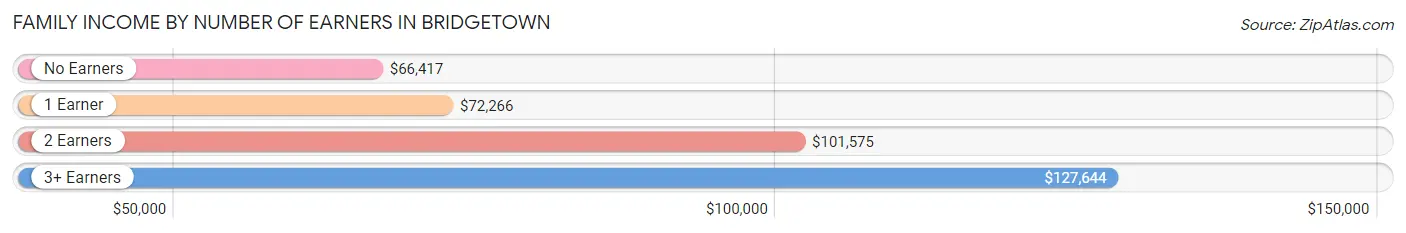
Family Income by Number of Earners in Bridgetown
The median family income in Bridgetown is $85,521, with families comprising 3+ earners (471) having the highest median family income of $127,644, while families with no earners (391) have the lowest median family income of $66,417, accounting for 13.9% and 11.5% of families, respectively.
| Number of Earners | # Families | Median Income |
| No Earners | 391 (11.5%) | $66,417 |
| 1 Earner | 1,115 (32.8%) | $72,266 |
| 2 Earners | 1,418 (41.8%) | $101,575 |
| 3+ Earners | 471 (13.9%) | $127,644 |
| Total | 3,395 (100.0%) | $85,521 |
Household Income in Bridgetown
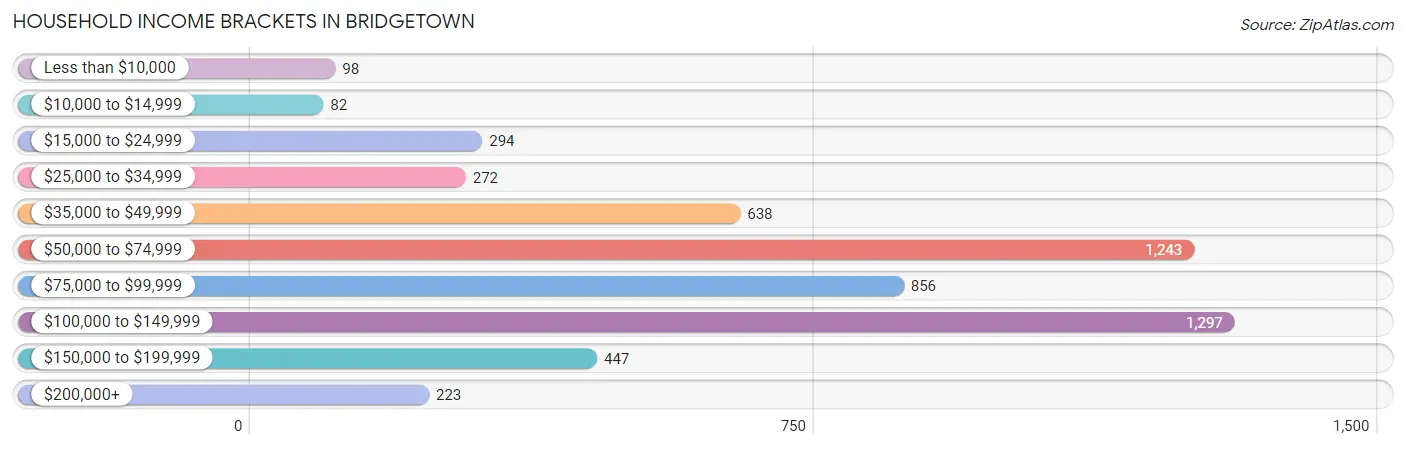
Household Income Brackets in Bridgetown
With 1,297 households falling in the category, the $100,000 to $149,999 income range is the most frequent in Bridgetown, accounting for 23.8% of all households. In contrast, only 82 households (1.5%) fall into the $10,000 to $14,999 income bracket, making it the least populous group.
| Income Bracket | # Households | % Households |
| Less than $10,000 | 98 | 1.8% |
| $10,000 to $14,999 | 82 | 1.5% |
| $15,000 to $24,999 | 294 | 5.4% |
| $25,000 to $34,999 | 272 | 5.0% |
| $35,000 to $49,999 | 638 | 11.7% |
| $50,000 to $74,999 | 1,243 | 22.8% |
| $75,000 to $99,999 | 856 | 15.7% |
| $100,000 to $149,999 | 1,297 | 23.8% |
| $150,000 to $199,999 | 447 | 8.2% |
| $200,000+ | 223 | 4.1% |
Household Income by Householder Age in Bridgetown
The median household income in Bridgetown is $76,270, with the highest median household income of $94,577 found in the 25 to 44 years age bracket for the primary householder. A total of 1,676 households (30.7%) fall into this category. Meanwhile, the 65+ years age bracket for the primary householder has the lowest median household income of $53,866, with 1,719 households (31.5%) in this group.
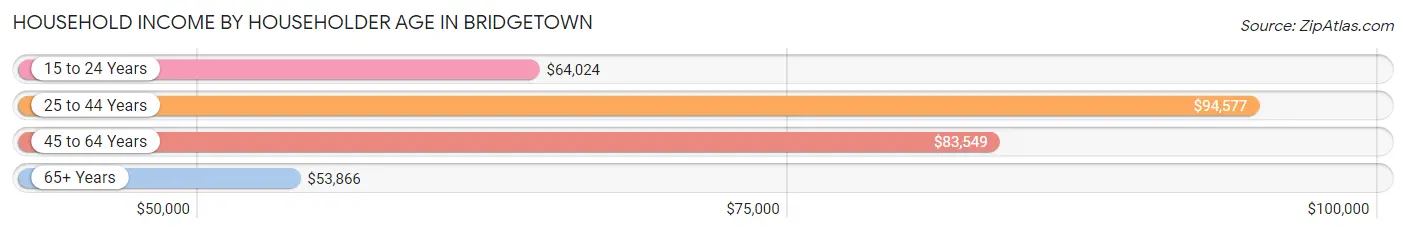
| Income Bracket | # Households | Median Income |
| 15 to 24 Years | 138 (2.5%) | $64,024 |
| 25 to 44 Years | 1,676 (30.7%) | $94,577 |
| 45 to 64 Years | 1,917 (35.2%) | $83,549 |
| 65+ Years | 1,719 (31.5%) | $53,866 |
| Total | 5,450 (100.0%) | $76,270 |
Poverty in Bridgetown
Income Below Poverty by Sex and Age in Bridgetown
With 4.9% poverty level for males and 6.1% for females among the residents of Bridgetown, 18 to 24 year old males and 75 year old and over females are the most vulnerable to poverty, with 62 males (14.2%) and 72 females (14.1%) in their respective age groups living below the poverty level.
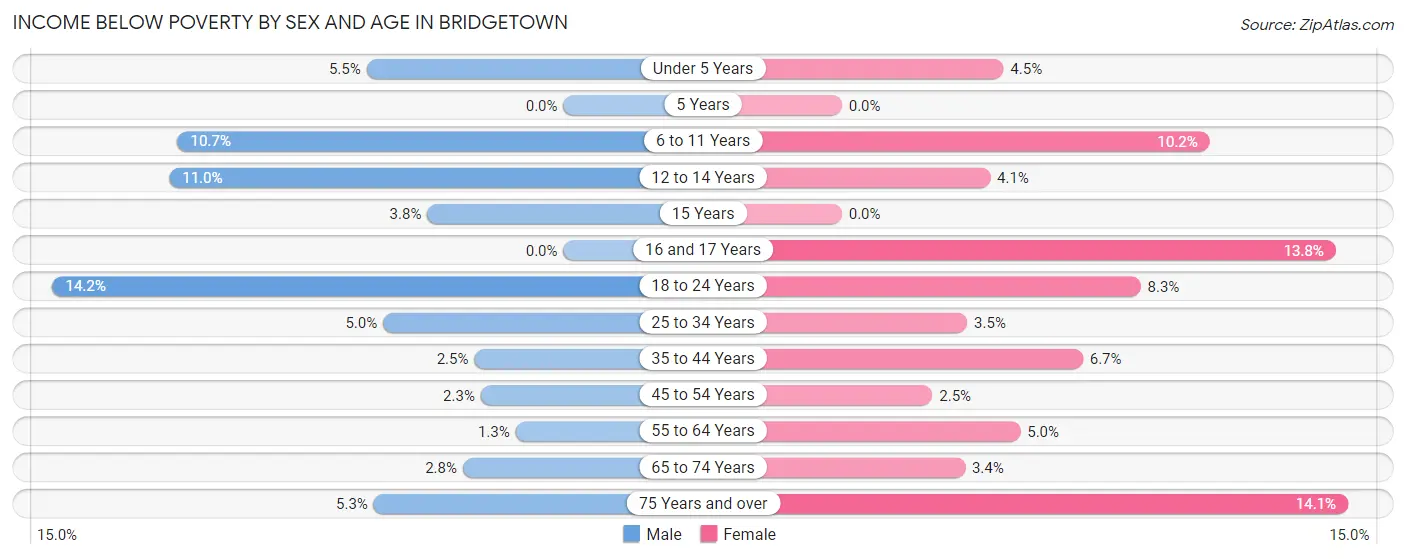
| Age Bracket | Male | Female |
| Under 5 Years | 23 (5.5%) | 14 (4.5%) |
| 5 Years | 0 (0.0%) | 0 (0.0%) |
| 6 to 11 Years | 52 (10.7%) | 68 (10.2%) |
| 12 to 14 Years | 43 (11.0%) | 14 (4.1%) |
| 15 Years | 5 (3.8%) | 0 (0.0%) |
| 16 and 17 Years | 0 (0.0%) | 22 (13.8%) |
| 18 to 24 Years | 62 (14.2%) | 42 (8.3%) |
| 25 to 34 Years | 50 (5.0%) | 32 (3.5%) |
| 35 to 44 Years | 21 (2.5%) | 57 (6.7%) |
| 45 to 54 Years | 22 (2.3%) | 17 (2.5%) |
| 55 to 64 Years | 9 (1.3%) | 43 (5.0%) |
| 65 to 74 Years | 20 (2.8%) | 29 (3.4%) |
| 75 Years and over | 18 (5.3%) | 72 (14.1%) |
| Total | 325 (4.9%) | 410 (6.1%) |
Income Above Poverty by Sex and Age in Bridgetown
According to the poverty statistics in Bridgetown, males aged 5 years and females aged 5 years are the age groups that are most secure financially, with 100.0% of males and 100.0% of females in these age groups living above the poverty line.
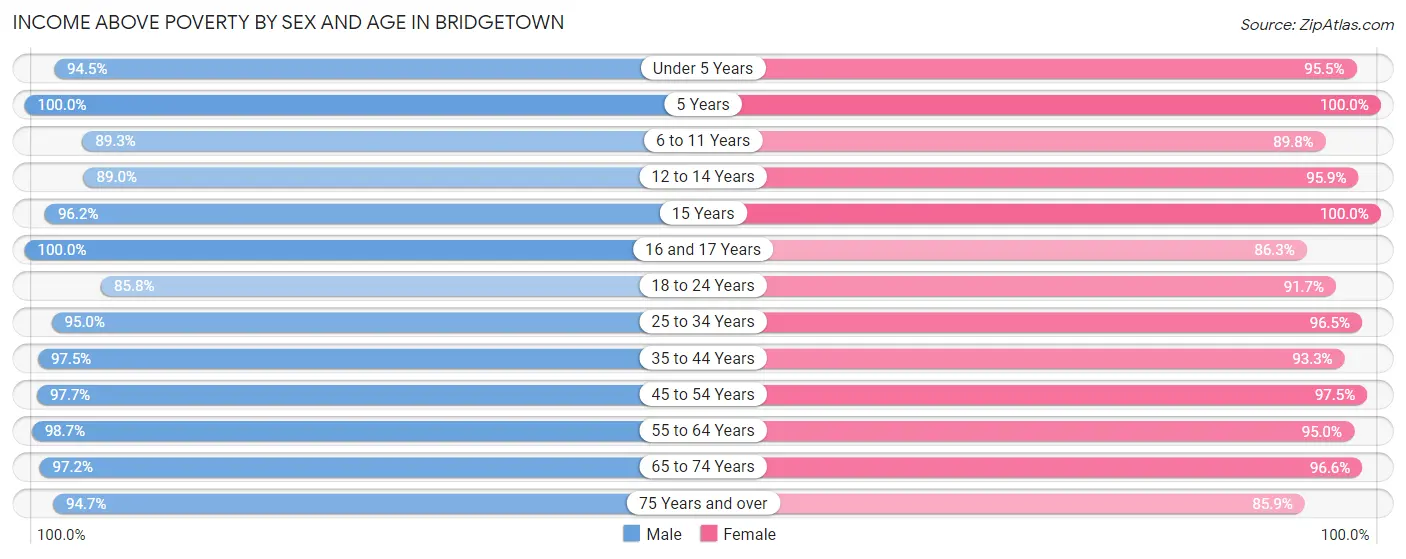
| Age Bracket | Male | Female |
| Under 5 Years | 397 (94.5%) | 297 (95.5%) |
| 5 Years | 18 (100.0%) | 51 (100.0%) |
| 6 to 11 Years | 432 (89.3%) | 596 (89.8%) |
| 12 to 14 Years | 349 (89.0%) | 325 (95.9%) |
| 15 Years | 127 (96.2%) | 64 (100.0%) |
| 16 and 17 Years | 273 (100.0%) | 138 (86.3%) |
| 18 to 24 Years | 374 (85.8%) | 463 (91.7%) |
| 25 to 34 Years | 947 (95.0%) | 886 (96.5%) |
| 35 to 44 Years | 827 (97.5%) | 792 (93.3%) |
| 45 to 54 Years | 935 (97.7%) | 657 (97.5%) |
| 55 to 64 Years | 666 (98.7%) | 823 (95.0%) |
| 65 to 74 Years | 695 (97.2%) | 817 (96.6%) |
| 75 Years and over | 323 (94.7%) | 439 (85.9%) |
| Total | 6,363 (95.1%) | 6,348 (93.9%) |
Income Below Poverty Among Married-Couple Families in Bridgetown
The poverty statistics for married-couple families in Bridgetown show that 2.4% or 59 of the total 2,492 families live below the poverty line. Families with 3 or 4 children have the highest poverty rate of 7.4%, comprising of 21 families. On the other hand, families with 5 or more children have the lowest poverty rate of 0.0%, which includes 0 families.
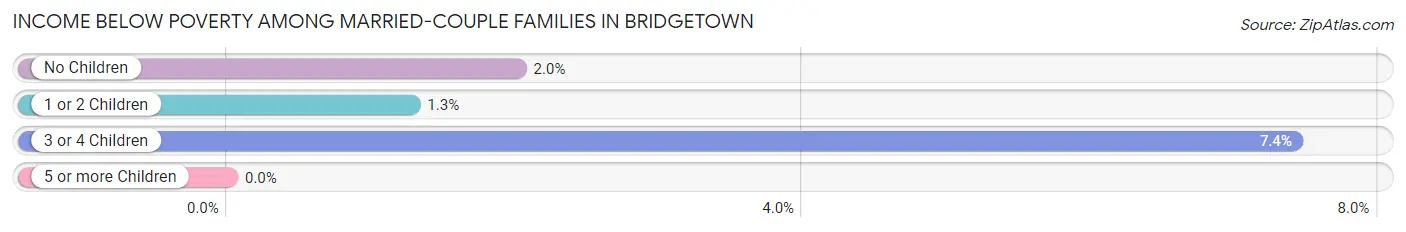
| Children | Above Poverty | Below Poverty |
| No Children | 1,368 (98.0%) | 28 (2.0%) |
| 1 or 2 Children | 780 (98.7%) | 10 (1.3%) |
| 3 or 4 Children | 262 (92.6%) | 21 (7.4%) |
| 5 or more Children | 23 (100.0%) | 0 (0.0%) |
| Total | 2,433 (97.6%) | 59 (2.4%) |
Income Below Poverty Among Single-Parent Households in Bridgetown
According to the poverty data in Bridgetown, 7.1% or 23 single-father households and 5.2% or 30 single-mother households are living below the poverty line. Among single-father households, those with 3 or 4 children have the highest poverty rate, with 23 households (67.6%) experiencing poverty. Likewise, among single-mother households, those with 1 or 2 children have the highest poverty rate, with 27 households (7.9%) falling below the poverty line.
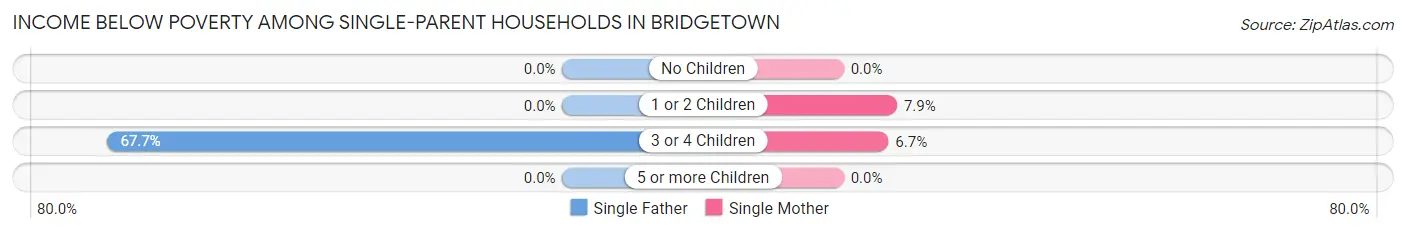
| Children | Single Father | Single Mother |
| No Children | 0 (0.0%) | 0 (0.0%) |
| 1 or 2 Children | 0 (0.0%) | 27 (7.9%) |
| 3 or 4 Children | 23 (67.6%) | 3 (6.7%) |
| 5 or more Children | 0 (0.0%) | 0 (0.0%) |
| Total | 23 (7.1%) | 30 (5.2%) |
Income Below Poverty Among Married-Couple vs Single-Parent Households in Bridgetown
The poverty data for Bridgetown shows that 59 of the married-couple family households (2.4%) and 53 of the single-parent households (5.9%) are living below the poverty level. Within the married-couple family households, those with 3 or 4 children have the highest poverty rate, with 21 households (7.4%) falling below the poverty line. Among the single-parent households, those with 3 or 4 children have the highest poverty rate, with 26 household (32.9%) living below poverty.
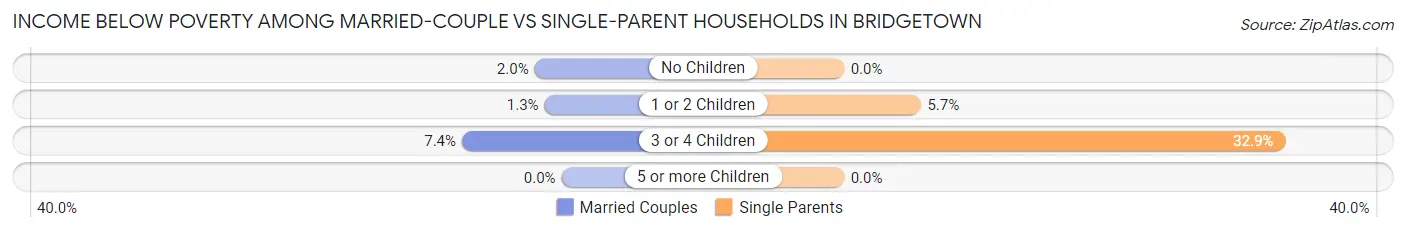
| Children | Married-Couple Families | Single-Parent Households |
| No Children | 28 (2.0%) | 0 (0.0%) |
| 1 or 2 Children | 10 (1.3%) | 27 (5.7%) |
| 3 or 4 Children | 21 (7.4%) | 26 (32.9%) |
| 5 or more Children | 0 (0.0%) | 0 (0.0%) |
| Total | 59 (2.4%) | 53 (5.9%) |
Race in Bridgetown
The most populous races in Bridgetown are White / Caucasian (12,661 | 93.6%), Two or more Races (512 | 3.8%), and Black / African American (223 | 1.7%).
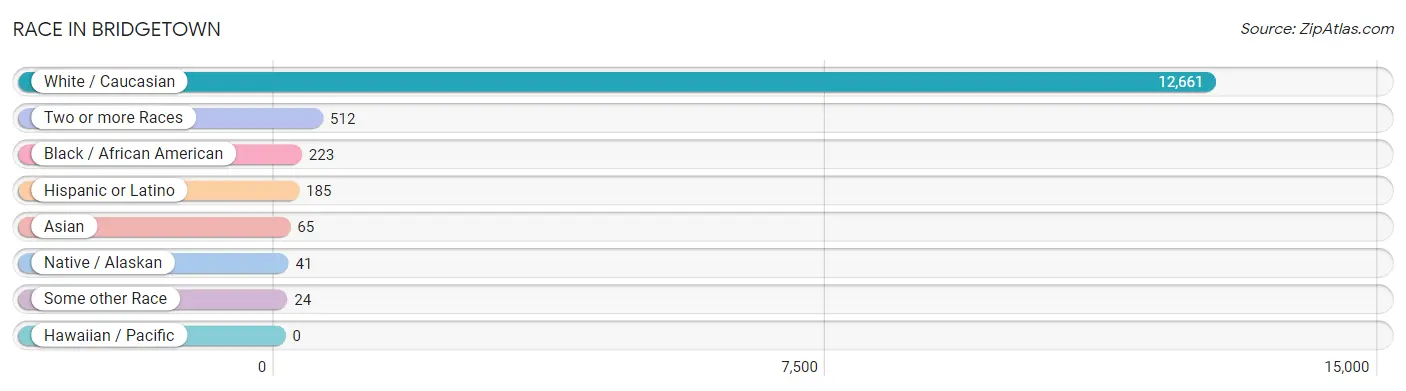
| Race | # Population | % Population |
| Asian | 65 | 0.5% |
| Black / African American | 223 | 1.7% |
| Hawaiian / Pacific | 0 | 0.0% |
| Hispanic or Latino | 185 | 1.4% |
| Native / Alaskan | 41 | 0.3% |
| White / Caucasian | 12,661 | 93.6% |
| Two or more Races | 512 | 3.8% |
| Some other Race | 24 | 0.2% |
| Total | 13,526 | 100.0% |
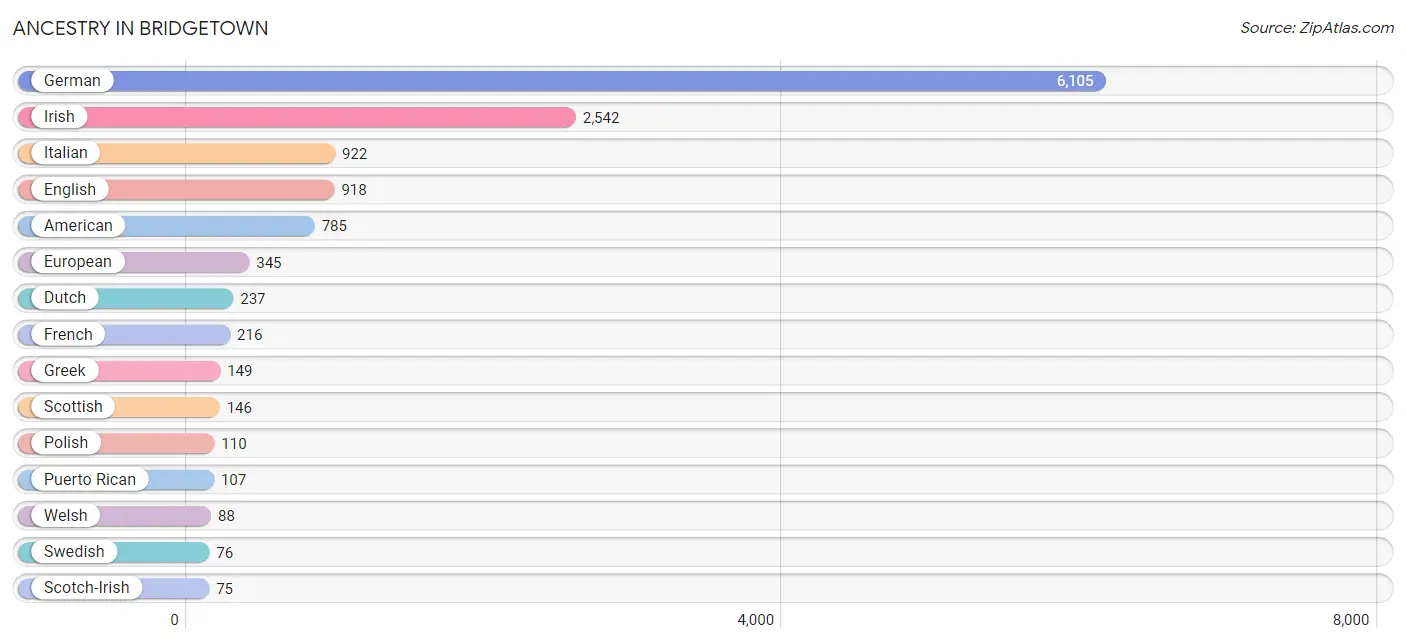
Ancestry in Bridgetown
The most populous ancestries reported in Bridgetown are German (6,105 | 45.1%), Irish (2,542 | 18.8%), Italian (922 | 6.8%), English (918 | 6.8%), and American (785 | 5.8%), together accounting for 83.3% of all Bridgetown residents.
| Ancestry | # Population | % Population |
| American | 785 | 5.8% |
| Arab | 34 | 0.3% |
| Austrian | 11 | 0.1% |
| Belgian | 15 | 0.1% |
| British | 57 | 0.4% |
| Canadian | 10 | 0.1% |
| Cherokee | 63 | 0.5% |
| Cheyenne | 1 | 0.0% |
| Colombian | 24 | 0.2% |
| Czech | 5 | 0.0% |
| Dominican | 5 | 0.0% |
| Dutch | 237 | 1.8% |
| Eastern European | 45 | 0.3% |
| English | 918 | 6.8% |
| European | 345 | 2.5% |
| Finnish | 29 | 0.2% |
| French | 216 | 1.6% |
| French Canadian | 16 | 0.1% |
| German | 6,105 | 45.1% |
| Greek | 149 | 1.1% |
| Hungarian | 63 | 0.5% |
| Icelander | 9 | 0.1% |
| Indian (Asian) | 43 | 0.3% |
| Irish | 2,542 | 18.8% |
| Italian | 922 | 6.8% |
| Japanese | 34 | 0.3% |
| Korean | 30 | 0.2% |
| Lebanese | 16 | 0.1% |
| Macedonian | 68 | 0.5% |
| Mexican | 49 | 0.4% |
| Norwegian | 71 | 0.5% |
| Palestinian | 6 | 0.0% |
| Polish | 110 | 0.8% |
| Portuguese | 30 | 0.2% |
| Puerto Rican | 107 | 0.8% |
| Romanian | 6 | 0.0% |
| Russian | 43 | 0.3% |
| Scandinavian | 49 | 0.4% |
| Scotch-Irish | 75 | 0.5% |
| Scottish | 146 | 1.1% |
| Serbian | 18 | 0.1% |
| Slovak | 13 | 0.1% |
| South American | 24 | 0.2% |
| Sri Lankan | 21 | 0.2% |
| Swedish | 76 | 0.6% |
| Swiss | 28 | 0.2% |
| Syrian | 6 | 0.0% |
| Thai | 12 | 0.1% |
| Welsh | 88 | 0.6% |
| West Indian | 15 | 0.1% |
| Yugoslavian | 13 | 0.1% | View All 51 Rows |
Immigrants in Bridgetown
The most numerous immigrant groups reported in Bridgetown came from Europe (103 | 0.8%), Asia (61 | 0.4%), South Eastern Asia (55 | 0.4%), Eastern Europe (53 | 0.4%), and Cambodia (34 | 0.3%), together accounting for 2.3% of all Bridgetown residents.
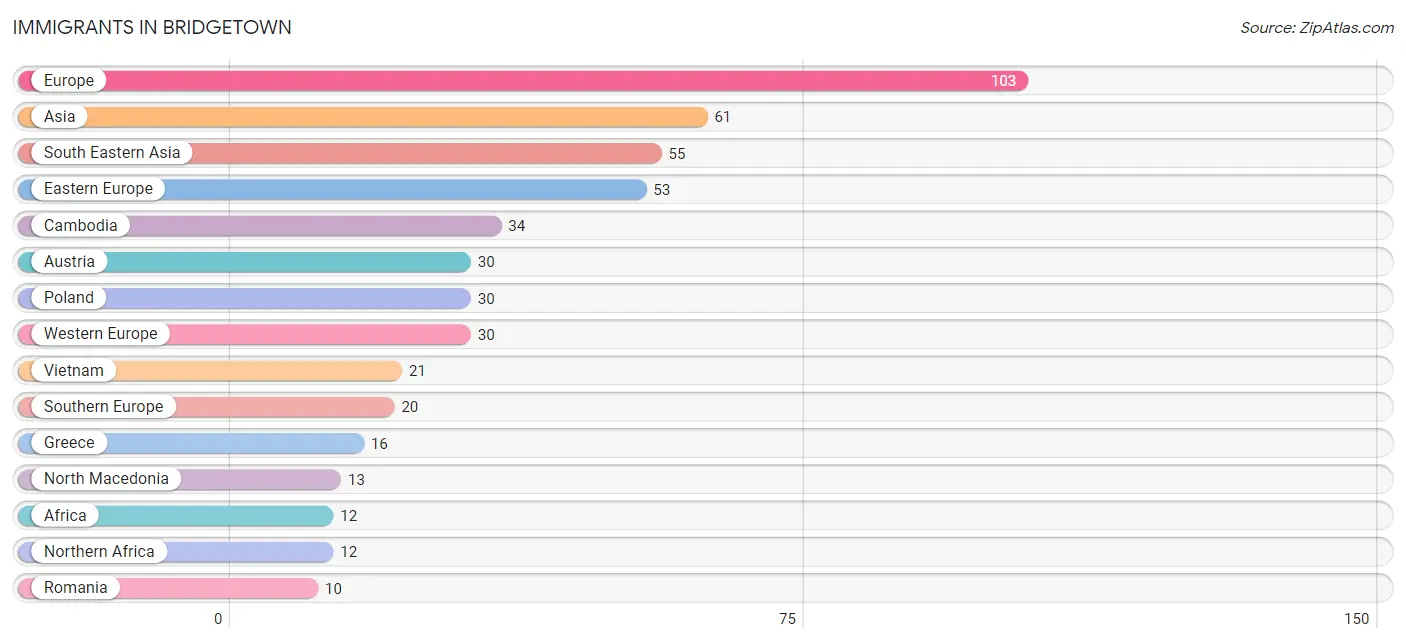
| Immigration Origin | # Population | % Population |
| Africa | 12 | 0.1% |
| Asia | 61 | 0.4% |
| Austria | 30 | 0.2% |
| Cambodia | 34 | 0.3% |
| Eastern Europe | 53 | 0.4% |
| Europe | 103 | 0.8% |
| Greece | 16 | 0.1% |
| Morocco | 6 | 0.0% |
| North Macedonia | 13 | 0.1% |
| Northern Africa | 12 | 0.1% |
| Poland | 30 | 0.2% |
| Romania | 10 | 0.1% |
| South Eastern Asia | 55 | 0.4% |
| Southern Europe | 20 | 0.2% |
| Spain | 4 | 0.0% |
| Sudan | 6 | 0.0% |
| Vietnam | 21 | 0.2% |
| Western Europe | 30 | 0.2% | View All 18 Rows |
Sex and Age in Bridgetown
Sex and Age in Bridgetown
The most populous age groups in Bridgetown are 15 to 19 Years (568 | 8.4%) for men and 10 to 14 Years (574 | 8.5%) for women.
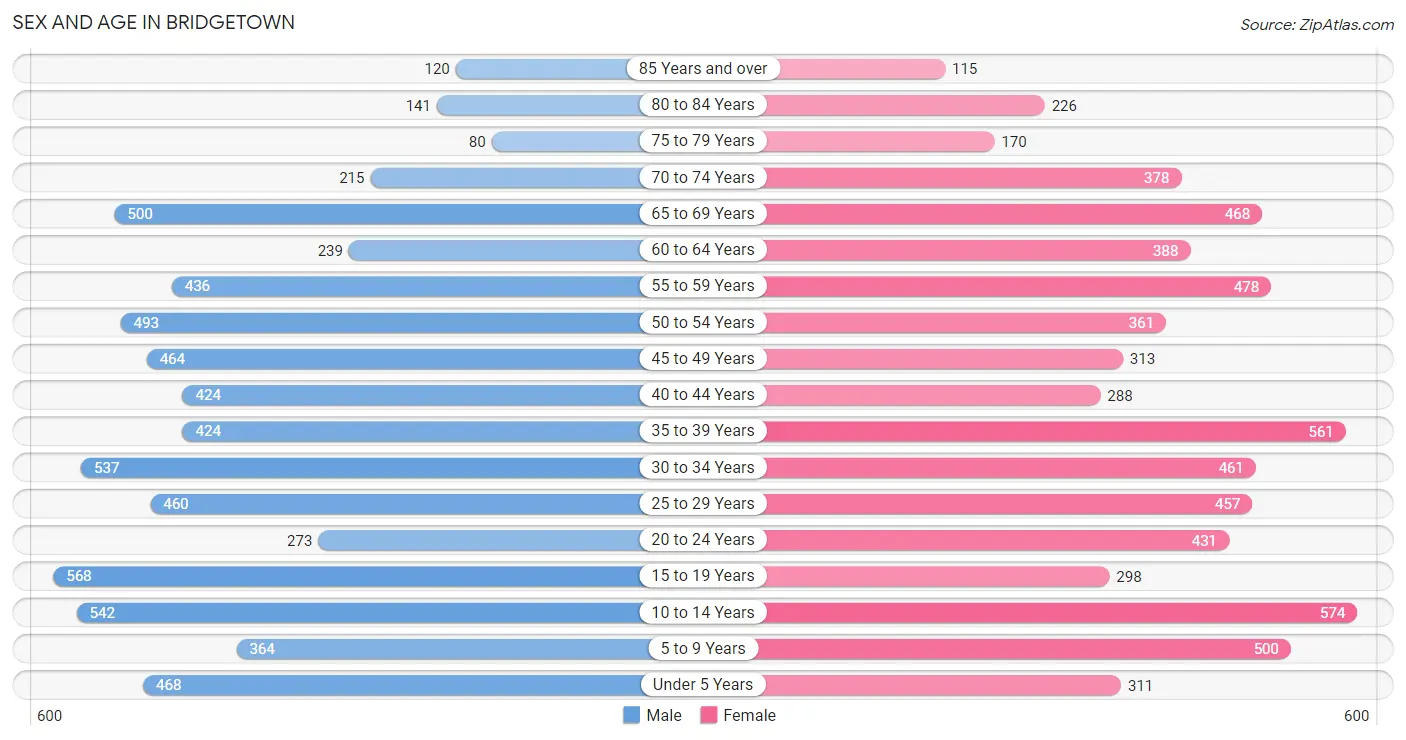
| Age Bracket | Male | Female |
| Under 5 Years | 468 (6.9%) | 311 (4.6%) |
| 5 to 9 Years | 364 (5.4%) | 500 (7.4%) |
| 10 to 14 Years | 542 (8.0%) | 574 (8.5%) |
| 15 to 19 Years | 568 (8.4%) | 298 (4.4%) |
| 20 to 24 Years | 273 (4.1%) | 431 (6.4%) |
| 25 to 29 Years | 460 (6.8%) | 457 (6.7%) |
| 30 to 34 Years | 537 (8.0%) | 461 (6.8%) |
| 35 to 39 Years | 424 (6.3%) | 561 (8.3%) |
| 40 to 44 Years | 424 (6.3%) | 288 (4.3%) |
| 45 to 49 Years | 464 (6.9%) | 313 (4.6%) |
| 50 to 54 Years | 493 (7.3%) | 361 (5.3%) |
| 55 to 59 Years | 436 (6.5%) | 478 (7.0%) |
| 60 to 64 Years | 239 (3.5%) | 388 (5.7%) |
| 65 to 69 Years | 500 (7.4%) | 468 (6.9%) |
| 70 to 74 Years | 215 (3.2%) | 378 (5.6%) |
| 75 to 79 Years | 80 (1.2%) | 170 (2.5%) |
| 80 to 84 Years | 141 (2.1%) | 226 (3.3%) |
| 85 Years and over | 120 (1.8%) | 115 (1.7%) |
| Total | 6,748 (100.0%) | 6,778 (100.0%) |
Families and Households in Bridgetown
Median Family Size in Bridgetown
The median family size in Bridgetown is 3.13 persons per family, with married-couple families (2,492 | 73.4%) accounting for the largest median family size of 3.31 persons per family. On the other hand, single male/father families (323 | 9.5%) represent the smallest median family size with 2.49 persons per family.
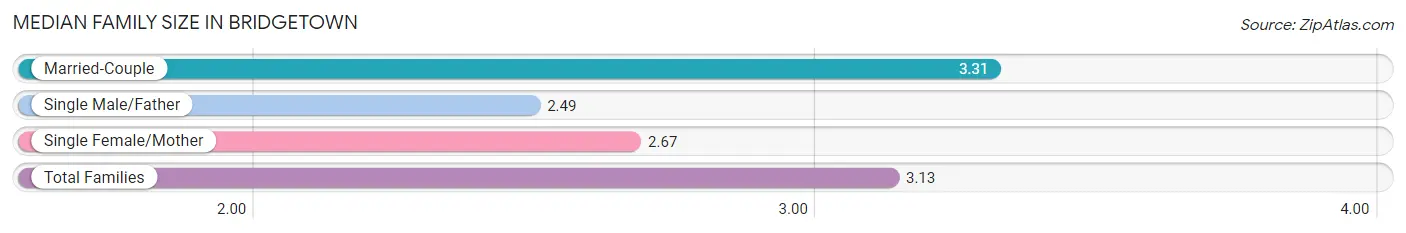
| Family Type | # Families | Family Size |
| Married-Couple | 2,492 (73.4%) | 3.31 |
| Single Male/Father | 323 (9.5%) | 2.49 |
| Single Female/Mother | 580 (17.1%) | 2.67 |
| Total Families | 3,395 (100.0%) | 3.13 |
Median Household Size in Bridgetown
The median household size in Bridgetown is 2.48 persons per household, with married-couple households (2,492 | 45.7%) accounting for the largest median household size of 3.35 persons per household. non-family households (2,055 | 37.7%) represent the smallest median household size with 1.23 persons per household.
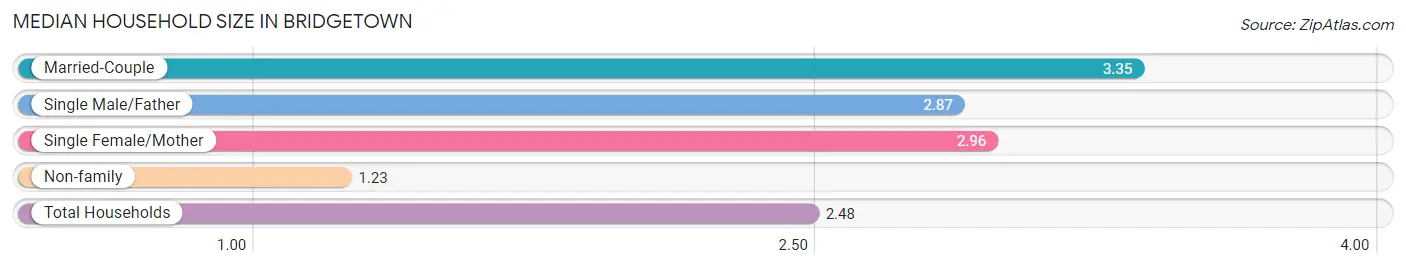
| Household Type | # Households | Household Size |
| Married-Couple | 2,492 (45.7%) | 3.35 |
| Single Male/Father | 323 (5.9%) | 2.87 |
| Single Female/Mother | 580 (10.6%) | 2.96 |
| Non-family | 2,055 (37.7%) | 1.23 |
| Total Households | 5,450 (100.0%) | 2.48 |
Household Size by Marriage Status in Bridgetown
Out of a total of 5,450 households in Bridgetown, 3,395 (62.3%) are family households, while 2,055 (37.7%) are nonfamily households. The most numerous type of family households are 2-person households, comprising 1,436, and the most common type of nonfamily households are 1-person households, comprising 1,650.
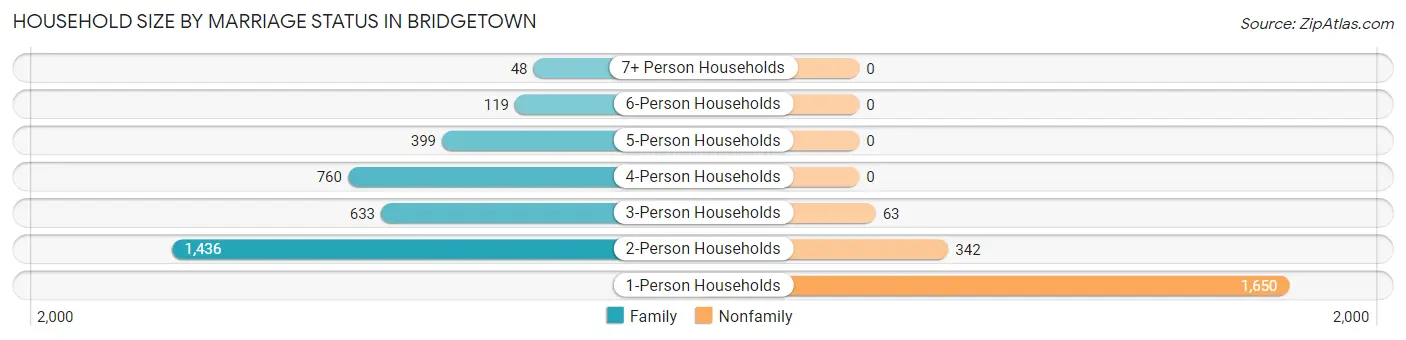
| Household Size | Family Households | Nonfamily Households |
| 1-Person Households | - | 1,650 (30.3%) |
| 2-Person Households | 1,436 (26.4%) | 342 (6.3%) |
| 3-Person Households | 633 (11.6%) | 63 (1.2%) |
| 4-Person Households | 760 (13.9%) | 0 (0.0%) |
| 5-Person Households | 399 (7.3%) | 0 (0.0%) |
| 6-Person Households | 119 (2.2%) | 0 (0.0%) |
| 7+ Person Households | 48 (0.9%) | 0 (0.0%) |
| Total | 3,395 (62.3%) | 2,055 (37.7%) |
Female Fertility in Bridgetown
Fertility by Age in Bridgetown
Average fertility rate in Bridgetown is 48.0 births per 1,000 women. Women in the age bracket of 20 to 34 years have the highest fertility rate with 90.0 births per 1,000 women. Women in the age bracket of 20 to 34 years acount for 87.1% of all women with births.
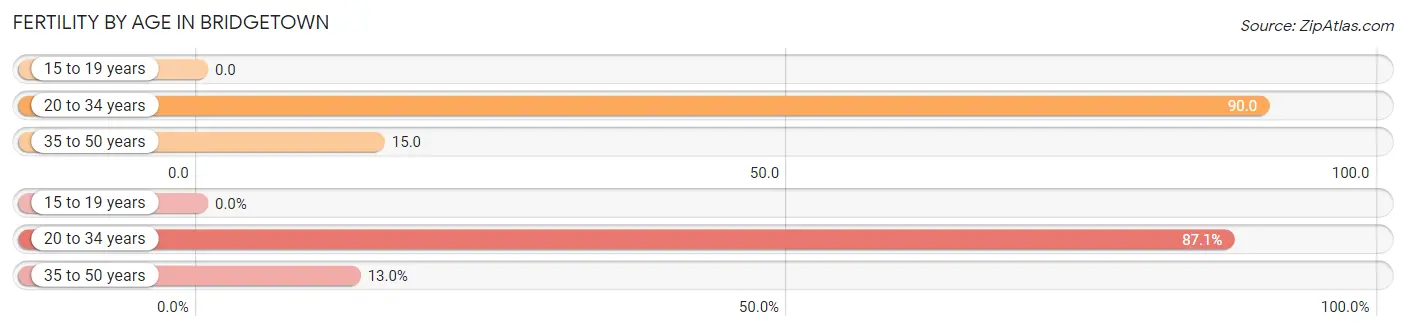
| Age Bracket | Women with Births | Births / 1,000 Women |
| 15 to 19 years | 0 (0.0%) | 0.0 |
| 20 to 34 years | 121 (87.1%) | 90.0 |
| 35 to 50 years | 18 (13.0%) | 15.0 |
| Total | 139 (100.0%) | 48.0 |
Fertility by Age by Marriage Status in Bridgetown
97.8% of women with births (139) in Bridgetown are married. The highest percentage of unmarried women with births falls into 35 to 50 years age bracket with 16.7% of them unmarried at the time of birth, while the lowest percentage of unmarried women with births belong to 20 to 34 years age bracket with 0.0% of them unmarried.
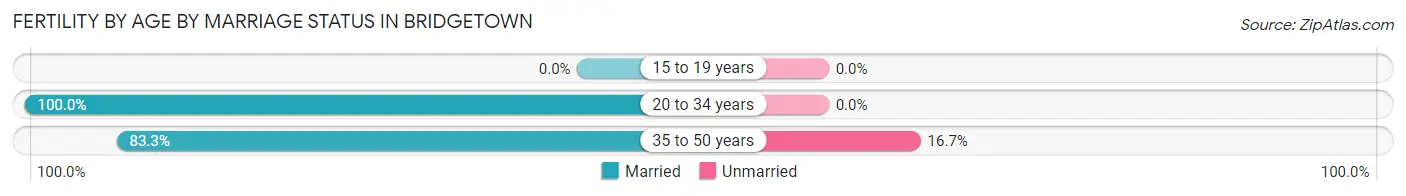
| Age Bracket | Married | Unmarried |
| 15 to 19 years | 0 (0.0%) | 0 (0.0%) |
| 20 to 34 years | 121 (100.0%) | 0 (0.0%) |
| 35 to 50 years | 15 (83.3%) | 3 (16.7%) |
| Total | 136 (97.8%) | 3 (2.2%) |
Fertility by Education in Bridgetown
Average fertility rate in Bridgetown is 48.0 births per 1,000 women. Women with the education attainment of graduate degree have the highest fertility rate of 139.0 births per 1,000 women, while women with the education attainment of college or associate's degree have the lowest fertility at 8.0 births per 1,000 women. Women with the education attainment of graduate degree represent 36.7% of all women with births.
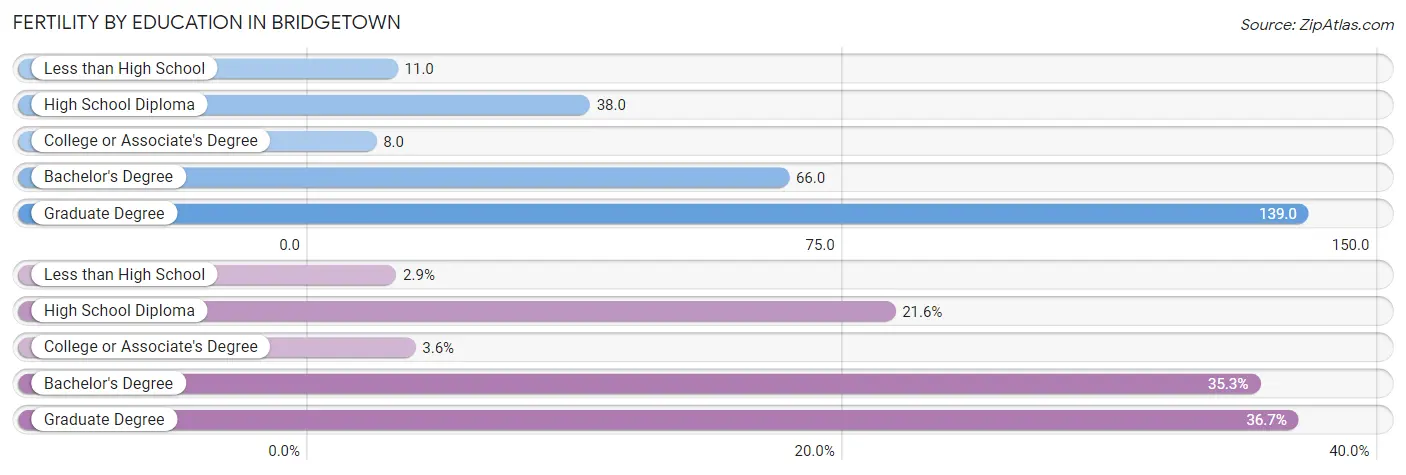
| Educational Attainment | Women with Births | Births / 1,000 Women |
| Less than High School | 4 (2.9%) | 11.0 |
| High School Diploma | 30 (21.6%) | 38.0 |
| College or Associate's Degree | 5 (3.6%) | 8.0 |
| Bachelor's Degree | 49 (35.2%) | 66.0 |
| Graduate Degree | 51 (36.7%) | 139.0 |
| Total | 139 (100.0%) | 48.0 |
Fertility by Education by Marriage Status in Bridgetown
2.2% of women with births in Bridgetown are unmarried. Women with the educational attainment of less than high school are most likely to be married with 100.0% of them married at childbirth, while women with the educational attainment of high school diploma are least likely to be married with 10.0% of them unmarried at childbirth.
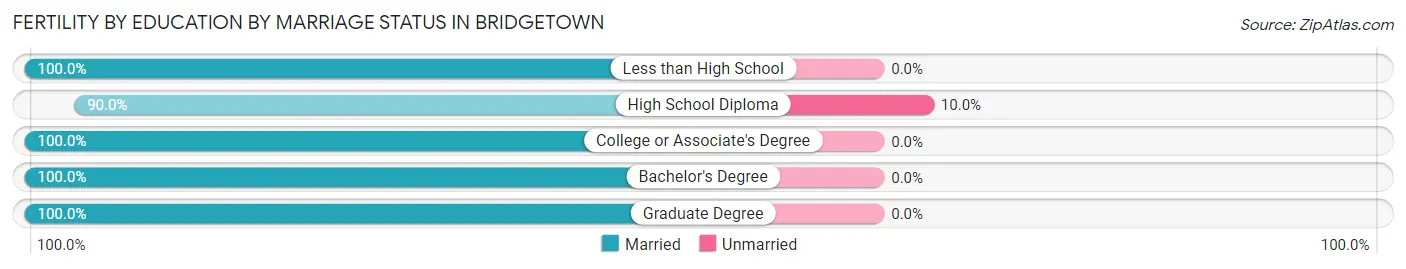
| Educational Attainment | Married | Unmarried |
| Less than High School | 4 (100.0%) | 0 (0.0%) |
| High School Diploma | 27 (90.0%) | 3 (10.0%) |
| College or Associate's Degree | 5 (100.0%) | 0 (0.0%) |
| Bachelor's Degree | 49 (100.0%) | 0 (0.0%) |
| Graduate Degree | 51 (100.0%) | 0 (0.0%) |
| Total | 136 (97.8%) | 3 (2.2%) |
Employment Characteristics in Bridgetown
Employment by Class of Employer in Bridgetown
Among the 6,897 employed individuals in Bridgetown, private company employees (4,815 | 69.8%), not-for-profit organizations (939 | 13.6%), and local government employees (641 | 9.3%) make up the most common classes of employment.
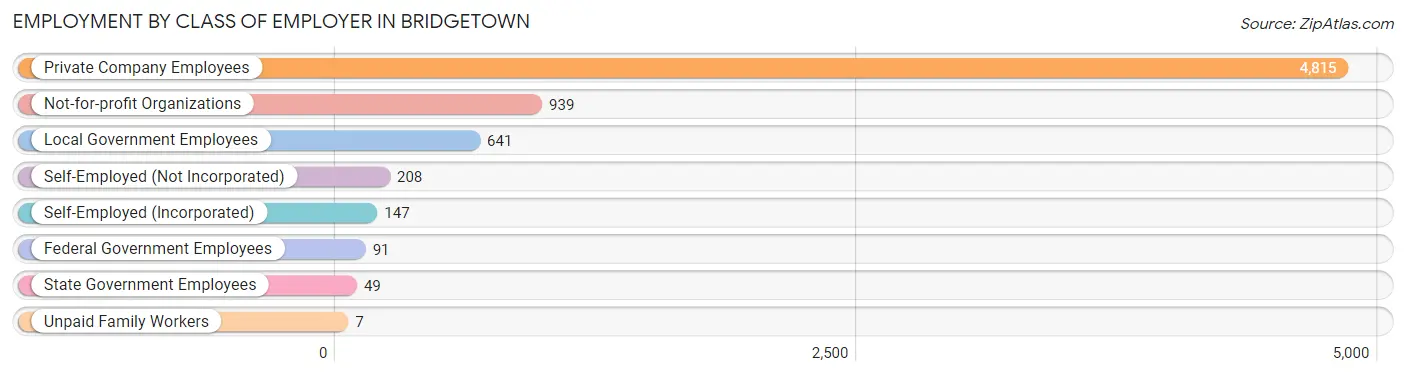
| Employer Class | # Employees | % Employees |
| Private Company Employees | 4,815 | 69.8% |
| Self-Employed (Incorporated) | 147 | 2.1% |
| Self-Employed (Not Incorporated) | 208 | 3.0% |
| Not-for-profit Organizations | 939 | 13.6% |
| Local Government Employees | 641 | 9.3% |
| State Government Employees | 49 | 0.7% |
| Federal Government Employees | 91 | 1.3% |
| Unpaid Family Workers | 7 | 0.1% |
| Total | 6,897 | 100.0% |
Employment Status by Age in Bridgetown
According to the labor force statistics for Bridgetown, out of the total population over 16 years of age (10,571), 67.6% or 7,146 individuals are in the labor force, with 3.1% or 222 of them unemployed. The age group with the highest labor force participation rate is 30 to 34 years, with 94.4% or 942 individuals in the labor force. Within the labor force, the 16 to 19 years age range has the highest percentage of unemployed individuals, with 20.8% or 65 of them being unemployed.
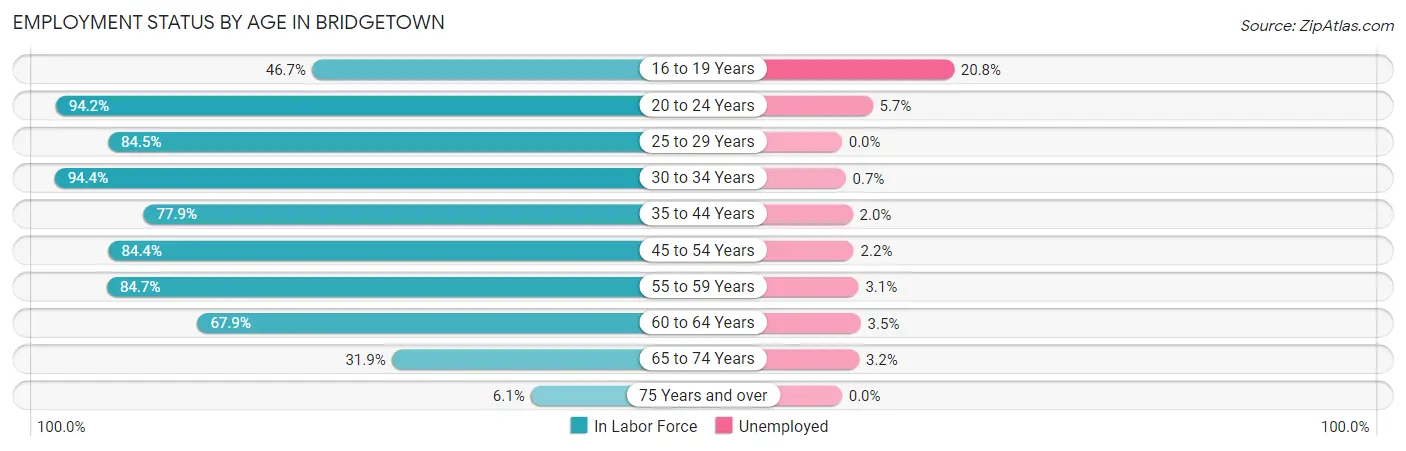
| Age Bracket | In Labor Force | Unemployed |
| 16 to 19 Years | 313 (46.7%) | 65 (20.8%) |
| 20 to 24 Years | 663 (94.2%) | 38 (5.7%) |
| 25 to 29 Years | 775 (84.5%) | 0 (0.0%) |
| 30 to 34 Years | 942 (94.4%) | 7 (0.7%) |
| 35 to 44 Years | 1,322 (77.9%) | 26 (2.0%) |
| 45 to 54 Years | 1,377 (84.4%) | 30 (2.2%) |
| 55 to 59 Years | 774 (84.7%) | 24 (3.1%) |
| 60 to 64 Years | 426 (67.9%) | 15 (3.5%) |
| 65 to 74 Years | 498 (31.9%) | 16 (3.2%) |
| 75 Years and over | 52 (6.1%) | 0 (0.0%) |
| Total | 7,146 (67.6%) | 222 (3.1%) |
Employment Status by Educational Attainment in Bridgetown
According to labor force statistics for Bridgetown, 82.8% of individuals (5,617) out of the total population between 25 and 64 years of age (6,784) are in the labor force, with 1.8% or 101 of them being unemployed. The group with the highest labor force participation rate are those with the educational attainment of college / associate degree, with 87.5% or 1,824 individuals in the labor force. Within the labor force, individuals with less than high school education have the highest percentage of unemployment, with 9.9% or 14 of them being unemployed.
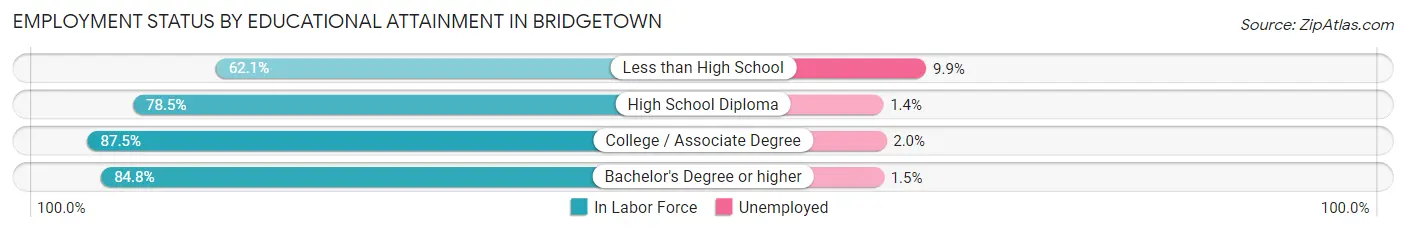
| Educational Attainment | In Labor Force | Unemployed |
| Less than High School | 141 (62.1%) | 22 (9.9%) |
| High School Diploma | 1,762 (78.5%) | 31 (1.4%) |
| College / Associate Degree | 1,824 (87.5%) | 42 (2.0%) |
| Bachelor's Degree or higher | 1,889 (84.8%) | 33 (1.5%) |
| Total | 5,617 (82.8%) | 122 (1.8%) |
Employment Occupations by Sex in Bridgetown
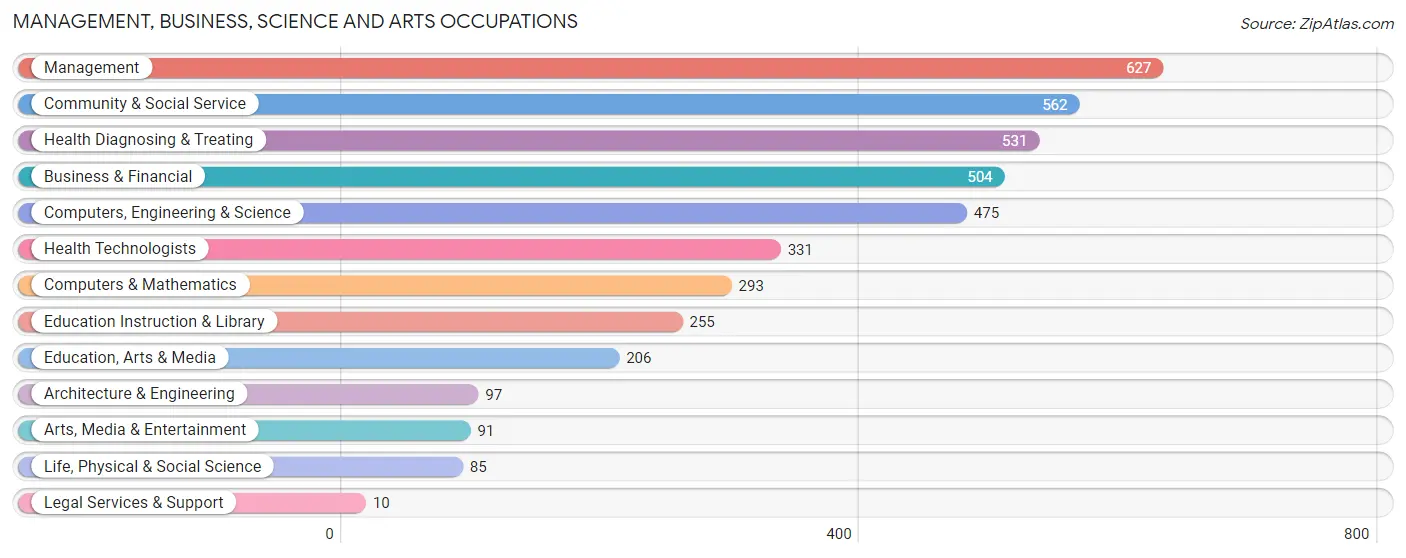
Management, Business, Science and Arts Occupations
The most common Management, Business, Science and Arts occupations in Bridgetown are Management (627 | 9.1%), Community & Social Service (562 | 8.1%), Health Diagnosing & Treating (531 | 7.7%), Business & Financial (504 | 7.3%), and Computers, Engineering & Science (475 | 6.9%).
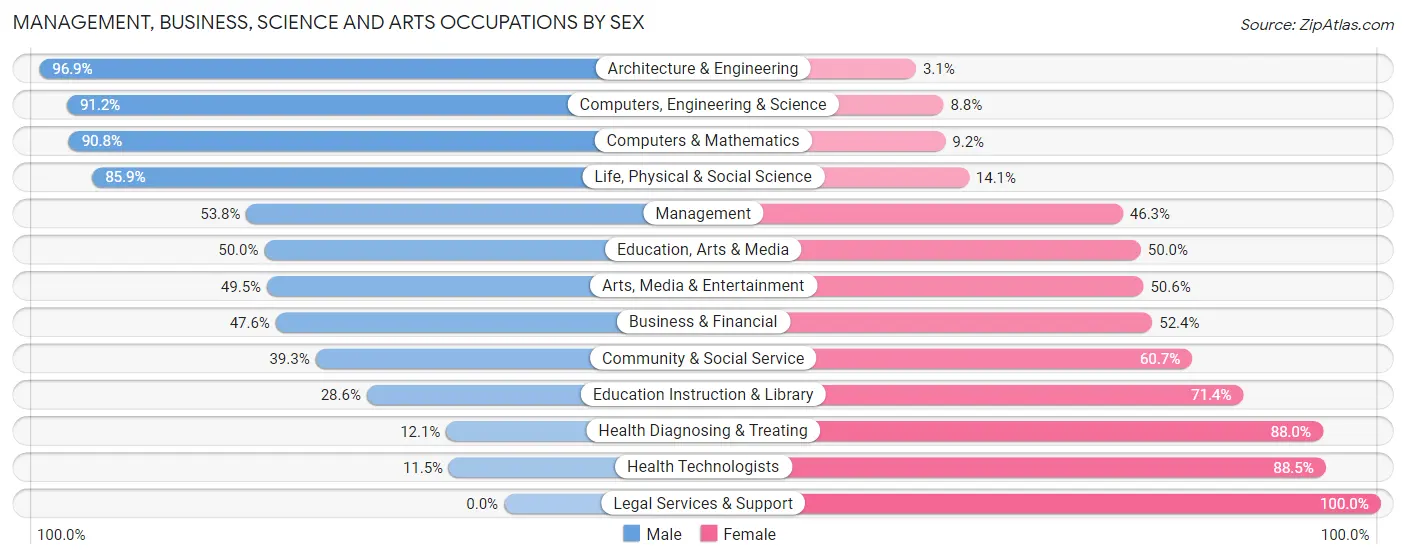
Management, Business, Science and Arts Occupations by Sex
Within the Management, Business, Science and Arts occupations in Bridgetown, the most male-oriented occupations are Architecture & Engineering (96.9%), Computers, Engineering & Science (91.2%), and Computers & Mathematics (90.8%), while the most female-oriented occupations are Legal Services & Support (100.0%), Health Technologists (88.5%), and Health Diagnosing & Treating (87.9%).
| Occupation | Male | Female |
| Management | 337 (53.7%) | 290 (46.3%) |
| Business & Financial | 240 (47.6%) | 264 (52.4%) |
| Computers, Engineering & Science | 433 (91.2%) | 42 (8.8%) |
| Computers & Mathematics | 266 (90.8%) | 27 (9.2%) |
| Architecture & Engineering | 94 (96.9%) | 3 (3.1%) |
| Life, Physical & Social Science | 73 (85.9%) | 12 (14.1%) |
| Community & Social Service | 221 (39.3%) | 341 (60.7%) |
| Education, Arts & Media | 103 (50.0%) | 103 (50.0%) |
| Legal Services & Support | 0 (0.0%) | 10 (100.0%) |
| Education Instruction & Library | 73 (28.6%) | 182 (71.4%) |
| Arts, Media & Entertainment | 45 (49.4%) | 46 (50.5%) |
| Health Diagnosing & Treating | 64 (12.0%) | 467 (87.9%) |
| Health Technologists | 38 (11.5%) | 293 (88.5%) |
| Total (Category) | 1,295 (48.0%) | 1,404 (52.0%) |
| Total (Overall) | 3,708 (53.7%) | 3,202 (46.3%) |
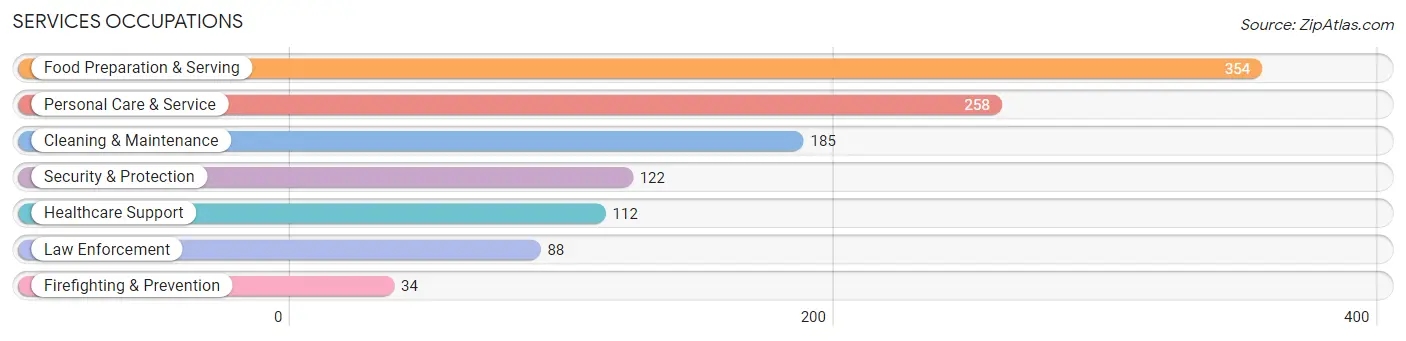
Services Occupations
The most common Services occupations in Bridgetown are Food Preparation & Serving (354 | 5.1%), Personal Care & Service (258 | 3.7%), Cleaning & Maintenance (185 | 2.7%), Security & Protection (122 | 1.8%), and Healthcare Support (112 | 1.6%).
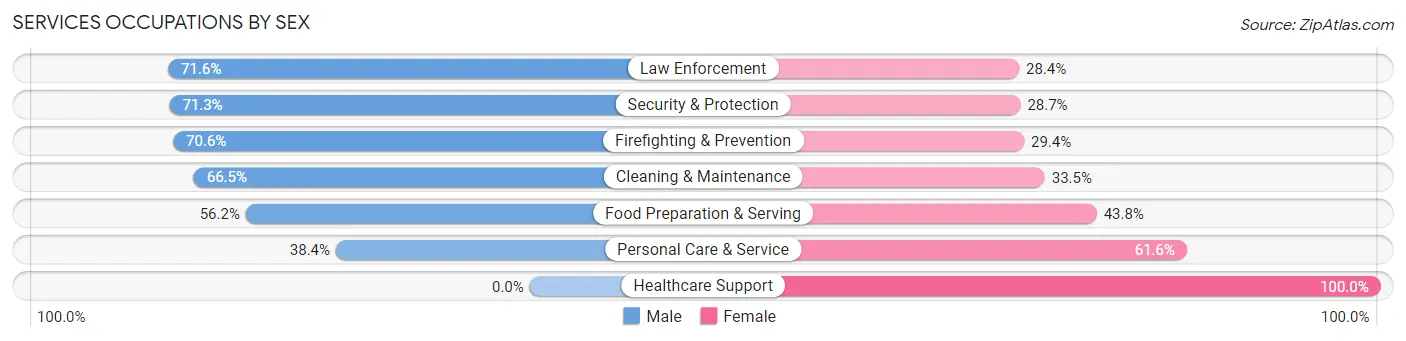
Services Occupations by Sex
Within the Services occupations in Bridgetown, the most male-oriented occupations are Law Enforcement (71.6%), Security & Protection (71.3%), and Firefighting & Prevention (70.6%), while the most female-oriented occupations are Healthcare Support (100.0%), Personal Care & Service (61.6%), and Food Preparation & Serving (43.8%).
| Occupation | Male | Female |
| Healthcare Support | 0 (0.0%) | 112 (100.0%) |
| Security & Protection | 87 (71.3%) | 35 (28.7%) |
| Firefighting & Prevention | 24 (70.6%) | 10 (29.4%) |
| Law Enforcement | 63 (71.6%) | 25 (28.4%) |
| Food Preparation & Serving | 199 (56.2%) | 155 (43.8%) |
| Cleaning & Maintenance | 123 (66.5%) | 62 (33.5%) |
| Personal Care & Service | 99 (38.4%) | 159 (61.6%) |
| Total (Category) | 508 (49.3%) | 523 (50.7%) |
| Total (Overall) | 3,708 (53.7%) | 3,202 (46.3%) |
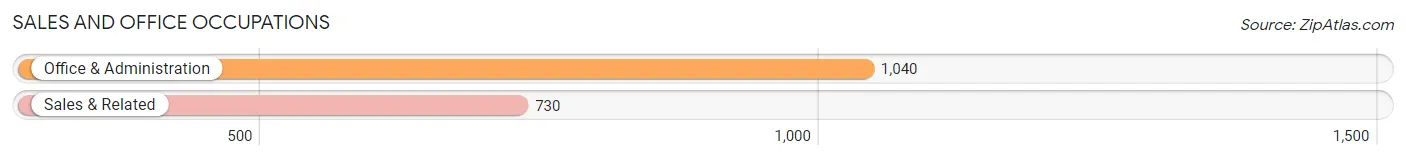
Sales and Office Occupations
The most common Sales and Office occupations in Bridgetown are Office & Administration (1,040 | 15.0%), and Sales & Related (730 | 10.6%).
Sales and Office Occupations by Sex
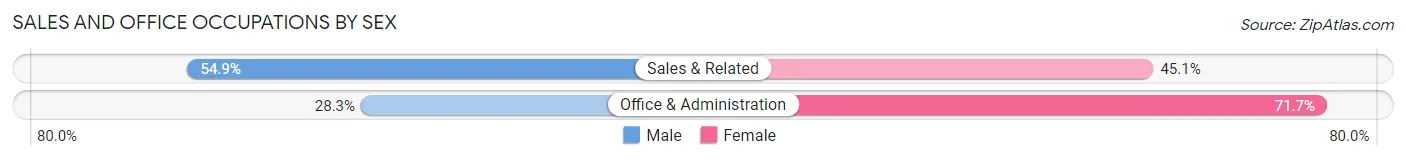
| Occupation | Male | Female |
| Sales & Related | 401 (54.9%) | 329 (45.1%) |
| Office & Administration | 294 (28.3%) | 746 (71.7%) |
| Total (Category) | 695 (39.3%) | 1,075 (60.7%) |
| Total (Overall) | 3,708 (53.7%) | 3,202 (46.3%) |
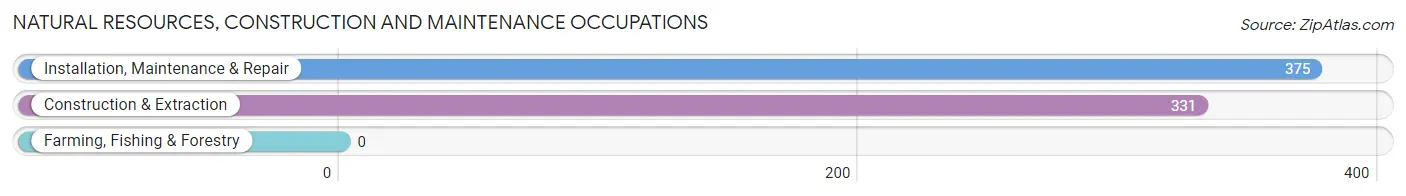
Natural Resources, Construction and Maintenance Occupations
The most common Natural Resources, Construction and Maintenance occupations in Bridgetown are Installation, Maintenance & Repair (375 | 5.4%), and Construction & Extraction (331 | 4.8%).
Natural Resources, Construction and Maintenance Occupations by Sex
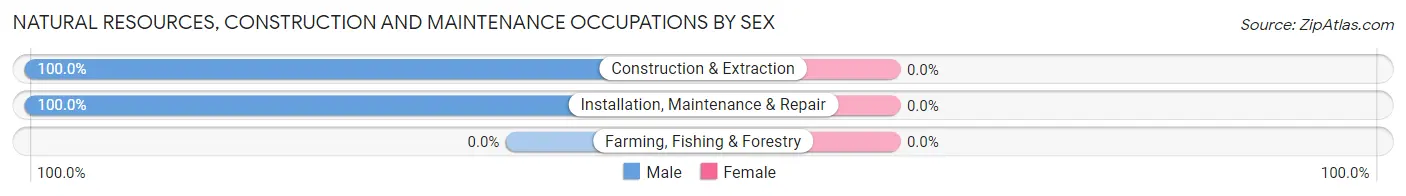
| Occupation | Male | Female |
| Farming, Fishing & Forestry | 0 (0.0%) | 0 (0.0%) |
| Construction & Extraction | 331 (100.0%) | 0 (0.0%) |
| Installation, Maintenance & Repair | 375 (100.0%) | 0 (0.0%) |
| Total (Category) | 706 (100.0%) | 0 (0.0%) |
| Total (Overall) | 3,708 (53.7%) | 3,202 (46.3%) |
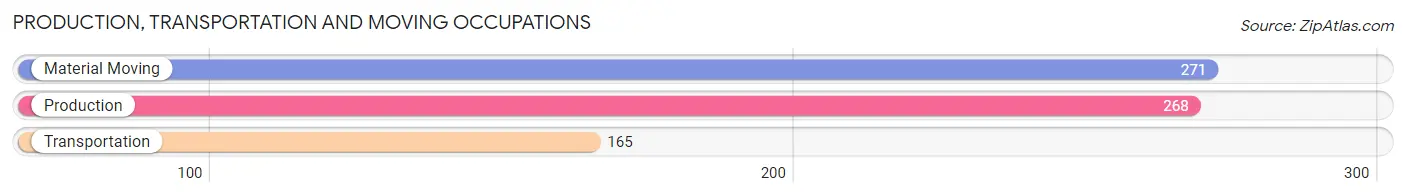
Production, Transportation and Moving Occupations
The most common Production, Transportation and Moving occupations in Bridgetown are Material Moving (271 | 3.9%), Production (268 | 3.9%), and Transportation (165 | 2.4%).
Production, Transportation and Moving Occupations by Sex
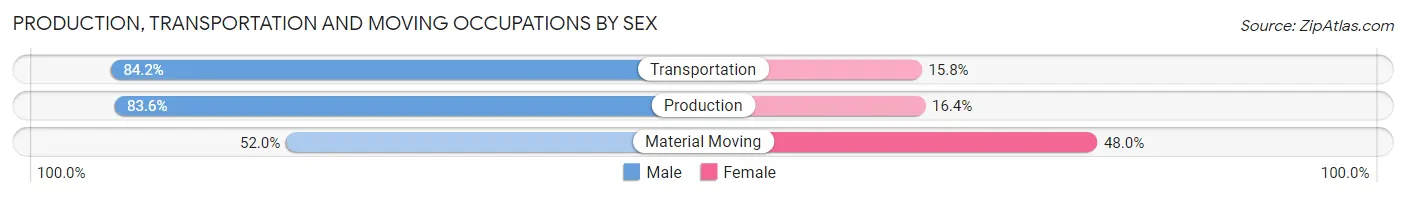
| Occupation | Male | Female |
| Production | 224 (83.6%) | 44 (16.4%) |
| Transportation | 139 (84.2%) | 26 (15.8%) |
| Material Moving | 141 (52.0%) | 130 (48.0%) |
| Total (Category) | 504 (71.6%) | 200 (28.4%) |
| Total (Overall) | 3,708 (53.7%) | 3,202 (46.3%) |
Employment Industries by Sex in Bridgetown
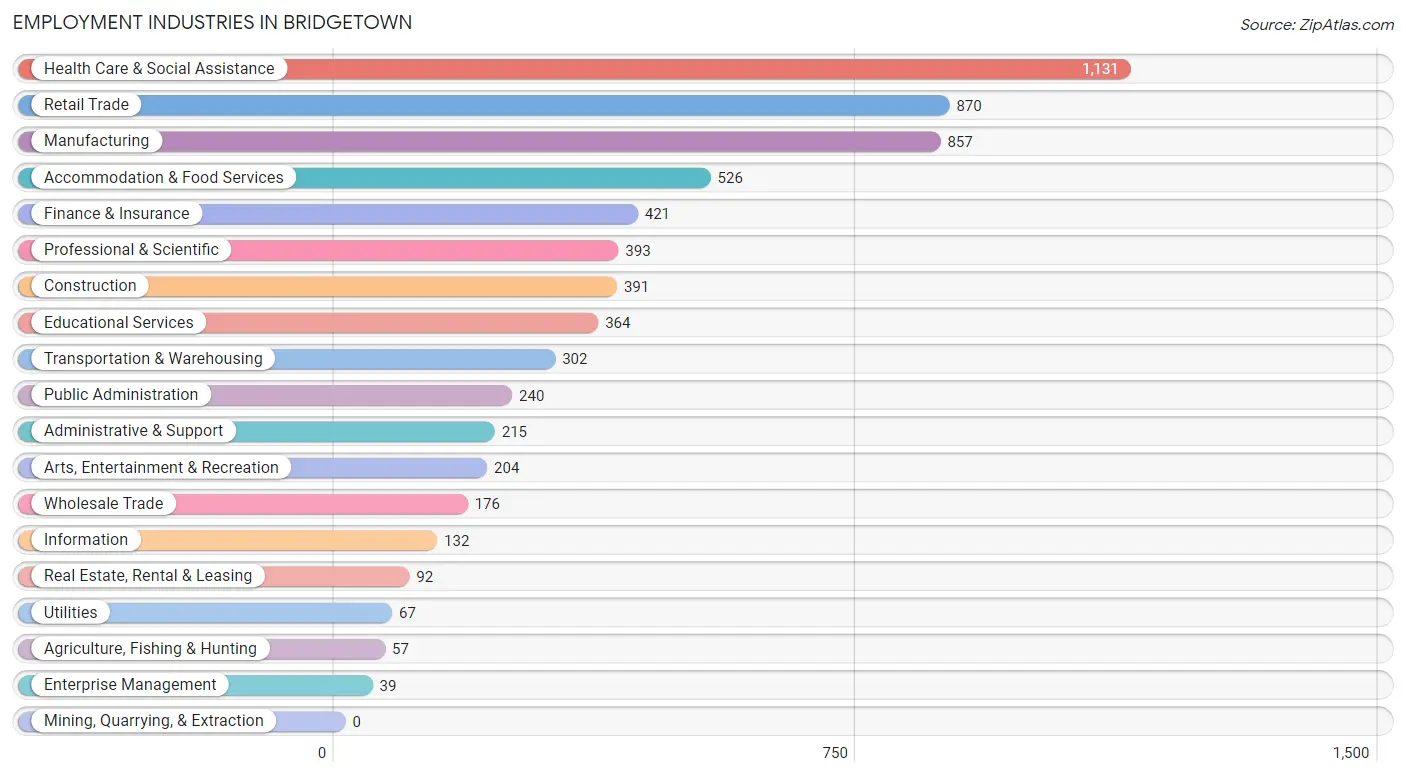
Employment Industries in Bridgetown
The major employment industries in Bridgetown include Health Care & Social Assistance (1,131 | 16.4%), Retail Trade (870 | 12.6%), Manufacturing (857 | 12.4%), Accommodation & Food Services (526 | 7.6%), and Finance & Insurance (421 | 6.1%).
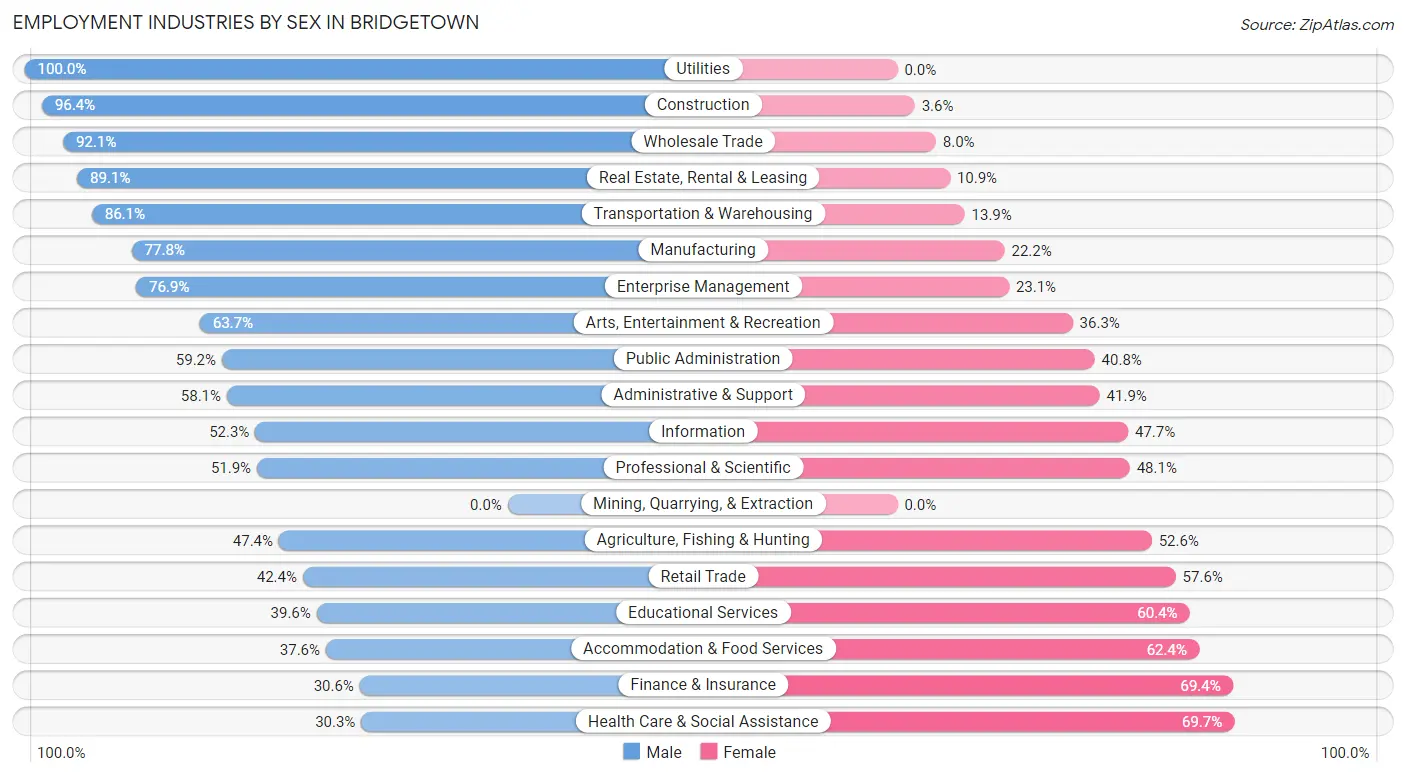
Employment Industries by Sex in Bridgetown
The Bridgetown industries that see more men than women are Utilities (100.0%), Construction (96.4%), and Wholesale Trade (92.0%), whereas the industries that tend to have a higher number of women are Health Care & Social Assistance (69.7%), Finance & Insurance (69.4%), and Accommodation & Food Services (62.4%).
| Industry | Male | Female |
| Agriculture, Fishing & Hunting | 27 (47.4%) | 30 (52.6%) |
| Mining, Quarrying, & Extraction | 0 (0.0%) | 0 (0.0%) |
| Construction | 377 (96.4%) | 14 (3.6%) |
| Manufacturing | 667 (77.8%) | 190 (22.2%) |
| Wholesale Trade | 162 (92.0%) | 14 (8.0%) |
| Retail Trade | 369 (42.4%) | 501 (57.6%) |
| Transportation & Warehousing | 260 (86.1%) | 42 (13.9%) |
| Utilities | 67 (100.0%) | 0 (0.0%) |
| Information | 69 (52.3%) | 63 (47.7%) |
| Finance & Insurance | 129 (30.6%) | 292 (69.4%) |
| Real Estate, Rental & Leasing | 82 (89.1%) | 10 (10.9%) |
| Professional & Scientific | 204 (51.9%) | 189 (48.1%) |
| Enterprise Management | 30 (76.9%) | 9 (23.1%) |
| Administrative & Support | 125 (58.1%) | 90 (41.9%) |
| Educational Services | 144 (39.6%) | 220 (60.4%) |
| Health Care & Social Assistance | 343 (30.3%) | 788 (69.7%) |
| Arts, Entertainment & Recreation | 130 (63.7%) | 74 (36.3%) |
| Accommodation & Food Services | 198 (37.6%) | 328 (62.4%) |
| Public Administration | 142 (59.2%) | 98 (40.8%) |
| Total | 3,708 (53.7%) | 3,202 (46.3%) |
Education in Bridgetown
School Enrollment in Bridgetown
The most common levels of schooling among the 3,416 students in Bridgetown are middle school (978 | 28.6%), high school (805 | 23.6%), and elementary school (696 | 20.4%).
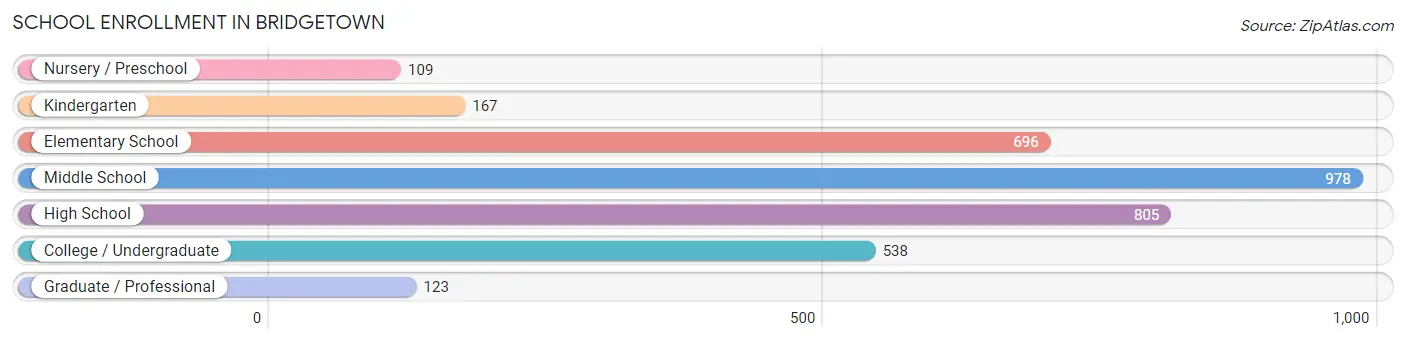
| School Level | # Students | % Students |
| Nursery / Preschool | 109 | 3.2% |
| Kindergarten | 167 | 4.9% |
| Elementary School | 696 | 20.4% |
| Middle School | 978 | 28.6% |
| High School | 805 | 23.6% |
| College / Undergraduate | 538 | 15.8% |
| Graduate / Professional | 123 | 3.6% |
| Total | 3,416 | 100.0% |
School Enrollment by Age by Funding Source in Bridgetown
Out of a total of 3,416 students who are enrolled in schools in Bridgetown, 523 (15.3%) attend a private institution, while the remaining 2,893 (84.7%) are enrolled in public schools. The age group of 3 to 4 year olds has the highest likelihood of being enrolled in private schools, with 62 (70.5% in the age bracket) enrolled. Conversely, the age group of 5 to 9 year old has the lowest likelihood of being enrolled in a private school, with 768 (92.2% in the age bracket) attending a public institution.
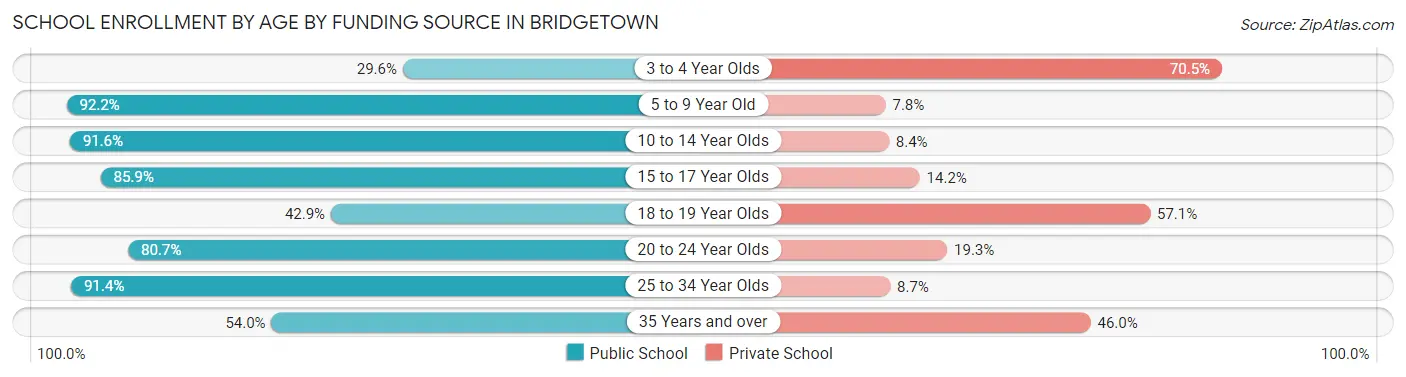
| Age Bracket | Public School | Private School |
| 3 to 4 Year Olds | 26 (29.5%) | 62 (70.5%) |
| 5 to 9 Year Old | 768 (92.2%) | 65 (7.8%) |
| 10 to 14 Year Olds | 1,011 (91.6%) | 93 (8.4%) |
| 15 to 17 Year Olds | 540 (85.9%) | 89 (14.1%) |
| 18 to 19 Year Olds | 70 (42.9%) | 93 (57.1%) |
| 20 to 24 Year Olds | 264 (80.7%) | 63 (19.3%) |
| 25 to 34 Year Olds | 169 (91.3%) | 16 (8.6%) |
| 35 Years and over | 47 (54.0%) | 40 (46.0%) |
| Total | 2,893 (84.7%) | 523 (15.3%) |
Educational Attainment by Field of Study in Bridgetown
Business (668 | 22.0%), education (336 | 11.1%), science & technology (317 | 10.4%), physical & health sciences (208 | 6.8%), and psychology (185 | 6.1%) are the most common fields of study among 3,040 individuals in Bridgetown who have obtained a bachelor's degree or higher.
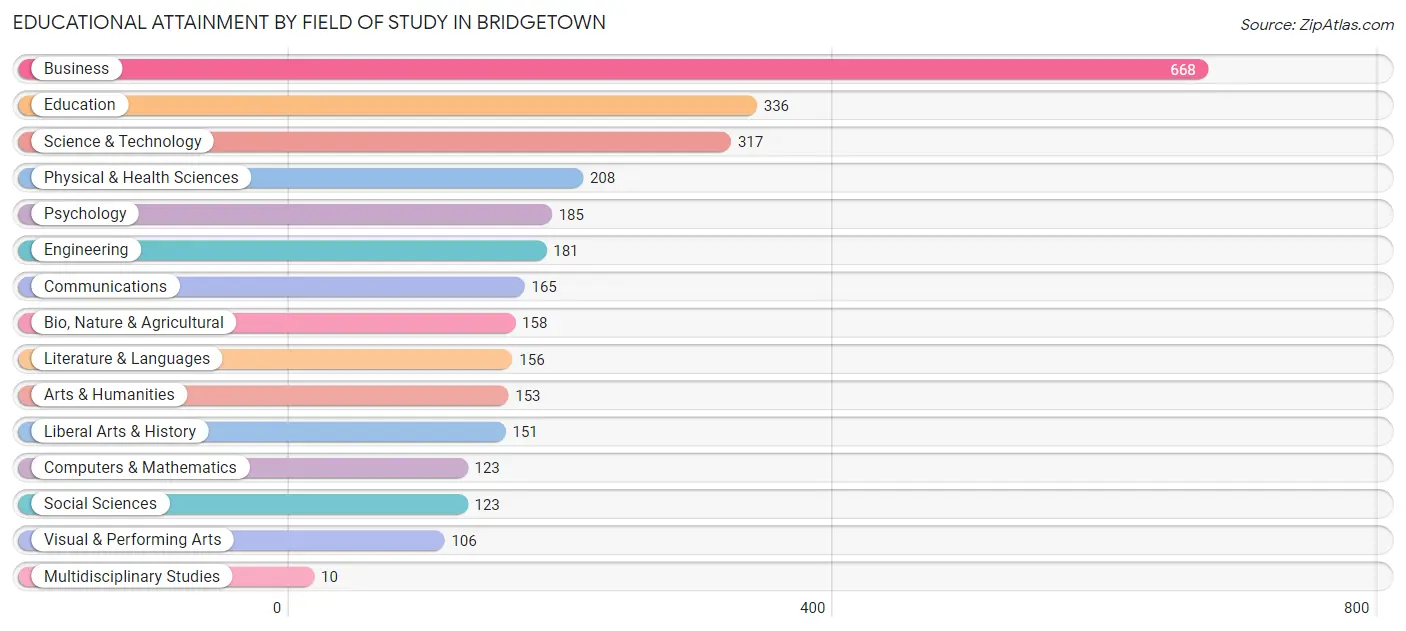
| Field of Study | # Graduates | % Graduates |
| Computers & Mathematics | 123 | 4.1% |
| Bio, Nature & Agricultural | 158 | 5.2% |
| Physical & Health Sciences | 208 | 6.8% |
| Psychology | 185 | 6.1% |
| Social Sciences | 123 | 4.1% |
| Engineering | 181 | 5.9% |
| Multidisciplinary Studies | 10 | 0.3% |
| Science & Technology | 317 | 10.4% |
| Business | 668 | 22.0% |
| Education | 336 | 11.1% |
| Literature & Languages | 156 | 5.1% |
| Liberal Arts & History | 151 | 5.0% |
| Visual & Performing Arts | 106 | 3.5% |
| Communications | 165 | 5.4% |
| Arts & Humanities | 153 | 5.0% |
| Total | 3,040 | 100.0% |
Transportation & Commute in Bridgetown
Vehicle Availability by Sex in Bridgetown
The most prevalent vehicle ownership categories in Bridgetown are males with 2 vehicles (1,903, accounting for 51.3%) and females with 2 vehicles (1,479, making up 59.7%).
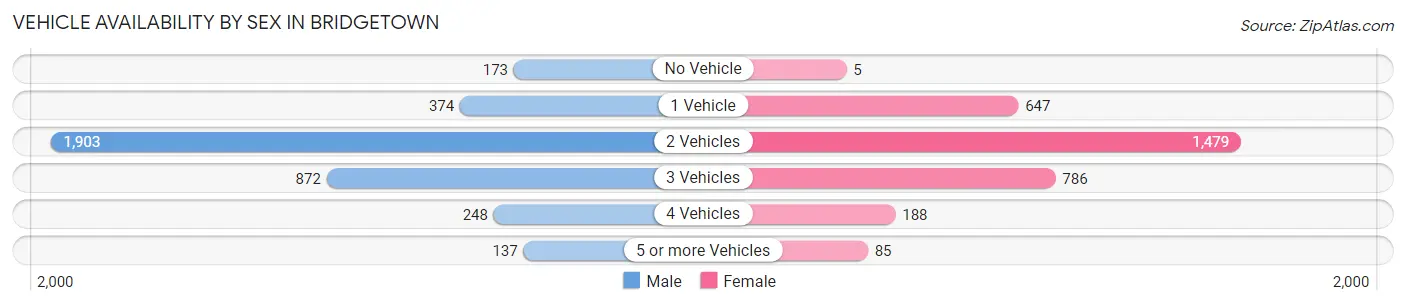
| Vehicles Available | Male | Female |
| No Vehicle | 173 (4.7%) | 5 (0.2%) |
| 1 Vehicle | 374 (10.1%) | 647 (20.3%) |
| 2 Vehicles | 1,903 (51.3%) | 1,479 (46.4%) |
| 3 Vehicles | 872 (23.5%) | 786 (24.6%) |
| 4 Vehicles | 248 (6.7%) | 188 (5.9%) |
| 5 or more Vehicles | 137 (3.7%) | 85 (2.7%) |
| Total | 3,707 (100.0%) | 3,190 (100.0%) |
Commute Time in Bridgetown
The most frequently occuring commute durations in Bridgetown are 30 to 34 minutes (1,298 commuters, 20.4%), 25 to 29 minutes (744 commuters, 11.7%), and 20 to 24 minutes (735 commuters, 11.5%).
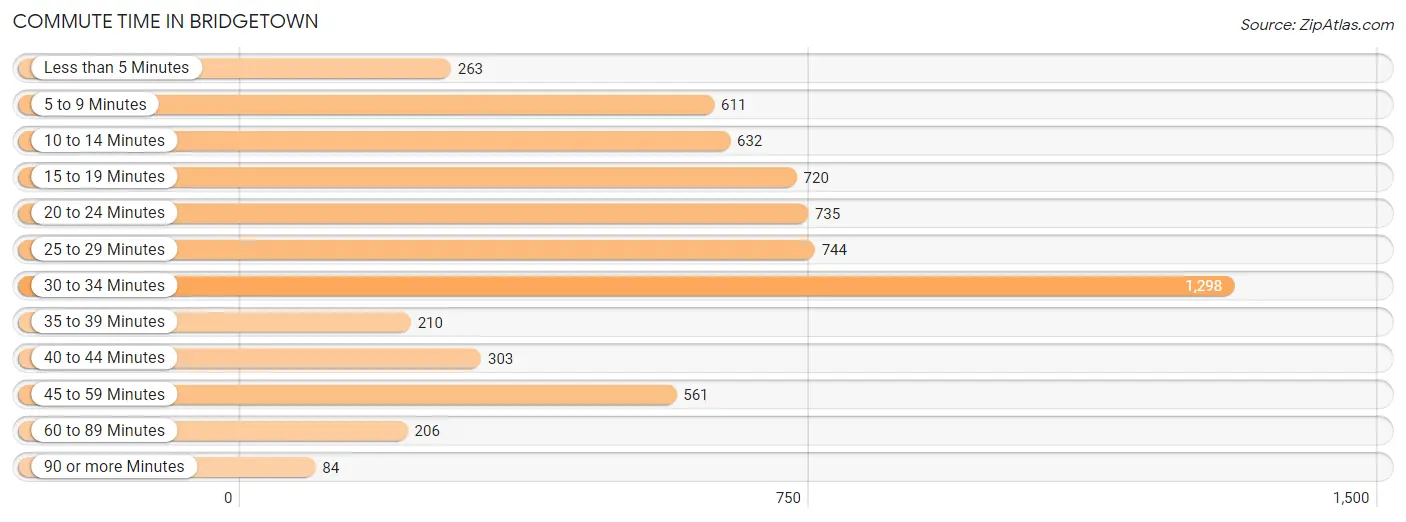
| Commute Time | # Commuters | % Commuters |
| Less than 5 Minutes | 263 | 4.1% |
| 5 to 9 Minutes | 611 | 9.6% |
| 10 to 14 Minutes | 632 | 9.9% |
| 15 to 19 Minutes | 720 | 11.3% |
| 20 to 24 Minutes | 735 | 11.5% |
| 25 to 29 Minutes | 744 | 11.7% |
| 30 to 34 Minutes | 1,298 | 20.4% |
| 35 to 39 Minutes | 210 | 3.3% |
| 40 to 44 Minutes | 303 | 4.8% |
| 45 to 59 Minutes | 561 | 8.8% |
| 60 to 89 Minutes | 206 | 3.2% |
| 90 or more Minutes | 84 | 1.3% |
Commute Time by Sex in Bridgetown
The most common commute times in Bridgetown are 30 to 34 minutes (791 commuters, 23.0%) for males and 30 to 34 minutes (507 commuters, 17.4%) for females.
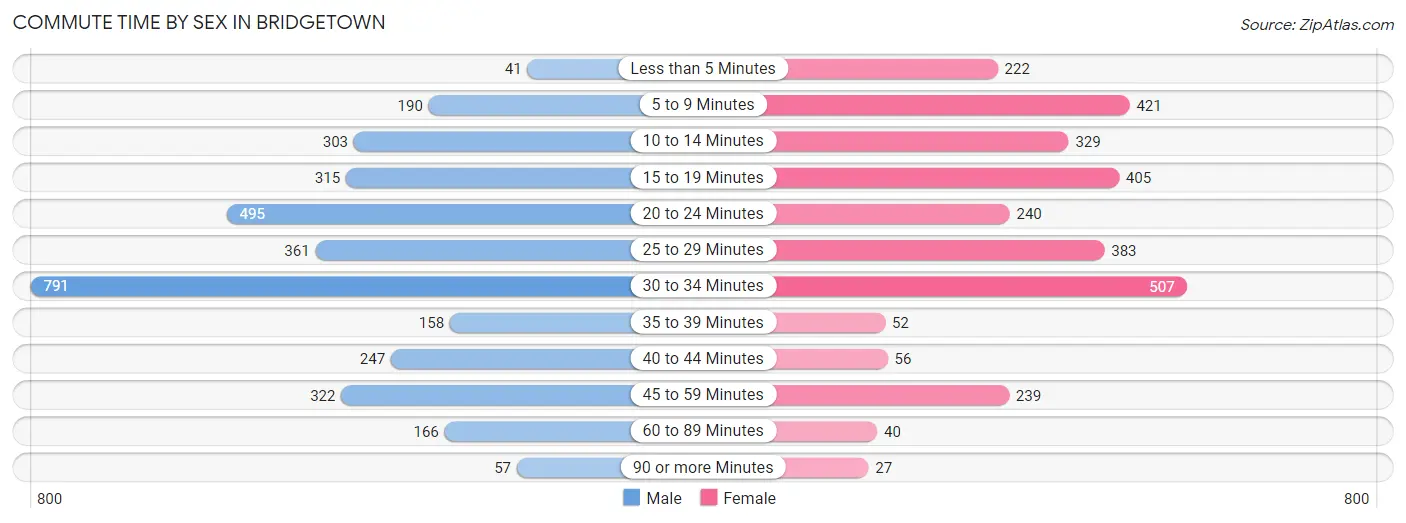
| Commute Time | Male | Female |
| Less than 5 Minutes | 41 (1.2%) | 222 (7.6%) |
| 5 to 9 Minutes | 190 (5.5%) | 421 (14.4%) |
| 10 to 14 Minutes | 303 (8.8%) | 329 (11.3%) |
| 15 to 19 Minutes | 315 (9.1%) | 405 (13.9%) |
| 20 to 24 Minutes | 495 (14.4%) | 240 (8.2%) |
| 25 to 29 Minutes | 361 (10.5%) | 383 (13.1%) |
| 30 to 34 Minutes | 791 (23.0%) | 507 (17.4%) |
| 35 to 39 Minutes | 158 (4.6%) | 52 (1.8%) |
| 40 to 44 Minutes | 247 (7.2%) | 56 (1.9%) |
| 45 to 59 Minutes | 322 (9.3%) | 239 (8.2%) |
| 60 to 89 Minutes | 166 (4.8%) | 40 (1.4%) |
| 90 or more Minutes | 57 (1.7%) | 27 (0.9%) |
Time of Departure to Work by Sex in Bridgetown
The most frequent times of departure to work in Bridgetown are 7:00 AM to 7:29 AM (708, 20.5%) for males and 8:00 AM to 8:29 AM (424, 14.5%) for females.
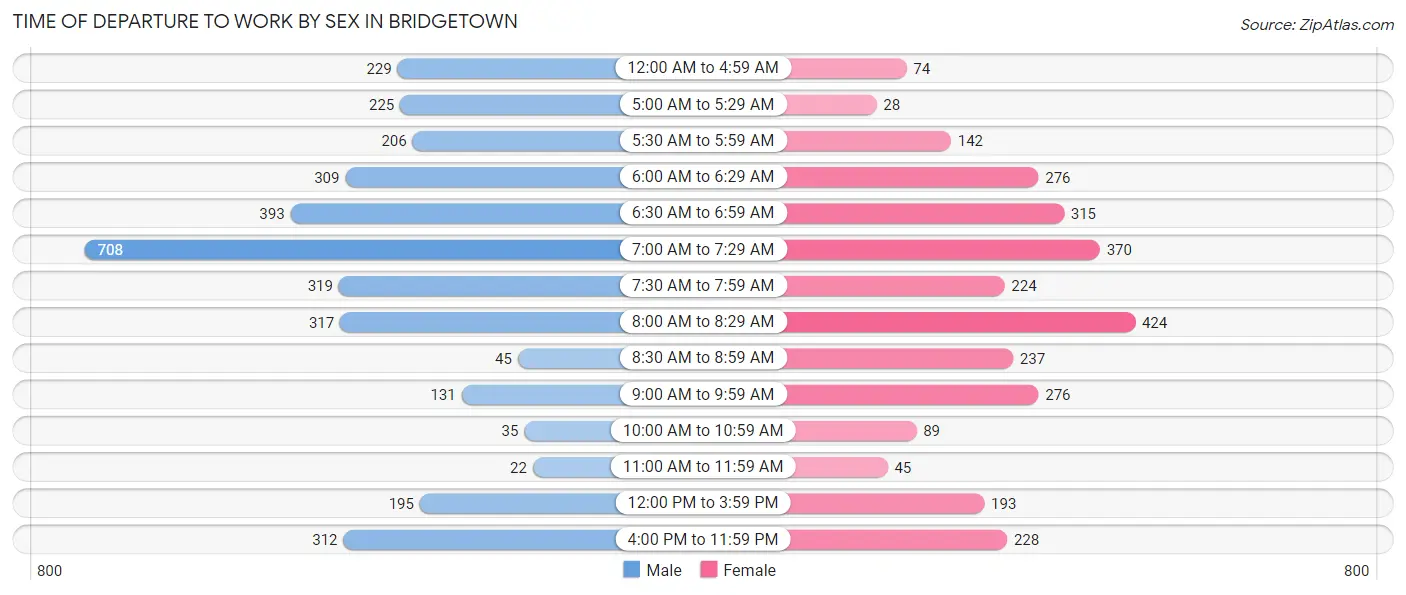
| Time of Departure | Male | Female |
| 12:00 AM to 4:59 AM | 229 (6.7%) | 74 (2.5%) |
| 5:00 AM to 5:29 AM | 225 (6.5%) | 28 (1.0%) |
| 5:30 AM to 5:59 AM | 206 (6.0%) | 142 (4.9%) |
| 6:00 AM to 6:29 AM | 309 (9.0%) | 276 (9.5%) |
| 6:30 AM to 6:59 AM | 393 (11.4%) | 315 (10.8%) |
| 7:00 AM to 7:29 AM | 708 (20.5%) | 370 (12.7%) |
| 7:30 AM to 7:59 AM | 319 (9.3%) | 224 (7.7%) |
| 8:00 AM to 8:29 AM | 317 (9.2%) | 424 (14.5%) |
| 8:30 AM to 8:59 AM | 45 (1.3%) | 237 (8.1%) |
| 9:00 AM to 9:59 AM | 131 (3.8%) | 276 (9.5%) |
| 10:00 AM to 10:59 AM | 35 (1.0%) | 89 (3.0%) |
| 11:00 AM to 11:59 AM | 22 (0.6%) | 45 (1.5%) |
| 12:00 PM to 3:59 PM | 195 (5.7%) | 193 (6.6%) |
| 4:00 PM to 11:59 PM | 312 (9.0%) | 228 (7.8%) |
| Total | 3,446 (100.0%) | 2,921 (100.0%) |
Housing Occupancy in Bridgetown
Occupancy by Ownership in Bridgetown
Of the total 5,450 dwellings in Bridgetown, owner-occupied units account for 4,618 (84.7%), while renter-occupied units make up 832 (15.3%).
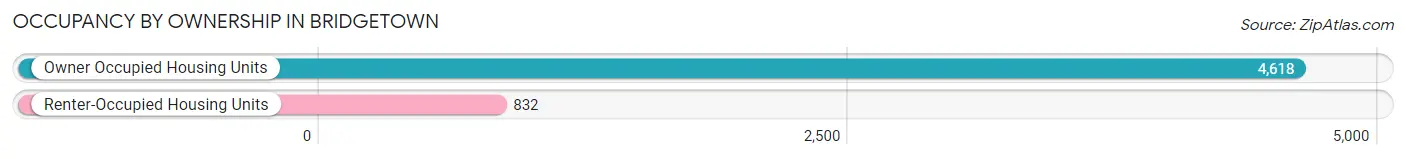
| Occupancy | # Housing Units | % Housing Units |
| Owner Occupied Housing Units | 4,618 | 84.7% |
| Renter-Occupied Housing Units | 832 | 15.3% |
| Total Occupied Housing Units | 5,450 | 100.0% |
Occupancy by Household Size in Bridgetown
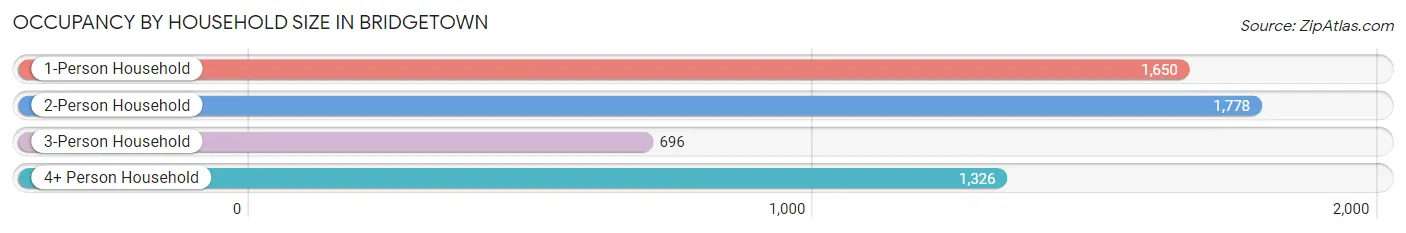
| Household Size | # Housing Units | % Housing Units |
| 1-Person Household | 1,650 | 30.3% |
| 2-Person Household | 1,778 | 32.6% |
| 3-Person Household | 696 | 12.8% |
| 4+ Person Household | 1,326 | 24.3% |
| Total Housing Units | 5,450 | 100.0% |
Occupancy by Ownership by Household Size in Bridgetown
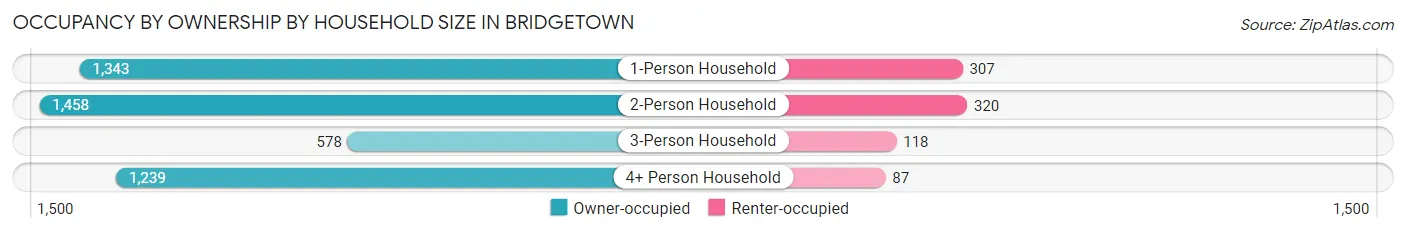
| Household Size | Owner-occupied | Renter-occupied |
| 1-Person Household | 1,343 (81.4%) | 307 (18.6%) |
| 2-Person Household | 1,458 (82.0%) | 320 (18.0%) |
| 3-Person Household | 578 (83.1%) | 118 (17.0%) |
| 4+ Person Household | 1,239 (93.4%) | 87 (6.6%) |
| Total Housing Units | 4,618 (84.7%) | 832 (15.3%) |
Occupancy by Educational Attainment in Bridgetown
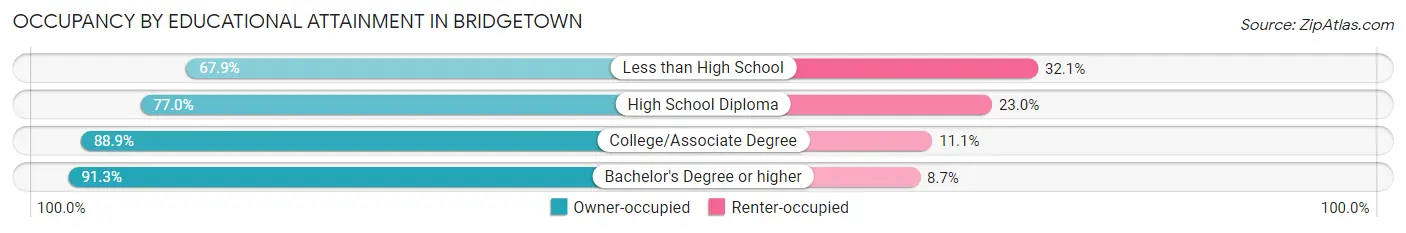
| Household Size | Owner-occupied | Renter-occupied |
| Less than High School | 182 (67.9%) | 86 (32.1%) |
| High School Diploma | 1,362 (77.0%) | 406 (23.0%) |
| College/Associate Degree | 1,565 (88.9%) | 196 (11.1%) |
| Bachelor's Degree or higher | 1,509 (91.3%) | 144 (8.7%) |
Occupancy by Age of Householder in Bridgetown
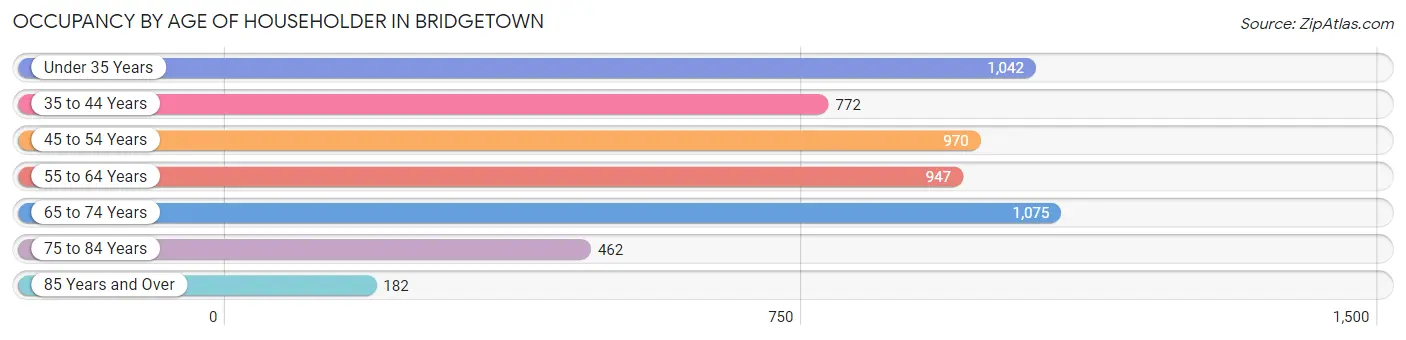
| Age Bracket | # Households | % Households |
| Under 35 Years | 1,042 | 19.1% |
| 35 to 44 Years | 772 | 14.2% |
| 45 to 54 Years | 970 | 17.8% |
| 55 to 64 Years | 947 | 17.4% |
| 65 to 74 Years | 1,075 | 19.7% |
| 75 to 84 Years | 462 | 8.5% |
| 85 Years and Over | 182 | 3.3% |
| Total | 5,450 | 100.0% |
Housing Finances in Bridgetown
Median Income by Occupancy in Bridgetown
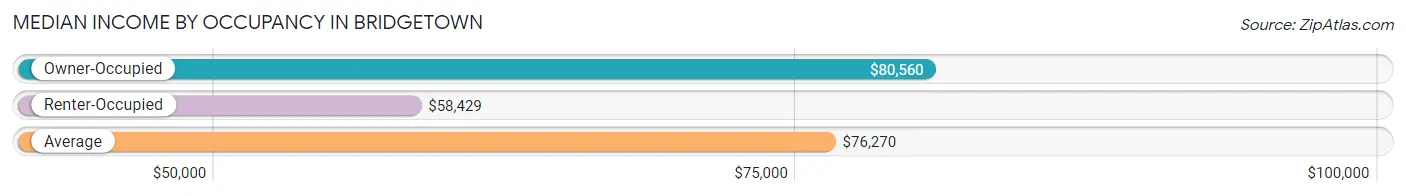
| Occupancy Type | # Households | Median Income |
| Owner-Occupied | 4,618 (84.7%) | $80,560 |
| Renter-Occupied | 832 (15.3%) | $58,429 |
| Average | 5,450 (100.0%) | $76,270 |
Occupancy by Householder Income Bracket in Bridgetown
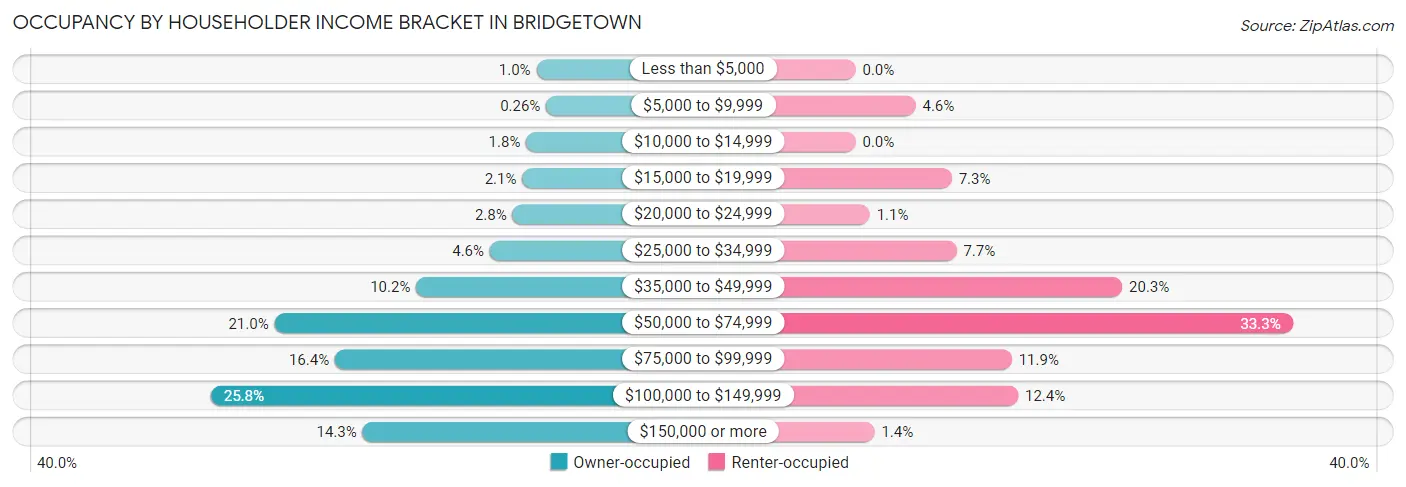
| Income Bracket | Owner-occupied | Renter-occupied |
| Less than $5,000 | 46 (1.0%) | 0 (0.0%) |
| $5,000 to $9,999 | 12 (0.3%) | 38 (4.6%) |
| $10,000 to $14,999 | 82 (1.8%) | 0 (0.0%) |
| $15,000 to $19,999 | 96 (2.1%) | 61 (7.3%) |
| $20,000 to $24,999 | 130 (2.8%) | 9 (1.1%) |
| $25,000 to $34,999 | 210 (4.5%) | 64 (7.7%) |
| $35,000 to $49,999 | 469 (10.2%) | 169 (20.3%) |
| $50,000 to $74,999 | 968 (21.0%) | 277 (33.3%) |
| $75,000 to $99,999 | 755 (16.4%) | 99 (11.9%) |
| $100,000 to $149,999 | 1,192 (25.8%) | 103 (12.4%) |
| $150,000 or more | 658 (14.2%) | 12 (1.4%) |
| Total | 4,618 (100.0%) | 832 (100.0%) |
Monthly Housing Cost Tiers in Bridgetown
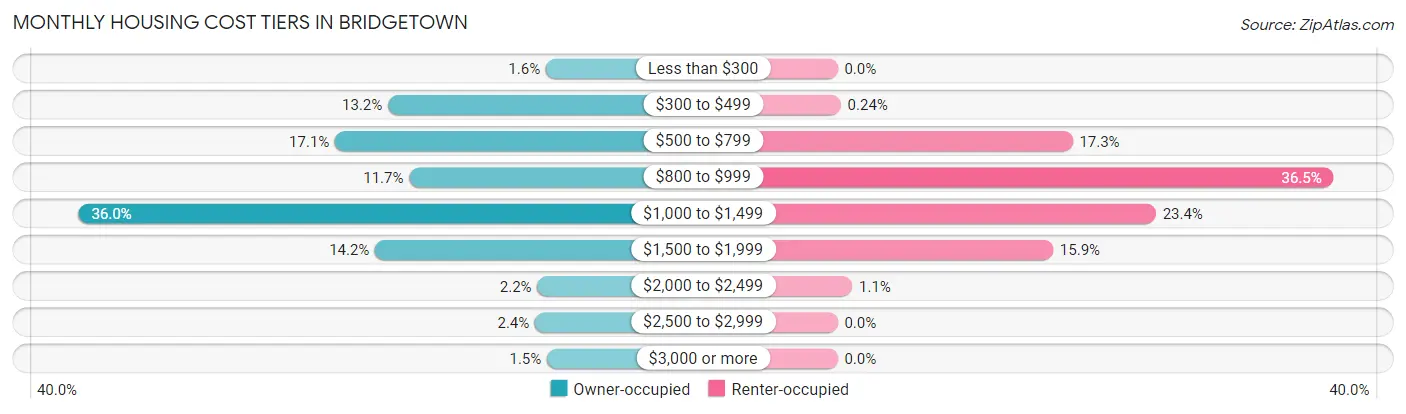
| Monthly Cost | Owner-occupied | Renter-occupied |
| Less than $300 | 74 (1.6%) | 0 (0.0%) |
| $300 to $499 | 611 (13.2%) | 2 (0.2%) |
| $500 to $799 | 791 (17.1%) | 144 (17.3%) |
| $800 to $999 | 539 (11.7%) | 304 (36.5%) |
| $1,000 to $1,499 | 1,664 (36.0%) | 195 (23.4%) |
| $1,500 to $1,999 | 655 (14.2%) | 132 (15.9%) |
| $2,000 to $2,499 | 103 (2.2%) | 9 (1.1%) |
| $2,500 to $2,999 | 111 (2.4%) | 0 (0.0%) |
| $3,000 or more | 70 (1.5%) | 0 (0.0%) |
| Total | 4,618 (100.0%) | 832 (100.0%) |
Physical Housing Characteristics in Bridgetown
Housing Structures in Bridgetown
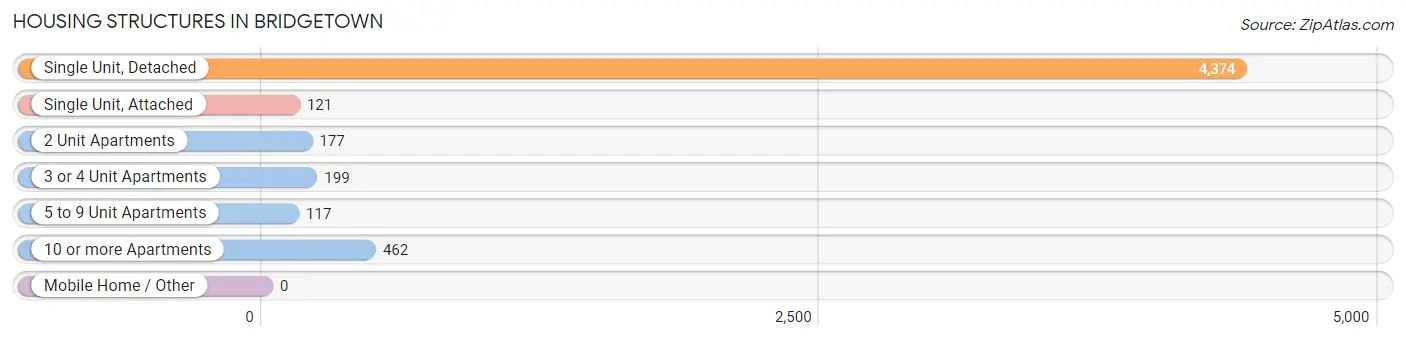
| Structure Type | # Housing Units | % Housing Units |
| Single Unit, Detached | 4,374 | 80.3% |
| Single Unit, Attached | 121 | 2.2% |
| 2 Unit Apartments | 177 | 3.3% |
| 3 or 4 Unit Apartments | 199 | 3.6% |
| 5 to 9 Unit Apartments | 117 | 2.1% |
| 10 or more Apartments | 462 | 8.5% |
| Mobile Home / Other | 0 | 0.0% |
| Total | 5,450 | 100.0% |
Housing Structures by Occupancy in Bridgetown
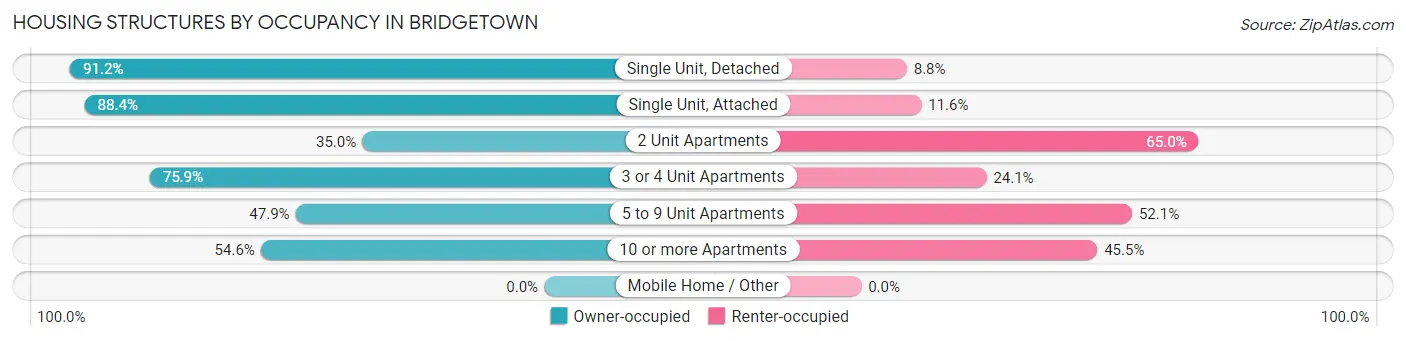
| Structure Type | Owner-occupied | Renter-occupied |
| Single Unit, Detached | 3,990 (91.2%) | 384 (8.8%) |
| Single Unit, Attached | 107 (88.4%) | 14 (11.6%) |
| 2 Unit Apartments | 62 (35.0%) | 115 (65.0%) |
| 3 or 4 Unit Apartments | 151 (75.9%) | 48 (24.1%) |
| 5 to 9 Unit Apartments | 56 (47.9%) | 61 (52.1%) |
| 10 or more Apartments | 252 (54.5%) | 210 (45.5%) |
| Mobile Home / Other | 0 (0.0%) | 0 (0.0%) |
| Total | 4,618 (84.7%) | 832 (15.3%) |
Housing Structures by Number of Rooms in Bridgetown
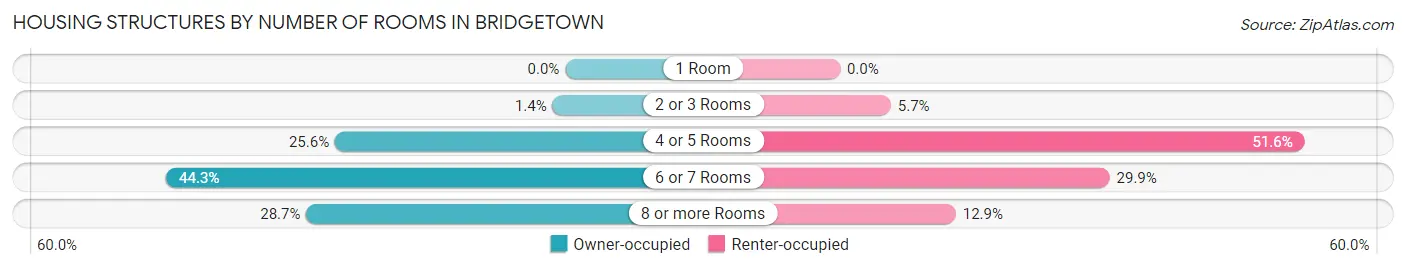
| Number of Rooms | Owner-occupied | Renter-occupied |
| 1 Room | 0 (0.0%) | 0 (0.0%) |
| 2 or 3 Rooms | 65 (1.4%) | 47 (5.7%) |
| 4 or 5 Rooms | 1,180 (25.6%) | 429 (51.6%) |
| 6 or 7 Rooms | 2,046 (44.3%) | 249 (29.9%) |
| 8 or more Rooms | 1,327 (28.7%) | 107 (12.9%) |
| Total | 4,618 (100.0%) | 832 (100.0%) |
Housing Structure by Heating Type in Bridgetown
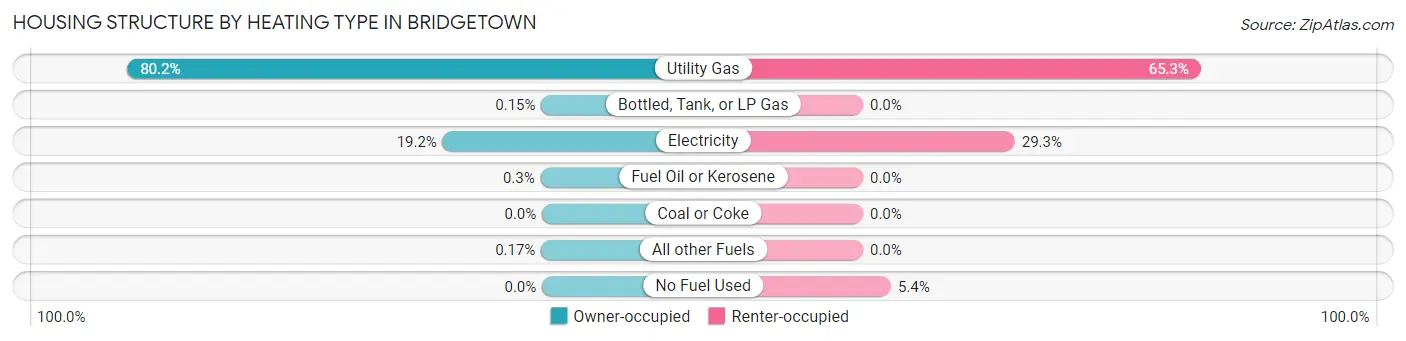
| Heating Type | Owner-occupied | Renter-occupied |
| Utility Gas | 3,702 (80.2%) | 543 (65.3%) |
| Bottled, Tank, or LP Gas | 7 (0.2%) | 0 (0.0%) |
| Electricity | 887 (19.2%) | 244 (29.3%) |
| Fuel Oil or Kerosene | 14 (0.3%) | 0 (0.0%) |
| Coal or Coke | 0 (0.0%) | 0 (0.0%) |
| All other Fuels | 8 (0.2%) | 0 (0.0%) |
| No Fuel Used | 0 (0.0%) | 45 (5.4%) |
| Total | 4,618 (100.0%) | 832 (100.0%) |
Household Vehicle Usage in Bridgetown
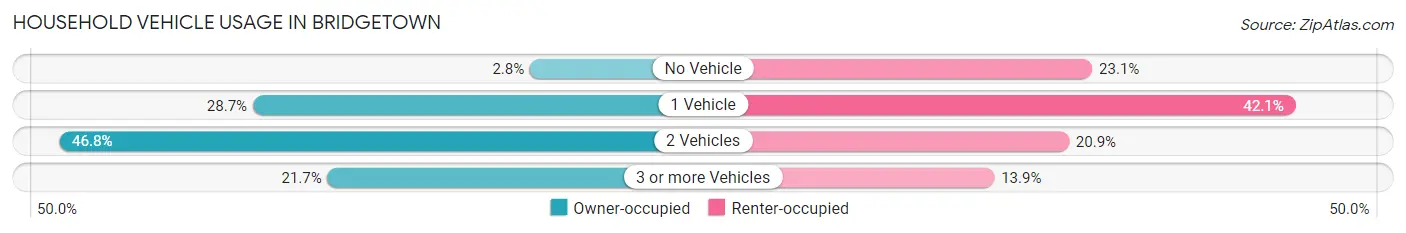
| Vehicles per Household | Owner-occupied | Renter-occupied |
| No Vehicle | 130 (2.8%) | 192 (23.1%) |
| 1 Vehicle | 1,325 (28.7%) | 350 (42.1%) |
| 2 Vehicles | 2,160 (46.8%) | 174 (20.9%) |
| 3 or more Vehicles | 1,003 (21.7%) | 116 (13.9%) |
| Total | 4,618 (100.0%) | 832 (100.0%) |
Real Estate & Mortgages in Bridgetown
Real Estate and Mortgage Overview in Bridgetown
| Characteristic | Without Mortgage | With Mortgage |
| Housing Units | 1,561 | 3,057 |
| Median Property Value | $169,600 | $155,000 |
| Median Household Income | $67,147 | $375 |
| Monthly Housing Costs | $558 | $70 |
| Real Estate Taxes | $2,596 | $37 |
Property Value by Mortgage Status in Bridgetown
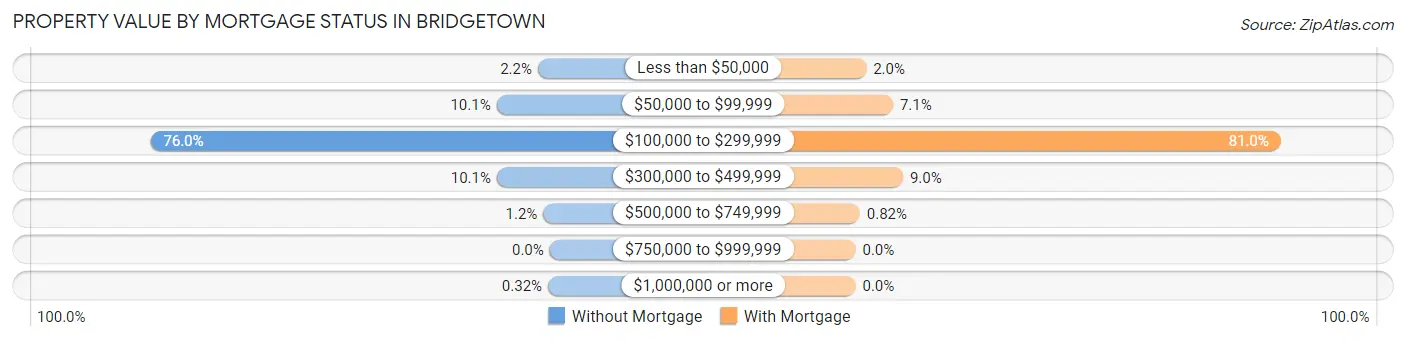
| Property Value | Without Mortgage | With Mortgage |
| Less than $50,000 | 35 (2.2%) | 62 (2.0%) |
| $50,000 to $99,999 | 158 (10.1%) | 218 (7.1%) |
| $100,000 to $299,999 | 1,187 (76.0%) | 2,476 (81.0%) |
| $300,000 to $499,999 | 157 (10.1%) | 276 (9.0%) |
| $500,000 to $749,999 | 19 (1.2%) | 25 (0.8%) |
| $750,000 to $999,999 | 0 (0.0%) | 0 (0.0%) |
| $1,000,000 or more | 5 (0.3%) | 0 (0.0%) |
| Total | 1,561 (100.0%) | 3,057 (100.0%) |
Household Income by Mortgage Status in Bridgetown
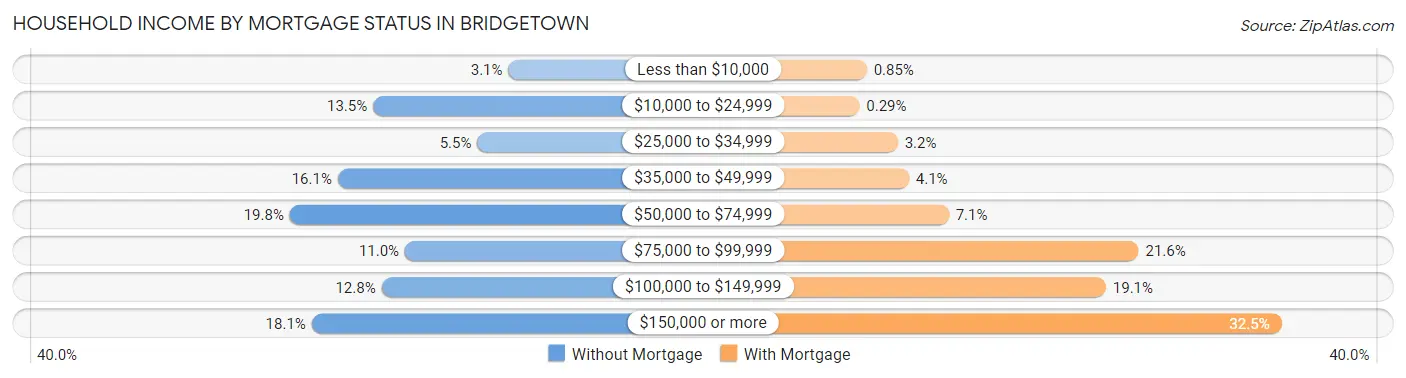
| Household Income | Without Mortgage | With Mortgage |
| Less than $10,000 | 49 (3.1%) | 26 (0.9%) |
| $10,000 to $24,999 | 210 (13.5%) | 9 (0.3%) |
| $25,000 to $34,999 | 86 (5.5%) | 98 (3.2%) |
| $35,000 to $49,999 | 252 (16.1%) | 124 (4.1%) |
| $50,000 to $74,999 | 309 (19.8%) | 217 (7.1%) |
| $75,000 to $99,999 | 172 (11.0%) | 659 (21.6%) |
| $100,000 to $149,999 | 200 (12.8%) | 583 (19.1%) |
| $150,000 or more | 283 (18.1%) | 992 (32.5%) |
| Total | 1,561 (100.0%) | 3,057 (100.0%) |
Property Value to Household Income Ratio in Bridgetown
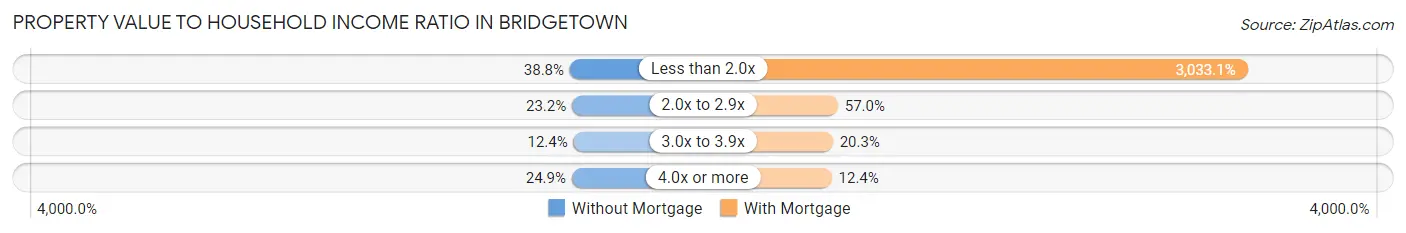
| Value-to-Income Ratio | Without Mortgage | With Mortgage |
| Less than 2.0x | 606 (38.8%) | 92,721 (3,033.1%) |
| 2.0x to 2.9x | 362 (23.2%) | 1,741 (57.0%) |
| 3.0x to 3.9x | 194 (12.4%) | 619 (20.3%) |
| 4.0x or more | 389 (24.9%) | 380 (12.4%) |
| Total | 1,561 (100.0%) | 3,057 (100.0%) |
Real Estate Taxes by Mortgage Status in Bridgetown
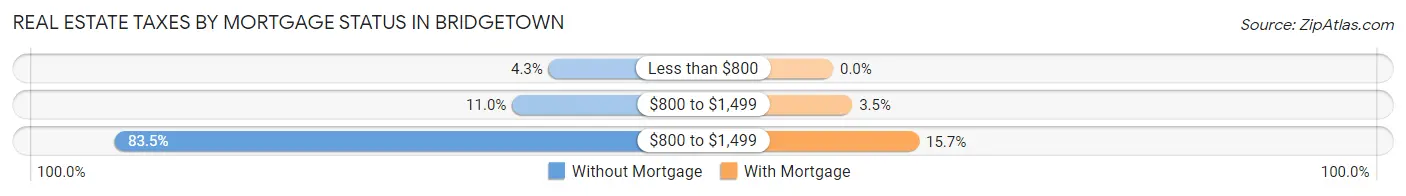
| Property Taxes | Without Mortgage | With Mortgage |
| Less than $800 | 67 (4.3%) | 0 (0.0%) |
| $800 to $1,499 | 171 (11.0%) | 107 (3.5%) |
| $800 to $1,499 | 1,303 (83.5%) | 480 (15.7%) |
| Total | 1,561 (100.0%) | 3,057 (100.0%) |
Health & Disability in Bridgetown
Health Insurance Coverage by Age in Bridgetown
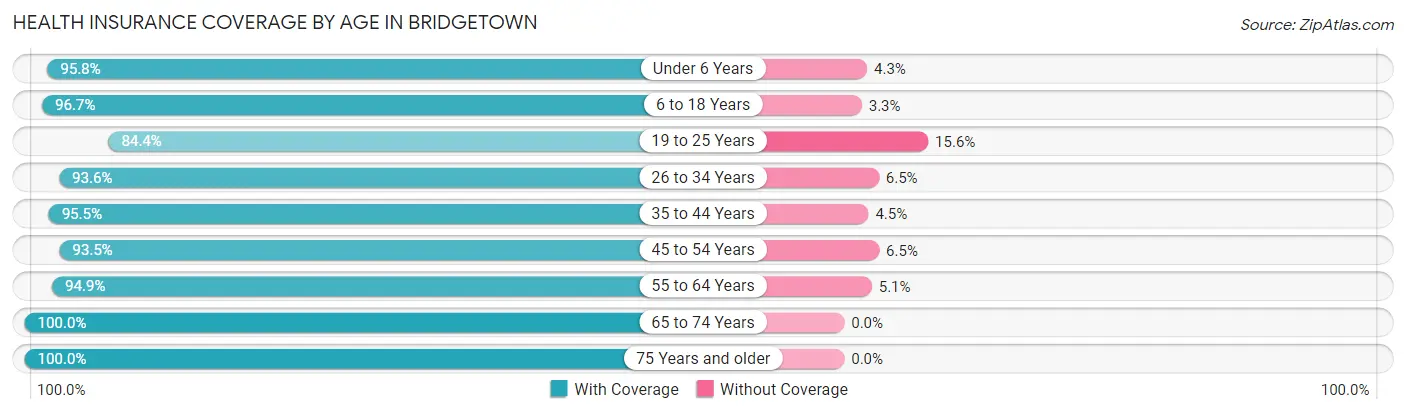
| Age Bracket | With Coverage | Without Coverage |
| Under 6 Years | 812 (95.8%) | 36 (4.3%) |
| 6 to 18 Years | 2,585 (96.7%) | 87 (3.3%) |
| 19 to 25 Years | 847 (84.4%) | 157 (15.6%) |
| 26 to 34 Years | 1,609 (93.5%) | 111 (6.5%) |
| 35 to 44 Years | 1,610 (95.5%) | 76 (4.5%) |
| 45 to 54 Years | 1,525 (93.5%) | 106 (6.5%) |
| 55 to 64 Years | 1,462 (94.9%) | 79 (5.1%) |
| 65 to 74 Years | 1,561 (100.0%) | 0 (0.0%) |
| 75 Years and older | 852 (100.0%) | 0 (0.0%) |
| Total | 12,863 (95.2%) | 652 (4.8%) |
Health Insurance Coverage by Citizenship Status in Bridgetown
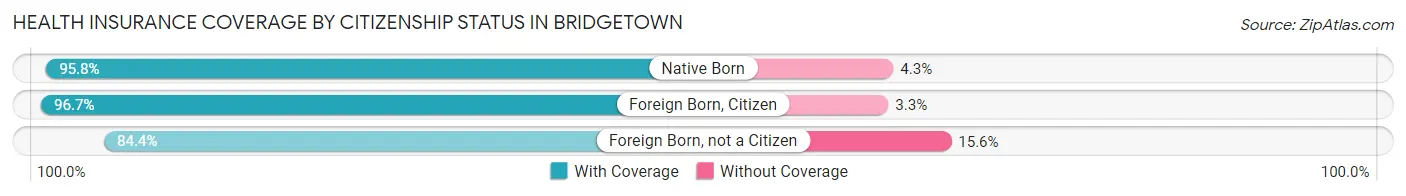
| Citizenship Status | With Coverage | Without Coverage |
| Native Born | 812 (95.8%) | 36 (4.3%) |
| Foreign Born, Citizen | 2,585 (96.7%) | 87 (3.3%) |
| Foreign Born, not a Citizen | 847 (84.4%) | 157 (15.6%) |
Health Insurance Coverage by Household Income in Bridgetown
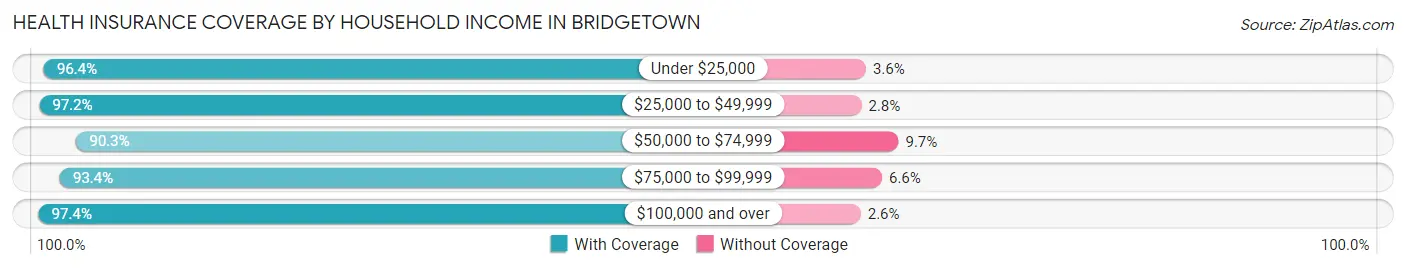
| Household Income | With Coverage | Without Coverage |
| Under $25,000 | 563 (96.4%) | 21 (3.6%) |
| $25,000 to $49,999 | 1,724 (97.2%) | 49 (2.8%) |
| $50,000 to $74,999 | 2,611 (90.3%) | 280 (9.7%) |
| $75,000 to $99,999 | 2,009 (93.4%) | 142 (6.6%) |
| $100,000 and over | 5,956 (97.4%) | 160 (2.6%) |
Public vs Private Health Insurance Coverage by Age in Bridgetown
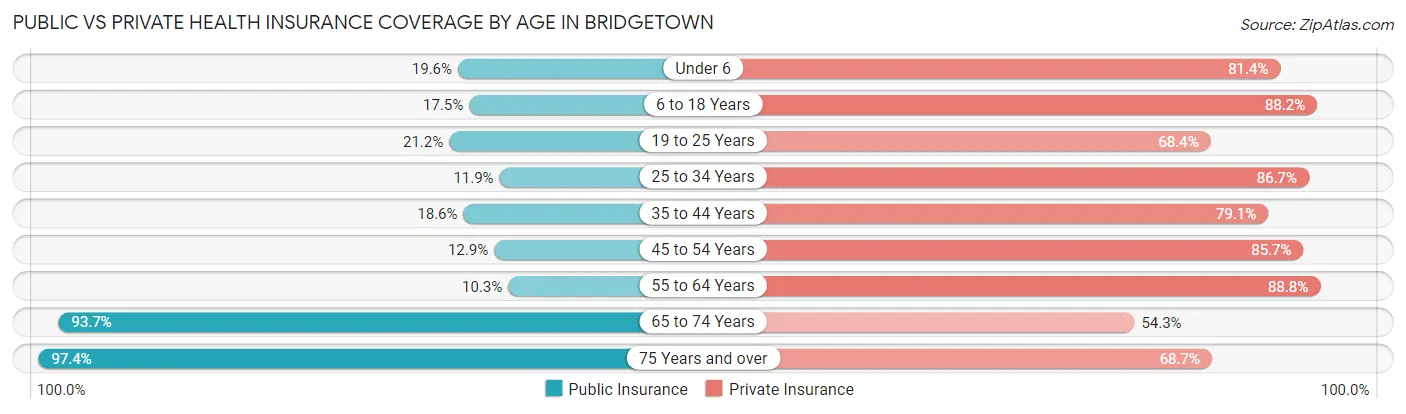
| Age Bracket | Public Insurance | Private Insurance |
| Under 6 | 166 (19.6%) | 690 (81.4%) |
| 6 to 18 Years | 468 (17.5%) | 2,357 (88.2%) |
| 19 to 25 Years | 213 (21.2%) | 687 (68.4%) |
| 25 to 34 Years | 204 (11.9%) | 1,491 (86.7%) |
| 35 to 44 Years | 313 (18.6%) | 1,334 (79.1%) |
| 45 to 54 Years | 210 (12.9%) | 1,397 (85.7%) |
| 55 to 64 Years | 158 (10.2%) | 1,368 (88.8%) |
| 65 to 74 Years | 1,463 (93.7%) | 848 (54.3%) |
| 75 Years and over | 830 (97.4%) | 585 (68.7%) |
| Total | 4,025 (29.8%) | 10,757 (79.6%) |
Disability Status by Sex by Age in Bridgetown
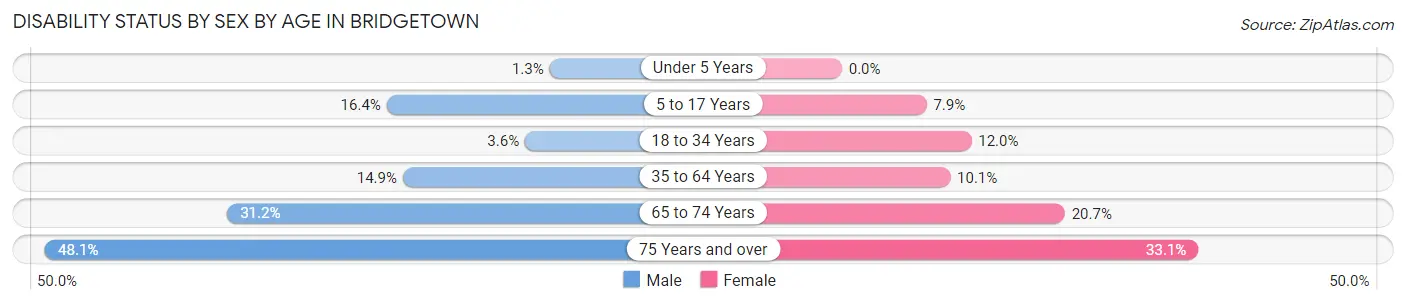
| Age Bracket | Male | Female |
| Under 5 Years | 6 (1.3%) | 0 (0.0%) |
| 5 to 17 Years | 215 (16.4%) | 102 (7.9%) |
| 18 to 34 Years | 51 (3.6%) | 171 (12.0%) |
| 35 to 64 Years | 368 (14.9%) | 240 (10.1%) |
| 65 to 74 Years | 223 (31.2%) | 175 (20.7%) |
| 75 Years and over | 164 (48.1%) | 169 (33.1%) |
Disability Class by Sex by Age in Bridgetown
Disability Class: Hearing Difficulty
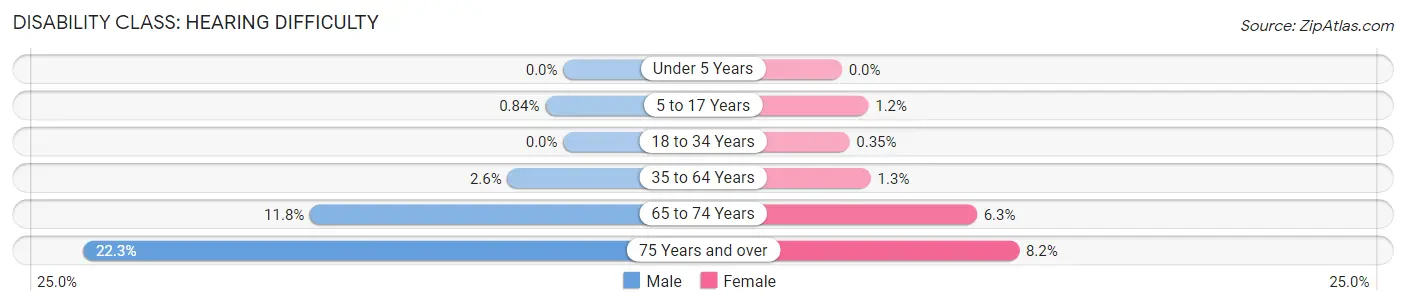
| Age Bracket | Male | Female |
| Under 5 Years | 0 (0.0%) | 0 (0.0%) |
| 5 to 17 Years | 11 (0.8%) | 16 (1.2%) |
| 18 to 34 Years | 0 (0.0%) | 5 (0.4%) |
| 35 to 64 Years | 64 (2.6%) | 32 (1.3%) |
| 65 to 74 Years | 84 (11.7%) | 53 (6.3%) |
| 75 Years and over | 76 (22.3%) | 42 (8.2%) |
Disability Class: Vision Difficulty
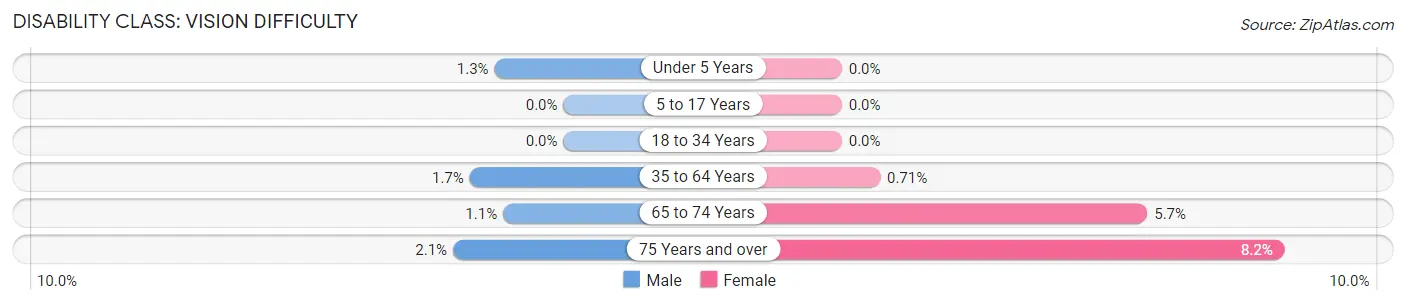
| Age Bracket | Male | Female |
| Under 5 Years | 6 (1.3%) | 0 (0.0%) |
| 5 to 17 Years | 0 (0.0%) | 0 (0.0%) |
| 18 to 34 Years | 0 (0.0%) | 0 (0.0%) |
| 35 to 64 Years | 43 (1.7%) | 17 (0.7%) |
| 65 to 74 Years | 8 (1.1%) | 48 (5.7%) |
| 75 Years and over | 7 (2.1%) | 42 (8.2%) |
Disability Class: Cognitive Difficulty
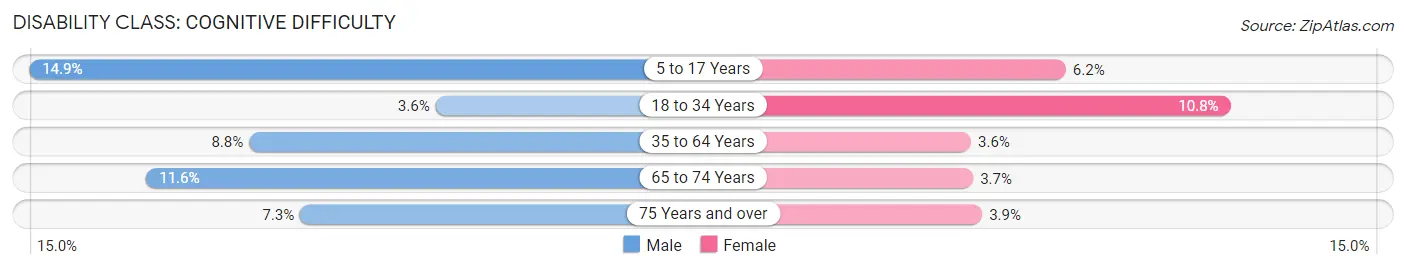
| Age Bracket | Male | Female |
| 5 to 17 Years | 195 (14.9%) | 81 (6.2%) |
| 18 to 34 Years | 51 (3.6%) | 154 (10.8%) |
| 35 to 64 Years | 216 (8.7%) | 86 (3.6%) |
| 65 to 74 Years | 83 (11.6%) | 31 (3.7%) |
| 75 Years and over | 25 (7.3%) | 20 (3.9%) |
Disability Class: Ambulatory Difficulty
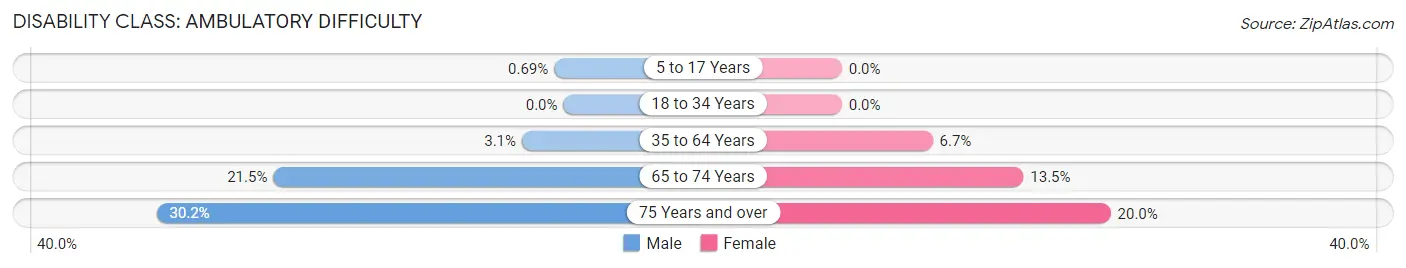
| Age Bracket | Male | Female |
| 5 to 17 Years | 9 (0.7%) | 0 (0.0%) |
| 18 to 34 Years | 0 (0.0%) | 0 (0.0%) |
| 35 to 64 Years | 76 (3.1%) | 161 (6.7%) |
| 65 to 74 Years | 154 (21.5%) | 114 (13.5%) |
| 75 Years and over | 103 (30.2%) | 102 (20.0%) |
Disability Class: Self-Care Difficulty
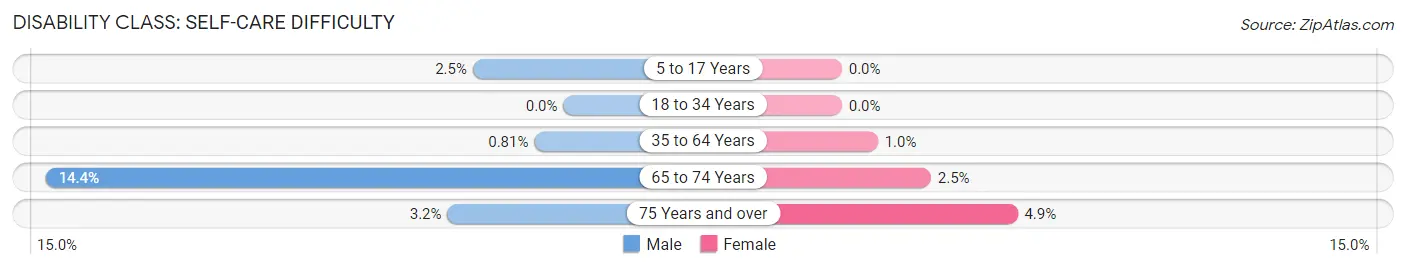
| Age Bracket | Male | Female |
| 5 to 17 Years | 33 (2.5%) | 0 (0.0%) |
| 18 to 34 Years | 0 (0.0%) | 0 (0.0%) |
| 35 to 64 Years | 20 (0.8%) | 24 (1.0%) |
| 65 to 74 Years | 103 (14.4%) | 21 (2.5%) |
| 75 Years and over | 11 (3.2%) | 25 (4.9%) |
Technology Access in Bridgetown
Computing Device Access in Bridgetown
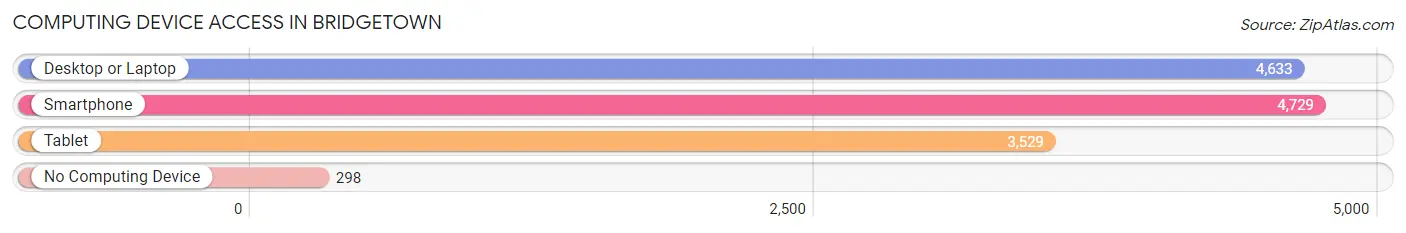
| Device Type | # Households | % Households |
| Desktop or Laptop | 4,633 | 85.0% |
| Smartphone | 4,729 | 86.8% |
| Tablet | 3,529 | 64.7% |
| No Computing Device | 298 | 5.5% |
| Total | 5,450 | 100.0% |
Internet Access in Bridgetown
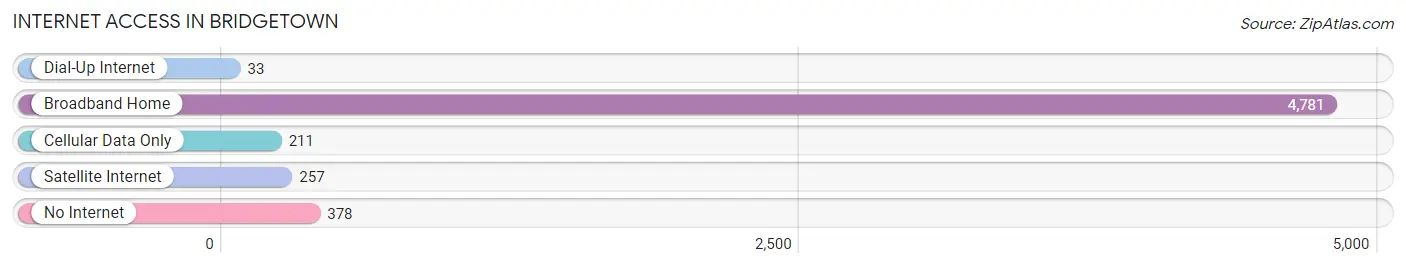
| Internet Type | # Households | % Households |
| Dial-Up Internet | 33 | 0.6% |
| Broadband Home | 4,781 | 87.7% |
| Cellular Data Only | 211 | 3.9% |
| Satellite Internet | 257 | 4.7% |
| No Internet | 378 | 6.9% |
| Total | 5,450 | 100.0% |
Bridgetown Summary
Bridgetown, Ohio is a small village located in Hamilton County, Ohio. It is situated on the west side of the city of Cincinnati, and is part of the Cincinnati metropolitan area. The village has a population of approximately 4,000 people, and is home to a variety of businesses, including a number of small retail stores, restaurants, and other services.
History
Bridgetown was founded in 1817 by a group of settlers from Pennsylvania. The village was named after the nearby Bridgetown Creek, which was named after the Irish immigrants who settled in the area. The village was originally a farming community, and the settlers grew a variety of crops, including corn, wheat, and oats.
In the late 19th century, the village began to grow and develop. The Cincinnati, Hamilton, and Dayton Railroad was built through the village in 1881, and this helped to spur economic growth. The village was incorporated in 1891, and the population grew to over 1,000 by the turn of the century.
In the early 20th century, the village continued to grow and develop. The village was home to a number of businesses, including a number of small retail stores, restaurants, and other services. The village also had a number of churches, schools, and other civic organizations.
Geography
Bridgetown is located in Hamilton County, Ohio. It is situated on the west side of the city of Cincinnati, and is part of the Cincinnati metropolitan area. The village is located on the banks of the Bridgetown Creek, and is surrounded by a number of small hills and valleys. The village is located at an elevation of 845 feet above sea level.
The climate in Bridgetown is classified as humid continental, with hot summers and cold winters. The average annual temperature is around 54 degrees Fahrenheit, and the average annual precipitation is around 40 inches.
Economy
The economy of Bridgetown is largely based on small businesses and services. The village is home to a number of small retail stores, restaurants, and other services. The village also has a number of churches, schools, and other civic organizations.
The village is also home to a number of manufacturing companies, including a number of automotive parts suppliers. The village is also home to a number of small technology companies, including a number of software development firms.
Demographics
As of the 2010 census, the population of Bridgetown was 4,000 people. The racial makeup of the village was 94.3% White, 1.7% African American, 0.2% Native American, 0.7% Asian, 0.1% Pacific Islander, and 2.1% from other races. The median household income was $50,000, and the median family income was $60,000.
The village is home to a number of churches, including the Bridgetown United Methodist Church, the Bridgetown Presbyterian Church, and the Bridgetown Baptist Church. The village is also home to a number of schools, including the Bridgetown Elementary School, the Bridgetown Middle School, and the Bridgetown High School.
Conclusion
Bridgetown, Ohio is a small village located in Hamilton County, Ohio. It is situated on the west side of the city of Cincinnati, and is part of the Cincinnati metropolitan area. The village has a population of approximately 4,000 people, and is home to a variety of businesses, including a number of small retail stores, restaurants, and other services. The economy of Bridgetown is largely based on small businesses and services, and the village is home to a number of churches, schools, and other civic organizations. The racial makeup of the village is 94.3% White, 1.7% African American, 0.2% Native American, 0.7% Asian, 0.1% Pacific Islander, and 2.1% from other races. The median household income was $50,000, and the median family income was $60,000.
Common Questions
What is Per Capita Income in Bridgetown?
Per Capita income in Bridgetown is $37,482.
What is the Median Family Income in Bridgetown?
Median Family Income in Bridgetown is $85,521.
What is the Median Household income in Bridgetown?
Median Household Income in Bridgetown is $76,270.
What is Income or Wage Gap in Bridgetown?
Income or Wage Gap in Bridgetown is 23.3%.
Women in Bridgetown earn 76.7 cents for every dollar earned by a man.
What is Inequality or Gini Index in Bridgetown?
Inequality or Gini Index in Bridgetown is 0.37.
What is the Total Population of Bridgetown?
Total Population of Bridgetown is 13,526.
What is the Total Male Population of Bridgetown?
Total Male Population of Bridgetown is 6,748.
What is the Total Female Population of Bridgetown?
Total Female Population of Bridgetown is 6,778.
What is the Ratio of Males per 100 Females in Bridgetown?
There are 99.56 Males per 100 Females in Bridgetown.
What is the Ratio of Females per 100 Males in Bridgetown?
There are 100.44 Females per 100 Males in Bridgetown.
What is the Median Population Age in Bridgetown?
Median Population Age in Bridgetown is 36.9 Years.
What is the Average Family Size in Bridgetown
Average Family Size in Bridgetown is 3.1 People.
What is the Average Household Size in Bridgetown
Average Household Size in Bridgetown is 2.5 People.
How Large is the Labor Force in Bridgetown?
There are 7,146 People in the Labor Forcein in Bridgetown.
What is the Percentage of People in the Labor Force in Bridgetown?
67.6% of People are in the Labor Force in Bridgetown.
What is the Unemployment Rate in Bridgetown?
Unemployment Rate in Bridgetown is 3.1%.