Dent, OH Map & Demographics
Dent Map
Dent Overview
$43,223
PER CAPITA INCOME
$107,219
AVG FAMILY INCOME
$80,321
AVG HOUSEHOLD INCOME
27.3%
WAGE / INCOME GAP [ % ]
72.7¢/ $1
WAGE / INCOME GAP [ $ ]
0.42
INEQUALITY / GINI INDEX
11,666
TOTAL POPULATION
5,556
MALE POPULATION
6,110
FEMALE POPULATION
90.93
MALES / 100 FEMALES
109.97
FEMALES / 100 MALES
40.9
MEDIAN AGE
3.0
AVG FAMILY SIZE
2.4
AVG HOUSEHOLD SIZE
5,802
LABOR FORCE [ PEOPLE ]
64.7%
PERCENT IN LABOR FORCE
4.5%
UNEMPLOYMENT RATE
Income in Dent
Income Overview in Dent
Per Capita Income in Dent is $43,223, while median incomes of families and households are $107,219 and $80,321 respectively.
| Characteristic | Number | Measure |
| Per Capita Income | 11,666 | $43,223 |
| Median Family Income | 3,065 | $107,219 |
| Mean Family Income | 3,065 | $127,001 |
| Median Household Income | 4,856 | $80,321 |
| Mean Household Income | 4,856 | $103,822 |
| Income Deficit | 3,065 | $0 |
| Wage / Income Gap (%) | 11,666 | 27.33% |
| Wage / Income Gap ($) | 11,666 | 72.67¢ per $1 |
| Gini / Inequality Index | 11,666 | 0.42 |
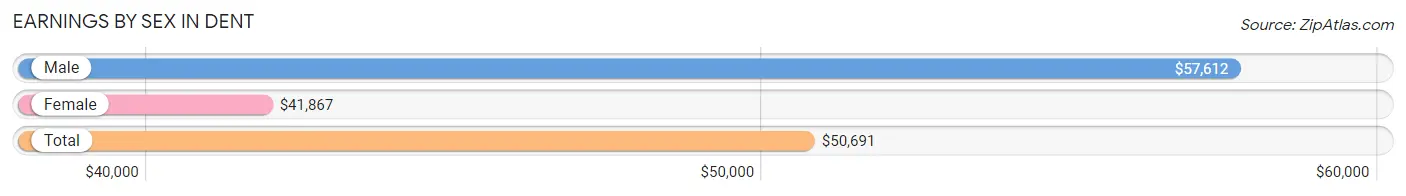
Earnings by Sex in Dent
Average Earnings in Dent are $50,691, $57,612 for men and $41,867 for women, a difference of 27.3%.
| Sex | Number | Average Earnings |
| Male | 3,201 (51.7%) | $57,612 |
| Female | 2,991 (48.3%) | $41,867 |
| Total | 6,192 (100.0%) | $50,691 |
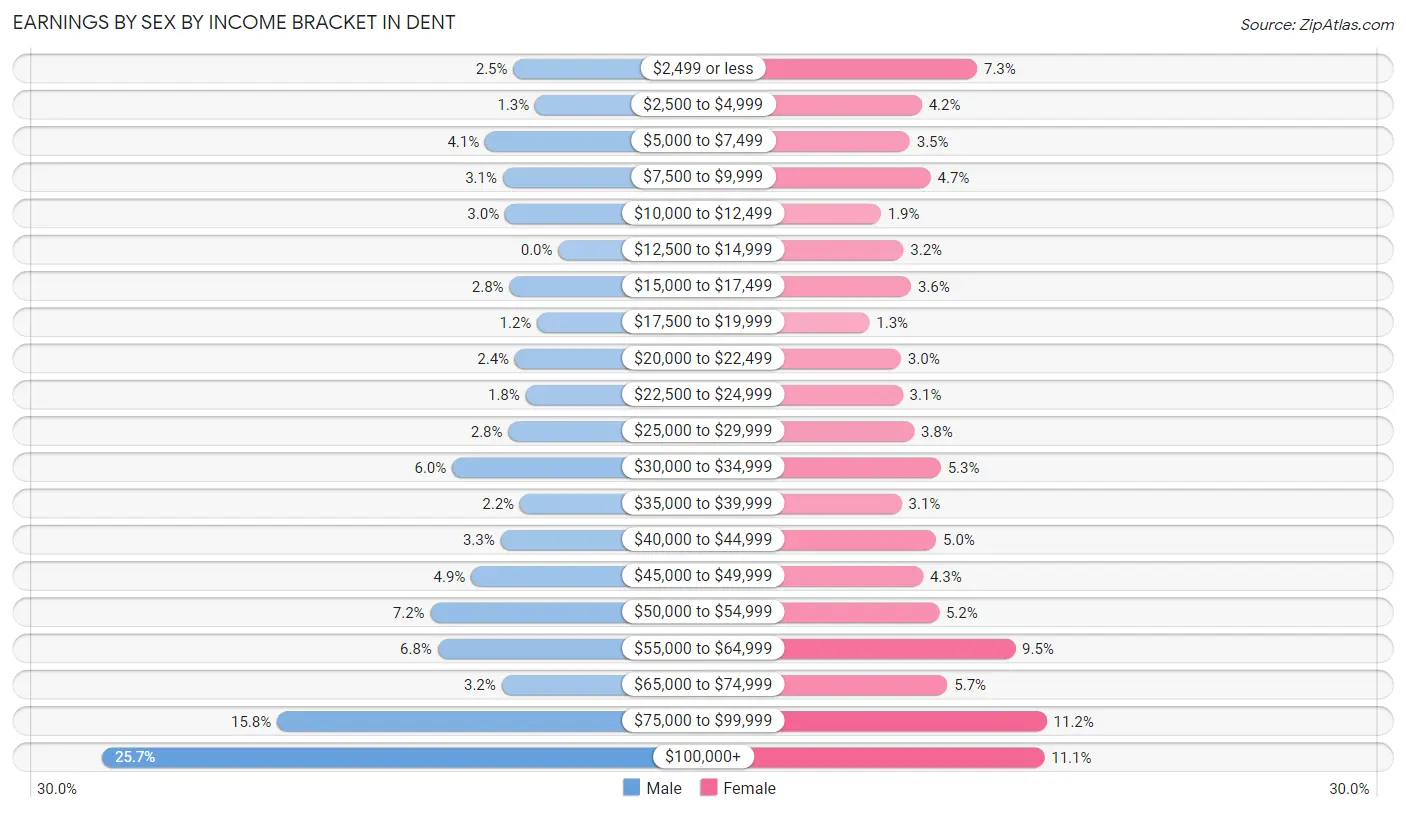
Earnings by Sex by Income Bracket in Dent
The most common earnings brackets in Dent are $100,000+ for men (821 | 25.7%) and $75,000 to $99,999 for women (336 | 11.2%).
| Income | Male | Female |
| $2,499 or less | 81 (2.5%) | 219 (7.3%) |
| $2,500 to $4,999 | 42 (1.3%) | 126 (4.2%) |
| $5,000 to $7,499 | 132 (4.1%) | 106 (3.5%) |
| $7,500 to $9,999 | 100 (3.1%) | 141 (4.7%) |
| $10,000 to $12,499 | 96 (3.0%) | 57 (1.9%) |
| $12,500 to $14,999 | 0 (0.0%) | 95 (3.2%) |
| $15,000 to $17,499 | 88 (2.8%) | 108 (3.6%) |
| $17,500 to $19,999 | 38 (1.2%) | 38 (1.3%) |
| $20,000 to $22,499 | 78 (2.4%) | 91 (3.0%) |
| $22,500 to $24,999 | 59 (1.8%) | 94 (3.1%) |
| $25,000 to $29,999 | 90 (2.8%) | 113 (3.8%) |
| $30,000 to $34,999 | 191 (6.0%) | 158 (5.3%) |
| $35,000 to $39,999 | 69 (2.2%) | 92 (3.1%) |
| $40,000 to $44,999 | 104 (3.3%) | 150 (5.0%) |
| $45,000 to $49,999 | 157 (4.9%) | 128 (4.3%) |
| $50,000 to $54,999 | 230 (7.2%) | 155 (5.2%) |
| $55,000 to $64,999 | 217 (6.8%) | 283 (9.5%) |
| $65,000 to $74,999 | 102 (3.2%) | 169 (5.7%) |
| $75,000 to $99,999 | 506 (15.8%) | 336 (11.2%) |
| $100,000+ | 821 (25.7%) | 332 (11.1%) |
| Total | 3,201 (100.0%) | 2,991 (100.0%) |
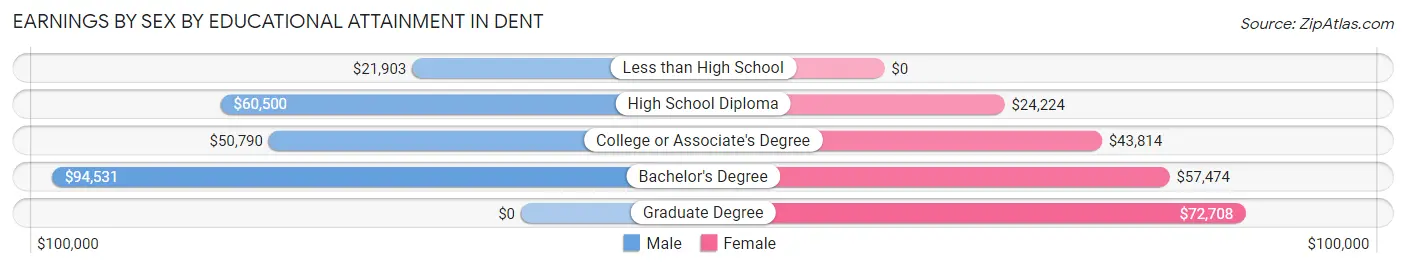
Earnings by Sex by Educational Attainment in Dent
Average earnings in Dent are $61,964 for men and $46,772 for women, a difference of 24.5%. Men with an educational attainment of bachelor's degree enjoy the highest average annual earnings of $94,531, while those with less than high school education earn the least with $21,903. Women with an educational attainment of graduate degree earn the most with the average annual earnings of $72,708, while those with high school diploma education have the smallest earnings of $24,224.
| Educational Attainment | Male Income | Female Income |
| Less than High School | $21,903 | $0 |
| High School Diploma | $60,500 | $24,224 |
| College or Associate's Degree | $50,790 | $43,814 |
| Bachelor's Degree | $94,531 | $57,474 |
| Graduate Degree | - | - |
| Total | $61,964 | $46,772 |
Family Income in Dent
Family Income Brackets in Dent
According to the Dent family income data, there are 622 families falling into the $100,000 to $149,999 income range, which is the most common income bracket and makes up 20.3% of all families.
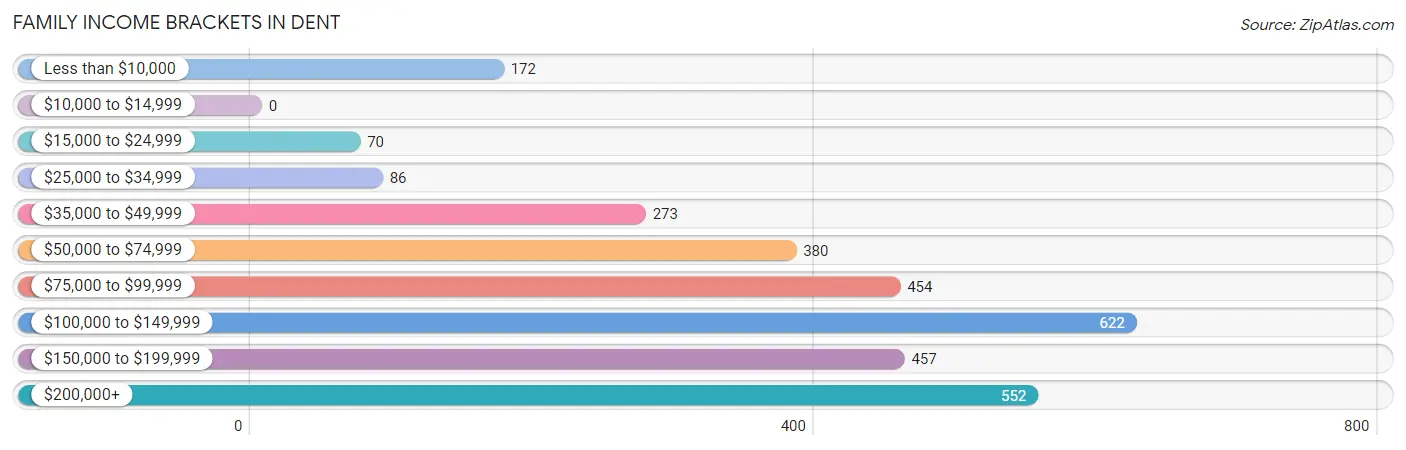
| Income Bracket | # Families | % Families |
| Less than $10,000 | 172 | 5.6% |
| $10,000 to $14,999 | 0 | 0.0% |
| $15,000 to $24,999 | 70 | 2.3% |
| $25,000 to $34,999 | 86 | 2.8% |
| $35,000 to $49,999 | 273 | 8.9% |
| $50,000 to $74,999 | 380 | 12.4% |
| $75,000 to $99,999 | 454 | 14.8% |
| $100,000 to $149,999 | 622 | 20.3% |
| $150,000 to $199,999 | 457 | 14.9% |
| $200,000+ | 552 | 18.0% |
Family Income by Famaliy Size in Dent
5-person families (288 | 9.4%) account for the highest median family income in Dent with $203,438 per family, while 4-person families (375 | 12.2%) have the highest median income of $48,149 per family member.
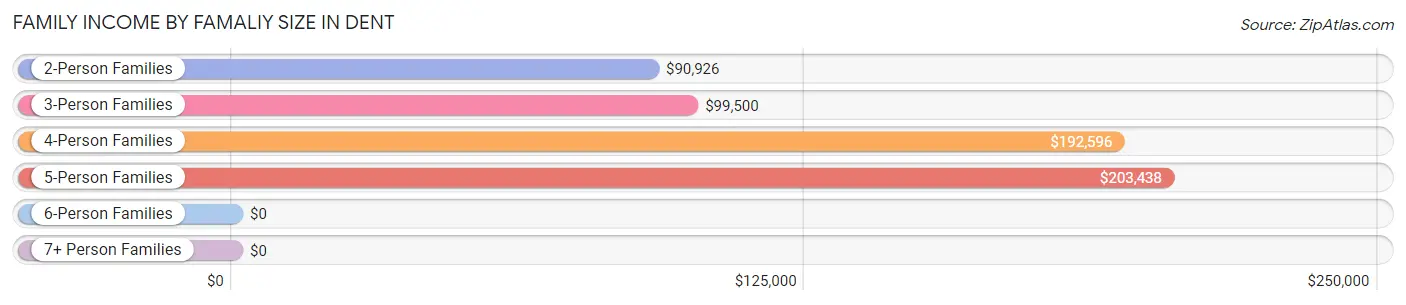
| Income Bracket | # Families | Median Income |
| 2-Person Families | 1,514 (49.4%) | $90,926 |
| 3-Person Families | 696 (22.7%) | $99,500 |
| 4-Person Families | 375 (12.2%) | $192,596 |
| 5-Person Families | 288 (9.4%) | $203,438 |
| 6-Person Families | 129 (4.2%) | $0 |
| 7+ Person Families | 63 (2.1%) | $0 |
| Total | 3,065 (100.0%) | $107,219 |
Family Income by Number of Earners in Dent
The median family income in Dent is $107,219, with families comprising 3+ earners (362) having the highest median family income of $210,556, while families with no earners (483) have the lowest median family income of $62,788, accounting for 11.8% and 15.8% of families, respectively.
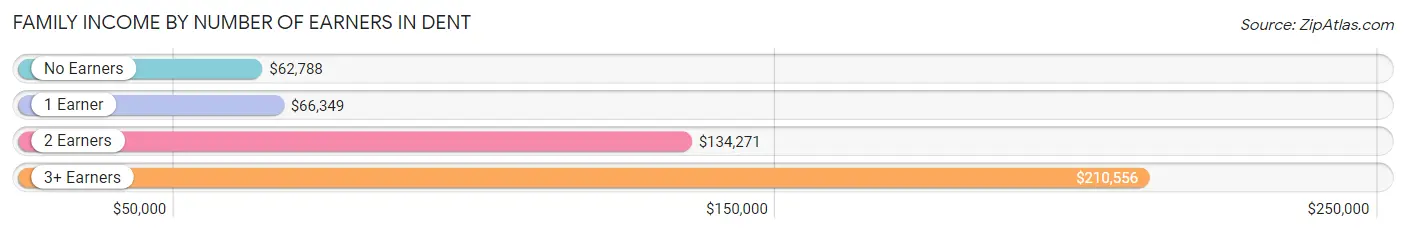
| Number of Earners | # Families | Median Income |
| No Earners | 483 (15.8%) | $62,788 |
| 1 Earner | 787 (25.7%) | $66,349 |
| 2 Earners | 1,433 (46.8%) | $134,271 |
| 3+ Earners | 362 (11.8%) | $210,556 |
| Total | 3,065 (100.0%) | $107,219 |
Household Income in Dent
Household Income Brackets in Dent
With 826 households falling in the category, the $100,000 to $149,999 income range is the most frequent in Dent, accounting for 17.0% of all households. In contrast, only 87 households (1.8%) fall into the $10,000 to $14,999 income bracket, making it the least populous group.
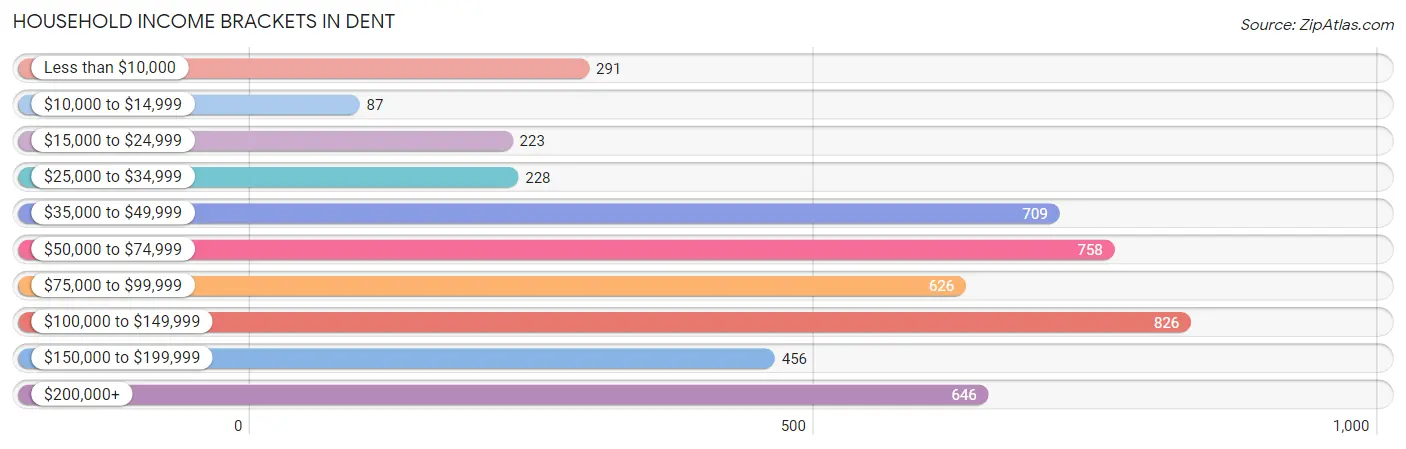
| Income Bracket | # Households | % Households |
| Less than $10,000 | 291 | 6.0% |
| $10,000 to $14,999 | 87 | 1.8% |
| $15,000 to $24,999 | 223 | 4.6% |
| $25,000 to $34,999 | 228 | 4.7% |
| $35,000 to $49,999 | 709 | 14.6% |
| $50,000 to $74,999 | 758 | 15.6% |
| $75,000 to $99,999 | 626 | 12.9% |
| $100,000 to $149,999 | 826 | 17.0% |
| $150,000 to $199,999 | 456 | 9.4% |
| $200,000+ | 646 | 13.3% |
Household Income by Householder Age in Dent
The median household income in Dent is $80,321, with the highest median household income of $119,236 found in the 45 to 64 years age bracket for the primary householder. A total of 1,617 households (33.3%) fall into this category. Meanwhile, the 15 to 24 years age bracket for the primary householder has the lowest median household income of $0, with 20 households (0.4%) in this group.
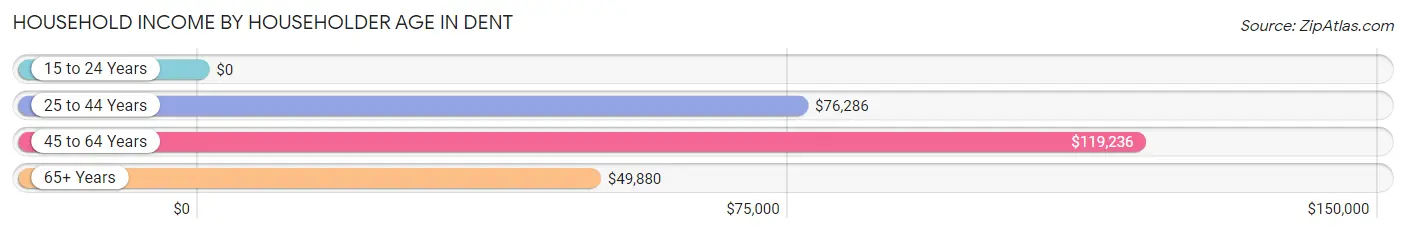
| Income Bracket | # Households | Median Income |
| 15 to 24 Years | 20 (0.4%) | $0 |
| 25 to 44 Years | 1,518 (31.3%) | $76,286 |
| 45 to 64 Years | 1,617 (33.3%) | $119,236 |
| 65+ Years | 1,701 (35.0%) | $49,880 |
| Total | 4,856 (100.0%) | $80,321 |
Poverty in Dent
Income Below Poverty by Sex and Age in Dent
With 7.7% poverty level for males and 8.4% for females among the residents of Dent, 15 year old males and 16 and 17 year old females are the most vulnerable to poverty, with 19 males (50.0%) and 43 females (19.5%) in their respective age groups living below the poverty level.
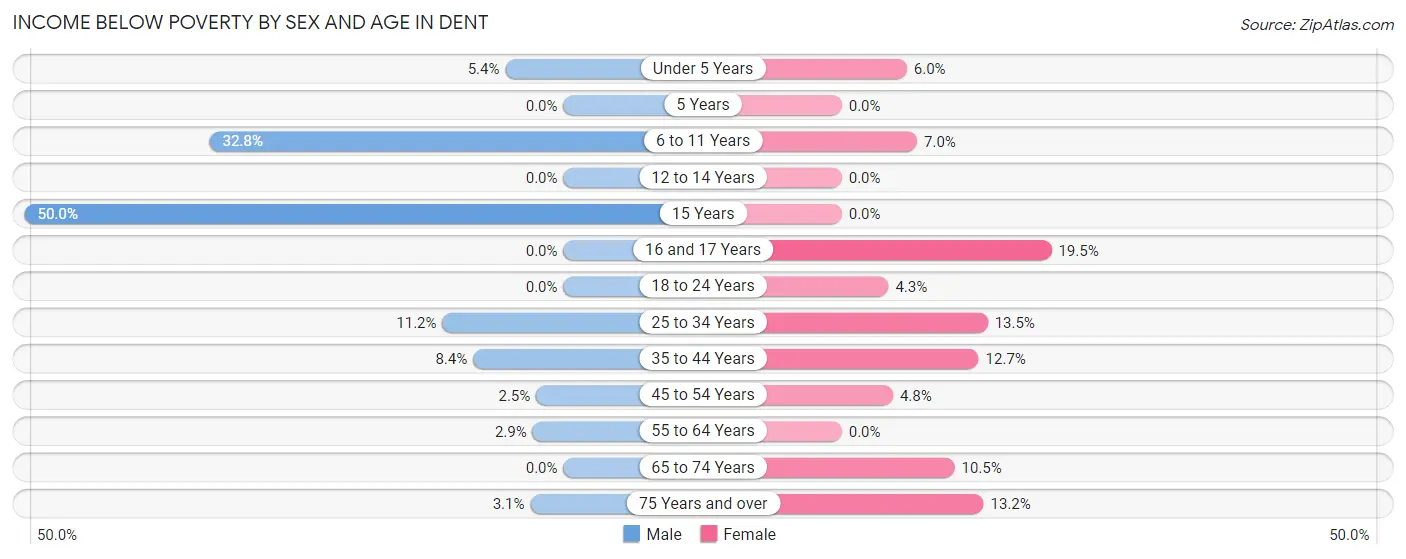
| Age Bracket | Male | Female |
| Under 5 Years | 26 (5.4%) | 32 (6.0%) |
| 5 Years | 0 (0.0%) | 0 (0.0%) |
| 6 to 11 Years | 196 (32.8%) | 27 (7.0%) |
| 12 to 14 Years | 0 (0.0%) | 0 (0.0%) |
| 15 Years | 19 (50.0%) | 0 (0.0%) |
| 16 and 17 Years | 0 (0.0%) | 43 (19.5%) |
| 18 to 24 Years | 0 (0.0%) | 10 (4.3%) |
| 25 to 34 Years | 72 (11.2%) | 99 (13.5%) |
| 35 to 44 Years | 64 (8.4%) | 94 (12.7%) |
| 45 to 54 Years | 14 (2.5%) | 27 (4.8%) |
| 55 to 64 Years | 24 (2.9%) | 0 (0.0%) |
| 65 to 74 Years | 0 (0.0%) | 81 (10.5%) |
| 75 Years and over | 12 (3.1%) | 90 (13.2%) |
| Total | 427 (7.7%) | 503 (8.4%) |
Income Above Poverty by Sex and Age in Dent
According to the poverty statistics in Dent, males aged 5 years and females aged 5 years are the age groups that are most secure financially, with 100.0% of males and 100.0% of females in these age groups living above the poverty line.
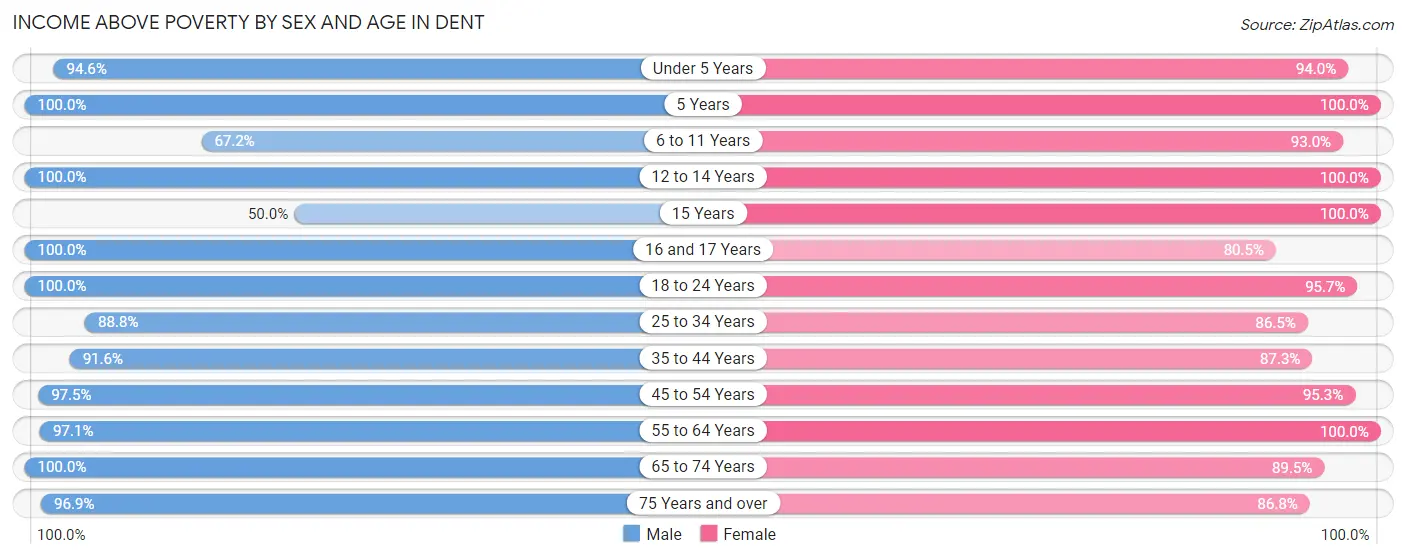
| Age Bracket | Male | Female |
| Under 5 Years | 456 (94.6%) | 498 (94.0%) |
| 5 Years | 50 (100.0%) | 107 (100.0%) |
| 6 to 11 Years | 401 (67.2%) | 359 (93.0%) |
| 12 to 14 Years | 210 (100.0%) | 119 (100.0%) |
| 15 Years | 19 (50.0%) | 30 (100.0%) |
| 16 and 17 Years | 137 (100.0%) | 178 (80.5%) |
| 18 to 24 Years | 211 (100.0%) | 221 (95.7%) |
| 25 to 34 Years | 569 (88.8%) | 632 (86.5%) |
| 35 to 44 Years | 700 (91.6%) | 646 (87.3%) |
| 45 to 54 Years | 539 (97.5%) | 542 (95.3%) |
| 55 to 64 Years | 816 (97.1%) | 838 (100.0%) |
| 65 to 74 Years | 642 (100.0%) | 693 (89.5%) |
| 75 Years and over | 379 (96.9%) | 594 (86.8%) |
| Total | 5,129 (92.3%) | 5,457 (91.6%) |
Income Below Poverty Among Married-Couple Families in Dent
The poverty statistics for married-couple families in Dent show that 3.6% or 89 of the total 2,483 families live below the poverty line. Families with 5 or more children have the highest poverty rate of 71.4%, comprising of 45 families. On the other hand, families with 3 or 4 children have the lowest poverty rate of 0.0%, which includes 0 families.
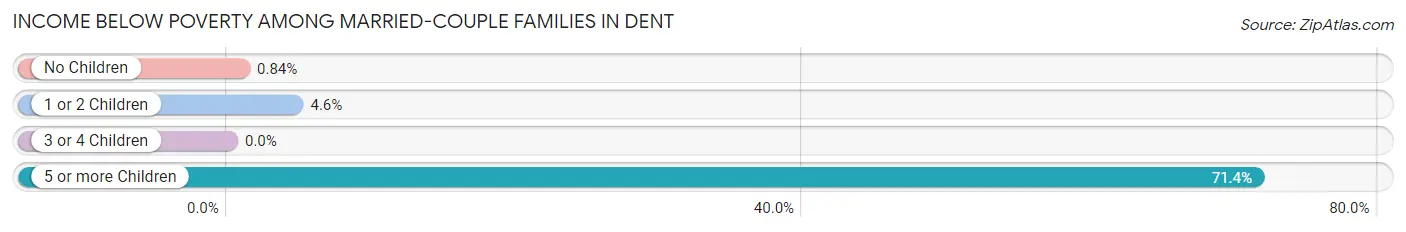
| Children | Above Poverty | Below Poverty |
| No Children | 1,416 (99.2%) | 12 (0.8%) |
| 1 or 2 Children | 669 (95.4%) | 32 (4.6%) |
| 3 or 4 Children | 291 (100.0%) | 0 (0.0%) |
| 5 or more Children | 18 (28.6%) | 45 (71.4%) |
| Total | 2,394 (96.4%) | 89 (3.6%) |
Income Below Poverty Among Single-Parent Households in Dent
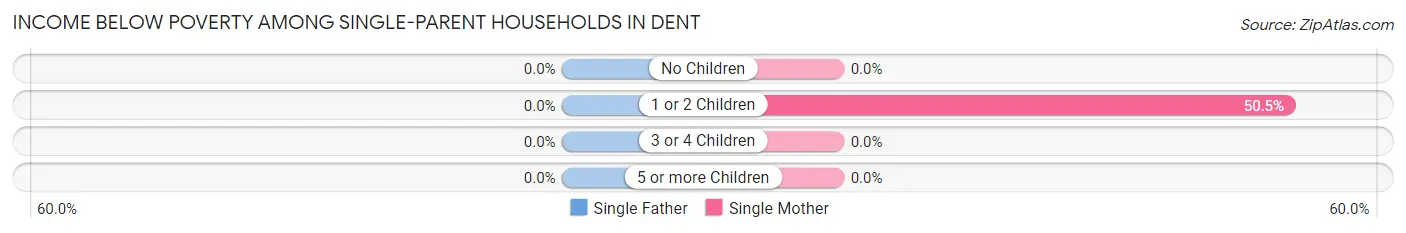
| Children | Single Father | Single Mother |
| No Children | 0 (0.0%) | 0 (0.0%) |
| 1 or 2 Children | 0 (0.0%) | 95 (50.5%) |
| 3 or 4 Children | 0 (0.0%) | 0 (0.0%) |
| 5 or more Children | 0 (0.0%) | 0 (0.0%) |
| Total | 0 (0.0%) | 95 (24.5%) |
Income Below Poverty Among Married-Couple vs Single-Parent Households in Dent
The poverty data for Dent shows that 89 of the married-couple family households (3.6%) and 95 of the single-parent households (16.3%) are living below the poverty level. Within the married-couple family households, those with 5 or more children have the highest poverty rate, with 45 households (71.4%) falling below the poverty line. Among the single-parent households, those with 1 or 2 children have the highest poverty rate, with 95 household (33.6%) living below poverty.
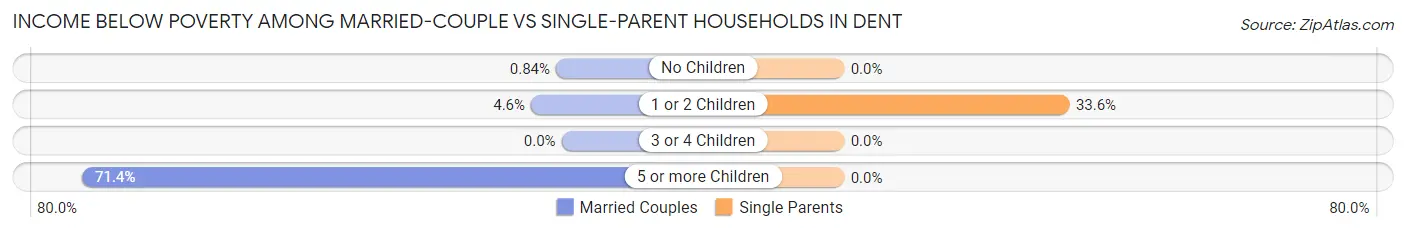
| Children | Married-Couple Families | Single-Parent Households |
| No Children | 12 (0.8%) | 0 (0.0%) |
| 1 or 2 Children | 32 (4.6%) | 95 (33.6%) |
| 3 or 4 Children | 0 (0.0%) | 0 (0.0%) |
| 5 or more Children | 45 (71.4%) | 0 (0.0%) |
| Total | 89 (3.6%) | 95 (16.3%) |
Race in Dent
The most populous races in Dent are White / Caucasian (10,913 | 93.5%), Two or more Races (351 | 3.0%), and Black / African American (326 | 2.8%).
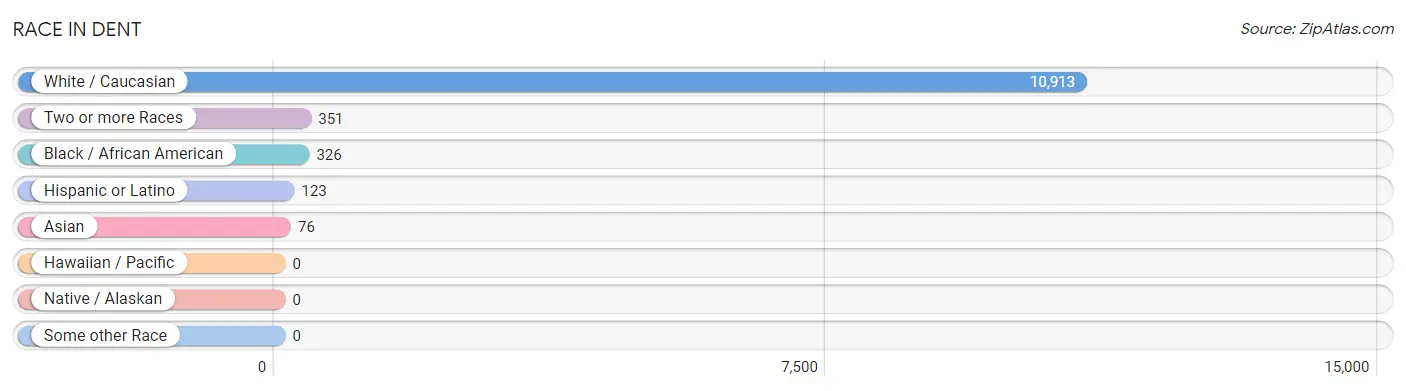
| Race | # Population | % Population |
| Asian | 76 | 0.6% |
| Black / African American | 326 | 2.8% |
| Hawaiian / Pacific | 0 | 0.0% |
| Hispanic or Latino | 123 | 1.1% |
| Native / Alaskan | 0 | 0.0% |
| White / Caucasian | 10,913 | 93.5% |
| Two or more Races | 351 | 3.0% |
| Some other Race | 0 | 0.0% |
| Total | 11,666 | 100.0% |
Ancestry in Dent
The most populous ancestries reported in Dent are German (5,184 | 44.4%), Irish (2,105 | 18.0%), Italian (1,082 | 9.3%), English (557 | 4.8%), and American (515 | 4.4%), together accounting for 80.9% of all Dent residents.
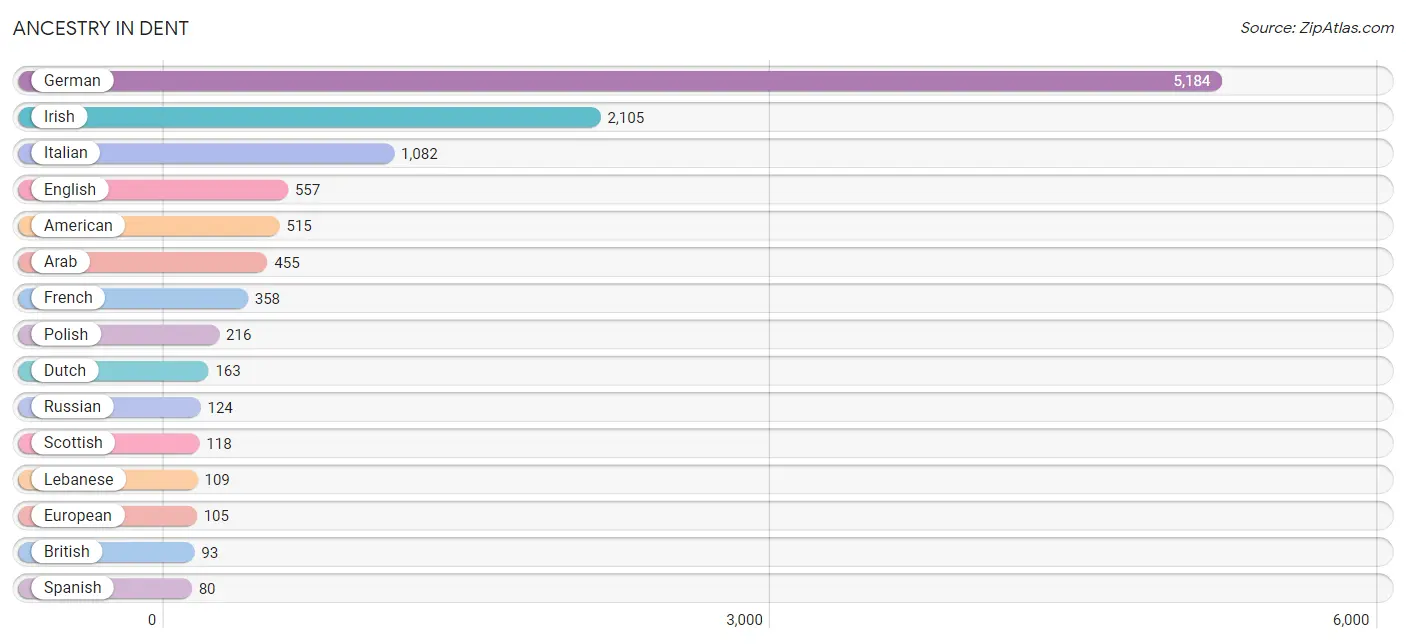
| Ancestry | # Population | % Population |
| African | 50 | 0.4% |
| American | 515 | 4.4% |
| Arab | 455 | 3.9% |
| Austrian | 25 | 0.2% |
| Bhutanese | 13 | 0.1% |
| British | 93 | 0.8% |
| Canadian | 11 | 0.1% |
| Cherokee | 4 | 0.0% |
| Cuban | 16 | 0.1% |
| Danish | 23 | 0.2% |
| Dutch | 163 | 1.4% |
| English | 557 | 4.8% |
| European | 105 | 0.9% |
| French | 358 | 3.1% |
| French Canadian | 13 | 0.1% |
| German | 5,184 | 44.4% |
| Greek | 42 | 0.4% |
| Hungarian | 9 | 0.1% |
| Indian (Asian) | 57 | 0.5% |
| Iraqi | 17 | 0.2% |
| Irish | 2,105 | 18.0% |
| Israeli | 9 | 0.1% |
| Italian | 1,082 | 9.3% |
| Korean | 12 | 0.1% |
| Lebanese | 109 | 0.9% |
| Macedonian | 59 | 0.5% |
| Mexican | 17 | 0.2% |
| Polish | 216 | 1.8% |
| Puerto Rican | 5 | 0.0% |
| Russian | 124 | 1.1% |
| Scandinavian | 6 | 0.1% |
| Scotch-Irish | 71 | 0.6% |
| Scottish | 118 | 1.0% |
| Slovene | 15 | 0.1% |
| Spaniard | 5 | 0.0% |
| Spanish | 80 | 0.7% |
| Sri Lankan | 9 | 0.1% |
| Subsaharan African | 50 | 0.4% |
| Swedish | 43 | 0.4% |
| Swiss | 11 | 0.1% |
| Turkish | 9 | 0.1% |
| Ukrainian | 4 | 0.0% |
| Welsh | 9 | 0.1% | View All 43 Rows |
Immigrants in Dent
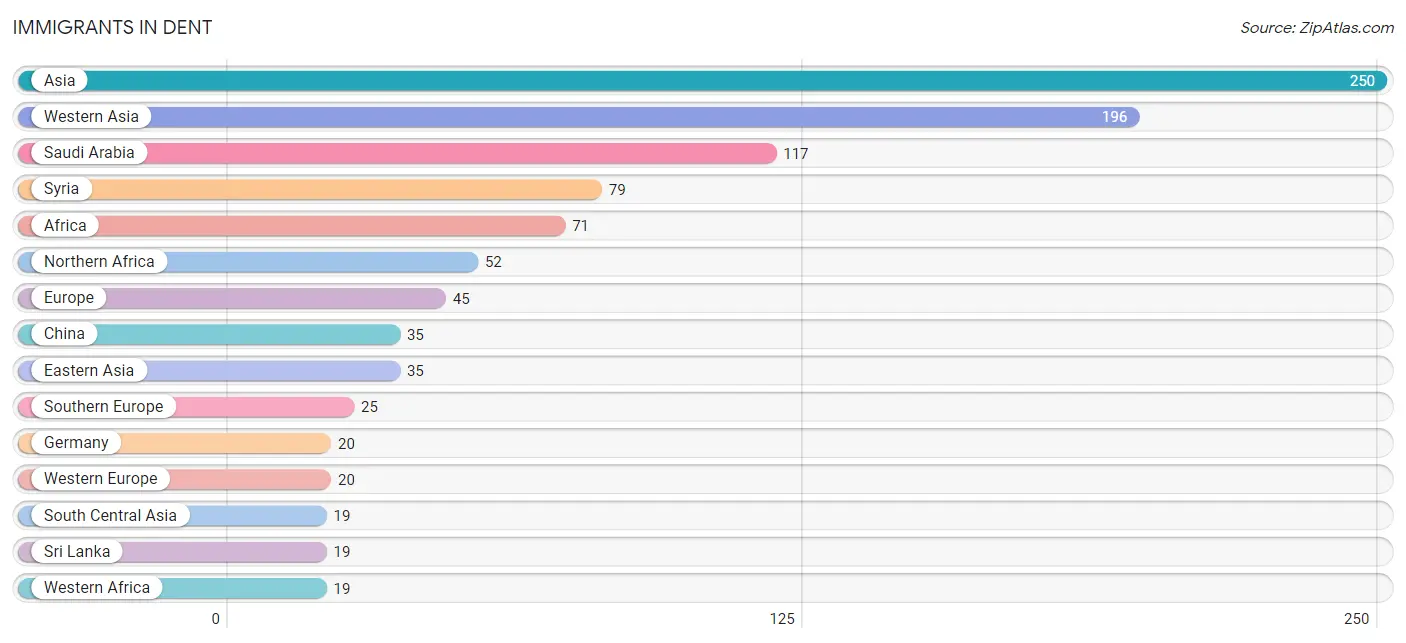
The most numerous immigrant groups reported in Dent came from Asia (250 | 2.1%), Western Asia (196 | 1.7%), Saudi Arabia (117 | 1.0%), Syria (79 | 0.7%), and Africa (71 | 0.6%), together accounting for 6.1% of all Dent residents.
| Immigration Origin | # Population | % Population |
| Africa | 71 | 0.6% |
| Asia | 250 | 2.1% |
| Canada | 9 | 0.1% |
| Caribbean | 16 | 0.1% |
| China | 35 | 0.3% |
| Cuba | 16 | 0.1% |
| Eastern Asia | 35 | 0.3% |
| Europe | 45 | 0.4% |
| Germany | 20 | 0.2% |
| Greece | 7 | 0.1% |
| Italy | 13 | 0.1% |
| Latin America | 16 | 0.1% |
| Northern Africa | 52 | 0.4% |
| Saudi Arabia | 117 | 1.0% |
| South Central Asia | 19 | 0.2% |
| Southern Europe | 25 | 0.2% |
| Spain | 5 | 0.0% |
| Sri Lanka | 19 | 0.2% |
| Syria | 79 | 0.7% |
| Western Africa | 19 | 0.2% |
| Western Asia | 196 | 1.7% |
| Western Europe | 20 | 0.2% | View All 22 Rows |
Sex and Age in Dent
Sex and Age in Dent
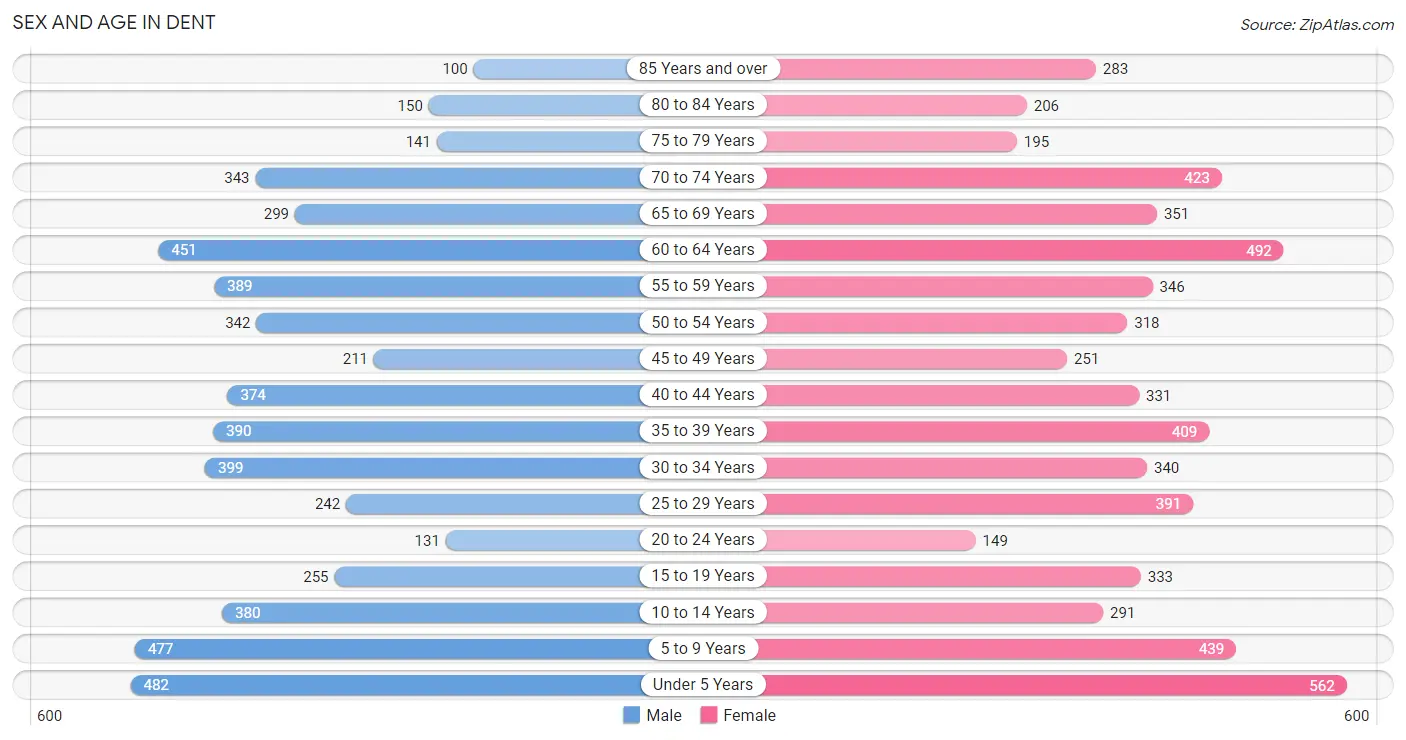
The most populous age groups in Dent are Under 5 Years (482 | 8.7%) for men and Under 5 Years (562 | 9.2%) for women.
| Age Bracket | Male | Female |
| Under 5 Years | 482 (8.7%) | 562 (9.2%) |
| 5 to 9 Years | 477 (8.6%) | 439 (7.2%) |
| 10 to 14 Years | 380 (6.8%) | 291 (4.8%) |
| 15 to 19 Years | 255 (4.6%) | 333 (5.4%) |
| 20 to 24 Years | 131 (2.4%) | 149 (2.4%) |
| 25 to 29 Years | 242 (4.4%) | 391 (6.4%) |
| 30 to 34 Years | 399 (7.2%) | 340 (5.6%) |
| 35 to 39 Years | 390 (7.0%) | 409 (6.7%) |
| 40 to 44 Years | 374 (6.7%) | 331 (5.4%) |
| 45 to 49 Years | 211 (3.8%) | 251 (4.1%) |
| 50 to 54 Years | 342 (6.2%) | 318 (5.2%) |
| 55 to 59 Years | 389 (7.0%) | 346 (5.7%) |
| 60 to 64 Years | 451 (8.1%) | 492 (8.1%) |
| 65 to 69 Years | 299 (5.4%) | 351 (5.7%) |
| 70 to 74 Years | 343 (6.2%) | 423 (6.9%) |
| 75 to 79 Years | 141 (2.5%) | 195 (3.2%) |
| 80 to 84 Years | 150 (2.7%) | 206 (3.4%) |
| 85 Years and over | 100 (1.8%) | 283 (4.6%) |
| Total | 5,556 (100.0%) | 6,110 (100.0%) |
Families and Households in Dent
Median Family Size in Dent
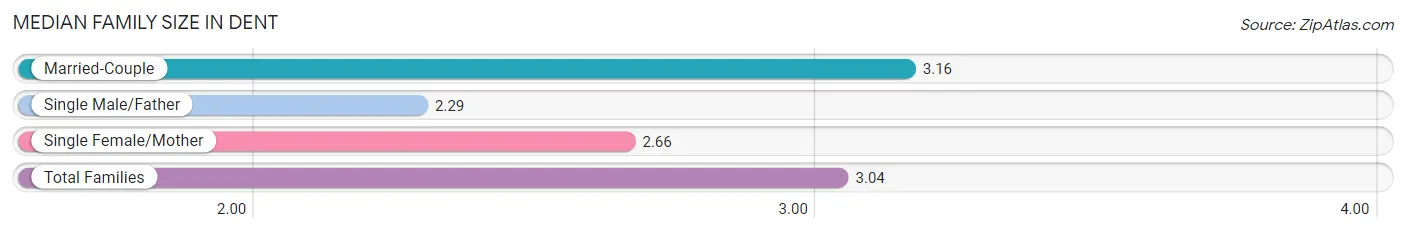
The median family size in Dent is 3.04 persons per family, with married-couple families (2,483 | 81.0%) accounting for the largest median family size of 3.16 persons per family. On the other hand, single male/father families (195 | 6.4%) represent the smallest median family size with 2.29 persons per family.
| Family Type | # Families | Family Size |
| Married-Couple | 2,483 (81.0%) | 3.16 |
| Single Male/Father | 195 (6.4%) | 2.29 |
| Single Female/Mother | 387 (12.6%) | 2.66 |
| Total Families | 3,065 (100.0%) | 3.04 |
Median Household Size in Dent
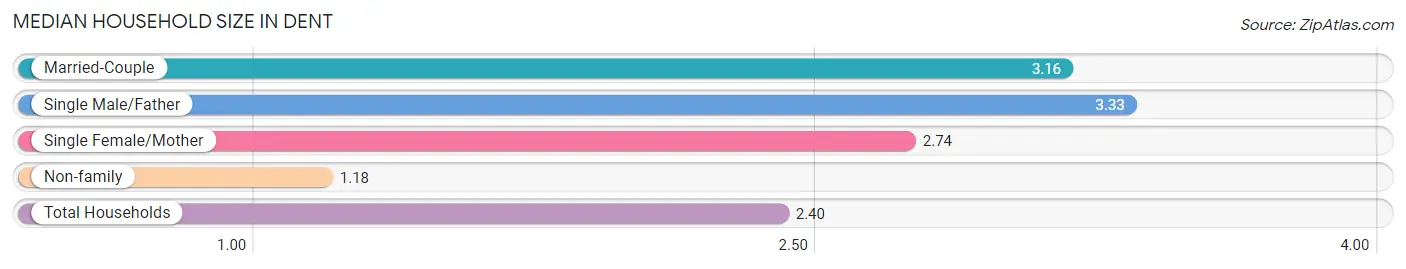
The median household size in Dent is 2.40 persons per household, with single male/father households (195 | 4.0%) accounting for the largest median household size of 3.33 persons per household. non-family households (1,791 | 36.9%) represent the smallest median household size with 1.18 persons per household.
| Household Type | # Households | Household Size |
| Married-Couple | 2,483 (51.1%) | 3.16 |
| Single Male/Father | 195 (4.0%) | 3.33 |
| Single Female/Mother | 387 (8.0%) | 2.74 |
| Non-family | 1,791 (36.9%) | 1.18 |
| Total Households | 4,856 (100.0%) | 2.40 |
Household Size by Marriage Status in Dent
Out of a total of 4,856 households in Dent, 3,065 (63.1%) are family households, while 1,791 (36.9%) are nonfamily households. The most numerous type of family households are 2-person households, comprising 1,492, and the most common type of nonfamily households are 1-person households, comprising 1,510.
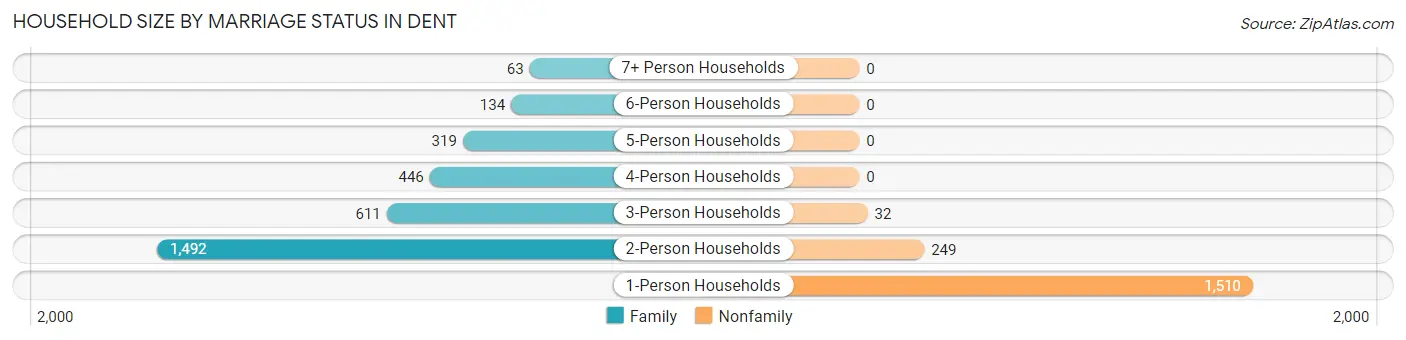
| Household Size | Family Households | Nonfamily Households |
| 1-Person Households | - | 1,510 (31.1%) |
| 2-Person Households | 1,492 (30.7%) | 249 (5.1%) |
| 3-Person Households | 611 (12.6%) | 32 (0.7%) |
| 4-Person Households | 446 (9.2%) | 0 (0.0%) |
| 5-Person Households | 319 (6.6%) | 0 (0.0%) |
| 6-Person Households | 134 (2.8%) | 0 (0.0%) |
| 7+ Person Households | 63 (1.3%) | 0 (0.0%) |
| Total | 3,065 (63.1%) | 1,791 (36.9%) |
Female Fertility in Dent
Fertility by Age in Dent
Average fertility rate in Dent is 48.0 births per 1,000 women. Women in the age bracket of 20 to 34 years have the highest fertility rate with 113.0 births per 1,000 women. Women in the age bracket of 20 to 34 years acount for 90.8% of all women with births.
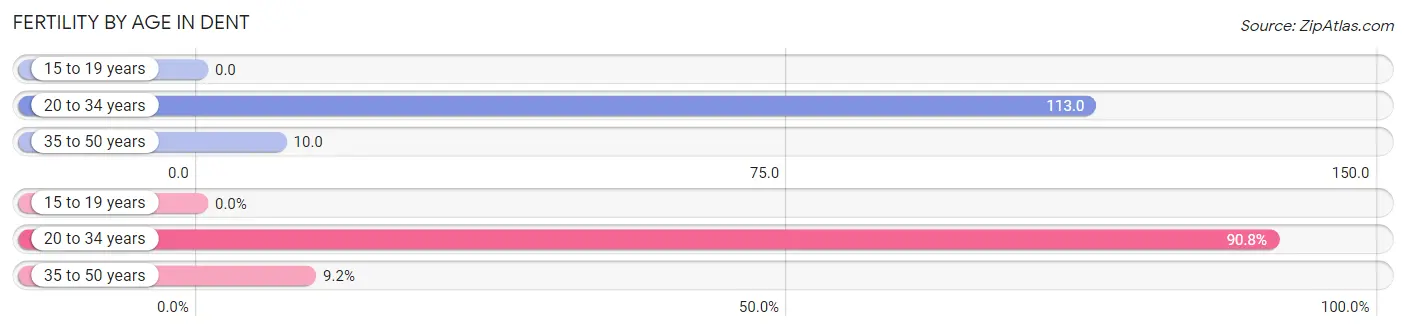
| Age Bracket | Women with Births | Births / 1,000 Women |
| 15 to 19 years | 0 (0.0%) | 0.0 |
| 20 to 34 years | 99 (90.8%) | 113.0 |
| 35 to 50 years | 10 (9.2%) | 10.0 |
| Total | 109 (100.0%) | 48.0 |
Fertility by Age by Marriage Status in Dent
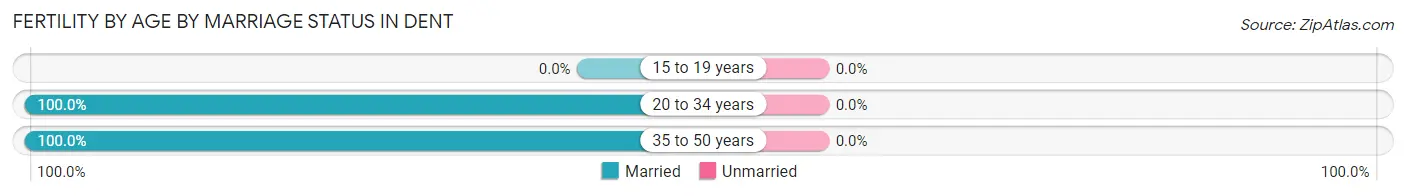
| Age Bracket | Married | Unmarried |
| 15 to 19 years | 0 (0.0%) | 0 (0.0%) |
| 20 to 34 years | 99 (100.0%) | 0 (0.0%) |
| 35 to 50 years | 10 (100.0%) | 0 (0.0%) |
| Total | 109 (100.0%) | 0 (0.0%) |
Fertility by Education in Dent
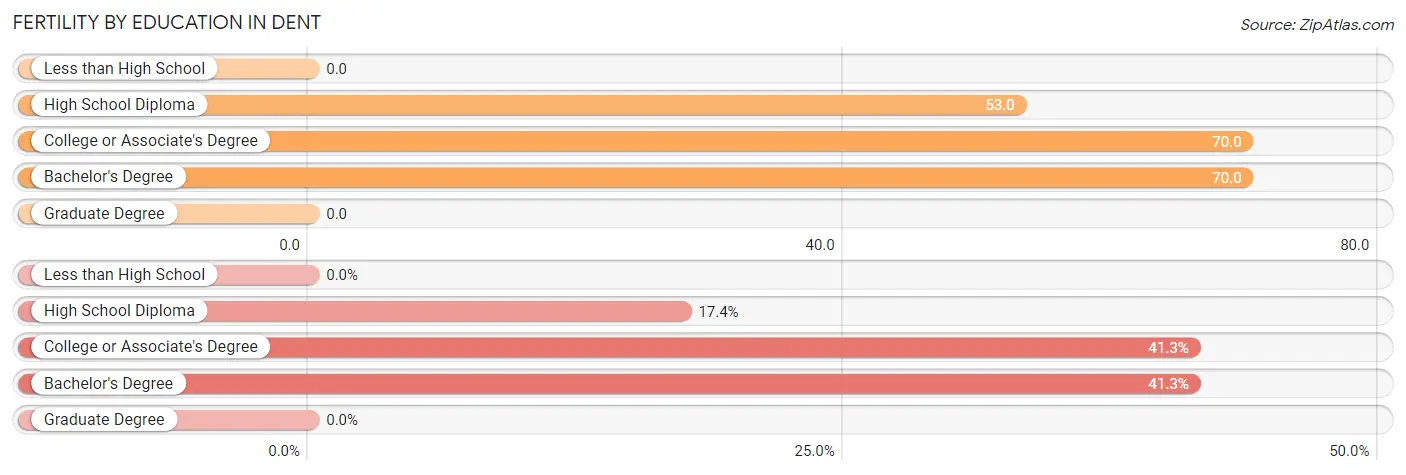
| Educational Attainment | Women with Births | Births / 1,000 Women |
| Less than High School | 0 (0.0%) | 0.0 |
| High School Diploma | 19 (17.4%) | 53.0 |
| College or Associate's Degree | 45 (41.3%) | 70.0 |
| Bachelor's Degree | 45 (41.3%) | 70.0 |
| Graduate Degree | 0 (0.0%) | 0.0 |
| Total | 109 (100.0%) | 48.0 |
Fertility by Education by Marriage Status in Dent
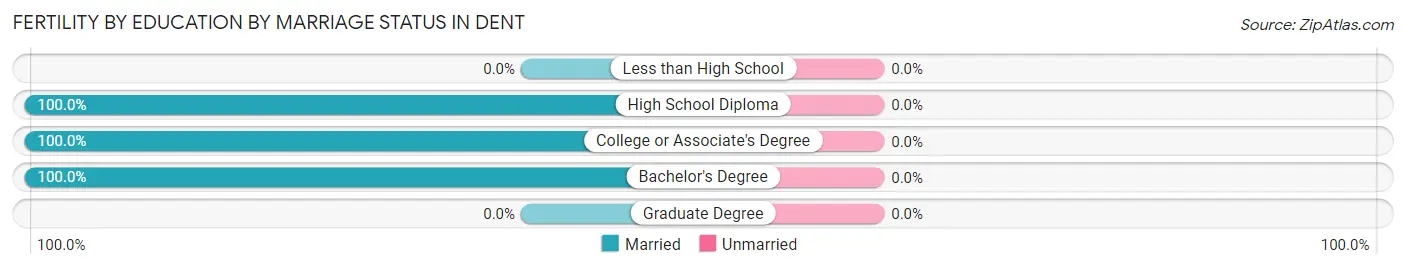
| Educational Attainment | Married | Unmarried |
| Less than High School | 0 (0.0%) | 0 (0.0%) |
| High School Diploma | 19 (100.0%) | 0 (0.0%) |
| College or Associate's Degree | 45 (100.0%) | 0 (0.0%) |
| Bachelor's Degree | 45 (100.0%) | 0 (0.0%) |
| Graduate Degree | 0 (0.0%) | 0 (0.0%) |
| Total | 109 (100.0%) | 0 (0.0%) |
Employment Characteristics in Dent
Employment by Class of Employer in Dent
Among the 5,459 employed individuals in Dent, private company employees (3,677 | 67.4%), not-for-profit organizations (937 | 17.2%), and local government employees (278 | 5.1%) make up the most common classes of employment.
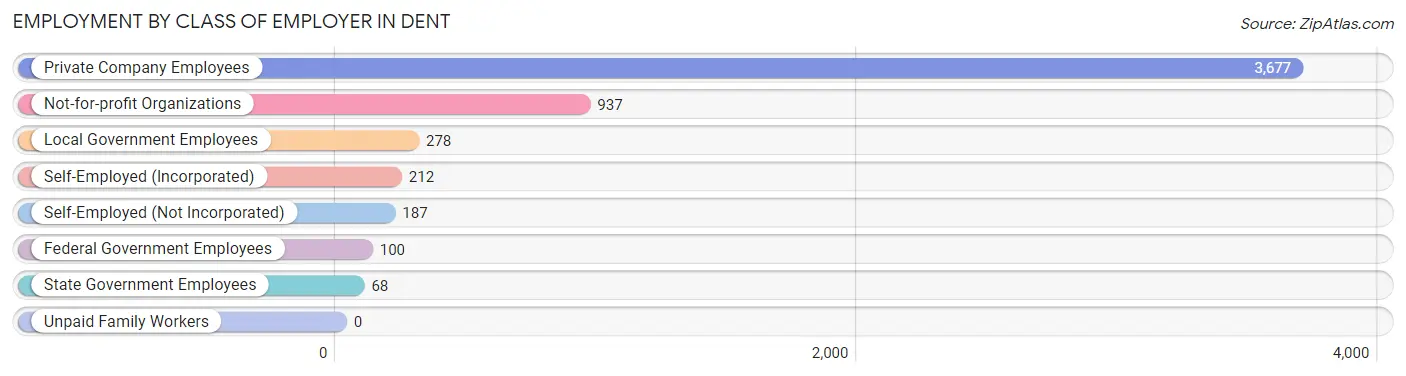
| Employer Class | # Employees | % Employees |
| Private Company Employees | 3,677 | 67.4% |
| Self-Employed (Incorporated) | 212 | 3.9% |
| Self-Employed (Not Incorporated) | 187 | 3.4% |
| Not-for-profit Organizations | 937 | 17.2% |
| Local Government Employees | 278 | 5.1% |
| State Government Employees | 68 | 1.3% |
| Federal Government Employees | 100 | 1.8% |
| Unpaid Family Workers | 0 | 0.0% |
| Total | 5,459 | 100.0% |
Employment Status by Age in Dent
According to the labor force statistics for Dent, out of the total population over 16 years of age (8,967), 64.7% or 5,802 individuals are in the labor force, with 4.5% or 261 of them unemployed. The age group with the highest labor force participation rate is 30 to 34 years, with 100.0% or 739 individuals in the labor force. Within the labor force, the 16 to 19 years age range has the highest percentage of unemployed individuals, with 24.0% or 53 of them being unemployed.
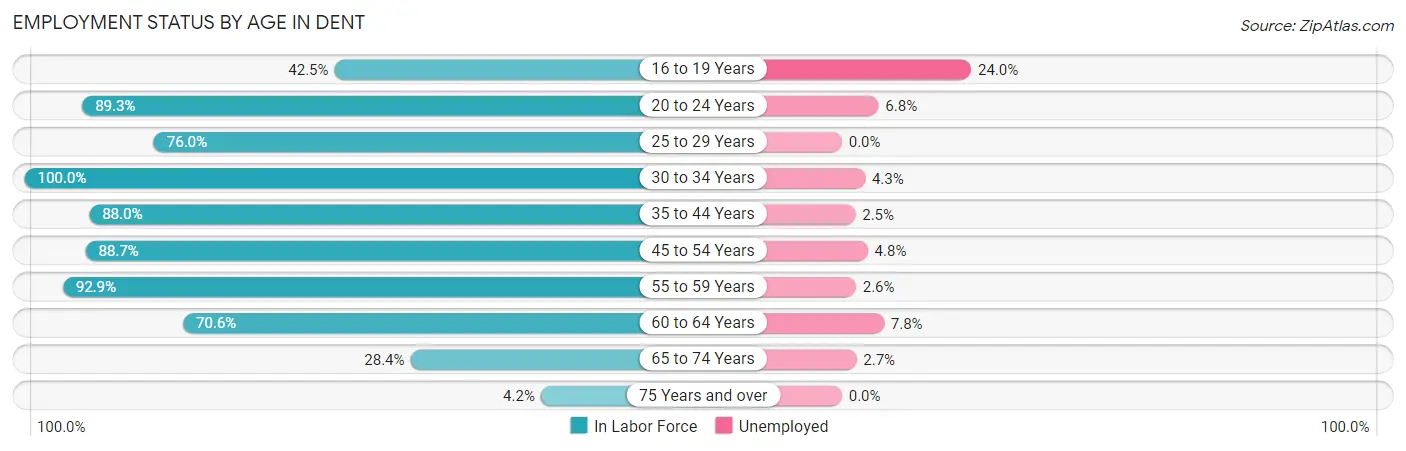
| Age Bracket | In Labor Force | Unemployed |
| 16 to 19 Years | 221 (42.5%) | 53 (24.0%) |
| 20 to 24 Years | 250 (89.3%) | 17 (6.8%) |
| 25 to 29 Years | 481 (76.0%) | 0 (0.0%) |
| 30 to 34 Years | 739 (100.0%) | 32 (4.3%) |
| 35 to 44 Years | 1,324 (88.0%) | 33 (2.5%) |
| 45 to 54 Years | 995 (88.7%) | 48 (4.8%) |
| 55 to 59 Years | 683 (92.9%) | 18 (2.6%) |
| 60 to 64 Years | 666 (70.6%) | 52 (7.8%) |
| 65 to 74 Years | 402 (28.4%) | 11 (2.7%) |
| 75 Years and over | 45 (4.2%) | 0 (0.0%) |
| Total | 5,802 (64.7%) | 261 (4.5%) |
Employment Status by Educational Attainment in Dent
According to labor force statistics for Dent, 86.1% of individuals (4,887) out of the total population between 25 and 64 years of age (5,676) are in the labor force, with 3.7% or 181 of them being unemployed. The group with the highest labor force participation rate are those with the educational attainment of bachelor's degree or higher, with 90.6% or 2,440 individuals in the labor force. Within the labor force, individuals with high school diploma education have the highest percentage of unemployment, with 6.4% or 59 of them being unemployed.
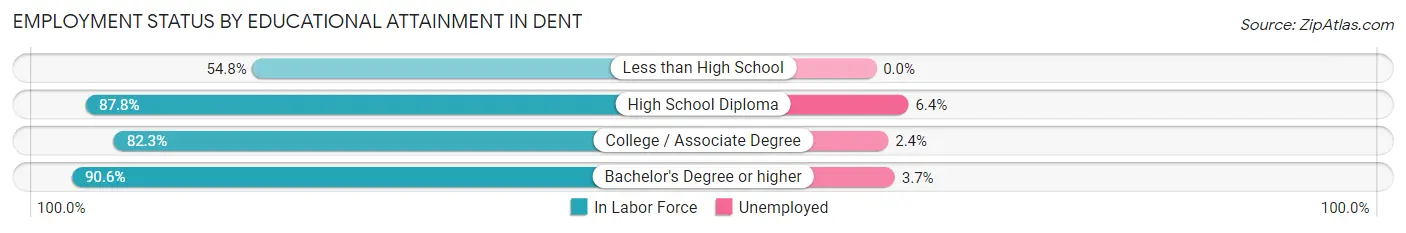
| Educational Attainment | In Labor Force | Unemployed |
| Less than High School | 131 (54.8%) | 0 (0.0%) |
| High School Diploma | 926 (87.8%) | 68 (6.4%) |
| College / Associate Degree | 1,390 (82.3%) | 41 (2.4%) |
| Bachelor's Degree or higher | 2,440 (90.6%) | 100 (3.7%) |
| Total | 4,887 (86.1%) | 210 (3.7%) |
Employment Occupations by Sex in Dent
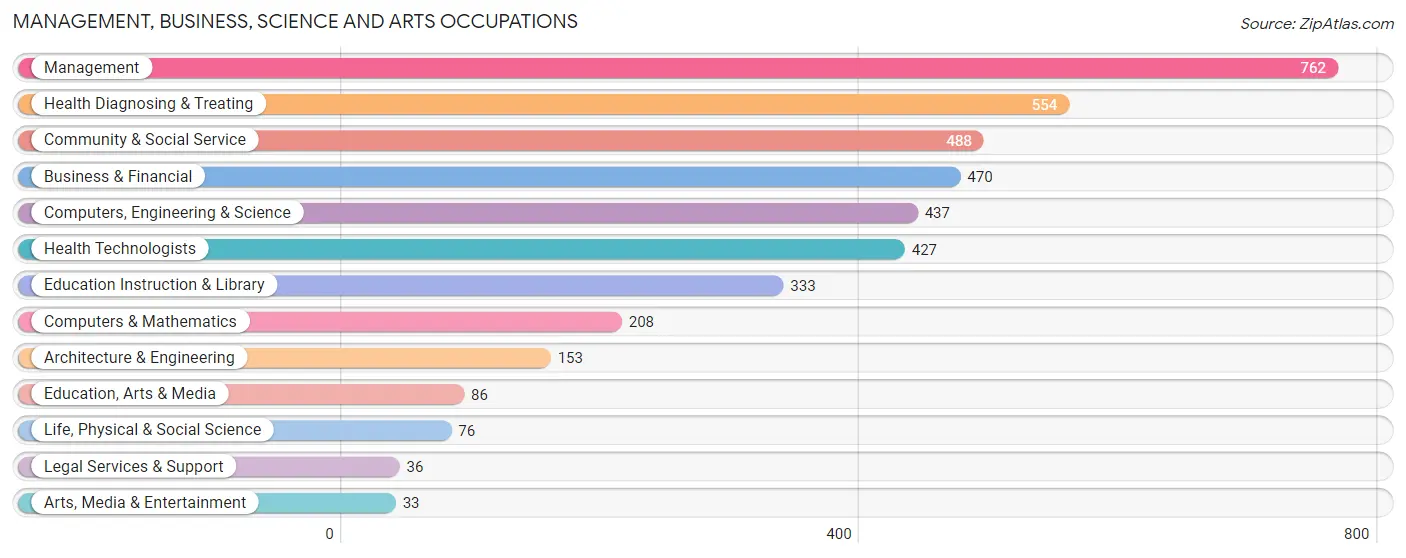
Management, Business, Science and Arts Occupations
The most common Management, Business, Science and Arts occupations in Dent are Management (762 | 13.8%), Health Diagnosing & Treating (554 | 10.0%), Community & Social Service (488 | 8.8%), Business & Financial (470 | 8.5%), and Computers, Engineering & Science (437 | 7.9%).
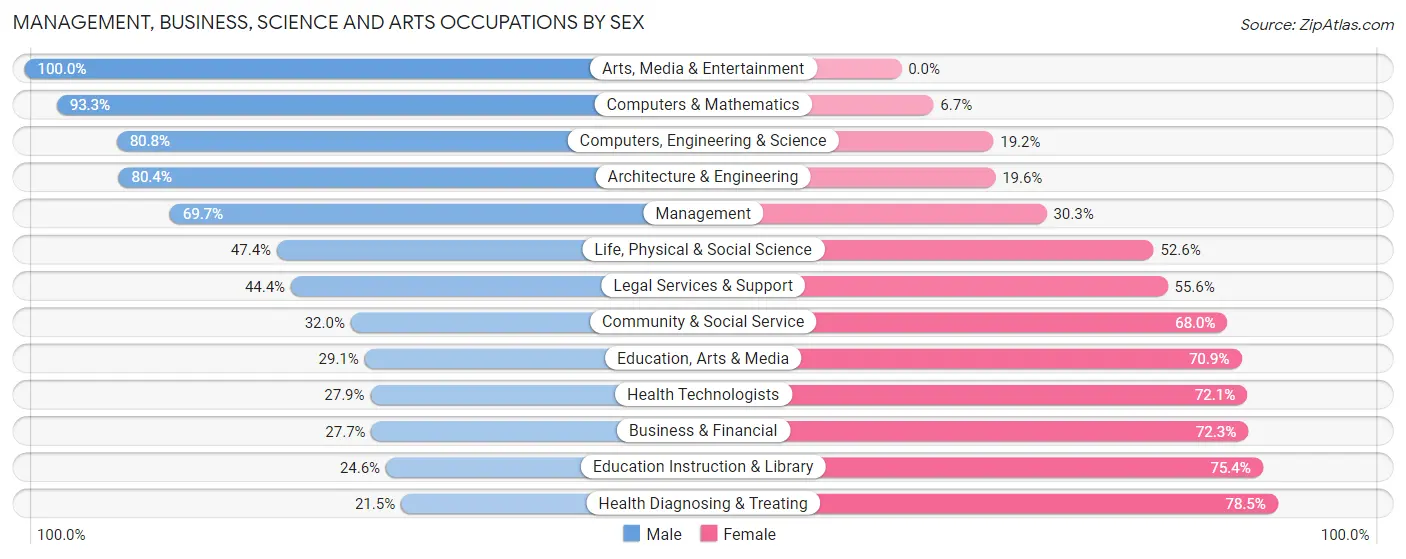
Management, Business, Science and Arts Occupations by Sex
Within the Management, Business, Science and Arts occupations in Dent, the most male-oriented occupations are Arts, Media & Entertainment (100.0%), Computers & Mathematics (93.3%), and Computers, Engineering & Science (80.8%), while the most female-oriented occupations are Health Diagnosing & Treating (78.5%), Education Instruction & Library (75.4%), and Business & Financial (72.3%).
| Occupation | Male | Female |
| Management | 531 (69.7%) | 231 (30.3%) |
| Business & Financial | 130 (27.7%) | 340 (72.3%) |
| Computers, Engineering & Science | 353 (80.8%) | 84 (19.2%) |
| Computers & Mathematics | 194 (93.3%) | 14 (6.7%) |
| Architecture & Engineering | 123 (80.4%) | 30 (19.6%) |
| Life, Physical & Social Science | 36 (47.4%) | 40 (52.6%) |
| Community & Social Service | 156 (32.0%) | 332 (68.0%) |
| Education, Arts & Media | 25 (29.1%) | 61 (70.9%) |
| Legal Services & Support | 16 (44.4%) | 20 (55.6%) |
| Education Instruction & Library | 82 (24.6%) | 251 (75.4%) |
| Arts, Media & Entertainment | 33 (100.0%) | 0 (0.0%) |
| Health Diagnosing & Treating | 119 (21.5%) | 435 (78.5%) |
| Health Technologists | 119 (27.9%) | 308 (72.1%) |
| Total (Category) | 1,289 (47.5%) | 1,422 (52.4%) |
| Total (Overall) | 2,925 (52.8%) | 2,617 (47.2%) |
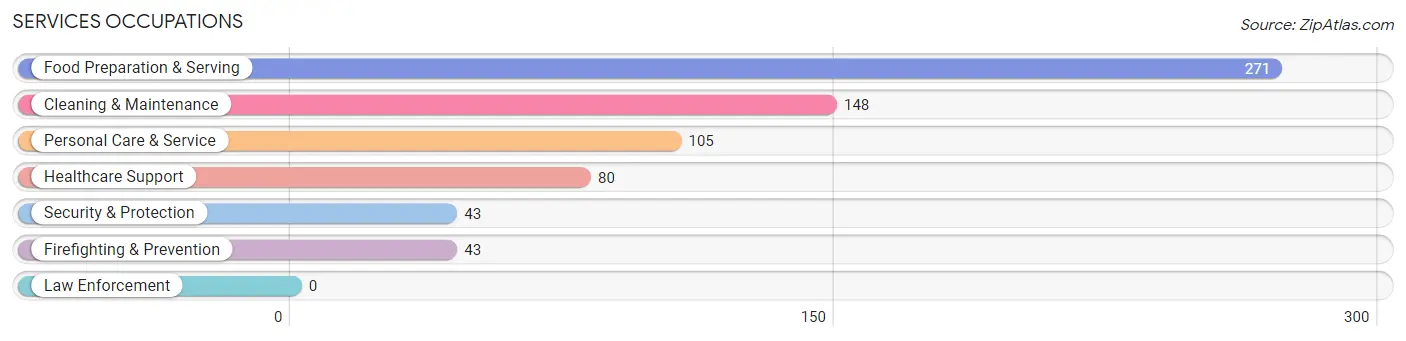
Services Occupations
The most common Services occupations in Dent are Food Preparation & Serving (271 | 4.9%), Cleaning & Maintenance (148 | 2.7%), Personal Care & Service (105 | 1.9%), Healthcare Support (80 | 1.4%), and Security & Protection (43 | 0.8%).
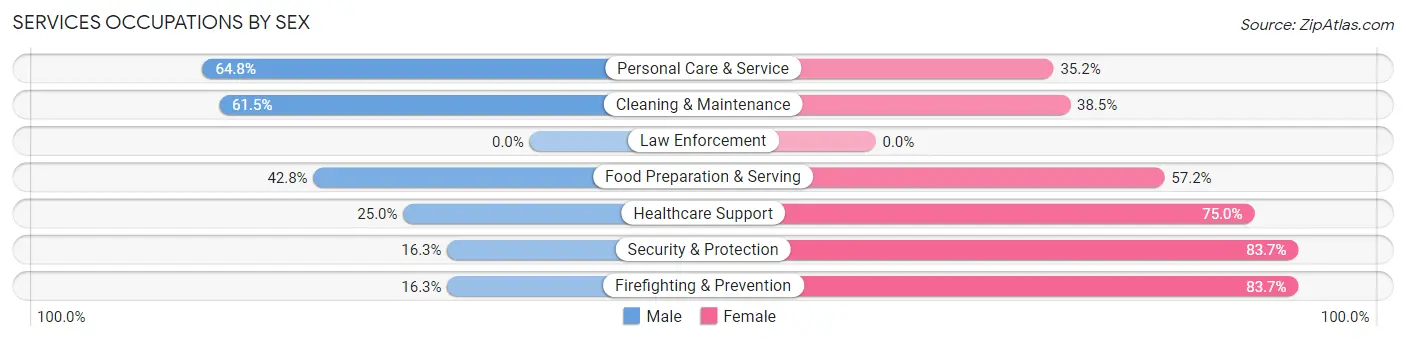
Services Occupations by Sex
Within the Services occupations in Dent, the most male-oriented occupations are Personal Care & Service (64.8%), Cleaning & Maintenance (61.5%), and Food Preparation & Serving (42.8%), while the most female-oriented occupations are Security & Protection (83.7%), Firefighting & Prevention (83.7%), and Healthcare Support (75.0%).
| Occupation | Male | Female |
| Healthcare Support | 20 (25.0%) | 60 (75.0%) |
| Security & Protection | 7 (16.3%) | 36 (83.7%) |
| Firefighting & Prevention | 7 (16.3%) | 36 (83.7%) |
| Law Enforcement | 0 (0.0%) | 0 (0.0%) |
| Food Preparation & Serving | 116 (42.8%) | 155 (57.2%) |
| Cleaning & Maintenance | 91 (61.5%) | 57 (38.5%) |
| Personal Care & Service | 68 (64.8%) | 37 (35.2%) |
| Total (Category) | 302 (46.7%) | 345 (53.3%) |
| Total (Overall) | 2,925 (52.8%) | 2,617 (47.2%) |
Sales and Office Occupations
The most common Sales and Office occupations in Dent are Office & Administration (699 | 12.6%), and Sales & Related (560 | 10.1%).
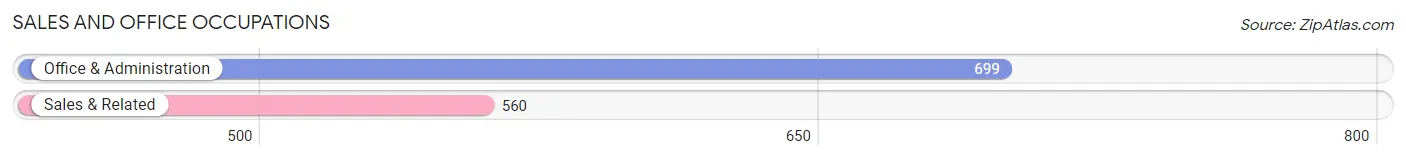
Sales and Office Occupations by Sex
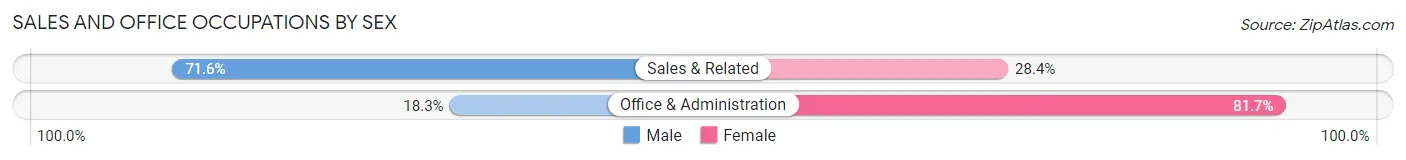
| Occupation | Male | Female |
| Sales & Related | 401 (71.6%) | 159 (28.4%) |
| Office & Administration | 128 (18.3%) | 571 (81.7%) |
| Total (Category) | 529 (42.0%) | 730 (58.0%) |
| Total (Overall) | 2,925 (52.8%) | 2,617 (47.2%) |
Natural Resources, Construction and Maintenance Occupations
The most common Natural Resources, Construction and Maintenance occupations in Dent are Construction & Extraction (276 | 5.0%), and Installation, Maintenance & Repair (66 | 1.2%).
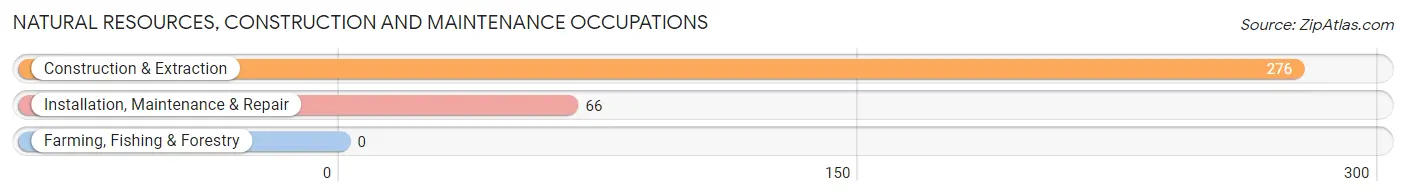
Natural Resources, Construction and Maintenance Occupations by Sex
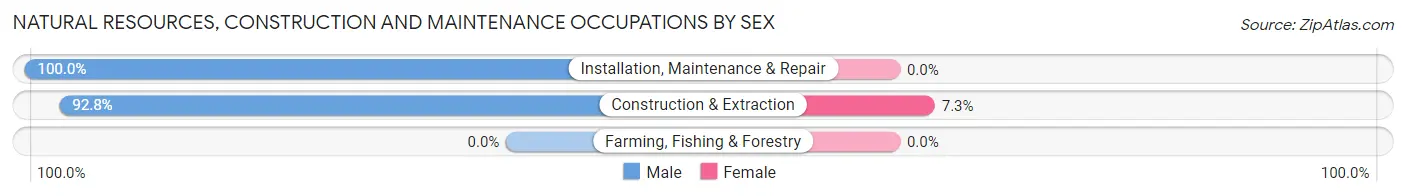
| Occupation | Male | Female |
| Farming, Fishing & Forestry | 0 (0.0%) | 0 (0.0%) |
| Construction & Extraction | 256 (92.7%) | 20 (7.2%) |
| Installation, Maintenance & Repair | 66 (100.0%) | 0 (0.0%) |
| Total (Category) | 322 (94.2%) | 20 (5.9%) |
| Total (Overall) | 2,925 (52.8%) | 2,617 (47.2%) |
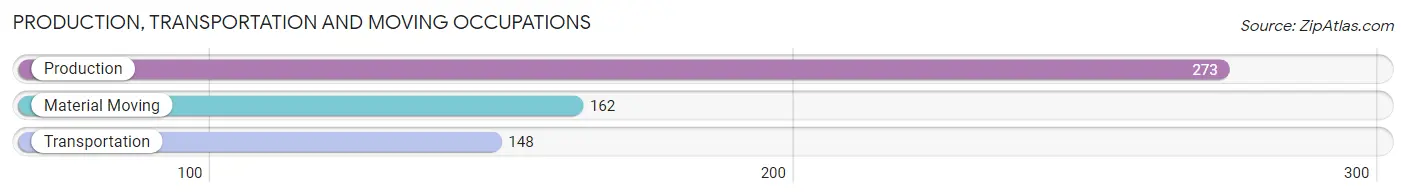
Production, Transportation and Moving Occupations
The most common Production, Transportation and Moving occupations in Dent are Production (273 | 4.9%), Material Moving (162 | 2.9%), and Transportation (148 | 2.7%).
Production, Transportation and Moving Occupations by Sex
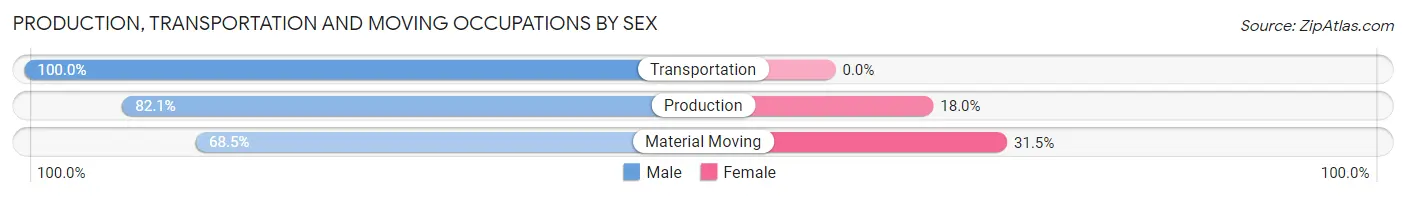
| Occupation | Male | Female |
| Production | 224 (82.1%) | 49 (17.9%) |
| Transportation | 148 (100.0%) | 0 (0.0%) |
| Material Moving | 111 (68.5%) | 51 (31.5%) |
| Total (Category) | 483 (82.9%) | 100 (17.2%) |
| Total (Overall) | 2,925 (52.8%) | 2,617 (47.2%) |
Employment Industries by Sex in Dent
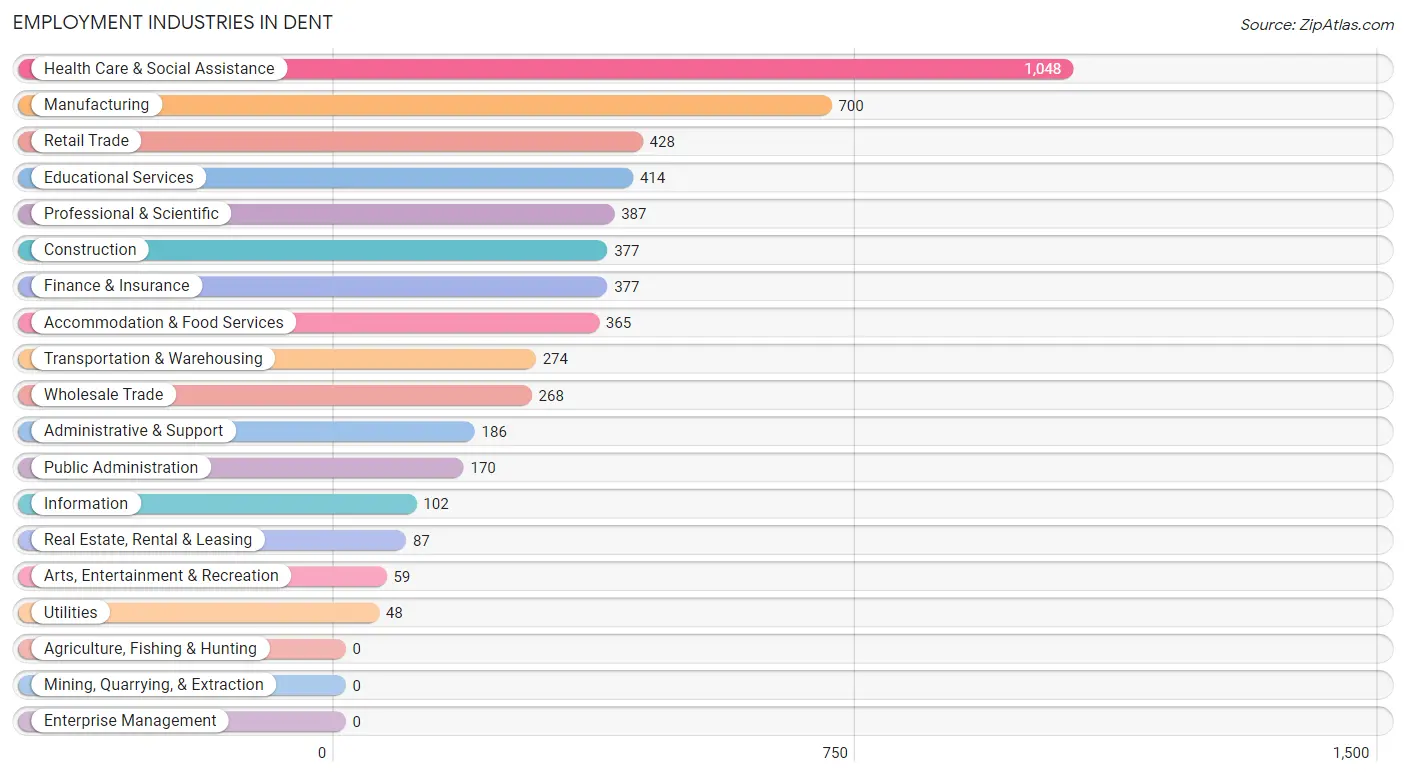
Employment Industries in Dent
The major employment industries in Dent include Health Care & Social Assistance (1,048 | 18.9%), Manufacturing (700 | 12.6%), Retail Trade (428 | 7.7%), Educational Services (414 | 7.5%), and Professional & Scientific (387 | 7.0%).
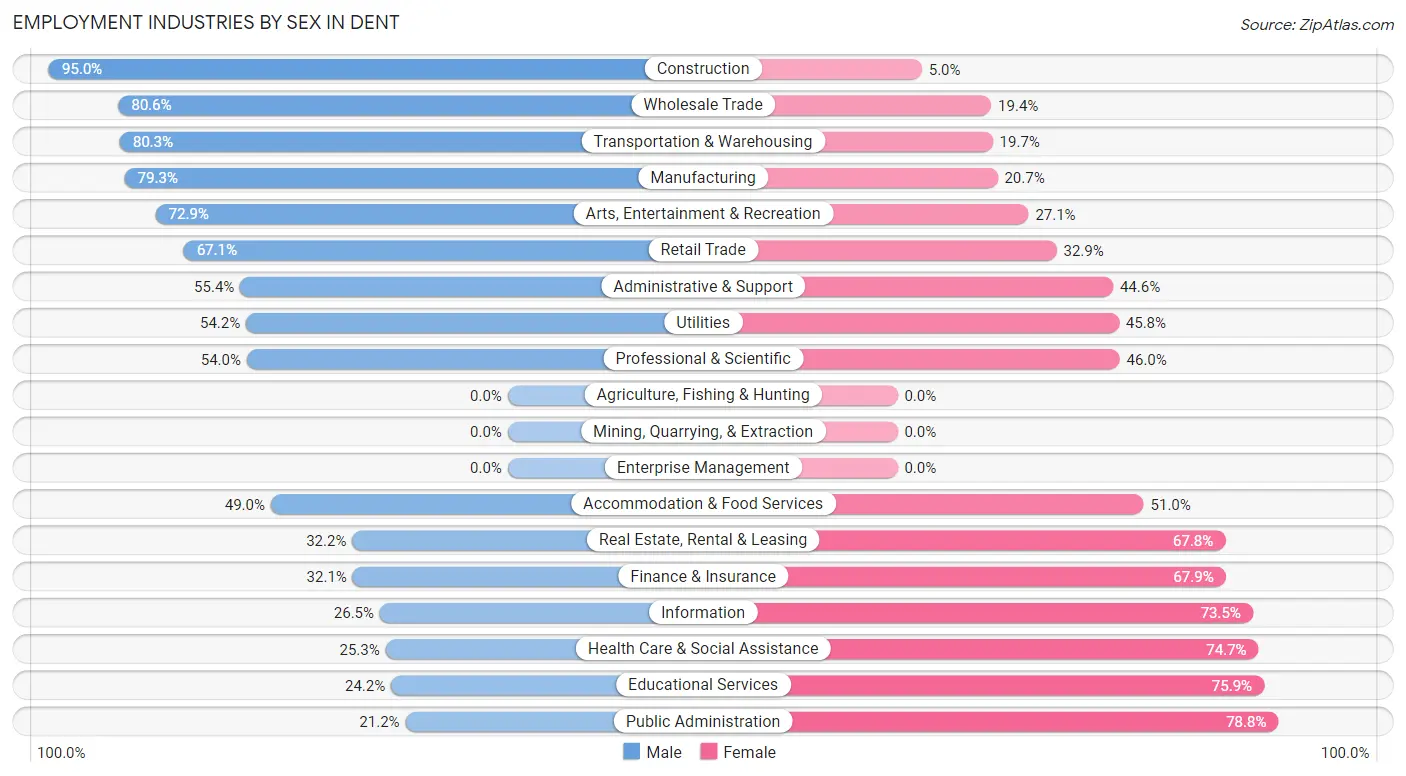
Employment Industries by Sex in Dent
The Dent industries that see more men than women are Construction (95.0%), Wholesale Trade (80.6%), and Transportation & Warehousing (80.3%), whereas the industries that tend to have a higher number of women are Public Administration (78.8%), Educational Services (75.8%), and Health Care & Social Assistance (74.7%).
| Industry | Male | Female |
| Agriculture, Fishing & Hunting | 0 (0.0%) | 0 (0.0%) |
| Mining, Quarrying, & Extraction | 0 (0.0%) | 0 (0.0%) |
| Construction | 358 (95.0%) | 19 (5.0%) |
| Manufacturing | 555 (79.3%) | 145 (20.7%) |
| Wholesale Trade | 216 (80.6%) | 52 (19.4%) |
| Retail Trade | 287 (67.1%) | 141 (32.9%) |
| Transportation & Warehousing | 220 (80.3%) | 54 (19.7%) |
| Utilities | 26 (54.2%) | 22 (45.8%) |
| Information | 27 (26.5%) | 75 (73.5%) |
| Finance & Insurance | 121 (32.1%) | 256 (67.9%) |
| Real Estate, Rental & Leasing | 28 (32.2%) | 59 (67.8%) |
| Professional & Scientific | 209 (54.0%) | 178 (46.0%) |
| Enterprise Management | 0 (0.0%) | 0 (0.0%) |
| Administrative & Support | 103 (55.4%) | 83 (44.6%) |
| Educational Services | 100 (24.1%) | 314 (75.8%) |
| Health Care & Social Assistance | 265 (25.3%) | 783 (74.7%) |
| Arts, Entertainment & Recreation | 43 (72.9%) | 16 (27.1%) |
| Accommodation & Food Services | 179 (49.0%) | 186 (51.0%) |
| Public Administration | 36 (21.2%) | 134 (78.8%) |
| Total | 2,925 (52.8%) | 2,617 (47.2%) |
Education in Dent
School Enrollment in Dent
The most common levels of schooling among the 2,523 students in Dent are elementary school (880 | 34.9%), high school (534 | 21.2%), and middle school (438 | 17.4%).
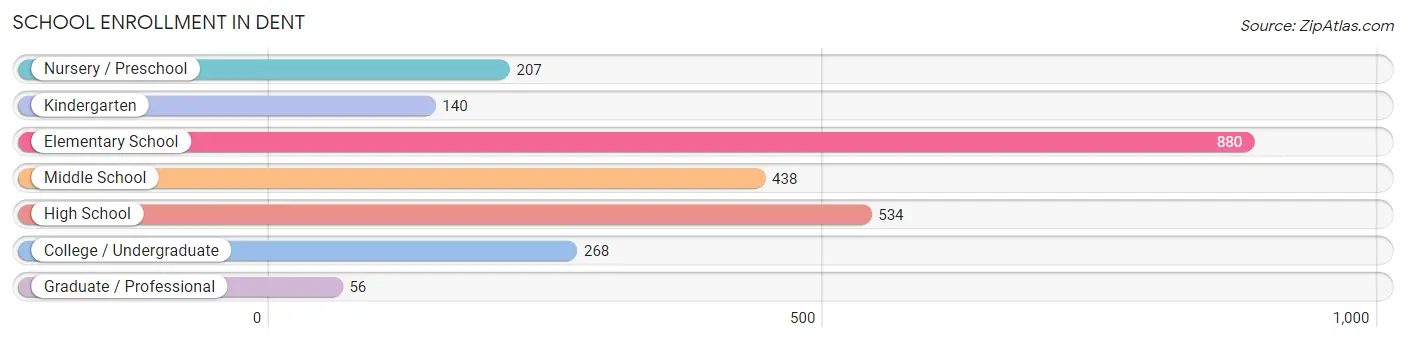
| School Level | # Students | % Students |
| Nursery / Preschool | 207 | 8.2% |
| Kindergarten | 140 | 5.6% |
| Elementary School | 880 | 34.9% |
| Middle School | 438 | 17.4% |
| High School | 534 | 21.2% |
| College / Undergraduate | 268 | 10.6% |
| Graduate / Professional | 56 | 2.2% |
| Total | 2,523 | 100.0% |
School Enrollment by Age by Funding Source in Dent
Out of a total of 2,523 students who are enrolled in schools in Dent, 863 (34.2%) attend a private institution, while the remaining 1,660 (65.8%) are enrolled in public schools. The age group of 15 to 17 year olds has the highest likelihood of being enrolled in private schools, with 227 (55.4% in the age bracket) enrolled. Conversely, the age group of 20 to 24 year olds has the lowest likelihood of being enrolled in a private school, with 67 (90.5% in the age bracket) attending a public institution.
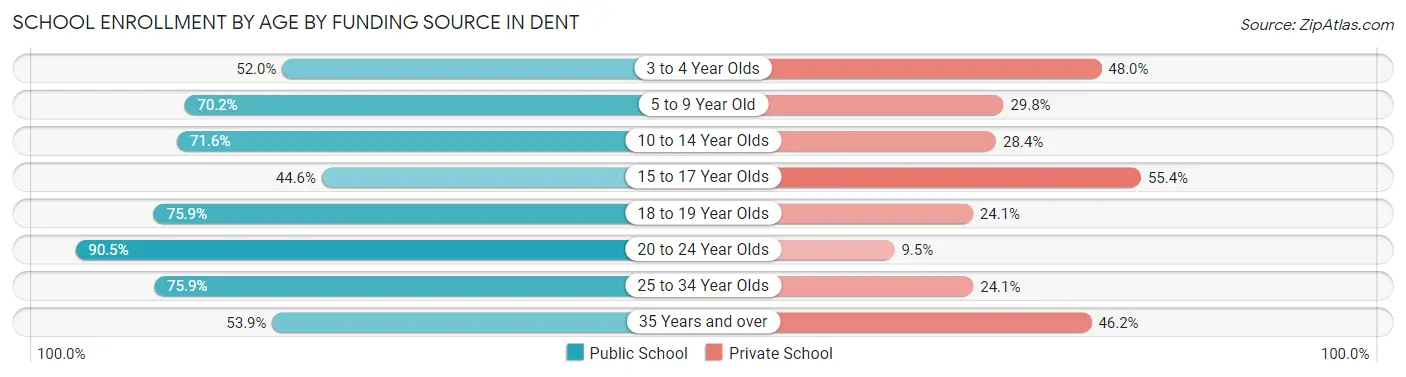
| Age Bracket | Public School | Private School |
| 3 to 4 Year Olds | 91 (52.0%) | 84 (48.0%) |
| 5 to 9 Year Old | 635 (70.2%) | 269 (29.8%) |
| 10 to 14 Year Olds | 474 (71.6%) | 188 (28.4%) |
| 15 to 17 Year Olds | 183 (44.6%) | 227 (55.4%) |
| 18 to 19 Year Olds | 123 (75.9%) | 39 (24.1%) |
| 20 to 24 Year Olds | 67 (90.5%) | 7 (9.5%) |
| 25 to 34 Year Olds | 44 (75.9%) | 14 (24.1%) |
| 35 Years and over | 42 (53.8%) | 36 (46.2%) |
| Total | 1,660 (65.8%) | 863 (34.2%) |
Educational Attainment by Field of Study in Dent
Business (887 | 25.5%), science & technology (517 | 14.9%), education (415 | 11.9%), engineering (369 | 10.6%), and communications (302 | 8.7%) are the most common fields of study among 3,479 individuals in Dent who have obtained a bachelor's degree or higher.
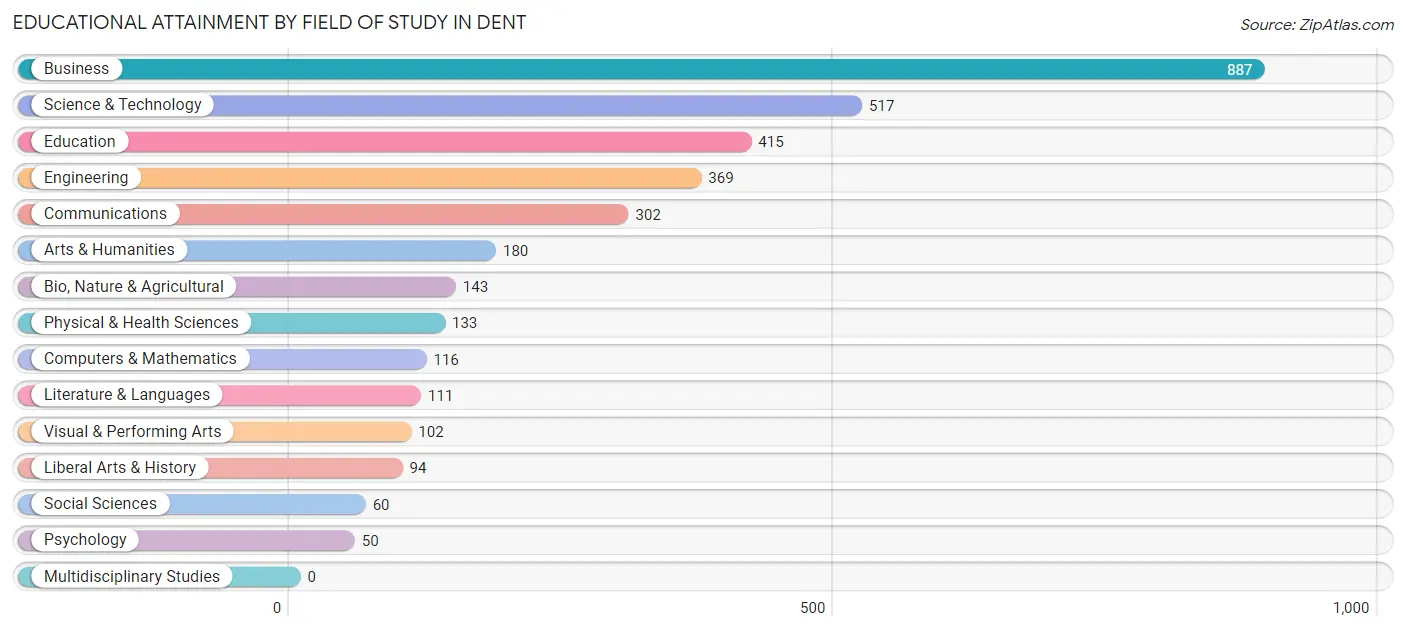
| Field of Study | # Graduates | % Graduates |
| Computers & Mathematics | 116 | 3.3% |
| Bio, Nature & Agricultural | 143 | 4.1% |
| Physical & Health Sciences | 133 | 3.8% |
| Psychology | 50 | 1.4% |
| Social Sciences | 60 | 1.7% |
| Engineering | 369 | 10.6% |
| Multidisciplinary Studies | 0 | 0.0% |
| Science & Technology | 517 | 14.9% |
| Business | 887 | 25.5% |
| Education | 415 | 11.9% |
| Literature & Languages | 111 | 3.2% |
| Liberal Arts & History | 94 | 2.7% |
| Visual & Performing Arts | 102 | 2.9% |
| Communications | 302 | 8.7% |
| Arts & Humanities | 180 | 5.2% |
| Total | 3,479 | 100.0% |
Transportation & Commute in Dent
Vehicle Availability by Sex in Dent
The most prevalent vehicle ownership categories in Dent are males with 2 vehicles (1,402, accounting for 48.8%) and females with 2 vehicles (1,170, making up 54.2%).
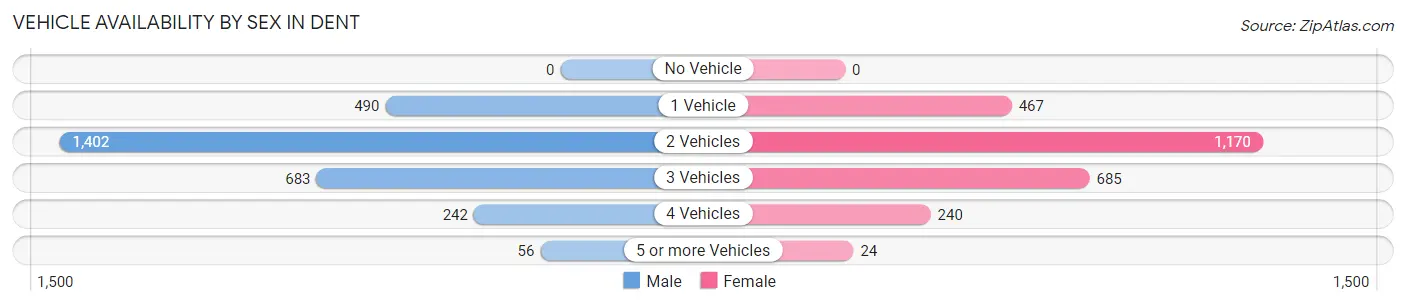
| Vehicles Available | Male | Female |
| No Vehicle | 0 (0.0%) | 0 (0.0%) |
| 1 Vehicle | 490 (17.1%) | 467 (18.1%) |
| 2 Vehicles | 1,402 (48.8%) | 1,170 (45.2%) |
| 3 Vehicles | 683 (23.8%) | 685 (26.5%) |
| 4 Vehicles | 242 (8.4%) | 240 (9.3%) |
| 5 or more Vehicles | 56 (1.9%) | 24 (0.9%) |
| Total | 2,873 (100.0%) | 2,586 (100.0%) |
Commute Time in Dent
The most frequently occuring commute durations in Dent are 20 to 24 minutes (1,295 commuters, 26.0%), 30 to 34 minutes (1,133 commuters, 22.7%), and 10 to 14 minutes (579 commuters, 11.6%).
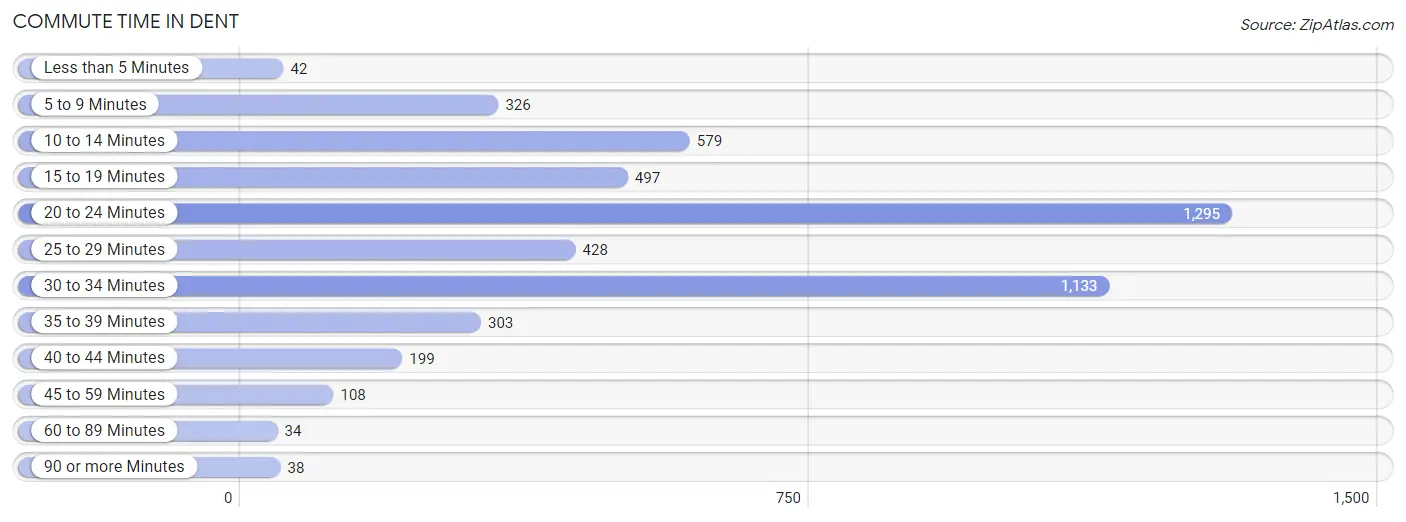
| Commute Time | # Commuters | % Commuters |
| Less than 5 Minutes | 42 | 0.8% |
| 5 to 9 Minutes | 326 | 6.5% |
| 10 to 14 Minutes | 579 | 11.6% |
| 15 to 19 Minutes | 497 | 10.0% |
| 20 to 24 Minutes | 1,295 | 26.0% |
| 25 to 29 Minutes | 428 | 8.6% |
| 30 to 34 Minutes | 1,133 | 22.7% |
| 35 to 39 Minutes | 303 | 6.1% |
| 40 to 44 Minutes | 199 | 4.0% |
| 45 to 59 Minutes | 108 | 2.2% |
| 60 to 89 Minutes | 34 | 0.7% |
| 90 or more Minutes | 38 | 0.8% |
Commute Time by Sex in Dent
The most common commute times in Dent are 20 to 24 minutes (682 commuters, 25.7%) for males and 20 to 24 minutes (613 commuters, 26.3%) for females.
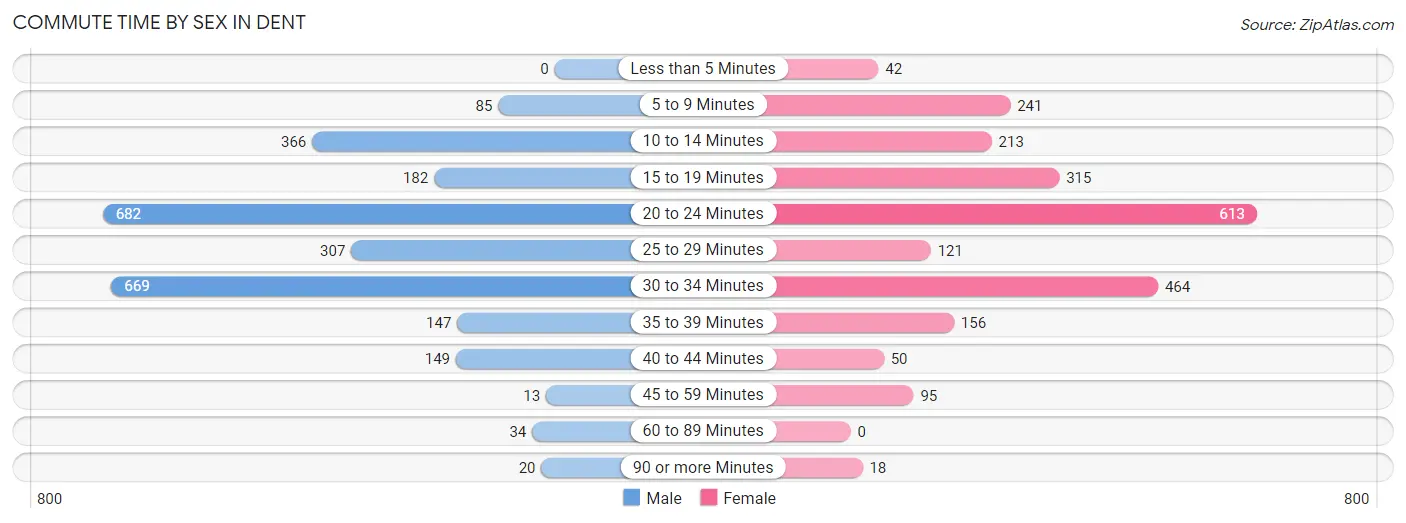
| Commute Time | Male | Female |
| Less than 5 Minutes | 0 (0.0%) | 42 (1.8%) |
| 5 to 9 Minutes | 85 (3.2%) | 241 (10.3%) |
| 10 to 14 Minutes | 366 (13.8%) | 213 (9.1%) |
| 15 to 19 Minutes | 182 (6.9%) | 315 (13.5%) |
| 20 to 24 Minutes | 682 (25.7%) | 613 (26.3%) |
| 25 to 29 Minutes | 307 (11.6%) | 121 (5.2%) |
| 30 to 34 Minutes | 669 (25.2%) | 464 (19.9%) |
| 35 to 39 Minutes | 147 (5.5%) | 156 (6.7%) |
| 40 to 44 Minutes | 149 (5.6%) | 50 (2.1%) |
| 45 to 59 Minutes | 13 (0.5%) | 95 (4.1%) |
| 60 to 89 Minutes | 34 (1.3%) | 0 (0.0%) |
| 90 or more Minutes | 20 (0.7%) | 18 (0.8%) |
Time of Departure to Work by Sex in Dent
The most frequent times of departure to work in Dent are 7:00 AM to 7:29 AM (596, 22.5%) for males and 7:30 AM to 7:59 AM (367, 15.8%) for females.
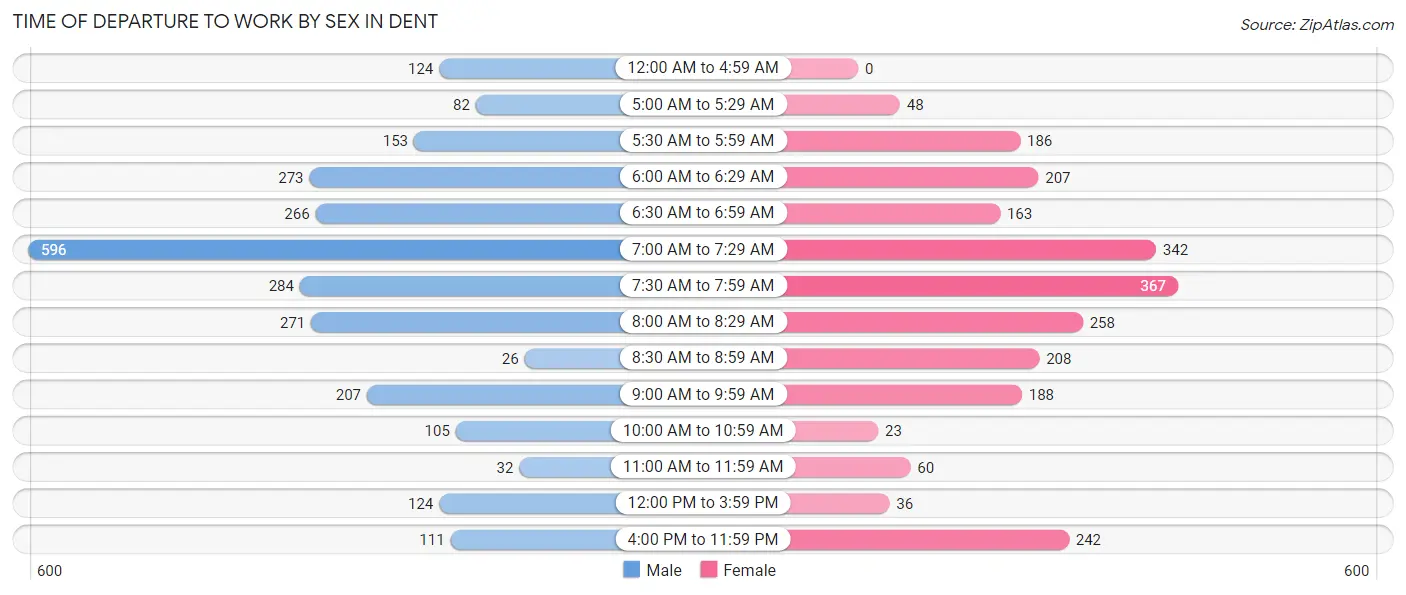
| Time of Departure | Male | Female |
| 12:00 AM to 4:59 AM | 124 (4.7%) | 0 (0.0%) |
| 5:00 AM to 5:29 AM | 82 (3.1%) | 48 (2.1%) |
| 5:30 AM to 5:59 AM | 153 (5.8%) | 186 (8.0%) |
| 6:00 AM to 6:29 AM | 273 (10.3%) | 207 (8.9%) |
| 6:30 AM to 6:59 AM | 266 (10.0%) | 163 (7.0%) |
| 7:00 AM to 7:29 AM | 596 (22.5%) | 342 (14.7%) |
| 7:30 AM to 7:59 AM | 284 (10.7%) | 367 (15.8%) |
| 8:00 AM to 8:29 AM | 271 (10.2%) | 258 (11.1%) |
| 8:30 AM to 8:59 AM | 26 (1.0%) | 208 (8.9%) |
| 9:00 AM to 9:59 AM | 207 (7.8%) | 188 (8.1%) |
| 10:00 AM to 10:59 AM | 105 (4.0%) | 23 (1.0%) |
| 11:00 AM to 11:59 AM | 32 (1.2%) | 60 (2.6%) |
| 12:00 PM to 3:59 PM | 124 (4.7%) | 36 (1.5%) |
| 4:00 PM to 11:59 PM | 111 (4.2%) | 242 (10.4%) |
| Total | 2,654 (100.0%) | 2,328 (100.0%) |
Housing Occupancy in Dent
Occupancy by Ownership in Dent
Of the total 4,856 dwellings in Dent, owner-occupied units account for 3,856 (79.4%), while renter-occupied units make up 1,000 (20.6%).
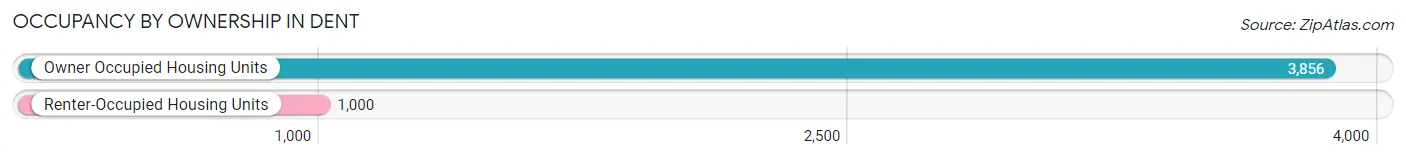
| Occupancy | # Housing Units | % Housing Units |
| Owner Occupied Housing Units | 3,856 | 79.4% |
| Renter-Occupied Housing Units | 1,000 | 20.6% |
| Total Occupied Housing Units | 4,856 | 100.0% |
Occupancy by Household Size in Dent
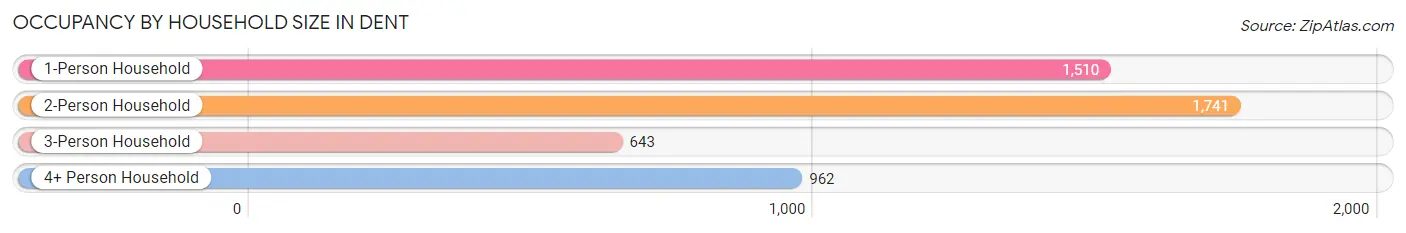
| Household Size | # Housing Units | % Housing Units |
| 1-Person Household | 1,510 | 31.1% |
| 2-Person Household | 1,741 | 35.8% |
| 3-Person Household | 643 | 13.2% |
| 4+ Person Household | 962 | 19.8% |
| Total Housing Units | 4,856 | 100.0% |
Occupancy by Ownership by Household Size in Dent
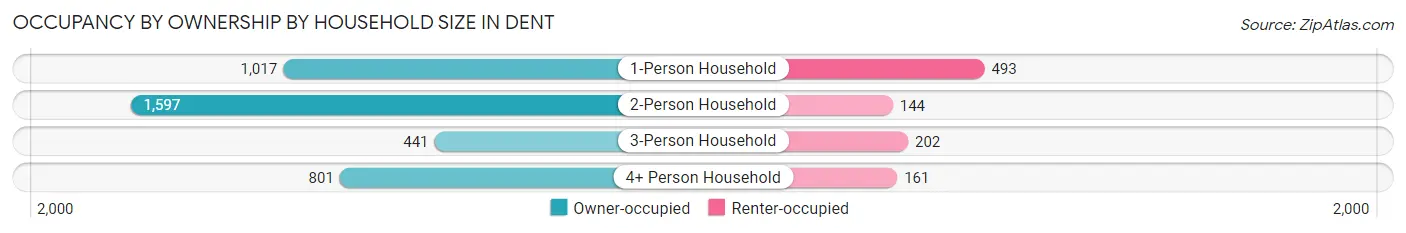
| Household Size | Owner-occupied | Renter-occupied |
| 1-Person Household | 1,017 (67.3%) | 493 (32.7%) |
| 2-Person Household | 1,597 (91.7%) | 144 (8.3%) |
| 3-Person Household | 441 (68.6%) | 202 (31.4%) |
| 4+ Person Household | 801 (83.3%) | 161 (16.7%) |
| Total Housing Units | 3,856 (79.4%) | 1,000 (20.6%) |
Occupancy by Educational Attainment in Dent
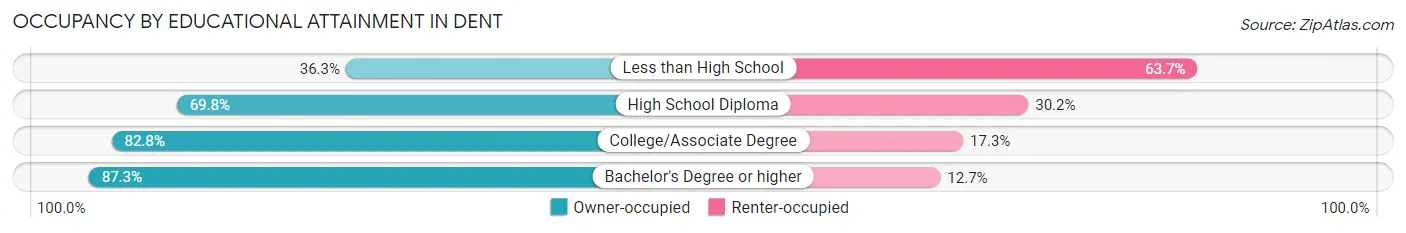
| Household Size | Owner-occupied | Renter-occupied |
| Less than High School | 73 (36.3%) | 128 (63.7%) |
| High School Diploma | 859 (69.8%) | 371 (30.2%) |
| College/Associate Degree | 1,185 (82.8%) | 247 (17.2%) |
| Bachelor's Degree or higher | 1,739 (87.3%) | 254 (12.7%) |
Occupancy by Age of Householder in Dent
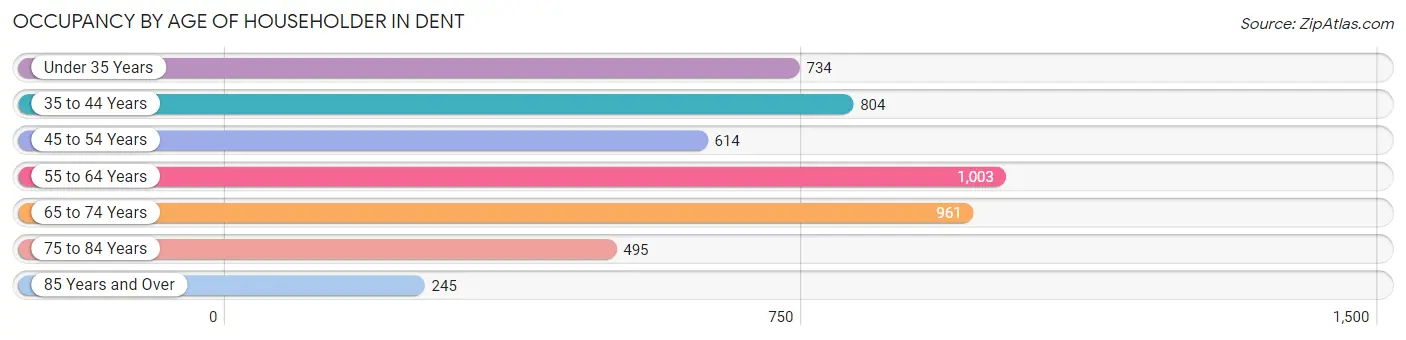
| Age Bracket | # Households | % Households |
| Under 35 Years | 734 | 15.1% |
| 35 to 44 Years | 804 | 16.6% |
| 45 to 54 Years | 614 | 12.6% |
| 55 to 64 Years | 1,003 | 20.6% |
| 65 to 74 Years | 961 | 19.8% |
| 75 to 84 Years | 495 | 10.2% |
| 85 Years and Over | 245 | 5.1% |
| Total | 4,856 | 100.0% |
Housing Finances in Dent
Median Income by Occupancy in Dent
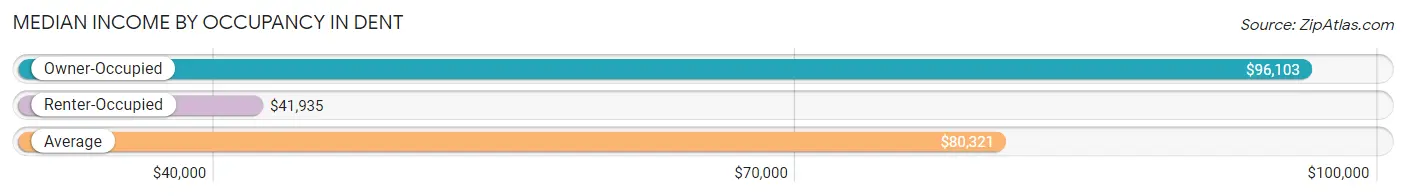
| Occupancy Type | # Households | Median Income |
| Owner-Occupied | 3,856 (79.4%) | $96,103 |
| Renter-Occupied | 1,000 (20.6%) | $41,935 |
| Average | 4,856 (100.0%) | $80,321 |
Occupancy by Householder Income Bracket in Dent
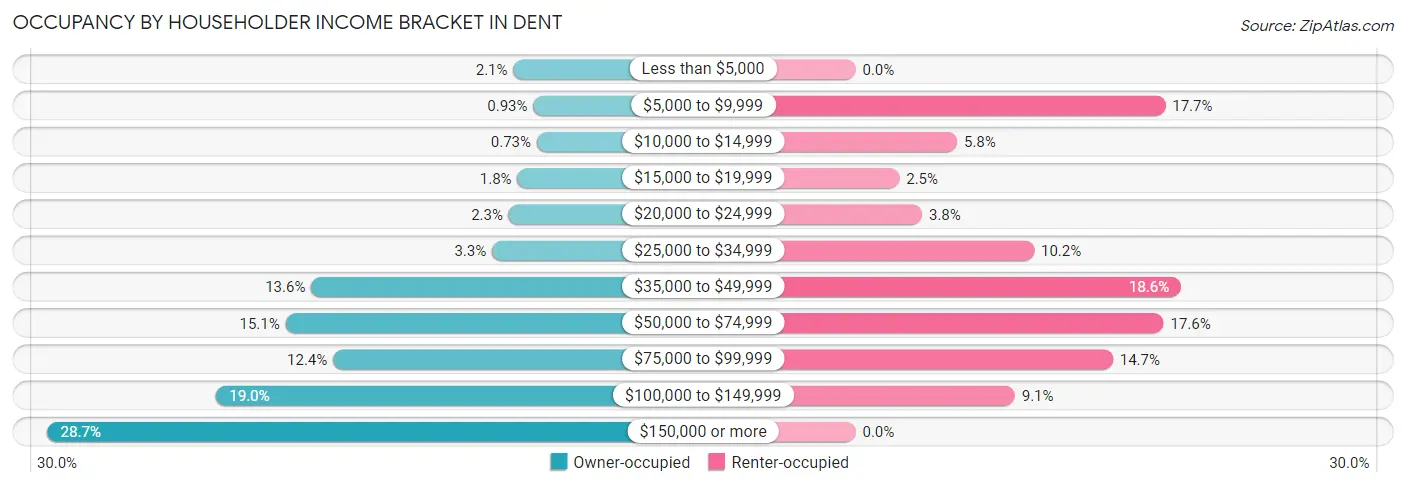
| Income Bracket | Owner-occupied | Renter-occupied |
| Less than $5,000 | 80 (2.1%) | 0 (0.0%) |
| $5,000 to $9,999 | 36 (0.9%) | 177 (17.7%) |
| $10,000 to $14,999 | 28 (0.7%) | 58 (5.8%) |
| $15,000 to $19,999 | 71 (1.8%) | 25 (2.5%) |
| $20,000 to $24,999 | 90 (2.3%) | 38 (3.8%) |
| $25,000 to $34,999 | 127 (3.3%) | 102 (10.2%) |
| $35,000 to $49,999 | 525 (13.6%) | 186 (18.6%) |
| $50,000 to $74,999 | 582 (15.1%) | 176 (17.6%) |
| $75,000 to $99,999 | 477 (12.4%) | 147 (14.7%) |
| $100,000 to $149,999 | 734 (19.0%) | 91 (9.1%) |
| $150,000 or more | 1,106 (28.7%) | 0 (0.0%) |
| Total | 3,856 (100.0%) | 1,000 (100.0%) |
Monthly Housing Cost Tiers in Dent
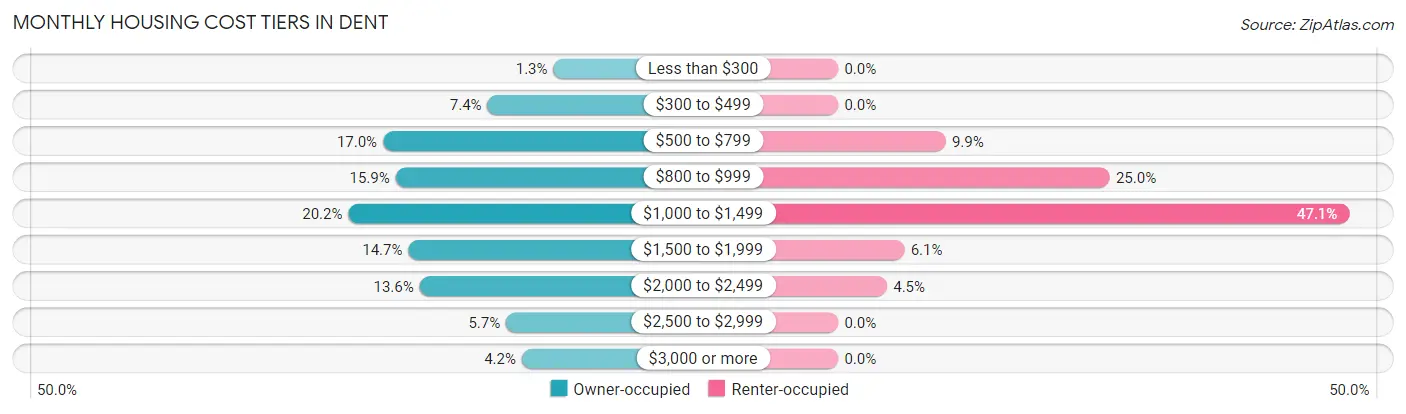
| Monthly Cost | Owner-occupied | Renter-occupied |
| Less than $300 | 51 (1.3%) | 0 (0.0%) |
| $300 to $499 | 285 (7.4%) | 0 (0.0%) |
| $500 to $799 | 656 (17.0%) | 99 (9.9%) |
| $800 to $999 | 611 (15.9%) | 250 (25.0%) |
| $1,000 to $1,499 | 779 (20.2%) | 471 (47.1%) |
| $1,500 to $1,999 | 566 (14.7%) | 61 (6.1%) |
| $2,000 to $2,499 | 526 (13.6%) | 45 (4.5%) |
| $2,500 to $2,999 | 219 (5.7%) | 0 (0.0%) |
| $3,000 or more | 163 (4.2%) | 0 (0.0%) |
| Total | 3,856 (100.0%) | 1,000 (100.0%) |
Physical Housing Characteristics in Dent
Housing Structures in Dent
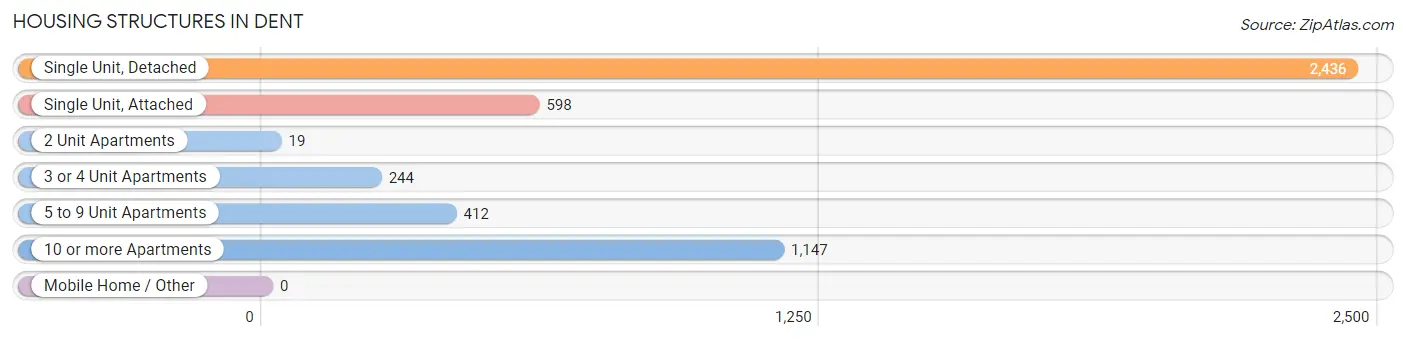
| Structure Type | # Housing Units | % Housing Units |
| Single Unit, Detached | 2,436 | 50.2% |
| Single Unit, Attached | 598 | 12.3% |
| 2 Unit Apartments | 19 | 0.4% |
| 3 or 4 Unit Apartments | 244 | 5.0% |
| 5 to 9 Unit Apartments | 412 | 8.5% |
| 10 or more Apartments | 1,147 | 23.6% |
| Mobile Home / Other | 0 | 0.0% |
| Total | 4,856 | 100.0% |
Housing Structures by Occupancy in Dent
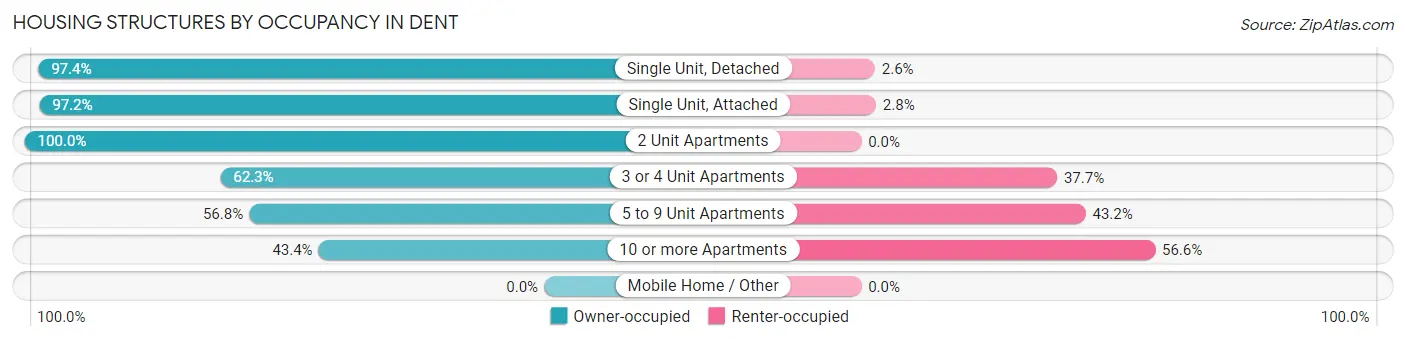
| Structure Type | Owner-occupied | Renter-occupied |
| Single Unit, Detached | 2,372 (97.4%) | 64 (2.6%) |
| Single Unit, Attached | 581 (97.2%) | 17 (2.8%) |
| 2 Unit Apartments | 19 (100.0%) | 0 (0.0%) |
| 3 or 4 Unit Apartments | 152 (62.3%) | 92 (37.7%) |
| 5 to 9 Unit Apartments | 234 (56.8%) | 178 (43.2%) |
| 10 or more Apartments | 498 (43.4%) | 649 (56.6%) |
| Mobile Home / Other | 0 (0.0%) | 0 (0.0%) |
| Total | 3,856 (79.4%) | 1,000 (20.6%) |
Housing Structures by Number of Rooms in Dent
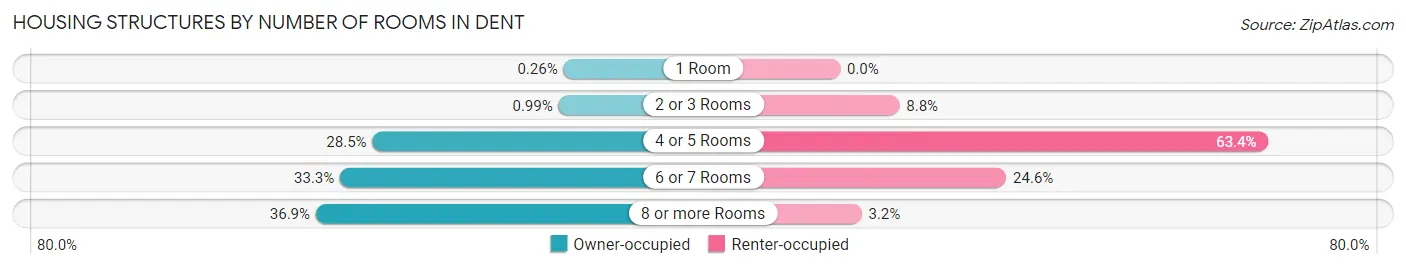
| Number of Rooms | Owner-occupied | Renter-occupied |
| 1 Room | 10 (0.3%) | 0 (0.0%) |
| 2 or 3 Rooms | 38 (1.0%) | 88 (8.8%) |
| 4 or 5 Rooms | 1,100 (28.5%) | 634 (63.4%) |
| 6 or 7 Rooms | 1,285 (33.3%) | 246 (24.6%) |
| 8 or more Rooms | 1,423 (36.9%) | 32 (3.2%) |
| Total | 3,856 (100.0%) | 1,000 (100.0%) |
Housing Structure by Heating Type in Dent
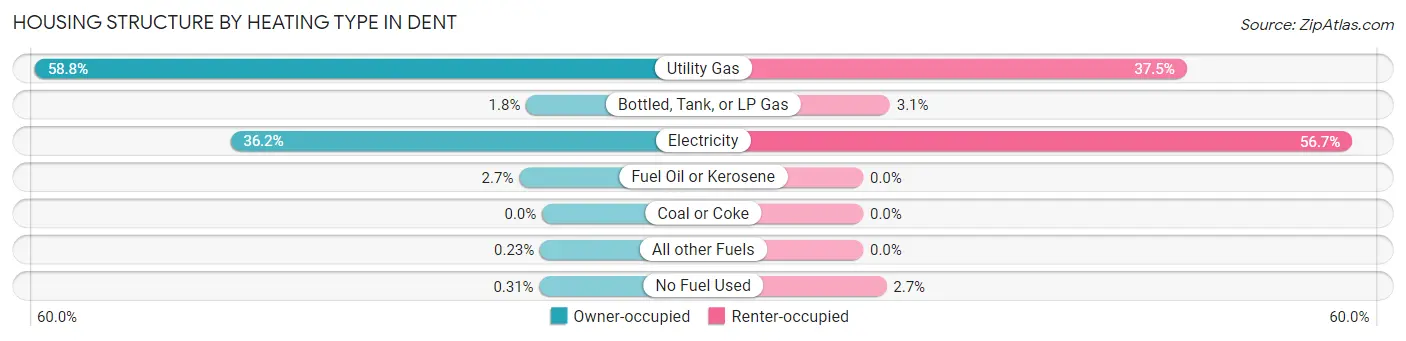
| Heating Type | Owner-occupied | Renter-occupied |
| Utility Gas | 2,268 (58.8%) | 375 (37.5%) |
| Bottled, Tank, or LP Gas | 71 (1.8%) | 31 (3.1%) |
| Electricity | 1,394 (36.1%) | 567 (56.7%) |
| Fuel Oil or Kerosene | 102 (2.6%) | 0 (0.0%) |
| Coal or Coke | 0 (0.0%) | 0 (0.0%) |
| All other Fuels | 9 (0.2%) | 0 (0.0%) |
| No Fuel Used | 12 (0.3%) | 27 (2.7%) |
| Total | 3,856 (100.0%) | 1,000 (100.0%) |
Household Vehicle Usage in Dent
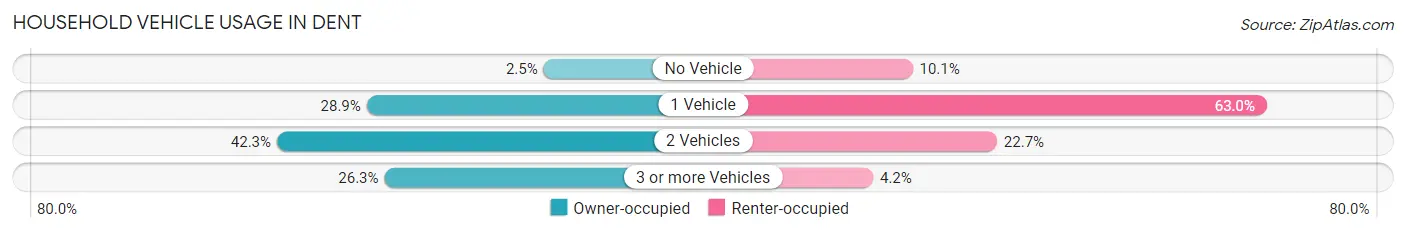
| Vehicles per Household | Owner-occupied | Renter-occupied |
| No Vehicle | 96 (2.5%) | 101 (10.1%) |
| 1 Vehicle | 1,115 (28.9%) | 630 (63.0%) |
| 2 Vehicles | 1,632 (42.3%) | 227 (22.7%) |
| 3 or more Vehicles | 1,013 (26.3%) | 42 (4.2%) |
| Total | 3,856 (100.0%) | 1,000 (100.0%) |
Real Estate & Mortgages in Dent
Real Estate and Mortgage Overview in Dent
| Characteristic | Without Mortgage | With Mortgage |
| Housing Units | 1,187 | 2,669 |
| Median Property Value | $233,300 | $252,400 |
| Median Household Income | $73,150 | $877 |
| Monthly Housing Costs | $689 | $163 |
| Real Estate Taxes | $3,443 | $69 |
Property Value by Mortgage Status in Dent
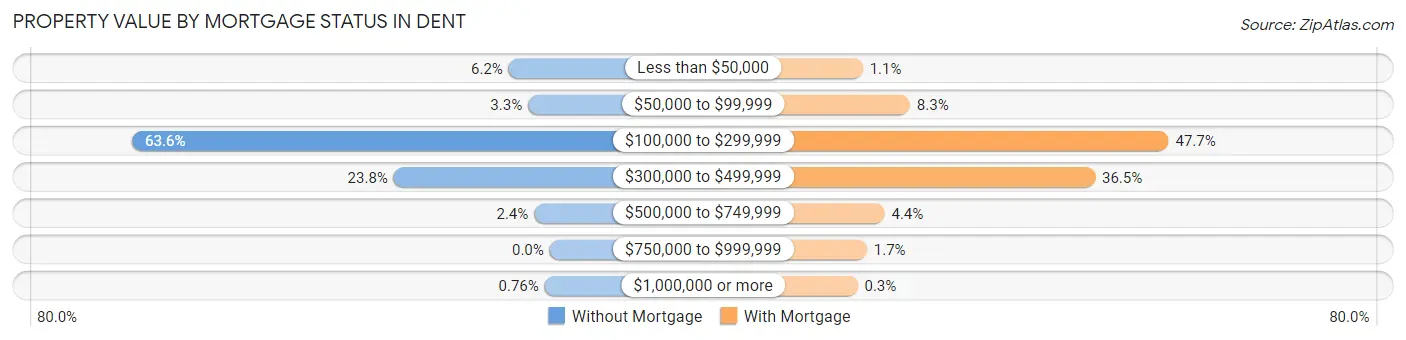
| Property Value | Without Mortgage | With Mortgage |
| Less than $50,000 | 74 (6.2%) | 29 (1.1%) |
| $50,000 to $99,999 | 39 (3.3%) | 221 (8.3%) |
| $100,000 to $299,999 | 755 (63.6%) | 1,273 (47.7%) |
| $300,000 to $499,999 | 282 (23.8%) | 974 (36.5%) |
| $500,000 to $749,999 | 28 (2.4%) | 118 (4.4%) |
| $750,000 to $999,999 | 0 (0.0%) | 46 (1.7%) |
| $1,000,000 or more | 9 (0.8%) | 8 (0.3%) |
| Total | 1,187 (100.0%) | 2,669 (100.0%) |
Household Income by Mortgage Status in Dent
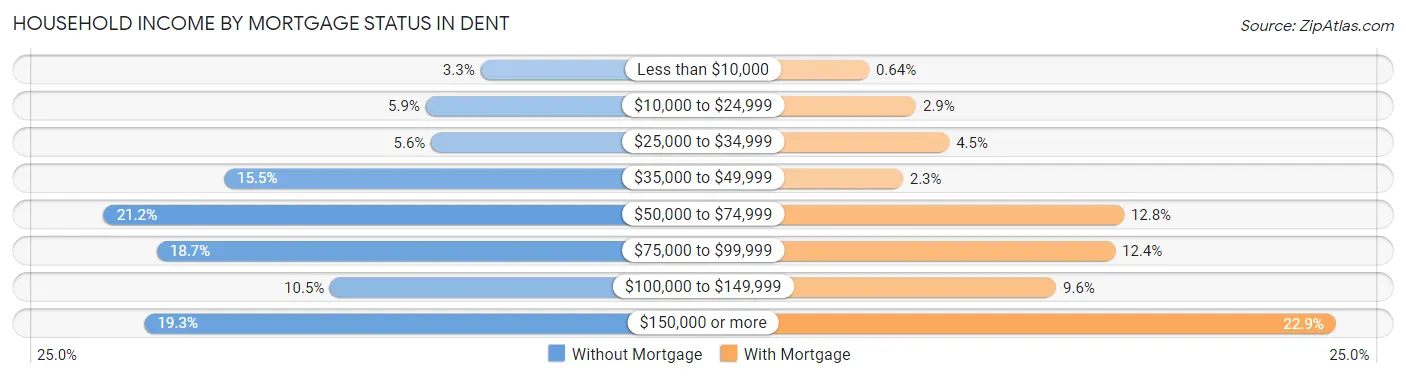
| Household Income | Without Mortgage | With Mortgage |
| Less than $10,000 | 39 (3.3%) | 17 (0.6%) |
| $10,000 to $24,999 | 70 (5.9%) | 77 (2.9%) |
| $25,000 to $34,999 | 67 (5.6%) | 119 (4.5%) |
| $35,000 to $49,999 | 184 (15.5%) | 60 (2.2%) |
| $50,000 to $74,999 | 252 (21.2%) | 341 (12.8%) |
| $75,000 to $99,999 | 222 (18.7%) | 330 (12.4%) |
| $100,000 to $149,999 | 124 (10.4%) | 255 (9.6%) |
| $150,000 or more | 229 (19.3%) | 610 (22.9%) |
| Total | 1,187 (100.0%) | 2,669 (100.0%) |
Property Value to Household Income Ratio in Dent
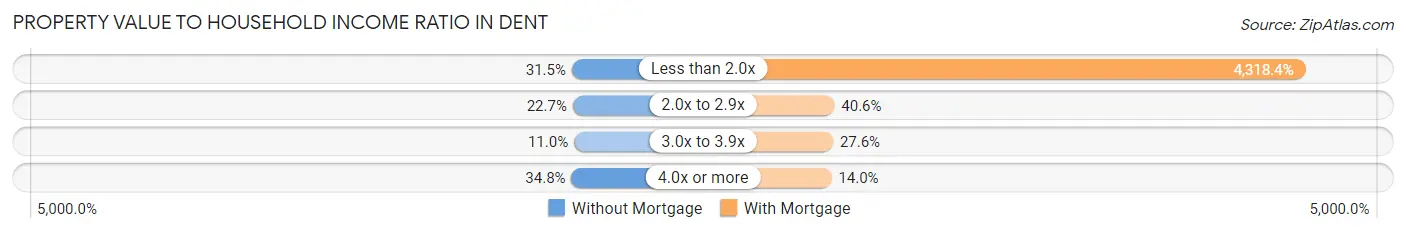
| Value-to-Income Ratio | Without Mortgage | With Mortgage |
| Less than 2.0x | 374 (31.5%) | 115,257 (4,318.4%) |
| 2.0x to 2.9x | 269 (22.7%) | 1,084 (40.6%) |
| 3.0x to 3.9x | 131 (11.0%) | 736 (27.6%) |
| 4.0x or more | 413 (34.8%) | 373 (14.0%) |
| Total | 1,187 (100.0%) | 2,669 (100.0%) |
Real Estate Taxes by Mortgage Status in Dent
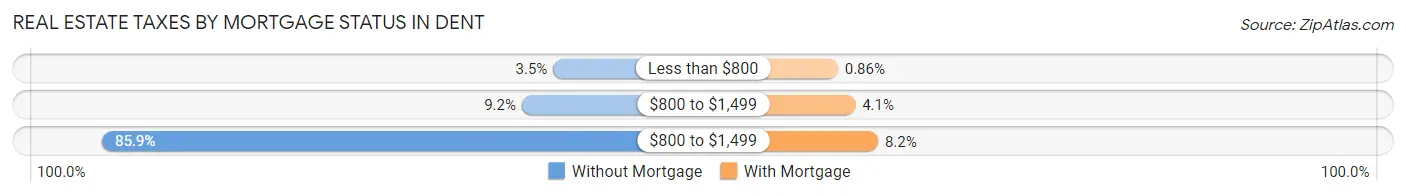
| Property Taxes | Without Mortgage | With Mortgage |
| Less than $800 | 41 (3.5%) | 23 (0.9%) |
| $800 to $1,499 | 109 (9.2%) | 108 (4.1%) |
| $800 to $1,499 | 1,019 (85.9%) | 219 (8.2%) |
| Total | 1,187 (100.0%) | 2,669 (100.0%) |
Health & Disability in Dent
Health Insurance Coverage by Age in Dent
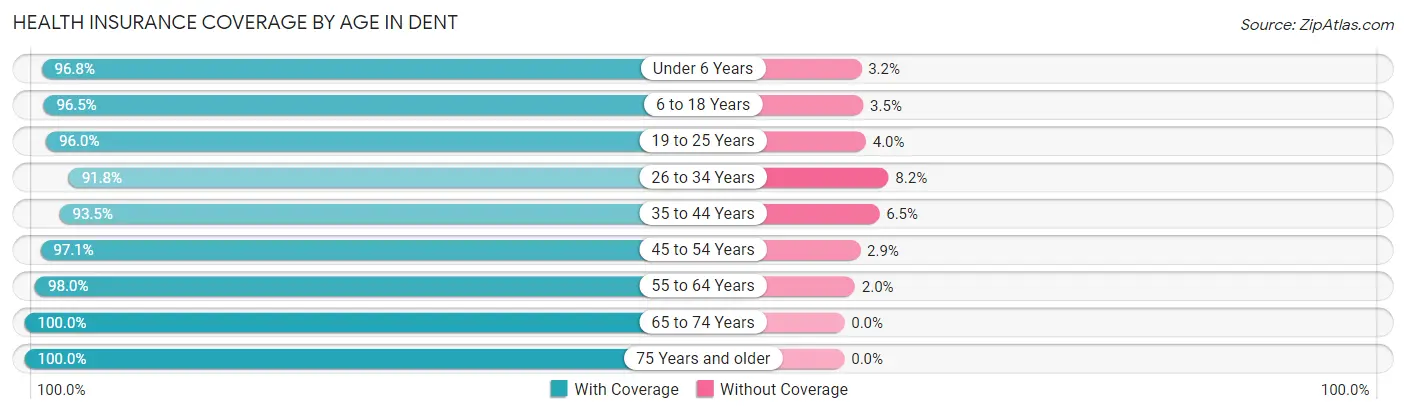
| Age Bracket | With Coverage | Without Coverage |
| Under 6 Years | 1,163 (96.8%) | 38 (3.2%) |
| 6 to 18 Years | 1,862 (96.5%) | 68 (3.5%) |
| 19 to 25 Years | 550 (96.0%) | 23 (4.0%) |
| 26 to 34 Years | 1,071 (91.8%) | 96 (8.2%) |
| 35 to 44 Years | 1,406 (93.5%) | 98 (6.5%) |
| 45 to 54 Years | 1,089 (97.1%) | 33 (2.9%) |
| 55 to 64 Years | 1,645 (98.0%) | 33 (2.0%) |
| 65 to 74 Years | 1,416 (100.0%) | 0 (0.0%) |
| 75 Years and older | 1,075 (100.0%) | 0 (0.0%) |
| Total | 11,277 (96.7%) | 389 (3.3%) |
Health Insurance Coverage by Citizenship Status in Dent
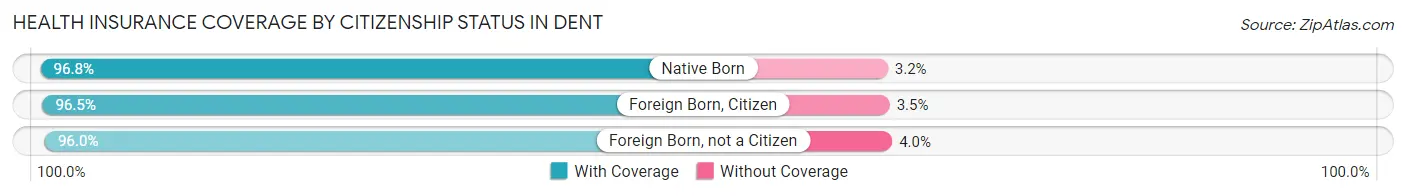
| Citizenship Status | With Coverage | Without Coverage |
| Native Born | 1,163 (96.8%) | 38 (3.2%) |
| Foreign Born, Citizen | 1,862 (96.5%) | 68 (3.5%) |
| Foreign Born, not a Citizen | 550 (96.0%) | 23 (4.0%) |
Health Insurance Coverage by Household Income in Dent
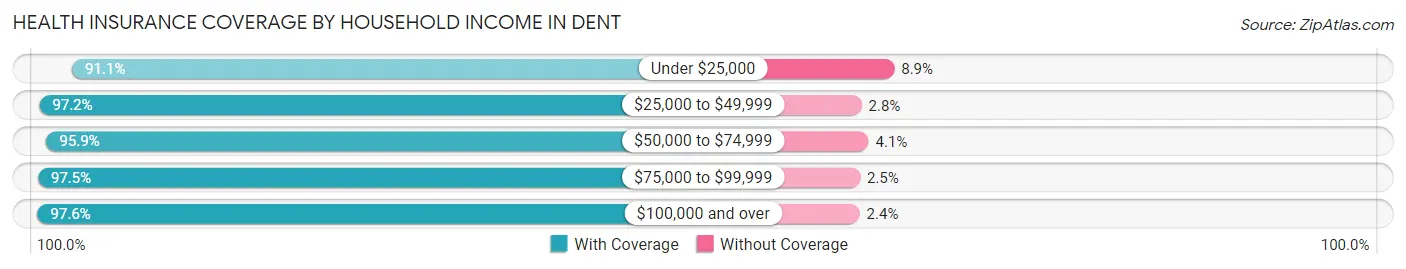
| Household Income | With Coverage | Without Coverage |
| Under $25,000 | 1,003 (91.1%) | 98 (8.9%) |
| $25,000 to $49,999 | 1,405 (97.2%) | 40 (2.8%) |
| $50,000 to $74,999 | 1,713 (95.9%) | 73 (4.1%) |
| $75,000 to $99,999 | 1,336 (97.5%) | 34 (2.5%) |
| $100,000 and over | 5,820 (97.6%) | 144 (2.4%) |
Public vs Private Health Insurance Coverage by Age in Dent
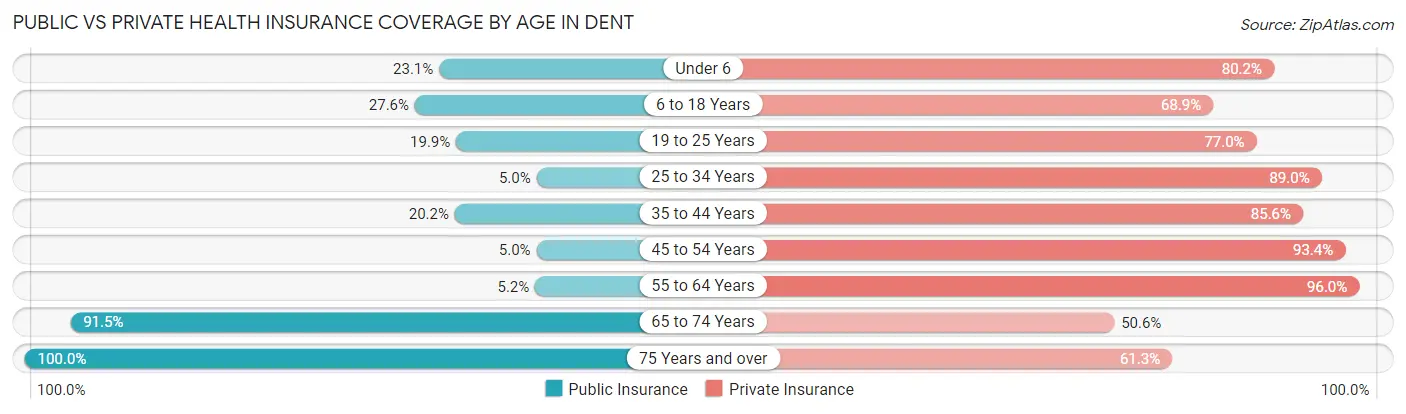
| Age Bracket | Public Insurance | Private Insurance |
| Under 6 | 277 (23.1%) | 963 (80.2%) |
| 6 to 18 Years | 532 (27.6%) | 1,330 (68.9%) |
| 19 to 25 Years | 114 (19.9%) | 441 (77.0%) |
| 25 to 34 Years | 58 (5.0%) | 1,039 (89.0%) |
| 35 to 44 Years | 303 (20.2%) | 1,287 (85.6%) |
| 45 to 54 Years | 56 (5.0%) | 1,048 (93.4%) |
| 55 to 64 Years | 88 (5.2%) | 1,611 (96.0%) |
| 65 to 74 Years | 1,296 (91.5%) | 716 (50.6%) |
| 75 Years and over | 1,075 (100.0%) | 659 (61.3%) |
| Total | 3,799 (32.6%) | 9,094 (77.9%) |
Disability Status by Sex by Age in Dent
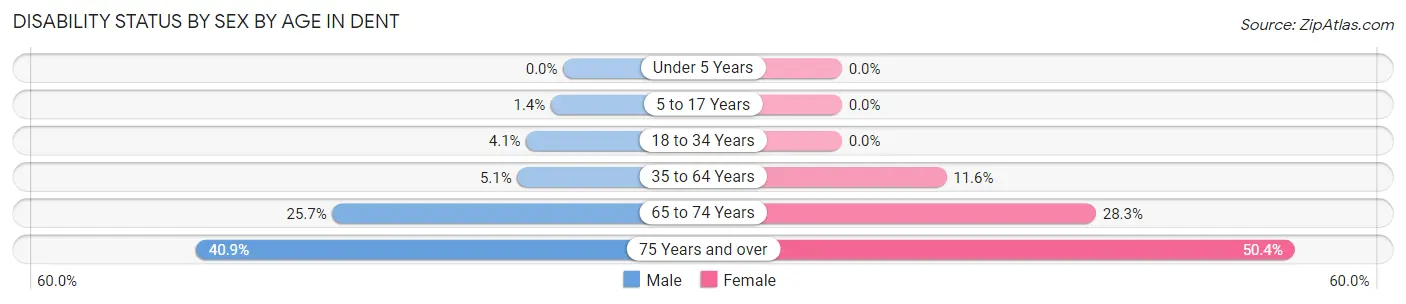
| Age Bracket | Male | Female |
| Under 5 Years | 0 (0.0%) | 0 (0.0%) |
| 5 to 17 Years | 14 (1.4%) | 0 (0.0%) |
| 18 to 34 Years | 35 (4.1%) | 0 (0.0%) |
| 35 to 64 Years | 110 (5.1%) | 250 (11.6%) |
| 65 to 74 Years | 165 (25.7%) | 219 (28.3%) |
| 75 Years and over | 160 (40.9%) | 345 (50.4%) |
Disability Class by Sex by Age in Dent
Disability Class: Hearing Difficulty
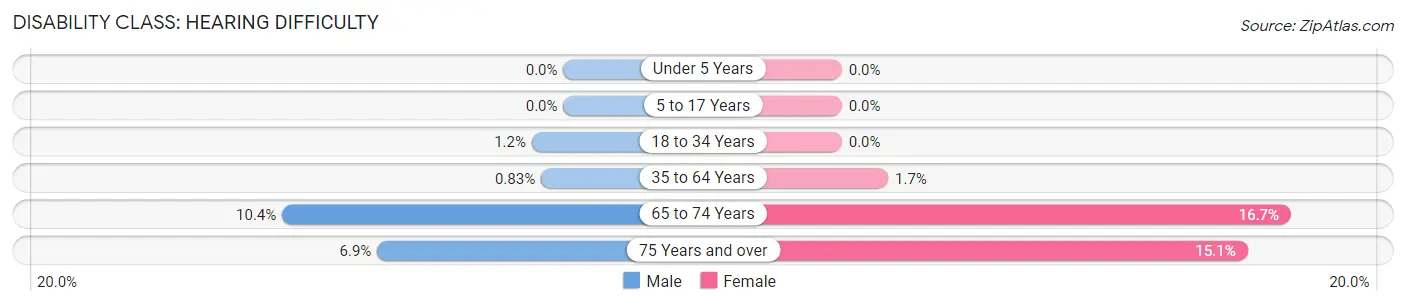
| Age Bracket | Male | Female |
| Under 5 Years | 0 (0.0%) | 0 (0.0%) |
| 5 to 17 Years | 0 (0.0%) | 0 (0.0%) |
| 18 to 34 Years | 10 (1.2%) | 0 (0.0%) |
| 35 to 64 Years | 18 (0.8%) | 37 (1.7%) |
| 65 to 74 Years | 67 (10.4%) | 129 (16.7%) |
| 75 Years and over | 27 (6.9%) | 103 (15.1%) |
Disability Class: Vision Difficulty
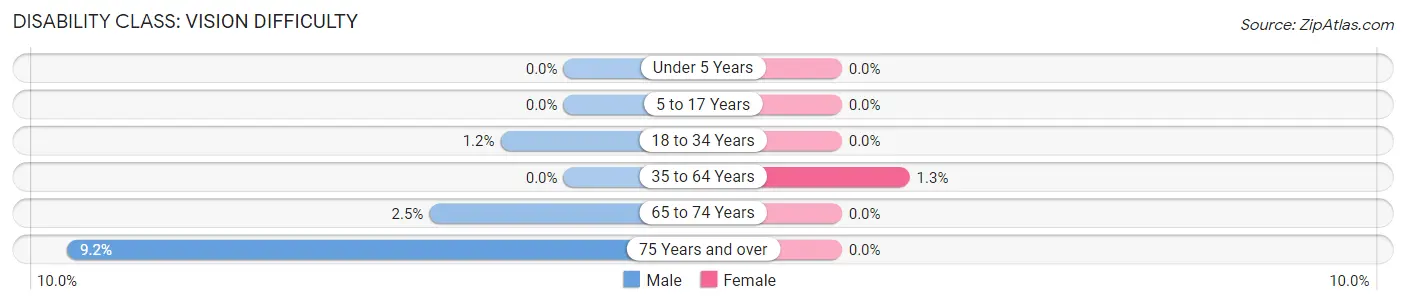
| Age Bracket | Male | Female |
| Under 5 Years | 0 (0.0%) | 0 (0.0%) |
| 5 to 17 Years | 0 (0.0%) | 0 (0.0%) |
| 18 to 34 Years | 10 (1.2%) | 0 (0.0%) |
| 35 to 64 Years | 0 (0.0%) | 27 (1.3%) |
| 65 to 74 Years | 16 (2.5%) | 0 (0.0%) |
| 75 Years and over | 36 (9.2%) | 0 (0.0%) |
Disability Class: Cognitive Difficulty
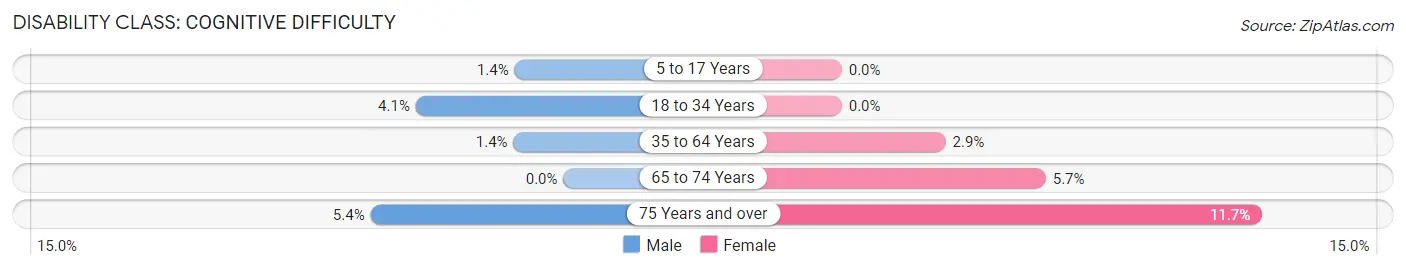
| Age Bracket | Male | Female |
| 5 to 17 Years | 14 (1.4%) | 0 (0.0%) |
| 18 to 34 Years | 35 (4.1%) | 0 (0.0%) |
| 35 to 64 Years | 30 (1.4%) | 62 (2.9%) |
| 65 to 74 Years | 0 (0.0%) | 44 (5.7%) |
| 75 Years and over | 21 (5.4%) | 80 (11.7%) |
Disability Class: Ambulatory Difficulty
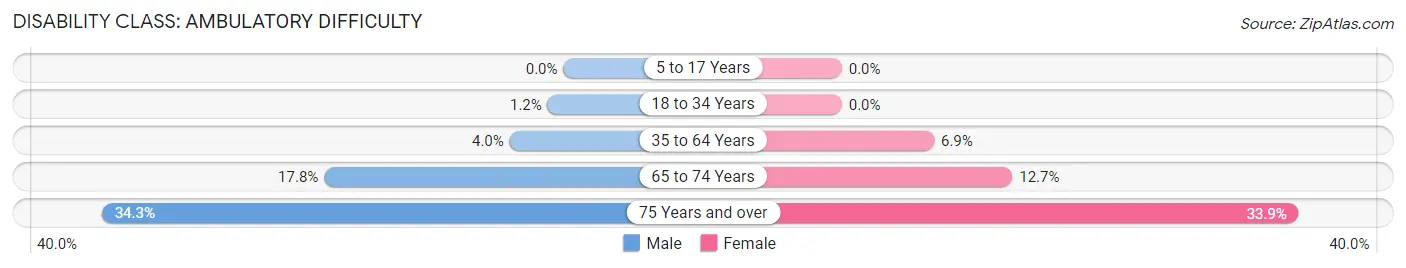
| Age Bracket | Male | Female |
| 5 to 17 Years | 0 (0.0%) | 0 (0.0%) |
| 18 to 34 Years | 10 (1.2%) | 0 (0.0%) |
| 35 to 64 Years | 86 (4.0%) | 147 (6.9%) |
| 65 to 74 Years | 114 (17.8%) | 98 (12.7%) |
| 75 Years and over | 134 (34.3%) | 232 (33.9%) |
Disability Class: Self-Care Difficulty
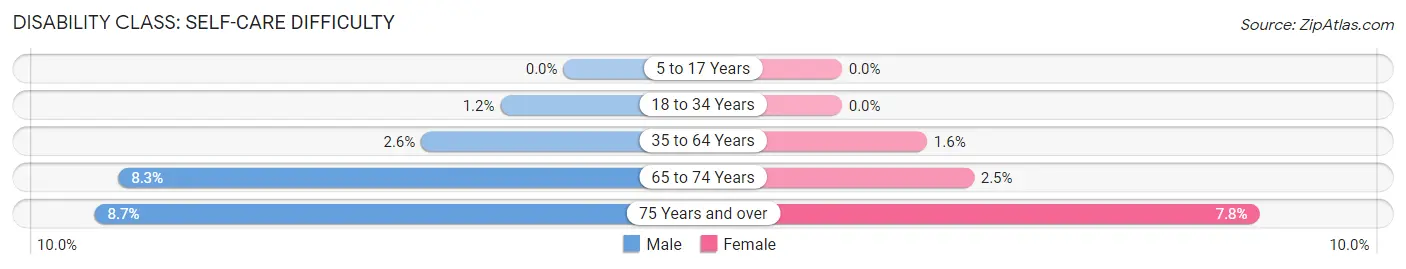
| Age Bracket | Male | Female |
| 5 to 17 Years | 0 (0.0%) | 0 (0.0%) |
| 18 to 34 Years | 10 (1.2%) | 0 (0.0%) |
| 35 to 64 Years | 57 (2.6%) | 34 (1.6%) |
| 65 to 74 Years | 53 (8.3%) | 19 (2.5%) |
| 75 Years and over | 34 (8.7%) | 53 (7.7%) |
Technology Access in Dent
Computing Device Access in Dent
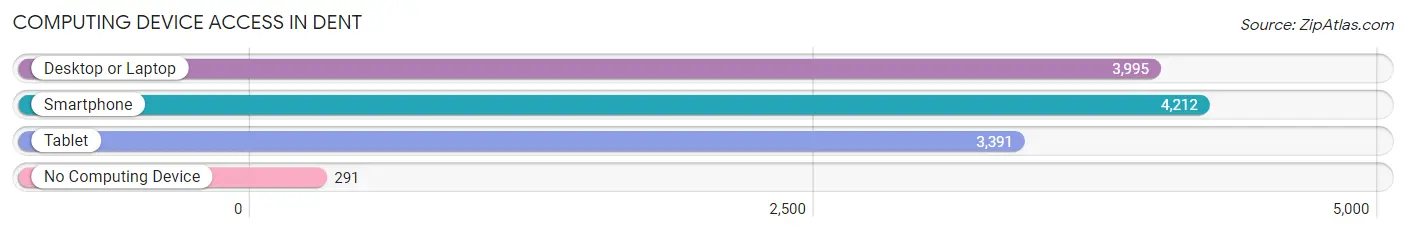
| Device Type | # Households | % Households |
| Desktop or Laptop | 3,995 | 82.3% |
| Smartphone | 4,212 | 86.7% |
| Tablet | 3,391 | 69.8% |
| No Computing Device | 291 | 6.0% |
| Total | 4,856 | 100.0% |
Internet Access in Dent
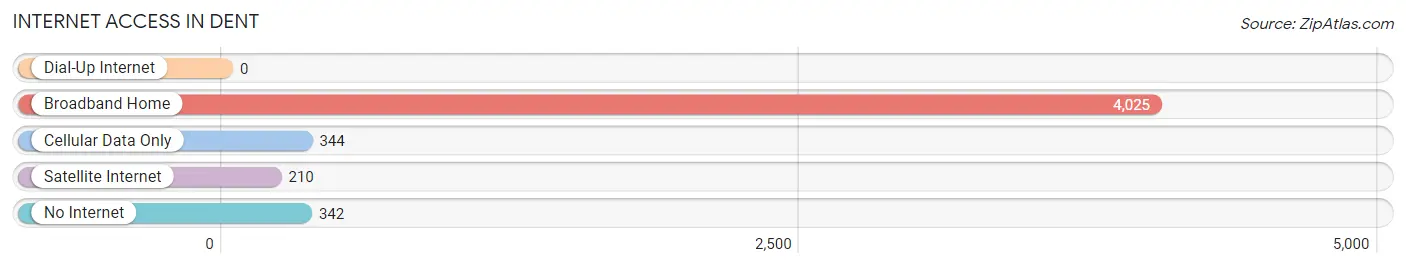
| Internet Type | # Households | % Households |
| Dial-Up Internet | 0 | 0.0% |
| Broadband Home | 4,025 | 82.9% |
| Cellular Data Only | 344 | 7.1% |
| Satellite Internet | 210 | 4.3% |
| No Internet | 342 | 7.0% |
| Total | 4,856 | 100.0% |
Dent Summary
Dent is a small unincorporated community located in the southeastern corner of Brown County, Ohio. It is situated along the Ohio River, approximately 10 miles south of the county seat of Georgetown. The community is home to a population of approximately 200 people, and is surrounded by rolling hills and farmland.
History
Dent was first settled in the early 1800s by a group of German immigrants. The community was originally known as “Dent’s Station”, named after the first settler, John Dent. The community was officially established in 1845, and the first post office was established in 1848.
In the late 1800s, Dent was a thriving community with a population of over 500 people. The town was home to several businesses, including a general store, a blacksmith shop, a sawmill, and a gristmill. The town also had a school, a church, and a cemetery.
In the early 1900s, the population of Dent began to decline as many of the residents moved away in search of better economic opportunities. By the mid-1900s, the population had dropped to just over 200 people.
Geography
Dent is located in the southeastern corner of Brown County, Ohio. It is situated along the Ohio River, approximately 10 miles south of the county seat of Georgetown. The community is surrounded by rolling hills and farmland.
The climate in Dent is characterized by hot, humid summers and cold, wet winters. The average annual temperature is around 50 degrees Fahrenheit, and the average annual precipitation is around 40 inches.
Economy
The economy of Dent is largely based on agriculture. The town is home to several farms, which produce a variety of crops, including corn, soybeans, wheat, and hay. The town also has a few small businesses, including a general store, a gas station, and a restaurant.
Demographics
As of the 2010 census, the population of Dent was estimated to be around 200 people. The racial makeup of the town was 97.5% White, 0.5% African American, 0.5% Native American, and 1.5% from other races. The median household income was $37,500, and the median home value was $90,000.
Conclusion
Dent is a small unincorporated community located in the southeastern corner of Brown County, Ohio. It is situated along the Ohio River, approximately 10 miles south of the county seat of Georgetown. The community is home to a population of approximately 200 people, and is surrounded by rolling hills and farmland. The economy of Dent is largely based on agriculture, and the town is home to several farms, which produce a variety of crops. The racial makeup of the town is predominantly White, with a small percentage of African American, Native American, and other races. The median household income is around $37,500, and the median home value is around $90,000.
Common Questions
What is Per Capita Income in Dent?
Per Capita income in Dent is $43,223.
What is the Median Family Income in Dent?
Median Family Income in Dent is $107,219.
What is the Median Household income in Dent?
Median Household Income in Dent is $80,321.
What is Income or Wage Gap in Dent?
Income or Wage Gap in Dent is 27.3%.
Women in Dent earn 72.7 cents for every dollar earned by a man.
What is Inequality or Gini Index in Dent?
Inequality or Gini Index in Dent is 0.42.
What is the Total Population of Dent?
Total Population of Dent is 11,666.
What is the Total Male Population of Dent?
Total Male Population of Dent is 5,556.
What is the Total Female Population of Dent?
Total Female Population of Dent is 6,110.
What is the Ratio of Males per 100 Females in Dent?
There are 90.93 Males per 100 Females in Dent.
What is the Ratio of Females per 100 Males in Dent?
There are 109.97 Females per 100 Males in Dent.
What is the Median Population Age in Dent?
Median Population Age in Dent is 40.9 Years.
What is the Average Family Size in Dent
Average Family Size in Dent is 3.0 People.
What is the Average Household Size in Dent
Average Household Size in Dent is 2.4 People.
How Large is the Labor Force in Dent?
There are 5,802 People in the Labor Forcein in Dent.
What is the Percentage of People in the Labor Force in Dent?
64.7% of People are in the Labor Force in Dent.
What is the Unemployment Rate in Dent?
Unemployment Rate in Dent is 4.5%.