Grove City, OH Map & Demographics
Grove City Map
Grove City Overview
$45,126
PER CAPITA INCOME
$111,439
AVG FAMILY INCOME
$84,765
AVG HOUSEHOLD INCOME
21.0%
WAGE / INCOME GAP [ % ]
79.0¢/ $1
WAGE / INCOME GAP [ $ ]
0.41
INEQUALITY / GINI INDEX
41,423
TOTAL POPULATION
20,821
MALE POPULATION
20,602
FEMALE POPULATION
101.06
MALES / 100 FEMALES
98.95
FEMALES / 100 MALES
40.6
MEDIAN AGE
2.9
AVG FAMILY SIZE
2.4
AVG HOUSEHOLD SIZE
22,871
LABOR FORCE [ PEOPLE ]
69.4%
PERCENT IN LABOR FORCE
2.4%
UNEMPLOYMENT RATE
Grove City Zip Codes
Grove City Area Codes
Income in Grove City
Income Overview in Grove City
Per Capita Income in Grove City is $45,126, while median incomes of families and households are $111,439 and $84,765 respectively.
| Characteristic | Number | Measure |
| Per Capita Income | 41,423 | $45,126 |
| Median Family Income | 11,837 | $111,439 |
| Mean Family Income | 11,837 | $131,503 |
| Median Household Income | 16,897 | $84,765 |
| Mean Household Income | 16,897 | $111,624 |
| Income Deficit | 11,837 | $0 |
| Wage / Income Gap (%) | 41,423 | 20.99% |
| Wage / Income Gap ($) | 41,423 | 79.01¢ per $1 |
| Gini / Inequality Index | 41,423 | 0.41 |
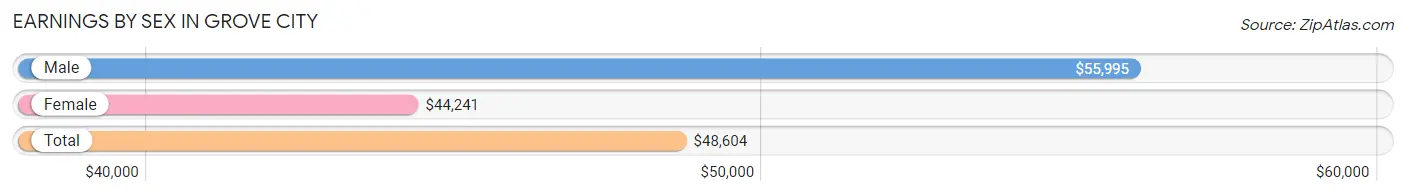
Earnings by Sex in Grove City
Average Earnings in Grove City are $48,604, $55,995 for men and $44,241 for women, a difference of 21.0%.
| Sex | Number | Average Earnings |
| Male | 12,296 (52.1%) | $55,995 |
| Female | 11,304 (47.9%) | $44,241 |
| Total | 23,600 (100.0%) | $48,604 |
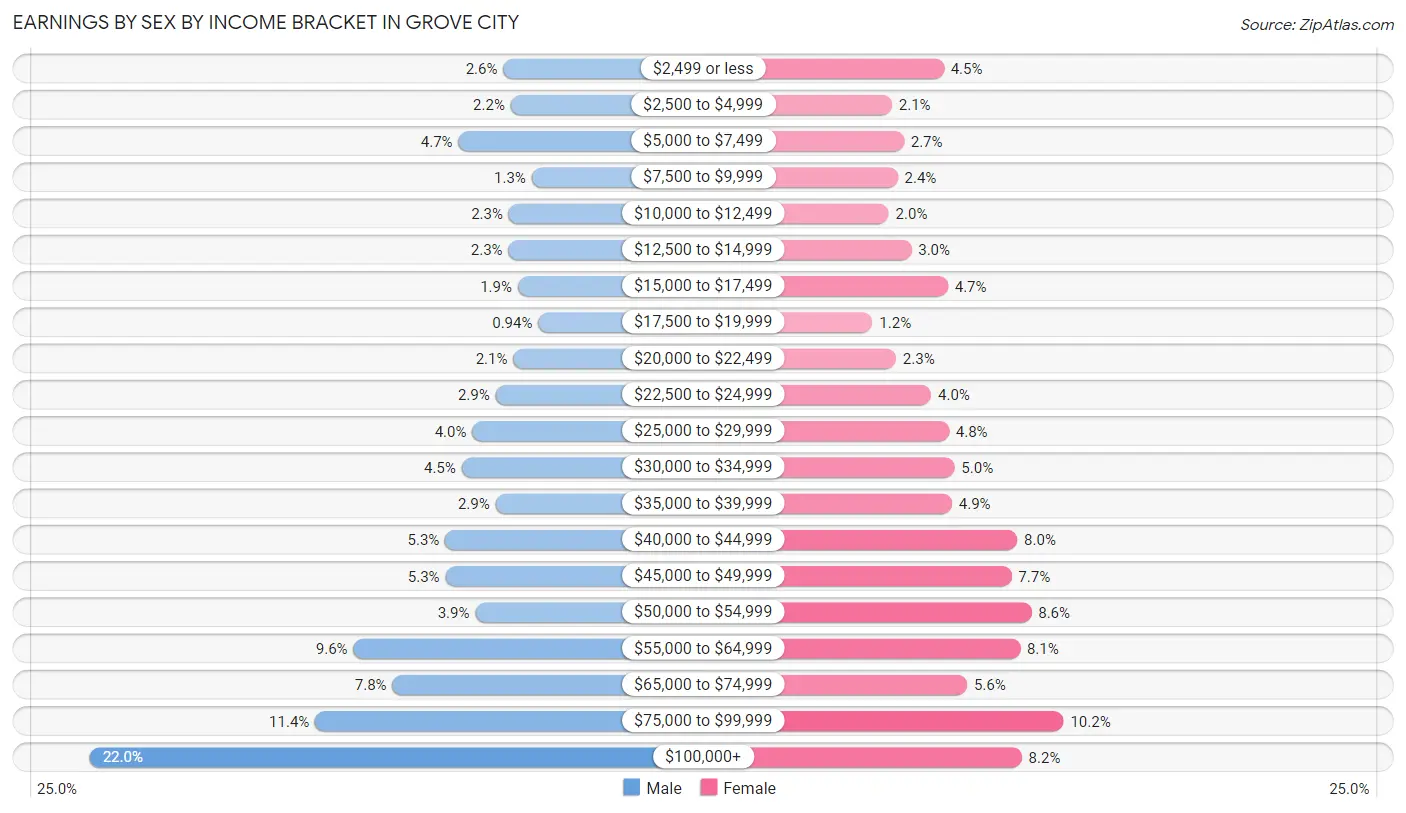
Earnings by Sex by Income Bracket in Grove City
The most common earnings brackets in Grove City are $100,000+ for men (2,699 | 22.0%) and $75,000 to $99,999 for women (1,147 | 10.2%).
| Income | Male | Female |
| $2,499 or less | 317 (2.6%) | 513 (4.5%) |
| $2,500 to $4,999 | 274 (2.2%) | 239 (2.1%) |
| $5,000 to $7,499 | 575 (4.7%) | 302 (2.7%) |
| $7,500 to $9,999 | 154 (1.3%) | 269 (2.4%) |
| $10,000 to $12,499 | 285 (2.3%) | 221 (2.0%) |
| $12,500 to $14,999 | 288 (2.3%) | 341 (3.0%) |
| $15,000 to $17,499 | 234 (1.9%) | 535 (4.7%) |
| $17,500 to $19,999 | 116 (0.9%) | 136 (1.2%) |
| $20,000 to $22,499 | 259 (2.1%) | 260 (2.3%) |
| $22,500 to $24,999 | 362 (2.9%) | 446 (4.0%) |
| $25,000 to $29,999 | 496 (4.0%) | 540 (4.8%) |
| $30,000 to $34,999 | 557 (4.5%) | 570 (5.0%) |
| $35,000 to $39,999 | 362 (2.9%) | 556 (4.9%) |
| $40,000 to $44,999 | 652 (5.3%) | 902 (8.0%) |
| $45,000 to $49,999 | 651 (5.3%) | 871 (7.7%) |
| $50,000 to $54,999 | 478 (3.9%) | 977 (8.6%) |
| $55,000 to $64,999 | 1,181 (9.6%) | 917 (8.1%) |
| $65,000 to $74,999 | 955 (7.8%) | 636 (5.6%) |
| $75,000 to $99,999 | 1,401 (11.4%) | 1,147 (10.2%) |
| $100,000+ | 2,699 (22.0%) | 926 (8.2%) |
| Total | 12,296 (100.0%) | 11,304 (100.0%) |
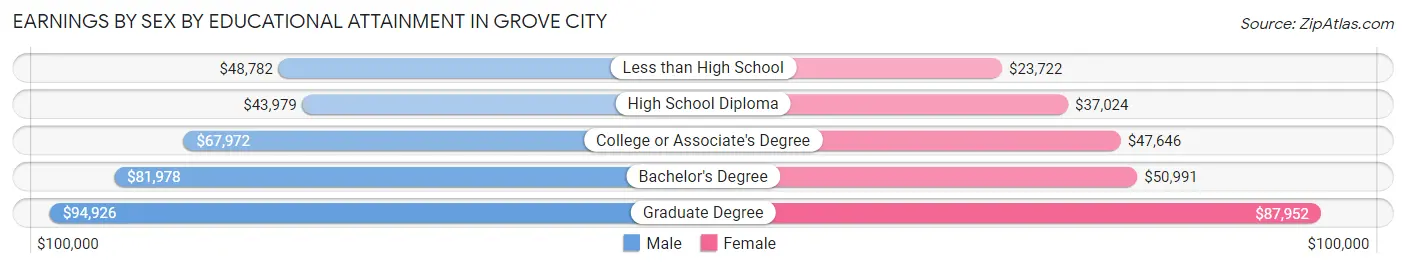
Earnings by Sex by Educational Attainment in Grove City
Average earnings in Grove City are $62,794 for men and $47,604 for women, a difference of 24.2%. Men with an educational attainment of graduate degree enjoy the highest average annual earnings of $94,926, while those with high school diploma education earn the least with $43,979. Women with an educational attainment of graduate degree earn the most with the average annual earnings of $87,952, while those with less than high school education have the smallest earnings of $23,722.
| Educational Attainment | Male Income | Female Income |
| Less than High School | $48,782 | $23,722 |
| High School Diploma | $43,979 | $37,024 |
| College or Associate's Degree | $67,972 | $47,646 |
| Bachelor's Degree | $81,978 | $50,991 |
| Graduate Degree | $94,926 | $87,952 |
| Total | $62,794 | $47,604 |
Family Income in Grove City
Family Income Brackets in Grove City
According to the Grove City family income data, there are 2,900 families falling into the $100,000 to $149,999 income range, which is the most common income bracket and makes up 24.5% of all families. Conversely, the less than $10,000 income bracket is the least frequent group with only 118 families (1.0%) belonging to this category.

| Income Bracket | # Families | % Families |
| Less than $10,000 | 118 | 1.0% |
| $10,000 to $14,999 | 154 | 1.3% |
| $15,000 to $24,999 | 249 | 2.1% |
| $25,000 to $34,999 | 343 | 2.9% |
| $35,000 to $49,999 | 864 | 7.3% |
| $50,000 to $74,999 | 1,870 | 15.8% |
| $75,000 to $99,999 | 1,740 | 14.7% |
| $100,000 to $149,999 | 2,900 | 24.5% |
| $150,000 to $199,999 | 2,178 | 18.4% |
| $200,000+ | 1,420 | 12.0% |
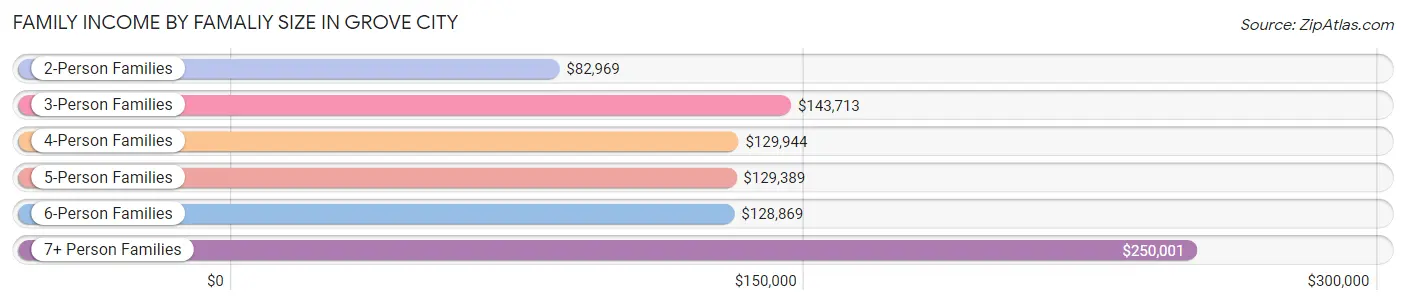
Family Income by Famaliy Size in Grove City
7+ person families (95 | 0.8%) account for the highest median family income in Grove City with $250,001 per family, while 3-person families (2,835 | 23.9%) have the highest median income of $47,904 per family member.
| Income Bracket | # Families | Median Income |
| 2-Person Families | 5,846 (49.4%) | $82,969 |
| 3-Person Families | 2,835 (23.9%) | $143,713 |
| 4-Person Families | 1,918 (16.2%) | $129,944 |
| 5-Person Families | 952 (8.0%) | $129,389 |
| 6-Person Families | 191 (1.6%) | $128,869 |
| 7+ Person Families | 95 (0.8%) | $250,001 |
| Total | 11,837 (100.0%) | $111,439 |
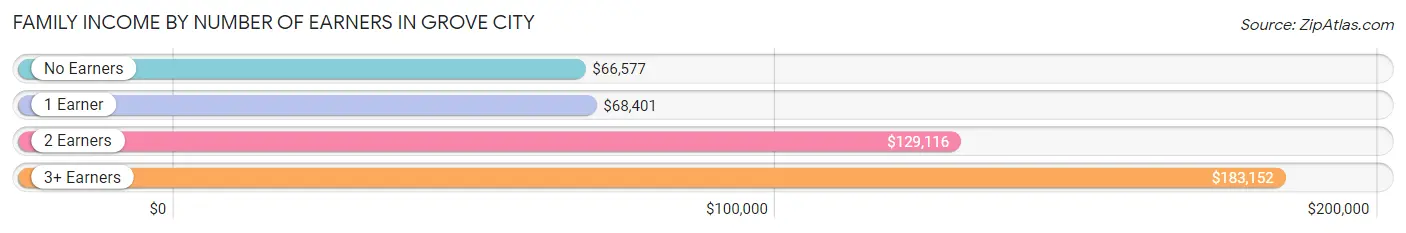
Family Income by Number of Earners in Grove City
The median family income in Grove City is $111,439, with families comprising 3+ earners (1,526) having the highest median family income of $183,152, while families with no earners (1,447) have the lowest median family income of $66,577, accounting for 12.9% and 12.2% of families, respectively.
| Number of Earners | # Families | Median Income |
| No Earners | 1,447 (12.2%) | $66,577 |
| 1 Earner | 3,233 (27.3%) | $68,401 |
| 2 Earners | 5,631 (47.6%) | $129,116 |
| 3+ Earners | 1,526 (12.9%) | $183,152 |
| Total | 11,837 (100.0%) | $111,439 |
Household Income in Grove City
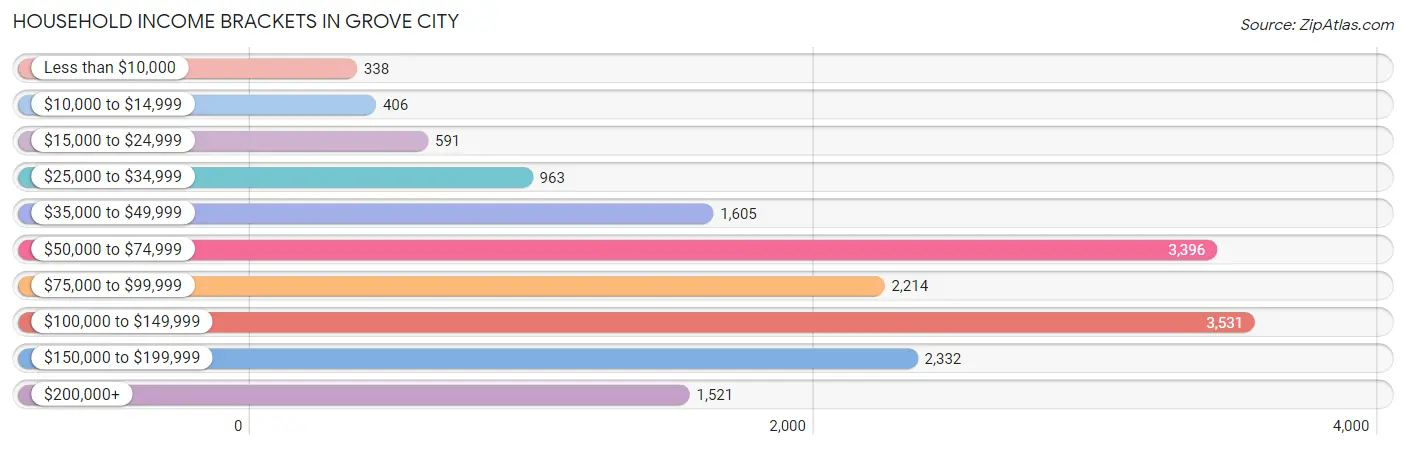
Household Income Brackets in Grove City
With 3,531 households falling in the category, the $100,000 to $149,999 income range is the most frequent in Grove City, accounting for 20.9% of all households. In contrast, only 338 households (2.0%) fall into the less than $10,000 income bracket, making it the least populous group.
| Income Bracket | # Households | % Households |
| Less than $10,000 | 338 | 2.0% |
| $10,000 to $14,999 | 406 | 2.4% |
| $15,000 to $24,999 | 591 | 3.5% |
| $25,000 to $34,999 | 963 | 5.7% |
| $35,000 to $49,999 | 1,605 | 9.5% |
| $50,000 to $74,999 | 3,396 | 20.1% |
| $75,000 to $99,999 | 2,214 | 13.1% |
| $100,000 to $149,999 | 3,531 | 20.9% |
| $150,000 to $199,999 | 2,332 | 13.8% |
| $200,000+ | 1,521 | 9.0% |
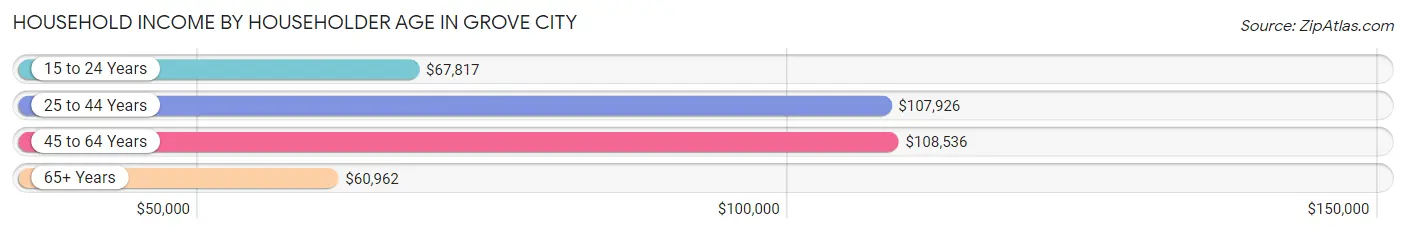
Household Income by Householder Age in Grove City
The median household income in Grove City is $84,765, with the highest median household income of $108,536 found in the 45 to 64 years age bracket for the primary householder. A total of 6,191 households (36.6%) fall into this category. Meanwhile, the 65+ years age bracket for the primary householder has the lowest median household income of $60,962, with 4,592 households (27.2%) in this group.
| Income Bracket | # Households | Median Income |
| 15 to 24 Years | 534 (3.2%) | $67,817 |
| 25 to 44 Years | 5,580 (33.0%) | $107,926 |
| 45 to 64 Years | 6,191 (36.6%) | $108,536 |
| 65+ Years | 4,592 (27.2%) | $60,962 |
| Total | 16,897 (100.0%) | $84,765 |
Poverty in Grove City
Income Below Poverty by Sex and Age in Grove City
With 4.9% poverty level for males and 6.3% for females among the residents of Grove City, 15 year old males and 6 to 11 year old females are the most vulnerable to poverty, with 13 males (11.3%) and 167 females (12.0%) in their respective age groups living below the poverty level.
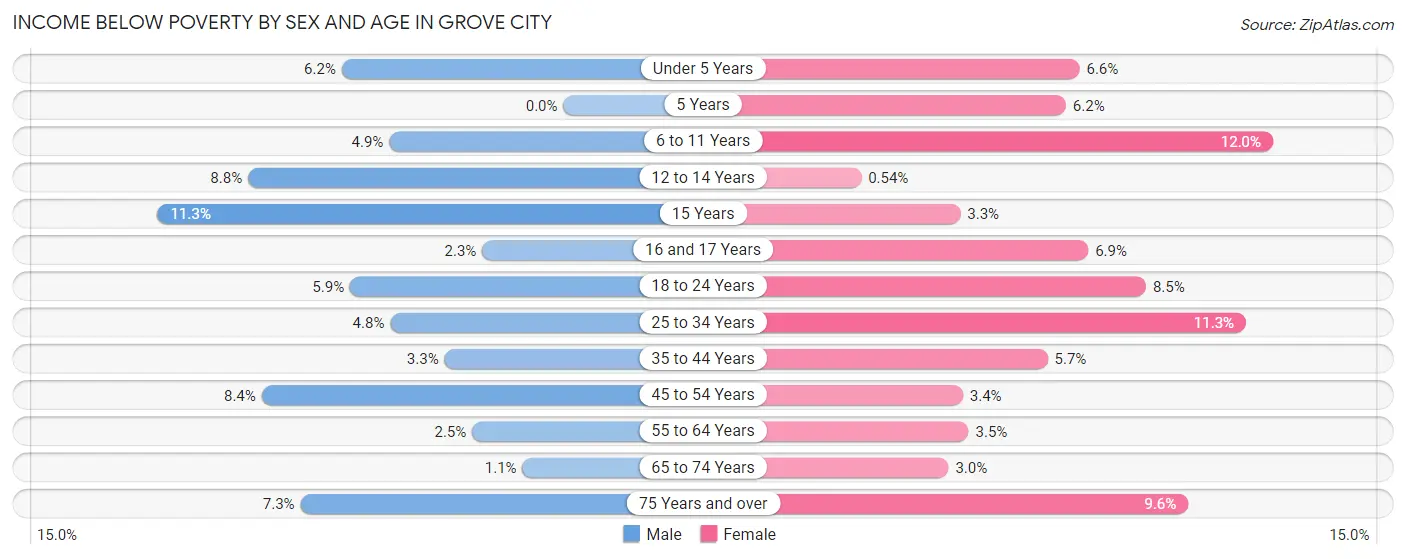
| Age Bracket | Male | Female |
| Under 5 Years | 115 (6.2%) | 73 (6.6%) |
| 5 Years | 0 (0.0%) | 26 (6.2%) |
| 6 to 11 Years | 82 (4.9%) | 167 (12.0%) |
| 12 to 14 Years | 70 (8.8%) | 3 (0.5%) |
| 15 Years | 13 (11.3%) | 7 (3.3%) |
| 16 and 17 Years | 18 (2.3%) | 30 (6.9%) |
| 18 to 24 Years | 82 (5.9%) | 92 (8.5%) |
| 25 to 34 Years | 121 (4.8%) | 300 (11.3%) |
| 35 to 44 Years | 97 (3.3%) | 171 (5.7%) |
| 45 to 54 Years | 239 (8.4%) | 92 (3.4%) |
| 55 to 64 Years | 56 (2.5%) | 99 (3.5%) |
| 65 to 74 Years | 23 (1.1%) | 71 (3.0%) |
| 75 Years and over | 100 (7.3%) | 156 (9.6%) |
| Total | 1,016 (4.9%) | 1,287 (6.3%) |
Income Above Poverty by Sex and Age in Grove City
According to the poverty statistics in Grove City, males aged 5 years and females aged 12 to 14 years are the age groups that are most secure financially, with 100.0% of males and 99.5% of females in these age groups living above the poverty line.
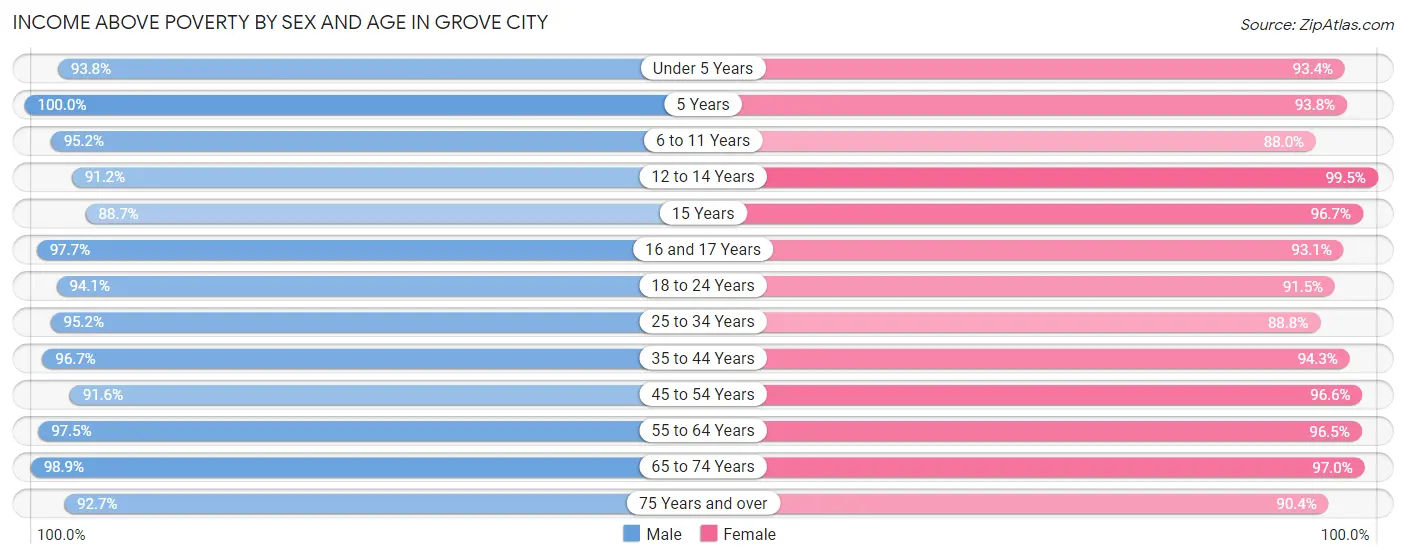
| Age Bracket | Male | Female |
| Under 5 Years | 1,750 (93.8%) | 1,029 (93.4%) |
| 5 Years | 155 (100.0%) | 391 (93.8%) |
| 6 to 11 Years | 1,610 (95.2%) | 1,225 (88.0%) |
| 12 to 14 Years | 727 (91.2%) | 550 (99.5%) |
| 15 Years | 102 (88.7%) | 205 (96.7%) |
| 16 and 17 Years | 778 (97.7%) | 407 (93.1%) |
| 18 to 24 Years | 1,298 (94.1%) | 994 (91.5%) |
| 25 to 34 Years | 2,387 (95.2%) | 2,367 (88.7%) |
| 35 to 44 Years | 2,833 (96.7%) | 2,811 (94.3%) |
| 45 to 54 Years | 2,607 (91.6%) | 2,634 (96.6%) |
| 55 to 64 Years | 2,153 (97.5%) | 2,704 (96.5%) |
| 65 to 74 Years | 1,990 (98.9%) | 2,318 (97.0%) |
| 75 Years and over | 1,266 (92.7%) | 1,463 (90.4%) |
| Total | 19,656 (95.1%) | 19,098 (93.7%) |
Income Below Poverty Among Married-Couple Families in Grove City
The poverty statistics for married-couple families in Grove City show that 1.5% or 141 of the total 9,213 families live below the poverty line. Families with 1 or 2 children have the highest poverty rate of 3.0%, comprising of 77 families. On the other hand, families with 3 or 4 children have the lowest poverty rate of 0.2%, which includes 2 families.
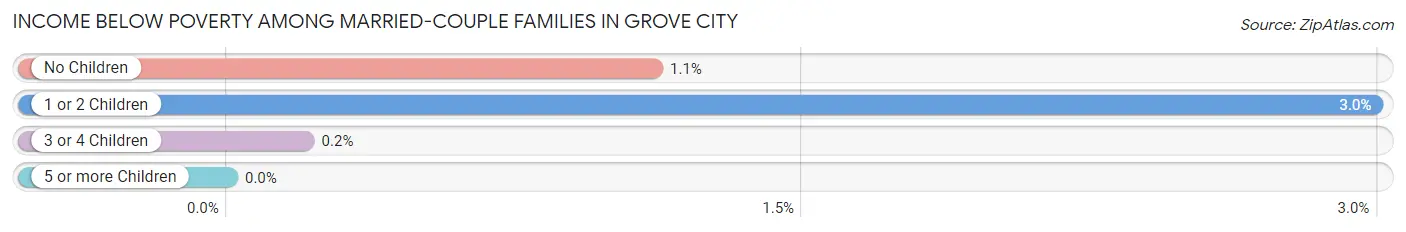
| Children | Above Poverty | Below Poverty |
| No Children | 5,547 (98.9%) | 62 (1.1%) |
| 1 or 2 Children | 2,502 (97.0%) | 77 (3.0%) |
| 3 or 4 Children | 1,023 (99.8%) | 2 (0.2%) |
| 5 or more Children | 0 (0.0%) | 0 (0.0%) |
| Total | 9,072 (98.5%) | 141 (1.5%) |
Income Below Poverty Among Single-Parent Households in Grove City
According to the poverty data in Grove City, 1.5% or 14 single-father households and 18.2% or 308 single-mother households are living below the poverty line. Among single-father households, those with 1 or 2 children have the highest poverty rate, with 14 households (2.9%) experiencing poverty. Likewise, among single-mother households, those with 5 or more children have the highest poverty rate, with 18 households (100.0%) falling below the poverty line.
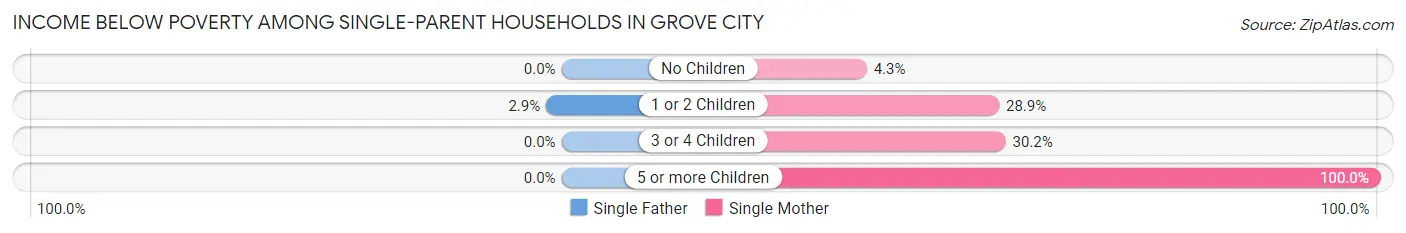
| Children | Single Father | Single Mother |
| No Children | 0 (0.0%) | 34 (4.3%) |
| 1 or 2 Children | 14 (2.9%) | 237 (28.9%) |
| 3 or 4 Children | 0 (0.0%) | 19 (30.2%) |
| 5 or more Children | 0 (0.0%) | 18 (100.0%) |
| Total | 14 (1.5%) | 308 (18.2%) |
Income Below Poverty Among Married-Couple vs Single-Parent Households in Grove City
The poverty data for Grove City shows that 141 of the married-couple family households (1.5%) and 322 of the single-parent households (12.3%) are living below the poverty level. Within the married-couple family households, those with 1 or 2 children have the highest poverty rate, with 77 households (3.0%) falling below the poverty line. Among the single-parent households, those with 5 or more children have the highest poverty rate, with 18 household (100.0%) living below poverty.
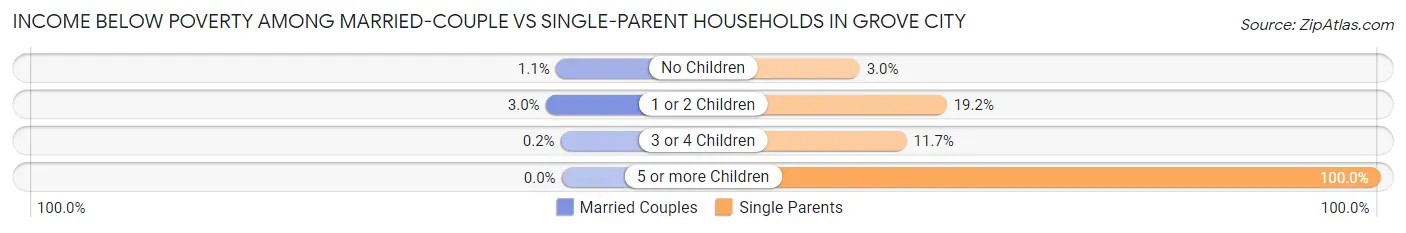
| Children | Married-Couple Families | Single-Parent Households |
| No Children | 62 (1.1%) | 34 (3.0%) |
| 1 or 2 Children | 77 (3.0%) | 251 (19.2%) |
| 3 or 4 Children | 2 (0.2%) | 19 (11.7%) |
| 5 or more Children | 0 (0.0%) | 18 (100.0%) |
| Total | 141 (1.5%) | 322 (12.3%) |
Race in Grove City
The most populous races in Grove City are White / Caucasian (36,191 | 87.4%), Two or more Races (1,772 | 4.3%), and Black / African American (1,638 | 4.0%).
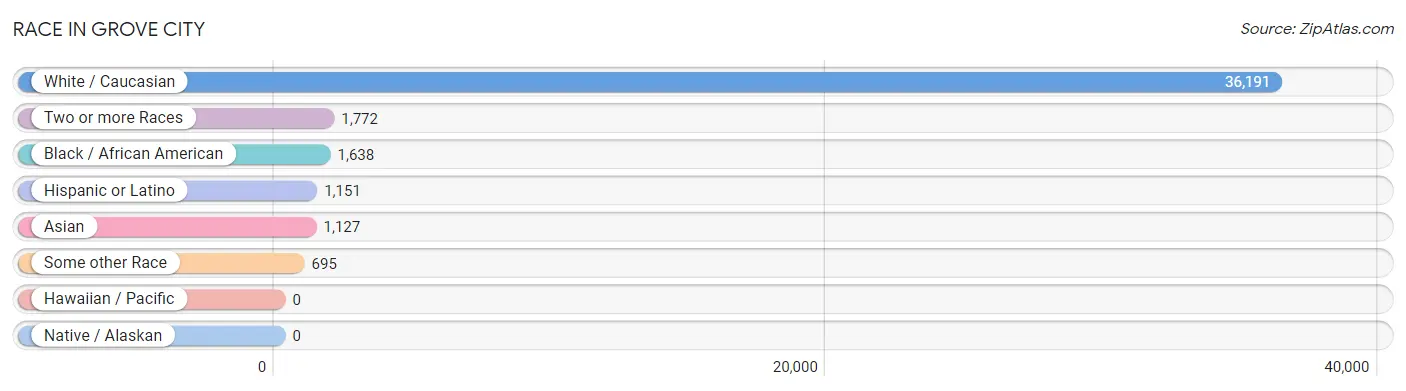
| Race | # Population | % Population |
| Asian | 1,127 | 2.7% |
| Black / African American | 1,638 | 4.0% |
| Hawaiian / Pacific | 0 | 0.0% |
| Hispanic or Latino | 1,151 | 2.8% |
| Native / Alaskan | 0 | 0.0% |
| White / Caucasian | 36,191 | 87.4% |
| Two or more Races | 1,772 | 4.3% |
| Some other Race | 695 | 1.7% |
| Total | 41,423 | 100.0% |
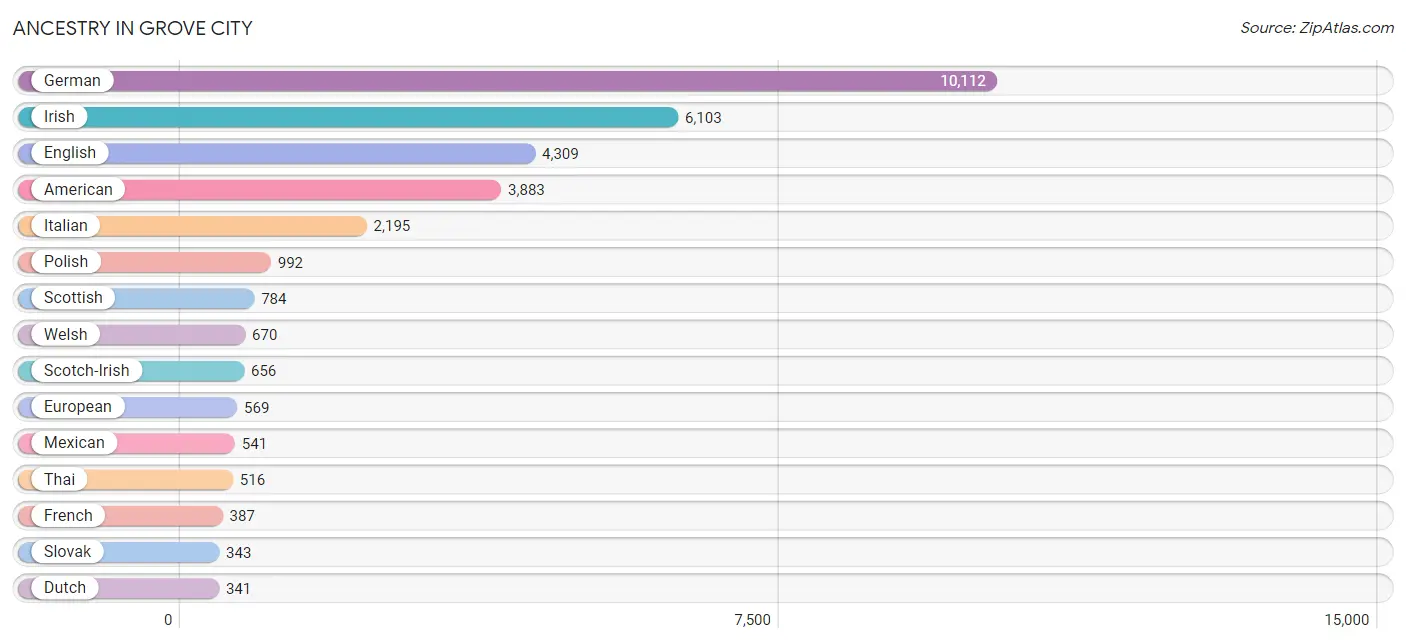
Ancestry in Grove City
The most populous ancestries reported in Grove City are German (10,112 | 24.4%), Irish (6,103 | 14.7%), English (4,309 | 10.4%), American (3,883 | 9.4%), and Italian (2,195 | 5.3%), together accounting for 64.2% of all Grove City residents.
| Ancestry | # Population | % Population |
| African | 45 | 0.1% |
| American | 3,883 | 9.4% |
| Arab | 32 | 0.1% |
| Armenian | 5 | 0.0% |
| Austrian | 17 | 0.0% |
| Belgian | 37 | 0.1% |
| Bhutanese | 42 | 0.1% |
| Blackfeet | 48 | 0.1% |
| Brazilian | 50 | 0.1% |
| British | 272 | 0.7% |
| Burmese | 36 | 0.1% |
| Canadian | 15 | 0.0% |
| Carpatho Rusyn | 20 | 0.1% |
| Central American | 150 | 0.4% |
| Central American Indian | 39 | 0.1% |
| Cherokee | 61 | 0.2% |
| Colombian | 92 | 0.2% |
| Croatian | 114 | 0.3% |
| Czech | 109 | 0.3% |
| Czechoslovakian | 36 | 0.1% |
| Danish | 133 | 0.3% |
| Dutch | 341 | 0.8% |
| Eastern European | 172 | 0.4% |
| English | 4,309 | 10.4% |
| European | 569 | 1.4% |
| Filipino | 52 | 0.1% |
| Finnish | 32 | 0.1% |
| French | 387 | 0.9% |
| French Canadian | 129 | 0.3% |
| German | 10,112 | 24.4% |
| Ghanaian | 61 | 0.2% |
| Greek | 169 | 0.4% |
| Guatemalan | 8 | 0.0% |
| Hungarian | 272 | 0.7% |
| Indian (Asian) | 236 | 0.6% |
| Irish | 6,103 | 14.7% |
| Israeli | 15 | 0.0% |
| Italian | 2,195 | 5.3% |
| Japanese | 261 | 0.6% |
| Korean | 54 | 0.1% |
| Lebanese | 17 | 0.0% |
| Mexican | 541 | 1.3% |
| Moroccan | 15 | 0.0% |
| Native Hawaiian | 31 | 0.1% |
| Nigerian | 23 | 0.1% |
| Northern European | 57 | 0.1% |
| Norwegian | 192 | 0.5% |
| Pennsylvania German | 9 | 0.0% |
| Peruvian | 10 | 0.0% |
| Polish | 992 | 2.4% |
| Portuguese | 26 | 0.1% |
| Puerto Rican | 261 | 0.6% |
| Romanian | 75 | 0.2% |
| Russian | 336 | 0.8% |
| Salvadoran | 142 | 0.3% |
| Scandinavian | 18 | 0.0% |
| Scotch-Irish | 656 | 1.6% |
| Scottish | 784 | 1.9% |
| Serbian | 40 | 0.1% |
| Slovak | 343 | 0.8% |
| Slovene | 16 | 0.0% |
| South American | 142 | 0.3% |
| Spaniard | 23 | 0.1% |
| Sri Lankan | 66 | 0.2% |
| Subsaharan African | 145 | 0.4% |
| Swedish | 55 | 0.1% |
| Swiss | 120 | 0.3% |
| Thai | 516 | 1.3% |
| Ukrainian | 194 | 0.5% |
| Venezuelan | 40 | 0.1% |
| Welsh | 670 | 1.6% |
| West Indian | 23 | 0.1% | View All 72 Rows |
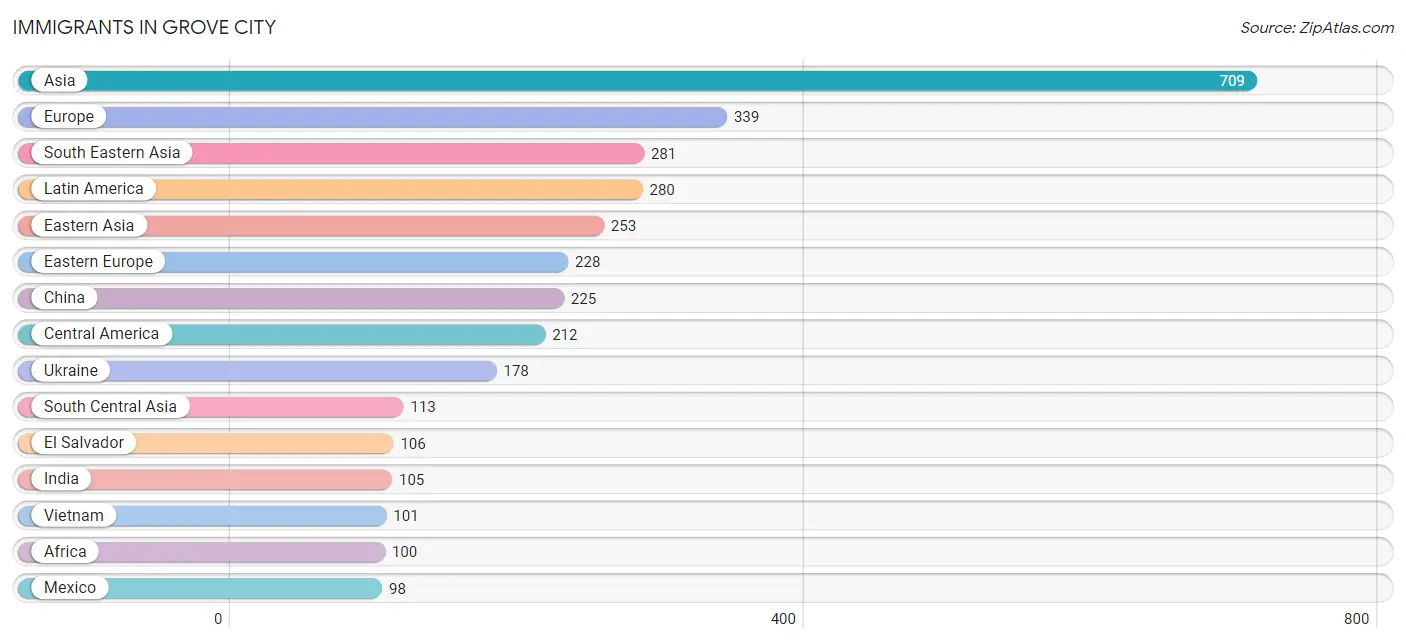
Immigrants in Grove City
The most numerous immigrant groups reported in Grove City came from Asia (709 | 1.7%), Europe (339 | 0.8%), South Eastern Asia (281 | 0.7%), Latin America (280 | 0.7%), and Eastern Asia (253 | 0.6%), together accounting for 4.5% of all Grove City residents.
| Immigration Origin | # Population | % Population |
| Africa | 100 | 0.2% |
| Asia | 709 | 1.7% |
| Brazil | 35 | 0.1% |
| Cambodia | 91 | 0.2% |
| Canada | 42 | 0.1% |
| Central America | 212 | 0.5% |
| China | 225 | 0.5% |
| Colombia | 33 | 0.1% |
| Denmark | 63 | 0.2% |
| Eastern Africa | 23 | 0.1% |
| Eastern Asia | 253 | 0.6% |
| Eastern Europe | 228 | 0.5% |
| El Salvador | 106 | 0.3% |
| Ethiopia | 22 | 0.1% |
| Europe | 339 | 0.8% |
| Germany | 48 | 0.1% |
| Ghana | 61 | 0.2% |
| Guatemala | 8 | 0.0% |
| India | 105 | 0.3% |
| Israel | 15 | 0.0% |
| Japan | 16 | 0.0% |
| Korea | 12 | 0.0% |
| Latin America | 280 | 0.7% |
| Mexico | 98 | 0.2% |
| Middle Africa | 16 | 0.0% |
| Nepal | 4 | 0.0% |
| Northern Europe | 63 | 0.2% |
| Philippines | 54 | 0.1% |
| Russia | 50 | 0.1% |
| South America | 68 | 0.2% |
| South Central Asia | 113 | 0.3% |
| South Eastern Asia | 281 | 0.7% |
| Taiwan | 10 | 0.0% |
| Thailand | 35 | 0.1% |
| Ukraine | 178 | 0.4% |
| Vietnam | 101 | 0.2% |
| Western Africa | 61 | 0.2% |
| Western Asia | 62 | 0.2% |
| Western Europe | 48 | 0.1% |
| Zaire | 16 | 0.0% | View All 40 Rows |
Sex and Age in Grove City
Sex and Age in Grove City
The most populous age groups in Grove City are Under 5 Years (1,871 | 9.0%) for men and 50 to 54 Years (1,764 | 8.6%) for women.
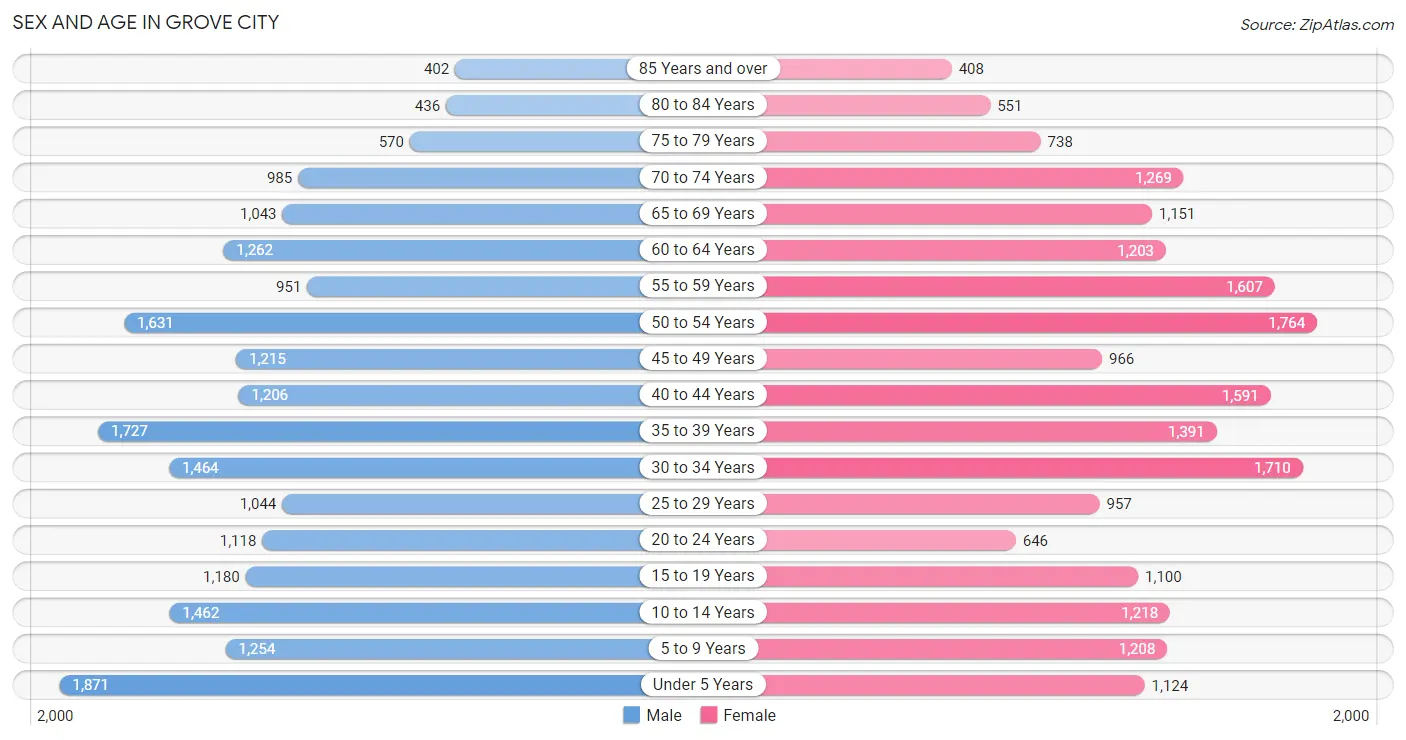
| Age Bracket | Male | Female |
| Under 5 Years | 1,871 (9.0%) | 1,124 (5.5%) |
| 5 to 9 Years | 1,254 (6.0%) | 1,208 (5.9%) |
| 10 to 14 Years | 1,462 (7.0%) | 1,218 (5.9%) |
| 15 to 19 Years | 1,180 (5.7%) | 1,100 (5.3%) |
| 20 to 24 Years | 1,118 (5.4%) | 646 (3.1%) |
| 25 to 29 Years | 1,044 (5.0%) | 957 (4.6%) |
| 30 to 34 Years | 1,464 (7.0%) | 1,710 (8.3%) |
| 35 to 39 Years | 1,727 (8.3%) | 1,391 (6.8%) |
| 40 to 44 Years | 1,206 (5.8%) | 1,591 (7.7%) |
| 45 to 49 Years | 1,215 (5.8%) | 966 (4.7%) |
| 50 to 54 Years | 1,631 (7.8%) | 1,764 (8.6%) |
| 55 to 59 Years | 951 (4.6%) | 1,607 (7.8%) |
| 60 to 64 Years | 1,262 (6.1%) | 1,203 (5.8%) |
| 65 to 69 Years | 1,043 (5.0%) | 1,151 (5.6%) |
| 70 to 74 Years | 985 (4.7%) | 1,269 (6.2%) |
| 75 to 79 Years | 570 (2.7%) | 738 (3.6%) |
| 80 to 84 Years | 436 (2.1%) | 551 (2.7%) |
| 85 Years and over | 402 (1.9%) | 408 (2.0%) |
| Total | 20,821 (100.0%) | 20,602 (100.0%) |
Families and Households in Grove City
Median Family Size in Grove City
The median family size in Grove City is 2.89 persons per family, with married-couple families (9,213 | 77.8%) accounting for the largest median family size of 2.98 persons per family. On the other hand, single male/father families (932 | 7.9%) represent the smallest median family size with 2.44 persons per family.
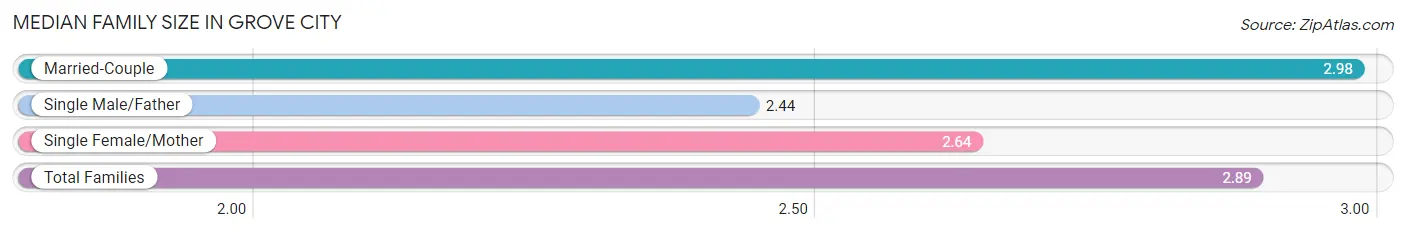
| Family Type | # Families | Family Size |
| Married-Couple | 9,213 (77.8%) | 2.98 |
| Single Male/Father | 932 (7.9%) | 2.44 |
| Single Female/Mother | 1,692 (14.3%) | 2.64 |
| Total Families | 11,837 (100.0%) | 2.89 |
Median Household Size in Grove City
The median household size in Grove City is 2.43 persons per household, with married-couple households (9,213 | 54.5%) accounting for the largest median household size of 3 persons per household. non-family households (5,060 | 29.9%) represent the smallest median household size with 1.17 persons per household.
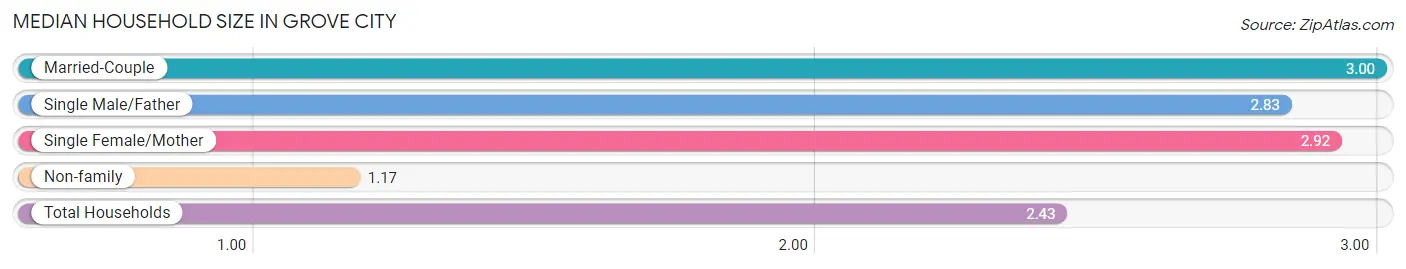
| Household Type | # Households | Household Size |
| Married-Couple | 9,213 (54.5%) | 3.00 |
| Single Male/Father | 932 (5.5%) | 2.83 |
| Single Female/Mother | 1,692 (10.0%) | 2.92 |
| Non-family | 5,060 (29.9%) | 1.17 |
| Total Households | 16,897 (100.0%) | 2.43 |
Household Size by Marriage Status in Grove City
Out of a total of 16,897 households in Grove City, 11,837 (70.1%) are family households, while 5,060 (29.9%) are nonfamily households. The most numerous type of family households are 2-person households, comprising 5,342, and the most common type of nonfamily households are 1-person households, comprising 4,218.
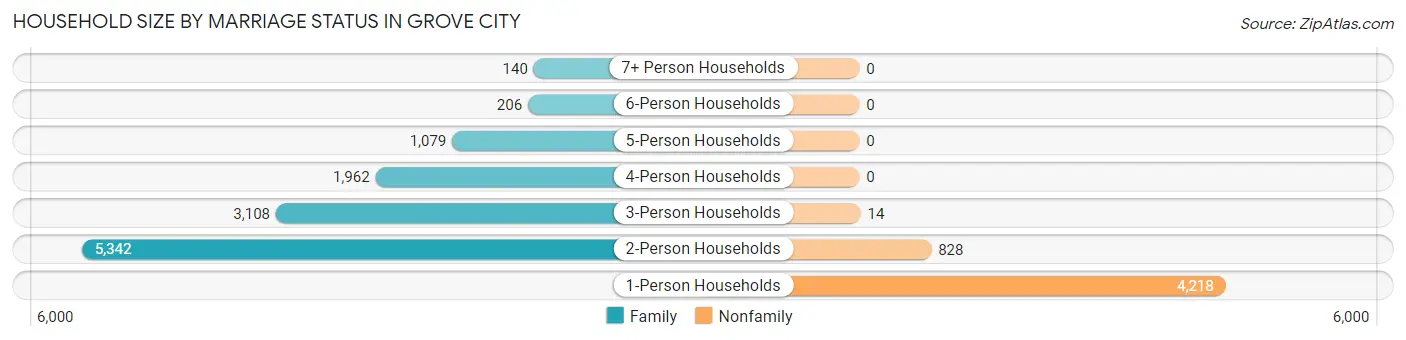
| Household Size | Family Households | Nonfamily Households |
| 1-Person Households | - | 4,218 (25.0%) |
| 2-Person Households | 5,342 (31.6%) | 828 (4.9%) |
| 3-Person Households | 3,108 (18.4%) | 14 (0.1%) |
| 4-Person Households | 1,962 (11.6%) | 0 (0.0%) |
| 5-Person Households | 1,079 (6.4%) | 0 (0.0%) |
| 6-Person Households | 206 (1.2%) | 0 (0.0%) |
| 7+ Person Households | 140 (0.8%) | 0 (0.0%) |
| Total | 11,837 (70.1%) | 5,060 (29.9%) |
Female Fertility in Grove City
Fertility by Age in Grove City
Average fertility rate in Grove City is 46.0 births per 1,000 women. Women in the age bracket of 20 to 34 years have the highest fertility rate with 73.0 births per 1,000 women. Women in the age bracket of 20 to 34 years acount for 61.0% of all women with births.
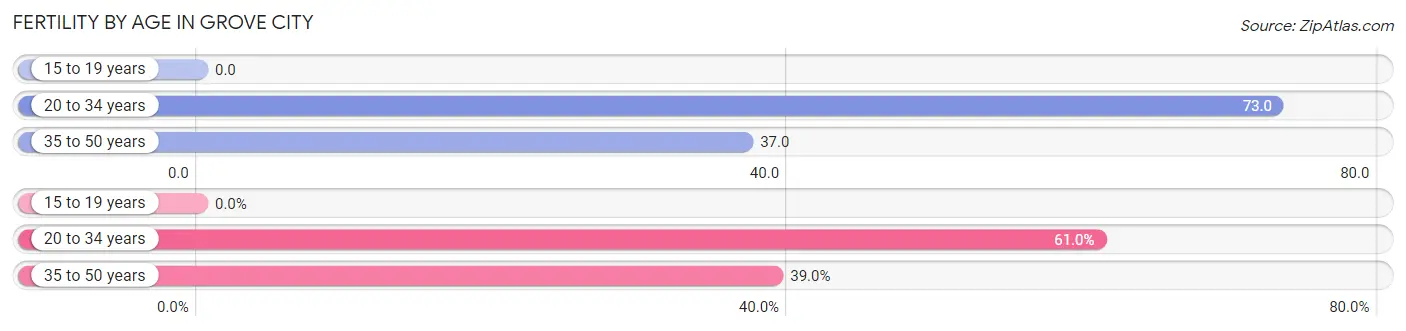
| Age Bracket | Women with Births | Births / 1,000 Women |
| 15 to 19 years | 0 (0.0%) | 0.0 |
| 20 to 34 years | 242 (61.0%) | 73.0 |
| 35 to 50 years | 155 (39.0%) | 37.0 |
| Total | 397 (100.0%) | 46.0 |
Fertility by Age by Marriage Status in Grove City
77.1% of women with births (397) in Grove City are married. The highest percentage of unmarried women with births falls into 20 to 34 years age bracket with 32.6% of them unmarried at the time of birth, while the lowest percentage of unmarried women with births belong to 35 to 50 years age bracket with 7.7% of them unmarried.
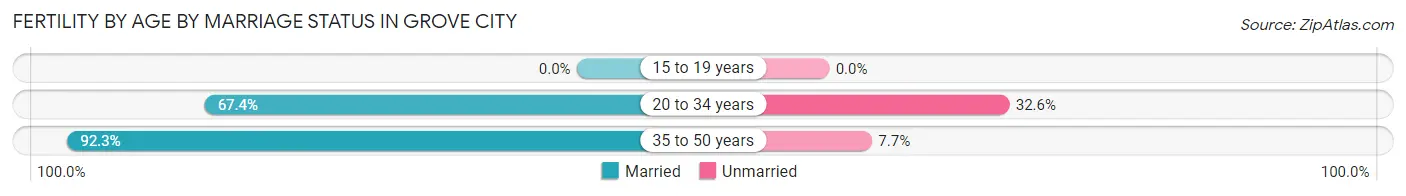
| Age Bracket | Married | Unmarried |
| 15 to 19 years | 0 (0.0%) | 0 (0.0%) |
| 20 to 34 years | 163 (67.4%) | 79 (32.6%) |
| 35 to 50 years | 143 (92.3%) | 12 (7.7%) |
| Total | 306 (77.1%) | 91 (22.9%) |
Fertility by Education in Grove City
Average fertility rate in Grove City is 46.0 births per 1,000 women. Women with the education attainment of bachelor's degree have the highest fertility rate of 70.0 births per 1,000 women, while women with the education attainment of high school diploma have the lowest fertility at 22.0 births per 1,000 women. Women with the education attainment of bachelor's degree represent 40.6% of all women with births.
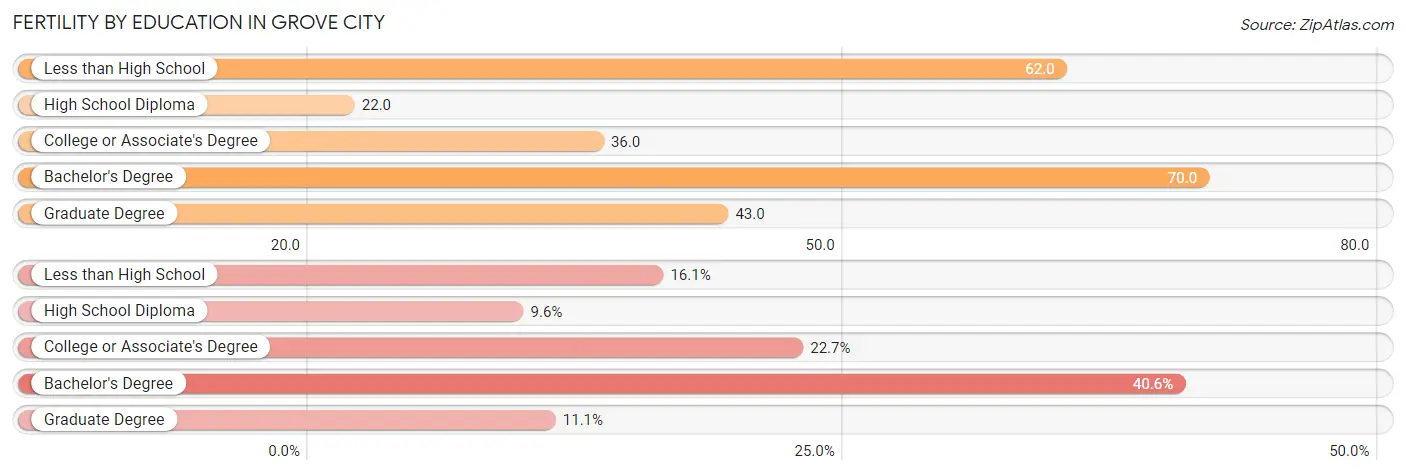
| Educational Attainment | Women with Births | Births / 1,000 Women |
| Less than High School | 64 (16.1%) | 62.0 |
| High School Diploma | 38 (9.6%) | 22.0 |
| College or Associate's Degree | 90 (22.7%) | 36.0 |
| Bachelor's Degree | 161 (40.6%) | 70.0 |
| Graduate Degree | 44 (11.1%) | 43.0 |
| Total | 397 (100.0%) | 46.0 |
Fertility by Education by Marriage Status in Grove City
22.9% of women with births in Grove City are unmarried. Women with the educational attainment of bachelor's degree are most likely to be married with 100.0% of them married at childbirth, while women with the educational attainment of less than high school are least likely to be married with 100.0% of them unmarried at childbirth.
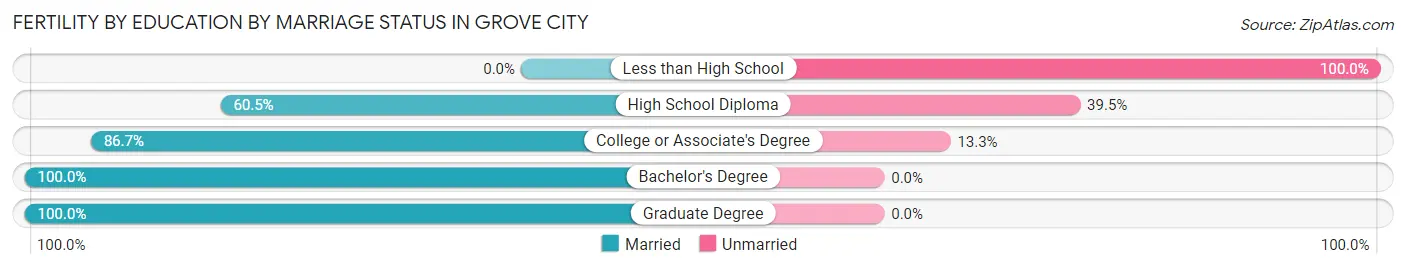
| Educational Attainment | Married | Unmarried |
| Less than High School | 0 (0.0%) | 64 (100.0%) |
| High School Diploma | 23 (60.5%) | 15 (39.5%) |
| College or Associate's Degree | 78 (86.7%) | 12 (13.3%) |
| Bachelor's Degree | 161 (100.0%) | 0 (0.0%) |
| Graduate Degree | 44 (100.0%) | 0 (0.0%) |
| Total | 306 (77.1%) | 91 (22.9%) |
Employment Characteristics in Grove City
Employment by Class of Employer in Grove City
Among the 22,091 employed individuals in Grove City, private company employees (14,729 | 66.7%), not-for-profit organizations (2,097 | 9.5%), and local government employees (2,067 | 9.4%) make up the most common classes of employment.
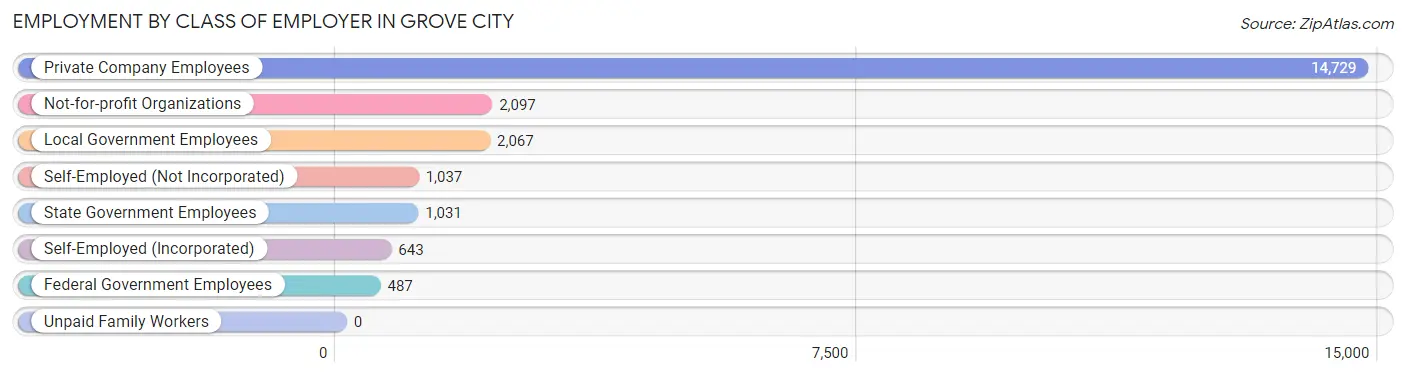
| Employer Class | # Employees | % Employees |
| Private Company Employees | 14,729 | 66.7% |
| Self-Employed (Incorporated) | 643 | 2.9% |
| Self-Employed (Not Incorporated) | 1,037 | 4.7% |
| Not-for-profit Organizations | 2,097 | 9.5% |
| Local Government Employees | 2,067 | 9.4% |
| State Government Employees | 1,031 | 4.7% |
| Federal Government Employees | 487 | 2.2% |
| Unpaid Family Workers | 0 | 0.0% |
| Total | 22,091 | 100.0% |
Employment Status by Age in Grove City
According to the labor force statistics for Grove City, out of the total population over 16 years of age (32,955), 69.4% or 22,871 individuals are in the labor force, with 2.4% or 549 of them unemployed. The age group with the highest labor force participation rate is 25 to 29 years, with 94.7% or 1,895 individuals in the labor force. Within the labor force, the 16 to 19 years age range has the highest percentage of unemployed individuals, with 6.5% or 72 of them being unemployed.
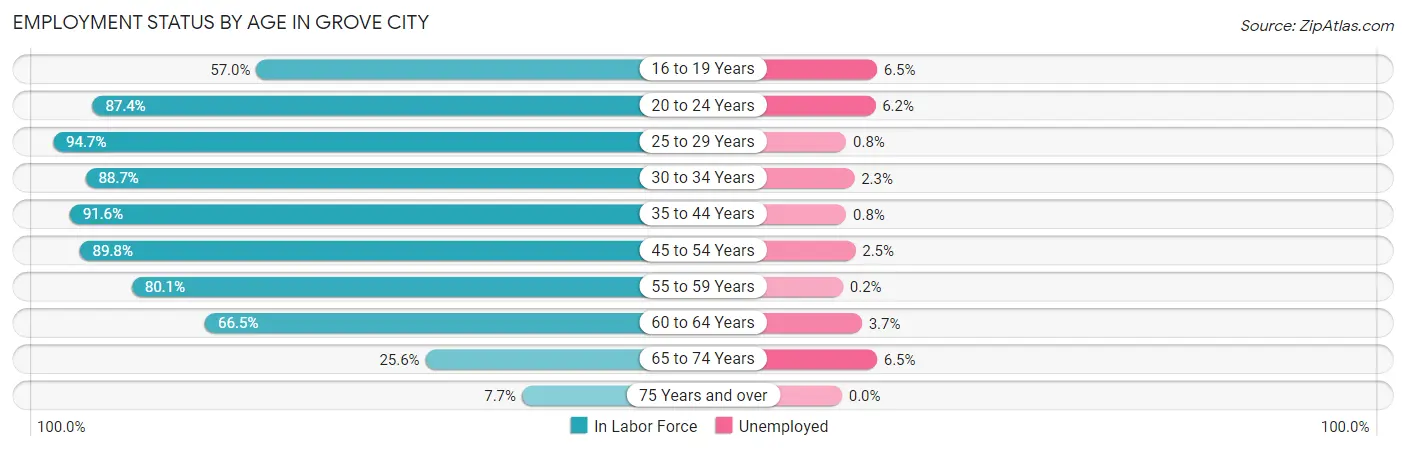
| Age Bracket | In Labor Force | Unemployed |
| 16 to 19 Years | 1,111 (57.0%) | 72 (6.5%) |
| 20 to 24 Years | 1,542 (87.4%) | 96 (6.2%) |
| 25 to 29 Years | 1,895 (94.7%) | 15 (0.8%) |
| 30 to 34 Years | 2,815 (88.7%) | 65 (2.3%) |
| 35 to 44 Years | 5,418 (91.6%) | 43 (0.8%) |
| 45 to 54 Years | 5,007 (89.8%) | 125 (2.5%) |
| 55 to 59 Years | 2,049 (80.1%) | 4 (0.2%) |
| 60 to 64 Years | 1,639 (66.5%) | 61 (3.7%) |
| 65 to 74 Years | 1,139 (25.6%) | 74 (6.5%) |
| 75 Years and over | 239 (7.7%) | 0 (0.0%) |
| Total | 22,871 (69.4%) | 549 (2.4%) |
Employment Status by Educational Attainment in Grove City
According to labor force statistics for Grove City, 86.8% of individuals (18,826) out of the total population between 25 and 64 years of age (21,689) are in the labor force, with 1.7% or 320 of them being unemployed. The group with the highest labor force participation rate are those with the educational attainment of bachelor's degree or higher, with 93.2% or 7,771 individuals in the labor force. Within the labor force, individuals with less than high school education have the highest percentage of unemployment, with 3.7% or 40 of them being unemployed.
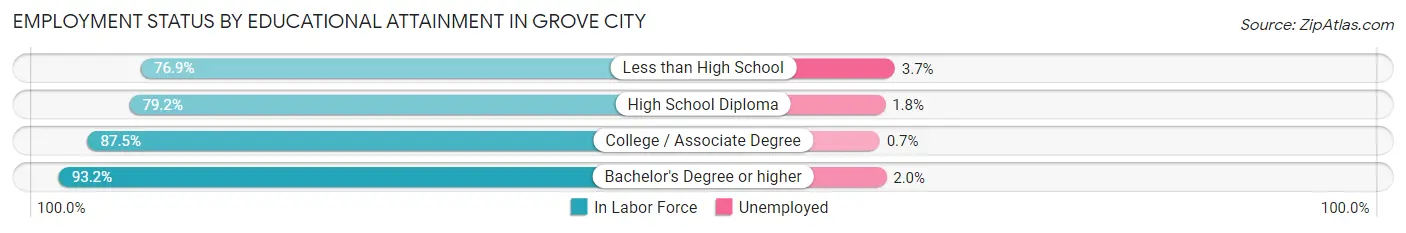
| Educational Attainment | In Labor Force | Unemployed |
| Less than High School | 1,094 (76.9%) | 53 (3.7%) |
| High School Diploma | 4,550 (79.2%) | 103 (1.8%) |
| College / Associate Degree | 5,410 (87.5%) | 43 (0.7%) |
| Bachelor's Degree or higher | 7,771 (93.2%) | 167 (2.0%) |
| Total | 18,826 (86.8%) | 369 (1.7%) |
Employment Occupations by Sex in Grove City
Management, Business, Science and Arts Occupations
The most common Management, Business, Science and Arts occupations in Grove City are Management (2,703 | 12.2%), Community & Social Service (2,167 | 9.8%), Health Diagnosing & Treating (1,709 | 7.7%), Computers, Engineering & Science (1,446 | 6.5%), and Education Instruction & Library (1,231 | 5.5%).
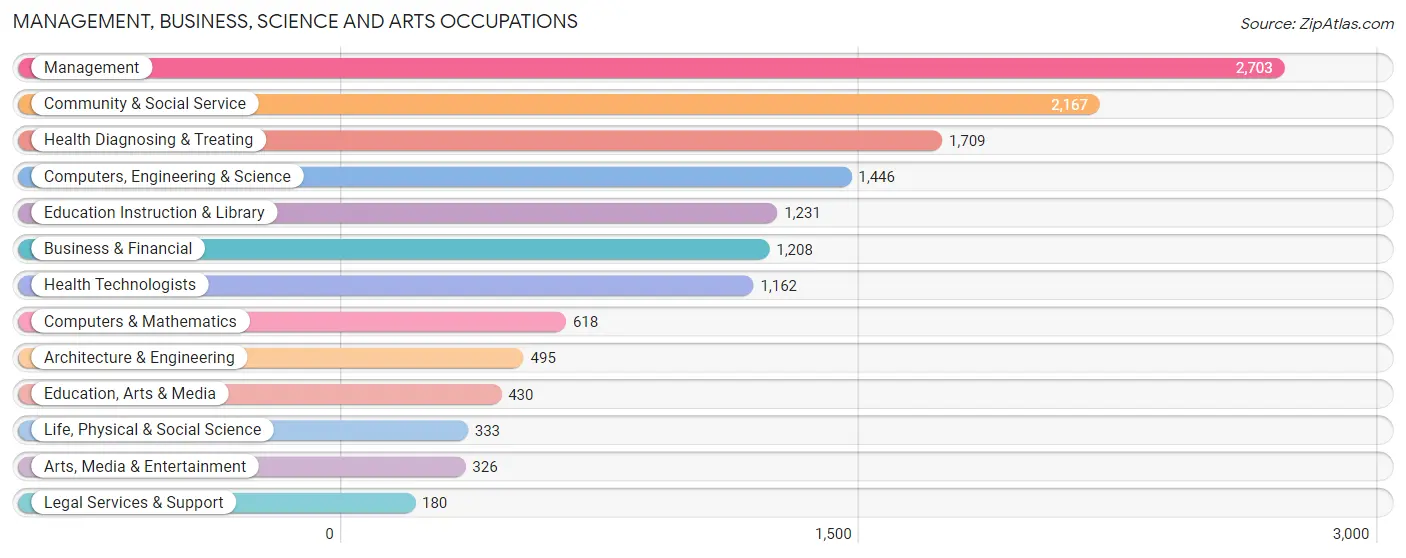
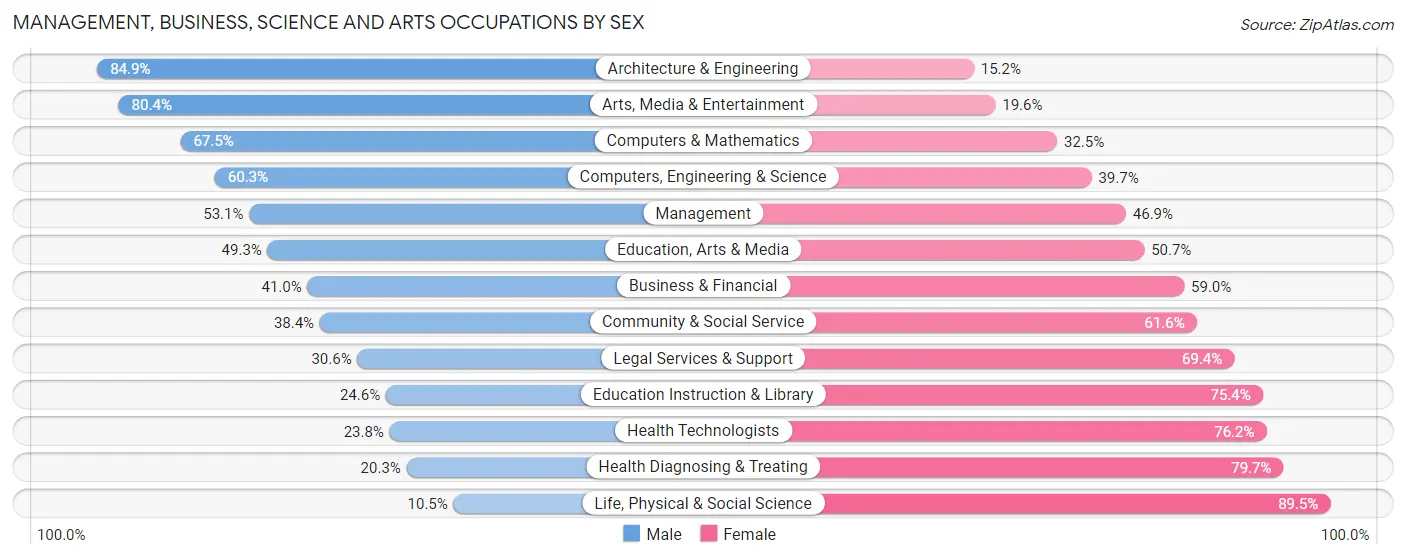
Management, Business, Science and Arts Occupations by Sex
Within the Management, Business, Science and Arts occupations in Grove City, the most male-oriented occupations are Architecture & Engineering (84.9%), Arts, Media & Entertainment (80.4%), and Computers & Mathematics (67.5%), while the most female-oriented occupations are Life, Physical & Social Science (89.5%), Health Diagnosing & Treating (79.7%), and Health Technologists (76.2%).
| Occupation | Male | Female |
| Management | 1,436 (53.1%) | 1,267 (46.9%) |
| Business & Financial | 495 (41.0%) | 713 (59.0%) |
| Computers, Engineering & Science | 872 (60.3%) | 574 (39.7%) |
| Computers & Mathematics | 417 (67.5%) | 201 (32.5%) |
| Architecture & Engineering | 420 (84.9%) | 75 (15.1%) |
| Life, Physical & Social Science | 35 (10.5%) | 298 (89.5%) |
| Community & Social Service | 832 (38.4%) | 1,335 (61.6%) |
| Education, Arts & Media | 212 (49.3%) | 218 (50.7%) |
| Legal Services & Support | 55 (30.6%) | 125 (69.4%) |
| Education Instruction & Library | 303 (24.6%) | 928 (75.4%) |
| Arts, Media & Entertainment | 262 (80.4%) | 64 (19.6%) |
| Health Diagnosing & Treating | 347 (20.3%) | 1,362 (79.7%) |
| Health Technologists | 277 (23.8%) | 885 (76.2%) |
| Total (Category) | 3,982 (43.1%) | 5,251 (56.9%) |
| Total (Overall) | 11,508 (51.8%) | 10,727 (48.2%) |
Services Occupations
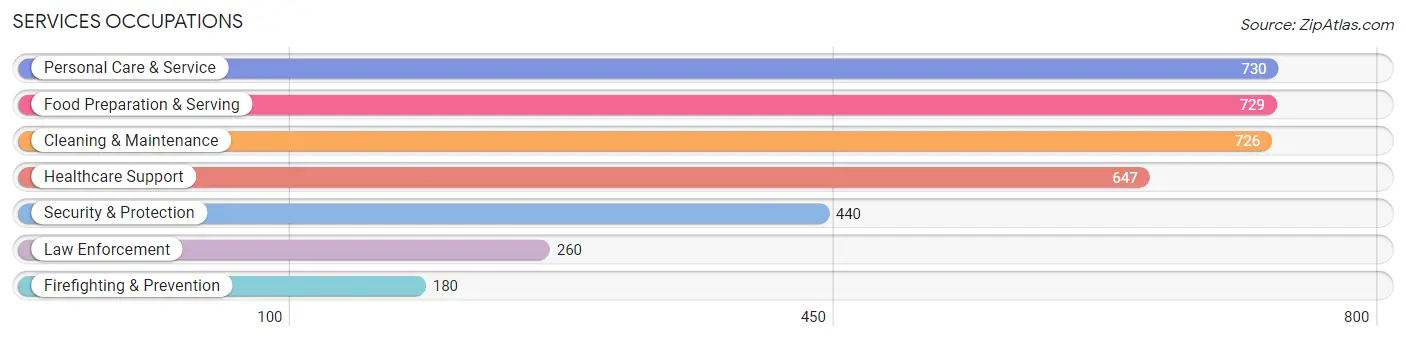
The most common Services occupations in Grove City are Personal Care & Service (730 | 3.3%), Food Preparation & Serving (729 | 3.3%), Cleaning & Maintenance (726 | 3.3%), Healthcare Support (647 | 2.9%), and Security & Protection (440 | 2.0%).
Services Occupations by Sex
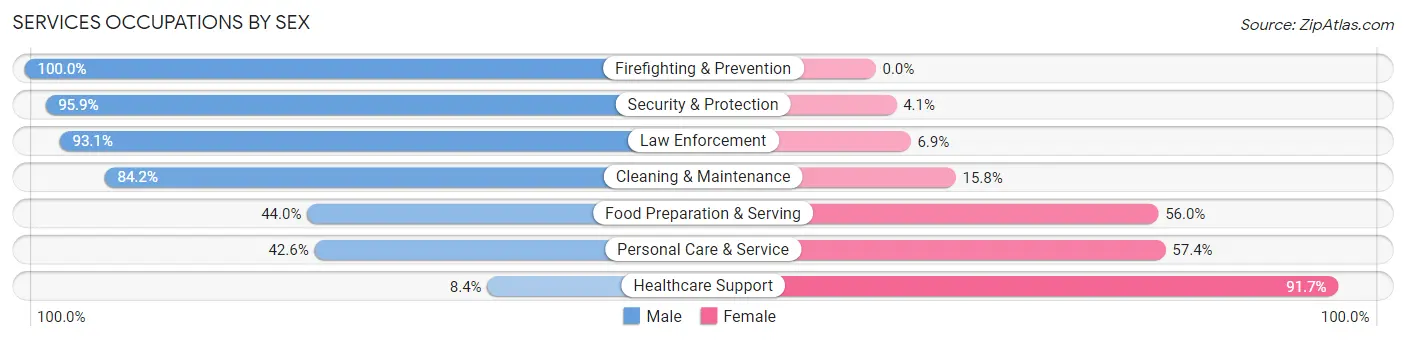
Within the Services occupations in Grove City, the most male-oriented occupations are Firefighting & Prevention (100.0%), Security & Protection (95.9%), and Law Enforcement (93.1%), while the most female-oriented occupations are Healthcare Support (91.6%), Personal Care & Service (57.4%), and Food Preparation & Serving (56.0%).
| Occupation | Male | Female |
| Healthcare Support | 54 (8.4%) | 593 (91.6%) |
| Security & Protection | 422 (95.9%) | 18 (4.1%) |
| Firefighting & Prevention | 180 (100.0%) | 0 (0.0%) |
| Law Enforcement | 242 (93.1%) | 18 (6.9%) |
| Food Preparation & Serving | 321 (44.0%) | 408 (56.0%) |
| Cleaning & Maintenance | 611 (84.2%) | 115 (15.8%) |
| Personal Care & Service | 311 (42.6%) | 419 (57.4%) |
| Total (Category) | 1,719 (52.5%) | 1,553 (47.5%) |
| Total (Overall) | 11,508 (51.8%) | 10,727 (48.2%) |
Sales and Office Occupations
The most common Sales and Office occupations in Grove City are Office & Administration (3,426 | 15.4%), and Sales & Related (1,932 | 8.7%).

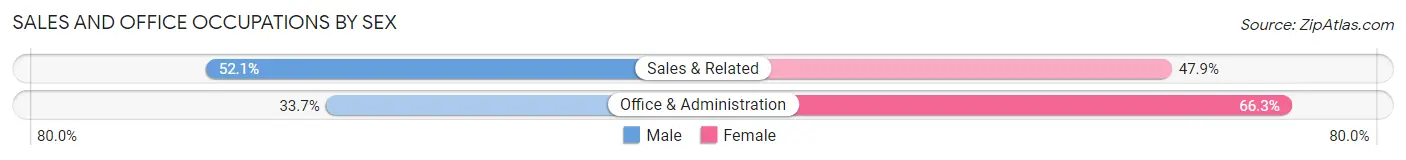
Sales and Office Occupations by Sex
| Occupation | Male | Female |
| Sales & Related | 1,007 (52.1%) | 925 (47.9%) |
| Office & Administration | 1,155 (33.7%) | 2,271 (66.3%) |
| Total (Category) | 2,162 (40.4%) | 3,196 (59.7%) |
| Total (Overall) | 11,508 (51.8%) | 10,727 (48.2%) |
Natural Resources, Construction and Maintenance Occupations
The most common Natural Resources, Construction and Maintenance occupations in Grove City are Construction & Extraction (736 | 3.3%), Installation, Maintenance & Repair (523 | 2.4%), and Farming, Fishing & Forestry (52 | 0.2%).
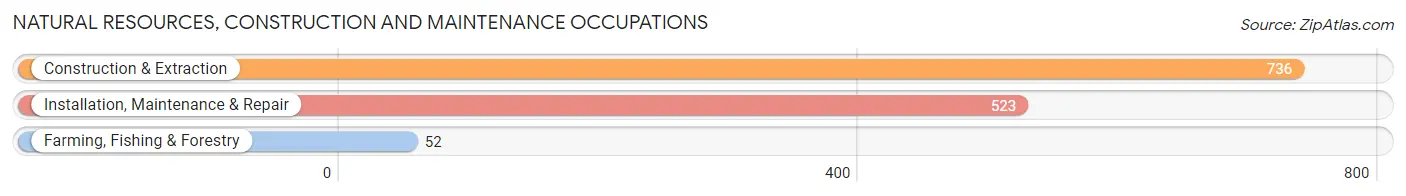
Natural Resources, Construction and Maintenance Occupations by Sex
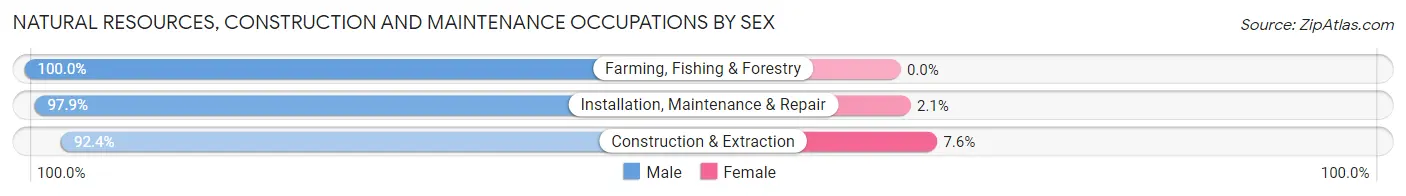
| Occupation | Male | Female |
| Farming, Fishing & Forestry | 52 (100.0%) | 0 (0.0%) |
| Construction & Extraction | 680 (92.4%) | 56 (7.6%) |
| Installation, Maintenance & Repair | 512 (97.9%) | 11 (2.1%) |
| Total (Category) | 1,244 (94.9%) | 67 (5.1%) |
| Total (Overall) | 11,508 (51.8%) | 10,727 (48.2%) |
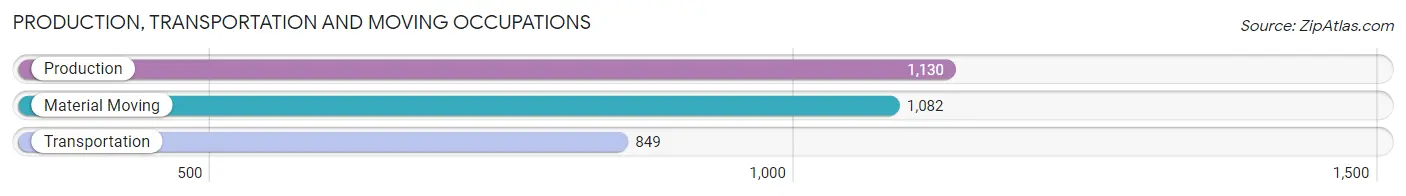
Production, Transportation and Moving Occupations
The most common Production, Transportation and Moving occupations in Grove City are Production (1,130 | 5.1%), Material Moving (1,082 | 4.9%), and Transportation (849 | 3.8%).
Production, Transportation and Moving Occupations by Sex
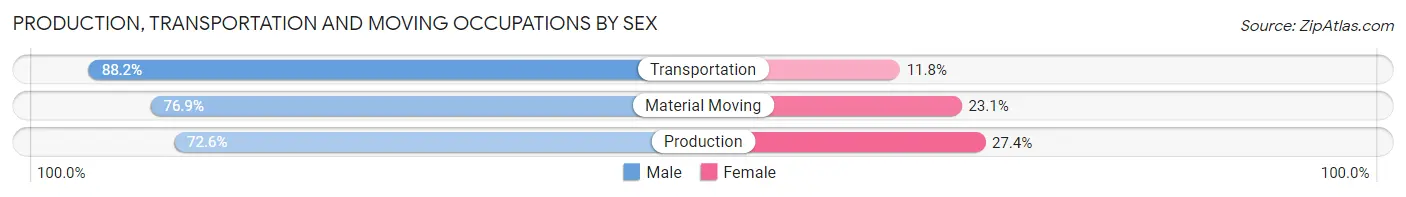
| Occupation | Male | Female |
| Production | 820 (72.6%) | 310 (27.4%) |
| Transportation | 749 (88.2%) | 100 (11.8%) |
| Material Moving | 832 (76.9%) | 250 (23.1%) |
| Total (Category) | 2,401 (78.4%) | 660 (21.6%) |
| Total (Overall) | 11,508 (51.8%) | 10,727 (48.2%) |
Employment Industries by Sex in Grove City
Employment Industries in Grove City
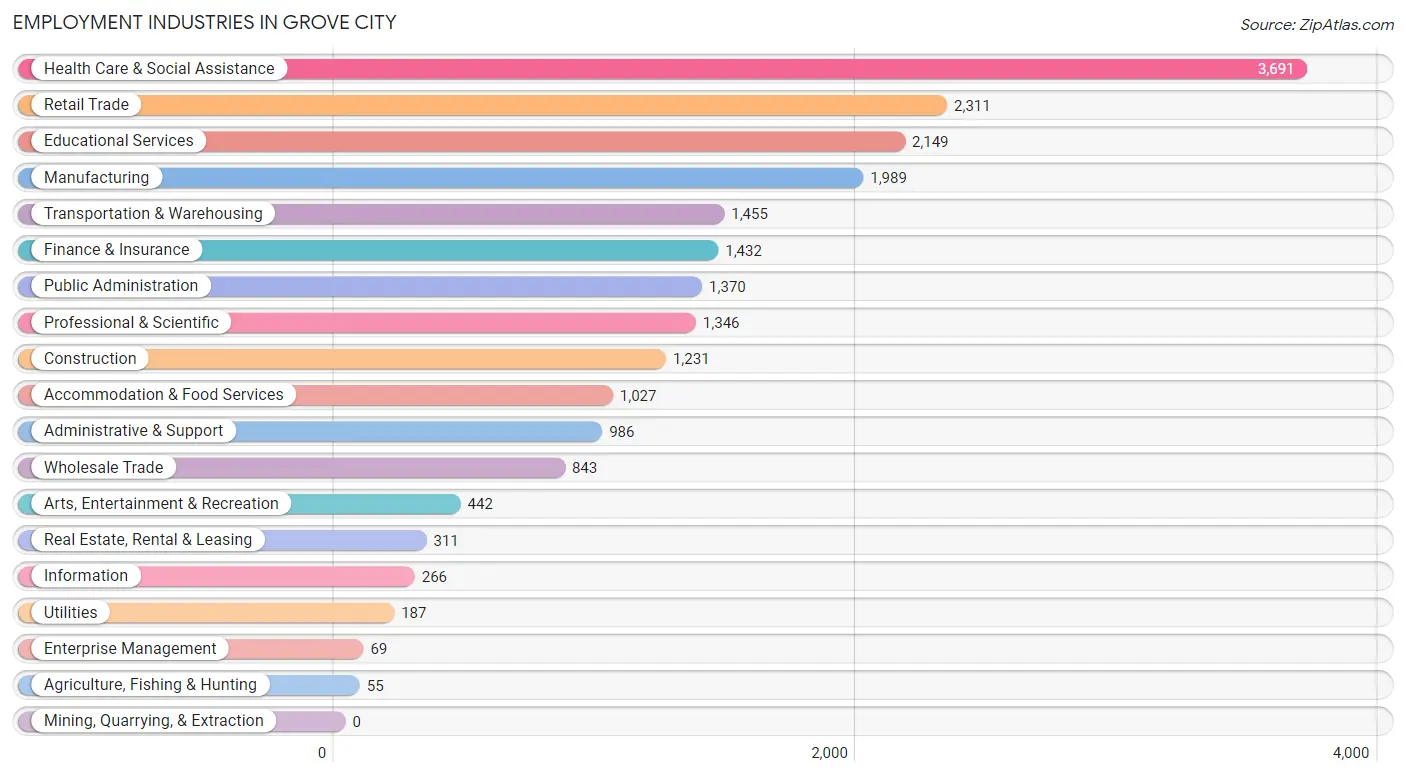
The major employment industries in Grove City include Health Care & Social Assistance (3,691 | 16.6%), Retail Trade (2,311 | 10.4%), Educational Services (2,149 | 9.7%), Manufacturing (1,989 | 8.9%), and Transportation & Warehousing (1,455 | 6.5%).
Employment Industries by Sex in Grove City
The Grove City industries that see more men than women are Agriculture, Fishing & Hunting (100.0%), Utilities (100.0%), and Administrative & Support (88.0%), whereas the industries that tend to have a higher number of women are Enterprise Management (100.0%), Health Care & Social Assistance (80.0%), and Educational Services (73.2%).
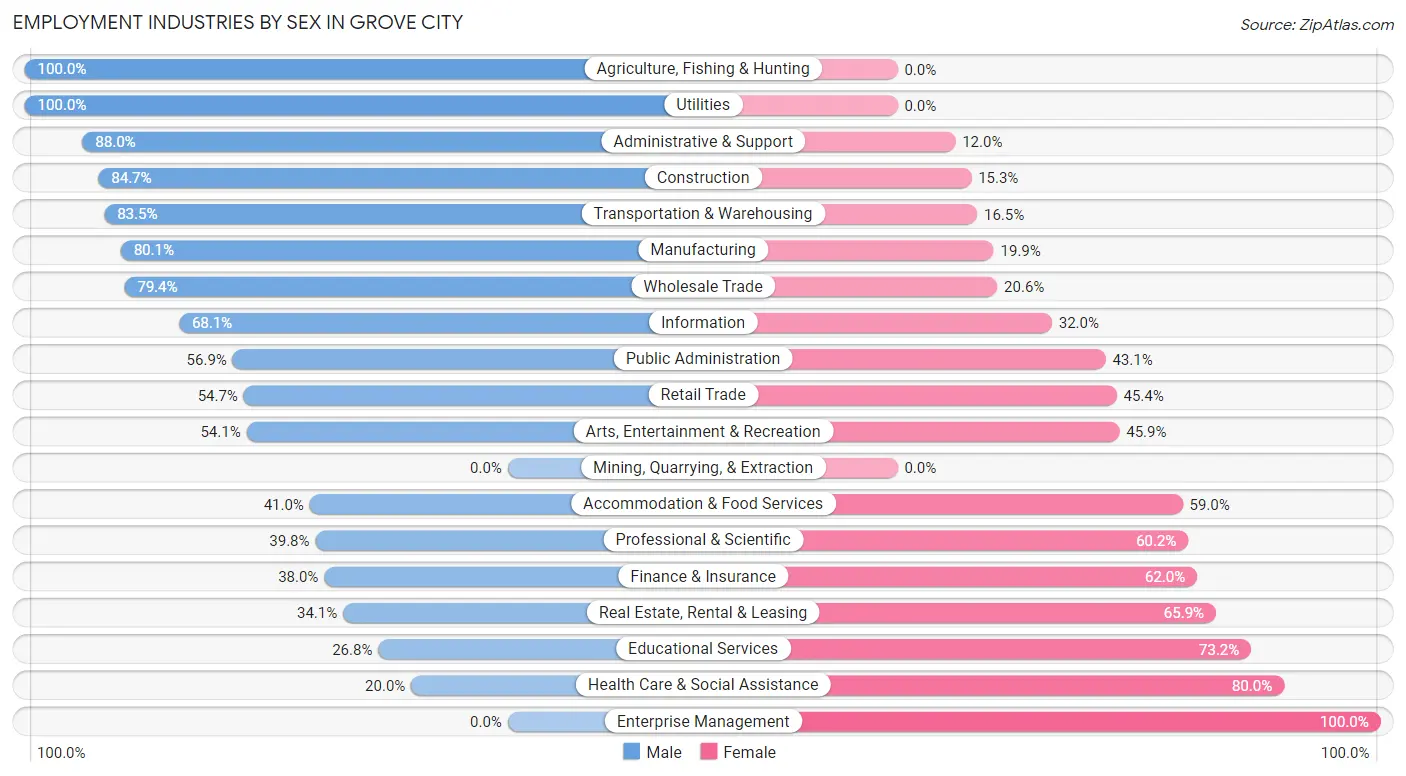
| Industry | Male | Female |
| Agriculture, Fishing & Hunting | 55 (100.0%) | 0 (0.0%) |
| Mining, Quarrying, & Extraction | 0 (0.0%) | 0 (0.0%) |
| Construction | 1,043 (84.7%) | 188 (15.3%) |
| Manufacturing | 1,593 (80.1%) | 396 (19.9%) |
| Wholesale Trade | 669 (79.4%) | 174 (20.6%) |
| Retail Trade | 1,263 (54.6%) | 1,048 (45.4%) |
| Transportation & Warehousing | 1,215 (83.5%) | 240 (16.5%) |
| Utilities | 187 (100.0%) | 0 (0.0%) |
| Information | 181 (68.0%) | 85 (32.0%) |
| Finance & Insurance | 544 (38.0%) | 888 (62.0%) |
| Real Estate, Rental & Leasing | 106 (34.1%) | 205 (65.9%) |
| Professional & Scientific | 536 (39.8%) | 810 (60.2%) |
| Enterprise Management | 0 (0.0%) | 69 (100.0%) |
| Administrative & Support | 868 (88.0%) | 118 (12.0%) |
| Educational Services | 576 (26.8%) | 1,573 (73.2%) |
| Health Care & Social Assistance | 738 (20.0%) | 2,953 (80.0%) |
| Arts, Entertainment & Recreation | 239 (54.1%) | 203 (45.9%) |
| Accommodation & Food Services | 421 (41.0%) | 606 (59.0%) |
| Public Administration | 780 (56.9%) | 590 (43.1%) |
| Total | 11,508 (51.8%) | 10,727 (48.2%) |
Education in Grove City
School Enrollment in Grove City
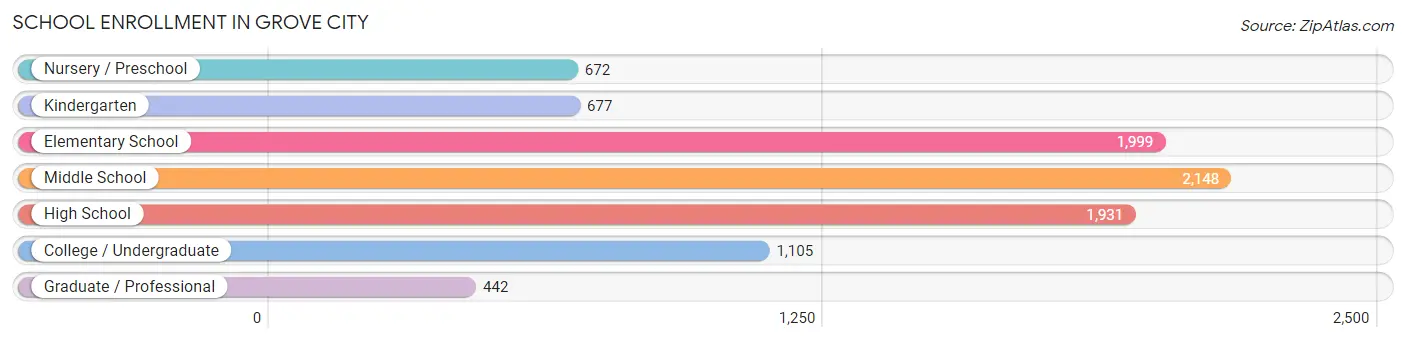
The most common levels of schooling among the 8,974 students in Grove City are middle school (2,148 | 23.9%), elementary school (1,999 | 22.3%), and high school (1,931 | 21.5%).
| School Level | # Students | % Students |
| Nursery / Preschool | 672 | 7.5% |
| Kindergarten | 677 | 7.5% |
| Elementary School | 1,999 | 22.3% |
| Middle School | 2,148 | 23.9% |
| High School | 1,931 | 21.5% |
| College / Undergraduate | 1,105 | 12.3% |
| Graduate / Professional | 442 | 4.9% |
| Total | 8,974 | 100.0% |
School Enrollment by Age by Funding Source in Grove City
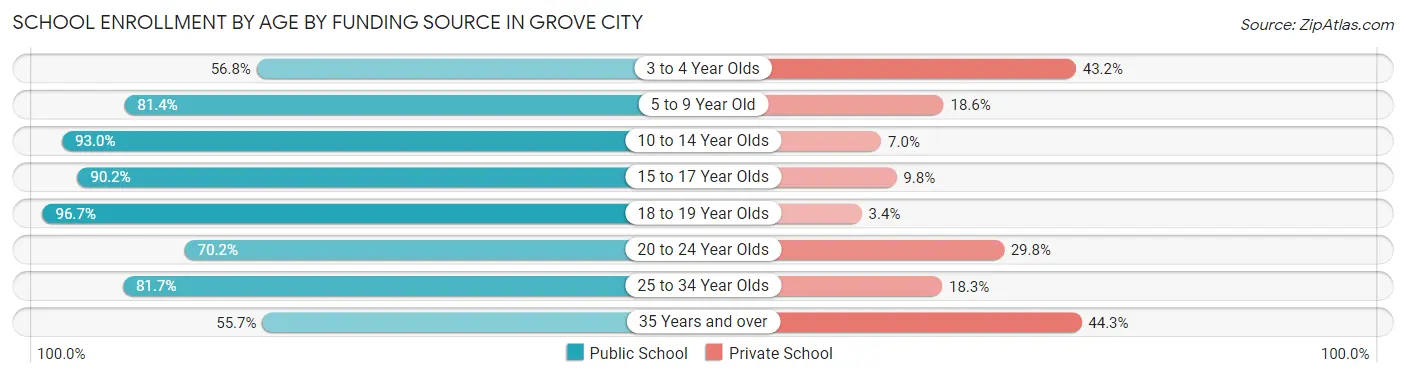
Out of a total of 8,974 students who are enrolled in schools in Grove City, 1,481 (16.5%) attend a private institution, while the remaining 7,493 (83.5%) are enrolled in public schools. The age group of 35 years and over has the highest likelihood of being enrolled in private schools, with 166 (44.3% in the age bracket) enrolled. Conversely, the age group of 18 to 19 year olds has the lowest likelihood of being enrolled in a private school, with 346 (96.7% in the age bracket) attending a public institution.
| Age Bracket | Public School | Private School |
| 3 to 4 Year Olds | 369 (56.8%) | 281 (43.2%) |
| 5 to 9 Year Old | 1,882 (81.4%) | 430 (18.6%) |
| 10 to 14 Year Olds | 2,493 (93.0%) | 187 (7.0%) |
| 15 to 17 Year Olds | 1,423 (90.2%) | 155 (9.8%) |
| 18 to 19 Year Olds | 346 (96.7%) | 12 (3.4%) |
| 20 to 24 Year Olds | 372 (70.2%) | 158 (29.8%) |
| 25 to 34 Year Olds | 401 (81.7%) | 90 (18.3%) |
| 35 Years and over | 209 (55.7%) | 166 (44.3%) |
| Total | 7,493 (83.5%) | 1,481 (16.5%) |
Educational Attainment by Field of Study in Grove City
Business (2,188 | 20.8%), science & technology (1,744 | 16.6%), education (1,288 | 12.2%), social sciences (751 | 7.1%), and engineering (653 | 6.2%) are the most common fields of study among 10,538 individuals in Grove City who have obtained a bachelor's degree or higher.
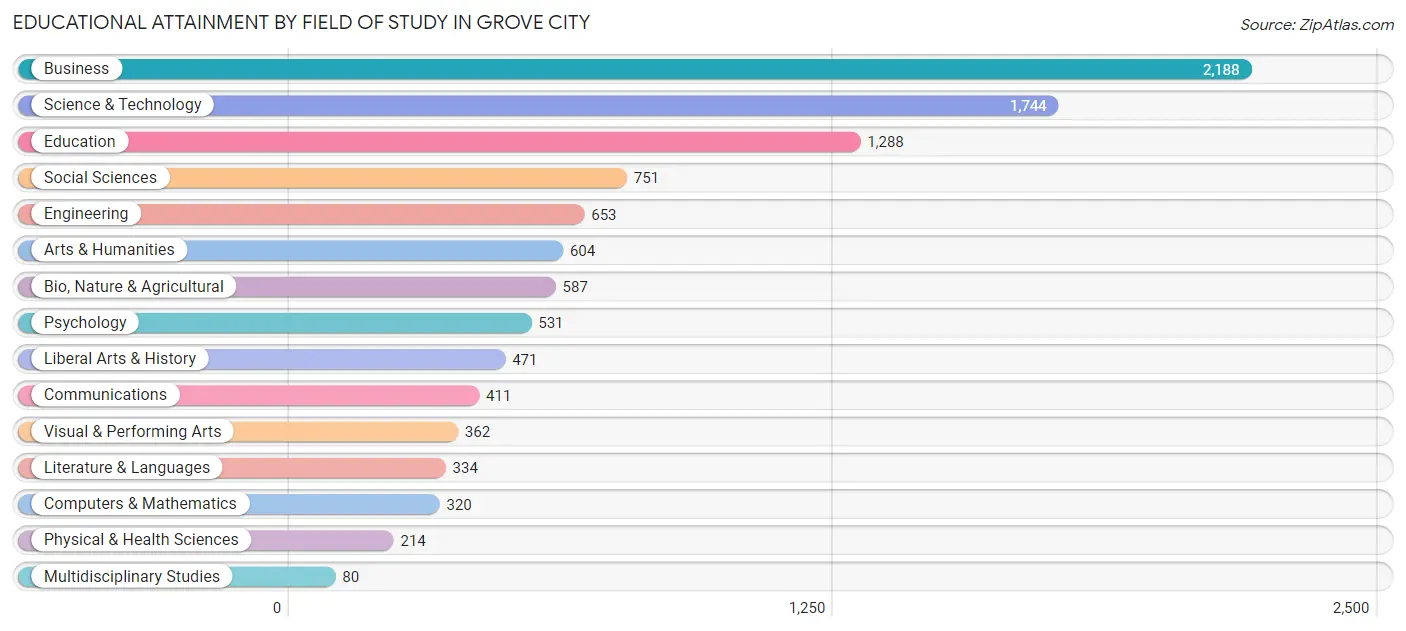
| Field of Study | # Graduates | % Graduates |
| Computers & Mathematics | 320 | 3.0% |
| Bio, Nature & Agricultural | 587 | 5.6% |
| Physical & Health Sciences | 214 | 2.0% |
| Psychology | 531 | 5.0% |
| Social Sciences | 751 | 7.1% |
| Engineering | 653 | 6.2% |
| Multidisciplinary Studies | 80 | 0.8% |
| Science & Technology | 1,744 | 16.6% |
| Business | 2,188 | 20.8% |
| Education | 1,288 | 12.2% |
| Literature & Languages | 334 | 3.2% |
| Liberal Arts & History | 471 | 4.5% |
| Visual & Performing Arts | 362 | 3.4% |
| Communications | 411 | 3.9% |
| Arts & Humanities | 604 | 5.7% |
| Total | 10,538 | 100.0% |
Transportation & Commute in Grove City
Vehicle Availability by Sex in Grove City
The most prevalent vehicle ownership categories in Grove City are males with 2 vehicles (5,349, accounting for 46.6%) and females with 2 vehicles (4,607, making up 50.5%).
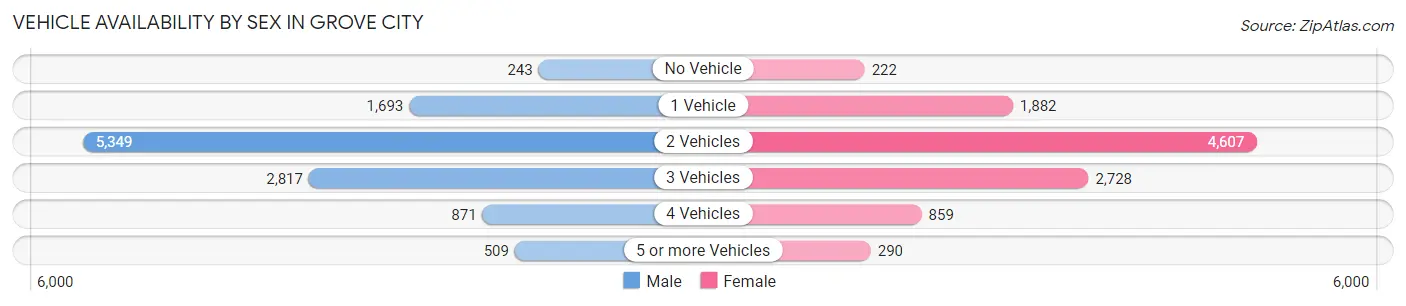
| Vehicles Available | Male | Female |
| No Vehicle | 243 (2.1%) | 222 (2.1%) |
| 1 Vehicle | 1,693 (14.7%) | 1,882 (17.8%) |
| 2 Vehicles | 5,349 (46.6%) | 4,607 (43.5%) |
| 3 Vehicles | 2,817 (24.5%) | 2,728 (25.8%) |
| 4 Vehicles | 871 (7.6%) | 859 (8.1%) |
| 5 or more Vehicles | 509 (4.4%) | 290 (2.7%) |
| Total | 11,482 (100.0%) | 10,588 (100.0%) |
Commute Time in Grove City
The most frequently occuring commute durations in Grove City are 20 to 24 minutes (3,781 commuters, 19.0%), 30 to 34 minutes (3,490 commuters, 17.6%), and 10 to 14 minutes (2,796 commuters, 14.1%).
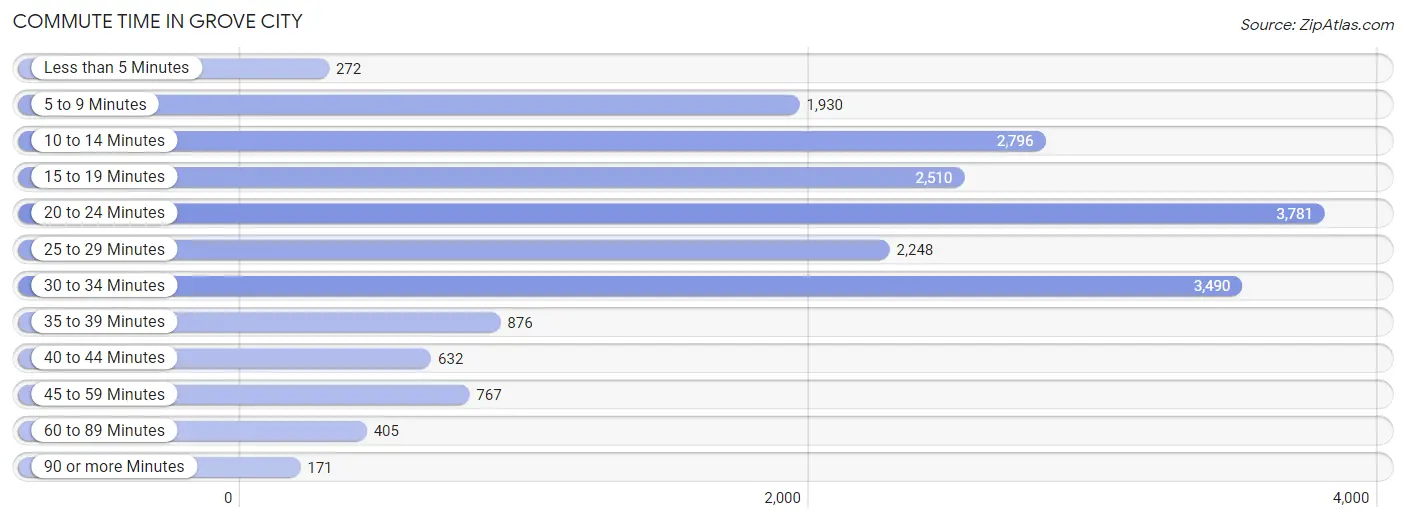
| Commute Time | # Commuters | % Commuters |
| Less than 5 Minutes | 272 | 1.4% |
| 5 to 9 Minutes | 1,930 | 9.7% |
| 10 to 14 Minutes | 2,796 | 14.1% |
| 15 to 19 Minutes | 2,510 | 12.6% |
| 20 to 24 Minutes | 3,781 | 19.0% |
| 25 to 29 Minutes | 2,248 | 11.3% |
| 30 to 34 Minutes | 3,490 | 17.6% |
| 35 to 39 Minutes | 876 | 4.4% |
| 40 to 44 Minutes | 632 | 3.2% |
| 45 to 59 Minutes | 767 | 3.9% |
| 60 to 89 Minutes | 405 | 2.0% |
| 90 or more Minutes | 171 | 0.9% |
Commute Time by Sex in Grove City
The most common commute times in Grove City are 20 to 24 minutes (2,095 commuters, 19.5%) for males and 20 to 24 minutes (1,686 commuters, 18.5%) for females.
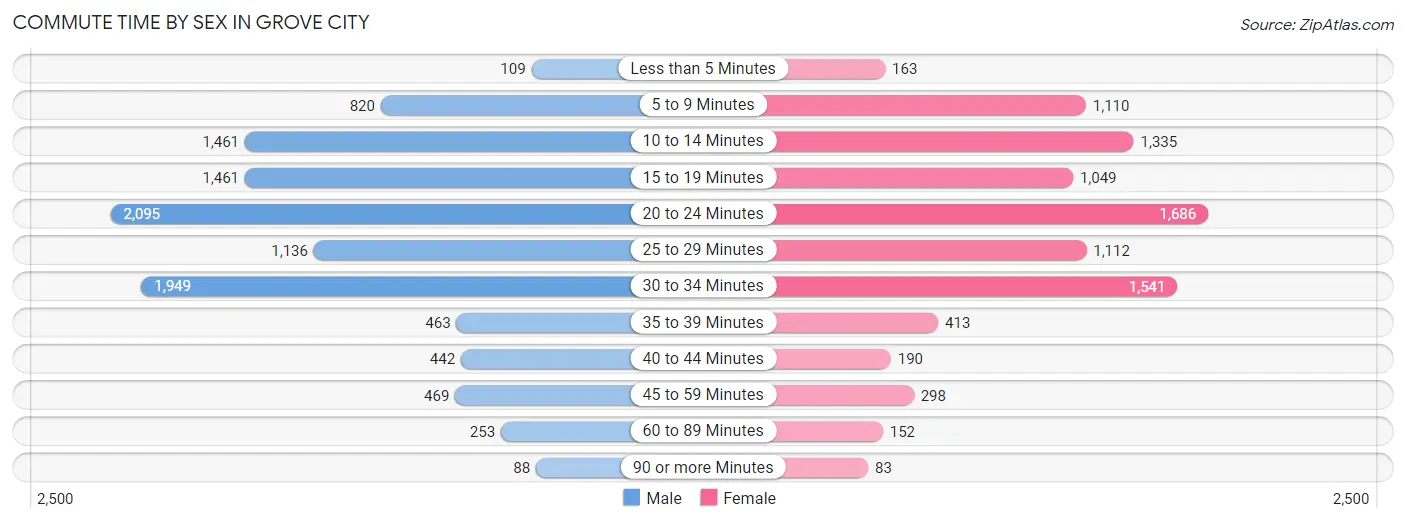
| Commute Time | Male | Female |
| Less than 5 Minutes | 109 (1.0%) | 163 (1.8%) |
| 5 to 9 Minutes | 820 (7.6%) | 1,110 (12.2%) |
| 10 to 14 Minutes | 1,461 (13.6%) | 1,335 (14.6%) |
| 15 to 19 Minutes | 1,461 (13.6%) | 1,049 (11.5%) |
| 20 to 24 Minutes | 2,095 (19.5%) | 1,686 (18.5%) |
| 25 to 29 Minutes | 1,136 (10.6%) | 1,112 (12.2%) |
| 30 to 34 Minutes | 1,949 (18.1%) | 1,541 (16.9%) |
| 35 to 39 Minutes | 463 (4.3%) | 413 (4.5%) |
| 40 to 44 Minutes | 442 (4.1%) | 190 (2.1%) |
| 45 to 59 Minutes | 469 (4.4%) | 298 (3.3%) |
| 60 to 89 Minutes | 253 (2.4%) | 152 (1.7%) |
| 90 or more Minutes | 88 (0.8%) | 83 (0.9%) |
Time of Departure to Work by Sex in Grove City
The most frequent times of departure to work in Grove City are 7:00 AM to 7:29 AM (1,753, 16.3%) for males and 7:30 AM to 7:59 AM (1,603, 17.5%) for females.
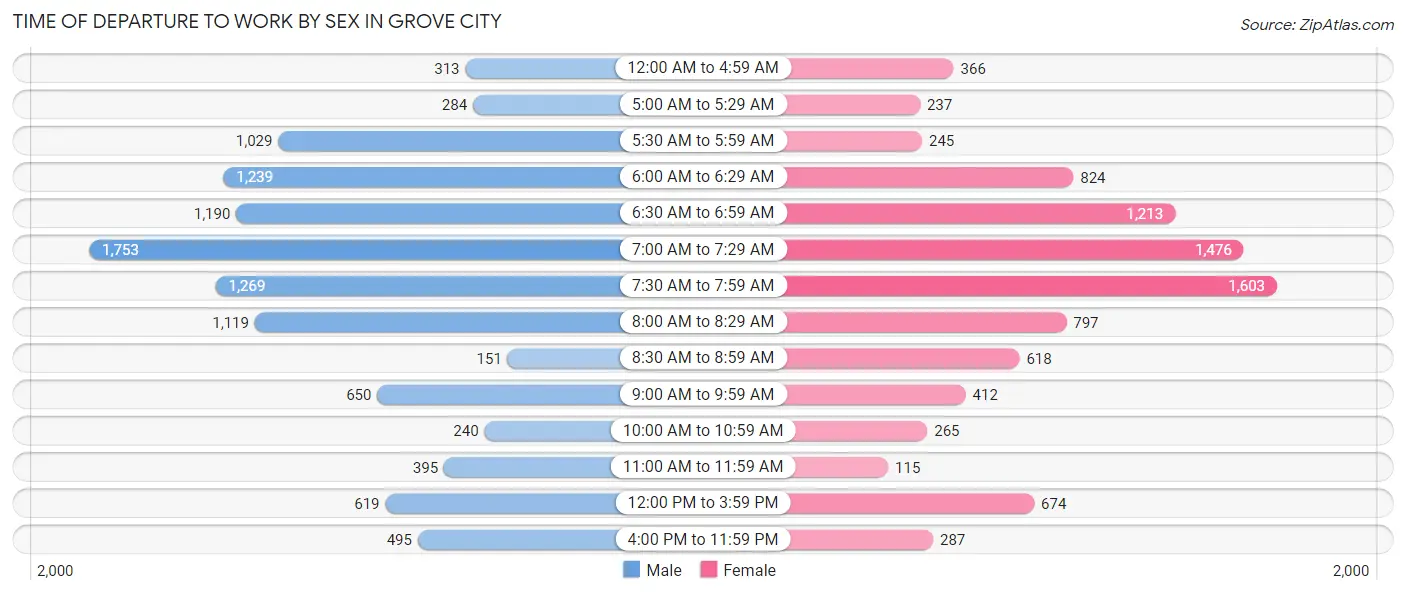
| Time of Departure | Male | Female |
| 12:00 AM to 4:59 AM | 313 (2.9%) | 366 (4.0%) |
| 5:00 AM to 5:29 AM | 284 (2.6%) | 237 (2.6%) |
| 5:30 AM to 5:59 AM | 1,029 (9.6%) | 245 (2.7%) |
| 6:00 AM to 6:29 AM | 1,239 (11.5%) | 824 (9.0%) |
| 6:30 AM to 6:59 AM | 1,190 (11.1%) | 1,213 (13.3%) |
| 7:00 AM to 7:29 AM | 1,753 (16.3%) | 1,476 (16.2%) |
| 7:30 AM to 7:59 AM | 1,269 (11.8%) | 1,603 (17.5%) |
| 8:00 AM to 8:29 AM | 1,119 (10.4%) | 797 (8.7%) |
| 8:30 AM to 8:59 AM | 151 (1.4%) | 618 (6.8%) |
| 9:00 AM to 9:59 AM | 650 (6.0%) | 412 (4.5%) |
| 10:00 AM to 10:59 AM | 240 (2.2%) | 265 (2.9%) |
| 11:00 AM to 11:59 AM | 395 (3.7%) | 115 (1.3%) |
| 12:00 PM to 3:59 PM | 619 (5.8%) | 674 (7.4%) |
| 4:00 PM to 11:59 PM | 495 (4.6%) | 287 (3.1%) |
| Total | 10,746 (100.0%) | 9,132 (100.0%) |
Housing Occupancy in Grove City
Occupancy by Ownership in Grove City
Of the total 16,897 dwellings in Grove City, owner-occupied units account for 11,958 (70.8%), while renter-occupied units make up 4,939 (29.2%).
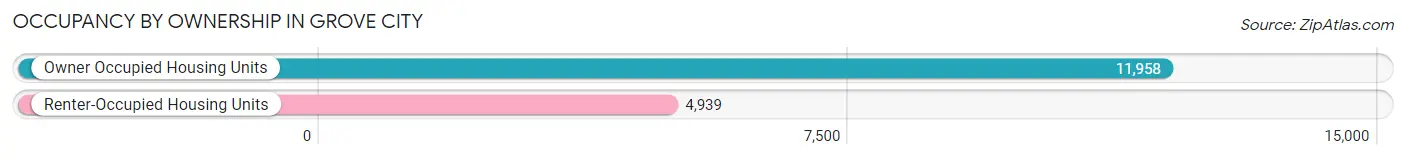
| Occupancy | # Housing Units | % Housing Units |
| Owner Occupied Housing Units | 11,958 | 70.8% |
| Renter-Occupied Housing Units | 4,939 | 29.2% |
| Total Occupied Housing Units | 16,897 | 100.0% |
Occupancy by Household Size in Grove City
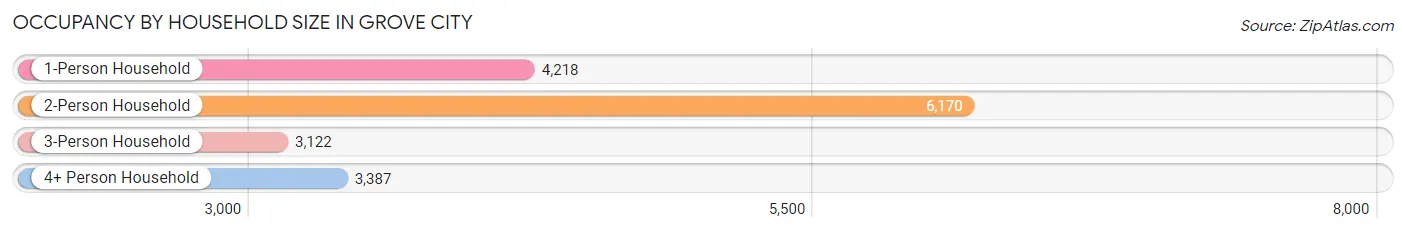
| Household Size | # Housing Units | % Housing Units |
| 1-Person Household | 4,218 | 25.0% |
| 2-Person Household | 6,170 | 36.5% |
| 3-Person Household | 3,122 | 18.5% |
| 4+ Person Household | 3,387 | 20.0% |
| Total Housing Units | 16,897 | 100.0% |
Occupancy by Ownership by Household Size in Grove City
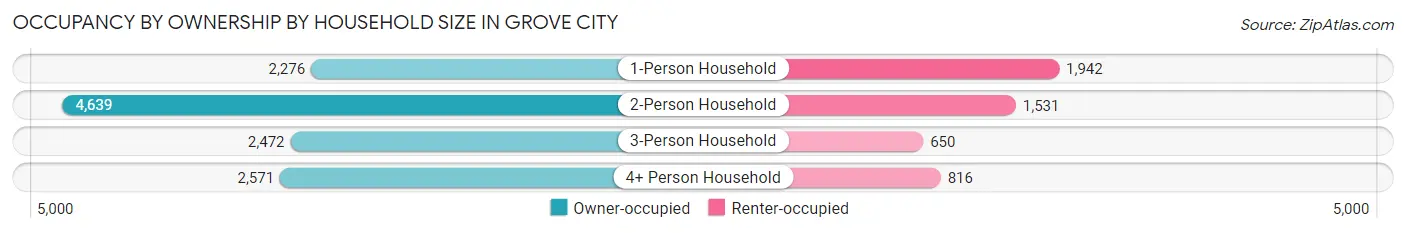
| Household Size | Owner-occupied | Renter-occupied |
| 1-Person Household | 2,276 (54.0%) | 1,942 (46.0%) |
| 2-Person Household | 4,639 (75.2%) | 1,531 (24.8%) |
| 3-Person Household | 2,472 (79.2%) | 650 (20.8%) |
| 4+ Person Household | 2,571 (75.9%) | 816 (24.1%) |
| Total Housing Units | 11,958 (70.8%) | 4,939 (29.2%) |
Occupancy by Educational Attainment in Grove City
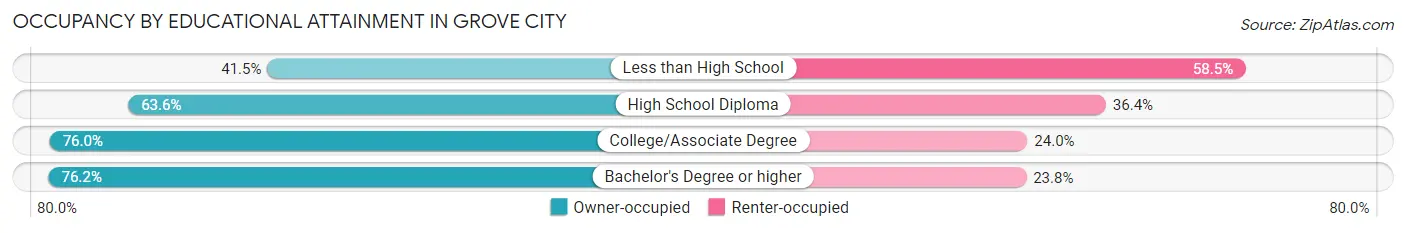
| Household Size | Owner-occupied | Renter-occupied |
| Less than High School | 362 (41.5%) | 510 (58.5%) |
| High School Diploma | 3,042 (63.6%) | 1,744 (36.4%) |
| College/Associate Degree | 4,094 (76.0%) | 1,292 (24.0%) |
| Bachelor's Degree or higher | 4,460 (76.2%) | 1,393 (23.8%) |
Occupancy by Age of Householder in Grove City
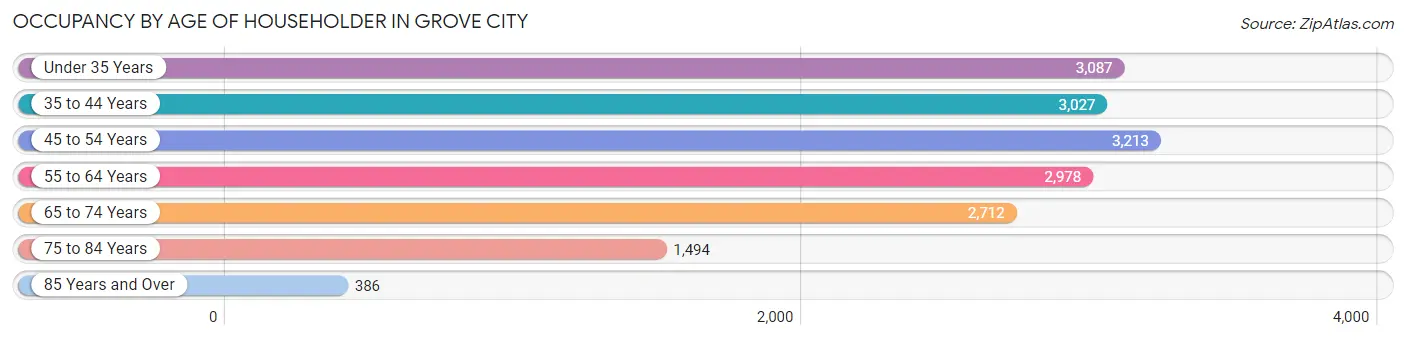
| Age Bracket | # Households | % Households |
| Under 35 Years | 3,087 | 18.3% |
| 35 to 44 Years | 3,027 | 17.9% |
| 45 to 54 Years | 3,213 | 19.0% |
| 55 to 64 Years | 2,978 | 17.6% |
| 65 to 74 Years | 2,712 | 16.1% |
| 75 to 84 Years | 1,494 | 8.8% |
| 85 Years and Over | 386 | 2.3% |
| Total | 16,897 | 100.0% |
Housing Finances in Grove City
Median Income by Occupancy in Grove City
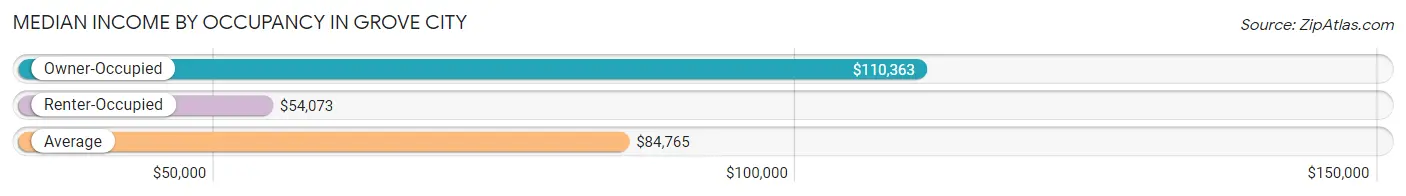
| Occupancy Type | # Households | Median Income |
| Owner-Occupied | 11,958 (70.8%) | $110,363 |
| Renter-Occupied | 4,939 (29.2%) | $54,073 |
| Average | 16,897 (100.0%) | $84,765 |
Occupancy by Householder Income Bracket in Grove City
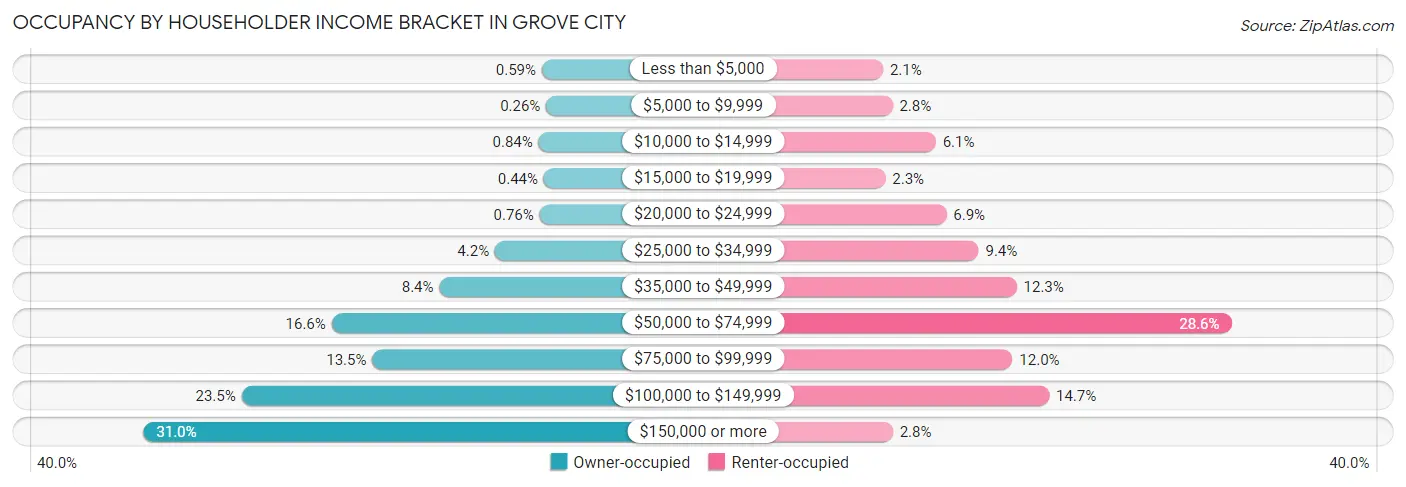
| Income Bracket | Owner-occupied | Renter-occupied |
| Less than $5,000 | 71 (0.6%) | 103 (2.1%) |
| $5,000 to $9,999 | 31 (0.3%) | 139 (2.8%) |
| $10,000 to $14,999 | 100 (0.8%) | 302 (6.1%) |
| $15,000 to $19,999 | 53 (0.4%) | 112 (2.3%) |
| $20,000 to $24,999 | 91 (0.8%) | 342 (6.9%) |
| $25,000 to $34,999 | 498 (4.2%) | 463 (9.4%) |
| $35,000 to $49,999 | 1,004 (8.4%) | 606 (12.3%) |
| $50,000 to $74,999 | 1,986 (16.6%) | 1,414 (28.6%) |
| $75,000 to $99,999 | 1,616 (13.5%) | 590 (11.9%) |
| $100,000 to $149,999 | 2,807 (23.5%) | 728 (14.7%) |
| $150,000 or more | 3,701 (30.9%) | 140 (2.8%) |
| Total | 11,958 (100.0%) | 4,939 (100.0%) |
Monthly Housing Cost Tiers in Grove City
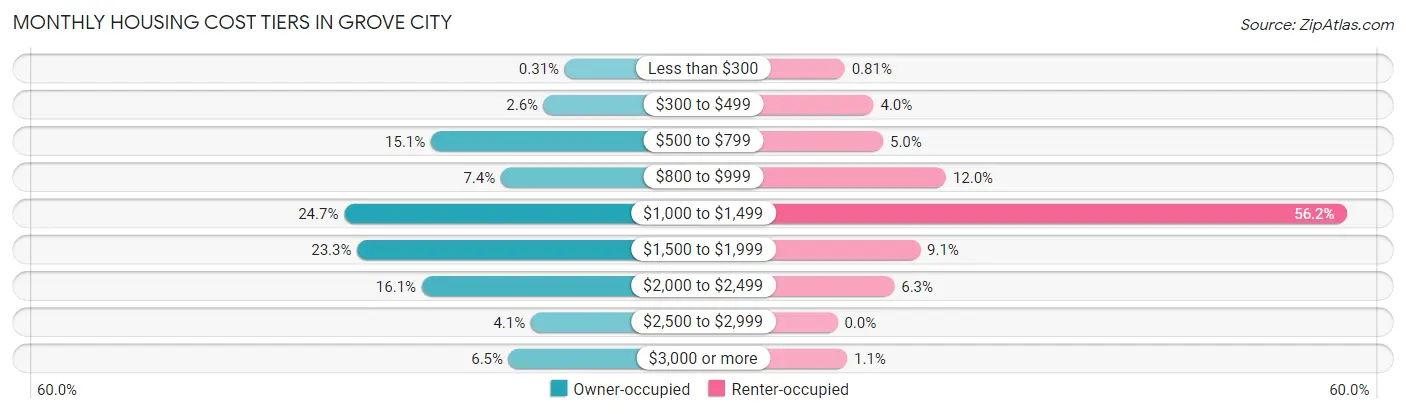
| Monthly Cost | Owner-occupied | Renter-occupied |
| Less than $300 | 37 (0.3%) | 40 (0.8%) |
| $300 to $499 | 315 (2.6%) | 197 (4.0%) |
| $500 to $799 | 1,805 (15.1%) | 249 (5.0%) |
| $800 to $999 | 881 (7.4%) | 592 (12.0%) |
| $1,000 to $1,499 | 2,953 (24.7%) | 2,776 (56.2%) |
| $1,500 to $1,999 | 2,780 (23.3%) | 451 (9.1%) |
| $2,000 to $2,499 | 1,926 (16.1%) | 310 (6.3%) |
| $2,500 to $2,999 | 484 (4.1%) | 0 (0.0%) |
| $3,000 or more | 777 (6.5%) | 53 (1.1%) |
| Total | 11,958 (100.0%) | 4,939 (100.0%) |
Physical Housing Characteristics in Grove City
Housing Structures in Grove City
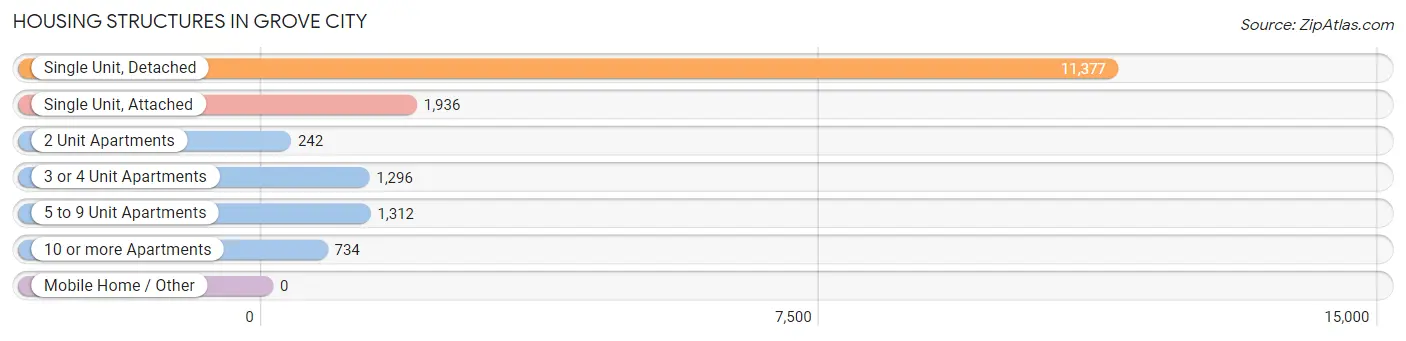
| Structure Type | # Housing Units | % Housing Units |
| Single Unit, Detached | 11,377 | 67.3% |
| Single Unit, Attached | 1,936 | 11.5% |
| 2 Unit Apartments | 242 | 1.4% |
| 3 or 4 Unit Apartments | 1,296 | 7.7% |
| 5 to 9 Unit Apartments | 1,312 | 7.8% |
| 10 or more Apartments | 734 | 4.3% |
| Mobile Home / Other | 0 | 0.0% |
| Total | 16,897 | 100.0% |
Housing Structures by Occupancy in Grove City
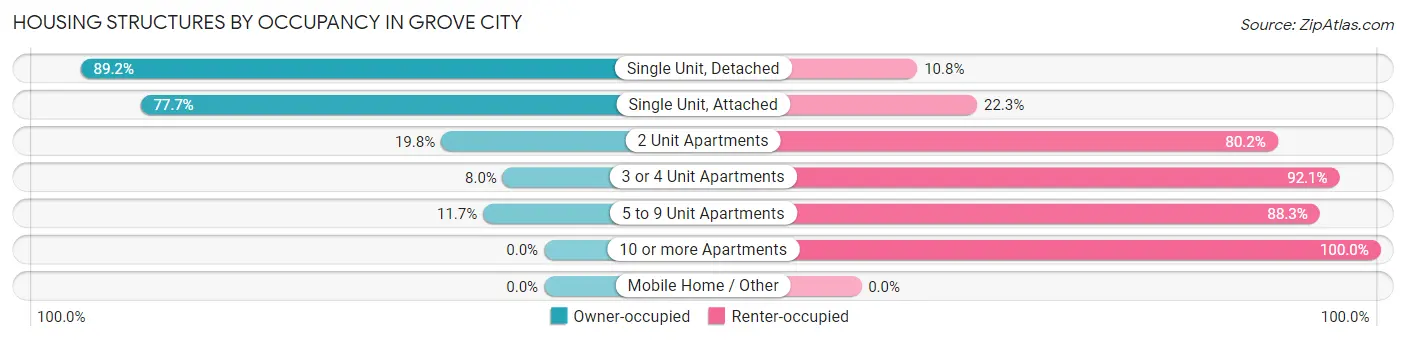
| Structure Type | Owner-occupied | Renter-occupied |
| Single Unit, Detached | 10,149 (89.2%) | 1,228 (10.8%) |
| Single Unit, Attached | 1,504 (77.7%) | 432 (22.3%) |
| 2 Unit Apartments | 48 (19.8%) | 194 (80.2%) |
| 3 or 4 Unit Apartments | 103 (8.0%) | 1,193 (92.0%) |
| 5 to 9 Unit Apartments | 154 (11.7%) | 1,158 (88.3%) |
| 10 or more Apartments | 0 (0.0%) | 734 (100.0%) |
| Mobile Home / Other | 0 (0.0%) | 0 (0.0%) |
| Total | 11,958 (70.8%) | 4,939 (29.2%) |
Housing Structures by Number of Rooms in Grove City
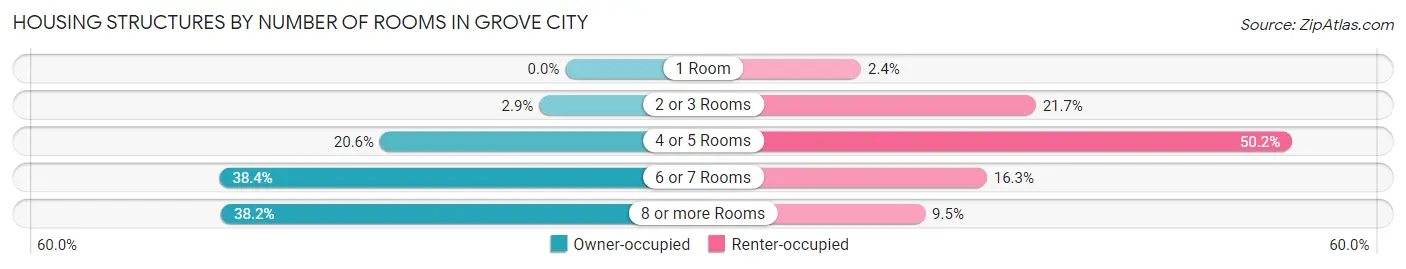
| Number of Rooms | Owner-occupied | Renter-occupied |
| 1 Room | 0 (0.0%) | 116 (2.4%) |
| 2 or 3 Rooms | 345 (2.9%) | 1,073 (21.7%) |
| 4 or 5 Rooms | 2,460 (20.6%) | 2,478 (50.2%) |
| 6 or 7 Rooms | 4,588 (38.4%) | 805 (16.3%) |
| 8 or more Rooms | 4,565 (38.2%) | 467 (9.5%) |
| Total | 11,958 (100.0%) | 4,939 (100.0%) |
Housing Structure by Heating Type in Grove City
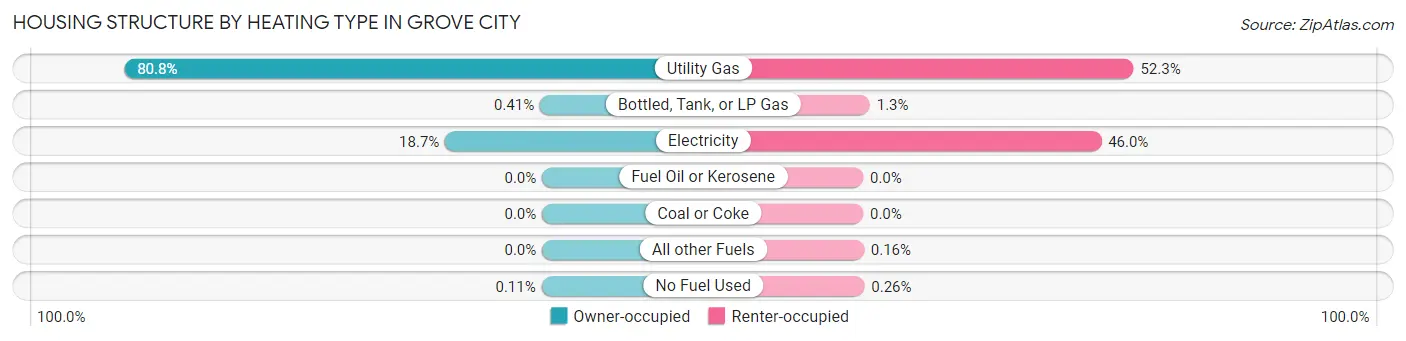
| Heating Type | Owner-occupied | Renter-occupied |
| Utility Gas | 9,656 (80.7%) | 2,581 (52.3%) |
| Bottled, Tank, or LP Gas | 49 (0.4%) | 64 (1.3%) |
| Electricity | 2,240 (18.7%) | 2,273 (46.0%) |
| Fuel Oil or Kerosene | 0 (0.0%) | 0 (0.0%) |
| Coal or Coke | 0 (0.0%) | 0 (0.0%) |
| All other Fuels | 0 (0.0%) | 8 (0.2%) |
| No Fuel Used | 13 (0.1%) | 13 (0.3%) |
| Total | 11,958 (100.0%) | 4,939 (100.0%) |
Household Vehicle Usage in Grove City
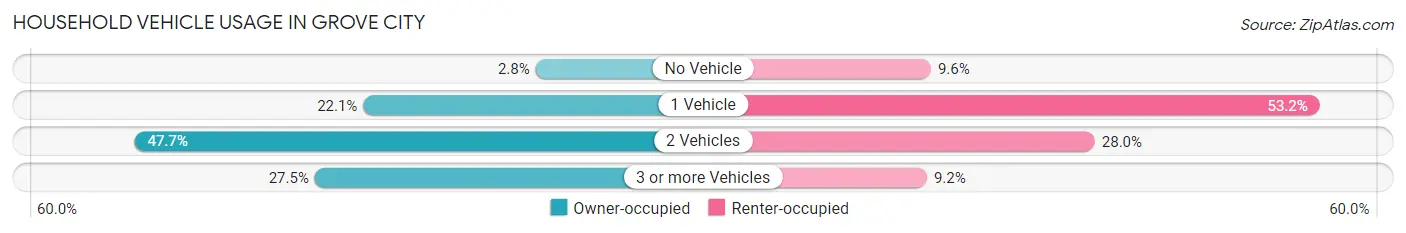
| Vehicles per Household | Owner-occupied | Renter-occupied |
| No Vehicle | 330 (2.8%) | 476 (9.6%) |
| 1 Vehicle | 2,639 (22.1%) | 2,626 (53.2%) |
| 2 Vehicles | 5,701 (47.7%) | 1,383 (28.0%) |
| 3 or more Vehicles | 3,288 (27.5%) | 454 (9.2%) |
| Total | 11,958 (100.0%) | 4,939 (100.0%) |
Real Estate & Mortgages in Grove City
Real Estate and Mortgage Overview in Grove City
| Characteristic | Without Mortgage | With Mortgage |
| Housing Units | 2,970 | 8,988 |
| Median Property Value | $247,000 | $267,900 |
| Median Household Income | $83,333 | $3,071 |
| Monthly Housing Costs | $723 | $754 |
| Real Estate Taxes | $4,170 | $211 |
Property Value by Mortgage Status in Grove City
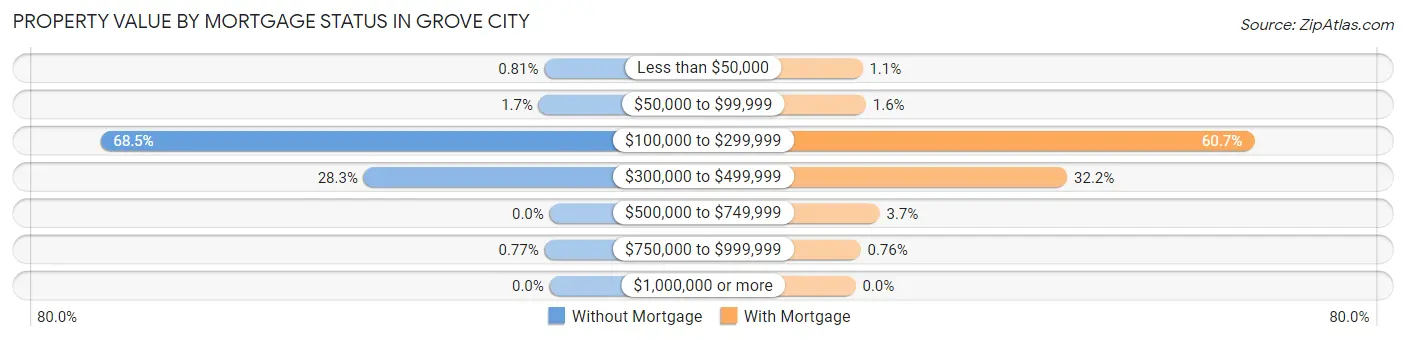
| Property Value | Without Mortgage | With Mortgage |
| Less than $50,000 | 24 (0.8%) | 94 (1.1%) |
| $50,000 to $99,999 | 49 (1.7%) | 141 (1.6%) |
| $100,000 to $299,999 | 2,033 (68.4%) | 5,458 (60.7%) |
| $300,000 to $499,999 | 841 (28.3%) | 2,898 (32.2%) |
| $500,000 to $749,999 | 0 (0.0%) | 329 (3.7%) |
| $750,000 to $999,999 | 23 (0.8%) | 68 (0.8%) |
| $1,000,000 or more | 0 (0.0%) | 0 (0.0%) |
| Total | 2,970 (100.0%) | 8,988 (100.0%) |
Household Income by Mortgage Status in Grove City
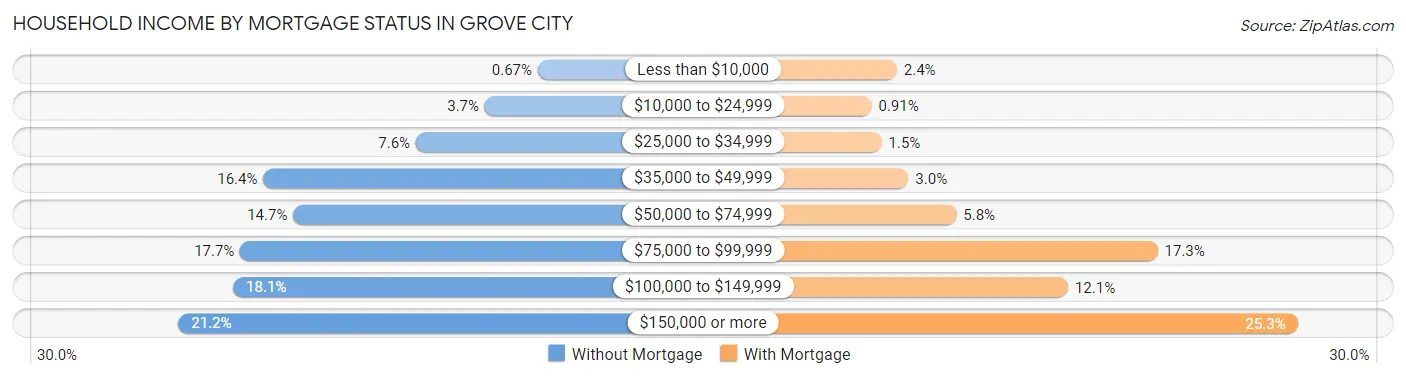
| Household Income | Without Mortgage | With Mortgage |
| Less than $10,000 | 20 (0.7%) | 212 (2.4%) |
| $10,000 to $24,999 | 110 (3.7%) | 82 (0.9%) |
| $25,000 to $34,999 | 227 (7.6%) | 134 (1.5%) |
| $35,000 to $49,999 | 486 (16.4%) | 271 (3.0%) |
| $50,000 to $74,999 | 435 (14.6%) | 518 (5.8%) |
| $75,000 to $99,999 | 525 (17.7%) | 1,551 (17.3%) |
| $100,000 to $149,999 | 537 (18.1%) | 1,091 (12.1%) |
| $150,000 or more | 630 (21.2%) | 2,270 (25.3%) |
| Total | 2,970 (100.0%) | 8,988 (100.0%) |
Property Value to Household Income Ratio in Grove City
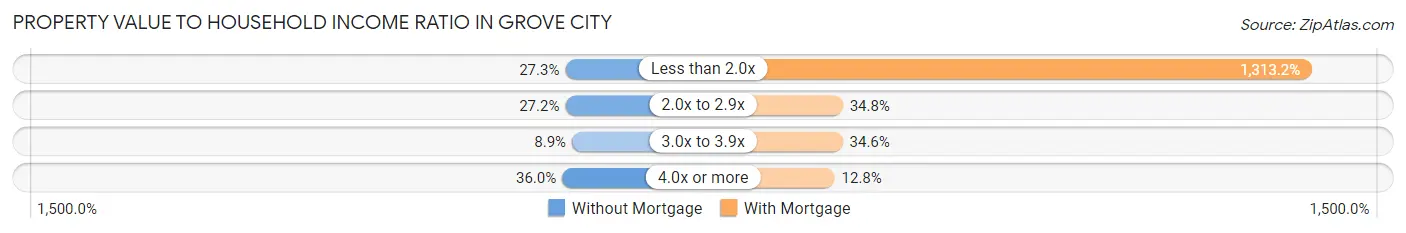
| Value-to-Income Ratio | Without Mortgage | With Mortgage |
| Less than 2.0x | 810 (27.3%) | 118,030 (1,313.2%) |
| 2.0x to 2.9x | 808 (27.2%) | 3,129 (34.8%) |
| 3.0x to 3.9x | 264 (8.9%) | 3,106 (34.6%) |
| 4.0x or more | 1,068 (36.0%) | 1,148 (12.8%) |
| Total | 2,970 (100.0%) | 8,988 (100.0%) |
Real Estate Taxes by Mortgage Status in Grove City
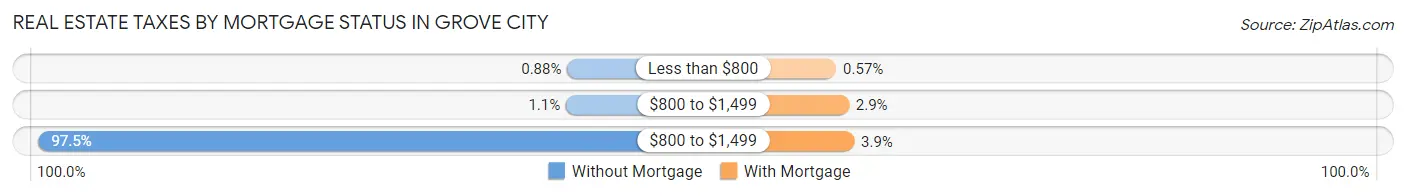
| Property Taxes | Without Mortgage | With Mortgage |
| Less than $800 | 26 (0.9%) | 51 (0.6%) |
| $800 to $1,499 | 33 (1.1%) | 259 (2.9%) |
| $800 to $1,499 | 2,895 (97.5%) | 346 (3.8%) |
| Total | 2,970 (100.0%) | 8,988 (100.0%) |
Health & Disability in Grove City
Health Insurance Coverage by Age in Grove City
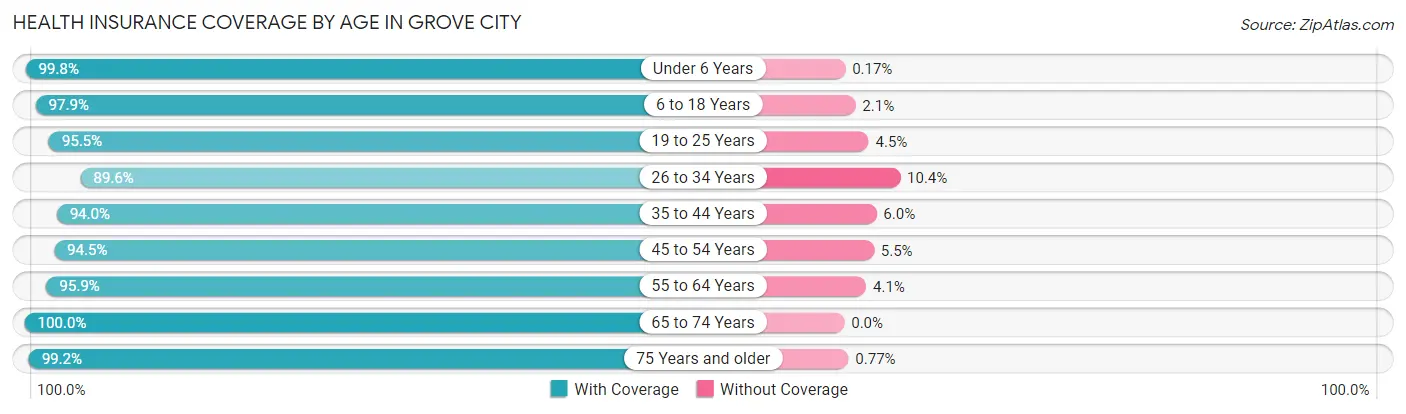
| Age Bracket | With Coverage | Without Coverage |
| Under 6 Years | 3,575 (99.8%) | 6 (0.2%) |
| 6 to 18 Years | 6,424 (97.9%) | 136 (2.1%) |
| 19 to 25 Years | 2,213 (95.5%) | 105 (4.5%) |
| 26 to 34 Years | 4,361 (89.6%) | 507 (10.4%) |
| 35 to 44 Years | 5,495 (94.0%) | 350 (6.0%) |
| 45 to 54 Years | 5,265 (94.5%) | 307 (5.5%) |
| 55 to 64 Years | 4,808 (95.9%) | 204 (4.1%) |
| 65 to 74 Years | 4,402 (100.0%) | 0 (0.0%) |
| 75 Years and older | 2,962 (99.2%) | 23 (0.8%) |
| Total | 39,505 (96.0%) | 1,638 (4.0%) |
Health Insurance Coverage by Citizenship Status in Grove City
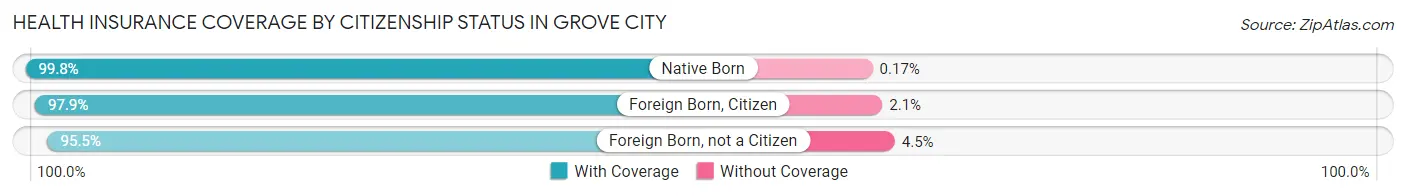
| Citizenship Status | With Coverage | Without Coverage |
| Native Born | 3,575 (99.8%) | 6 (0.2%) |
| Foreign Born, Citizen | 6,424 (97.9%) | 136 (2.1%) |
| Foreign Born, not a Citizen | 2,213 (95.5%) | 105 (4.5%) |
Health Insurance Coverage by Household Income in Grove City
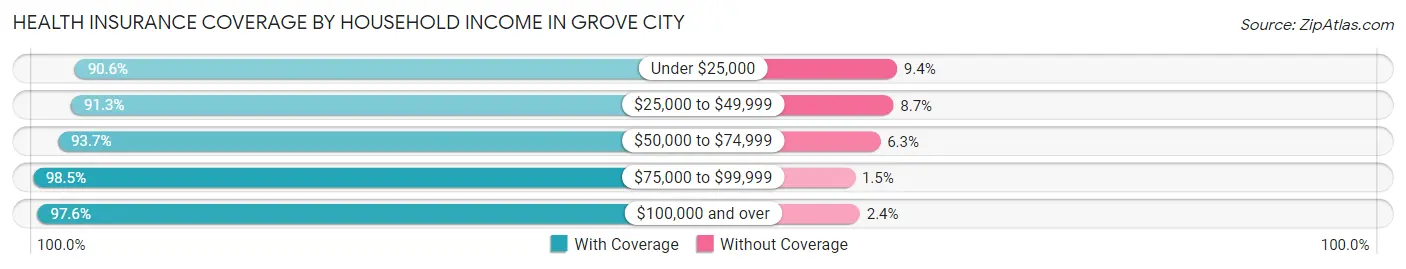
| Household Income | With Coverage | Without Coverage |
| Under $25,000 | 1,863 (90.6%) | 193 (9.4%) |
| $25,000 to $49,999 | 3,884 (91.3%) | 371 (8.7%) |
| $50,000 to $74,999 | 6,733 (93.7%) | 450 (6.3%) |
| $75,000 to $99,999 | 5,218 (98.5%) | 81 (1.5%) |
| $100,000 and over | 21,739 (97.6%) | 542 (2.4%) |
Public vs Private Health Insurance Coverage by Age in Grove City
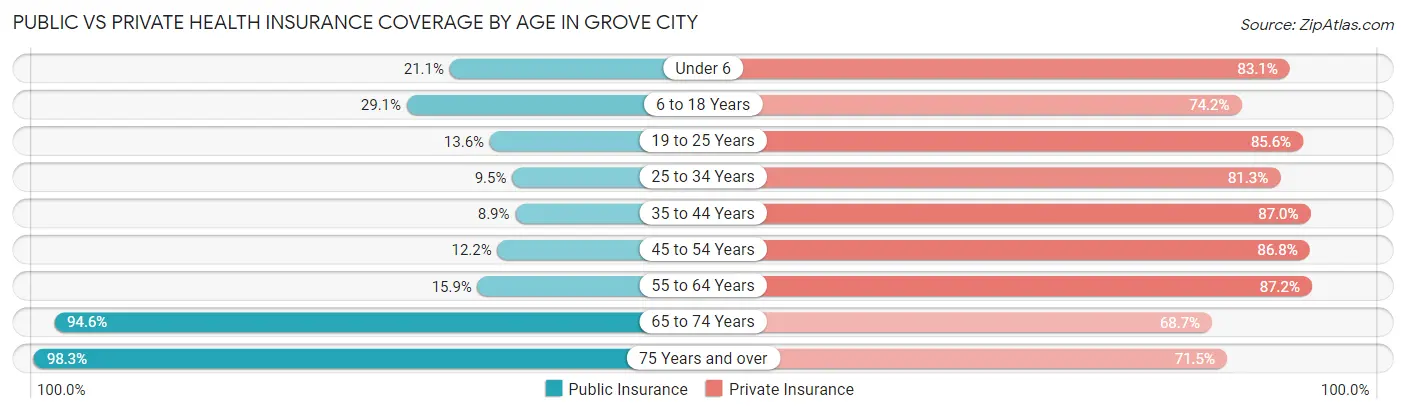
| Age Bracket | Public Insurance | Private Insurance |
| Under 6 | 755 (21.1%) | 2,976 (83.1%) |
| 6 to 18 Years | 1,906 (29.0%) | 4,864 (74.2%) |
| 19 to 25 Years | 316 (13.6%) | 1,984 (85.6%) |
| 25 to 34 Years | 461 (9.5%) | 3,959 (81.3%) |
| 35 to 44 Years | 521 (8.9%) | 5,083 (87.0%) |
| 45 to 54 Years | 681 (12.2%) | 4,837 (86.8%) |
| 55 to 64 Years | 797 (15.9%) | 4,372 (87.2%) |
| 65 to 74 Years | 4,162 (94.6%) | 3,024 (68.7%) |
| 75 Years and over | 2,934 (98.3%) | 2,133 (71.5%) |
| Total | 12,533 (30.5%) | 33,232 (80.8%) |
Disability Status by Sex by Age in Grove City
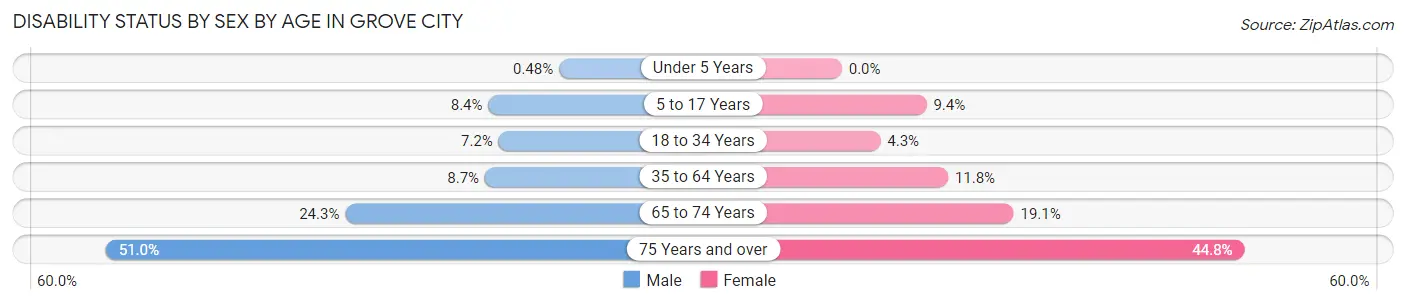
| Age Bracket | Male | Female |
| Under 5 Years | 9 (0.5%) | 0 (0.0%) |
| 5 to 17 Years | 302 (8.4%) | 290 (9.4%) |
| 18 to 34 Years | 280 (7.2%) | 161 (4.3%) |
| 35 to 64 Years | 691 (8.7%) | 1,006 (11.8%) |
| 65 to 74 Years | 489 (24.3%) | 457 (19.1%) |
| 75 Years and over | 696 (50.9%) | 726 (44.8%) |
Disability Class by Sex by Age in Grove City
Disability Class: Hearing Difficulty
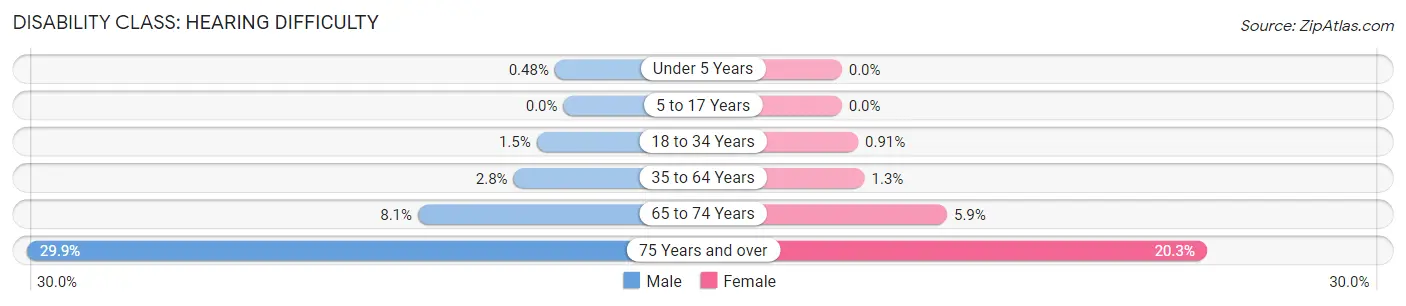
| Age Bracket | Male | Female |
| Under 5 Years | 9 (0.5%) | 0 (0.0%) |
| 5 to 17 Years | 0 (0.0%) | 0 (0.0%) |
| 18 to 34 Years | 58 (1.5%) | 34 (0.9%) |
| 35 to 64 Years | 220 (2.8%) | 108 (1.3%) |
| 65 to 74 Years | 163 (8.1%) | 140 (5.9%) |
| 75 Years and over | 408 (29.9%) | 329 (20.3%) |
Disability Class: Vision Difficulty
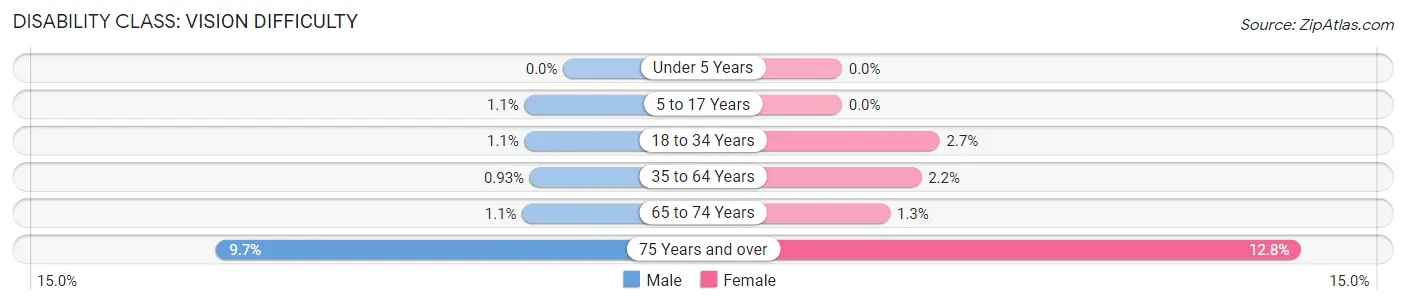
| Age Bracket | Male | Female |
| Under 5 Years | 0 (0.0%) | 0 (0.0%) |
| 5 to 17 Years | 39 (1.1%) | 0 (0.0%) |
| 18 to 34 Years | 42 (1.1%) | 102 (2.7%) |
| 35 to 64 Years | 74 (0.9%) | 188 (2.2%) |
| 65 to 74 Years | 23 (1.1%) | 32 (1.3%) |
| 75 Years and over | 132 (9.7%) | 207 (12.8%) |
Disability Class: Cognitive Difficulty
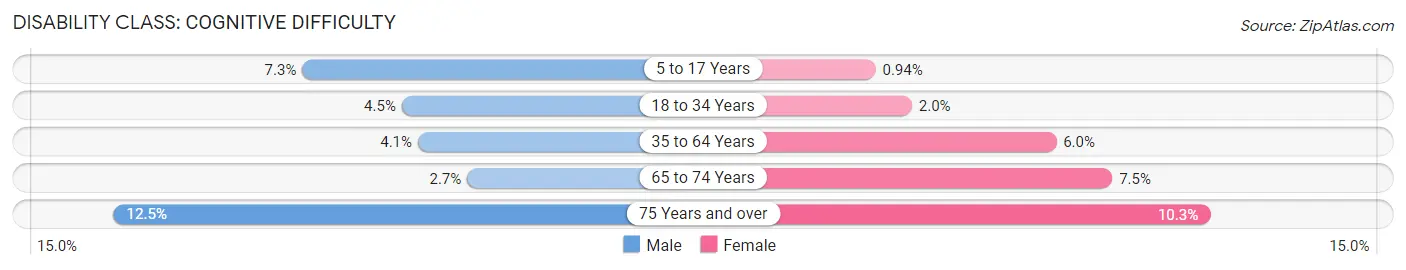
| Age Bracket | Male | Female |
| 5 to 17 Years | 263 (7.3%) | 29 (0.9%) |
| 18 to 34 Years | 175 (4.5%) | 73 (1.9%) |
| 35 to 64 Years | 321 (4.1%) | 508 (6.0%) |
| 65 to 74 Years | 54 (2.7%) | 180 (7.5%) |
| 75 Years and over | 171 (12.5%) | 166 (10.2%) |
Disability Class: Ambulatory Difficulty
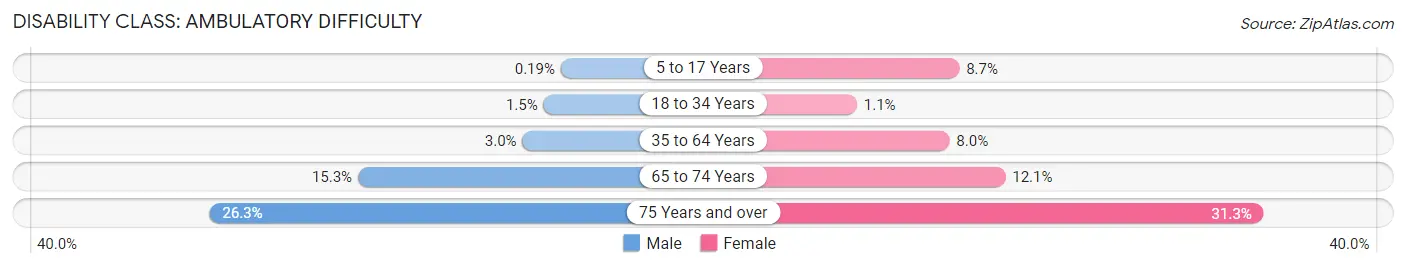
| Age Bracket | Male | Female |
| 5 to 17 Years | 7 (0.2%) | 268 (8.7%) |
| 18 to 34 Years | 57 (1.5%) | 42 (1.1%) |
| 35 to 64 Years | 241 (3.0%) | 680 (8.0%) |
| 65 to 74 Years | 307 (15.2%) | 290 (12.1%) |
| 75 Years and over | 359 (26.3%) | 507 (31.3%) |
Disability Class: Self-Care Difficulty
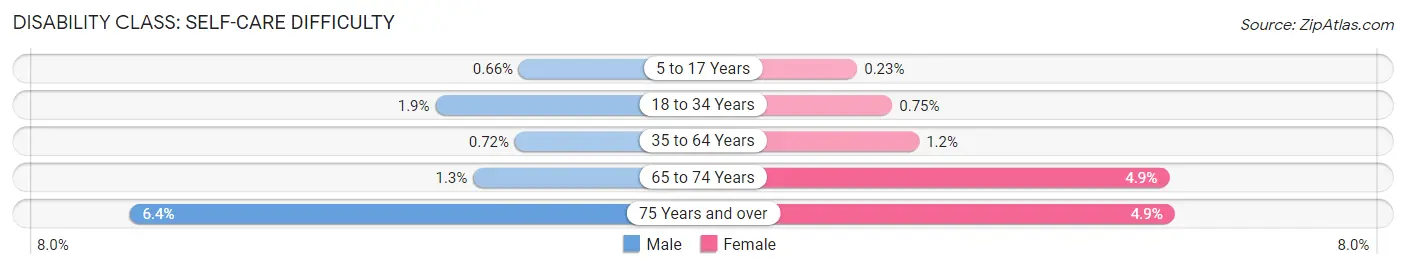
| Age Bracket | Male | Female |
| 5 to 17 Years | 24 (0.7%) | 7 (0.2%) |
| 18 to 34 Years | 74 (1.9%) | 28 (0.7%) |
| 35 to 64 Years | 57 (0.7%) | 98 (1.1%) |
| 65 to 74 Years | 27 (1.3%) | 116 (4.9%) |
| 75 Years and over | 88 (6.4%) | 80 (4.9%) |
Technology Access in Grove City
Computing Device Access in Grove City
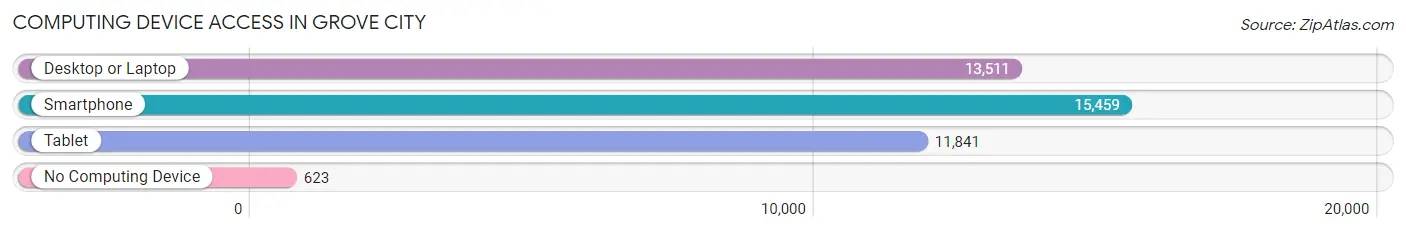
| Device Type | # Households | % Households |
| Desktop or Laptop | 13,511 | 80.0% |
| Smartphone | 15,459 | 91.5% |
| Tablet | 11,841 | 70.1% |
| No Computing Device | 623 | 3.7% |
| Total | 16,897 | 100.0% |
Internet Access in Grove City
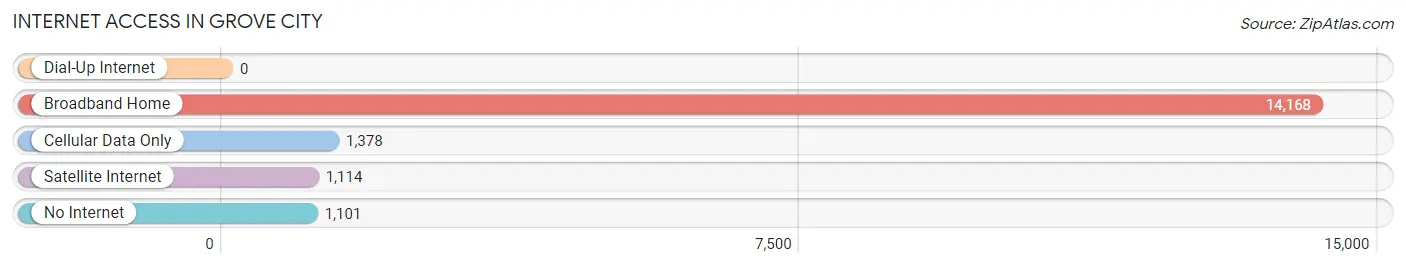
| Internet Type | # Households | % Households |
| Dial-Up Internet | 0 | 0.0% |
| Broadband Home | 14,168 | 83.9% |
| Cellular Data Only | 1,378 | 8.2% |
| Satellite Internet | 1,114 | 6.6% |
| No Internet | 1,101 | 6.5% |
| Total | 16,897 | 100.0% |
Grove City Summary
Grove City, Ohio is a city located in Franklin County, Ohio, United States. It is a suburb of Columbus, the state capital and largest city in Ohio. As of the 2010 census, the city had a population of 35,575.
History
The area that is now Grove City was first settled in 1803 by William Foster, who built a log cabin near the intersection of what is now Broadway and Park Street. The area was known as Foster’s Crossing until 1839, when it was renamed Grove City after the grove of trees that surrounded the area.
In 1852, Grove City was incorporated as a village. The village was home to a variety of businesses, including a sawmill, a gristmill, a blacksmith shop, and a general store. The village also had a post office, a school, and a church.
In the late 19th century, Grove City began to grow rapidly. The population increased from just over 500 in 1880 to over 1,000 in 1900. The village was also home to a variety of industries, including a brickyard, a canning factory, and a furniture factory.
In the early 20th century, Grove City continued to grow. The population increased from 1,000 in 1900 to over 5,000 in 1930. The village was also home to a variety of businesses, including a bank, a movie theater, and a variety of stores.
In 1961, Grove City was incorporated as a city. The city continued to grow throughout the 1960s and 1970s, and by the 1980s, the population had grown to over 20,000.
Geography
Grove City is located in Franklin County, Ohio, approximately 10 miles southwest of Columbus. The city has a total area of 11.2 square miles, of which 11.1 square miles is land and 0.1 square miles is water.
The city is located in the Central Lowland region of the United States, and is part of the Appalachian Plateau physiographic region. The city is located on the western edge of the Allegheny Plateau, and is characterized by rolling hills and valleys.
The city is located in the Scioto River watershed, and is home to several creeks and streams, including Big Run, Little Run, and Walnut Creek.
Economy
Grove City’s economy is largely based on retail and services. The city is home to a variety of retail stores, restaurants, and other businesses. The city is also home to a variety of manufacturing companies, including a plastics manufacturer, a metal fabricator, and a food processor.
The city is also home to a variety of healthcare providers, including a hospital, a nursing home, and a variety of medical offices.
Demographics
As of the 2010 census, the city had a population of 35,575. The racial makeup of the city was 87.3% White, 8.2% African American, 0.4% Native American, 1.2% Asian, 0.1% Pacific Islander, 0.7% from other races, and 2.1% from two or more races. Hispanic or Latino of any race were 2.3% of the population.
The median household income in the city was $50,945, and the median family income was $60,945. The per capita income in the city was $25,945. About 6.3% of families and 8.2% of the population were below the poverty line, including 11.2% of those under age 18 and 6.2% of those age 65 or over.
Common Questions
What is Per Capita Income in Grove City?
Per Capita income in Grove City is $45,126.
What is the Median Family Income in Grove City?
Median Family Income in Grove City is $111,439.
What is the Median Household income in Grove City?
Median Household Income in Grove City is $84,765.
What is Income or Wage Gap in Grove City?
Income or Wage Gap in Grove City is 21.0%.
Women in Grove City earn 79.0 cents for every dollar earned by a man.
What is Inequality or Gini Index in Grove City?
Inequality or Gini Index in Grove City is 0.41.
What is the Total Population of Grove City?
Total Population of Grove City is 41,423.
What is the Total Male Population of Grove City?
Total Male Population of Grove City is 20,821.
What is the Total Female Population of Grove City?
Total Female Population of Grove City is 20,602.
What is the Ratio of Males per 100 Females in Grove City?
There are 101.06 Males per 100 Females in Grove City.
What is the Ratio of Females per 100 Males in Grove City?
There are 98.95 Females per 100 Males in Grove City.
What is the Median Population Age in Grove City?
Median Population Age in Grove City is 40.6 Years.
What is the Average Family Size in Grove City
Average Family Size in Grove City is 2.9 People.
What is the Average Household Size in Grove City
Average Household Size in Grove City is 2.4 People.
How Large is the Labor Force in Grove City?
There are 22,871 People in the Labor Forcein in Grove City.
What is the Percentage of People in the Labor Force in Grove City?
69.4% of People are in the Labor Force in Grove City.
What is the Unemployment Rate in Grove City?
Unemployment Rate in Grove City is 2.4%.