Zip Codes with the Highest Percentage of Hawaiian / Pacific Population in Bronx, NY
RELATED REPORTS & OPTIONS
Hawaiian / Pacific
Bronx
Compare Zip Codes
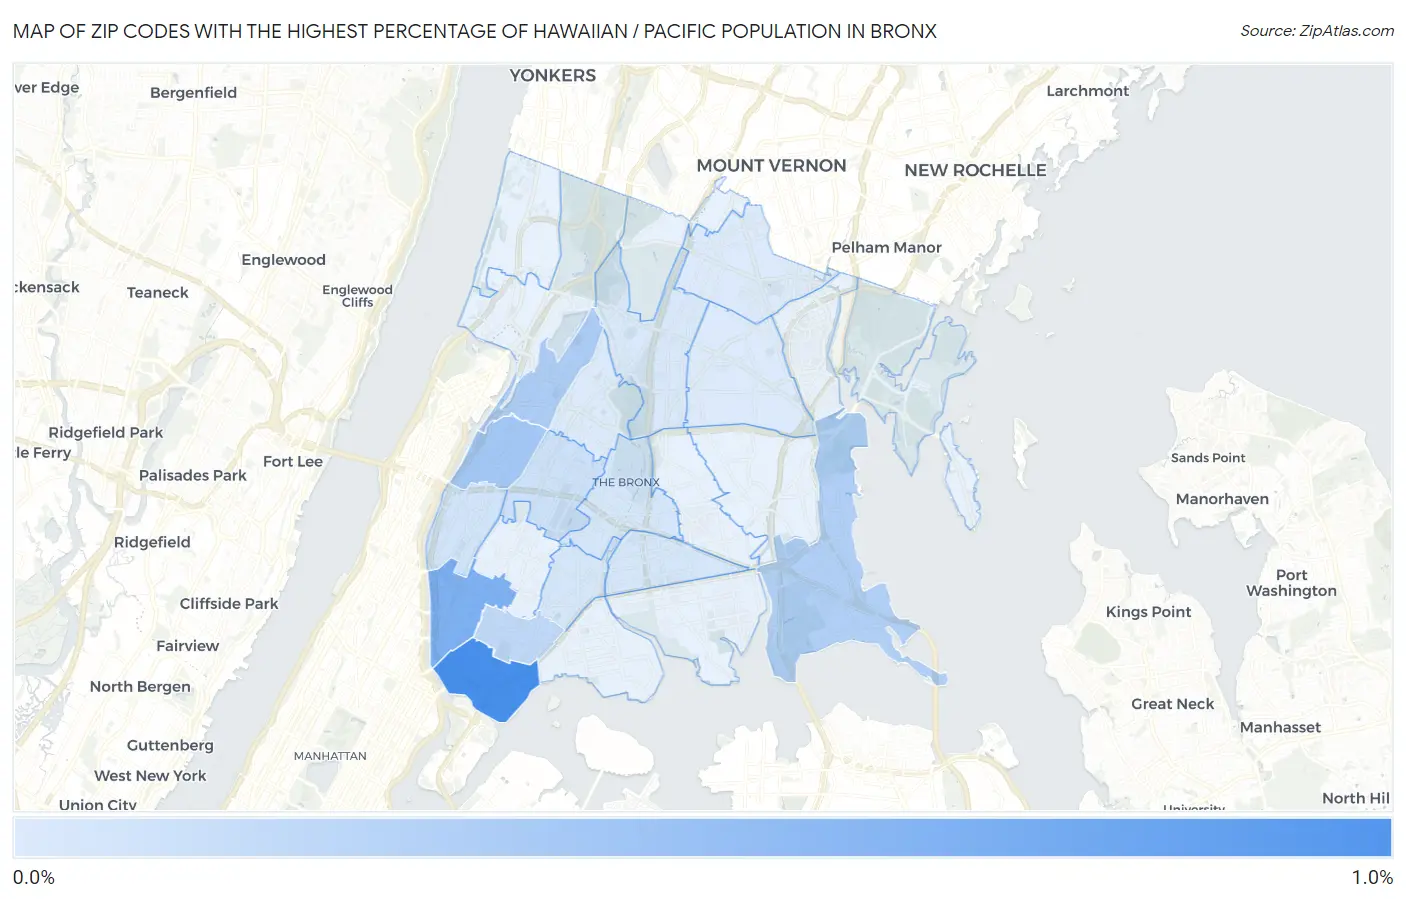
Map of Zip Codes with the Highest Percentage of Hawaiian / Pacific Population in Bronx
0.012%
0.91%
Zip Codes with the Highest Percentage of Hawaiian / Pacific Population in Bronx, NY
| Zip Code | Hawaiian / Pacific | vs State | vs National | |
| 1. | 10454 | 0.91% | 0.046%(+0.865)#14 | 0.19%(+0.722)#795 |
| 2. | 10451 | 0.57% | 0.046%(+0.525)#19 | 0.19%(+0.382)#1,266 |
| 3. | 10453 | 0.35% | 0.046%(+0.309)#36 | 0.19%(+0.166)#1,882 |
| 4. | 10468 | 0.31% | 0.046%(+0.260)#41 | 0.19%(+0.117)#2,089 |
| 5. | 10465 | 0.27% | 0.046%(+0.226)#49 | 0.19%(+0.083)#2,291 |
| 6. | 10455 | 0.20% | 0.046%(+0.150)#62 | 0.19%(+0.007)#2,843 |
| 7. | 10457 | 0.11% | 0.046%(+0.061)#103 | 0.19%(-0.082)#3,917 |
| 8. | 10452 | 0.081% | 0.046%(+0.036)#127 | 0.19%(-0.107)#4,393 |
| 9. | 10472 | 0.060% | 0.046%(+0.014)#157 | 0.19%(-0.129)#4,867 |
| 10. | 10459 | 0.054% | 0.046%(+0.008)#164 | 0.19%(-0.135)#4,990 |
| 11. | 10460 | 0.047% | 0.046%(+0.001)#176 | 0.19%(-0.142)#5,161 |
| 12. | 10467 | 0.038% | 0.046%(-0.007)#187 | 0.19%(-0.150)#5,393 |
| 13. | 10469 | 0.014% | 0.046%(-0.032)#236 | 0.19%(-0.175)#6,164 |
| 14. | 10466 | 0.014% | 0.046%(-0.032)#237 | 0.19%(-0.175)#6,168 |
| 15. | 10458 | 0.012% | 0.046%(-0.034)#241 | 0.19%(-0.177)#6,224 |
1
Common Questions
What are the Top 10 Zip Codes with the Highest Percentage of Hawaiian / Pacific Population in Bronx, NY?
Top 10 Zip Codes with the Highest Percentage of Hawaiian / Pacific Population in Bronx, NY are:
What zip code has the Highest Percentage of Hawaiian / Pacific Population in Bronx, NY?
10454 has the Highest Percentage of Hawaiian / Pacific Population in Bronx, NY with 0.91%.
What is the Percentage of Hawaiian / Pacific Population in New York?
Percentage of Hawaiian / Pacific Population in New York is 0.046%.
What is the Percentage of Hawaiian / Pacific Population in the United States?
Percentage of Hawaiian / Pacific Population in the United States is 0.19%.