Brockport, NY Map & Demographics
Brockport Map
Brockport Overview
$23,044
PER CAPITA INCOME
$83,218
AVG FAMILY INCOME
$46,468
AVG HOUSEHOLD INCOME
10.9%
WAGE / INCOME GAP [ % ]
89.1¢/ $1
WAGE / INCOME GAP [ $ ]
0.48
INEQUALITY / GINI INDEX
7,192
TOTAL POPULATION
3,192
MALE POPULATION
4,000
FEMALE POPULATION
79.80
MALES / 100 FEMALES
125.31
FEMALES / 100 MALES
22.8
MEDIAN AGE
2.8
AVG FAMILY SIZE
2.2
AVG HOUSEHOLD SIZE
4,076
LABOR FORCE [ PEOPLE ]
60.4%
PERCENT IN LABOR FORCE
5.2%
UNEMPLOYMENT RATE
Brockport Zip Codes
Brockport Area Codes
Income in Brockport
Income Overview in Brockport
Per Capita Income in Brockport is $23,044, while median incomes of families and households are $83,218 and $46,468 respectively.
| Characteristic | Number | Measure |
| Per Capita Income | 7,192 | $23,044 |
| Median Family Income | 955 | $83,218 |
| Mean Family Income | 955 | $91,261 |
| Median Household Income | 2,144 | $46,468 |
| Mean Household Income | 2,144 | $66,503 |
| Income Deficit | 955 | $0 |
| Wage / Income Gap (%) | 7,192 | 10.90% |
| Wage / Income Gap ($) | 7,192 | 89.10¢ per $1 |
| Gini / Inequality Index | 7,192 | 0.48 |
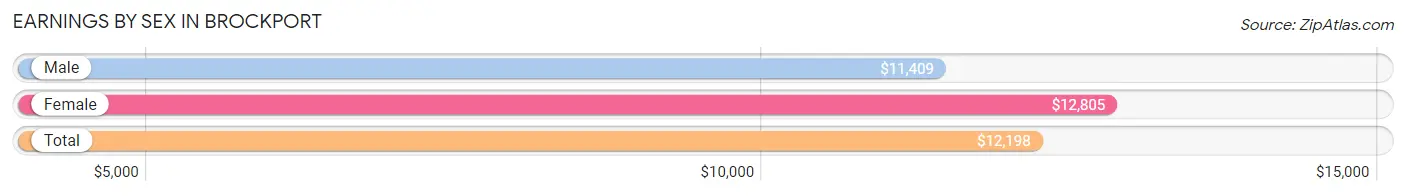
Earnings by Sex in Brockport
Average Earnings in Brockport are $12,198, $11,409 for men and $12,805 for women, a difference of 10.9%.
| Sex | Number | Average Earnings |
| Male | 2,098 (42.0%) | $11,409 |
| Female | 2,894 (58.0%) | $12,805 |
| Total | 4,992 (100.0%) | $12,198 |
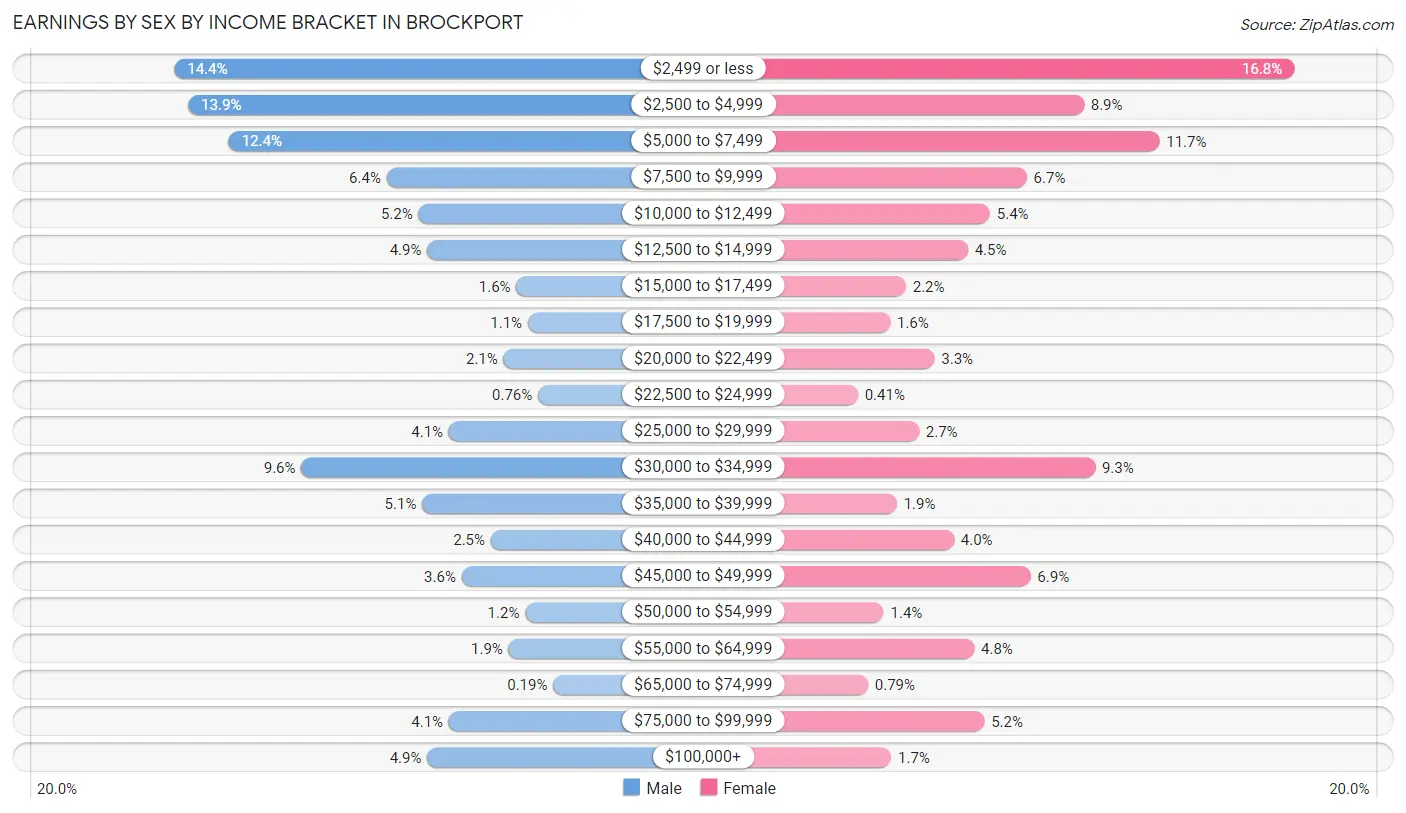
Earnings by Sex by Income Bracket in Brockport
The most common earnings brackets in Brockport are $2,499 or less for men (302 | 14.4%) and $2,499 or less for women (485 | 16.8%).
| Income | Male | Female |
| $2,499 or less | 302 (14.4%) | 485 (16.8%) |
| $2,500 to $4,999 | 291 (13.9%) | 257 (8.9%) |
| $5,000 to $7,499 | 259 (12.3%) | 339 (11.7%) |
| $7,500 to $9,999 | 135 (6.4%) | 195 (6.7%) |
| $10,000 to $12,499 | 110 (5.2%) | 155 (5.4%) |
| $12,500 to $14,999 | 103 (4.9%) | 131 (4.5%) |
| $15,000 to $17,499 | 33 (1.6%) | 64 (2.2%) |
| $17,500 to $19,999 | 24 (1.1%) | 47 (1.6%) |
| $20,000 to $22,499 | 43 (2.1%) | 95 (3.3%) |
| $22,500 to $24,999 | 16 (0.8%) | 12 (0.4%) |
| $25,000 to $29,999 | 86 (4.1%) | 78 (2.7%) |
| $30,000 to $34,999 | 202 (9.6%) | 269 (9.3%) |
| $35,000 to $39,999 | 107 (5.1%) | 54 (1.9%) |
| $40,000 to $44,999 | 53 (2.5%) | 116 (4.0%) |
| $45,000 to $49,999 | 76 (3.6%) | 199 (6.9%) |
| $50,000 to $54,999 | 26 (1.2%) | 40 (1.4%) |
| $55,000 to $64,999 | 39 (1.9%) | 138 (4.8%) |
| $65,000 to $74,999 | 4 (0.2%) | 23 (0.8%) |
| $75,000 to $99,999 | 86 (4.1%) | 149 (5.1%) |
| $100,000+ | 103 (4.9%) | 48 (1.7%) |
| Total | 2,098 (100.0%) | 2,894 (100.0%) |
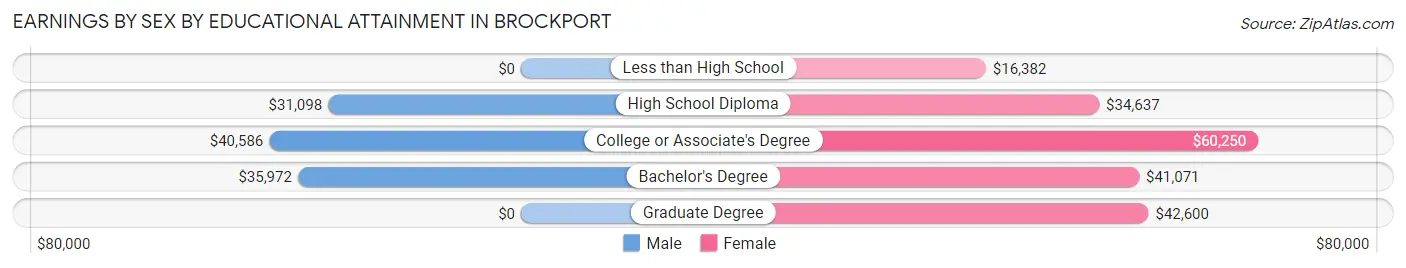
Earnings by Sex by Educational Attainment in Brockport
Average earnings in Brockport are $32,099 for men and $41,071 for women, a difference of 21.8%. Men with an educational attainment of college or associate's degree enjoy the highest average annual earnings of $40,586, while those with high school diploma education earn the least with $31,098. Women with an educational attainment of college or associate's degree earn the most with the average annual earnings of $60,250, while those with less than high school education have the smallest earnings of $16,382.
| Educational Attainment | Male Income | Female Income |
| Less than High School | - | - |
| High School Diploma | $31,098 | $34,637 |
| College or Associate's Degree | $40,586 | $60,250 |
| Bachelor's Degree | $35,972 | $41,071 |
| Graduate Degree | - | - |
| Total | $32,099 | $41,071 |
Family Income in Brockport
Family Income Brackets in Brockport
According to the Brockport family income data, there are 259 families falling into the $100,000 to $149,999 income range, which is the most common income bracket and makes up 27.1% of all families. Conversely, the $25,000 to $34,999 income bracket is the least frequent group with only 3 families (0.3%) belonging to this category.
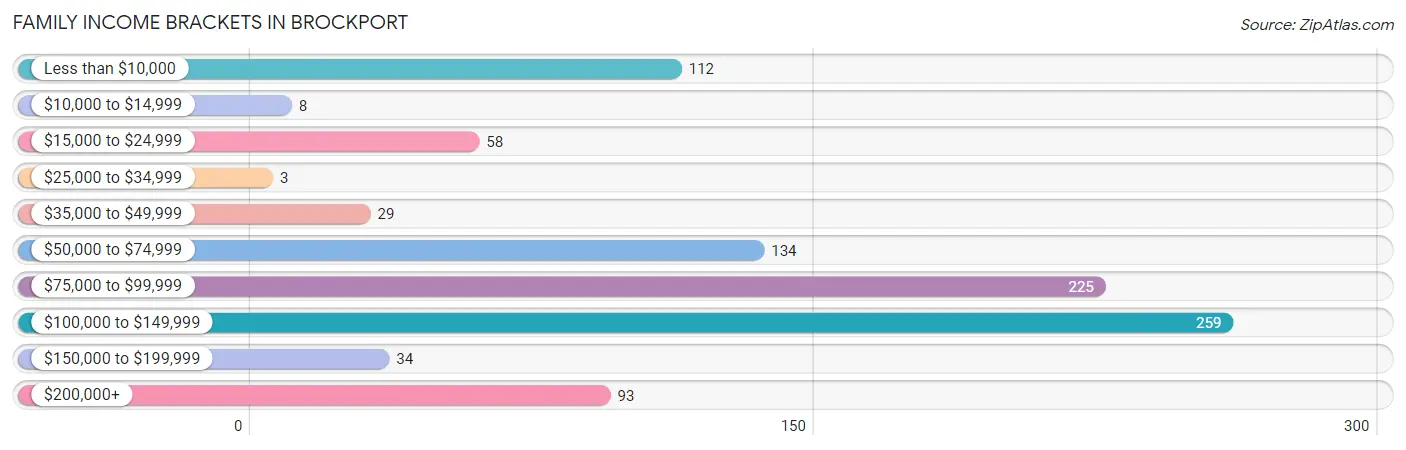
| Income Bracket | # Families | % Families |
| Less than $10,000 | 112 | 11.7% |
| $10,000 to $14,999 | 8 | 0.8% |
| $15,000 to $24,999 | 58 | 6.1% |
| $25,000 to $34,999 | 3 | 0.3% |
| $35,000 to $49,999 | 29 | 3.0% |
| $50,000 to $74,999 | 134 | 14.0% |
| $75,000 to $99,999 | 225 | 23.6% |
| $100,000 to $149,999 | 259 | 27.1% |
| $150,000 to $199,999 | 34 | 3.6% |
| $200,000+ | 93 | 9.7% |
Family Income by Famaliy Size in Brockport
3-person families (147 | 15.4%) account for the highest median family income in Brockport with $102,872 per family, while 2-person families (592 | 62.0%) have the highest median income of $40,666 per family member.
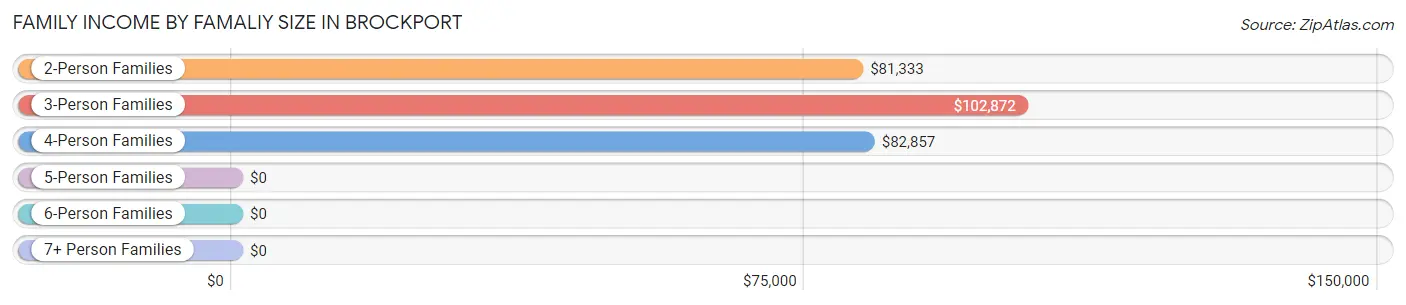
| Income Bracket | # Families | Median Income |
| 2-Person Families | 592 (62.0%) | $81,333 |
| 3-Person Families | 147 (15.4%) | $102,872 |
| 4-Person Families | 138 (14.4%) | $82,857 |
| 5-Person Families | 22 (2.3%) | $0 |
| 6-Person Families | 0 (0.0%) | $0 |
| 7+ Person Families | 56 (5.9%) | $0 |
| Total | 955 (100.0%) | $83,218 |
Family Income by Number of Earners in Brockport
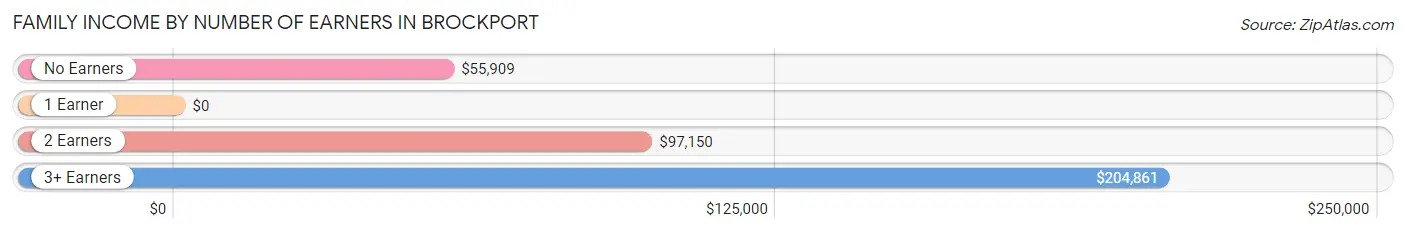
| Number of Earners | # Families | Median Income |
| No Earners | 144 (15.1%) | $55,909 |
| 1 Earner | 241 (25.2%) | $0 |
| 2 Earners | 457 (47.8%) | $97,150 |
| 3+ Earners | 113 (11.8%) | $204,861 |
| Total | 955 (100.0%) | $83,218 |
Household Income in Brockport
Household Income Brackets in Brockport
With 405 households falling in the category, the $100,000 to $149,999 income range is the most frequent in Brockport, accounting for 18.9% of all households. In contrast, only 45 households (2.1%) fall into the $150,000 to $199,999 income bracket, making it the least populous group.
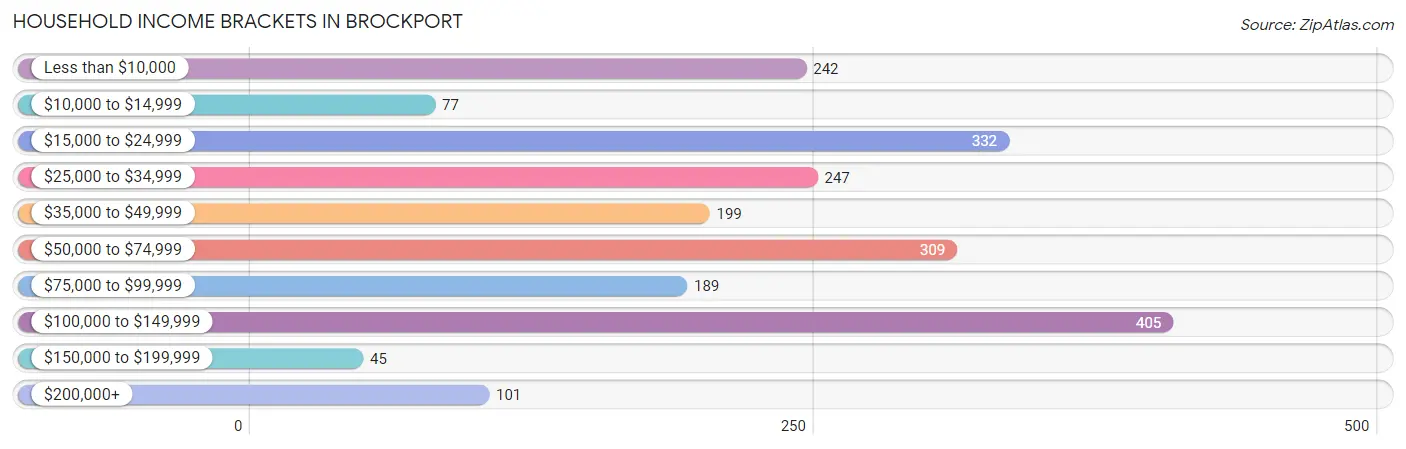
| Income Bracket | # Households | % Households |
| Less than $10,000 | 242 | 11.3% |
| $10,000 to $14,999 | 77 | 3.6% |
| $15,000 to $24,999 | 332 | 15.5% |
| $25,000 to $34,999 | 247 | 11.5% |
| $35,000 to $49,999 | 199 | 9.3% |
| $50,000 to $74,999 | 309 | 14.4% |
| $75,000 to $99,999 | 189 | 8.8% |
| $100,000 to $149,999 | 405 | 18.9% |
| $150,000 to $199,999 | 45 | 2.1% |
| $200,000+ | 101 | 4.7% |
Household Income by Householder Age in Brockport
The median household income in Brockport is $46,468, with the highest median household income of $82,039 found in the 45 to 64 years age bracket for the primary householder. A total of 839 households (39.1%) fall into this category. Meanwhile, the 15 to 24 years age bracket for the primary householder has the lowest median household income of $22,634, with 501 households (23.4%) in this group.
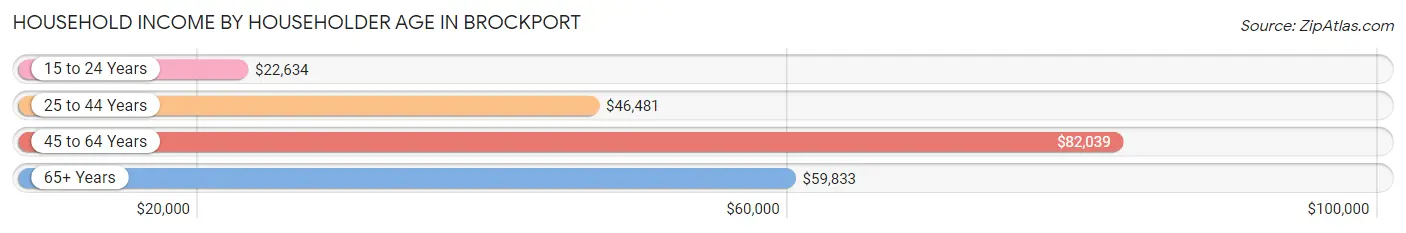
| Income Bracket | # Households | Median Income |
| 15 to 24 Years | 501 (23.4%) | $22,634 |
| 25 to 44 Years | 402 (18.8%) | $46,481 |
| 45 to 64 Years | 839 (39.1%) | $82,039 |
| 65+ Years | 402 (18.8%) | $59,833 |
| Total | 2,144 (100.0%) | $46,468 |
Poverty in Brockport
Income Below Poverty by Sex and Age in Brockport
With 25.2% poverty level for males and 21.6% for females among the residents of Brockport, 18 to 24 year old males and 18 to 24 year old females are the most vulnerable to poverty, with 355 males (57.1%) and 294 females (44.5%) in their respective age groups living below the poverty level.
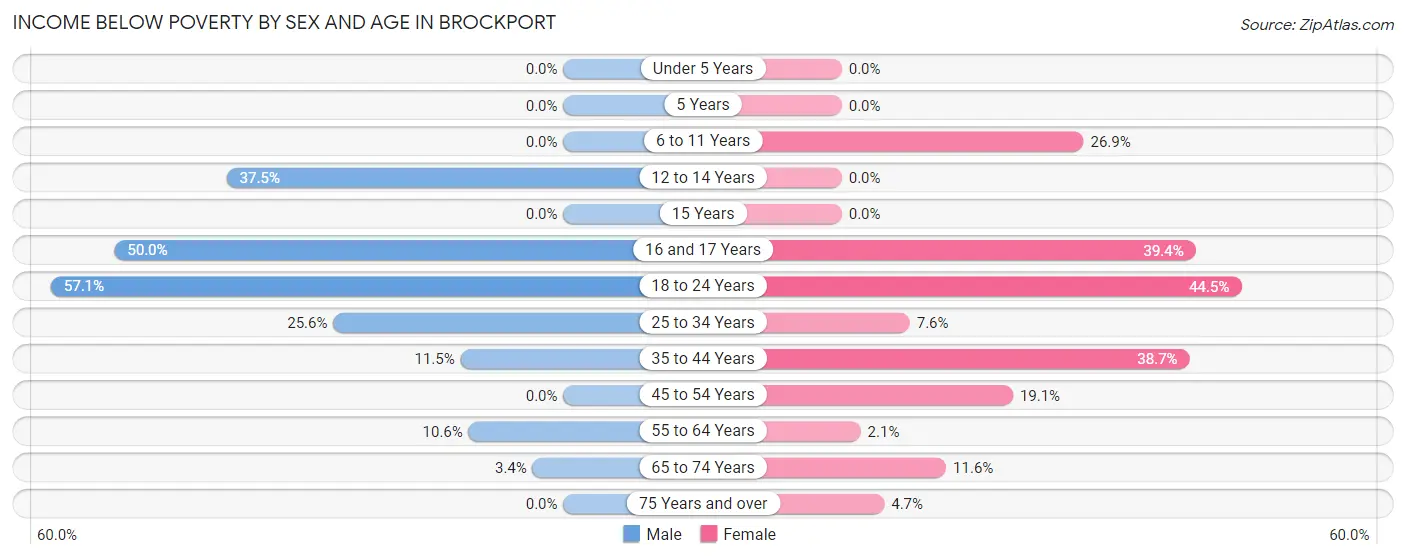
| Age Bracket | Male | Female |
| Under 5 Years | 0 (0.0%) | 0 (0.0%) |
| 5 Years | 0 (0.0%) | 0 (0.0%) |
| 6 to 11 Years | 0 (0.0%) | 35 (26.9%) |
| 12 to 14 Years | 24 (37.5%) | 0 (0.0%) |
| 15 Years | 0 (0.0%) | 0 (0.0%) |
| 16 and 17 Years | 13 (50.0%) | 13 (39.4%) |
| 18 to 24 Years | 355 (57.1%) | 294 (44.5%) |
| 25 to 34 Years | 103 (25.6%) | 23 (7.6%) |
| 35 to 44 Years | 15 (11.5%) | 72 (38.7%) |
| 45 to 54 Years | 0 (0.0%) | 85 (19.1%) |
| 55 to 64 Years | 21 (10.5%) | 9 (2.1%) |
| 65 to 74 Years | 5 (3.4%) | 23 (11.6%) |
| 75 Years and over | 0 (0.0%) | 7 (4.7%) |
| Total | 536 (25.2%) | 561 (21.6%) |
Income Above Poverty by Sex and Age in Brockport
According to the poverty statistics in Brockport, males aged under 5 years and females aged under 5 years are the age groups that are most secure financially, with 100.0% of males and 100.0% of females in these age groups living above the poverty line.
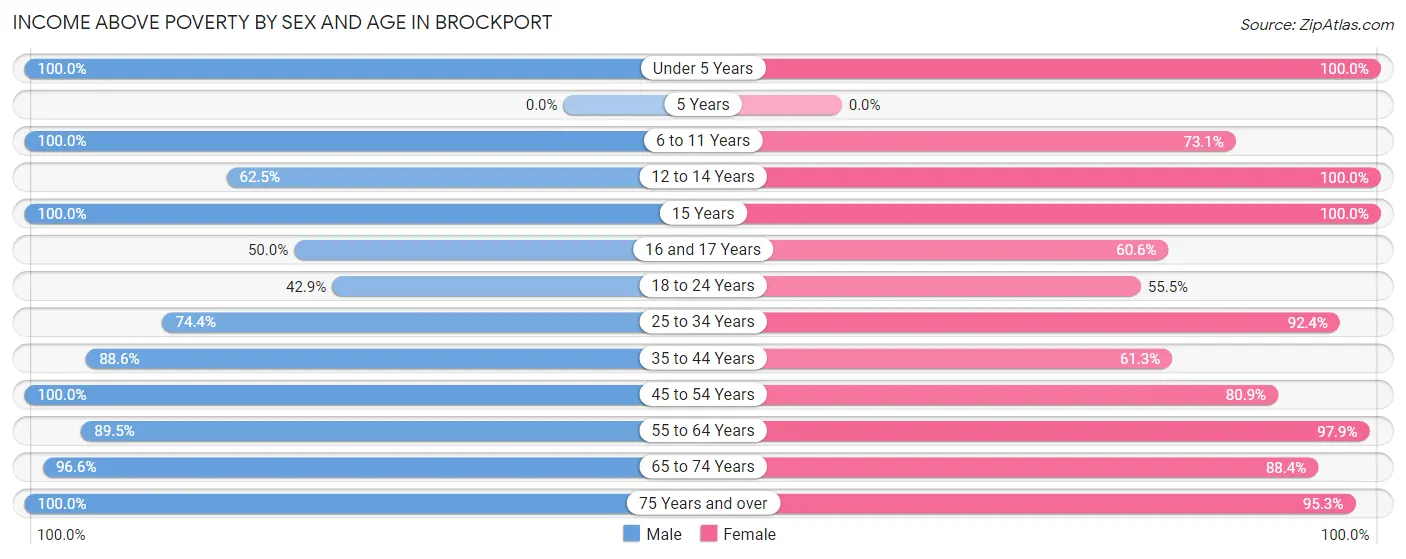
| Age Bracket | Male | Female |
| Under 5 Years | 62 (100.0%) | 38 (100.0%) |
| 5 Years | 0 (0.0%) | 0 (0.0%) |
| 6 to 11 Years | 24 (100.0%) | 95 (73.1%) |
| 12 to 14 Years | 40 (62.5%) | 11 (100.0%) |
| 15 Years | 79 (100.0%) | 13 (100.0%) |
| 16 and 17 Years | 13 (50.0%) | 20 (60.6%) |
| 18 to 24 Years | 267 (42.9%) | 367 (55.5%) |
| 25 to 34 Years | 299 (74.4%) | 281 (92.4%) |
| 35 to 44 Years | 116 (88.5%) | 114 (61.3%) |
| 45 to 54 Years | 250 (100.0%) | 361 (80.9%) |
| 55 to 64 Years | 178 (89.4%) | 419 (97.9%) |
| 65 to 74 Years | 141 (96.6%) | 175 (88.4%) |
| 75 Years and over | 119 (100.0%) | 141 (95.3%) |
| Total | 1,588 (74.8%) | 2,035 (78.4%) |
Income Below Poverty Among Married-Couple Families in Brockport
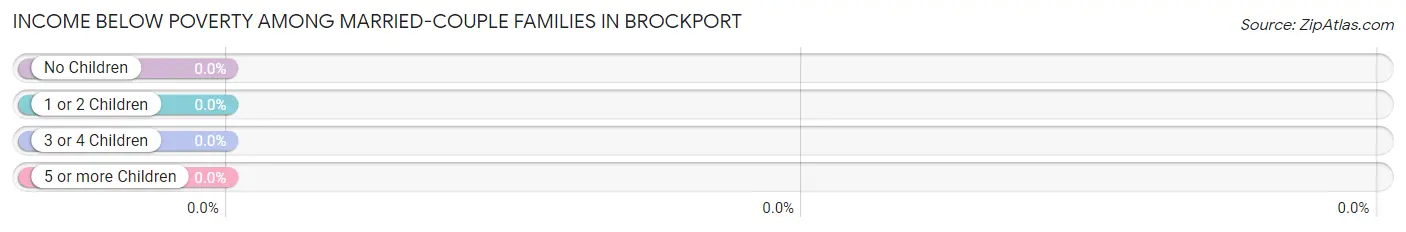
| Children | Above Poverty | Below Poverty |
| No Children | 340 (100.0%) | 0 (0.0%) |
| 1 or 2 Children | 165 (100.0%) | 0 (0.0%) |
| 3 or 4 Children | 10 (100.0%) | 0 (0.0%) |
| 5 or more Children | 0 (0.0%) | 0 (0.0%) |
| Total | 515 (100.0%) | 0 (0.0%) |
Income Below Poverty Among Single-Parent Households in Brockport
According to the poverty data in Brockport, 68.5% or 74 single-father households and 18.1% or 60 single-mother households are living below the poverty line. Among single-father households, those with no children have the highest poverty rate, with 74 households (89.2%) experiencing poverty. Likewise, among single-mother households, those with 1 or 2 children have the highest poverty rate, with 46 households (80.7%) falling below the poverty line.
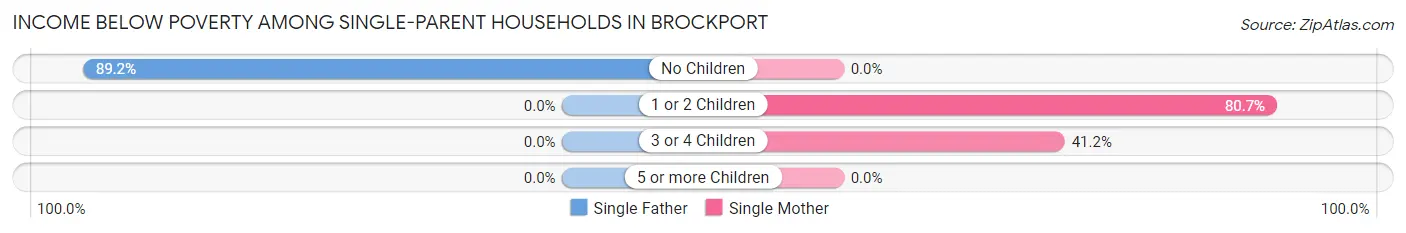
| Children | Single Father | Single Mother |
| No Children | 74 (89.2%) | 0 (0.0%) |
| 1 or 2 Children | 0 (0.0%) | 46 (80.7%) |
| 3 or 4 Children | 0 (0.0%) | 14 (41.2%) |
| 5 or more Children | 0 (0.0%) | 0 (0.0%) |
| Total | 74 (68.5%) | 60 (18.1%) |
Income Below Poverty Among Married-Couple vs Single-Parent Households in Brockport
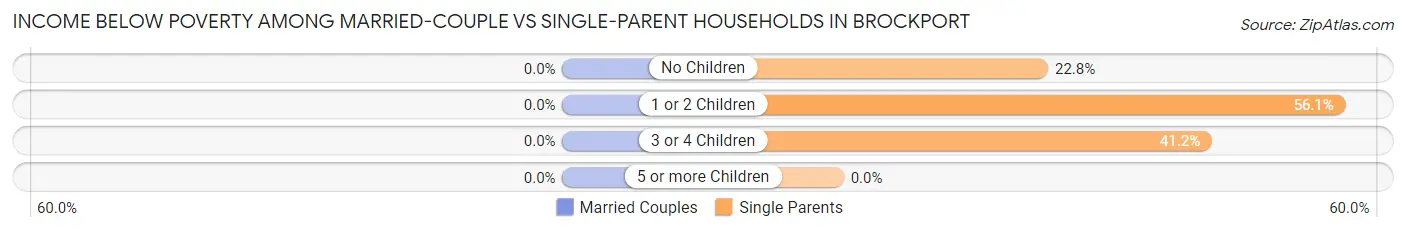
| Children | Married-Couple Families | Single-Parent Households |
| No Children | 0 (0.0%) | 74 (22.8%) |
| 1 or 2 Children | 0 (0.0%) | 46 (56.1%) |
| 3 or 4 Children | 0 (0.0%) | 14 (41.2%) |
| 5 or more Children | 0 (0.0%) | 0 (0.0%) |
| Total | 0 (0.0%) | 134 (30.4%) |
Race in Brockport
The most populous races in Brockport are White / Caucasian (6,009 | 83.6%), Black / African American (650 | 9.0%), and Hispanic or Latino (447 | 6.2%).
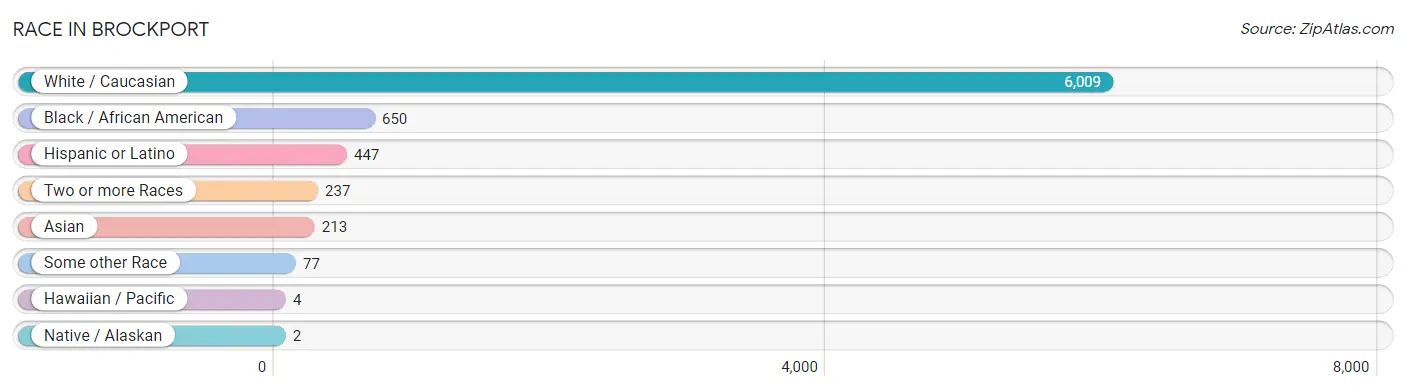
| Race | # Population | % Population |
| Asian | 213 | 3.0% |
| Black / African American | 650 | 9.0% |
| Hawaiian / Pacific | 4 | 0.1% |
| Hispanic or Latino | 447 | 6.2% |
| Native / Alaskan | 2 | 0.0% |
| White / Caucasian | 6,009 | 83.6% |
| Two or more Races | 237 | 3.3% |
| Some other Race | 77 | 1.1% |
| Total | 7,192 | 100.0% |
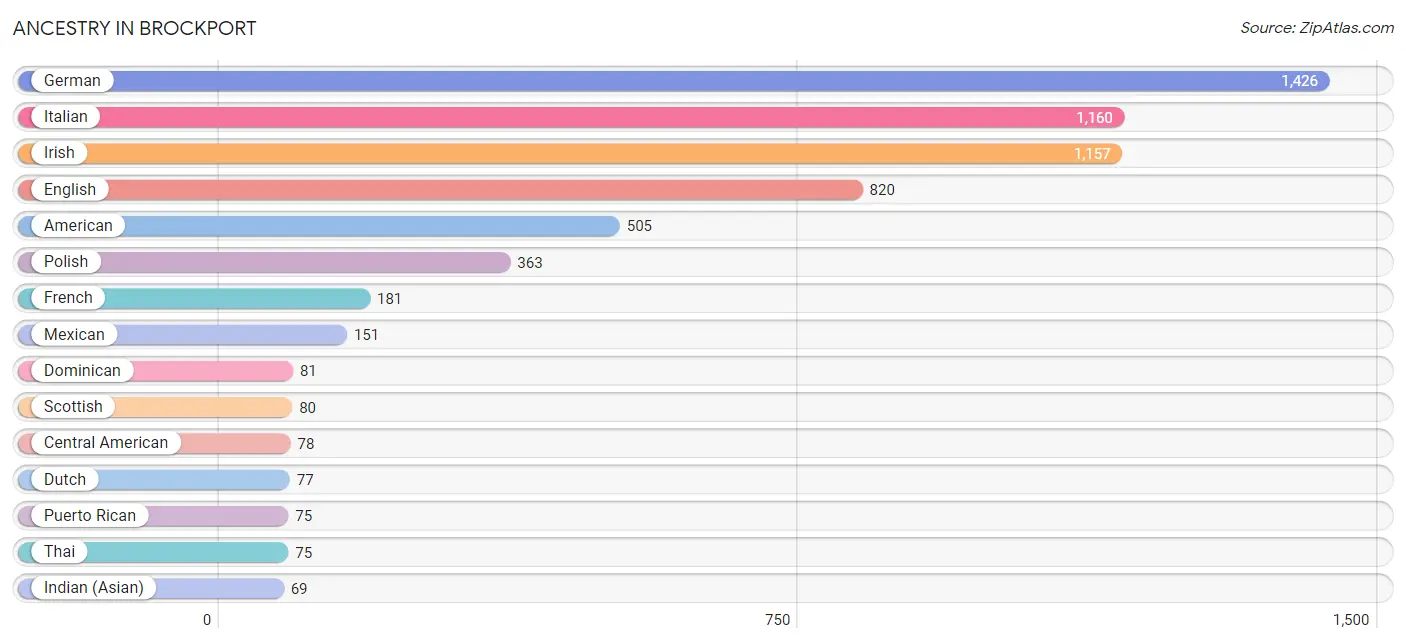
Ancestry in Brockport
The most populous ancestries reported in Brockport are German (1,426 | 19.8%), Italian (1,160 | 16.1%), Irish (1,157 | 16.1%), English (820 | 11.4%), and American (505 | 7.0%), together accounting for 70.5% of all Brockport residents.
| Ancestry | # Population | % Population |
| American | 505 | 7.0% |
| Arab | 24 | 0.3% |
| Armenian | 27 | 0.4% |
| Austrian | 17 | 0.2% |
| Bhutanese | 41 | 0.6% |
| British | 11 | 0.2% |
| Burmese | 31 | 0.4% |
| Cajun | 13 | 0.2% |
| Canadian | 6 | 0.1% |
| Central American | 78 | 1.1% |
| Cherokee | 5 | 0.1% |
| Cuban | 10 | 0.1% |
| Czech | 10 | 0.1% |
| Dominican | 81 | 1.1% |
| Dutch | 77 | 1.1% |
| Eastern European | 9 | 0.1% |
| English | 820 | 11.4% |
| European | 47 | 0.6% |
| Filipino | 9 | 0.1% |
| Finnish | 21 | 0.3% |
| French | 181 | 2.5% |
| French Canadian | 44 | 0.6% |
| German | 1,426 | 19.8% |
| Ghanaian | 5 | 0.1% |
| Greek | 17 | 0.2% |
| Guatemalan | 60 | 0.8% |
| Guyanese | 6 | 0.1% |
| Haitian | 56 | 0.8% |
| Honduran | 14 | 0.2% |
| Hungarian | 22 | 0.3% |
| Indian (Asian) | 69 | 1.0% |
| Indonesian | 2 | 0.0% |
| Irish | 1,157 | 16.1% |
| Italian | 1,160 | 16.1% |
| Jamaican | 10 | 0.1% |
| Korean | 21 | 0.3% |
| Latvian | 4 | 0.1% |
| Lebanese | 19 | 0.3% |
| Lithuanian | 27 | 0.4% |
| Mexican | 151 | 2.1% |
| Native Hawaiian | 11 | 0.2% |
| Nigerian | 12 | 0.2% |
| Northern European | 8 | 0.1% |
| Norwegian | 4 | 0.1% |
| Pennsylvania German | 6 | 0.1% |
| Peruvian | 9 | 0.1% |
| Polish | 363 | 5.1% |
| Portuguese | 18 | 0.3% |
| Puerto Rican | 75 | 1.0% |
| Romanian | 9 | 0.1% |
| Russian | 33 | 0.5% |
| Salvadoran | 4 | 0.1% |
| Scotch-Irish | 32 | 0.4% |
| Scottish | 80 | 1.1% |
| Slovak | 45 | 0.6% |
| South American | 9 | 0.1% |
| Spanish | 6 | 0.1% |
| Sri Lankan | 6 | 0.1% |
| Subsaharan African | 25 | 0.4% |
| Swedish | 67 | 0.9% |
| Thai | 75 | 1.0% |
| Trinidadian and Tobagonian | 4 | 0.1% |
| Ukrainian | 50 | 0.7% |
| Welsh | 32 | 0.4% | View All 64 Rows |
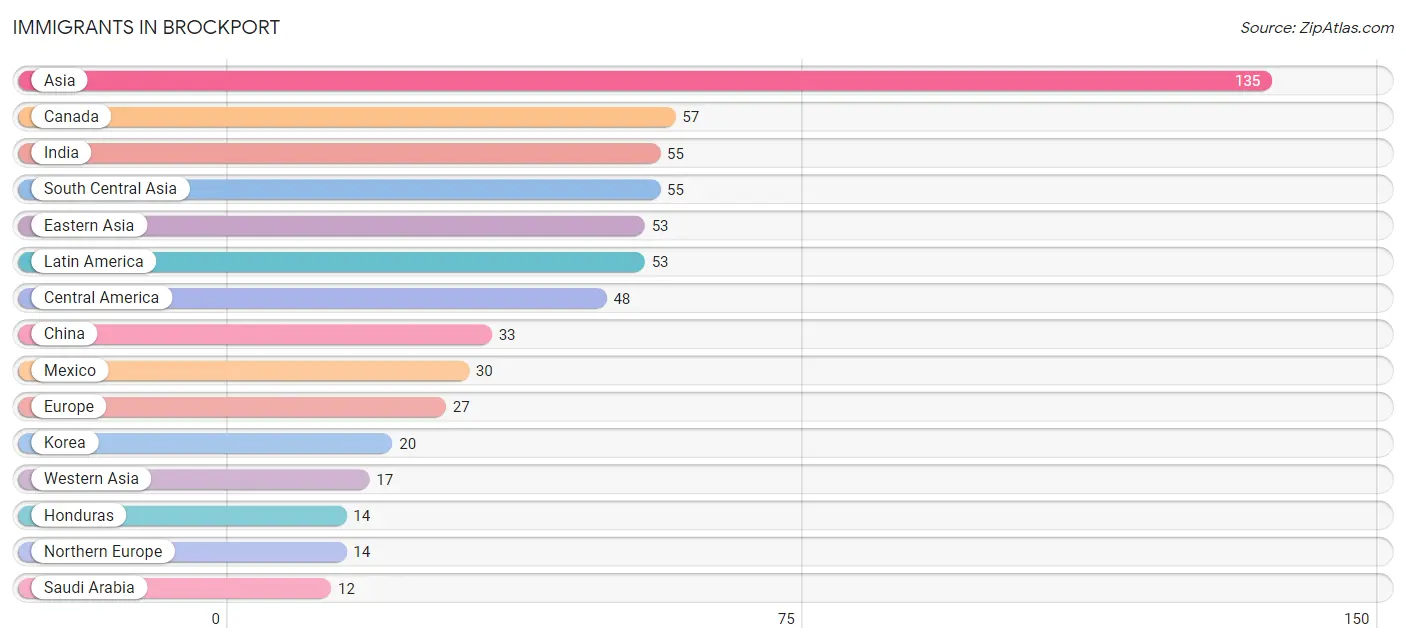
Immigrants in Brockport
The most numerous immigrant groups reported in Brockport came from Asia (135 | 1.9%), Canada (57 | 0.8%), India (55 | 0.8%), South Central Asia (55 | 0.8%), and Eastern Asia (53 | 0.7%), together accounting for 4.9% of all Brockport residents.
| Immigration Origin | # Population | % Population |
| Africa | 10 | 0.1% |
| Asia | 135 | 1.9% |
| Australia | 8 | 0.1% |
| Canada | 57 | 0.8% |
| Caribbean | 5 | 0.1% |
| Central America | 48 | 0.7% |
| China | 33 | 0.5% |
| Dominican Republic | 5 | 0.1% |
| Eastern Asia | 53 | 0.7% |
| Eastern Europe | 10 | 0.1% |
| England | 11 | 0.2% |
| Europe | 27 | 0.4% |
| Ghana | 5 | 0.1% |
| Guatemala | 4 | 0.1% |
| Honduras | 14 | 0.2% |
| India | 55 | 0.8% |
| Italy | 3 | 0.0% |
| Korea | 20 | 0.3% |
| Latin America | 53 | 0.7% |
| Mexico | 30 | 0.4% |
| Nigeria | 5 | 0.1% |
| Northern Europe | 14 | 0.2% |
| Oceania | 8 | 0.1% |
| Russia | 10 | 0.1% |
| Saudi Arabia | 12 | 0.2% |
| Singapore | 4 | 0.1% |
| South Central Asia | 55 | 0.8% |
| South Eastern Asia | 10 | 0.1% |
| Southern Europe | 3 | 0.0% |
| Vietnam | 6 | 0.1% |
| Western Africa | 10 | 0.1% |
| Western Asia | 17 | 0.2% | View All 32 Rows |
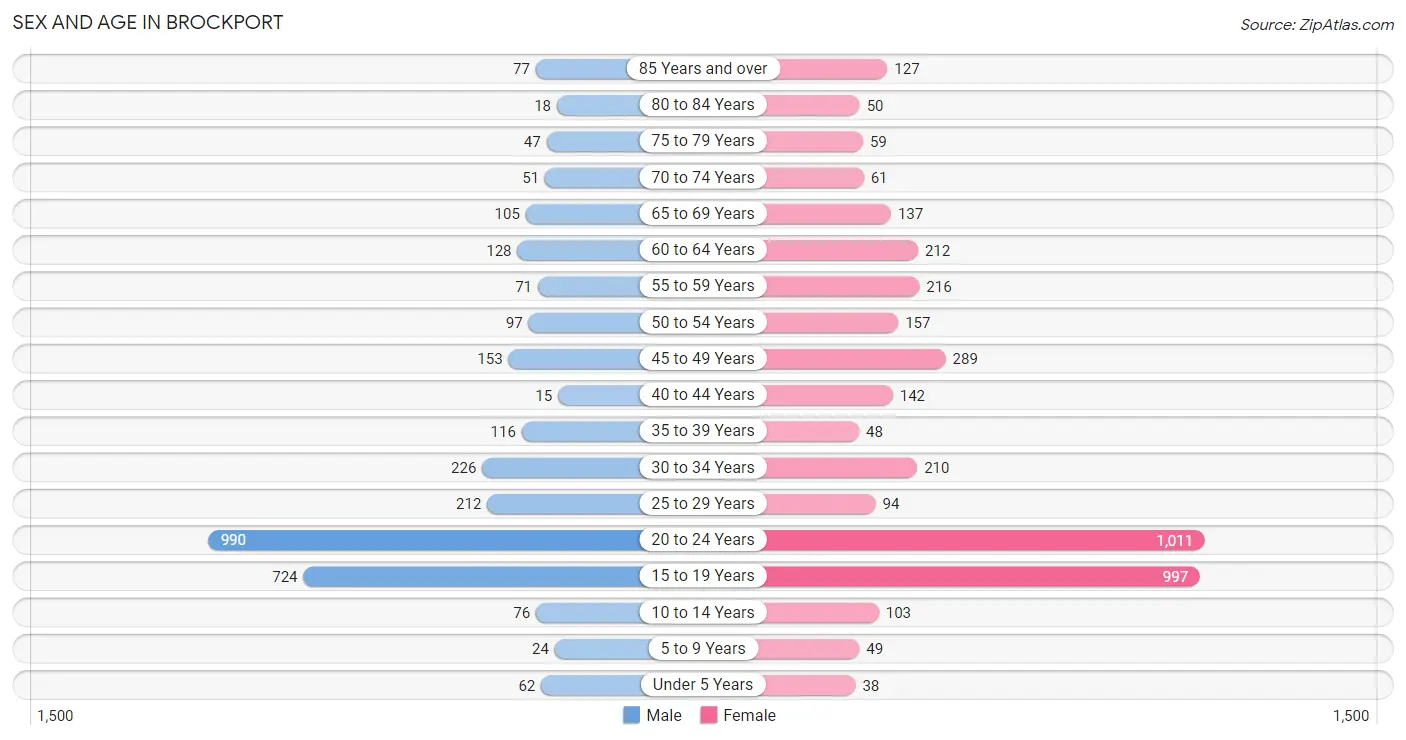
Sex and Age in Brockport
Sex and Age in Brockport
The most populous age groups in Brockport are 20 to 24 Years (990 | 31.0%) for men and 20 to 24 Years (1,011 | 25.3%) for women.
| Age Bracket | Male | Female |
| Under 5 Years | 62 (1.9%) | 38 (0.9%) |
| 5 to 9 Years | 24 (0.7%) | 49 (1.2%) |
| 10 to 14 Years | 76 (2.4%) | 103 (2.6%) |
| 15 to 19 Years | 724 (22.7%) | 997 (24.9%) |
| 20 to 24 Years | 990 (31.0%) | 1,011 (25.3%) |
| 25 to 29 Years | 212 (6.6%) | 94 (2.4%) |
| 30 to 34 Years | 226 (7.1%) | 210 (5.2%) |
| 35 to 39 Years | 116 (3.6%) | 48 (1.2%) |
| 40 to 44 Years | 15 (0.5%) | 142 (3.5%) |
| 45 to 49 Years | 153 (4.8%) | 289 (7.2%) |
| 50 to 54 Years | 97 (3.0%) | 157 (3.9%) |
| 55 to 59 Years | 71 (2.2%) | 216 (5.4%) |
| 60 to 64 Years | 128 (4.0%) | 212 (5.3%) |
| 65 to 69 Years | 105 (3.3%) | 137 (3.4%) |
| 70 to 74 Years | 51 (1.6%) | 61 (1.5%) |
| 75 to 79 Years | 47 (1.5%) | 59 (1.5%) |
| 80 to 84 Years | 18 (0.6%) | 50 (1.3%) |
| 85 Years and over | 77 (2.4%) | 127 (3.2%) |
| Total | 3,192 (100.0%) | 4,000 (100.0%) |
Families and Households in Brockport
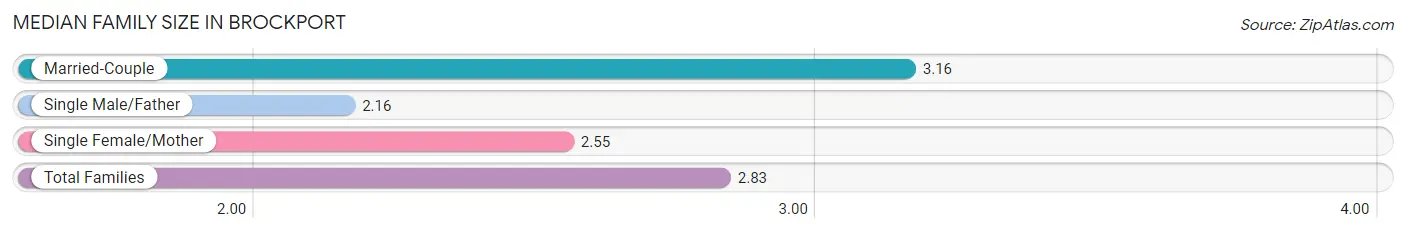
Median Family Size in Brockport
The median family size in Brockport is 2.83 persons per family, with married-couple families (515 | 53.9%) accounting for the largest median family size of 3.16 persons per family. On the other hand, single male/father families (108 | 11.3%) represent the smallest median family size with 2.16 persons per family.
| Family Type | # Families | Family Size |
| Married-Couple | 515 (53.9%) | 3.16 |
| Single Male/Father | 108 (11.3%) | 2.16 |
| Single Female/Mother | 332 (34.8%) | 2.55 |
| Total Families | 955 (100.0%) | 2.83 |
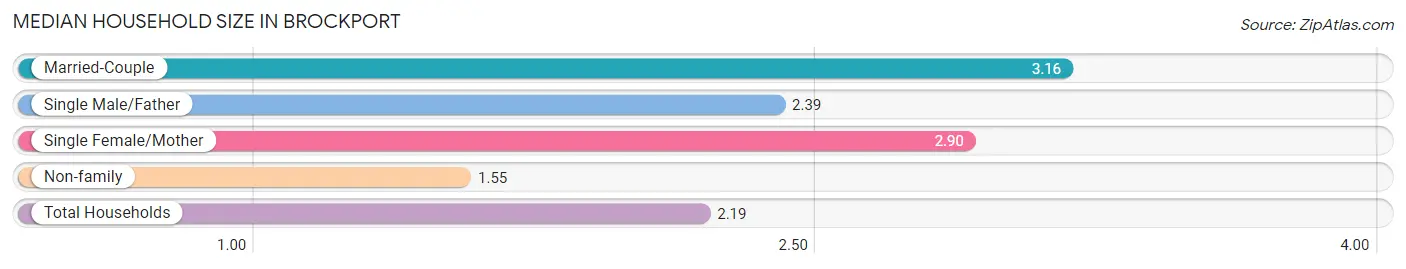
Median Household Size in Brockport
The median household size in Brockport is 2.19 persons per household, with married-couple households (515 | 24.0%) accounting for the largest median household size of 3.16 persons per household. non-family households (1,189 | 55.5%) represent the smallest median household size with 1.55 persons per household.
| Household Type | # Households | Household Size |
| Married-Couple | 515 (24.0%) | 3.16 |
| Single Male/Father | 108 (5.0%) | 2.39 |
| Single Female/Mother | 332 (15.5%) | 2.90 |
| Non-family | 1,189 (55.5%) | 1.55 |
| Total Households | 2,144 (100.0%) | 2.19 |
Household Size by Marriage Status in Brockport
Out of a total of 2,144 households in Brockport, 955 (44.5%) are family households, while 1,189 (55.5%) are nonfamily households. The most numerous type of family households are 2-person households, comprising 499, and the most common type of nonfamily households are 1-person households, comprising 710.
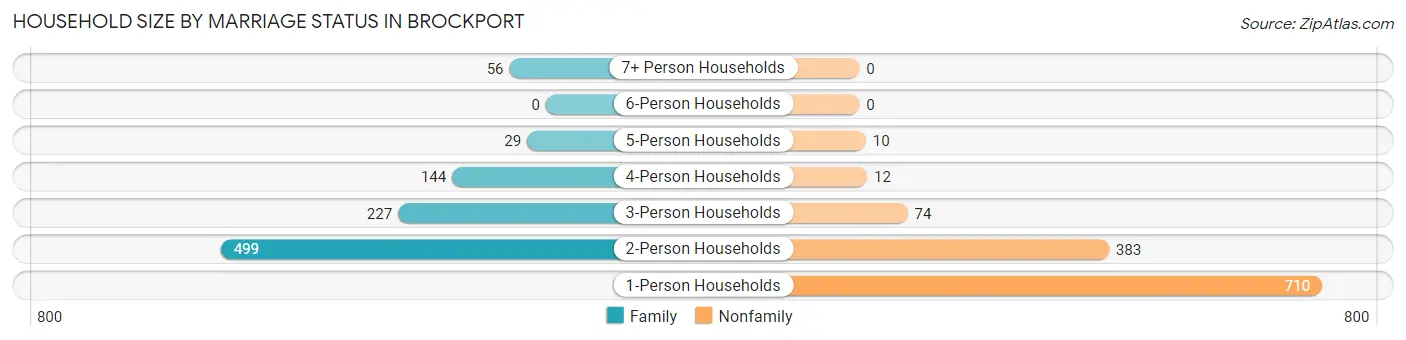
| Household Size | Family Households | Nonfamily Households |
| 1-Person Households | - | 710 (33.1%) |
| 2-Person Households | 499 (23.3%) | 383 (17.9%) |
| 3-Person Households | 227 (10.6%) | 74 (3.5%) |
| 4-Person Households | 144 (6.7%) | 12 (0.6%) |
| 5-Person Households | 29 (1.3%) | 10 (0.5%) |
| 6-Person Households | 0 (0.0%) | 0 (0.0%) |
| 7+ Person Households | 56 (2.6%) | 0 (0.0%) |
| Total | 955 (44.5%) | 1,189 (55.5%) |
Female Fertility in Brockport
Fertility by Age in Brockport
Average fertility rate in Brockport is 7.0 births per 1,000 women. Women in the age bracket of 20 to 34 years have the highest fertility rate with 16.0 births per 1,000 women. Women in the age bracket of 20 to 34 years acount for 100.0% of all women with births.
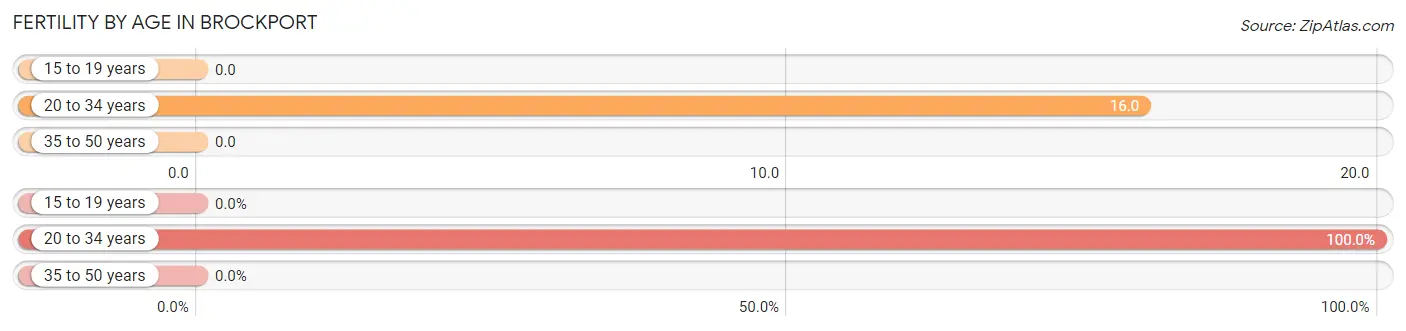
| Age Bracket | Women with Births | Births / 1,000 Women |
| 15 to 19 years | 0 (0.0%) | 0.0 |
| 20 to 34 years | 21 (100.0%) | 16.0 |
| 35 to 50 years | 0 (0.0%) | 0.0 |
| Total | 21 (100.0%) | 7.0 |
Fertility by Age by Marriage Status in Brockport
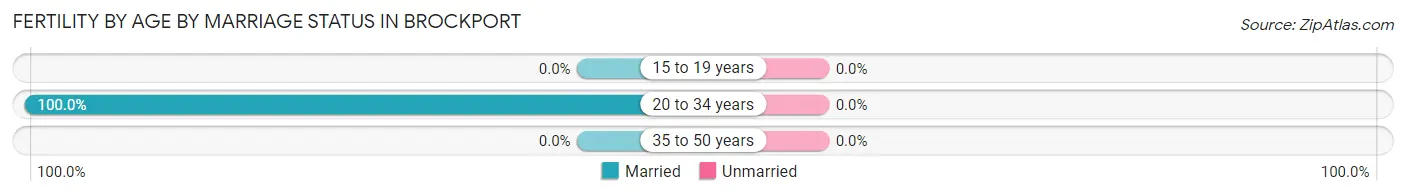
| Age Bracket | Married | Unmarried |
| 15 to 19 years | 0 (0.0%) | 0 (0.0%) |
| 20 to 34 years | 21 (100.0%) | 0 (0.0%) |
| 35 to 50 years | 0 (0.0%) | 0 (0.0%) |
| Total | 21 (100.0%) | 0 (0.0%) |
Fertility by Education in Brockport
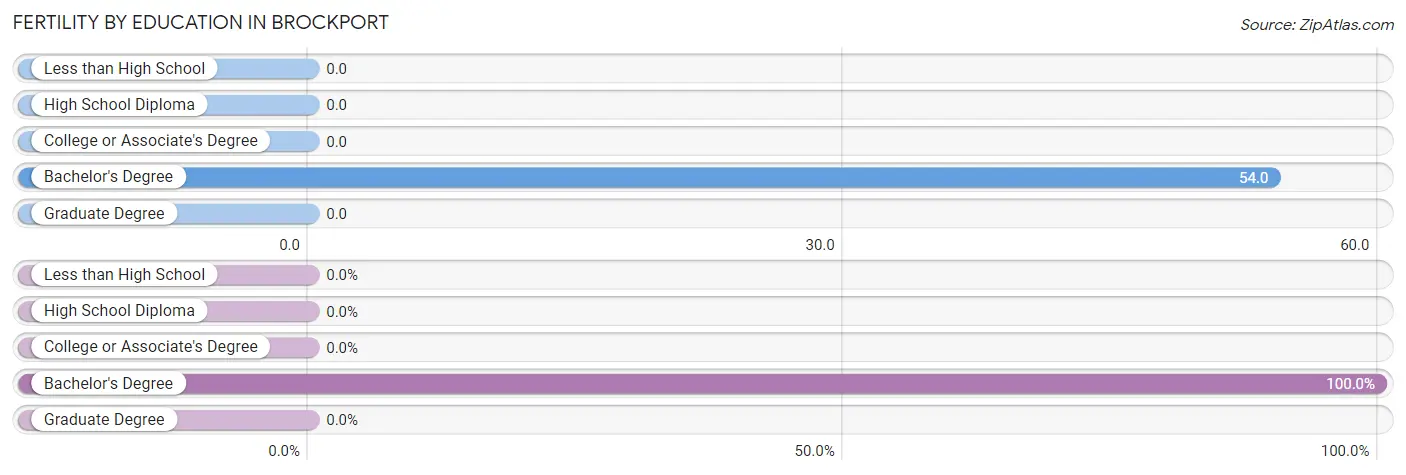
| Educational Attainment | Women with Births | Births / 1,000 Women |
| Less than High School | 0 (0.0%) | 0.0 |
| High School Diploma | 0 (0.0%) | 0.0 |
| College or Associate's Degree | 0 (0.0%) | 0.0 |
| Bachelor's Degree | 21 (100.0%) | 54.0 |
| Graduate Degree | 0 (0.0%) | 0.0 |
| Total | 21 (100.0%) | 7.0 |
Fertility by Education by Marriage Status in Brockport
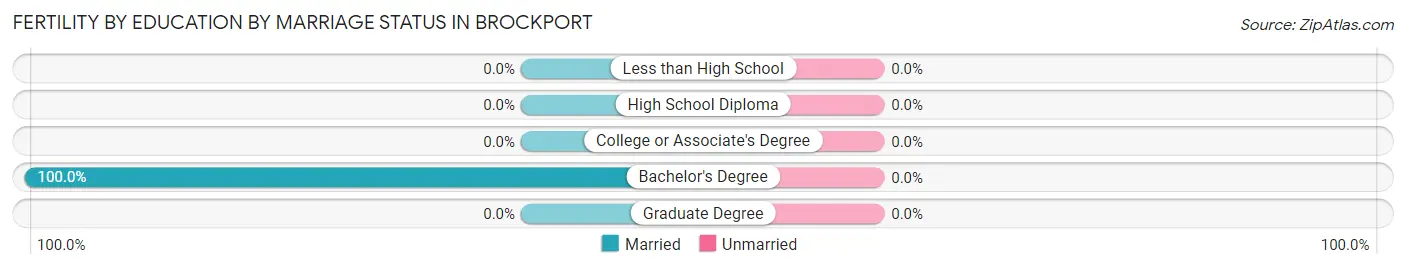
| Educational Attainment | Married | Unmarried |
| Less than High School | 0 (0.0%) | 0 (0.0%) |
| High School Diploma | 0 (0.0%) | 0 (0.0%) |
| College or Associate's Degree | 0 (0.0%) | 0 (0.0%) |
| Bachelor's Degree | 21 (100.0%) | 0 (0.0%) |
| Graduate Degree | 0 (0.0%) | 0 (0.0%) |
| Total | 21 (100.0%) | 0 (0.0%) |
Employment Characteristics in Brockport
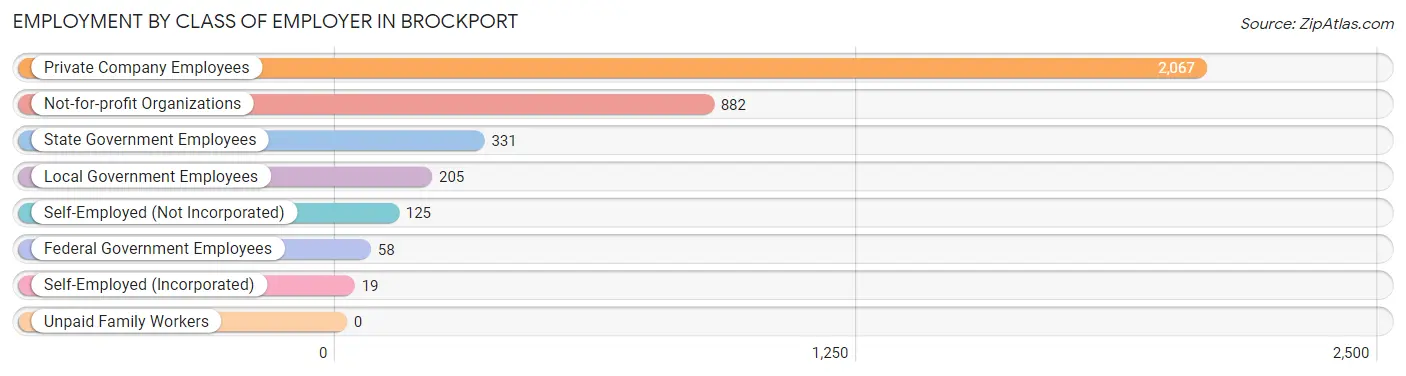
Employment by Class of Employer in Brockport
Among the 3,687 employed individuals in Brockport, private company employees (2,067 | 56.1%), not-for-profit organizations (882 | 23.9%), and state government employees (331 | 9.0%) make up the most common classes of employment.
| Employer Class | # Employees | % Employees |
| Private Company Employees | 2,067 | 56.1% |
| Self-Employed (Incorporated) | 19 | 0.5% |
| Self-Employed (Not Incorporated) | 125 | 3.4% |
| Not-for-profit Organizations | 882 | 23.9% |
| Local Government Employees | 205 | 5.6% |
| State Government Employees | 331 | 9.0% |
| Federal Government Employees | 58 | 1.6% |
| Unpaid Family Workers | 0 | 0.0% |
| Total | 3,687 | 100.0% |
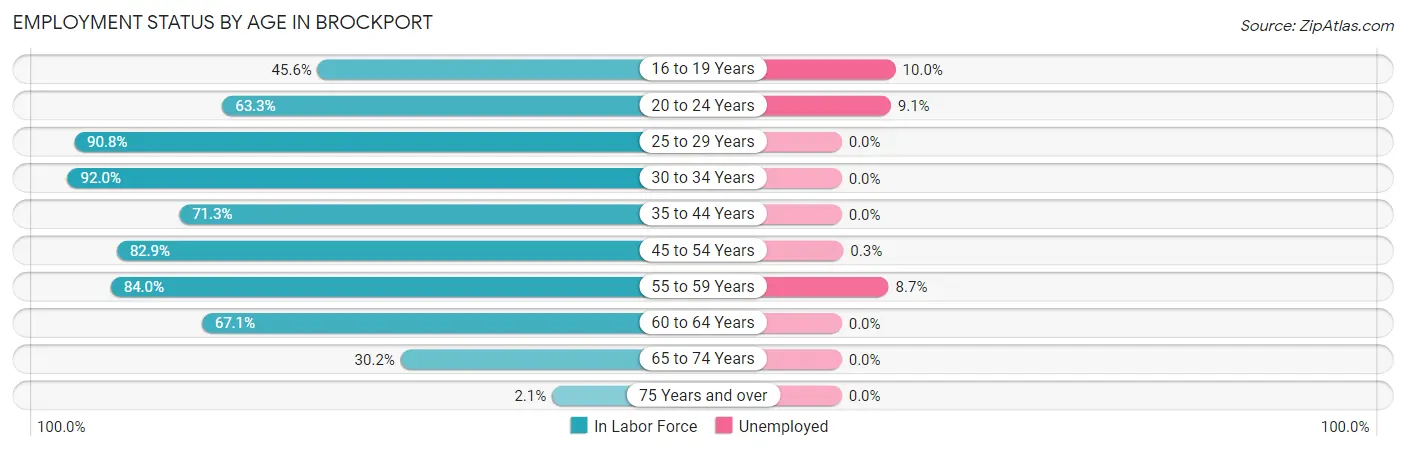
Employment Status by Age in Brockport
According to the labor force statistics for Brockport, out of the total population over 16 years of age (6,748), 60.4% or 4,076 individuals are in the labor force, with 5.2% or 212 of them unemployed. The age group with the highest labor force participation rate is 30 to 34 years, with 92.0% or 401 individuals in the labor force. Within the labor force, the 16 to 19 years age range has the highest percentage of unemployed individuals, with 10.0% or 74 of them being unemployed.
| Age Bracket | In Labor Force | Unemployed |
| 16 to 19 Years | 743 (45.6%) | 74 (10.0%) |
| 20 to 24 Years | 1,267 (63.3%) | 115 (9.1%) |
| 25 to 29 Years | 278 (90.8%) | 0 (0.0%) |
| 30 to 34 Years | 401 (92.0%) | 0 (0.0%) |
| 35 to 44 Years | 229 (71.3%) | 0 (0.0%) |
| 45 to 54 Years | 577 (82.9%) | 2 (0.3%) |
| 55 to 59 Years | 241 (84.0%) | 21 (8.7%) |
| 60 to 64 Years | 228 (67.1%) | 0 (0.0%) |
| 65 to 74 Years | 107 (30.2%) | 0 (0.0%) |
| 75 Years and over | 8 (2.1%) | 0 (0.0%) |
| Total | 4,076 (60.4%) | 212 (5.2%) |
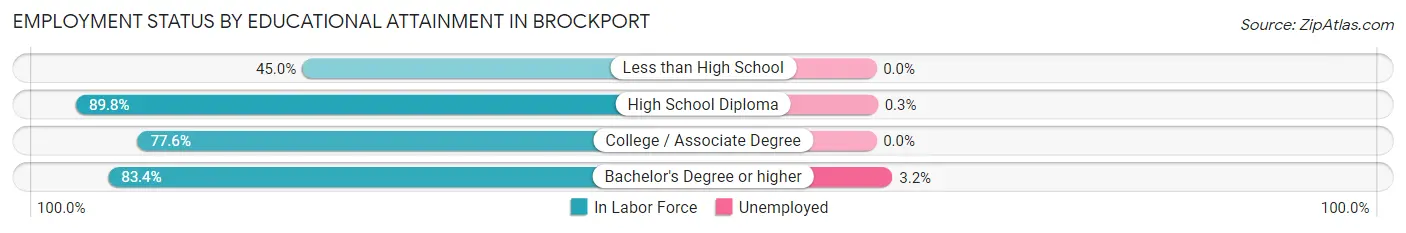
Employment Status by Educational Attainment in Brockport
According to labor force statistics for Brockport, 81.9% of individuals (1,954) out of the total population between 25 and 64 years of age (2,386) are in the labor force, with 1.2% or 23 of them being unemployed. The group with the highest labor force participation rate are those with the educational attainment of high school diploma, with 89.8% or 703 individuals in the labor force. Within the labor force, individuals with bachelor's degree or higher education have the highest percentage of unemployment, with 3.2% or 21 of them being unemployed.
| Educational Attainment | In Labor Force | Unemployed |
| Less than High School | 54 (45.0%) | 0 (0.0%) |
| High School Diploma | 703 (89.8%) | 2 (0.3%) |
| College / Associate Degree | 535 (77.6%) | 0 (0.0%) |
| Bachelor's Degree or higher | 662 (83.4%) | 25 (3.2%) |
| Total | 1,954 (81.9%) | 29 (1.2%) |
Employment Occupations by Sex in Brockport
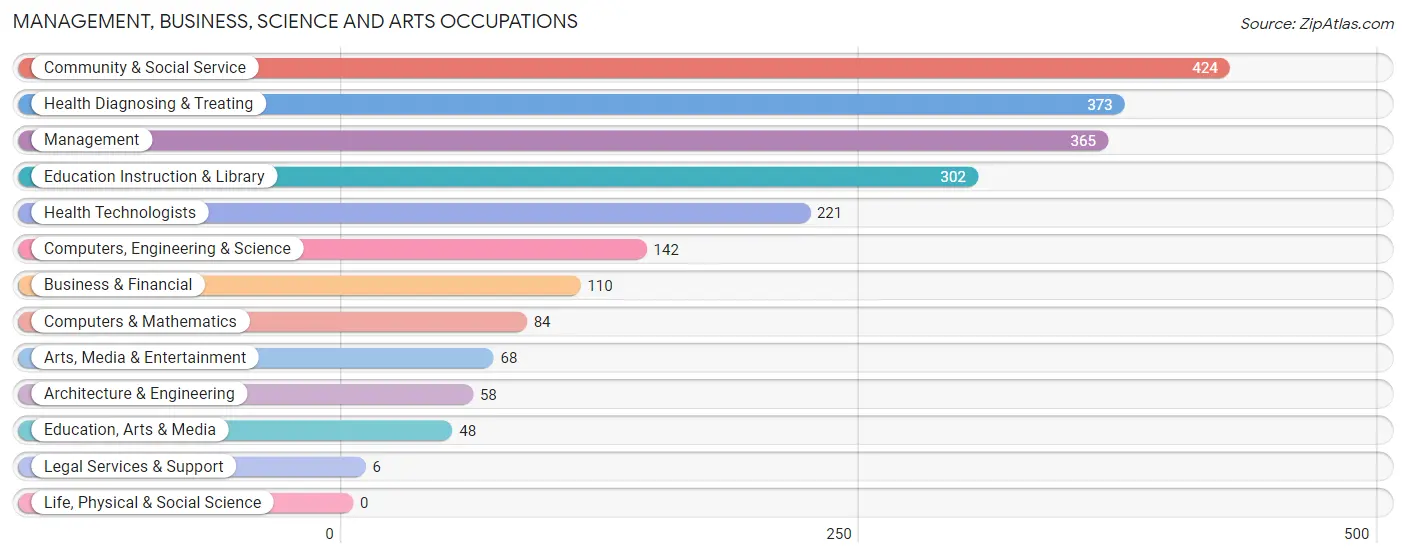
Management, Business, Science and Arts Occupations
The most common Management, Business, Science and Arts occupations in Brockport are Community & Social Service (424 | 11.0%), Health Diagnosing & Treating (373 | 9.7%), Management (365 | 9.4%), Education Instruction & Library (302 | 7.8%), and Health Technologists (221 | 5.7%).
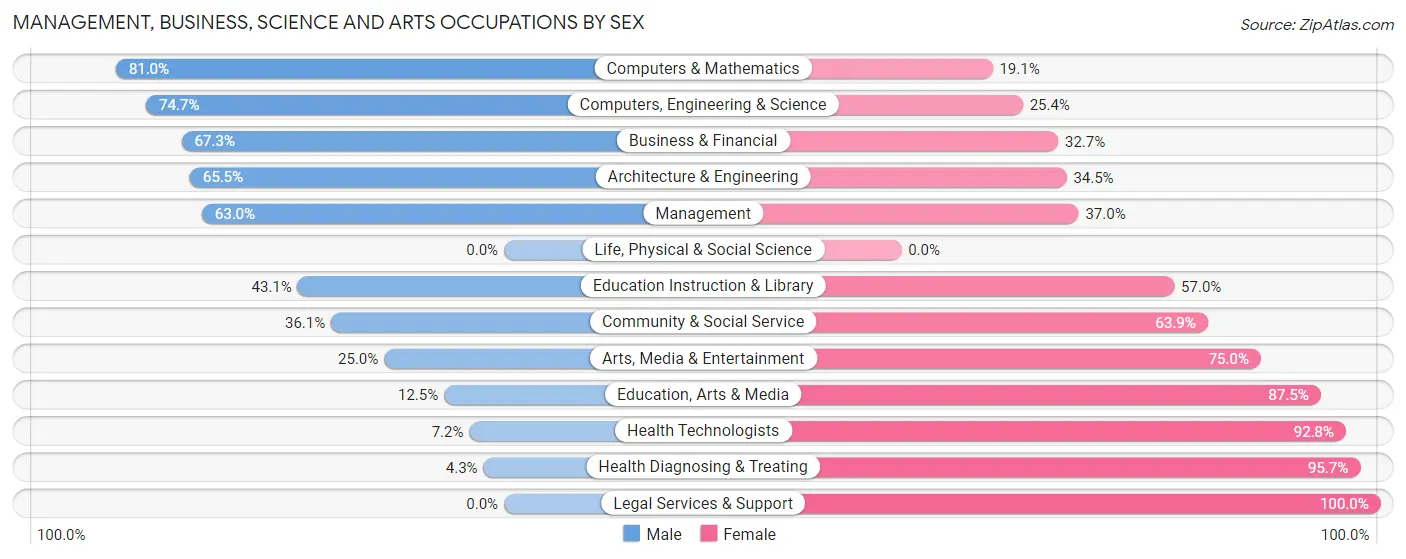
Management, Business, Science and Arts Occupations by Sex
Within the Management, Business, Science and Arts occupations in Brockport, the most male-oriented occupations are Computers & Mathematics (80.9%), Computers, Engineering & Science (74.7%), and Business & Financial (67.3%), while the most female-oriented occupations are Legal Services & Support (100.0%), Health Diagnosing & Treating (95.7%), and Health Technologists (92.8%).
| Occupation | Male | Female |
| Management | 230 (63.0%) | 135 (37.0%) |
| Business & Financial | 74 (67.3%) | 36 (32.7%) |
| Computers, Engineering & Science | 106 (74.7%) | 36 (25.4%) |
| Computers & Mathematics | 68 (80.9%) | 16 (19.1%) |
| Architecture & Engineering | 38 (65.5%) | 20 (34.5%) |
| Life, Physical & Social Science | 0 (0.0%) | 0 (0.0%) |
| Community & Social Service | 153 (36.1%) | 271 (63.9%) |
| Education, Arts & Media | 6 (12.5%) | 42 (87.5%) |
| Legal Services & Support | 0 (0.0%) | 6 (100.0%) |
| Education Instruction & Library | 130 (43.0%) | 172 (57.0%) |
| Arts, Media & Entertainment | 17 (25.0%) | 51 (75.0%) |
| Health Diagnosing & Treating | 16 (4.3%) | 357 (95.7%) |
| Health Technologists | 16 (7.2%) | 205 (92.8%) |
| Total (Category) | 579 (40.9%) | 835 (59.1%) |
| Total (Overall) | 1,532 (39.6%) | 2,335 (60.4%) |
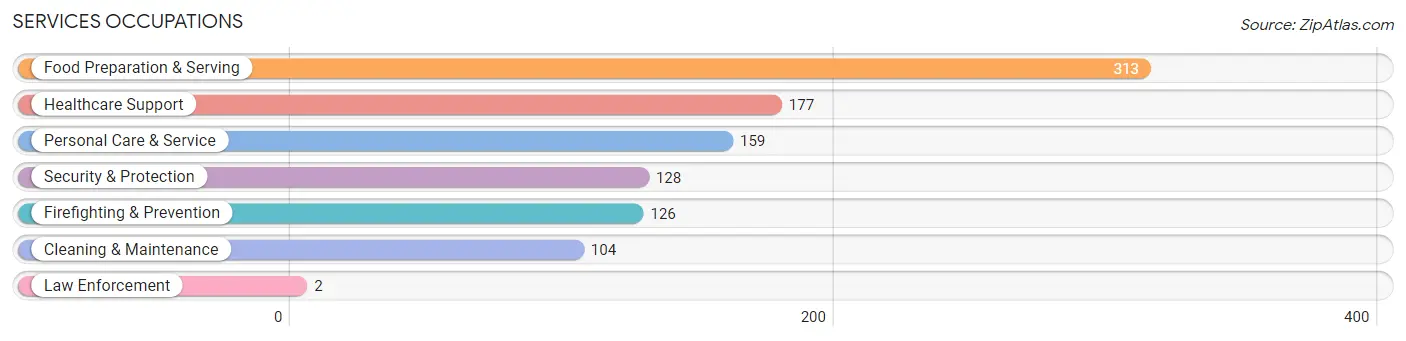
Services Occupations
The most common Services occupations in Brockport are Food Preparation & Serving (313 | 8.1%), Healthcare Support (177 | 4.6%), Personal Care & Service (159 | 4.1%), Security & Protection (128 | 3.3%), and Firefighting & Prevention (126 | 3.3%).
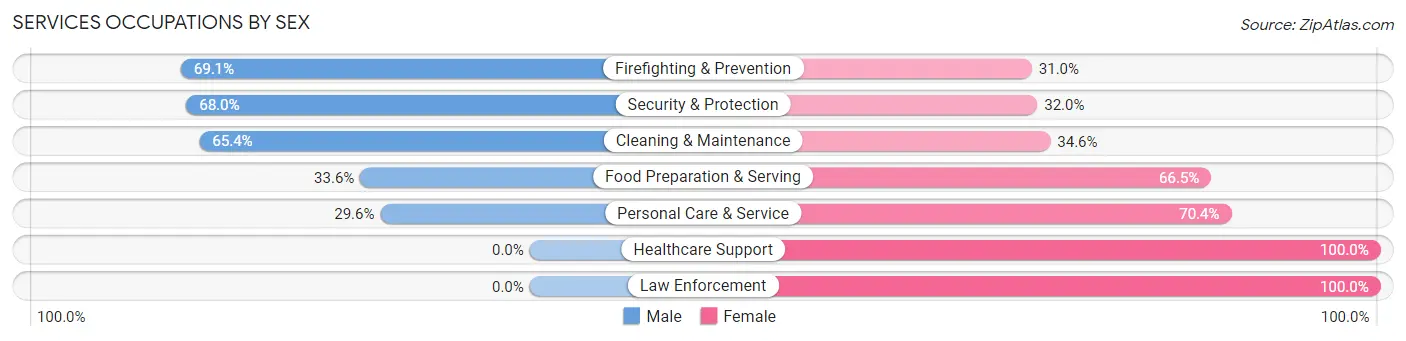
Services Occupations by Sex
Within the Services occupations in Brockport, the most male-oriented occupations are Firefighting & Prevention (69.1%), Security & Protection (68.0%), and Cleaning & Maintenance (65.4%), while the most female-oriented occupations are Healthcare Support (100.0%), Law Enforcement (100.0%), and Personal Care & Service (70.4%).
| Occupation | Male | Female |
| Healthcare Support | 0 (0.0%) | 177 (100.0%) |
| Security & Protection | 87 (68.0%) | 41 (32.0%) |
| Firefighting & Prevention | 87 (69.1%) | 39 (30.9%) |
| Law Enforcement | 0 (0.0%) | 2 (100.0%) |
| Food Preparation & Serving | 105 (33.6%) | 208 (66.4%) |
| Cleaning & Maintenance | 68 (65.4%) | 36 (34.6%) |
| Personal Care & Service | 47 (29.6%) | 112 (70.4%) |
| Total (Category) | 307 (34.8%) | 574 (65.1%) |
| Total (Overall) | 1,532 (39.6%) | 2,335 (60.4%) |
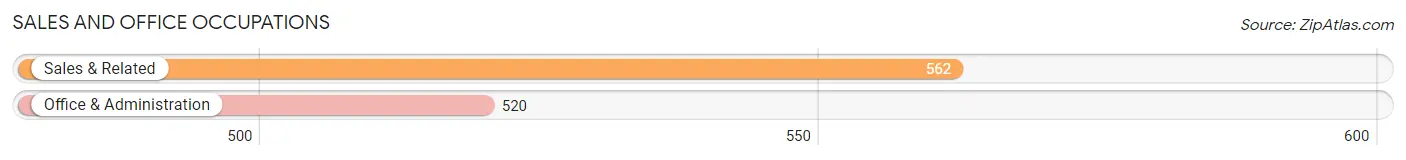
Sales and Office Occupations
The most common Sales and Office occupations in Brockport are Sales & Related (562 | 14.5%), and Office & Administration (520 | 13.5%).
Sales and Office Occupations by Sex
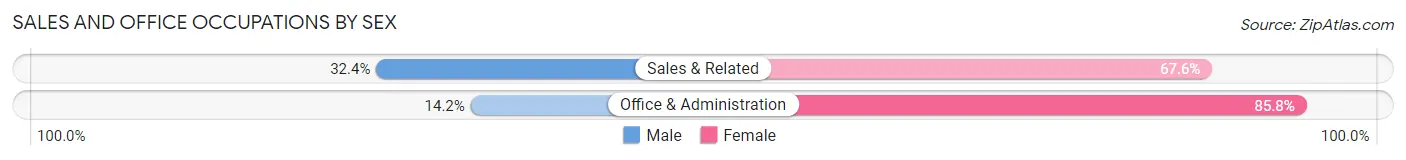
| Occupation | Male | Female |
| Sales & Related | 182 (32.4%) | 380 (67.6%) |
| Office & Administration | 74 (14.2%) | 446 (85.8%) |
| Total (Category) | 256 (23.7%) | 826 (76.3%) |
| Total (Overall) | 1,532 (39.6%) | 2,335 (60.4%) |
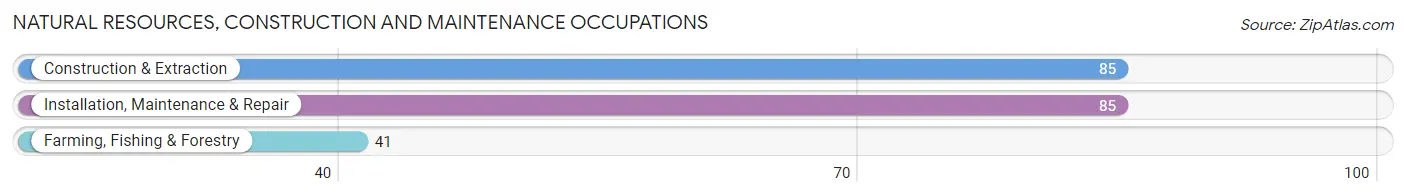
Natural Resources, Construction and Maintenance Occupations
The most common Natural Resources, Construction and Maintenance occupations in Brockport are Construction & Extraction (85 | 2.2%), Installation, Maintenance & Repair (85 | 2.2%), and Farming, Fishing & Forestry (41 | 1.1%).
Natural Resources, Construction and Maintenance Occupations by Sex
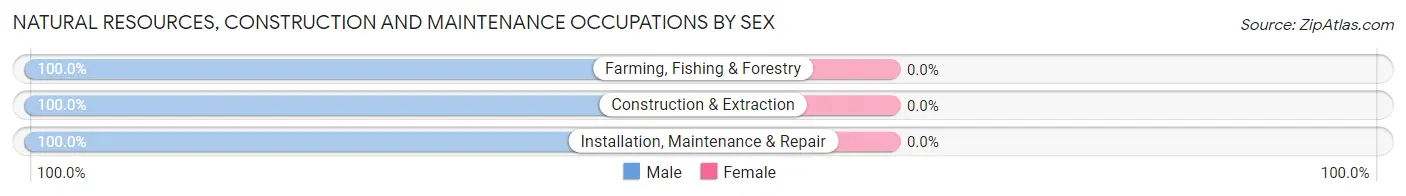
| Occupation | Male | Female |
| Farming, Fishing & Forestry | 41 (100.0%) | 0 (0.0%) |
| Construction & Extraction | 85 (100.0%) | 0 (0.0%) |
| Installation, Maintenance & Repair | 85 (100.0%) | 0 (0.0%) |
| Total (Category) | 211 (100.0%) | 0 (0.0%) |
| Total (Overall) | 1,532 (39.6%) | 2,335 (60.4%) |
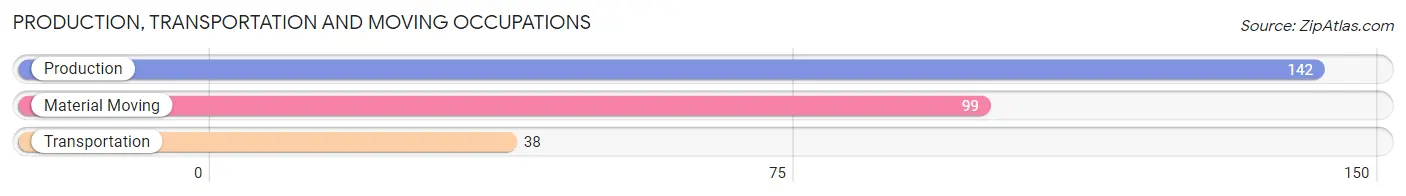
Production, Transportation and Moving Occupations
The most common Production, Transportation and Moving occupations in Brockport are Production (142 | 3.7%), Material Moving (99 | 2.6%), and Transportation (38 | 1.0%).
Production, Transportation and Moving Occupations by Sex
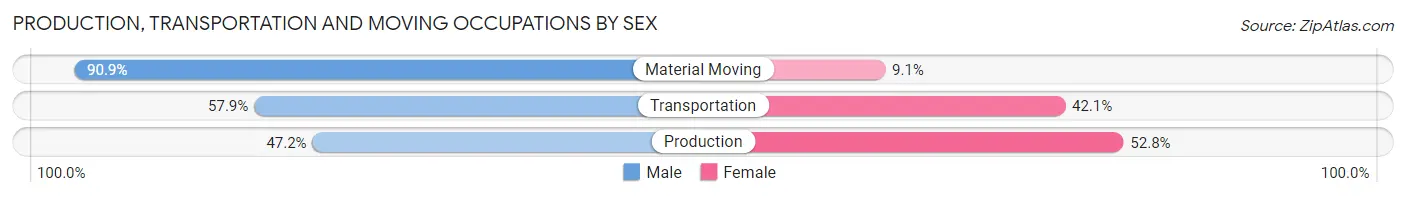
| Occupation | Male | Female |
| Production | 67 (47.2%) | 75 (52.8%) |
| Transportation | 22 (57.9%) | 16 (42.1%) |
| Material Moving | 90 (90.9%) | 9 (9.1%) |
| Total (Category) | 179 (64.2%) | 100 (35.8%) |
| Total (Overall) | 1,532 (39.6%) | 2,335 (60.4%) |
Employment Industries by Sex in Brockport
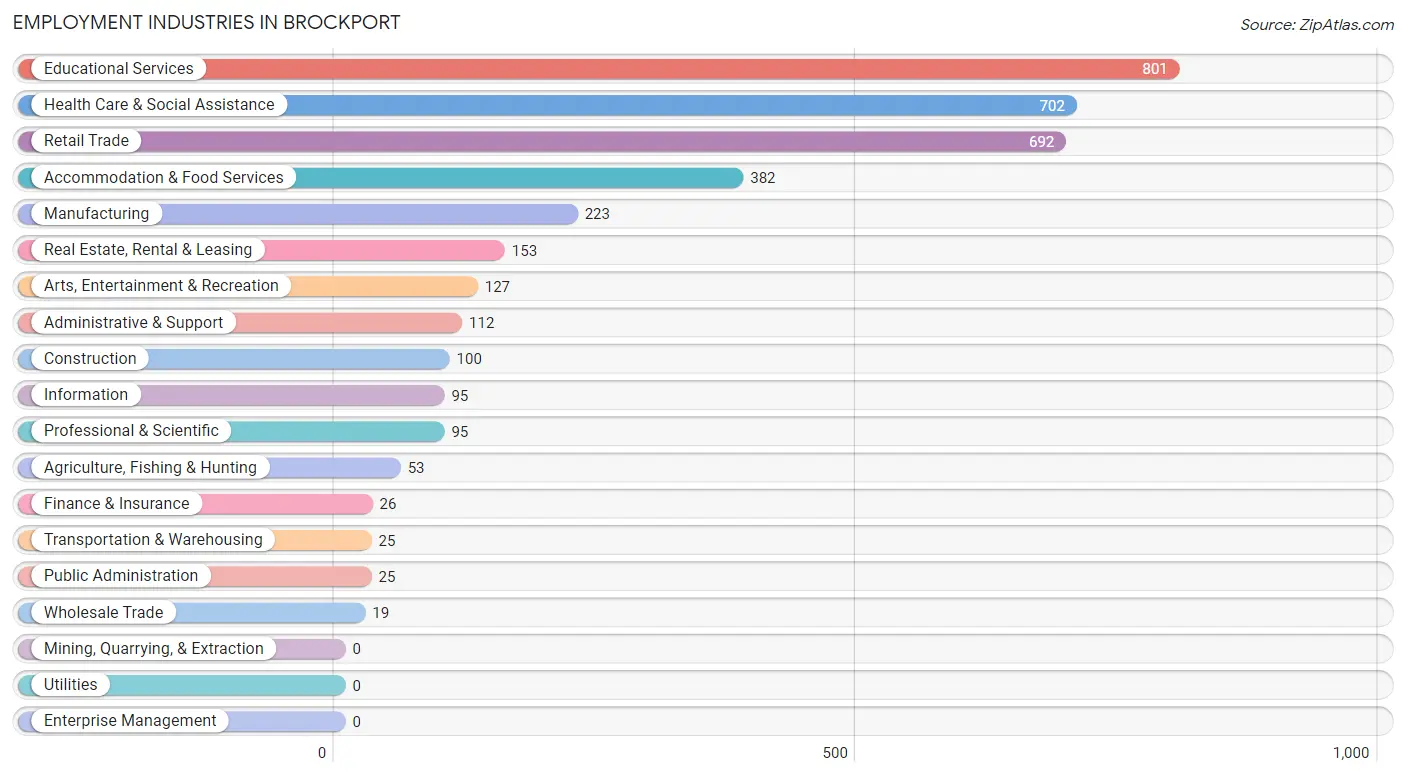
Employment Industries in Brockport
The major employment industries in Brockport include Educational Services (801 | 20.7%), Health Care & Social Assistance (702 | 18.1%), Retail Trade (692 | 17.9%), Accommodation & Food Services (382 | 9.9%), and Manufacturing (223 | 5.8%).
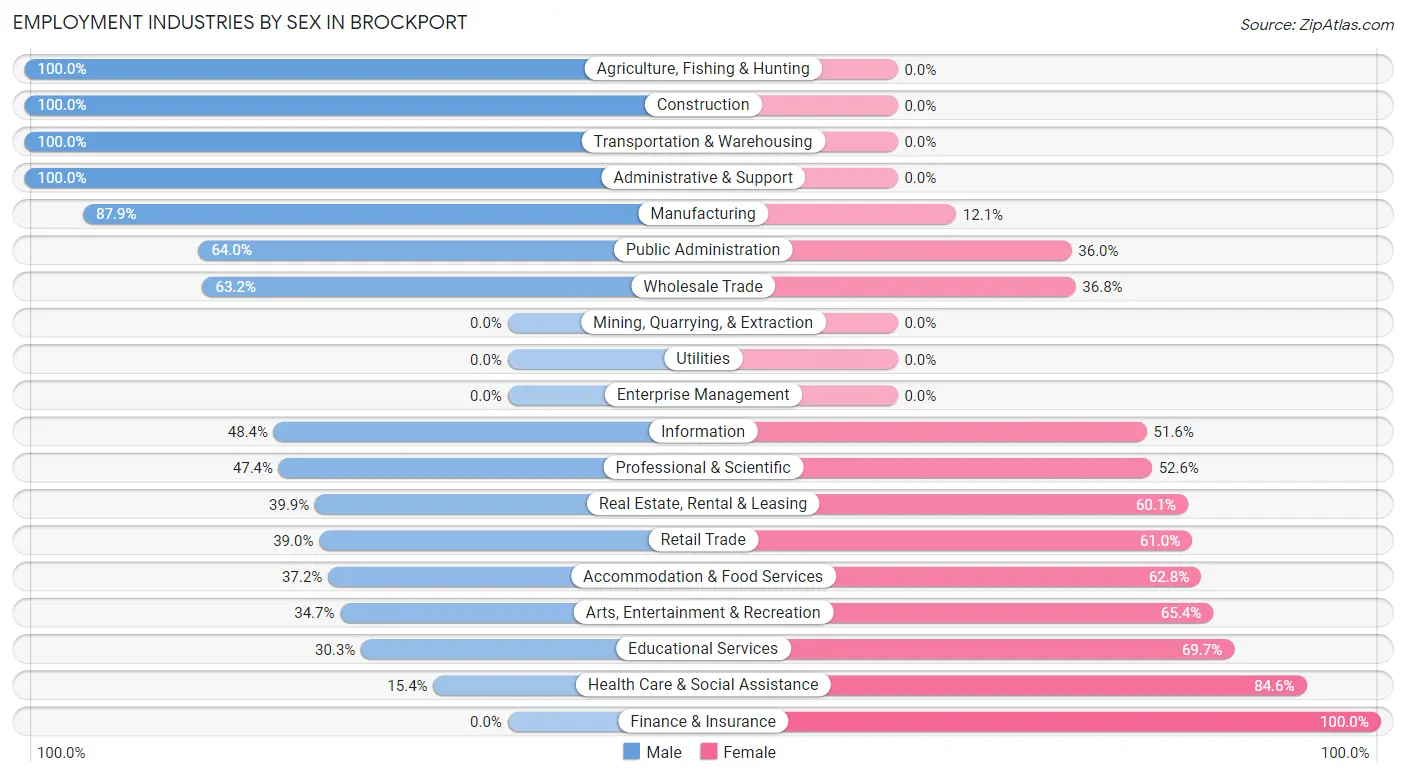
Employment Industries by Sex in Brockport
The Brockport industries that see more men than women are Agriculture, Fishing & Hunting (100.0%), Construction (100.0%), and Transportation & Warehousing (100.0%), whereas the industries that tend to have a higher number of women are Finance & Insurance (100.0%), Health Care & Social Assistance (84.6%), and Educational Services (69.7%).
| Industry | Male | Female |
| Agriculture, Fishing & Hunting | 53 (100.0%) | 0 (0.0%) |
| Mining, Quarrying, & Extraction | 0 (0.0%) | 0 (0.0%) |
| Construction | 100 (100.0%) | 0 (0.0%) |
| Manufacturing | 196 (87.9%) | 27 (12.1%) |
| Wholesale Trade | 12 (63.2%) | 7 (36.8%) |
| Retail Trade | 270 (39.0%) | 422 (61.0%) |
| Transportation & Warehousing | 25 (100.0%) | 0 (0.0%) |
| Utilities | 0 (0.0%) | 0 (0.0%) |
| Information | 46 (48.4%) | 49 (51.6%) |
| Finance & Insurance | 0 (0.0%) | 26 (100.0%) |
| Real Estate, Rental & Leasing | 61 (39.9%) | 92 (60.1%) |
| Professional & Scientific | 45 (47.4%) | 50 (52.6%) |
| Enterprise Management | 0 (0.0%) | 0 (0.0%) |
| Administrative & Support | 112 (100.0%) | 0 (0.0%) |
| Educational Services | 243 (30.3%) | 558 (69.7%) |
| Health Care & Social Assistance | 108 (15.4%) | 594 (84.6%) |
| Arts, Entertainment & Recreation | 44 (34.6%) | 83 (65.3%) |
| Accommodation & Food Services | 142 (37.2%) | 240 (62.8%) |
| Public Administration | 16 (64.0%) | 9 (36.0%) |
| Total | 1,532 (39.6%) | 2,335 (60.4%) |
Education in Brockport
School Enrollment in Brockport
The most common levels of schooling among the 3,714 students in Brockport are college / undergraduate (3,159 | 85.1%), high school (241 | 6.5%), and middle school (175 | 4.7%).
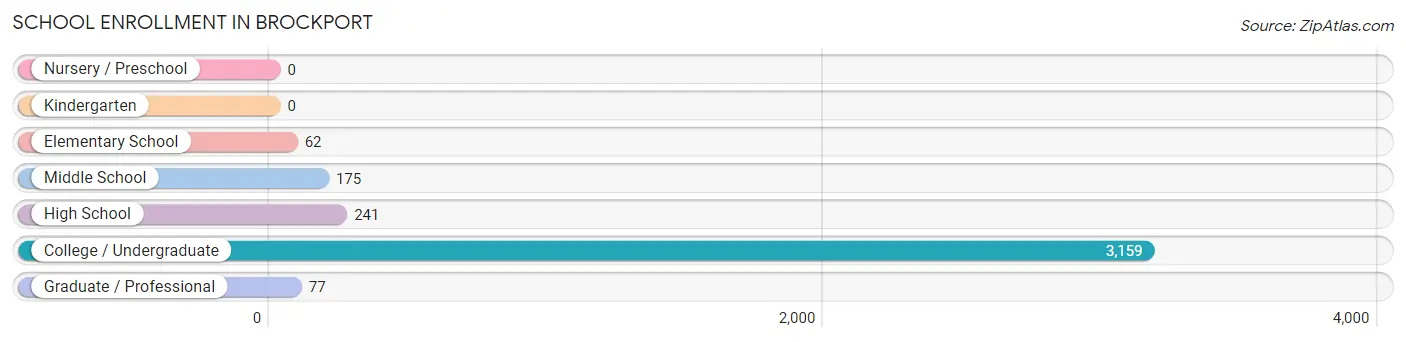
| School Level | # Students | % Students |
| Nursery / Preschool | 0 | 0.0% |
| Kindergarten | 0 | 0.0% |
| Elementary School | 62 | 1.7% |
| Middle School | 175 | 4.7% |
| High School | 241 | 6.5% |
| College / Undergraduate | 3,159 | 85.1% |
| Graduate / Professional | 77 | 2.1% |
| Total | 3,714 | 100.0% |
School Enrollment by Age by Funding Source in Brockport
Out of a total of 3,714 students who are enrolled in schools in Brockport, 891 (24.0%) attend a private institution, while the remaining 2,823 (76.0%) are enrolled in public schools. The age group of 35 years and over has the highest likelihood of being enrolled in private schools, with 45 (58.4% in the age bracket) enrolled. Conversely, the age group of 5 to 9 year old has the lowest likelihood of being enrolled in a private school, with 73 (100.0% in the age bracket) attending a public institution.
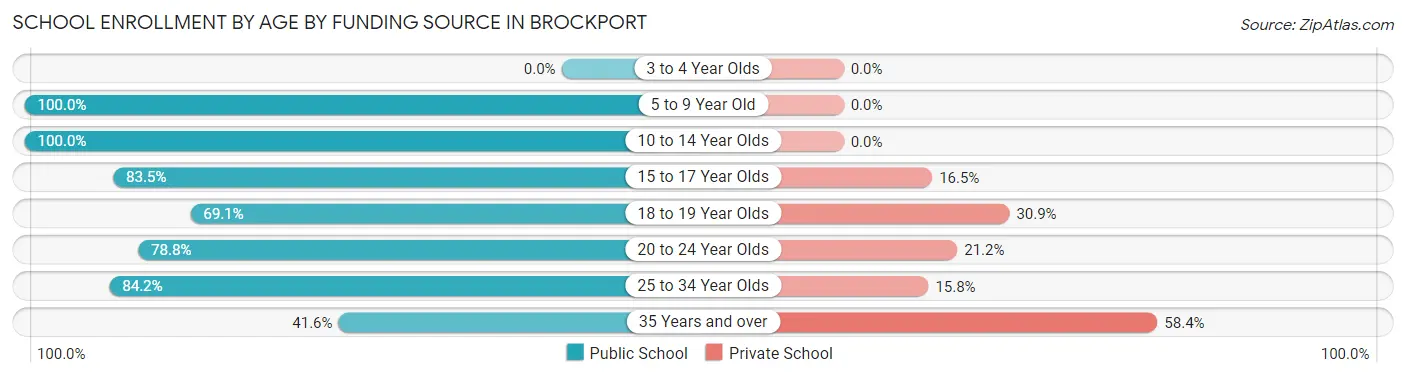
| Age Bracket | Public School | Private School |
| 3 to 4 Year Olds | 0 (0.0%) | 0 (0.0%) |
| 5 to 9 Year Old | 73 (100.0%) | 0 (0.0%) |
| 10 to 14 Year Olds | 179 (100.0%) | 0 (0.0%) |
| 15 to 17 Year Olds | 162 (83.5%) | 32 (16.5%) |
| 18 to 19 Year Olds | 1,016 (69.1%) | 454 (30.9%) |
| 20 to 24 Year Olds | 1,282 (78.8%) | 344 (21.2%) |
| 25 to 34 Year Olds | 80 (84.2%) | 15 (15.8%) |
| 35 Years and over | 32 (41.6%) | 45 (58.4%) |
| Total | 2,823 (76.0%) | 891 (24.0%) |
Educational Attainment by Field of Study in Brockport
Science & technology (192 | 17.3%), arts & humanities (135 | 12.1%), social sciences (128 | 11.5%), liberal arts & history (117 | 10.5%), and education (102 | 9.2%) are the most common fields of study among 1,111 individuals in Brockport who have obtained a bachelor's degree or higher.
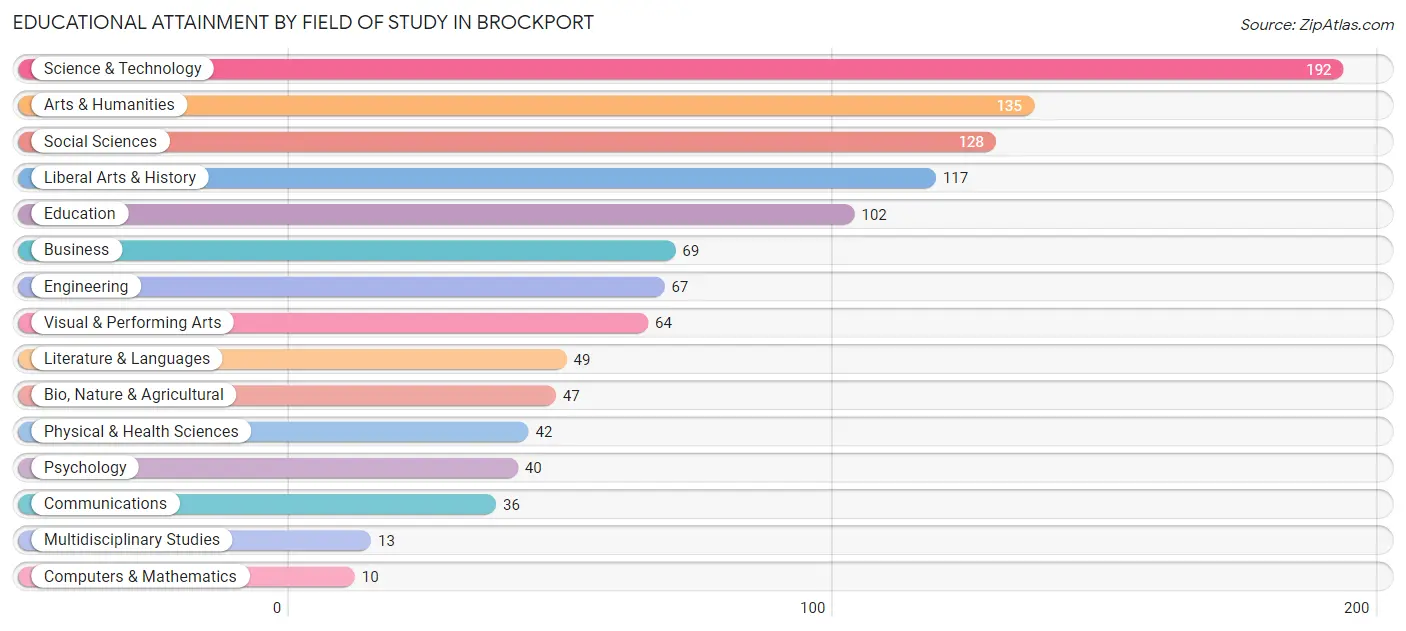
| Field of Study | # Graduates | % Graduates |
| Computers & Mathematics | 10 | 0.9% |
| Bio, Nature & Agricultural | 47 | 4.2% |
| Physical & Health Sciences | 42 | 3.8% |
| Psychology | 40 | 3.6% |
| Social Sciences | 128 | 11.5% |
| Engineering | 67 | 6.0% |
| Multidisciplinary Studies | 13 | 1.2% |
| Science & Technology | 192 | 17.3% |
| Business | 69 | 6.2% |
| Education | 102 | 9.2% |
| Literature & Languages | 49 | 4.4% |
| Liberal Arts & History | 117 | 10.5% |
| Visual & Performing Arts | 64 | 5.8% |
| Communications | 36 | 3.2% |
| Arts & Humanities | 135 | 12.1% |
| Total | 1,111 | 100.0% |
Transportation & Commute in Brockport
Vehicle Availability by Sex in Brockport
The most prevalent vehicle ownership categories in Brockport are males with 1 vehicle (328, accounting for 28.0%) and females with 1 vehicle (427, making up 21.4%).
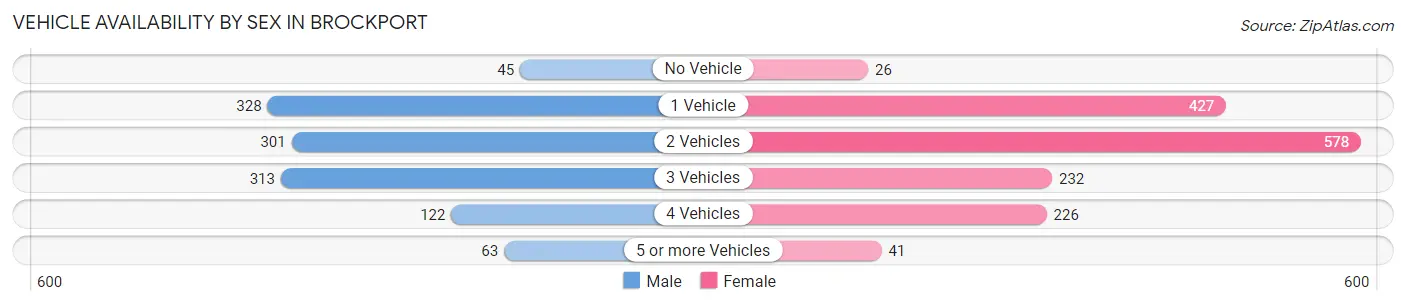
| Vehicles Available | Male | Female |
| No Vehicle | 45 (3.8%) | 26 (1.7%) |
| 1 Vehicle | 328 (28.0%) | 427 (27.9%) |
| 2 Vehicles | 301 (25.7%) | 578 (37.8%) |
| 3 Vehicles | 313 (26.7%) | 232 (15.2%) |
| 4 Vehicles | 122 (10.4%) | 226 (14.8%) |
| 5 or more Vehicles | 63 (5.4%) | 41 (2.7%) |
| Total | 1,172 (100.0%) | 1,530 (100.0%) |
Commute Time in Brockport
The most frequently occuring commute durations in Brockport are 5 to 9 minutes (807 commuters, 22.8%), 25 to 29 minutes (457 commuters, 12.9%), and 20 to 24 minutes (454 commuters, 12.8%).
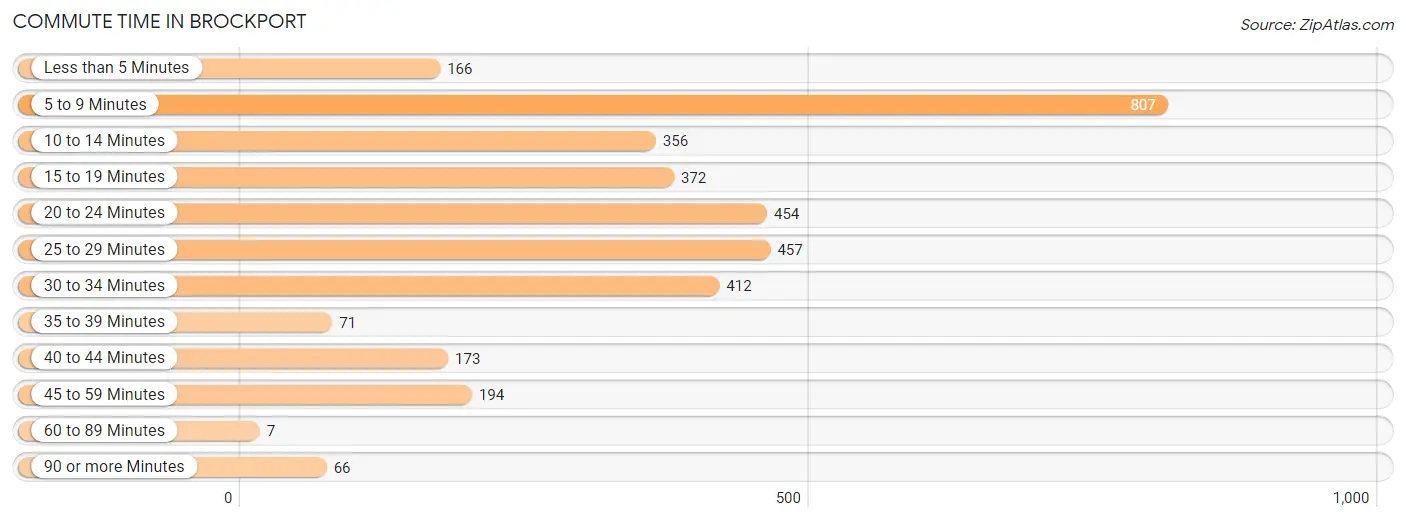
| Commute Time | # Commuters | % Commuters |
| Less than 5 Minutes | 166 | 4.7% |
| 5 to 9 Minutes | 807 | 22.8% |
| 10 to 14 Minutes | 356 | 10.1% |
| 15 to 19 Minutes | 372 | 10.5% |
| 20 to 24 Minutes | 454 | 12.8% |
| 25 to 29 Minutes | 457 | 12.9% |
| 30 to 34 Minutes | 412 | 11.7% |
| 35 to 39 Minutes | 71 | 2.0% |
| 40 to 44 Minutes | 173 | 4.9% |
| 45 to 59 Minutes | 194 | 5.5% |
| 60 to 89 Minutes | 7 | 0.2% |
| 90 or more Minutes | 66 | 1.9% |
Commute Time by Sex in Brockport
The most common commute times in Brockport are 20 to 24 minutes (305 commuters, 20.8%) for males and 5 to 9 minutes (664 commuters, 32.1%) for females.

| Commute Time | Male | Female |
| Less than 5 Minutes | 85 (5.8%) | 81 (3.9%) |
| 5 to 9 Minutes | 143 (9.8%) | 664 (32.1%) |
| 10 to 14 Minutes | 133 (9.1%) | 223 (10.8%) |
| 15 to 19 Minutes | 183 (12.5%) | 189 (9.1%) |
| 20 to 24 Minutes | 305 (20.8%) | 149 (7.2%) |
| 25 to 29 Minutes | 199 (13.6%) | 258 (12.5%) |
| 30 to 34 Minutes | 166 (11.3%) | 246 (11.9%) |
| 35 to 39 Minutes | 52 (3.5%) | 19 (0.9%) |
| 40 to 44 Minutes | 74 (5.1%) | 99 (4.8%) |
| 45 to 59 Minutes | 125 (8.5%) | 69 (3.3%) |
| 60 to 89 Minutes | 0 (0.0%) | 7 (0.3%) |
| 90 or more Minutes | 0 (0.0%) | 66 (3.2%) |
Time of Departure to Work by Sex in Brockport
The most frequent times of departure to work in Brockport are 7:00 AM to 7:29 AM (251, 17.1%) for males and 4:00 PM to 11:59 PM (440, 21.3%) for females.
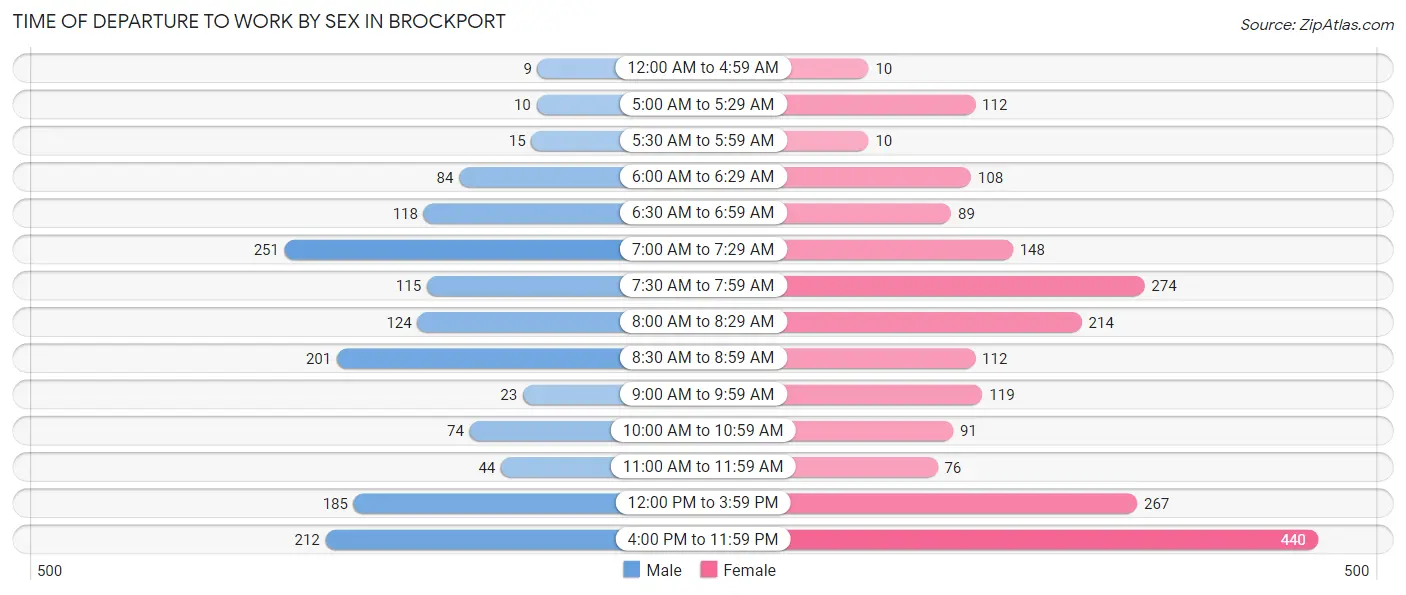
| Time of Departure | Male | Female |
| 12:00 AM to 4:59 AM | 9 (0.6%) | 10 (0.5%) |
| 5:00 AM to 5:29 AM | 10 (0.7%) | 112 (5.4%) |
| 5:30 AM to 5:59 AM | 15 (1.0%) | 10 (0.5%) |
| 6:00 AM to 6:29 AM | 84 (5.7%) | 108 (5.2%) |
| 6:30 AM to 6:59 AM | 118 (8.1%) | 89 (4.3%) |
| 7:00 AM to 7:29 AM | 251 (17.1%) | 148 (7.1%) |
| 7:30 AM to 7:59 AM | 115 (7.9%) | 274 (13.2%) |
| 8:00 AM to 8:29 AM | 124 (8.5%) | 214 (10.3%) |
| 8:30 AM to 8:59 AM | 201 (13.7%) | 112 (5.4%) |
| 9:00 AM to 9:59 AM | 23 (1.6%) | 119 (5.8%) |
| 10:00 AM to 10:59 AM | 74 (5.1%) | 91 (4.4%) |
| 11:00 AM to 11:59 AM | 44 (3.0%) | 76 (3.7%) |
| 12:00 PM to 3:59 PM | 185 (12.6%) | 267 (12.9%) |
| 4:00 PM to 11:59 PM | 212 (14.5%) | 440 (21.3%) |
| Total | 1,465 (100.0%) | 2,070 (100.0%) |
Housing Occupancy in Brockport
Occupancy by Ownership in Brockport
Of the total 2,144 dwellings in Brockport, owner-occupied units account for 1,021 (47.6%), while renter-occupied units make up 1,123 (52.4%).
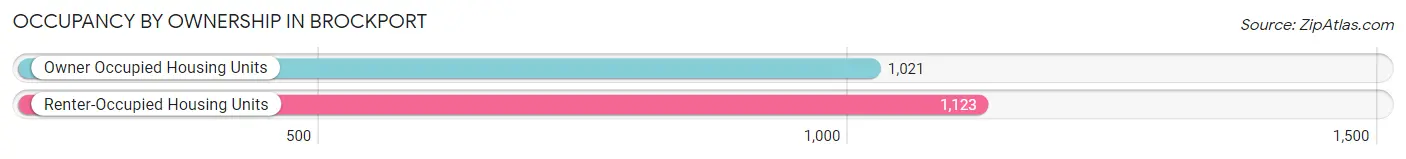
| Occupancy | # Housing Units | % Housing Units |
| Owner Occupied Housing Units | 1,021 | 47.6% |
| Renter-Occupied Housing Units | 1,123 | 52.4% |
| Total Occupied Housing Units | 2,144 | 100.0% |
Occupancy by Household Size in Brockport
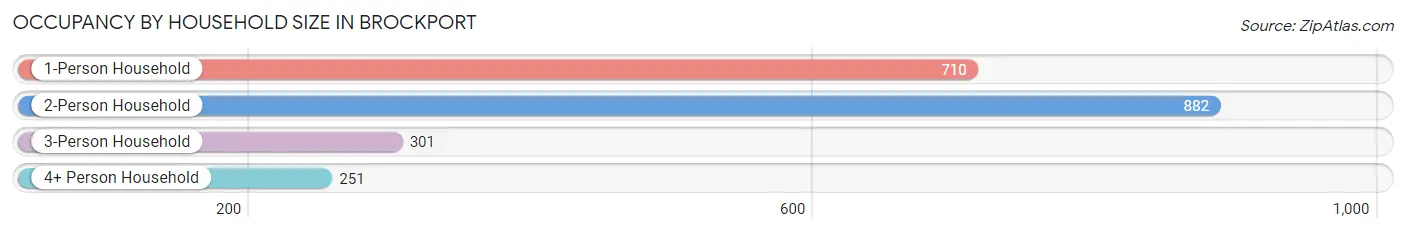
| Household Size | # Housing Units | % Housing Units |
| 1-Person Household | 710 | 33.1% |
| 2-Person Household | 882 | 41.1% |
| 3-Person Household | 301 | 14.0% |
| 4+ Person Household | 251 | 11.7% |
| Total Housing Units | 2,144 | 100.0% |
Occupancy by Ownership by Household Size in Brockport
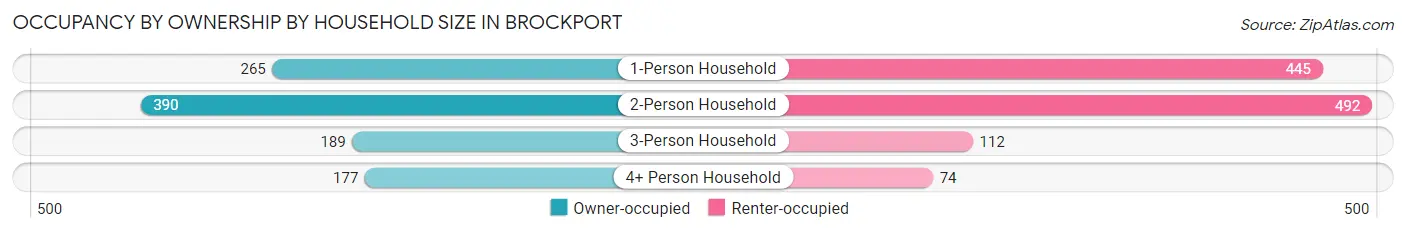
| Household Size | Owner-occupied | Renter-occupied |
| 1-Person Household | 265 (37.3%) | 445 (62.7%) |
| 2-Person Household | 390 (44.2%) | 492 (55.8%) |
| 3-Person Household | 189 (62.8%) | 112 (37.2%) |
| 4+ Person Household | 177 (70.5%) | 74 (29.5%) |
| Total Housing Units | 1,021 (47.6%) | 1,123 (52.4%) |
Occupancy by Educational Attainment in Brockport
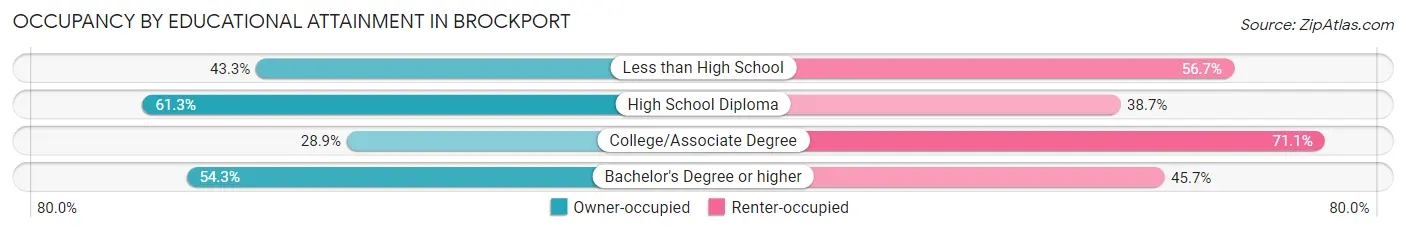
| Household Size | Owner-occupied | Renter-occupied |
| Less than High School | 29 (43.3%) | 38 (56.7%) |
| High School Diploma | 396 (61.3%) | 250 (38.7%) |
| College/Associate Degree | 206 (28.9%) | 507 (71.1%) |
| Bachelor's Degree or higher | 390 (54.3%) | 328 (45.7%) |
Occupancy by Age of Householder in Brockport
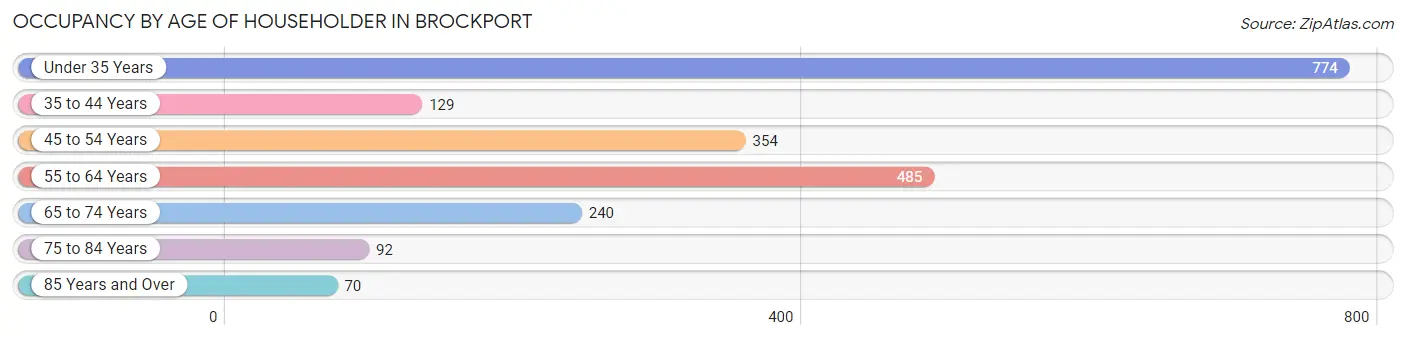
| Age Bracket | # Households | % Households |
| Under 35 Years | 774 | 36.1% |
| 35 to 44 Years | 129 | 6.0% |
| 45 to 54 Years | 354 | 16.5% |
| 55 to 64 Years | 485 | 22.6% |
| 65 to 74 Years | 240 | 11.2% |
| 75 to 84 Years | 92 | 4.3% |
| 85 Years and Over | 70 | 3.3% |
| Total | 2,144 | 100.0% |
Housing Finances in Brockport
Median Income by Occupancy in Brockport
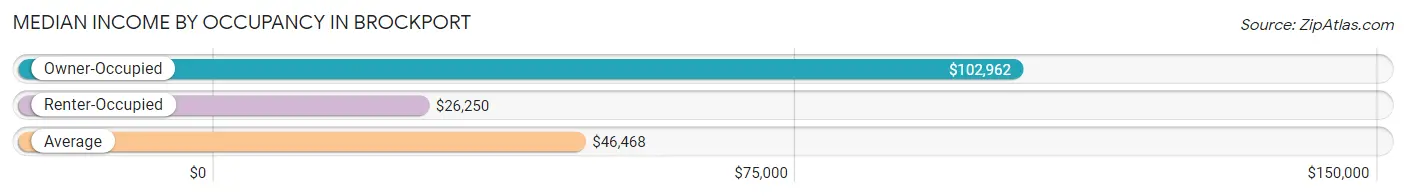
| Occupancy Type | # Households | Median Income |
| Owner-Occupied | 1,021 (47.6%) | $102,962 |
| Renter-Occupied | 1,123 (52.4%) | $26,250 |
| Average | 2,144 (100.0%) | $46,468 |
Occupancy by Householder Income Bracket in Brockport
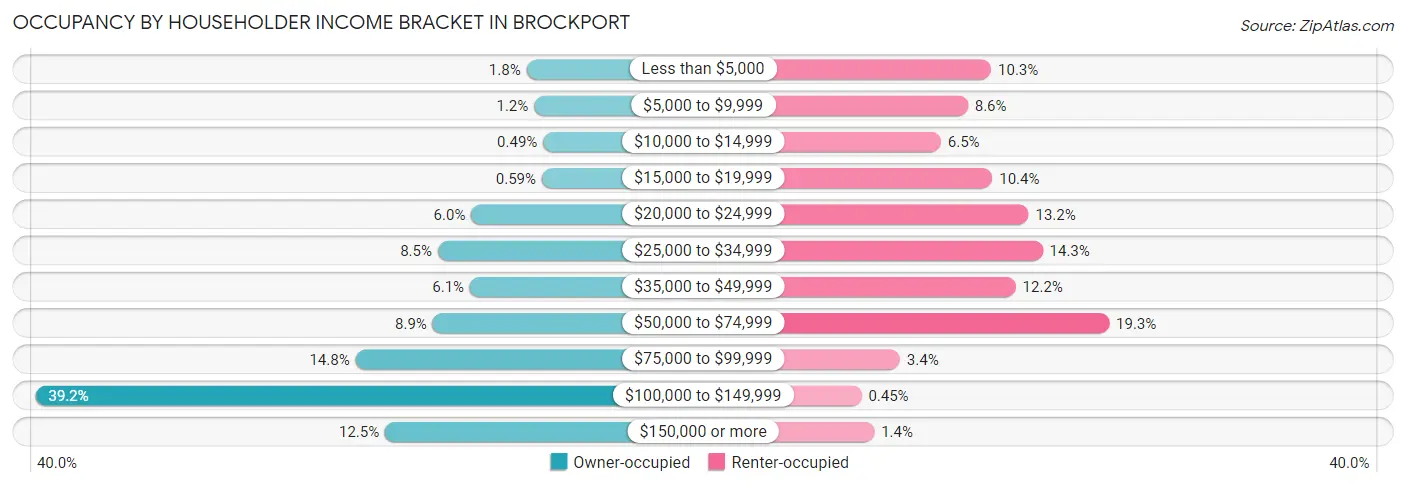
| Income Bracket | Owner-occupied | Renter-occupied |
| Less than $5,000 | 18 (1.8%) | 116 (10.3%) |
| $5,000 to $9,999 | 12 (1.2%) | 96 (8.6%) |
| $10,000 to $14,999 | 5 (0.5%) | 73 (6.5%) |
| $15,000 to $19,999 | 6 (0.6%) | 117 (10.4%) |
| $20,000 to $24,999 | 61 (6.0%) | 148 (13.2%) |
| $25,000 to $34,999 | 87 (8.5%) | 160 (14.2%) |
| $35,000 to $49,999 | 62 (6.1%) | 137 (12.2%) |
| $50,000 to $74,999 | 91 (8.9%) | 217 (19.3%) |
| $75,000 to $99,999 | 151 (14.8%) | 38 (3.4%) |
| $100,000 to $149,999 | 400 (39.2%) | 5 (0.4%) |
| $150,000 or more | 128 (12.5%) | 16 (1.4%) |
| Total | 1,021 (100.0%) | 1,123 (100.0%) |
Monthly Housing Cost Tiers in Brockport
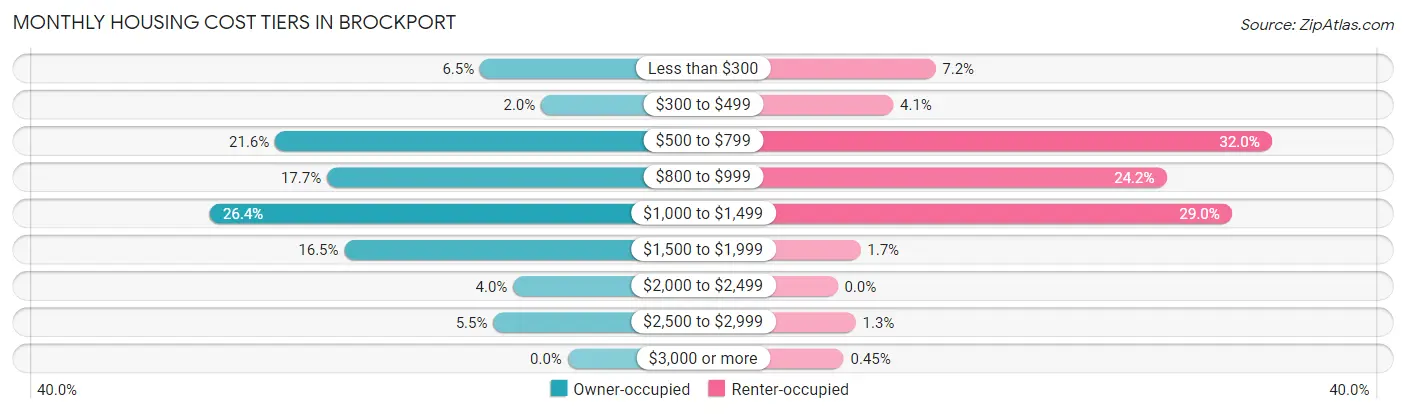
| Monthly Cost | Owner-occupied | Renter-occupied |
| Less than $300 | 66 (6.5%) | 81 (7.2%) |
| $300 to $499 | 20 (2.0%) | 46 (4.1%) |
| $500 to $799 | 220 (21.5%) | 359 (32.0%) |
| $800 to $999 | 181 (17.7%) | 272 (24.2%) |
| $1,000 to $1,499 | 269 (26.4%) | 326 (29.0%) |
| $1,500 to $1,999 | 168 (16.5%) | 19 (1.7%) |
| $2,000 to $2,499 | 41 (4.0%) | 0 (0.0%) |
| $2,500 to $2,999 | 56 (5.5%) | 15 (1.3%) |
| $3,000 or more | 0 (0.0%) | 5 (0.4%) |
| Total | 1,021 (100.0%) | 1,123 (100.0%) |
Physical Housing Characteristics in Brockport
Housing Structures in Brockport
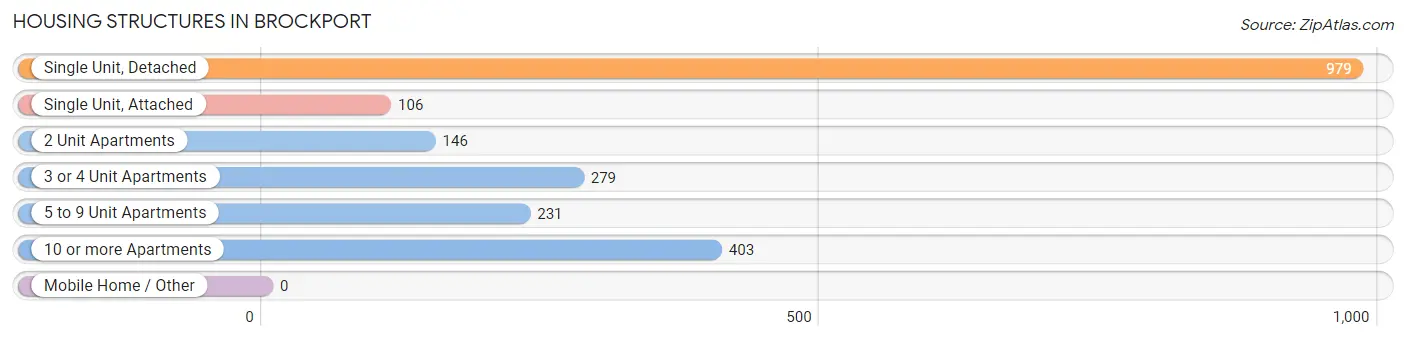
| Structure Type | # Housing Units | % Housing Units |
| Single Unit, Detached | 979 | 45.7% |
| Single Unit, Attached | 106 | 4.9% |
| 2 Unit Apartments | 146 | 6.8% |
| 3 or 4 Unit Apartments | 279 | 13.0% |
| 5 to 9 Unit Apartments | 231 | 10.8% |
| 10 or more Apartments | 403 | 18.8% |
| Mobile Home / Other | 0 | 0.0% |
| Total | 2,144 | 100.0% |
Housing Structures by Occupancy in Brockport
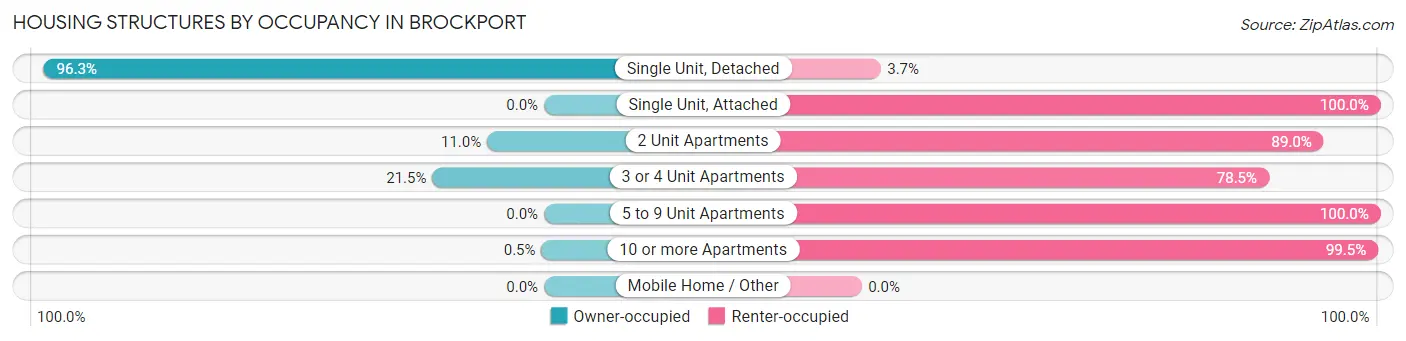
| Structure Type | Owner-occupied | Renter-occupied |
| Single Unit, Detached | 943 (96.3%) | 36 (3.7%) |
| Single Unit, Attached | 0 (0.0%) | 106 (100.0%) |
| 2 Unit Apartments | 16 (11.0%) | 130 (89.0%) |
| 3 or 4 Unit Apartments | 60 (21.5%) | 219 (78.5%) |
| 5 to 9 Unit Apartments | 0 (0.0%) | 231 (100.0%) |
| 10 or more Apartments | 2 (0.5%) | 401 (99.5%) |
| Mobile Home / Other | 0 (0.0%) | 0 (0.0%) |
| Total | 1,021 (47.6%) | 1,123 (52.4%) |
Housing Structures by Number of Rooms in Brockport
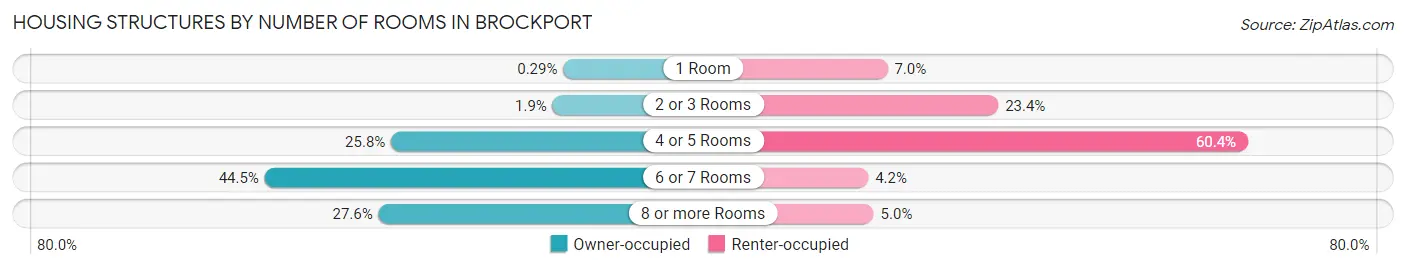
| Number of Rooms | Owner-occupied | Renter-occupied |
| 1 Room | 3 (0.3%) | 79 (7.0%) |
| 2 or 3 Rooms | 19 (1.9%) | 263 (23.4%) |
| 4 or 5 Rooms | 263 (25.8%) | 678 (60.4%) |
| 6 or 7 Rooms | 454 (44.5%) | 47 (4.2%) |
| 8 or more Rooms | 282 (27.6%) | 56 (5.0%) |
| Total | 1,021 (100.0%) | 1,123 (100.0%) |
Housing Structure by Heating Type in Brockport
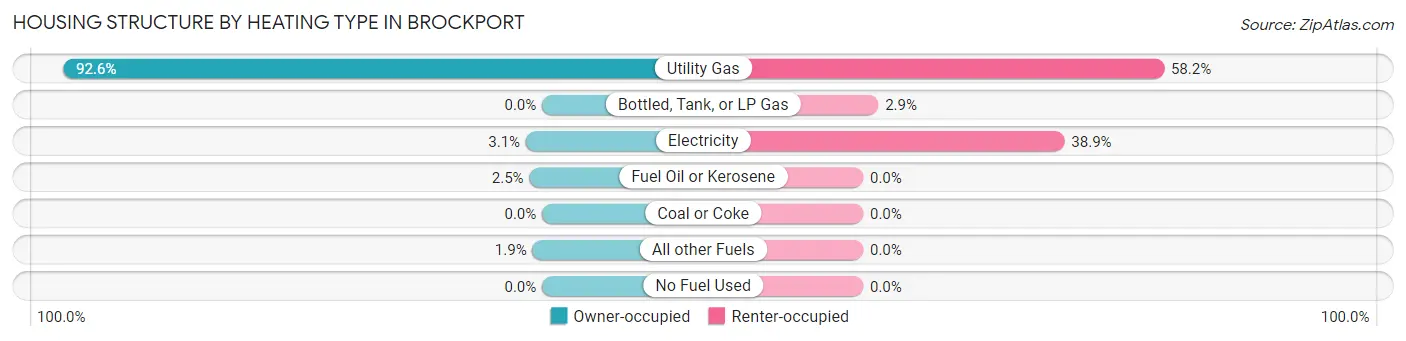
| Heating Type | Owner-occupied | Renter-occupied |
| Utility Gas | 945 (92.6%) | 653 (58.2%) |
| Bottled, Tank, or LP Gas | 0 (0.0%) | 33 (2.9%) |
| Electricity | 32 (3.1%) | 437 (38.9%) |
| Fuel Oil or Kerosene | 25 (2.5%) | 0 (0.0%) |
| Coal or Coke | 0 (0.0%) | 0 (0.0%) |
| All other Fuels | 19 (1.9%) | 0 (0.0%) |
| No Fuel Used | 0 (0.0%) | 0 (0.0%) |
| Total | 1,021 (100.0%) | 1,123 (100.0%) |
Household Vehicle Usage in Brockport
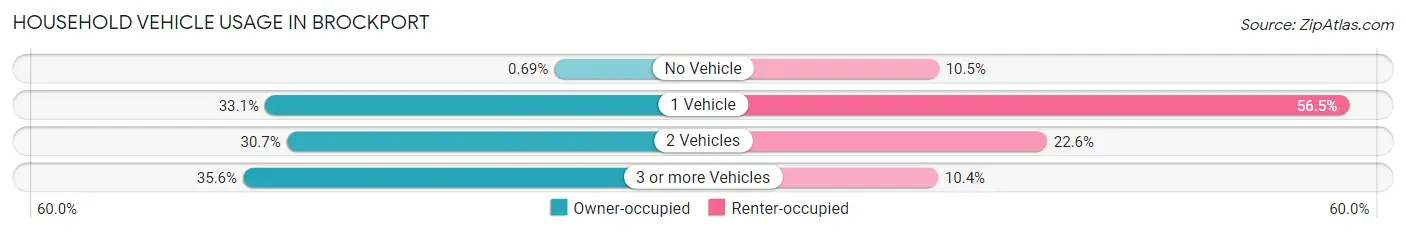
| Vehicles per Household | Owner-occupied | Renter-occupied |
| No Vehicle | 7 (0.7%) | 118 (10.5%) |
| 1 Vehicle | 338 (33.1%) | 634 (56.5%) |
| 2 Vehicles | 313 (30.7%) | 254 (22.6%) |
| 3 or more Vehicles | 363 (35.5%) | 117 (10.4%) |
| Total | 1,021 (100.0%) | 1,123 (100.0%) |
Real Estate & Mortgages in Brockport
Real Estate and Mortgage Overview in Brockport
| Characteristic | Without Mortgage | With Mortgage |
| Housing Units | 353 | 668 |
| Median Property Value | $107,500 | $130,000 |
| Median Household Income | $91,971 | $81 |
| Monthly Housing Costs | $652 | $0 |
| Real Estate Taxes | $4,152 | $23 |
Property Value by Mortgage Status in Brockport
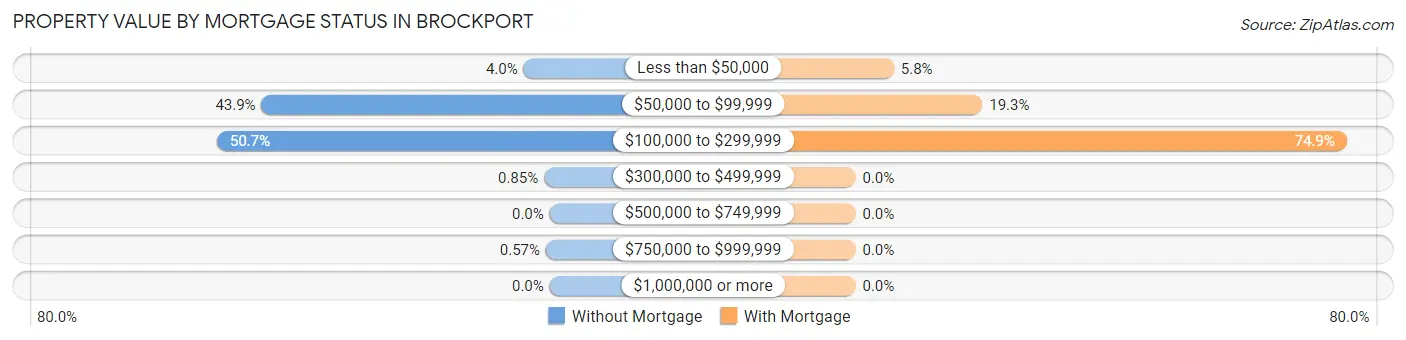
| Property Value | Without Mortgage | With Mortgage |
| Less than $50,000 | 14 (4.0%) | 39 (5.8%) |
| $50,000 to $99,999 | 155 (43.9%) | 129 (19.3%) |
| $100,000 to $299,999 | 179 (50.7%) | 500 (74.9%) |
| $300,000 to $499,999 | 3 (0.9%) | 0 (0.0%) |
| $500,000 to $749,999 | 0 (0.0%) | 0 (0.0%) |
| $750,000 to $999,999 | 2 (0.6%) | 0 (0.0%) |
| $1,000,000 or more | 0 (0.0%) | 0 (0.0%) |
| Total | 353 (100.0%) | 668 (100.0%) |
Household Income by Mortgage Status in Brockport
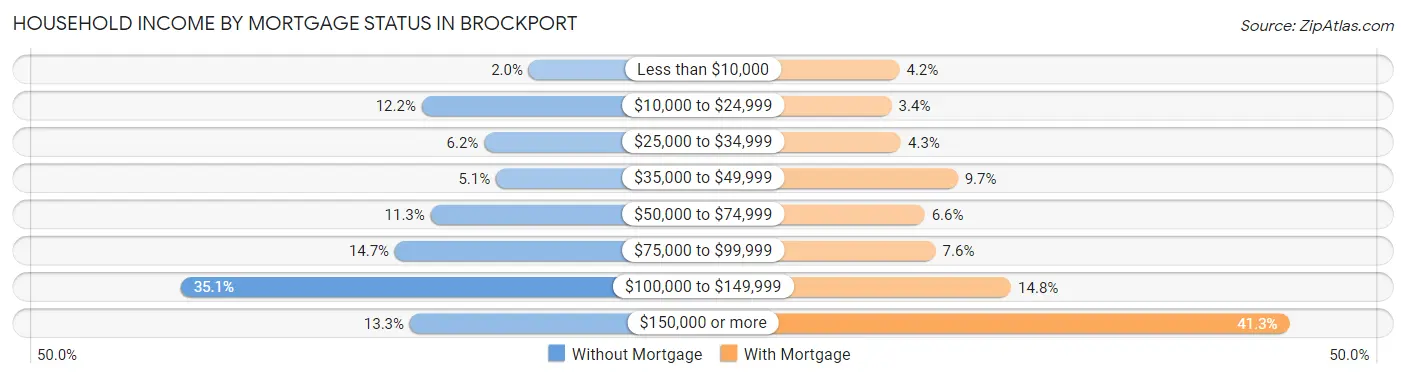
| Household Income | Without Mortgage | With Mortgage |
| Less than $10,000 | 7 (2.0%) | 28 (4.2%) |
| $10,000 to $24,999 | 43 (12.2%) | 23 (3.4%) |
| $25,000 to $34,999 | 22 (6.2%) | 29 (4.3%) |
| $35,000 to $49,999 | 18 (5.1%) | 65 (9.7%) |
| $50,000 to $74,999 | 40 (11.3%) | 44 (6.6%) |
| $75,000 to $99,999 | 52 (14.7%) | 51 (7.6%) |
| $100,000 to $149,999 | 124 (35.1%) | 99 (14.8%) |
| $150,000 or more | 47 (13.3%) | 276 (41.3%) |
| Total | 353 (100.0%) | 668 (100.0%) |
Property Value to Household Income Ratio in Brockport
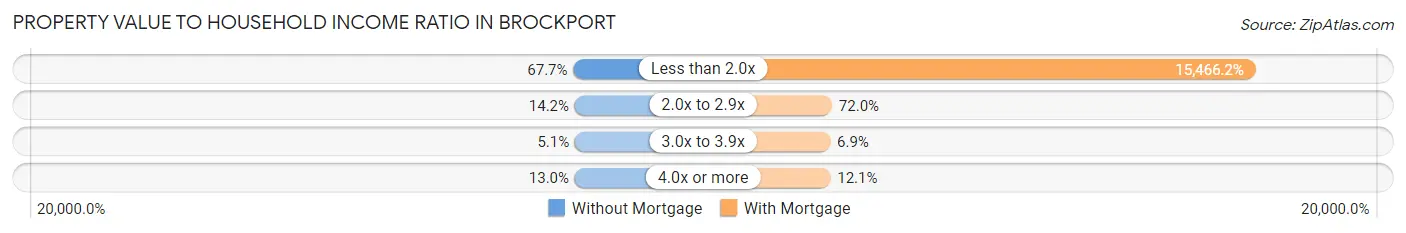
| Value-to-Income Ratio | Without Mortgage | With Mortgage |
| Less than 2.0x | 239 (67.7%) | 103,314 (15,466.2%) |
| 2.0x to 2.9x | 50 (14.2%) | 481 (72.0%) |
| 3.0x to 3.9x | 18 (5.1%) | 46 (6.9%) |
| 4.0x or more | 46 (13.0%) | 81 (12.1%) |
| Total | 353 (100.0%) | 668 (100.0%) |
Real Estate Taxes by Mortgage Status in Brockport
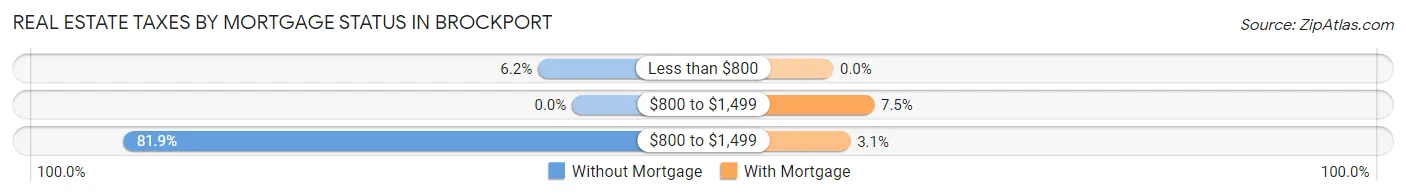
| Property Taxes | Without Mortgage | With Mortgage |
| Less than $800 | 22 (6.2%) | 0 (0.0%) |
| $800 to $1,499 | 0 (0.0%) | 50 (7.5%) |
| $800 to $1,499 | 289 (81.9%) | 21 (3.1%) |
| Total | 353 (100.0%) | 668 (100.0%) |
Health & Disability in Brockport
Health Insurance Coverage by Age in Brockport
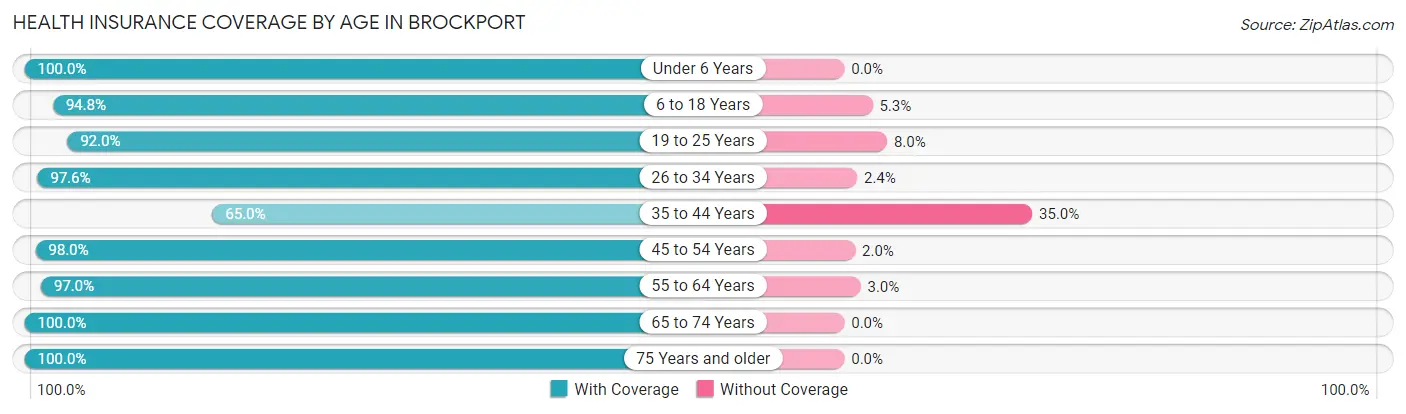
| Age Bracket | With Coverage | Without Coverage |
| Under 6 Years | 100 (100.0%) | 0 (0.0%) |
| 6 to 18 Years | 1,065 (94.8%) | 59 (5.2%) |
| 19 to 25 Years | 2,727 (92.0%) | 236 (8.0%) |
| 26 to 34 Years | 614 (97.6%) | 15 (2.4%) |
| 35 to 44 Years | 206 (65.0%) | 111 (35.0%) |
| 45 to 54 Years | 682 (98.0%) | 14 (2.0%) |
| 55 to 64 Years | 608 (97.0%) | 19 (3.0%) |
| 65 to 74 Years | 344 (100.0%) | 0 (0.0%) |
| 75 Years and older | 267 (100.0%) | 0 (0.0%) |
| Total | 6,613 (93.6%) | 454 (6.4%) |
Health Insurance Coverage by Citizenship Status in Brockport
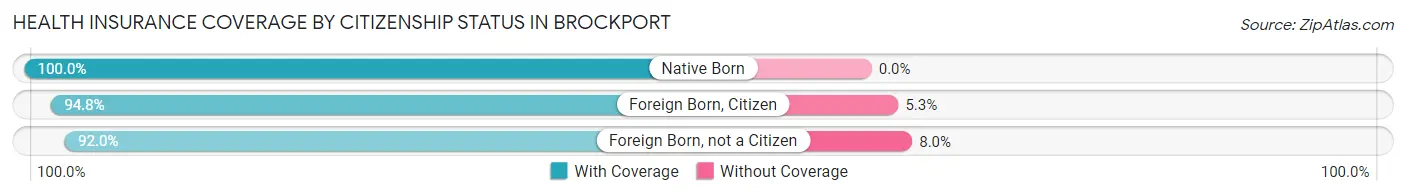
| Citizenship Status | With Coverage | Without Coverage |
| Native Born | 100 (100.0%) | 0 (0.0%) |
| Foreign Born, Citizen | 1,065 (94.8%) | 59 (5.2%) |
| Foreign Born, not a Citizen | 2,727 (92.0%) | 236 (8.0%) |
Health Insurance Coverage by Household Income in Brockport
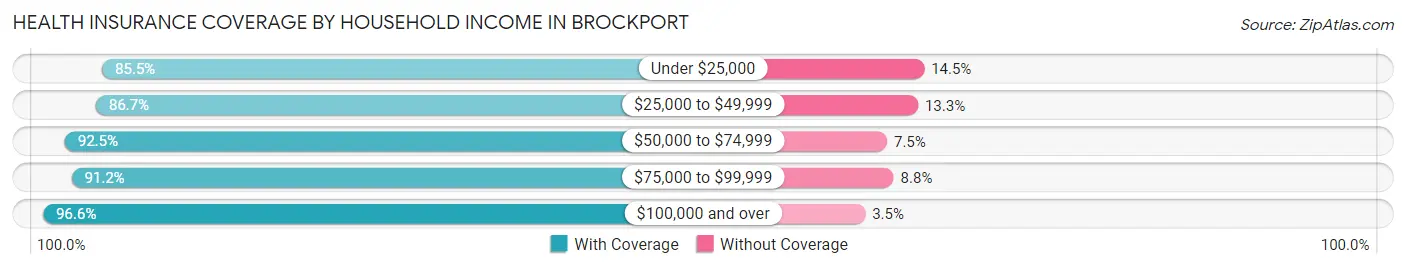
| Household Income | With Coverage | Without Coverage |
| Under $25,000 | 985 (85.5%) | 167 (14.5%) |
| $25,000 to $49,999 | 526 (86.7%) | 81 (13.3%) |
| $50,000 to $74,999 | 638 (92.5%) | 52 (7.5%) |
| $75,000 to $99,999 | 405 (91.2%) | 39 (8.8%) |
| $100,000 and over | 1,734 (96.6%) | 62 (3.5%) |
Public vs Private Health Insurance Coverage by Age in Brockport
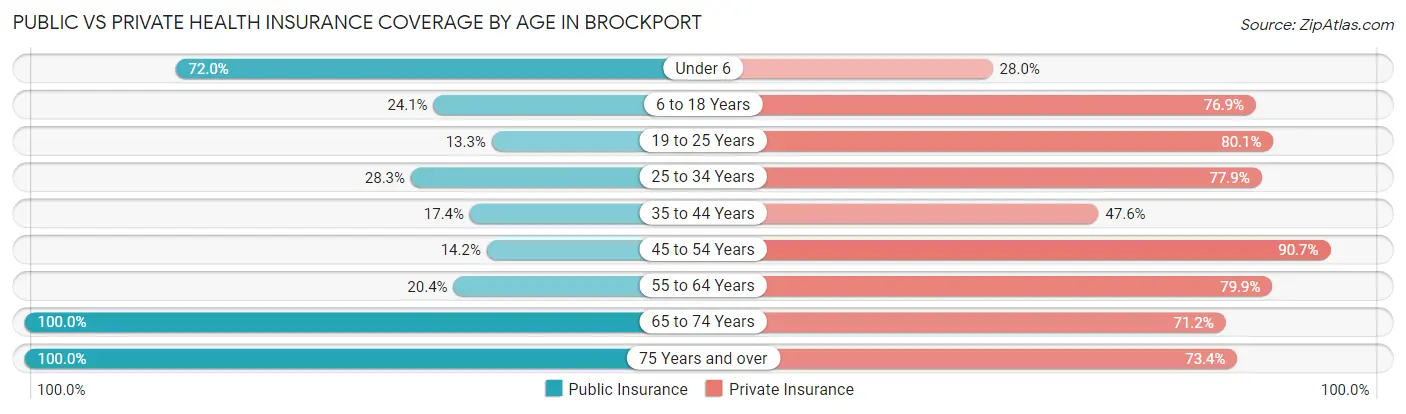
| Age Bracket | Public Insurance | Private Insurance |
| Under 6 | 72 (72.0%) | 28 (28.0%) |
| 6 to 18 Years | 271 (24.1%) | 864 (76.9%) |
| 19 to 25 Years | 394 (13.3%) | 2,373 (80.1%) |
| 25 to 34 Years | 178 (28.3%) | 490 (77.9%) |
| 35 to 44 Years | 55 (17.3%) | 151 (47.6%) |
| 45 to 54 Years | 99 (14.2%) | 631 (90.7%) |
| 55 to 64 Years | 128 (20.4%) | 501 (79.9%) |
| 65 to 74 Years | 344 (100.0%) | 245 (71.2%) |
| 75 Years and over | 267 (100.0%) | 196 (73.4%) |
| Total | 1,808 (25.6%) | 5,479 (77.5%) |
Disability Status by Sex by Age in Brockport
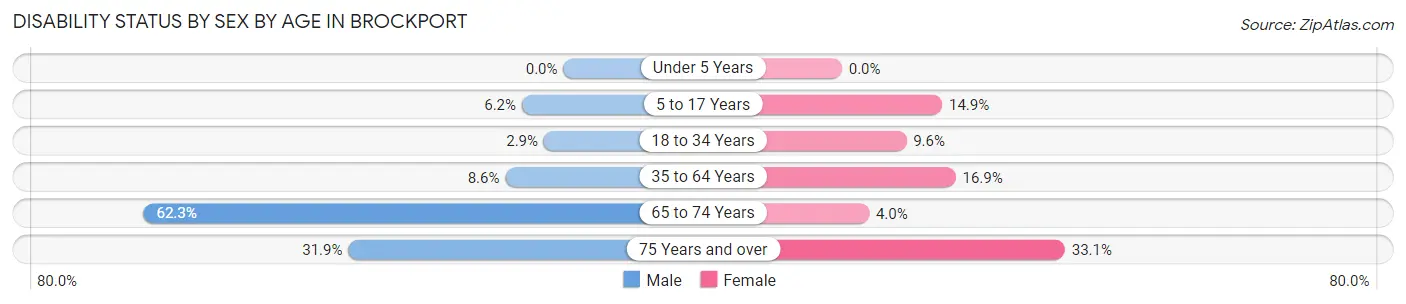
| Age Bracket | Male | Female |
| Under 5 Years | 0 (0.0%) | 0 (0.0%) |
| 5 to 17 Years | 13 (6.2%) | 35 (14.9%) |
| 18 to 34 Years | 59 (2.9%) | 213 (9.6%) |
| 35 to 64 Years | 50 (8.6%) | 179 (16.9%) |
| 65 to 74 Years | 91 (62.3%) | 8 (4.0%) |
| 75 Years and over | 38 (31.9%) | 49 (33.1%) |
Disability Class by Sex by Age in Brockport
Disability Class: Hearing Difficulty
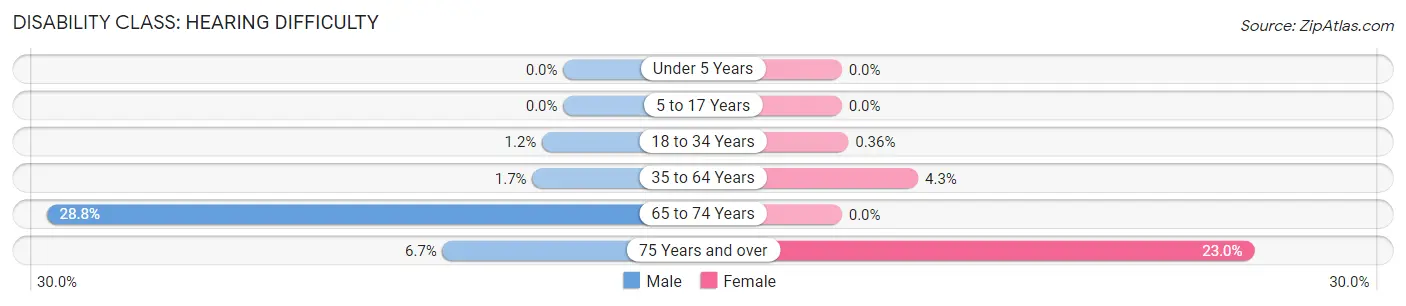
| Age Bracket | Male | Female |
| Under 5 Years | 0 (0.0%) | 0 (0.0%) |
| 5 to 17 Years | 0 (0.0%) | 0 (0.0%) |
| 18 to 34 Years | 24 (1.2%) | 8 (0.4%) |
| 35 to 64 Years | 10 (1.7%) | 45 (4.3%) |
| 65 to 74 Years | 42 (28.8%) | 0 (0.0%) |
| 75 Years and over | 8 (6.7%) | 34 (23.0%) |
Disability Class: Vision Difficulty
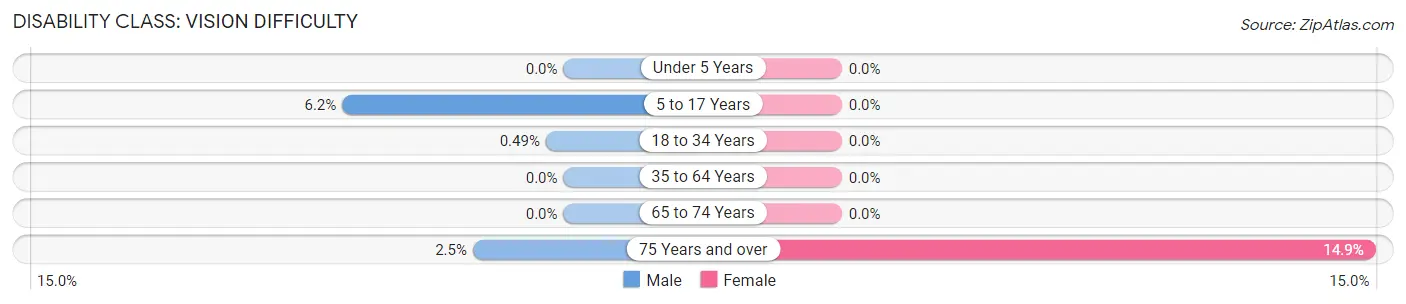
| Age Bracket | Male | Female |
| Under 5 Years | 0 (0.0%) | 0 (0.0%) |
| 5 to 17 Years | 13 (6.2%) | 0 (0.0%) |
| 18 to 34 Years | 10 (0.5%) | 0 (0.0%) |
| 35 to 64 Years | 0 (0.0%) | 0 (0.0%) |
| 65 to 74 Years | 0 (0.0%) | 0 (0.0%) |
| 75 Years and over | 3 (2.5%) | 22 (14.9%) |
Disability Class: Cognitive Difficulty
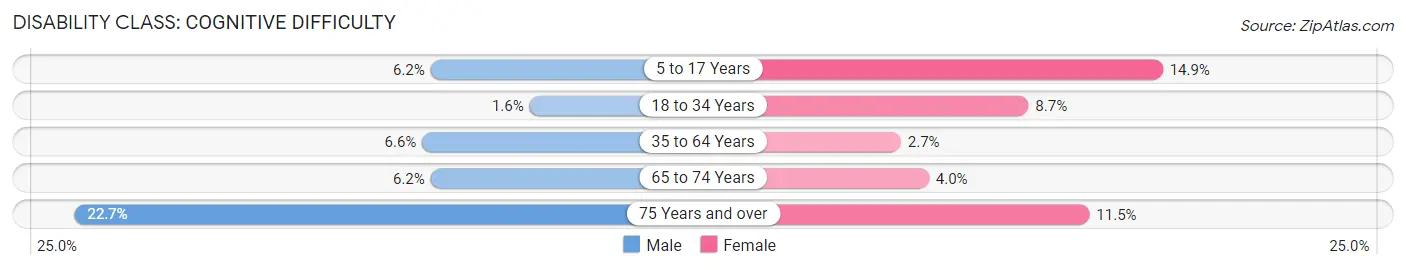
| Age Bracket | Male | Female |
| 5 to 17 Years | 13 (6.2%) | 35 (14.9%) |
| 18 to 34 Years | 32 (1.6%) | 193 (8.7%) |
| 35 to 64 Years | 38 (6.6%) | 29 (2.7%) |
| 65 to 74 Years | 9 (6.2%) | 8 (4.0%) |
| 75 Years and over | 27 (22.7%) | 17 (11.5%) |
Disability Class: Ambulatory Difficulty
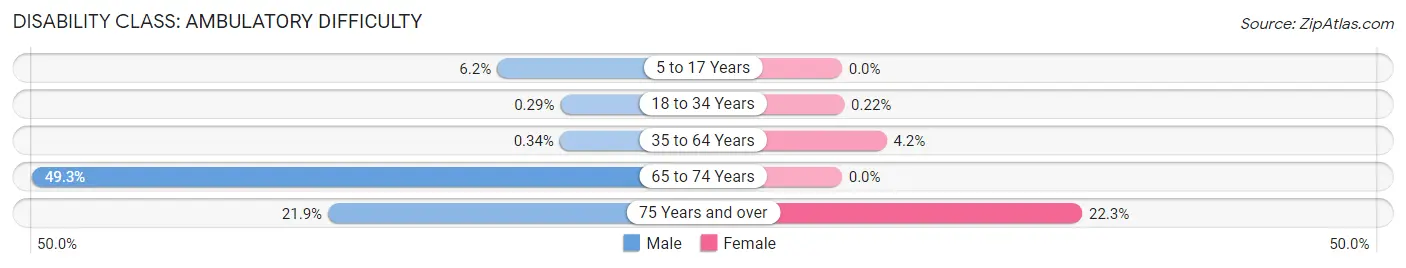
| Age Bracket | Male | Female |
| 5 to 17 Years | 13 (6.2%) | 0 (0.0%) |
| 18 to 34 Years | 6 (0.3%) | 5 (0.2%) |
| 35 to 64 Years | 2 (0.3%) | 44 (4.2%) |
| 65 to 74 Years | 72 (49.3%) | 0 (0.0%) |
| 75 Years and over | 26 (21.8%) | 33 (22.3%) |
Disability Class: Self-Care Difficulty
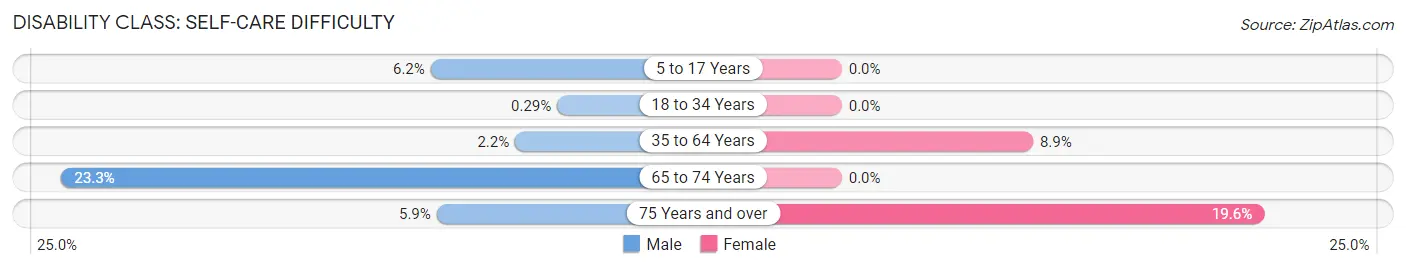
| Age Bracket | Male | Female |
| 5 to 17 Years | 13 (6.2%) | 0 (0.0%) |
| 18 to 34 Years | 6 (0.3%) | 0 (0.0%) |
| 35 to 64 Years | 13 (2.2%) | 94 (8.9%) |
| 65 to 74 Years | 34 (23.3%) | 0 (0.0%) |
| 75 Years and over | 7 (5.9%) | 29 (19.6%) |
Technology Access in Brockport
Computing Device Access in Brockport
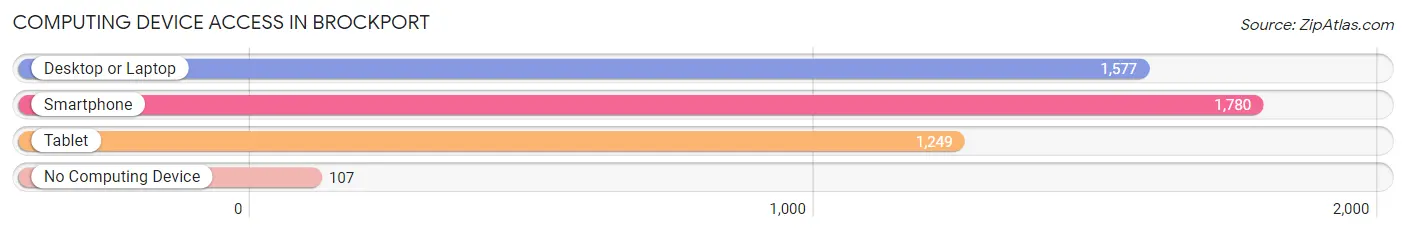
| Device Type | # Households | % Households |
| Desktop or Laptop | 1,577 | 73.6% |
| Smartphone | 1,780 | 83.0% |
| Tablet | 1,249 | 58.3% |
| No Computing Device | 107 | 5.0% |
| Total | 2,144 | 100.0% |
Internet Access in Brockport
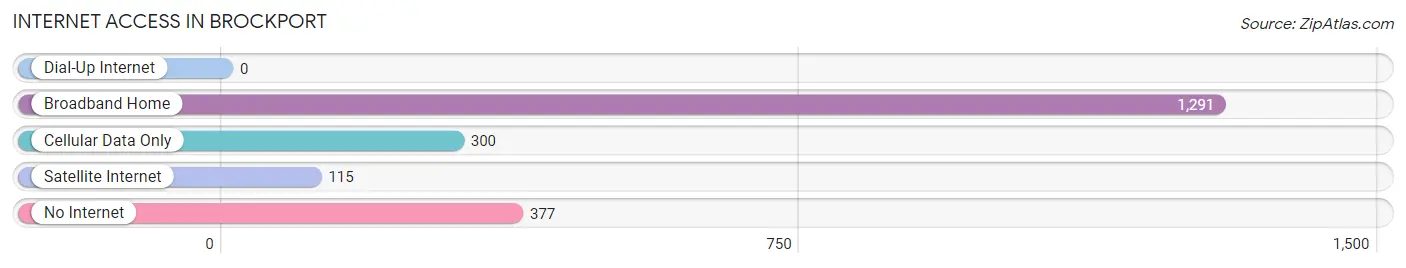
| Internet Type | # Households | % Households |
| Dial-Up Internet | 0 | 0.0% |
| Broadband Home | 1,291 | 60.2% |
| Cellular Data Only | 300 | 14.0% |
| Satellite Internet | 115 | 5.4% |
| No Internet | 377 | 17.6% |
| Total | 2,144 | 100.0% |
Brockport Summary
Brockport, NY is a village located in the town of Sweden in Monroe County, New York. It is situated on the Erie Canal and is part of the Rochester metropolitan area. The village has a population of 8,336 as of the 2010 census.
History
The area that is now Brockport was originally inhabited by the Seneca Nation of the Iroquois Confederacy. The first European settlers arrived in the area in the late 18th century. The village was founded in 1823 by Heil Brockway, a local landowner. The village was named after him and was incorporated in 1829.
In the 19th century, Brockport was an important stop on the Erie Canal. The canal was a major transportation route for goods and people, and Brockport was a major port of call for canal boats. The village was also a center of industry, with several mills and factories located in the area.
Geography
Brockport is located in western Monroe County, New York. It is situated on the Erie Canal, which runs through the village. The village is bordered by the towns of Sweden to the north, Clarkson to the east, and Parma to the south. The village is located approximately 20 miles west of Rochester.
The village has a total area of 2.2 square miles, all of which is land. The terrain is generally flat, with some rolling hills in the northern part of the village. The village is located in the Finger Lakes region of New York.
Economy
Brockport’s economy is largely based on tourism and education. The village is home to the State University of New York at Brockport, which is a major employer in the area. The university also attracts many visitors to the village.
The village is also home to several small businesses, including restaurants, shops, and other services. The village is also home to several manufacturing companies, including a paper mill and a plastics factory.
Demographics
As of the 2010 census, Brockport had a population of 8,336. The racial makeup of the village was 90.2% White, 4.2% African American, 0.5% Native American, 1.7% Asian, 0.1% Pacific Islander, 1.3% from other races, and 2.0% from two or more races. Hispanic or Latino of any race were 4.2% of the population.
The median household income in Brockport was $45,945, and the median family income was $58,958. About 15.2% of families and 20.2% of the population were below the poverty line, including 28.2% of those under age 18 and 8.2% of those age 65 or over.
Brockport is a diverse community with a rich history and a vibrant economy. The village is home to a major university, several small businesses, and a variety of manufacturing companies. The village is also a popular tourist destination, with many attractions and activities to enjoy.
Common Questions
What is Per Capita Income in Brockport?
Per Capita income in Brockport is $23,044.
What is the Median Family Income in Brockport?
Median Family Income in Brockport is $83,218.
What is the Median Household income in Brockport?
Median Household Income in Brockport is $46,468.
What is Income or Wage Gap in Brockport?
Income or Wage Gap in Brockport is 10.9%.
Women in Brockport earn 89.1 cents for every dollar earned by a man.
What is Inequality or Gini Index in Brockport?
Inequality or Gini Index in Brockport is 0.48.
What is the Total Population of Brockport?
Total Population of Brockport is 7,192.
What is the Total Male Population of Brockport?
Total Male Population of Brockport is 3,192.
What is the Total Female Population of Brockport?
Total Female Population of Brockport is 4,000.
What is the Ratio of Males per 100 Females in Brockport?
There are 79.80 Males per 100 Females in Brockport.
What is the Ratio of Females per 100 Males in Brockport?
There are 125.31 Females per 100 Males in Brockport.
What is the Median Population Age in Brockport?
Median Population Age in Brockport is 22.8 Years.
What is the Average Family Size in Brockport
Average Family Size in Brockport is 2.8 People.
What is the Average Household Size in Brockport
Average Household Size in Brockport is 2.2 People.
How Large is the Labor Force in Brockport?
There are 4,076 People in the Labor Forcein in Brockport.
What is the Percentage of People in the Labor Force in Brockport?
60.4% of People are in the Labor Force in Brockport.
What is the Unemployment Rate in Brockport?
Unemployment Rate in Brockport is 5.2%.