Zip Codes with the Highest Percentage of Population Employed in Community & Social Service in New York
RELATED REPORTS & OPTIONS
Community & Social Service
New York
Compare Zip Codes
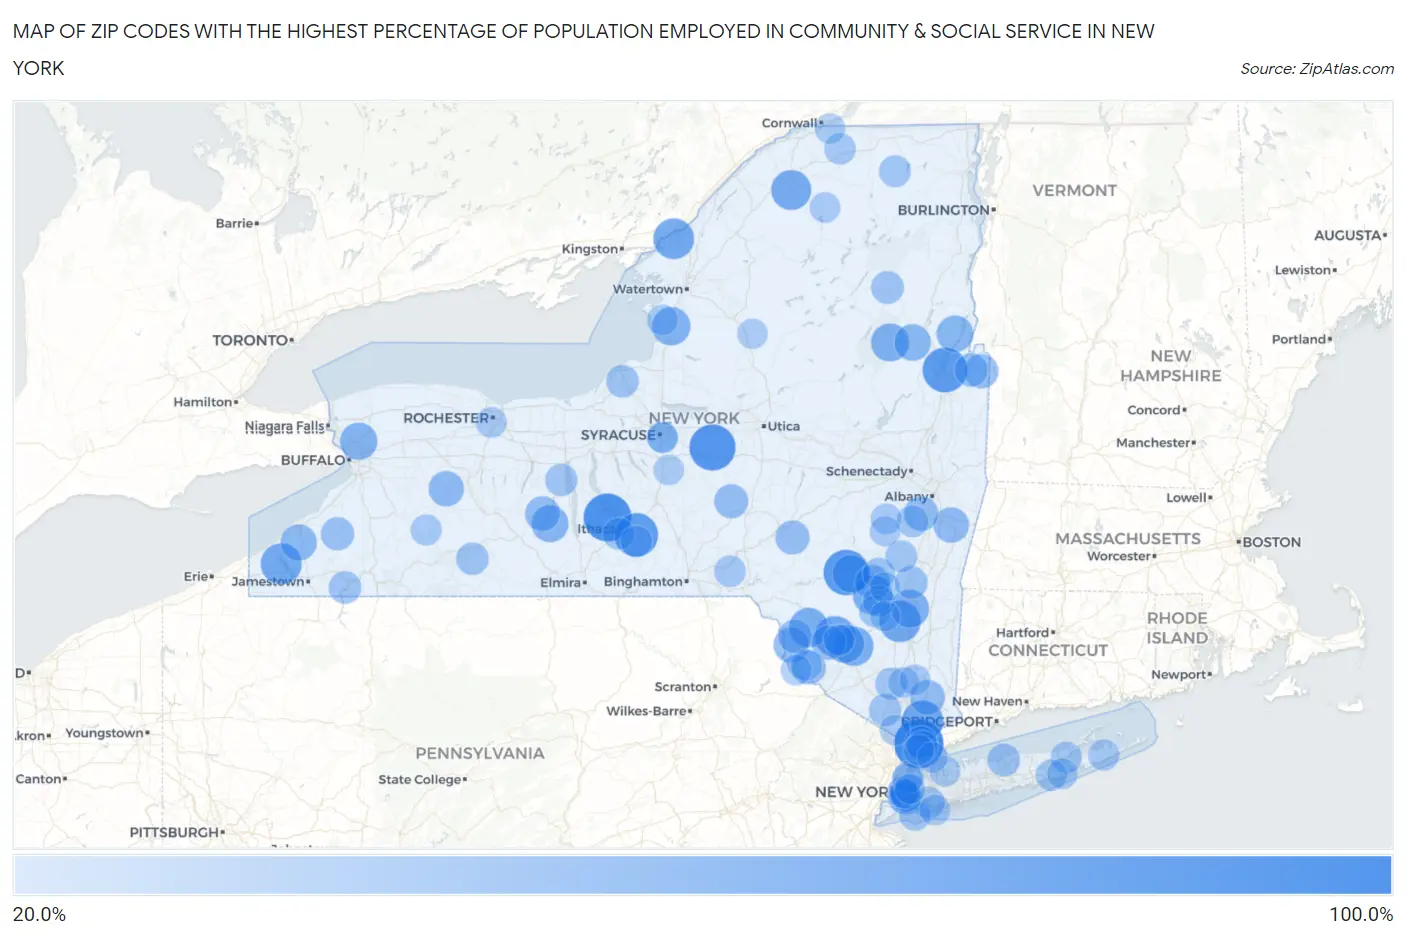
Map of Zip Codes with the Highest Percentage of Population Employed in Community & Social Service in New York
20.0%
100.0%
Zip Codes with the Highest Percentage of Population Employed in Community & Social Service in New York
| Zip Code | % Employed | vs State | vs National | |
| 1. | 10503 | 84.4% | 15.0%(+69.5)#1 | 11.2%(+73.2)#35 |
| 2. | 14854 | 79.1% | 15.0%(+64.1)#2 | 11.2%(+67.9)#43 |
| 3. | 13134 | 74.0% | 15.0%(+59.0)#3 | 11.2%(+62.8)#50 |
| 4. | 12441 | 71.8% | 15.0%(+56.8)#4 | 11.2%(+60.6)#54 |
| 5. | 12820 | 69.6% | 15.0%(+54.6)#5 | 11.2%(+58.4)#58 |
| 6. | 14881 | 66.4% | 15.0%(+51.4)#6 | 11.2%(+55.2)#67 |
| 7. | 12471 | 60.0% | 15.0%(+45.0)#7 | 11.2%(+48.8)#84 |
| 8. | 10545 | 59.7% | 15.0%(+44.7)#8 | 11.2%(+48.5)#86 |
| 9. | 14722 | 58.1% | 15.0%(+43.2)#9 | 11.2%(+46.9)#91 |
| 10. | 13692 | 57.4% | 15.0%(+42.5)#10 | 11.2%(+46.2)#97 |
| 11. | 12733 | 56.9% | 15.0%(+41.9)#11 | 11.2%(+45.6)#103 |
| 12. | 13647 | 55.2% | 15.0%(+40.2)#12 | 11.2%(+44.0)#113 |
| 13. | 12412 | 53.4% | 15.0%(+38.4)#13 | 11.2%(+42.2)#122 |
| 14. | 12483 | 53.3% | 15.0%(+38.4)#14 | 11.2%(+42.1)#123 |
| 15. | 12787 | 52.9% | 15.0%(+38.0)#15 | 11.2%(+41.7)#128 |
| 16. | 12763 | 50.9% | 15.0%(+35.9)#16 | 11.2%(+39.7)#150 |
| 17. | 13674 | 50.0% | 15.0%(+35.0)#17 | 11.2%(+38.8)#158 |
| 18. | 12574 | 49.7% | 15.0%(+34.7)#18 | 11.2%(+38.4)#171 |
| 19. | 12856 | 49.3% | 15.0%(+34.3)#19 | 11.2%(+38.1)#173 |
| 20. | 12465 | 48.3% | 15.0%(+33.3)#20 | 11.2%(+37.1)#178 |
| 21. | 14260 | 47.2% | 15.0%(+32.2)#21 | 11.2%(+36.0)#190 |
| 22. | 14893 | 46.2% | 15.0%(+31.2)#22 | 11.2%(+34.9)#207 |
| 23. | 12886 | 45.3% | 15.0%(+30.4)#23 | 11.2%(+34.1)#219 |
| 24. | 12874 | 45.3% | 15.0%(+30.3)#24 | 11.2%(+34.1)#222 |
| 25. | 14752 | 43.8% | 15.0%(+28.8)#25 | 11.2%(+32.5)#237 |
| 26. | 12752 | 41.8% | 15.0%(+26.8)#26 | 11.2%(+30.6)#266 |
| 27. | 12115 | 41.5% | 15.0%(+26.5)#27 | 11.2%(+30.2)#269 |
| 28. | 14549 | 41.4% | 15.0%(+26.4)#28 | 11.2%(+30.2)#270 |
| 29. | 12416 | 40.6% | 15.0%(+25.7)#29 | 11.2%(+29.4)#276 |
| 30. | 10535 | 40.3% | 15.0%(+25.3)#30 | 11.2%(+29.0)#282 |
| 31. | 14874 | 40.0% | 15.0%(+25.0)#31 | 11.2%(+28.8)#286 |
| 32. | 12751 | 38.8% | 15.0%(+23.9)#32 | 11.2%(+27.6)#306 |
| 33. | 12854 | 38.8% | 15.0%(+23.8)#33 | 11.2%(+27.6)#307 |
| 34. | 12161 | 38.5% | 15.0%(+23.5)#34 | 11.2%(+27.2)#318 |
| 35. | 13806 | 37.6% | 15.0%(+22.6)#35 | 11.2%(+26.4)#336 |
| 36. | 13814 | 37.5% | 15.0%(+22.5)#36 | 11.2%(+26.3)#340 |
| 37. | 12743 | 37.4% | 15.0%(+22.4)#37 | 11.2%(+26.1)#343 |
| 38. | 12750 | 36.4% | 15.0%(+21.4)#38 | 11.2%(+25.1)#367 |
| 39. | 14041 | 35.3% | 15.0%(+20.3)#39 | 11.2%(+24.1)#384 |
| 40. | 12821 | 35.0% | 15.0%(+20.0)#40 | 11.2%(+23.8)#392 |
| 41. | 12453 | 33.9% | 15.0%(+18.9)#41 | 11.2%(+22.7)#418 |
| 42. | 11794 | 33.6% | 15.0%(+18.6)#42 | 11.2%(+22.4)#426 |
| 43. | 12852 | 33.6% | 15.0%(+18.6)#43 | 11.2%(+22.3)#429 |
| 44. | 13115 | 33.3% | 15.0%(+18.4)#44 | 11.2%(+22.1)#435 |
| 45. | 14783 | 33.3% | 15.0%(+18.4)#45 | 11.2%(+22.1)#440 |
| 46. | 10533 | 33.2% | 15.0%(+18.2)#46 | 11.2%(+21.9)#448 |
| 47. | 14803 | 33.0% | 15.0%(+18.0)#47 | 11.2%(+21.7)#452 |
| 48. | 10975 | 32.1% | 15.0%(+17.1)#48 | 11.2%(+20.9)#477 |
| 49. | 14415 | 32.1% | 15.0%(+17.1)#49 | 11.2%(+20.9)#480 |
| 50. | 12577 | 32.0% | 15.0%(+17.0)#50 | 11.2%(+20.8)#483 |
| 51. | 11238 | 31.8% | 15.0%(+16.8)#51 | 11.2%(+20.5)#501 |
| 52. | 11215 | 31.7% | 15.0%(+16.7)#52 | 11.2%(+20.4)#506 |
| 53. | 11231 | 31.6% | 15.0%(+16.6)#53 | 11.2%(+20.4)#508 |
| 54. | 12450 | 31.3% | 15.0%(+16.3)#54 | 11.2%(+20.1)#521 |
| 55. | 12473 | 31.1% | 15.0%(+16.2)#55 | 11.2%(+19.9)#526 |
| 56. | 11430 | 31.1% | 15.0%(+16.1)#56 | 11.2%(+19.9)#530 |
| 57. | 12969 | 30.9% | 15.0%(+15.9)#57 | 11.2%(+19.7)#542 |
| 58. | 14850 | 30.7% | 15.0%(+15.7)#58 | 11.2%(+19.5)#554 |
| 59. | 12007 | 30.5% | 15.0%(+15.5)#59 | 11.2%(+19.3)#562 |
| 60. | 12461 | 30.4% | 15.0%(+15.4)#60 | 11.2%(+19.2)#569 |
| 61. | 13813 | 30.2% | 15.0%(+15.3)#61 | 11.2%(+19.0)#575 |
| 62. | 12481 | 30.2% | 15.0%(+15.3)#62 | 11.2%(+19.0)#576 |
| 63. | 11697 | 30.1% | 15.0%(+15.1)#63 | 11.2%(+18.9)#582 |
| 64. | 14817 | 30.1% | 15.0%(+15.1)#64 | 11.2%(+18.9)#583 |
| 65. | 12957 | 29.8% | 15.0%(+14.8)#65 | 11.2%(+18.6)#599 |
| 66. | 11970 | 29.2% | 15.0%(+14.2)#66 | 11.2%(+18.0)#624 |
| 67. | 12732 | 29.1% | 15.0%(+14.1)#67 | 11.2%(+17.9)#626 |
| 68. | 11972 | 29.1% | 15.0%(+14.1)#68 | 11.2%(+17.9)#627 |
| 69. | 11975 | 28.9% | 15.0%(+14.0)#69 | 11.2%(+17.7)#637 |
| 70. | 10502 | 28.8% | 15.0%(+13.8)#70 | 11.2%(+17.6)#643 |
| 71. | 10012 | 28.7% | 15.0%(+13.8)#71 | 11.2%(+17.5)#650 |
| 72. | 14744 | 28.7% | 15.0%(+13.7)#72 | 11.2%(+17.5)#653 |
| 73. | 11217 | 28.3% | 15.0%(+13.3)#73 | 11.2%(+17.1)#674 |
| 74. | 10027 | 28.3% | 15.0%(+13.3)#74 | 11.2%(+17.1)#675 |
| 75. | 12792 | 28.0% | 15.0%(+13.0)#75 | 11.2%(+16.8)#691 |
| 76. | 11509 | 28.0% | 15.0%(+13.0)#76 | 11.2%(+16.7)#694 |
| 77. | 13210 | 27.8% | 15.0%(+12.8)#77 | 11.2%(+16.6)#703 |
| 78. | 12147 | 27.8% | 15.0%(+12.8)#78 | 11.2%(+16.6)#705 |
| 79. | 14627 | 27.8% | 15.0%(+12.8)#79 | 11.2%(+16.6)#706 |
| 80. | 12789 | 27.8% | 15.0%(+12.8)#80 | 11.2%(+16.5)#711 |
| 81. | 13611 | 27.7% | 15.0%(+12.7)#81 | 11.2%(+16.5)#713 |
| 82. | 12520 | 27.6% | 15.0%(+12.6)#82 | 11.2%(+16.4)#720 |
| 83. | 10006 | 27.6% | 15.0%(+12.6)#83 | 11.2%(+16.4)#725 |
| 84. | 10516 | 27.5% | 15.0%(+12.5)#84 | 11.2%(+16.3)#729 |
| 85. | 10025 | 27.4% | 15.0%(+12.4)#85 | 11.2%(+16.2)#733 |
| 86. | 11579 | 27.3% | 15.0%(+12.4)#86 | 11.2%(+16.1)#737 |
| 87. | 10952 | 27.2% | 15.0%(+12.2)#87 | 11.2%(+16.0)#744 |
| 88. | 10538 | 27.2% | 15.0%(+12.2)#88 | 11.2%(+16.0)#750 |
| 89. | 10706 | 27.1% | 15.0%(+12.2)#89 | 11.2%(+15.9)#758 |
| 90. | 13672 | 27.0% | 15.0%(+12.1)#90 | 11.2%(+15.8)#765 |
| 91. | 13244 | 27.0% | 15.0%(+12.1)#91 | 11.2%(+15.8)#768 |
| 92. | 11959 | 27.0% | 15.0%(+12.0)#92 | 11.2%(+15.8)#776 |
| 93. | 12460 | 26.9% | 15.0%(+11.9)#93 | 11.2%(+15.6)#792 |
| 94. | 13655 | 26.8% | 15.0%(+11.8)#94 | 11.2%(+15.6)#799 |
| 95. | 13020 | 26.5% | 15.0%(+11.6)#95 | 11.2%(+15.3)#819 |
| 96. | 13345 | 26.4% | 15.0%(+11.4)#96 | 11.2%(+15.2)#830 |
| 97. | 12409 | 26.3% | 15.0%(+11.3)#97 | 11.2%(+15.1)#837 |
| 98. | 11201 | 26.3% | 15.0%(+11.3)#98 | 11.2%(+15.1)#839 |
| 99. | 12484 | 26.3% | 15.0%(+11.3)#99 | 11.2%(+15.0)#841 |
| 100. | 11222 | 26.2% | 15.0%(+11.3)#100 | 11.2%(+15.0)#845 |
Common Questions
What are the Top 10 Zip Codes with the Highest Percentage of Population Employed in Community & Social Service in New York?
Top 10 Zip Codes with the Highest Percentage of Population Employed in Community & Social Service in New York are:
What zip code has the Highest Percentage of Population Employed in Community & Social Service in New York?
10503 has the Highest Percentage of Population Employed in Community & Social Service in New York with 84.4%.
What is the Percentage of Population Employed in Community & Social Service in the State of New York?
Percentage of Population Employed in Community & Social Service in New York is 15.0%.
What is the Percentage of Population Employed in Community & Social Service in the United States?
Percentage of Population Employed in Community & Social Service in the United States is 11.2%.