Hannawa Falls, NY Map & Demographics
Hannawa Falls Map
Hannawa Falls Overview
$42,496
PER CAPITA INCOME
$93,814
AVG FAMILY INCOME
$92,818
AVG HOUSEHOLD INCOME
6.0%
WAGE / INCOME GAP [ % ]
94.0¢/ $1
WAGE / INCOME GAP [ $ ]
0.44
INEQUALITY / GINI INDEX
892
TOTAL POPULATION
493
MALE POPULATION
399
FEMALE POPULATION
123.56
MALES / 100 FEMALES
80.93
FEMALES / 100 MALES
46.4
MEDIAN AGE
2.6
AVG FAMILY SIZE
2.1
AVG HOUSEHOLD SIZE
418
LABOR FORCE [ PEOPLE ]
55.7%
PERCENT IN LABOR FORCE
2.9%
UNEMPLOYMENT RATE
Hannawa Falls Zip Codes
Hannawa Falls Area Codes
Income in Hannawa Falls
Income Overview in Hannawa Falls
Per Capita Income in Hannawa Falls is $42,496, while median incomes of families and households are $93,814 and $92,818 respectively.
| Characteristic | Number | Measure |
| Per Capita Income | 892 | $42,496 |
| Median Family Income | 272 | $93,814 |
| Mean Family Income | 272 | $104,804 |
| Median Household Income | 419 | $92,818 |
| Mean Household Income | 419 | $91,295 |
| Income Deficit | 272 | $0 |
| Wage / Income Gap (%) | 892 | 6.00% |
| Wage / Income Gap ($) | 892 | 94.00¢ per $1 |
| Gini / Inequality Index | 892 | 0.44 |
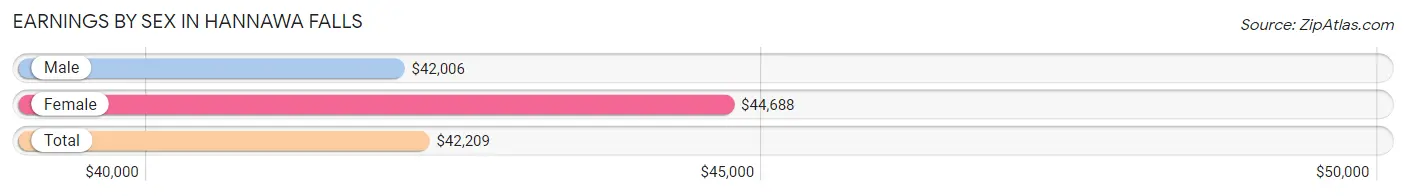
Earnings by Sex in Hannawa Falls
Average Earnings in Hannawa Falls are $42,209, $42,006 for men and $44,688 for women, a difference of 6.0%.
| Sex | Number | Average Earnings |
| Male | 235 (54.9%) | $42,006 |
| Female | 193 (45.1%) | $44,688 |
| Total | 428 (100.0%) | $42,209 |
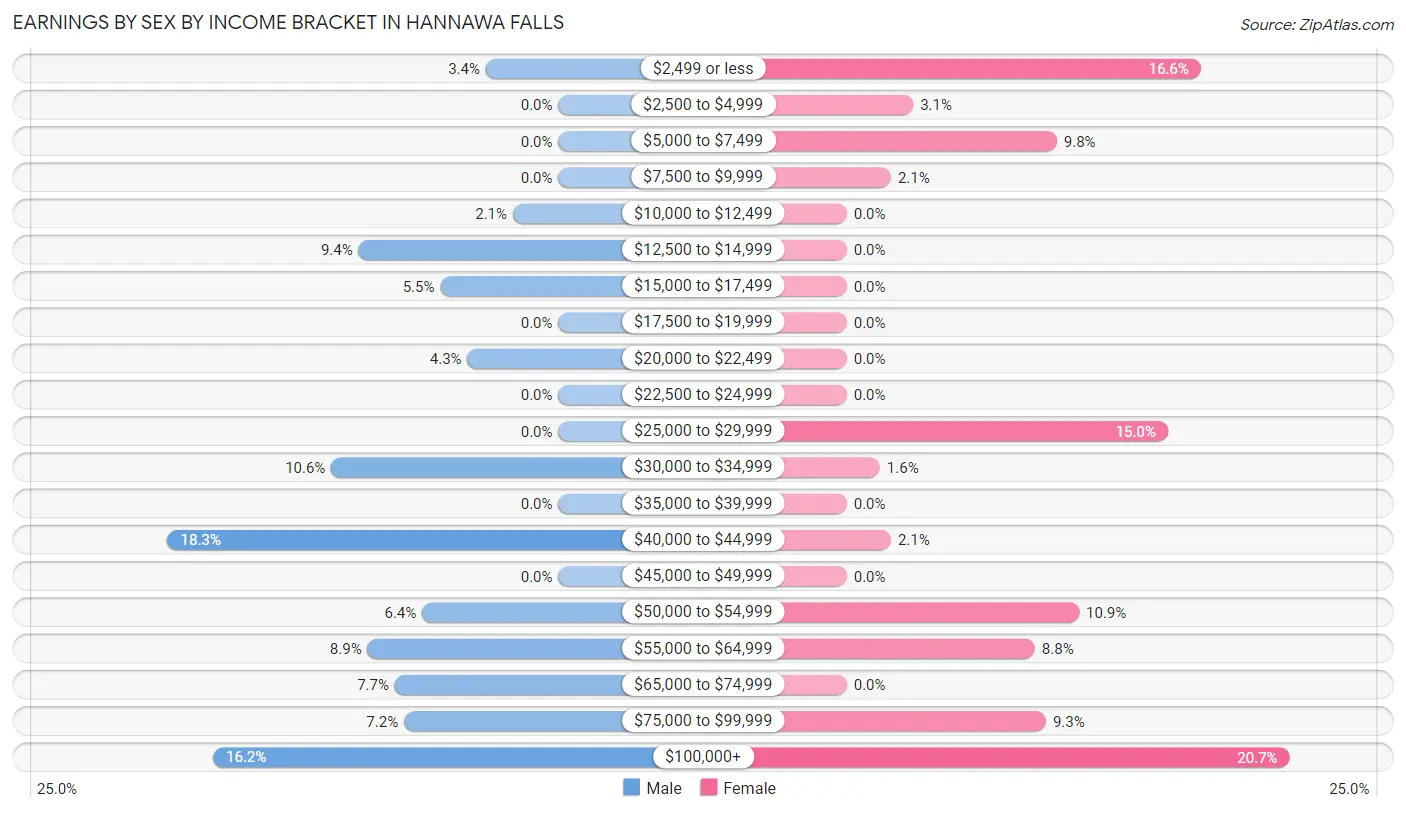
Earnings by Sex by Income Bracket in Hannawa Falls
The most common earnings brackets in Hannawa Falls are $40,000 to $44,999 for men (43 | 18.3%) and $100,000+ for women (40 | 20.7%).
| Income | Male | Female |
| $2,499 or less | 8 (3.4%) | 32 (16.6%) |
| $2,500 to $4,999 | 0 (0.0%) | 6 (3.1%) |
| $5,000 to $7,499 | 0 (0.0%) | 19 (9.8%) |
| $7,500 to $9,999 | 0 (0.0%) | 4 (2.1%) |
| $10,000 to $12,499 | 5 (2.1%) | 0 (0.0%) |
| $12,500 to $14,999 | 22 (9.4%) | 0 (0.0%) |
| $15,000 to $17,499 | 13 (5.5%) | 0 (0.0%) |
| $17,500 to $19,999 | 0 (0.0%) | 0 (0.0%) |
| $20,000 to $22,499 | 10 (4.3%) | 0 (0.0%) |
| $22,500 to $24,999 | 0 (0.0%) | 0 (0.0%) |
| $25,000 to $29,999 | 0 (0.0%) | 29 (15.0%) |
| $30,000 to $34,999 | 25 (10.6%) | 3 (1.5%) |
| $35,000 to $39,999 | 0 (0.0%) | 0 (0.0%) |
| $40,000 to $44,999 | 43 (18.3%) | 4 (2.1%) |
| $45,000 to $49,999 | 0 (0.0%) | 0 (0.0%) |
| $50,000 to $54,999 | 15 (6.4%) | 21 (10.9%) |
| $55,000 to $64,999 | 21 (8.9%) | 17 (8.8%) |
| $65,000 to $74,999 | 18 (7.7%) | 0 (0.0%) |
| $75,000 to $99,999 | 17 (7.2%) | 18 (9.3%) |
| $100,000+ | 38 (16.2%) | 40 (20.7%) |
| Total | 235 (100.0%) | 193 (100.0%) |
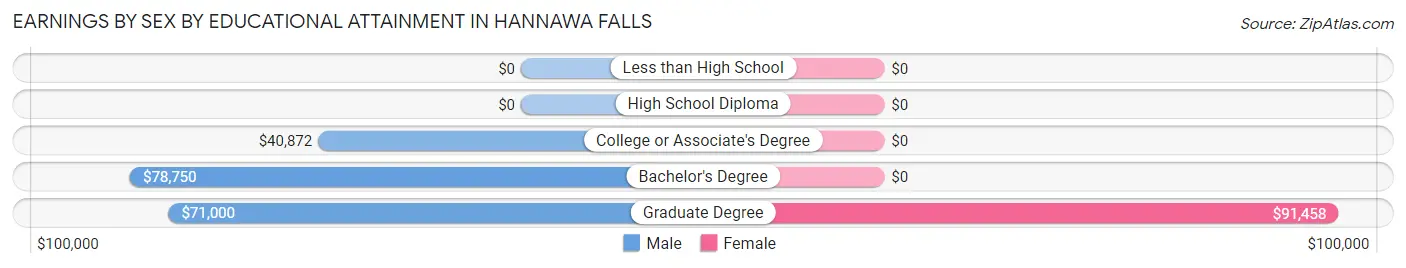
Earnings by Sex by Educational Attainment in Hannawa Falls
Average earnings in Hannawa Falls are $42,122 for men and $51,845 for women, a difference of 18.8%. Men with an educational attainment of bachelor's degree enjoy the highest average annual earnings of $78,750, while those with college or associate's degree education earn the least with $40,872. Women with an educational attainment of graduate degree earn the most with the average annual earnings of $91,458, while those with graduate degree education have the smallest earnings of $91,458.
| Educational Attainment | Male Income | Female Income |
| Less than High School | - | - |
| High School Diploma | - | - |
| College or Associate's Degree | $40,872 | $0 |
| Bachelor's Degree | $78,750 | $0 |
| Graduate Degree | $71,000 | $91,458 |
| Total | $42,122 | $51,845 |
Family Income in Hannawa Falls
Family Income Brackets in Hannawa Falls
According to the Hannawa Falls family income data, there are 75 families falling into the $75,000 to $99,999 income range, which is the most common income bracket and makes up 27.6% of all families.
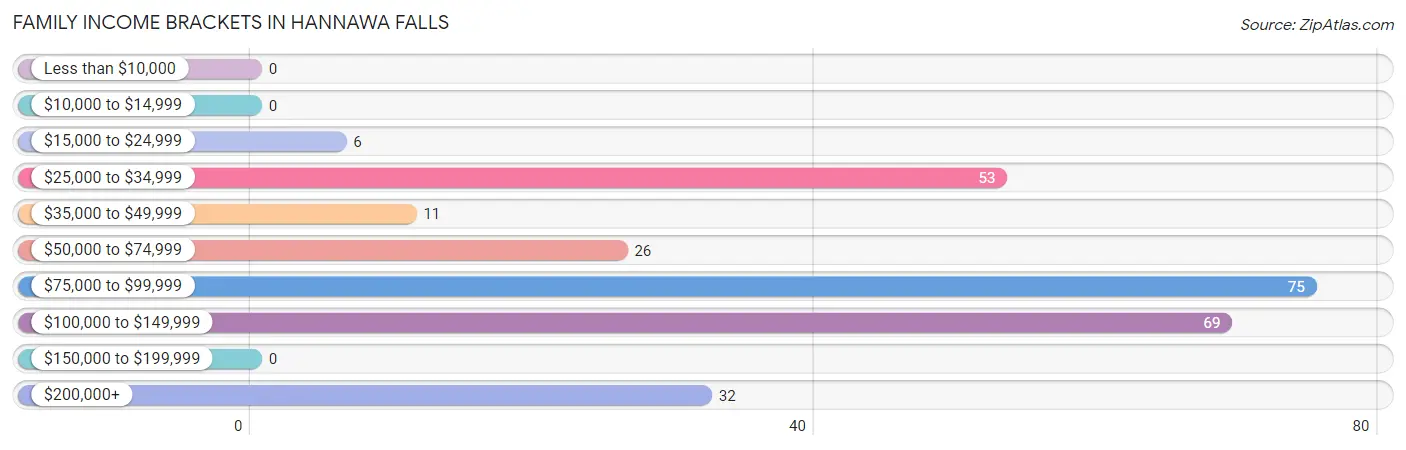
| Income Bracket | # Families | % Families |
| Less than $10,000 | 0 | 0.0% |
| $10,000 to $14,999 | 0 | 0.0% |
| $15,000 to $24,999 | 6 | 2.2% |
| $25,000 to $34,999 | 53 | 19.5% |
| $35,000 to $49,999 | 11 | 4.0% |
| $50,000 to $74,999 | 26 | 9.6% |
| $75,000 to $99,999 | 75 | 27.6% |
| $100,000 to $149,999 | 69 | 25.4% |
| $150,000 to $199,999 | 0 | 0.0% |
| $200,000+ | 32 | 11.8% |
Family Income by Famaliy Size in Hannawa Falls
3-person families (46 | 16.9%) account for the highest median family income in Hannawa Falls with $113,750 per family, while 3-person families (46 | 16.9%) have the highest median income of $37,917 per family member.
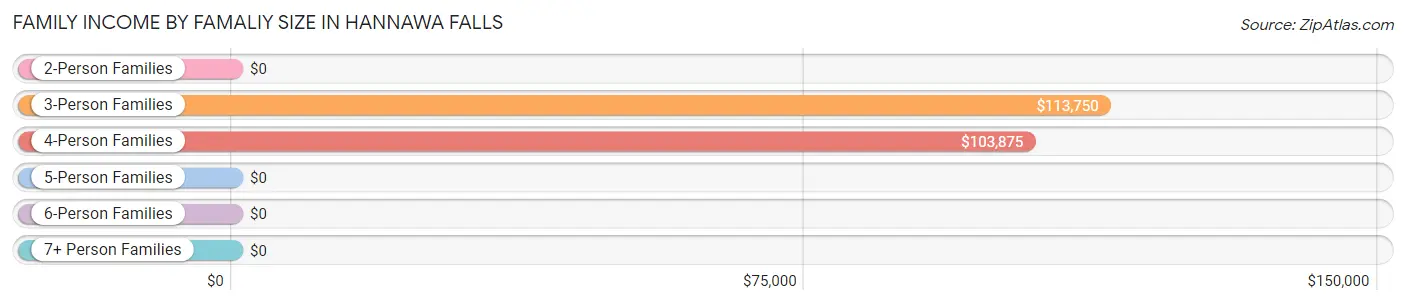
| Income Bracket | # Families | Median Income |
| 2-Person Families | 145 (53.3%) | $0 |
| 3-Person Families | 46 (16.9%) | $113,750 |
| 4-Person Families | 64 (23.5%) | $103,875 |
| 5-Person Families | 17 (6.2%) | $0 |
| 6-Person Families | 0 (0.0%) | $0 |
| 7+ Person Families | 0 (0.0%) | $0 |
| Total | 272 (100.0%) | $93,814 |
Family Income by Number of Earners in Hannawa Falls
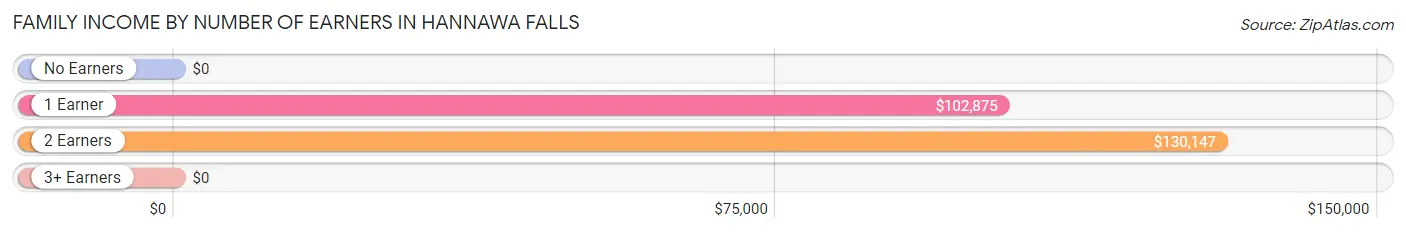
| Number of Earners | # Families | Median Income |
| No Earners | 109 (40.1%) | $0 |
| 1 Earner | 56 (20.6%) | $102,875 |
| 2 Earners | 100 (36.8%) | $130,147 |
| 3+ Earners | 7 (2.6%) | $0 |
| Total | 272 (100.0%) | $93,814 |
Household Income in Hannawa Falls
Household Income Brackets in Hannawa Falls
With 100 households falling in the category, the $100,000 to $149,999 income range is the most frequent in Hannawa Falls, accounting for 23.9% of all households. In contrast, only 16 households (3.8%) fall into the $150,000 to $199,999 income bracket, making it the least populous group.
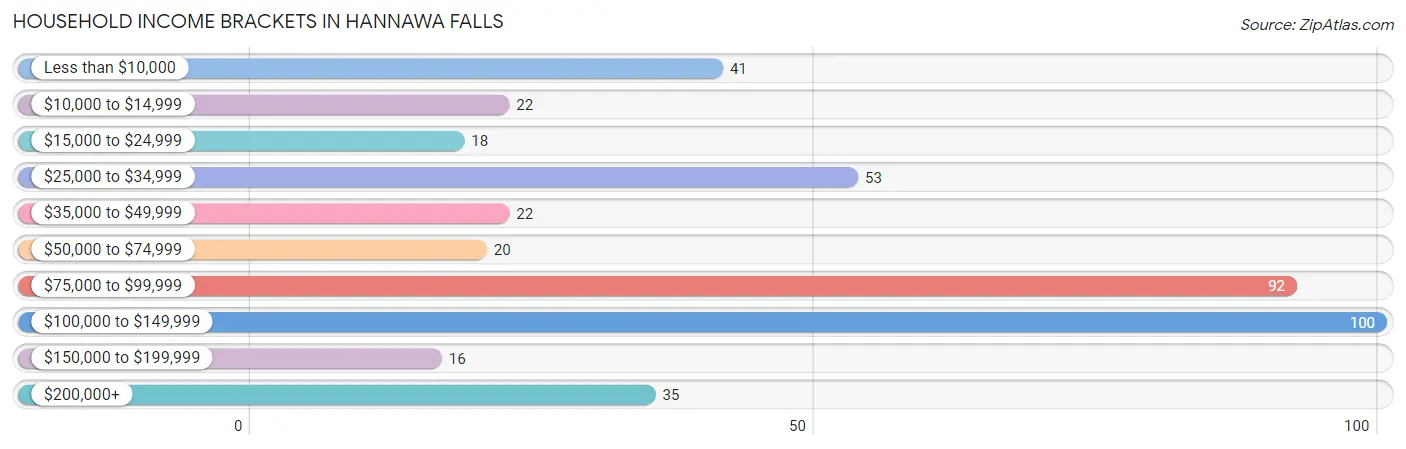
| Income Bracket | # Households | % Households |
| Less than $10,000 | 41 | 9.8% |
| $10,000 to $14,999 | 22 | 5.3% |
| $15,000 to $24,999 | 18 | 4.3% |
| $25,000 to $34,999 | 53 | 12.6% |
| $35,000 to $49,999 | 22 | 5.3% |
| $50,000 to $74,999 | 20 | 4.8% |
| $75,000 to $99,999 | 92 | 22.0% |
| $100,000 to $149,999 | 100 | 23.9% |
| $150,000 to $199,999 | 16 | 3.8% |
| $200,000+ | 35 | 8.4% |
Household Income by Householder Age in Hannawa Falls
The median household income in Hannawa Falls is $92,818, with the highest median household income of $113,295 found in the 25 to 44 years age bracket for the primary householder. A total of 85 households (20.3%) fall into this category. Meanwhile, the 15 to 24 years age bracket for the primary householder has the lowest median household income of $0, with 25 households (6.0%) in this group.
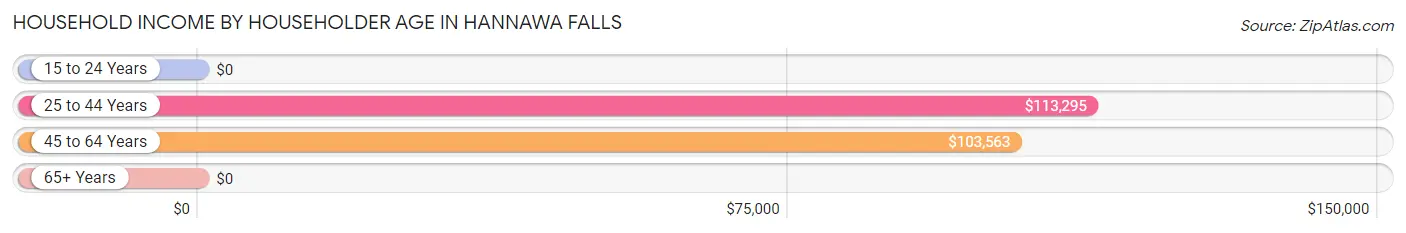
| Income Bracket | # Households | Median Income |
| 15 to 24 Years | 25 (6.0%) | $0 |
| 25 to 44 Years | 85 (20.3%) | $113,295 |
| 45 to 64 Years | 139 (33.2%) | $103,563 |
| 65+ Years | 170 (40.6%) | $0 |
| Total | 419 (100.0%) | $92,818 |
Poverty in Hannawa Falls
Income Below Poverty by Sex and Age in Hannawa Falls
With 8.7% poverty level for males and 9.5% for females among the residents of Hannawa Falls, 75 year old and over males and 18 to 24 year old females are the most vulnerable to poverty, with 21 males (30.0%) and 32 females (100.0%) in their respective age groups living below the poverty level.
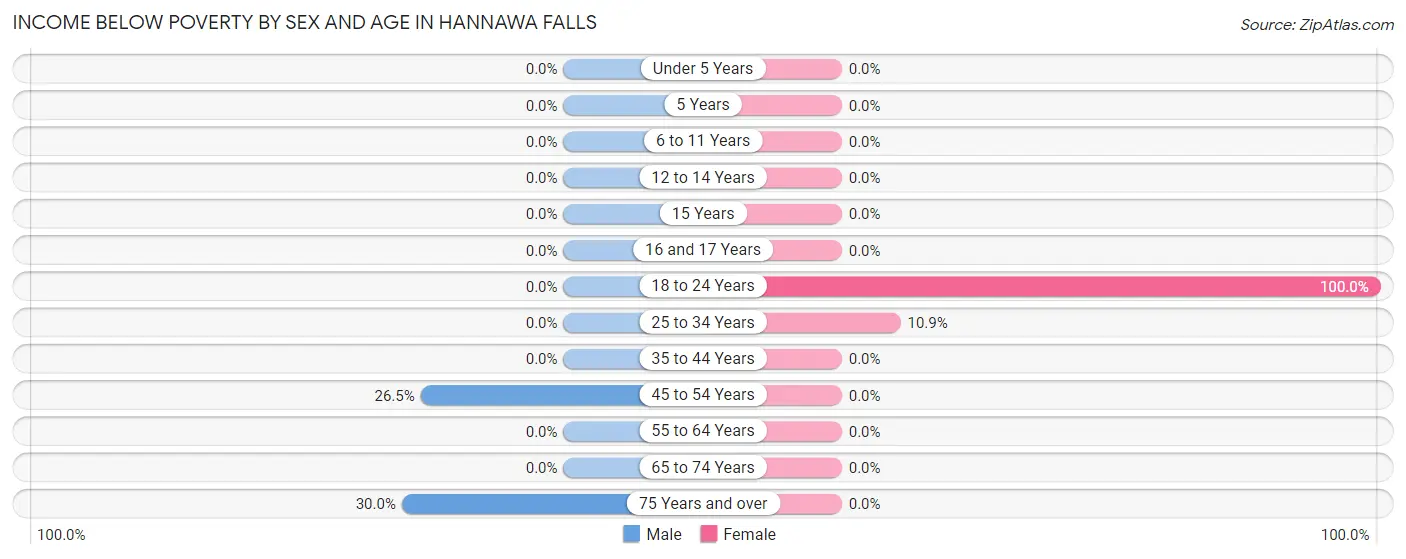
| Age Bracket | Male | Female |
| Under 5 Years | 0 (0.0%) | 0 (0.0%) |
| 5 Years | 0 (0.0%) | 0 (0.0%) |
| 6 to 11 Years | 0 (0.0%) | 0 (0.0%) |
| 12 to 14 Years | 0 (0.0%) | 0 (0.0%) |
| 15 Years | 0 (0.0%) | 0 (0.0%) |
| 16 and 17 Years | 0 (0.0%) | 0 (0.0%) |
| 18 to 24 Years | 0 (0.0%) | 32 (100.0%) |
| 25 to 34 Years | 0 (0.0%) | 6 (10.9%) |
| 35 to 44 Years | 0 (0.0%) | 0 (0.0%) |
| 45 to 54 Years | 22 (26.5%) | 0 (0.0%) |
| 55 to 64 Years | 0 (0.0%) | 0 (0.0%) |
| 65 to 74 Years | 0 (0.0%) | 0 (0.0%) |
| 75 Years and over | 21 (30.0%) | 0 (0.0%) |
| Total | 43 (8.7%) | 38 (9.5%) |
Income Above Poverty by Sex and Age in Hannawa Falls
According to the poverty statistics in Hannawa Falls, males aged under 5 years and females aged under 5 years are the age groups that are most secure financially, with 100.0% of males and 100.0% of females in these age groups living above the poverty line.
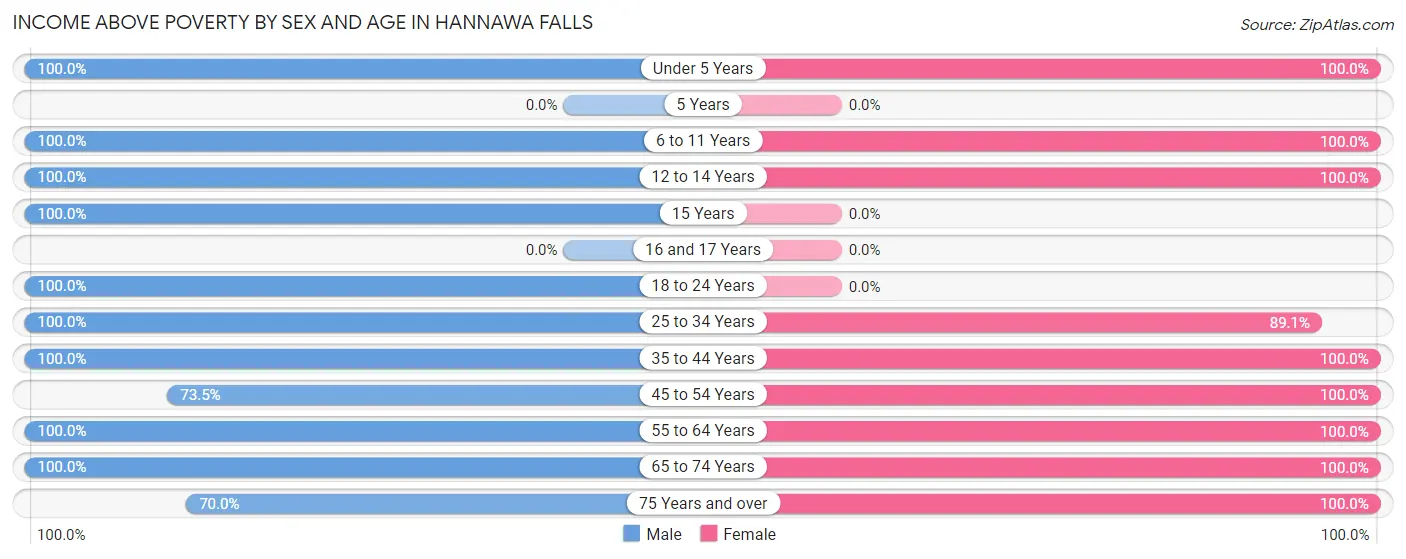
| Age Bracket | Male | Female |
| Under 5 Years | 46 (100.0%) | 20 (100.0%) |
| 5 Years | 0 (0.0%) | 0 (0.0%) |
| 6 to 11 Years | 12 (100.0%) | 25 (100.0%) |
| 12 to 14 Years | 25 (100.0%) | 8 (100.0%) |
| 15 Years | 5 (100.0%) | 0 (0.0%) |
| 16 and 17 Years | 0 (0.0%) | 0 (0.0%) |
| 18 to 24 Years | 55 (100.0%) | 0 (0.0%) |
| 25 to 34 Years | 25 (100.0%) | 49 (89.1%) |
| 35 to 44 Years | 68 (100.0%) | 38 (100.0%) |
| 45 to 54 Years | 61 (73.5%) | 67 (100.0%) |
| 55 to 64 Years | 51 (100.0%) | 25 (100.0%) |
| 65 to 74 Years | 53 (100.0%) | 40 (100.0%) |
| 75 Years and over | 49 (70.0%) | 89 (100.0%) |
| Total | 450 (91.3%) | 361 (90.5%) |
Income Below Poverty Among Married-Couple Families in Hannawa Falls
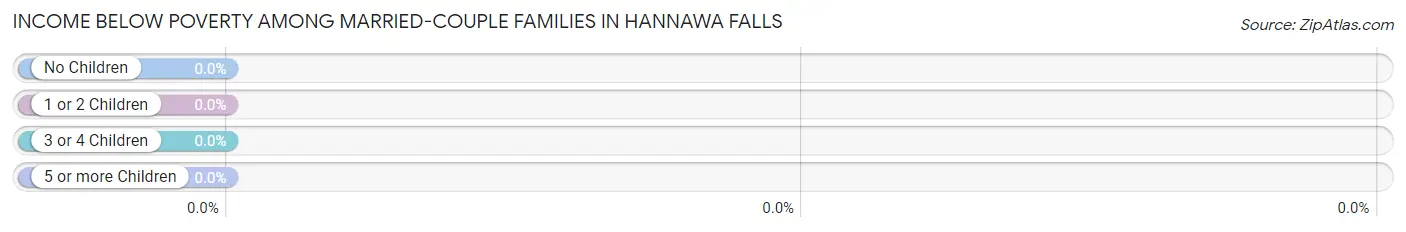
| Children | Above Poverty | Below Poverty |
| No Children | 157 (100.0%) | 0 (0.0%) |
| 1 or 2 Children | 85 (100.0%) | 0 (0.0%) |
| 3 or 4 Children | 0 (0.0%) | 0 (0.0%) |
| 5 or more Children | 0 (0.0%) | 0 (0.0%) |
| Total | 242 (100.0%) | 0 (0.0%) |
Income Below Poverty Among Single-Parent Households in Hannawa Falls
| Children | Single Father | Single Mother |
| No Children | 0 (0.0%) | 0 (0.0%) |
| 1 or 2 Children | 0 (0.0%) | 0 (0.0%) |
| 3 or 4 Children | 0 (0.0%) | 0 (0.0%) |
| 5 or more Children | 0 (0.0%) | 0 (0.0%) |
| Total | 0 (0.0%) | 0 (0.0%) |
Income Below Poverty Among Married-Couple vs Single-Parent Households in Hannawa Falls
| Children | Married-Couple Families | Single-Parent Households |
| No Children | 0 (0.0%) | 0 (0.0%) |
| 1 or 2 Children | 0 (0.0%) | 0 (0.0%) |
| 3 or 4 Children | 0 (0.0%) | 0 (0.0%) |
| 5 or more Children | 0 (0.0%) | 0 (0.0%) |
| Total | 0 (0.0%) | 0 (0.0%) |
Race in Hannawa Falls
The most populous races in Hannawa Falls are White / Caucasian (807 | 90.5%), Two or more Races (74 | 8.3%), and Hispanic or Latino (44 | 4.9%).
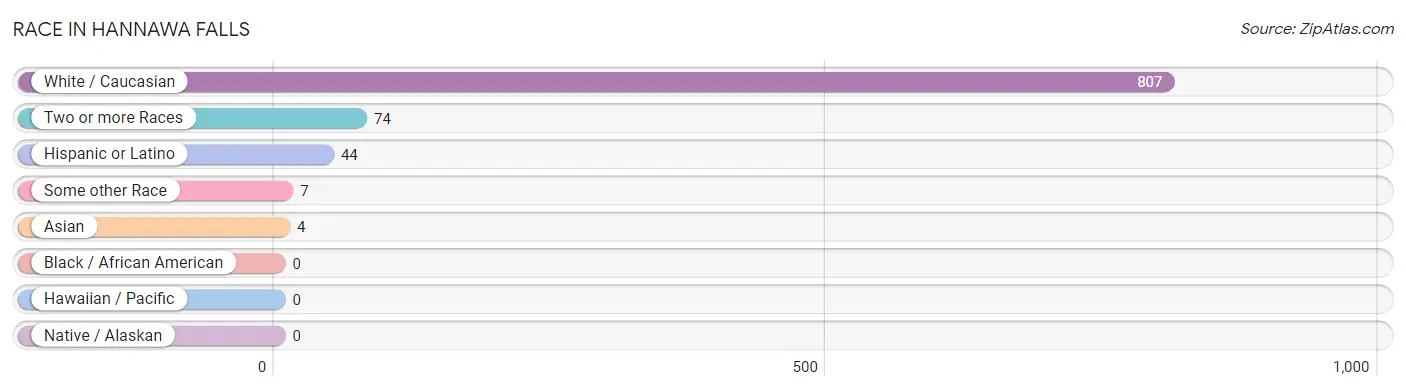
| Race | # Population | % Population |
| Asian | 4 | 0.4% |
| Black / African American | 0 | 0.0% |
| Hawaiian / Pacific | 0 | 0.0% |
| Hispanic or Latino | 44 | 4.9% |
| Native / Alaskan | 0 | 0.0% |
| White / Caucasian | 807 | 90.5% |
| Two or more Races | 74 | 8.3% |
| Some other Race | 7 | 0.8% |
| Total | 892 | 100.0% |
Ancestry in Hannawa Falls
The most populous ancestries reported in Hannawa Falls are Irish (177 | 19.8%), English (163 | 18.3%), American (126 | 14.1%), German (90 | 10.1%), and French (84 | 9.4%), together accounting for 71.8% of all Hannawa Falls residents.
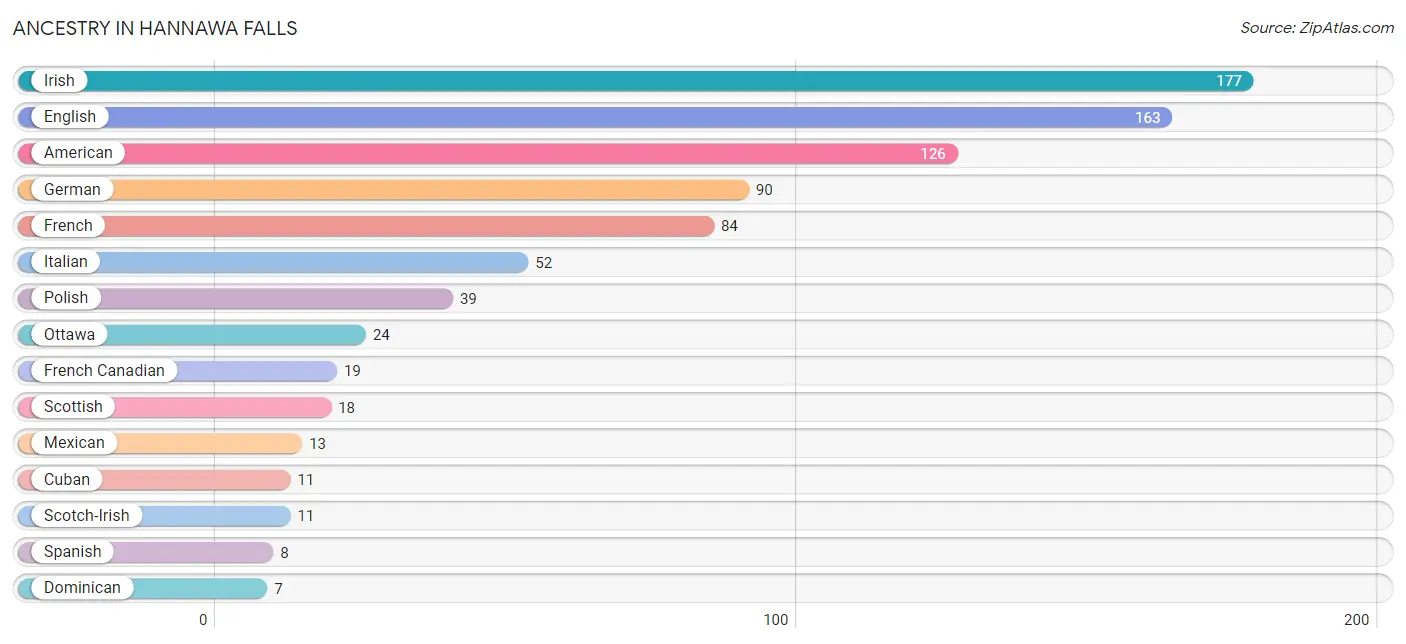
| Ancestry | # Population | % Population |
| American | 126 | 14.1% |
| Austrian | 4 | 0.4% |
| Bhutanese | 5 | 0.6% |
| British | 5 | 0.6% |
| Canadian | 4 | 0.4% |
| Central American | 2 | 0.2% |
| Cuban | 11 | 1.2% |
| Dominican | 7 | 0.8% |
| Dutch | 7 | 0.8% |
| English | 163 | 18.3% |
| European | 7 | 0.8% |
| French | 84 | 9.4% |
| French Canadian | 19 | 2.1% |
| German | 90 | 10.1% |
| Hungarian | 4 | 0.4% |
| Indian (Asian) | 3 | 0.3% |
| Iranian | 6 | 0.7% |
| Irish | 177 | 19.8% |
| Italian | 52 | 5.8% |
| Korean | 7 | 0.8% |
| Mexican | 13 | 1.5% |
| Native Hawaiian | 4 | 0.4% |
| Ottawa | 24 | 2.7% |
| Panamanian | 2 | 0.2% |
| Peruvian | 3 | 0.3% |
| Polish | 39 | 4.4% |
| Romanian | 1 | 0.1% |
| Scotch-Irish | 11 | 1.2% |
| Scottish | 18 | 2.0% |
| South American | 3 | 0.3% |
| Spanish | 8 | 0.9% |
| Swedish | 5 | 0.6% |
| Ukrainian | 1 | 0.1% | View All 33 Rows |
Immigrants in Hannawa Falls
The most numerous immigrant groups reported in Hannawa Falls came from Europe (18 | 2.0%), Germany (13 | 1.5%), Western Europe (13 | 1.5%), Asia (9 | 1.0%), and Latin America (7 | 0.8%), together accounting for 6.7% of all Hannawa Falls residents.
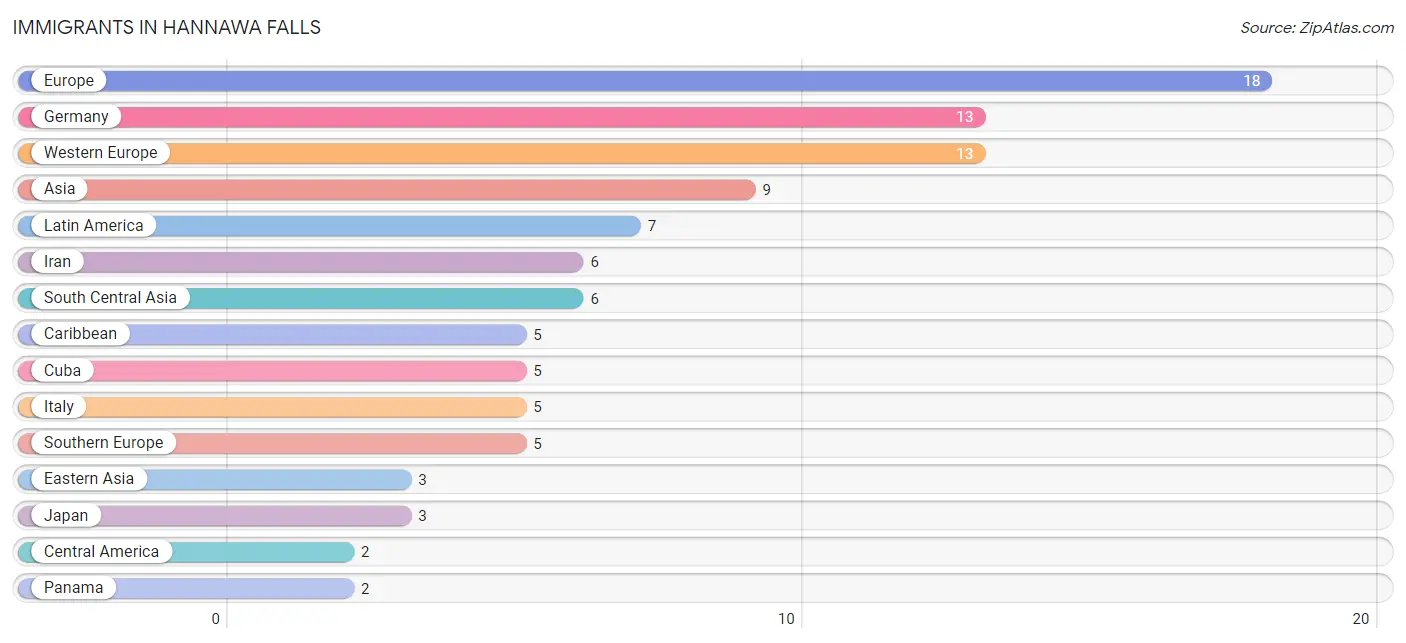
| Immigration Origin | # Population | % Population |
| Asia | 9 | 1.0% |
| Caribbean | 5 | 0.6% |
| Central America | 2 | 0.2% |
| Cuba | 5 | 0.6% |
| Eastern Asia | 3 | 0.3% |
| Europe | 18 | 2.0% |
| Germany | 13 | 1.5% |
| Iran | 6 | 0.7% |
| Italy | 5 | 0.6% |
| Japan | 3 | 0.3% |
| Latin America | 7 | 0.8% |
| Panama | 2 | 0.2% |
| South Central Asia | 6 | 0.7% |
| Southern Europe | 5 | 0.6% |
| Western Europe | 13 | 1.5% | View All 15 Rows |
Sex and Age in Hannawa Falls
Sex and Age in Hannawa Falls
The most populous age groups in Hannawa Falls are 45 to 49 Years (49 | 9.9%) for men and 75 to 79 Years (64 | 16.0%) for women.
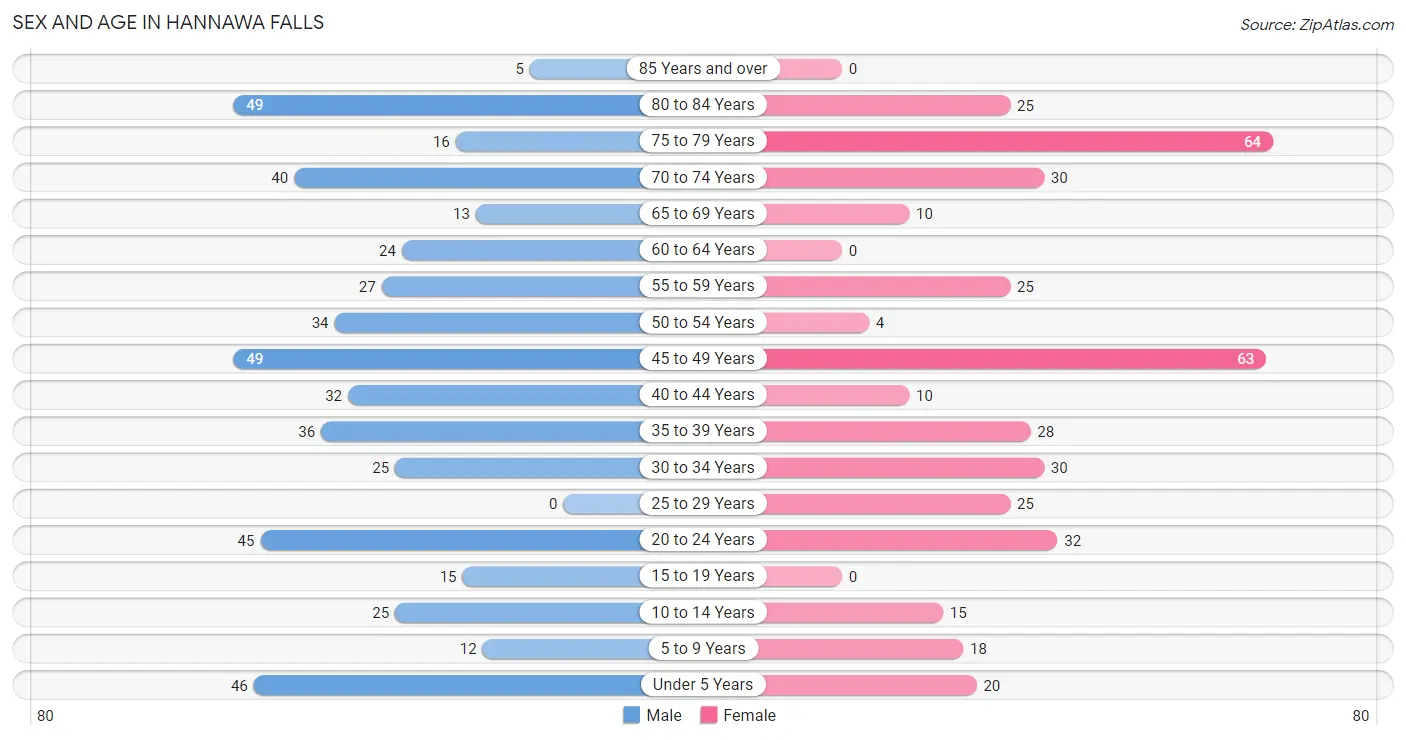
| Age Bracket | Male | Female |
| Under 5 Years | 46 (9.3%) | 20 (5.0%) |
| 5 to 9 Years | 12 (2.4%) | 18 (4.5%) |
| 10 to 14 Years | 25 (5.1%) | 15 (3.8%) |
| 15 to 19 Years | 15 (3.0%) | 0 (0.0%) |
| 20 to 24 Years | 45 (9.1%) | 32 (8.0%) |
| 25 to 29 Years | 0 (0.0%) | 25 (6.3%) |
| 30 to 34 Years | 25 (5.1%) | 30 (7.5%) |
| 35 to 39 Years | 36 (7.3%) | 28 (7.0%) |
| 40 to 44 Years | 32 (6.5%) | 10 (2.5%) |
| 45 to 49 Years | 49 (9.9%) | 63 (15.8%) |
| 50 to 54 Years | 34 (6.9%) | 4 (1.0%) |
| 55 to 59 Years | 27 (5.5%) | 25 (6.3%) |
| 60 to 64 Years | 24 (4.9%) | 0 (0.0%) |
| 65 to 69 Years | 13 (2.6%) | 10 (2.5%) |
| 70 to 74 Years | 40 (8.1%) | 30 (7.5%) |
| 75 to 79 Years | 16 (3.3%) | 64 (16.0%) |
| 80 to 84 Years | 49 (9.9%) | 25 (6.3%) |
| 85 Years and over | 5 (1.0%) | 0 (0.0%) |
| Total | 493 (100.0%) | 399 (100.0%) |
Families and Households in Hannawa Falls
Median Family Size in Hannawa Falls
The median family size in Hannawa Falls is 2.63 persons per family, with single female/mother families (17 | 6.2%) accounting for the largest median family size of 5.76 persons per family. On the other hand, married-couple families (242 | 89.0%) represent the smallest median family size with 2.37 persons per family.
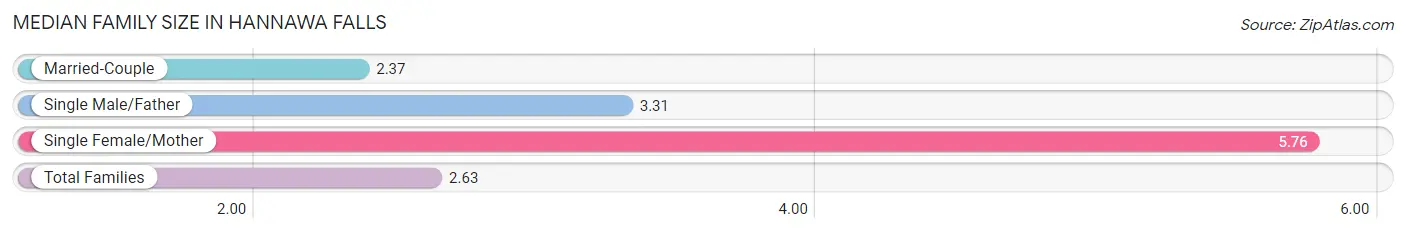
| Family Type | # Families | Family Size |
| Married-Couple | 242 (89.0%) | 2.37 |
| Single Male/Father | 13 (4.8%) | 3.31 |
| Single Female/Mother | 17 (6.2%) | 5.76 |
| Total Families | 272 (100.0%) | 2.63 |
Median Household Size in Hannawa Falls
The median household size in Hannawa Falls is 2.13 persons per household, with single female/mother households (17 | 4.1%) accounting for the largest median household size of 5.76 persons per household. non-family households (147 | 35.1%) represent the smallest median household size with 1.18 persons per household.
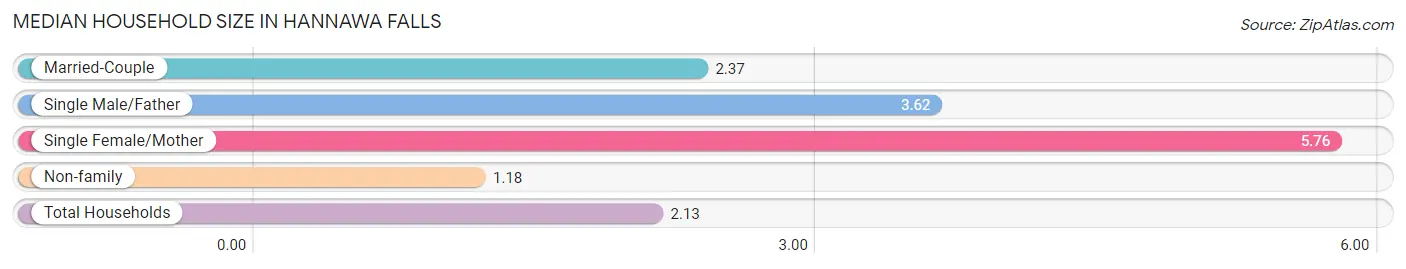
| Household Type | # Households | Household Size |
| Married-Couple | 242 (57.8%) | 2.37 |
| Single Male/Father | 13 (3.1%) | 3.62 |
| Single Female/Mother | 17 (4.1%) | 5.76 |
| Non-family | 147 (35.1%) | 1.18 |
| Total Households | 419 (100.0%) | 2.13 |
Household Size by Marriage Status in Hannawa Falls
Out of a total of 419 households in Hannawa Falls, 272 (64.9%) are family households, while 147 (35.1%) are nonfamily households. The most numerous type of family households are 2-person households, comprising 145, and the most common type of nonfamily households are 1-person households, comprising 102.
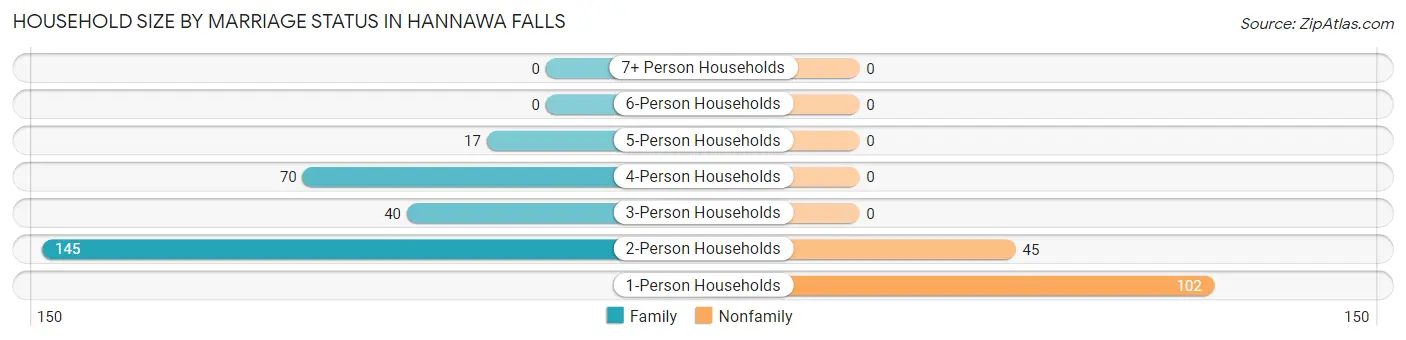
| Household Size | Family Households | Nonfamily Households |
| 1-Person Households | - | 102 (24.3%) |
| 2-Person Households | 145 (34.6%) | 45 (10.7%) |
| 3-Person Households | 40 (9.6%) | 0 (0.0%) |
| 4-Person Households | 70 (16.7%) | 0 (0.0%) |
| 5-Person Households | 17 (4.1%) | 0 (0.0%) |
| 6-Person Households | 0 (0.0%) | 0 (0.0%) |
| 7+ Person Households | 0 (0.0%) | 0 (0.0%) |
| Total | 272 (64.9%) | 147 (35.1%) |
Female Fertility in Hannawa Falls
Fertility by Age in Hannawa Falls
Average fertility rate in Hannawa Falls is 27.0 births per 1,000 women. Women in the age bracket of 35 to 50 years have the highest fertility rate with 30.0 births per 1,000 women. Women in the age bracket of 35 to 50 years acount for 60.0% of all women with births.
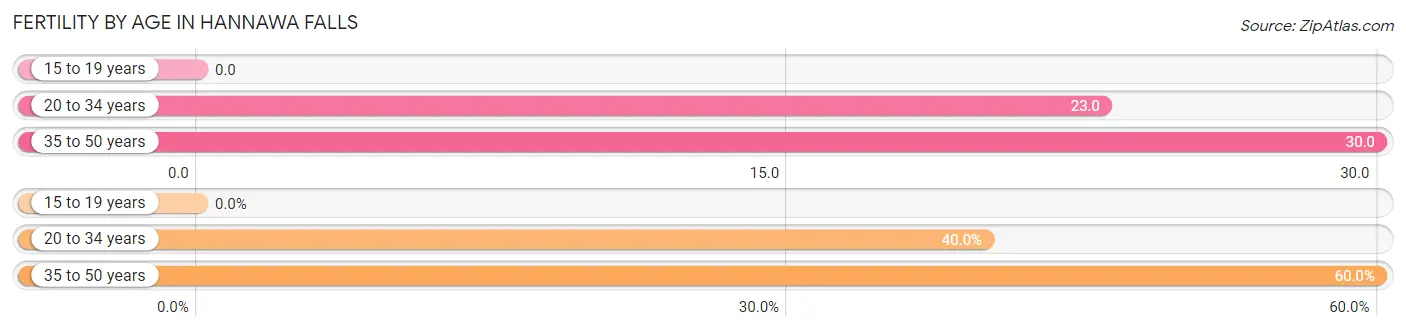
| Age Bracket | Women with Births | Births / 1,000 Women |
| 15 to 19 years | 0 (0.0%) | 0.0 |
| 20 to 34 years | 2 (40.0%) | 23.0 |
| 35 to 50 years | 3 (60.0%) | 30.0 |
| Total | 5 (100.0%) | 27.0 |
Fertility by Age by Marriage Status in Hannawa Falls
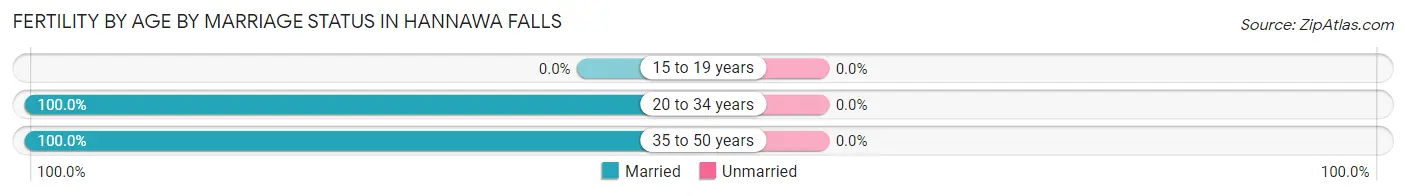
| Age Bracket | Married | Unmarried |
| 15 to 19 years | 0 (0.0%) | 0 (0.0%) |
| 20 to 34 years | 2 (100.0%) | 0 (0.0%) |
| 35 to 50 years | 3 (100.0%) | 0 (0.0%) |
| Total | 5 (100.0%) | 0 (0.0%) |
Fertility by Education in Hannawa Falls
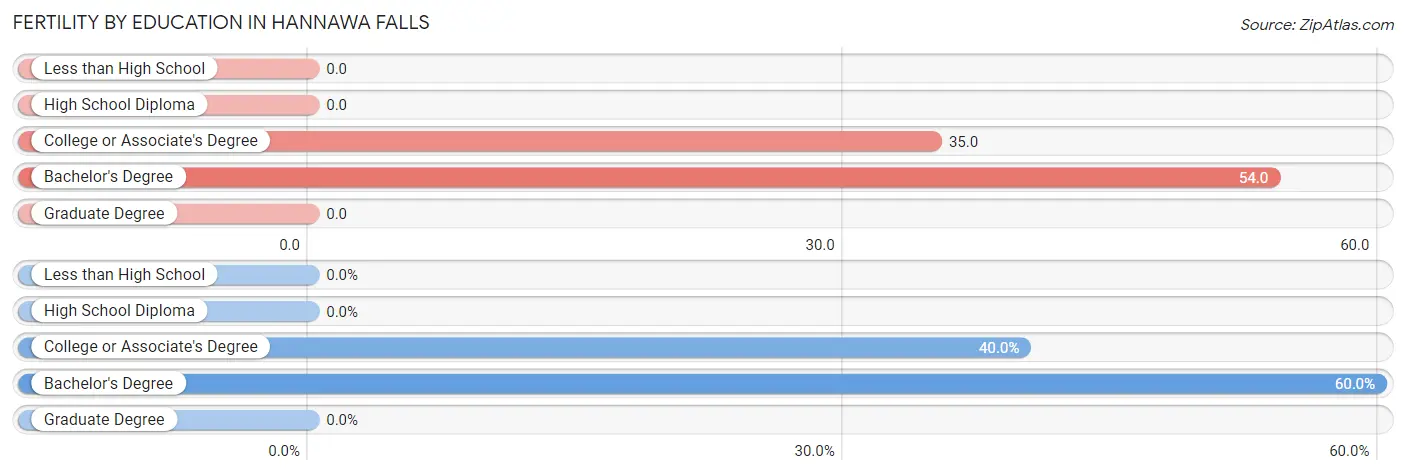
| Educational Attainment | Women with Births | Births / 1,000 Women |
| Less than High School | 0 (0.0%) | 0.0 |
| High School Diploma | 0 (0.0%) | 0.0 |
| College or Associate's Degree | 2 (40.0%) | 35.0 |
| Bachelor's Degree | 3 (60.0%) | 54.0 |
| Graduate Degree | 0 (0.0%) | 0.0 |
| Total | 5 (100.0%) | 27.0 |
Fertility by Education by Marriage Status in Hannawa Falls
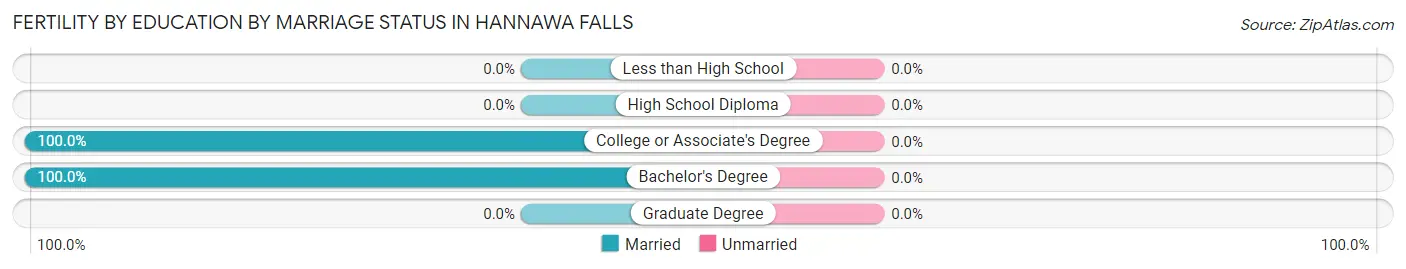
| Educational Attainment | Married | Unmarried |
| Less than High School | 0 (0.0%) | 0 (0.0%) |
| High School Diploma | 0 (0.0%) | 0 (0.0%) |
| College or Associate's Degree | 2 (100.0%) | 0 (0.0%) |
| Bachelor's Degree | 3 (100.0%) | 0 (0.0%) |
| Graduate Degree | 0 (0.0%) | 0 (0.0%) |
| Total | 5 (100.0%) | 0 (0.0%) |
Employment Characteristics in Hannawa Falls
Employment by Class of Employer in Hannawa Falls
Among the 406 employed individuals in Hannawa Falls, local government employees (115 | 28.3%), private company employees (114 | 28.1%), and not-for-profit organizations (96 | 23.6%) make up the most common classes of employment.
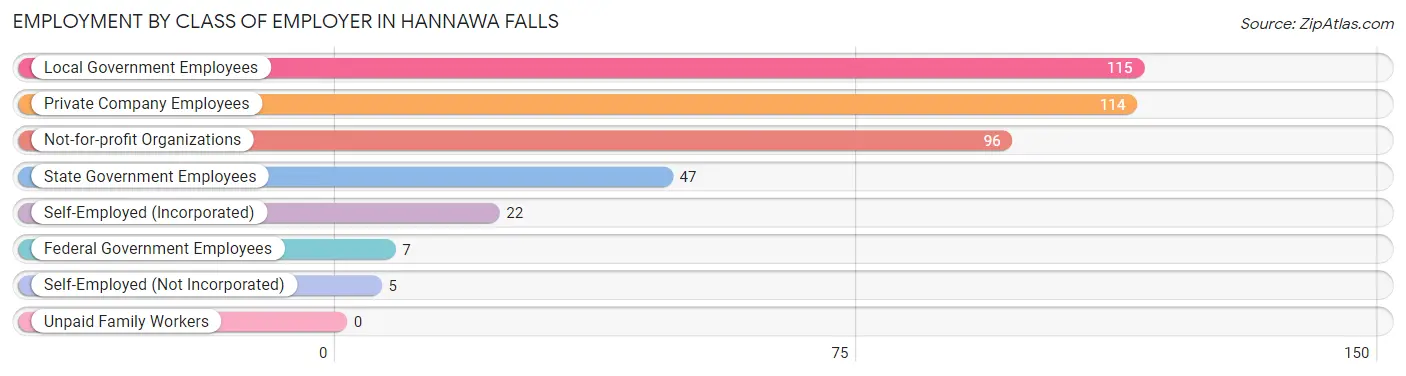
| Employer Class | # Employees | % Employees |
| Private Company Employees | 114 | 28.1% |
| Self-Employed (Incorporated) | 22 | 5.4% |
| Self-Employed (Not Incorporated) | 5 | 1.2% |
| Not-for-profit Organizations | 96 | 23.6% |
| Local Government Employees | 115 | 28.3% |
| State Government Employees | 47 | 11.6% |
| Federal Government Employees | 7 | 1.7% |
| Unpaid Family Workers | 0 | 0.0% |
| Total | 406 | 100.0% |
Employment Status by Age in Hannawa Falls
According to the labor force statistics for Hannawa Falls, out of the total population over 16 years of age (751), 55.7% or 418 individuals are in the labor force, with 2.9% or 12 of them unemployed. The age group with the highest labor force participation rate is 35 to 44 years, with 92.5% or 98 individuals in the labor force. Within the labor force, the 25 to 29 years age range has the highest percentage of unemployed individuals, with 26.1% or 6 of them being unemployed.
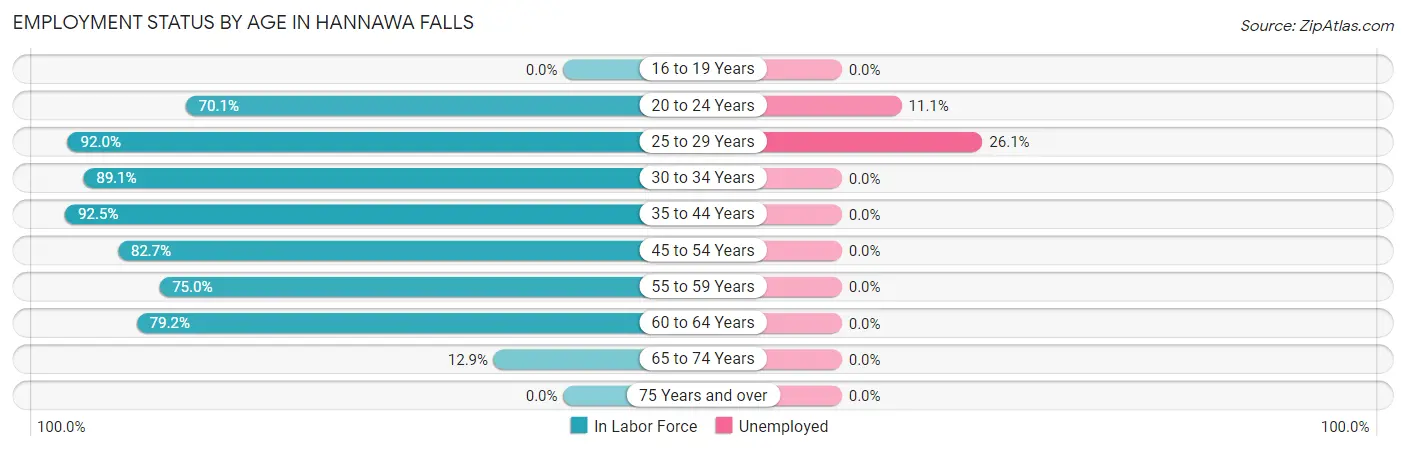
| Age Bracket | In Labor Force | Unemployed |
| 16 to 19 Years | 0 (0.0%) | 0 (0.0%) |
| 20 to 24 Years | 54 (70.1%) | 6 (11.1%) |
| 25 to 29 Years | 23 (92.0%) | 6 (26.1%) |
| 30 to 34 Years | 49 (89.1%) | 0 (0.0%) |
| 35 to 44 Years | 98 (92.5%) | 0 (0.0%) |
| 45 to 54 Years | 124 (82.7%) | 0 (0.0%) |
| 55 to 59 Years | 39 (75.0%) | 0 (0.0%) |
| 60 to 64 Years | 19 (79.2%) | 0 (0.0%) |
| 65 to 74 Years | 12 (12.9%) | 0 (0.0%) |
| 75 Years and over | 0 (0.0%) | 0 (0.0%) |
| Total | 418 (55.7%) | 12 (2.9%) |
Employment Status by Educational Attainment in Hannawa Falls
According to labor force statistics for Hannawa Falls, 85.4% of individuals (352) out of the total population between 25 and 64 years of age (412) are in the labor force, with 1.7% or 6 of them being unemployed. The group with the highest labor force participation rate are those with the educational attainment of high school diploma, with 100.0% or 12 individuals in the labor force. Within the labor force, individuals with high school diploma education have the highest percentage of unemployment, with 50.0% or 6 of them being unemployed.
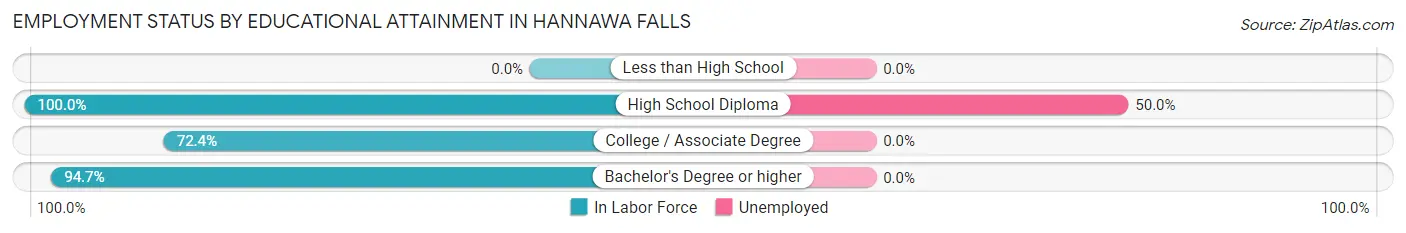
| Educational Attainment | In Labor Force | Unemployed |
| Less than High School | 0 (0.0%) | 0 (0.0%) |
| High School Diploma | 12 (100.0%) | 6 (50.0%) |
| College / Associate Degree | 126 (72.4%) | 0 (0.0%) |
| Bachelor's Degree or higher | 214 (94.7%) | 0 (0.0%) |
| Total | 352 (85.4%) | 7 (1.7%) |
Employment Occupations by Sex in Hannawa Falls
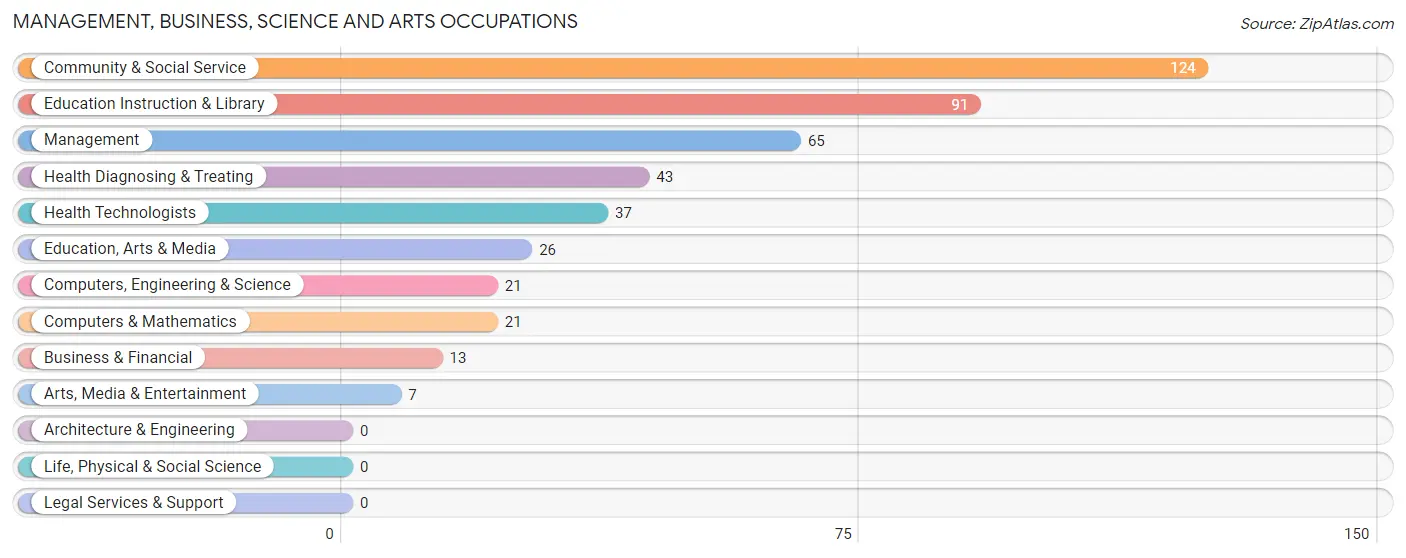
Management, Business, Science and Arts Occupations
The most common Management, Business, Science and Arts occupations in Hannawa Falls are Community & Social Service (124 | 30.5%), Education Instruction & Library (91 | 22.4%), Management (65 | 16.0%), Health Diagnosing & Treating (43 | 10.6%), and Health Technologists (37 | 9.1%).
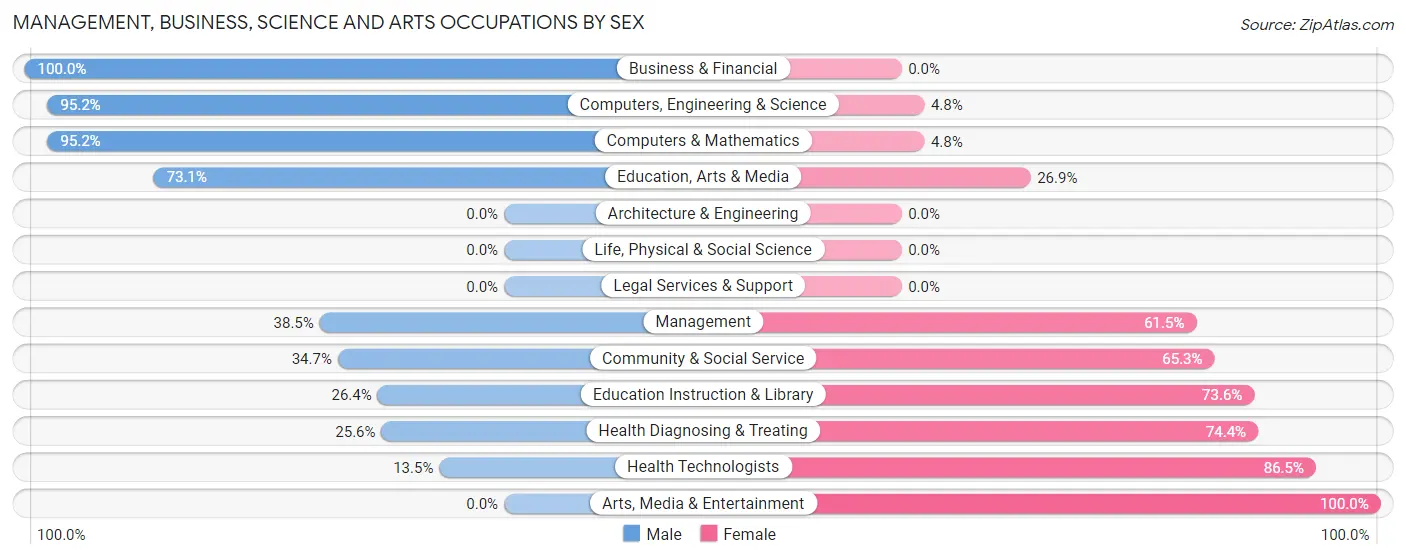
Management, Business, Science and Arts Occupations by Sex
Within the Management, Business, Science and Arts occupations in Hannawa Falls, the most male-oriented occupations are Business & Financial (100.0%), Computers, Engineering & Science (95.2%), and Computers & Mathematics (95.2%), while the most female-oriented occupations are Arts, Media & Entertainment (100.0%), Health Technologists (86.5%), and Health Diagnosing & Treating (74.4%).
| Occupation | Male | Female |
| Management | 25 (38.5%) | 40 (61.5%) |
| Business & Financial | 13 (100.0%) | 0 (0.0%) |
| Computers, Engineering & Science | 20 (95.2%) | 1 (4.8%) |
| Computers & Mathematics | 20 (95.2%) | 1 (4.8%) |
| Architecture & Engineering | 0 (0.0%) | 0 (0.0%) |
| Life, Physical & Social Science | 0 (0.0%) | 0 (0.0%) |
| Community & Social Service | 43 (34.7%) | 81 (65.3%) |
| Education, Arts & Media | 19 (73.1%) | 7 (26.9%) |
| Legal Services & Support | 0 (0.0%) | 0 (0.0%) |
| Education Instruction & Library | 24 (26.4%) | 67 (73.6%) |
| Arts, Media & Entertainment | 0 (0.0%) | 7 (100.0%) |
| Health Diagnosing & Treating | 11 (25.6%) | 32 (74.4%) |
| Health Technologists | 5 (13.5%) | 32 (86.5%) |
| Total (Category) | 112 (42.1%) | 154 (57.9%) |
| Total (Overall) | 219 (53.9%) | 187 (46.1%) |
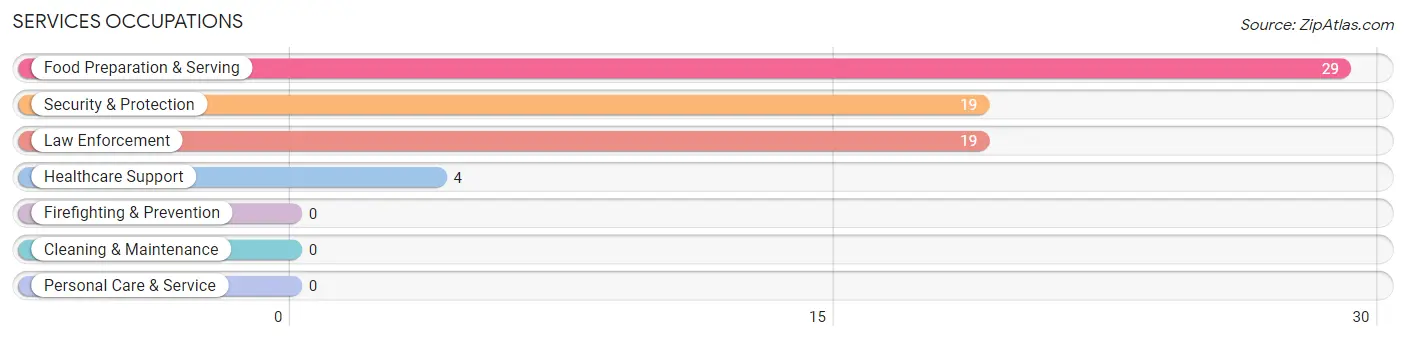
Services Occupations
The most common Services occupations in Hannawa Falls are Food Preparation & Serving (29 | 7.1%), Security & Protection (19 | 4.7%), Law Enforcement (19 | 4.7%), and Healthcare Support (4 | 1.0%).
Services Occupations by Sex
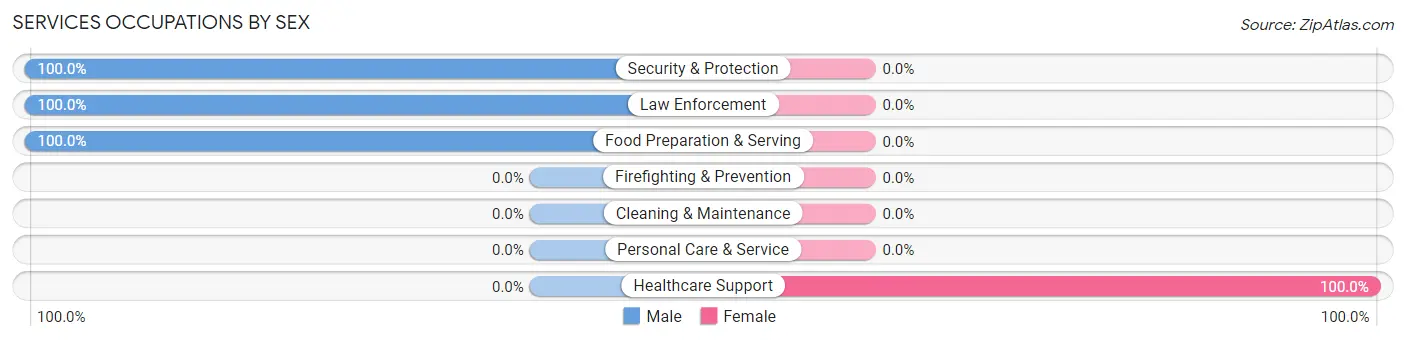
| Occupation | Male | Female |
| Healthcare Support | 0 (0.0%) | 4 (100.0%) |
| Security & Protection | 19 (100.0%) | 0 (0.0%) |
| Firefighting & Prevention | 0 (0.0%) | 0 (0.0%) |
| Law Enforcement | 19 (100.0%) | 0 (0.0%) |
| Food Preparation & Serving | 29 (100.0%) | 0 (0.0%) |
| Cleaning & Maintenance | 0 (0.0%) | 0 (0.0%) |
| Personal Care & Service | 0 (0.0%) | 0 (0.0%) |
| Total (Category) | 48 (92.3%) | 4 (7.7%) |
| Total (Overall) | 219 (53.9%) | 187 (46.1%) |
Sales and Office Occupations
The most common Sales and Office occupations in Hannawa Falls are Office & Administration (19 | 4.7%), and Sales & Related (10 | 2.5%).
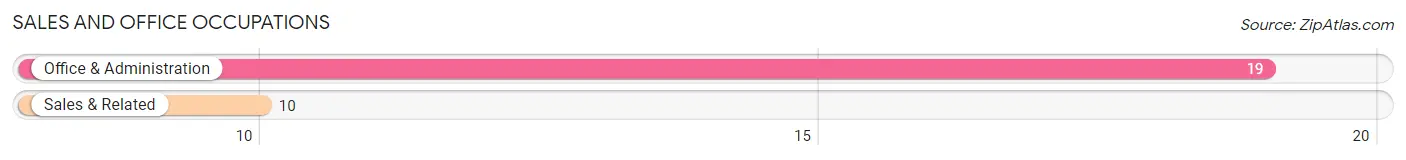
Sales and Office Occupations by Sex
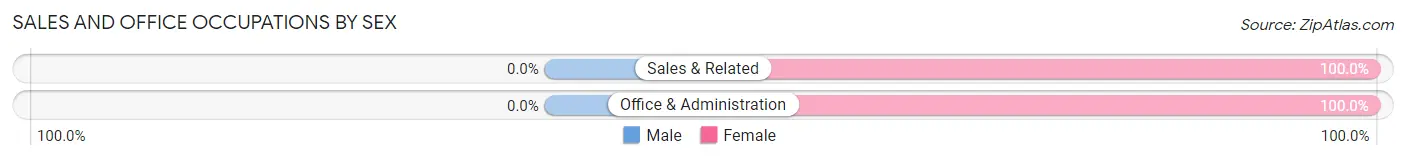
| Occupation | Male | Female |
| Sales & Related | 0 (0.0%) | 10 (100.0%) |
| Office & Administration | 0 (0.0%) | 19 (100.0%) |
| Total (Category) | 0 (0.0%) | 29 (100.0%) |
| Total (Overall) | 219 (53.9%) | 187 (46.1%) |
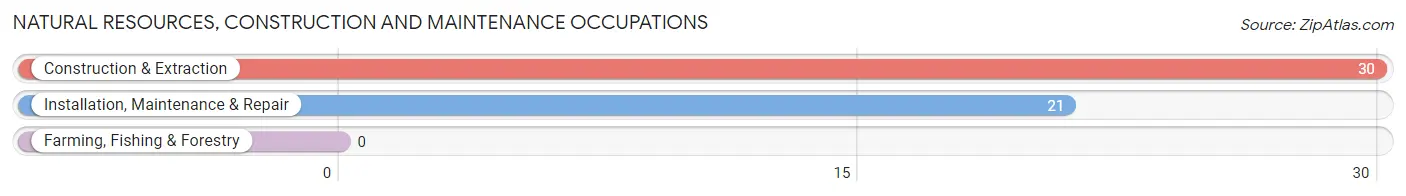
Natural Resources, Construction and Maintenance Occupations
The most common Natural Resources, Construction and Maintenance occupations in Hannawa Falls are Construction & Extraction (30 | 7.4%), and Installation, Maintenance & Repair (21 | 5.2%).
Natural Resources, Construction and Maintenance Occupations by Sex
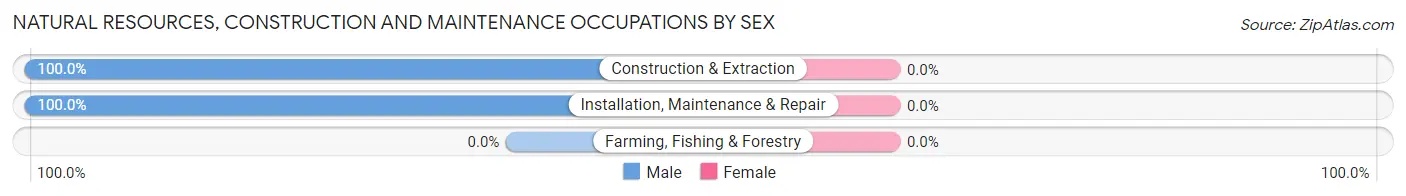
| Occupation | Male | Female |
| Farming, Fishing & Forestry | 0 (0.0%) | 0 (0.0%) |
| Construction & Extraction | 30 (100.0%) | 0 (0.0%) |
| Installation, Maintenance & Repair | 21 (100.0%) | 0 (0.0%) |
| Total (Category) | 51 (100.0%) | 0 (0.0%) |
| Total (Overall) | 219 (53.9%) | 187 (46.1%) |
Production, Transportation and Moving Occupations
The most common Production, Transportation and Moving occupations in Hannawa Falls are , and Production (8 | 2.0%).
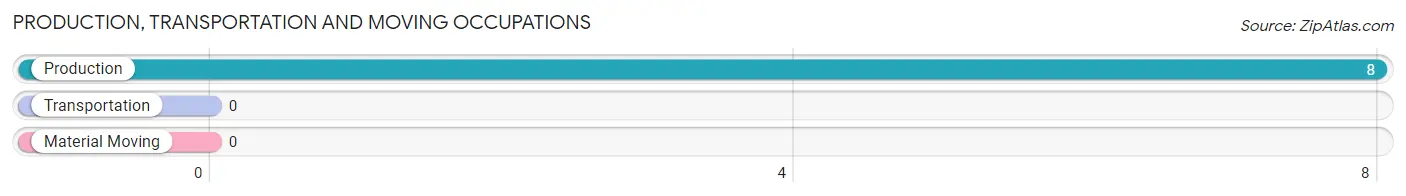
Production, Transportation and Moving Occupations by Sex
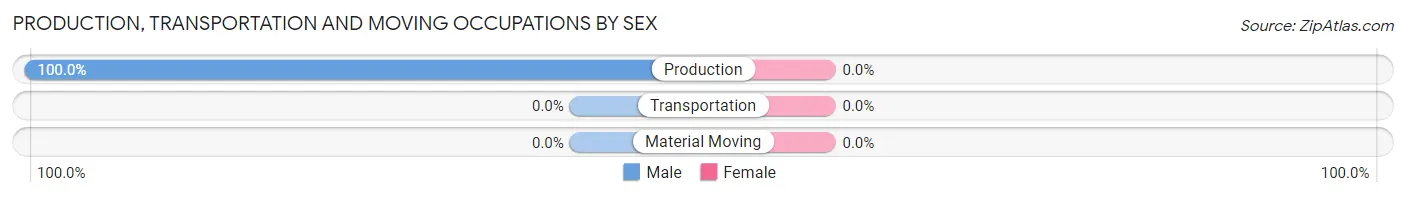
| Occupation | Male | Female |
| Production | 8 (100.0%) | 0 (0.0%) |
| Transportation | 0 (0.0%) | 0 (0.0%) |
| Material Moving | 0 (0.0%) | 0 (0.0%) |
| Total (Category) | 8 (100.0%) | 0 (0.0%) |
| Total (Overall) | 219 (53.9%) | 187 (46.1%) |
Employment Industries by Sex in Hannawa Falls
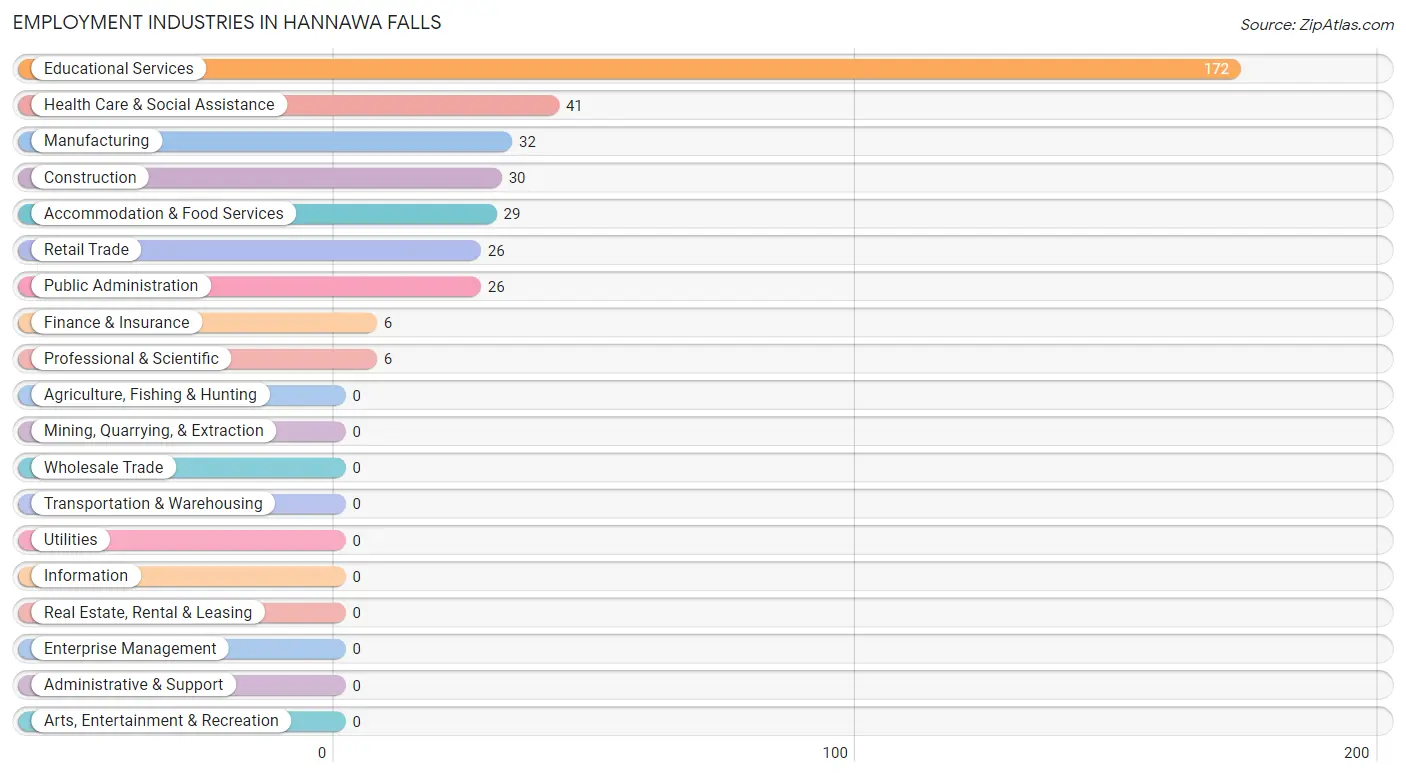
Employment Industries in Hannawa Falls
The major employment industries in Hannawa Falls include Educational Services (172 | 42.4%), Health Care & Social Assistance (41 | 10.1%), Manufacturing (32 | 7.9%), Construction (30 | 7.4%), and Accommodation & Food Services (29 | 7.1%).
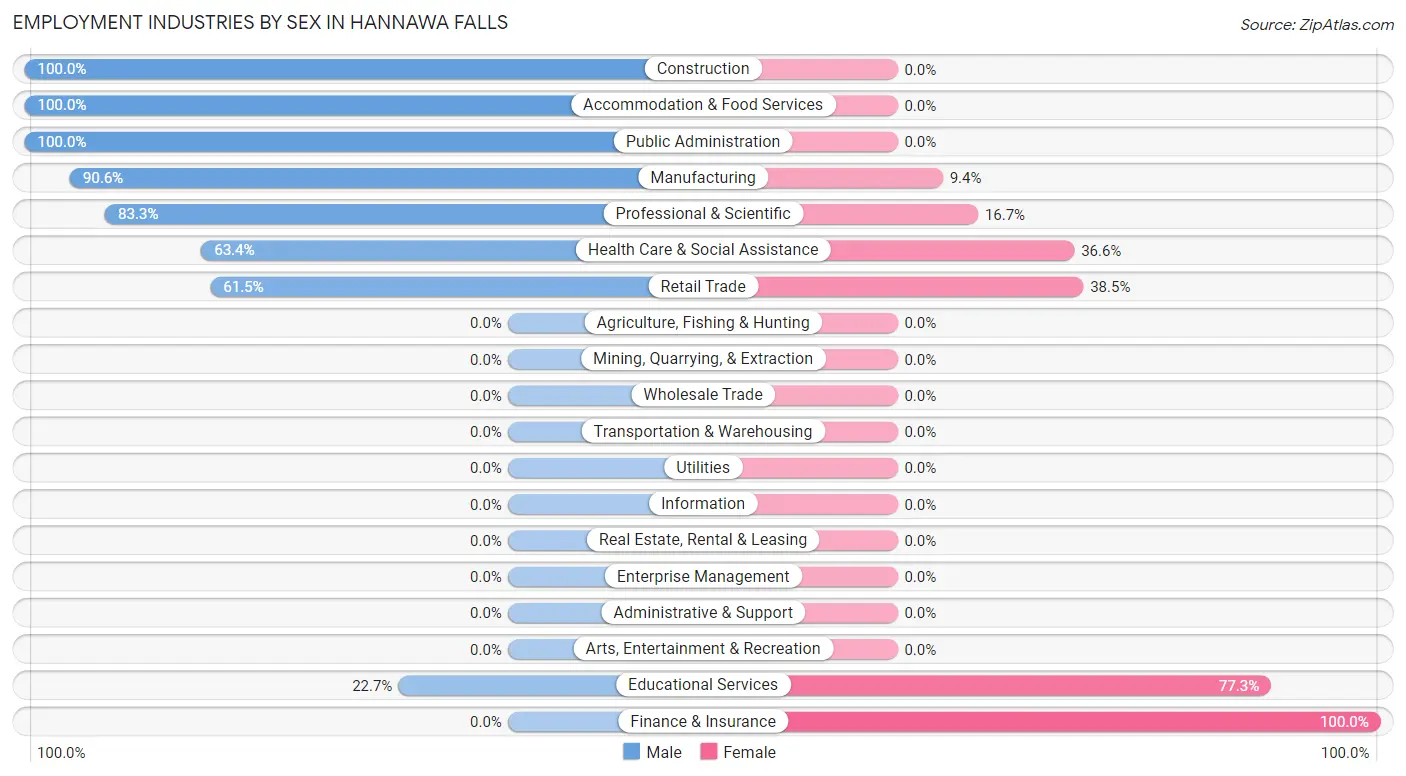
Employment Industries by Sex in Hannawa Falls
The Hannawa Falls industries that see more men than women are Construction (100.0%), Accommodation & Food Services (100.0%), and Public Administration (100.0%), whereas the industries that tend to have a higher number of women are Finance & Insurance (100.0%), Educational Services (77.3%), and Retail Trade (38.5%).
| Industry | Male | Female |
| Agriculture, Fishing & Hunting | 0 (0.0%) | 0 (0.0%) |
| Mining, Quarrying, & Extraction | 0 (0.0%) | 0 (0.0%) |
| Construction | 30 (100.0%) | 0 (0.0%) |
| Manufacturing | 29 (90.6%) | 3 (9.4%) |
| Wholesale Trade | 0 (0.0%) | 0 (0.0%) |
| Retail Trade | 16 (61.5%) | 10 (38.5%) |
| Transportation & Warehousing | 0 (0.0%) | 0 (0.0%) |
| Utilities | 0 (0.0%) | 0 (0.0%) |
| Information | 0 (0.0%) | 0 (0.0%) |
| Finance & Insurance | 0 (0.0%) | 6 (100.0%) |
| Real Estate, Rental & Leasing | 0 (0.0%) | 0 (0.0%) |
| Professional & Scientific | 5 (83.3%) | 1 (16.7%) |
| Enterprise Management | 0 (0.0%) | 0 (0.0%) |
| Administrative & Support | 0 (0.0%) | 0 (0.0%) |
| Educational Services | 39 (22.7%) | 133 (77.3%) |
| Health Care & Social Assistance | 26 (63.4%) | 15 (36.6%) |
| Arts, Entertainment & Recreation | 0 (0.0%) | 0 (0.0%) |
| Accommodation & Food Services | 29 (100.0%) | 0 (0.0%) |
| Public Administration | 26 (100.0%) | 0 (0.0%) |
| Total | 219 (53.9%) | 187 (46.1%) |
Education in Hannawa Falls
School Enrollment in Hannawa Falls
The most common levels of schooling among the 137 students in Hannawa Falls are college / undergraduate (56 | 40.9%), middle school (40 | 29.2%), and elementary school (24 | 17.5%).
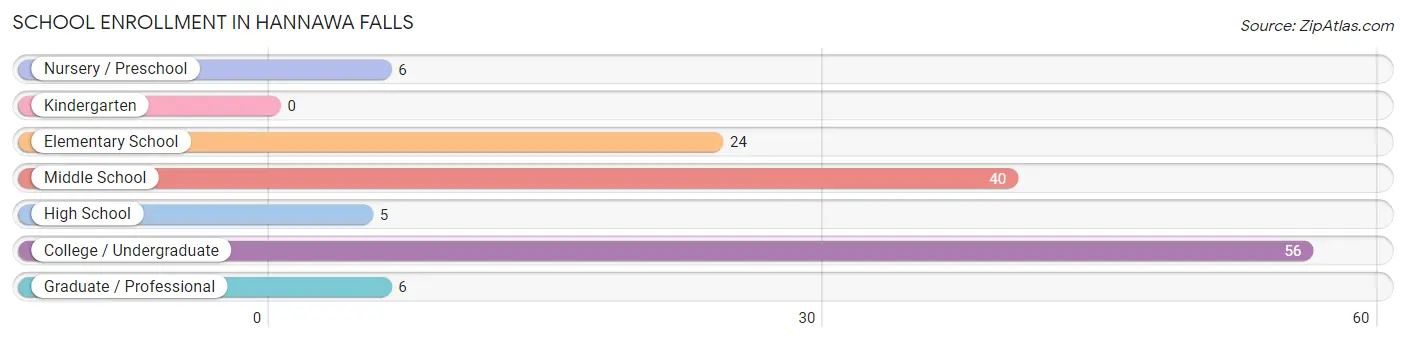
| School Level | # Students | % Students |
| Nursery / Preschool | 6 | 4.4% |
| Kindergarten | 0 | 0.0% |
| Elementary School | 24 | 17.5% |
| Middle School | 40 | 29.2% |
| High School | 5 | 3.6% |
| College / Undergraduate | 56 | 40.9% |
| Graduate / Professional | 6 | 4.4% |
| Total | 137 | 100.0% |
School Enrollment by Age by Funding Source in Hannawa Falls
Out of a total of 137 students who are enrolled in schools in Hannawa Falls, 16 (11.7%) attend a private institution, while the remaining 121 (88.3%) are enrolled in public schools. The age group of 15 to 17 year olds has the highest likelihood of being enrolled in private schools, with 5 (100.0% in the age bracket) enrolled. Conversely, the age group of 3 to 4 year olds has the lowest likelihood of being enrolled in a private school, with 6 (100.0% in the age bracket) attending a public institution.
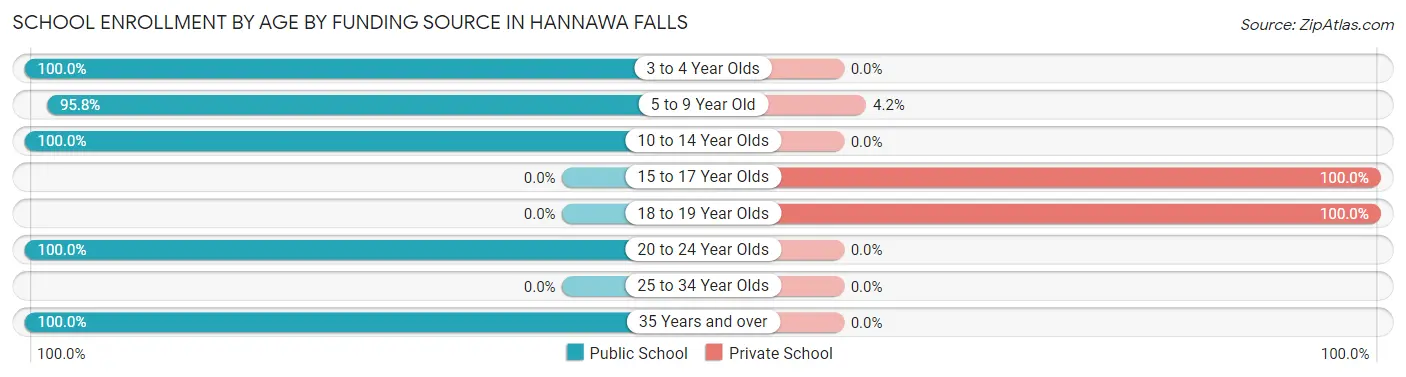
| Age Bracket | Public School | Private School |
| 3 to 4 Year Olds | 6 (100.0%) | 0 (0.0%) |
| 5 to 9 Year Old | 23 (95.8%) | 1 (4.2%) |
| 10 to 14 Year Olds | 40 (100.0%) | 0 (0.0%) |
| 15 to 17 Year Olds | 0 (0.0%) | 5 (100.0%) |
| 18 to 19 Year Olds | 0 (0.0%) | 10 (100.0%) |
| 20 to 24 Year Olds | 46 (100.0%) | 0 (0.0%) |
| 25 to 34 Year Olds | 0 (0.0%) | 0 (0.0%) |
| 35 Years and over | 6 (100.0%) | 0 (0.0%) |
| Total | 121 (88.3%) | 16 (11.7%) |
Educational Attainment by Field of Study in Hannawa Falls
Science & technology (86 | 28.0%), physical & health sciences (45 | 14.7%), education (32 | 10.4%), liberal arts & history (29 | 9.5%), and bio, nature & agricultural (26 | 8.5%) are the most common fields of study among 307 individuals in Hannawa Falls who have obtained a bachelor's degree or higher.
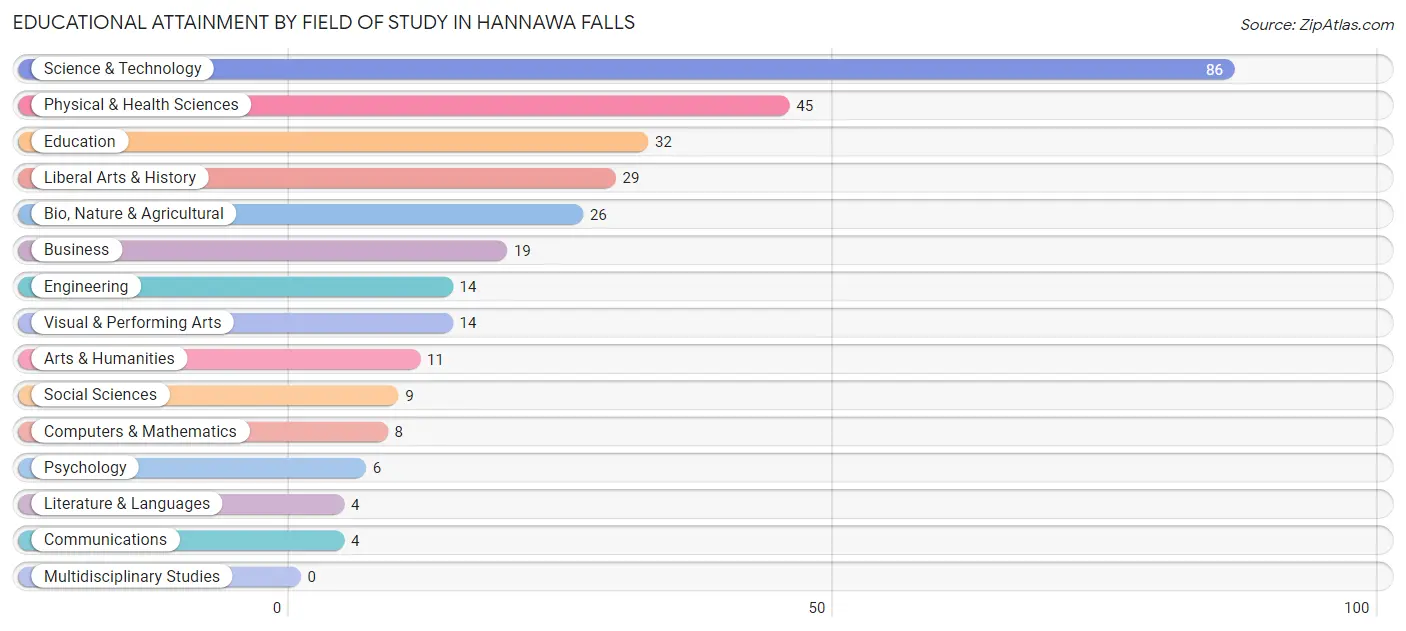
| Field of Study | # Graduates | % Graduates |
| Computers & Mathematics | 8 | 2.6% |
| Bio, Nature & Agricultural | 26 | 8.5% |
| Physical & Health Sciences | 45 | 14.7% |
| Psychology | 6 | 1.9% |
| Social Sciences | 9 | 2.9% |
| Engineering | 14 | 4.6% |
| Multidisciplinary Studies | 0 | 0.0% |
| Science & Technology | 86 | 28.0% |
| Business | 19 | 6.2% |
| Education | 32 | 10.4% |
| Literature & Languages | 4 | 1.3% |
| Liberal Arts & History | 29 | 9.5% |
| Visual & Performing Arts | 14 | 4.6% |
| Communications | 4 | 1.3% |
| Arts & Humanities | 11 | 3.6% |
| Total | 307 | 100.0% |
Transportation & Commute in Hannawa Falls
Vehicle Availability by Sex in Hannawa Falls
The most prevalent vehicle ownership categories in Hannawa Falls are males with 2 vehicles (96, accounting for 43.8%) and females with 2 vehicles (90, making up 51.3%).
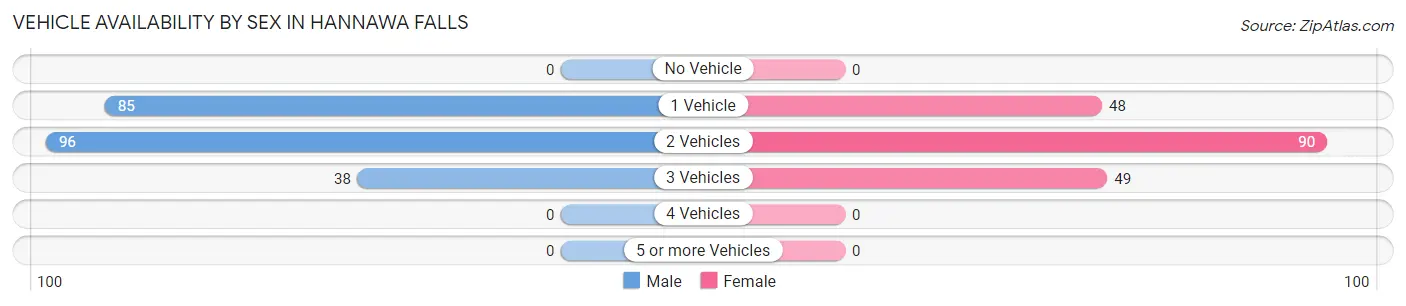
| Vehicles Available | Male | Female |
| No Vehicle | 0 (0.0%) | 0 (0.0%) |
| 1 Vehicle | 85 (38.8%) | 48 (25.7%) |
| 2 Vehicles | 96 (43.8%) | 90 (48.1%) |
| 3 Vehicles | 38 (17.3%) | 49 (26.2%) |
| 4 Vehicles | 0 (0.0%) | 0 (0.0%) |
| 5 or more Vehicles | 0 (0.0%) | 0 (0.0%) |
| Total | 219 (100.0%) | 187 (100.0%) |
Commute Time in Hannawa Falls
The most frequently occuring commute durations in Hannawa Falls are 15 to 19 minutes (110 commuters, 28.3%), 5 to 9 minutes (84 commuters, 21.6%), and 20 to 24 minutes (68 commuters, 17.5%).
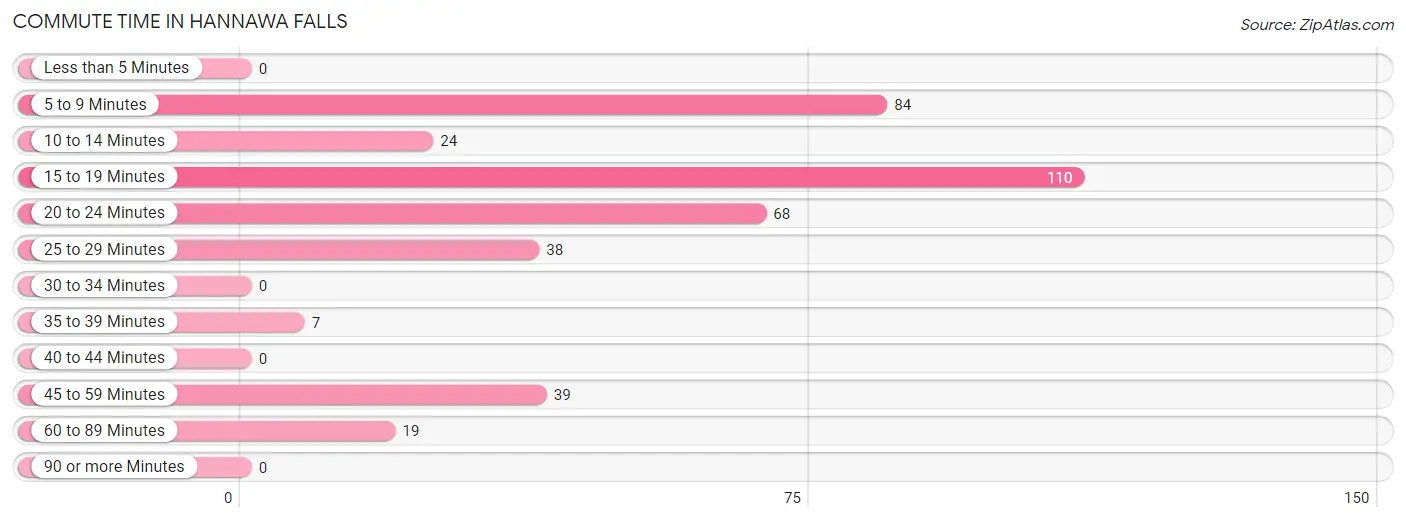
| Commute Time | # Commuters | % Commuters |
| Less than 5 Minutes | 0 | 0.0% |
| 5 to 9 Minutes | 84 | 21.6% |
| 10 to 14 Minutes | 24 | 6.2% |
| 15 to 19 Minutes | 110 | 28.3% |
| 20 to 24 Minutes | 68 | 17.5% |
| 25 to 29 Minutes | 38 | 9.8% |
| 30 to 34 Minutes | 0 | 0.0% |
| 35 to 39 Minutes | 7 | 1.8% |
| 40 to 44 Minutes | 0 | 0.0% |
| 45 to 59 Minutes | 39 | 10.0% |
| 60 to 89 Minutes | 19 | 4.9% |
| 90 or more Minutes | 0 | 0.0% |
Commute Time by Sex in Hannawa Falls
The most common commute times in Hannawa Falls are 15 to 19 minutes (60 commuters, 29.1%) for males and 20 to 24 minutes (62 commuters, 33.9%) for females.
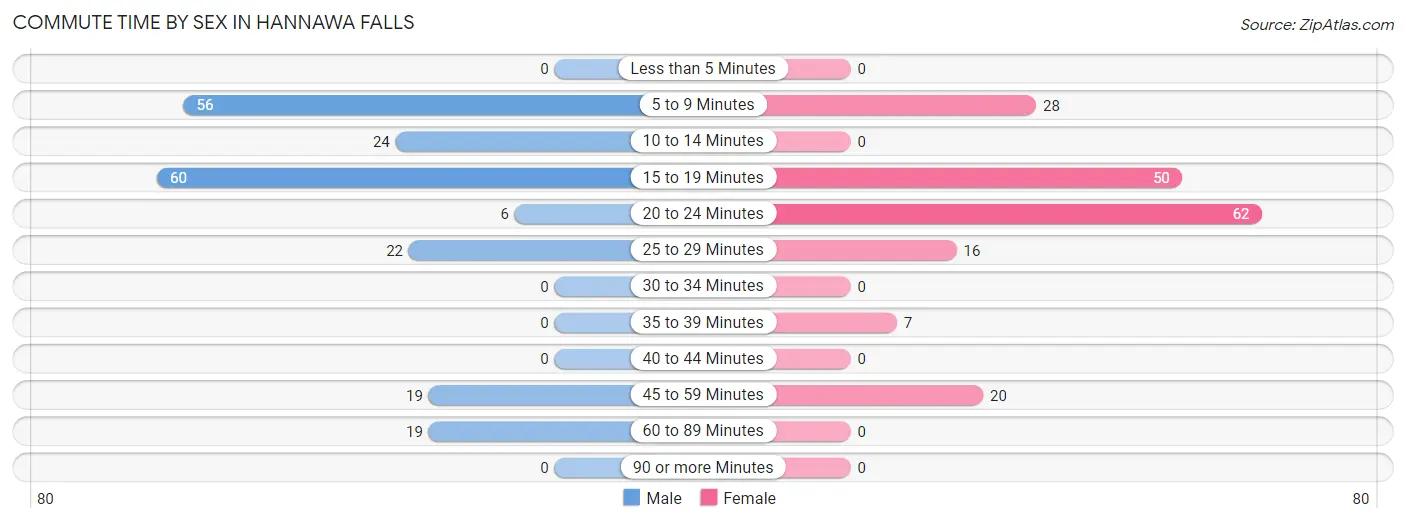
| Commute Time | Male | Female |
| Less than 5 Minutes | 0 (0.0%) | 0 (0.0%) |
| 5 to 9 Minutes | 56 (27.2%) | 28 (15.3%) |
| 10 to 14 Minutes | 24 (11.7%) | 0 (0.0%) |
| 15 to 19 Minutes | 60 (29.1%) | 50 (27.3%) |
| 20 to 24 Minutes | 6 (2.9%) | 62 (33.9%) |
| 25 to 29 Minutes | 22 (10.7%) | 16 (8.7%) |
| 30 to 34 Minutes | 0 (0.0%) | 0 (0.0%) |
| 35 to 39 Minutes | 0 (0.0%) | 7 (3.8%) |
| 40 to 44 Minutes | 0 (0.0%) | 0 (0.0%) |
| 45 to 59 Minutes | 19 (9.2%) | 20 (10.9%) |
| 60 to 89 Minutes | 19 (9.2%) | 0 (0.0%) |
| 90 or more Minutes | 0 (0.0%) | 0 (0.0%) |
Time of Departure to Work by Sex in Hannawa Falls
The most frequent times of departure to work in Hannawa Falls are 8:00 AM to 8:29 AM (56, 27.2%) for males and 7:30 AM to 7:59 AM (71, 38.8%) for females.
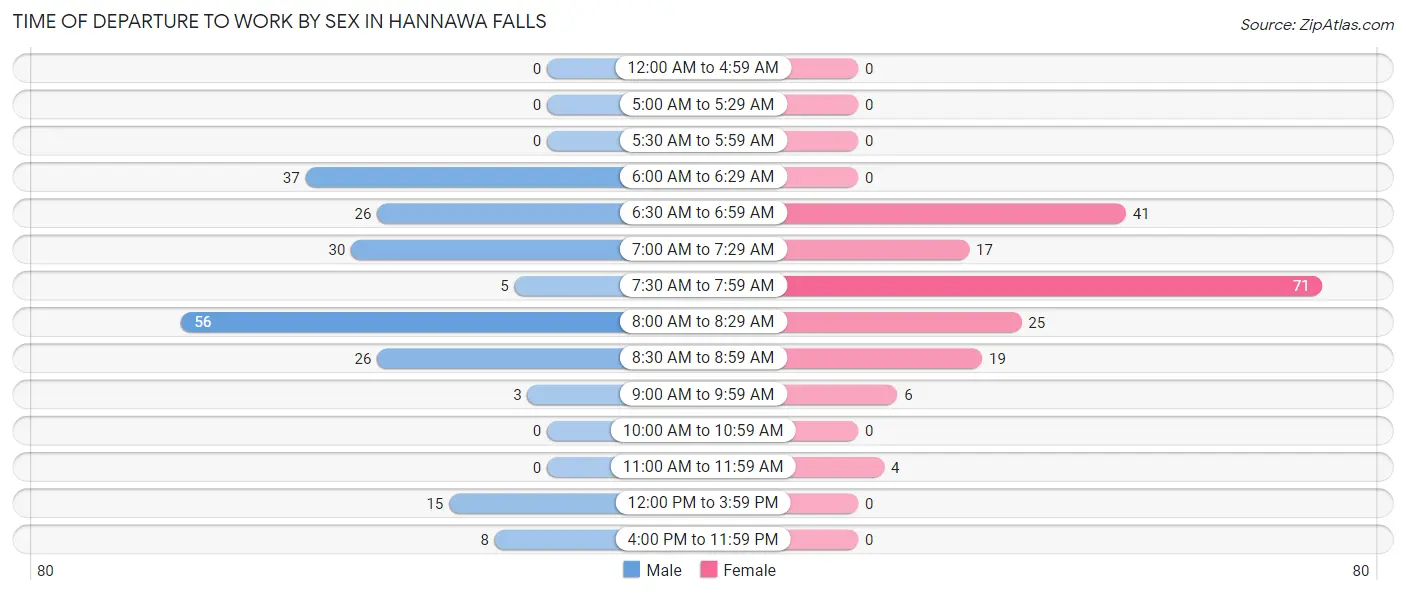
| Time of Departure | Male | Female |
| 12:00 AM to 4:59 AM | 0 (0.0%) | 0 (0.0%) |
| 5:00 AM to 5:29 AM | 0 (0.0%) | 0 (0.0%) |
| 5:30 AM to 5:59 AM | 0 (0.0%) | 0 (0.0%) |
| 6:00 AM to 6:29 AM | 37 (18.0%) | 0 (0.0%) |
| 6:30 AM to 6:59 AM | 26 (12.6%) | 41 (22.4%) |
| 7:00 AM to 7:29 AM | 30 (14.6%) | 17 (9.3%) |
| 7:30 AM to 7:59 AM | 5 (2.4%) | 71 (38.8%) |
| 8:00 AM to 8:29 AM | 56 (27.2%) | 25 (13.7%) |
| 8:30 AM to 8:59 AM | 26 (12.6%) | 19 (10.4%) |
| 9:00 AM to 9:59 AM | 3 (1.5%) | 6 (3.3%) |
| 10:00 AM to 10:59 AM | 0 (0.0%) | 0 (0.0%) |
| 11:00 AM to 11:59 AM | 0 (0.0%) | 4 (2.2%) |
| 12:00 PM to 3:59 PM | 15 (7.3%) | 0 (0.0%) |
| 4:00 PM to 11:59 PM | 8 (3.9%) | 0 (0.0%) |
| Total | 206 (100.0%) | 183 (100.0%) |
Housing Occupancy in Hannawa Falls
Occupancy by Ownership in Hannawa Falls
Of the total 419 dwellings in Hannawa Falls, owner-occupied units account for 352 (84.0%), while renter-occupied units make up 67 (16.0%).
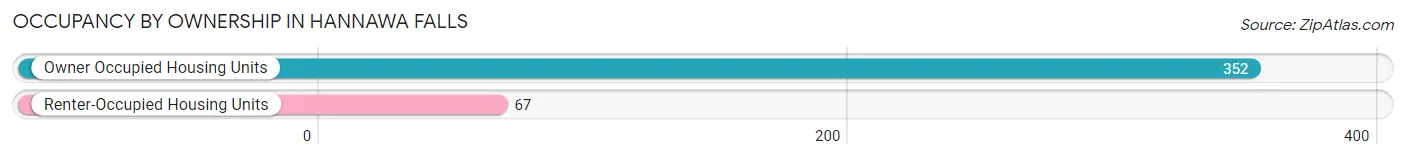
| Occupancy | # Housing Units | % Housing Units |
| Owner Occupied Housing Units | 352 | 84.0% |
| Renter-Occupied Housing Units | 67 | 16.0% |
| Total Occupied Housing Units | 419 | 100.0% |
Occupancy by Household Size in Hannawa Falls
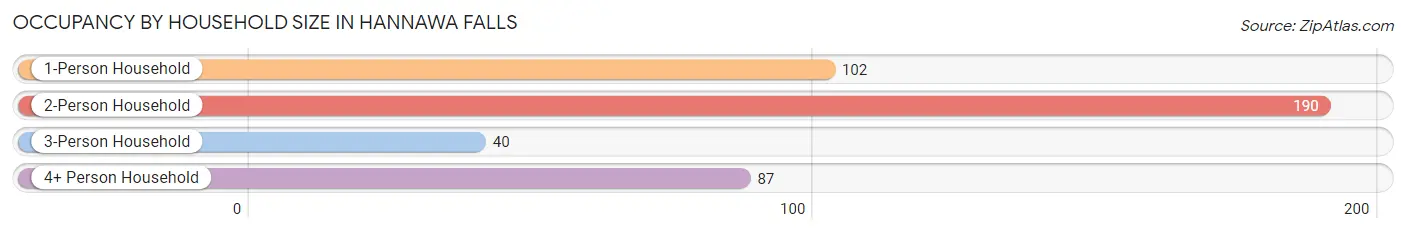
| Household Size | # Housing Units | % Housing Units |
| 1-Person Household | 102 | 24.3% |
| 2-Person Household | 190 | 45.4% |
| 3-Person Household | 40 | 9.6% |
| 4+ Person Household | 87 | 20.8% |
| Total Housing Units | 419 | 100.0% |
Occupancy by Ownership by Household Size in Hannawa Falls
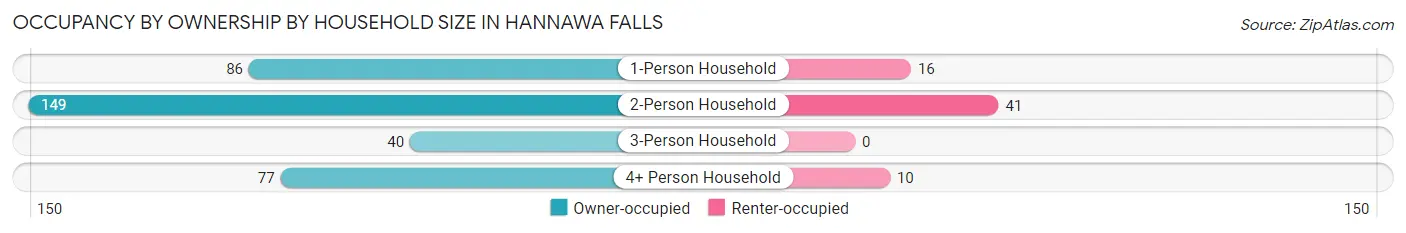
| Household Size | Owner-occupied | Renter-occupied |
| 1-Person Household | 86 (84.3%) | 16 (15.7%) |
| 2-Person Household | 149 (78.4%) | 41 (21.6%) |
| 3-Person Household | 40 (100.0%) | 0 (0.0%) |
| 4+ Person Household | 77 (88.5%) | 10 (11.5%) |
| Total Housing Units | 352 (84.0%) | 67 (16.0%) |
Occupancy by Educational Attainment in Hannawa Falls
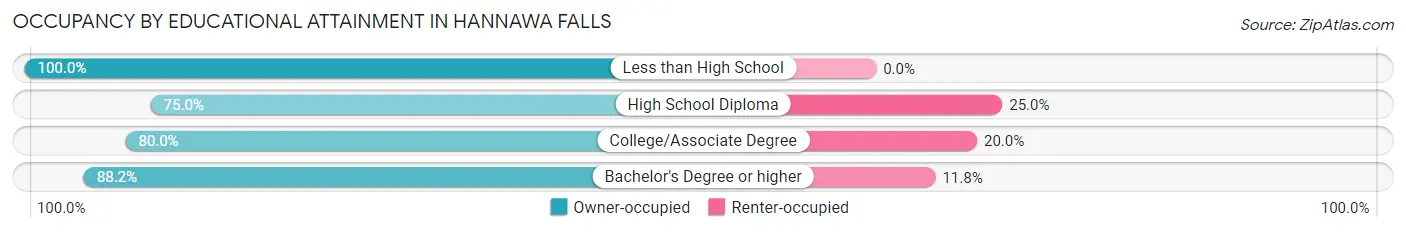
| Household Size | Owner-occupied | Renter-occupied |
| Less than High School | 4 (100.0%) | 0 (0.0%) |
| High School Diploma | 33 (75.0%) | 11 (25.0%) |
| College/Associate Degree | 120 (80.0%) | 30 (20.0%) |
| Bachelor's Degree or higher | 195 (88.2%) | 26 (11.8%) |
Occupancy by Age of Householder in Hannawa Falls
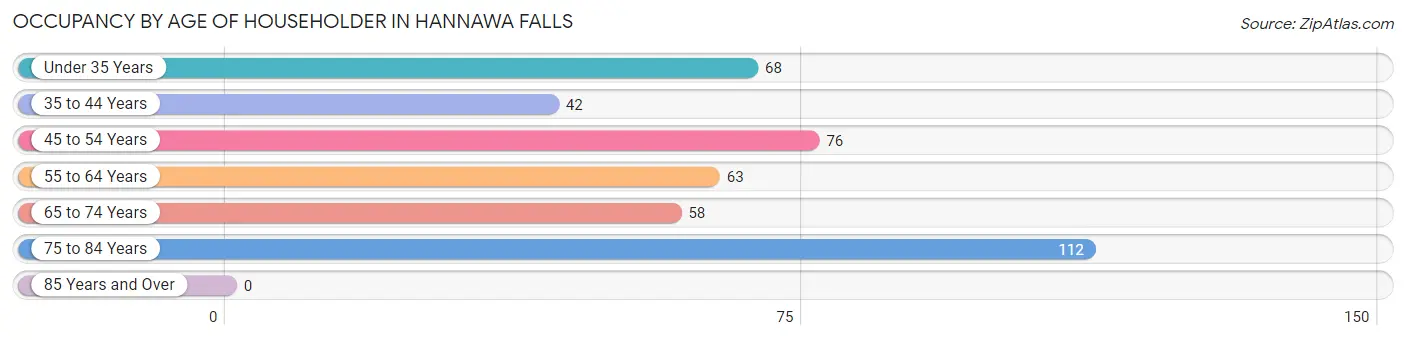
| Age Bracket | # Households | % Households |
| Under 35 Years | 68 | 16.2% |
| 35 to 44 Years | 42 | 10.0% |
| 45 to 54 Years | 76 | 18.1% |
| 55 to 64 Years | 63 | 15.0% |
| 65 to 74 Years | 58 | 13.8% |
| 75 to 84 Years | 112 | 26.7% |
| 85 Years and Over | 0 | 0.0% |
| Total | 419 | 100.0% |
Housing Finances in Hannawa Falls
Median Income by Occupancy in Hannawa Falls
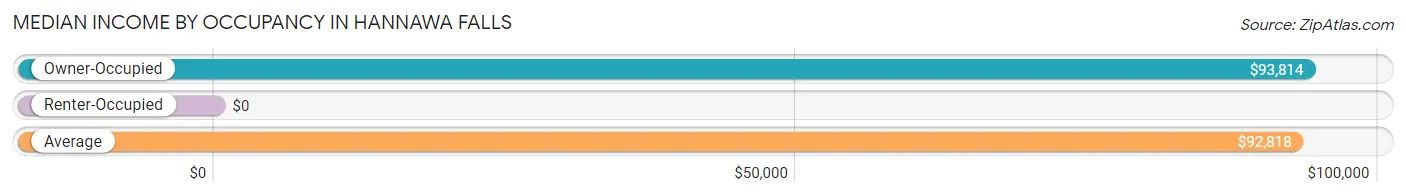
| Occupancy Type | # Households | Median Income |
| Owner-Occupied | 352 (84.0%) | $93,814 |
| Renter-Occupied | 67 (16.0%) | $0 |
| Average | 419 (100.0%) | $92,818 |
Occupancy by Householder Income Bracket in Hannawa Falls
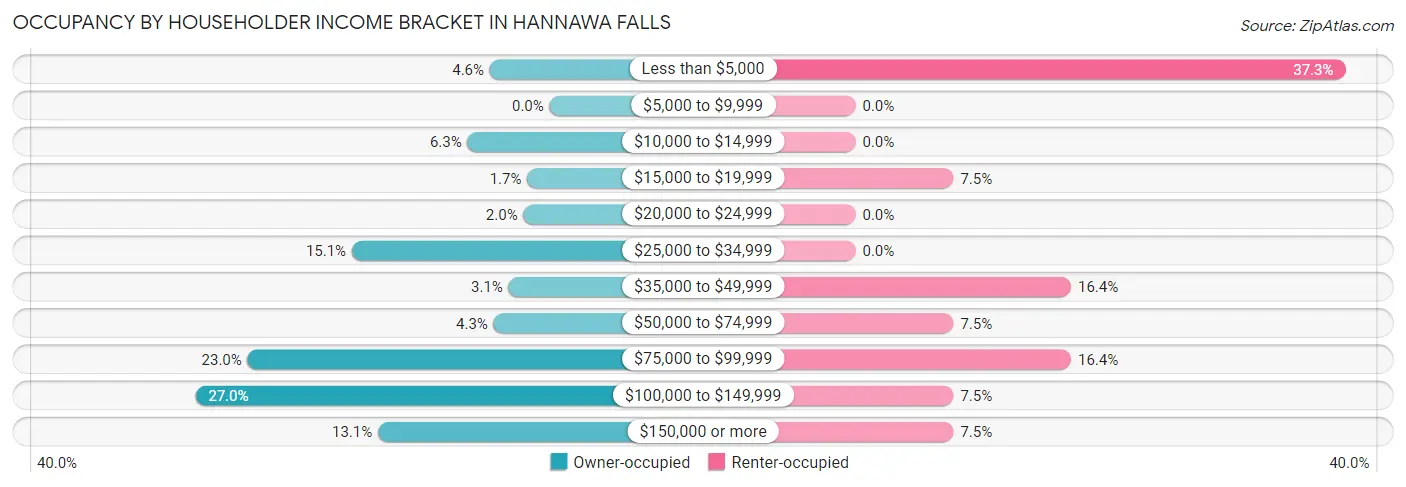
| Income Bracket | Owner-occupied | Renter-occupied |
| Less than $5,000 | 16 (4.5%) | 25 (37.3%) |
| $5,000 to $9,999 | 0 (0.0%) | 0 (0.0%) |
| $10,000 to $14,999 | 22 (6.2%) | 0 (0.0%) |
| $15,000 to $19,999 | 6 (1.7%) | 5 (7.5%) |
| $20,000 to $24,999 | 7 (2.0%) | 0 (0.0%) |
| $25,000 to $34,999 | 53 (15.1%) | 0 (0.0%) |
| $35,000 to $49,999 | 11 (3.1%) | 11 (16.4%) |
| $50,000 to $74,999 | 15 (4.3%) | 5 (7.5%) |
| $75,000 to $99,999 | 81 (23.0%) | 11 (16.4%) |
| $100,000 to $149,999 | 95 (27.0%) | 5 (7.5%) |
| $150,000 or more | 46 (13.1%) | 5 (7.5%) |
| Total | 352 (100.0%) | 67 (100.0%) |
Monthly Housing Cost Tiers in Hannawa Falls
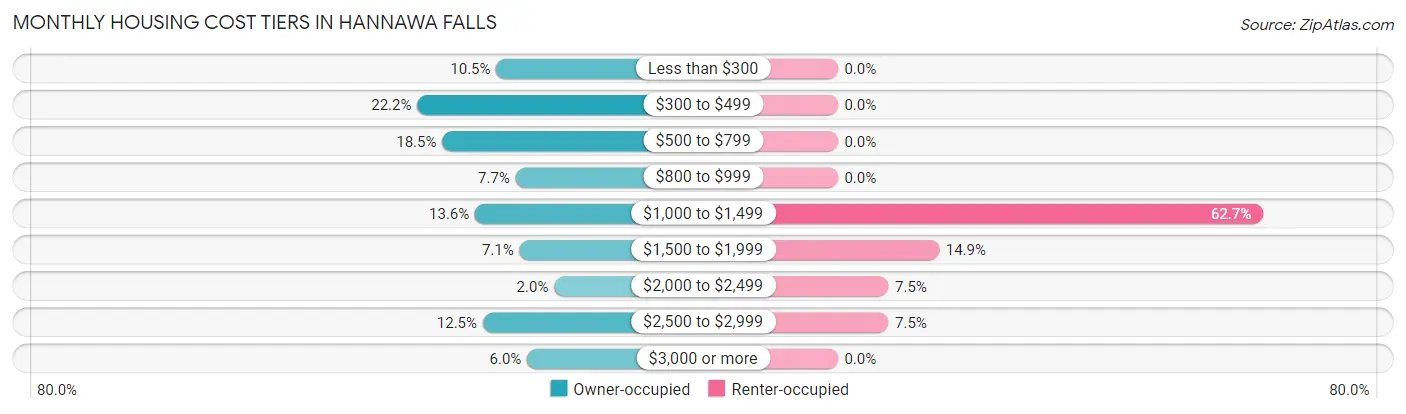
| Monthly Cost | Owner-occupied | Renter-occupied |
| Less than $300 | 37 (10.5%) | 0 (0.0%) |
| $300 to $499 | 78 (22.2%) | 0 (0.0%) |
| $500 to $799 | 65 (18.5%) | 0 (0.0%) |
| $800 to $999 | 27 (7.7%) | 0 (0.0%) |
| $1,000 to $1,499 | 48 (13.6%) | 42 (62.7%) |
| $1,500 to $1,999 | 25 (7.1%) | 10 (14.9%) |
| $2,000 to $2,499 | 7 (2.0%) | 5 (7.5%) |
| $2,500 to $2,999 | 44 (12.5%) | 5 (7.5%) |
| $3,000 or more | 21 (6.0%) | 0 (0.0%) |
| Total | 352 (100.0%) | 67 (100.0%) |
Physical Housing Characteristics in Hannawa Falls
Housing Structures in Hannawa Falls
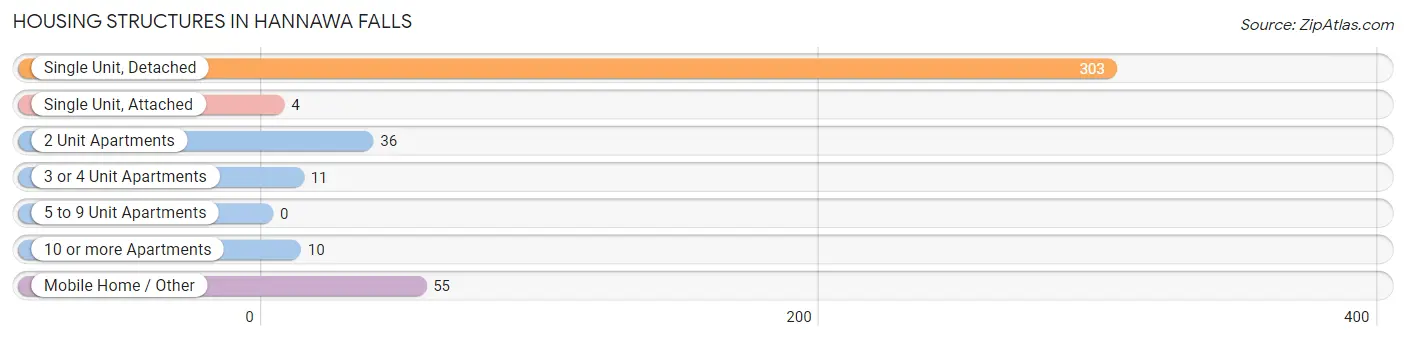
| Structure Type | # Housing Units | % Housing Units |
| Single Unit, Detached | 303 | 72.3% |
| Single Unit, Attached | 4 | 0.9% |
| 2 Unit Apartments | 36 | 8.6% |
| 3 or 4 Unit Apartments | 11 | 2.6% |
| 5 to 9 Unit Apartments | 0 | 0.0% |
| 10 or more Apartments | 10 | 2.4% |
| Mobile Home / Other | 55 | 13.1% |
| Total | 419 | 100.0% |
Housing Structures by Occupancy in Hannawa Falls
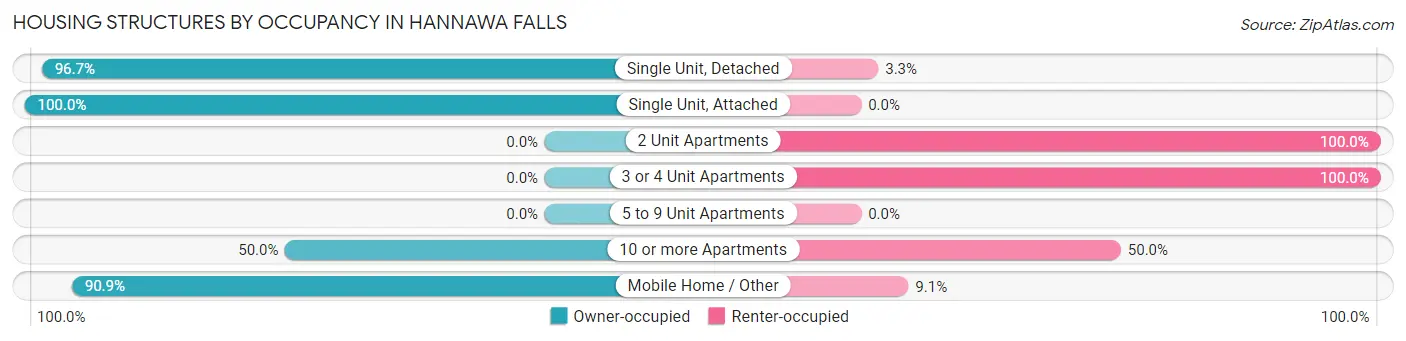
| Structure Type | Owner-occupied | Renter-occupied |
| Single Unit, Detached | 293 (96.7%) | 10 (3.3%) |
| Single Unit, Attached | 4 (100.0%) | 0 (0.0%) |
| 2 Unit Apartments | 0 (0.0%) | 36 (100.0%) |
| 3 or 4 Unit Apartments | 0 (0.0%) | 11 (100.0%) |
| 5 to 9 Unit Apartments | 0 (0.0%) | 0 (0.0%) |
| 10 or more Apartments | 5 (50.0%) | 5 (50.0%) |
| Mobile Home / Other | 50 (90.9%) | 5 (9.1%) |
| Total | 352 (84.0%) | 67 (16.0%) |
Housing Structures by Number of Rooms in Hannawa Falls
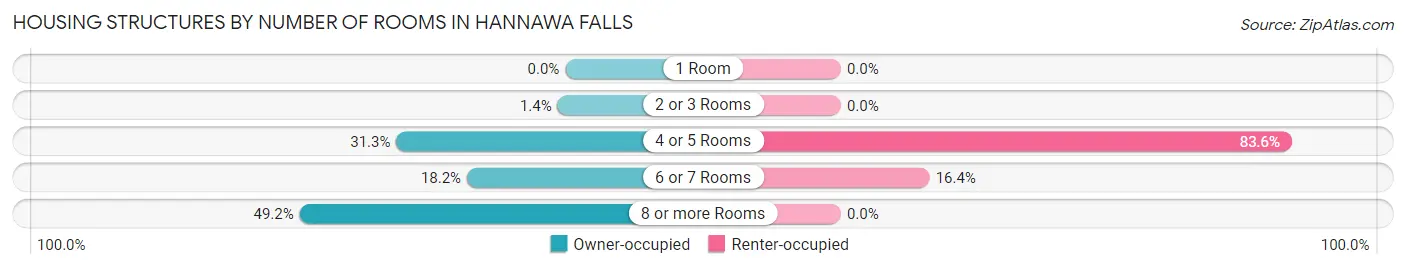
| Number of Rooms | Owner-occupied | Renter-occupied |
| 1 Room | 0 (0.0%) | 0 (0.0%) |
| 2 or 3 Rooms | 5 (1.4%) | 0 (0.0%) |
| 4 or 5 Rooms | 110 (31.2%) | 56 (83.6%) |
| 6 or 7 Rooms | 64 (18.2%) | 11 (16.4%) |
| 8 or more Rooms | 173 (49.1%) | 0 (0.0%) |
| Total | 352 (100.0%) | 67 (100.0%) |
Housing Structure by Heating Type in Hannawa Falls
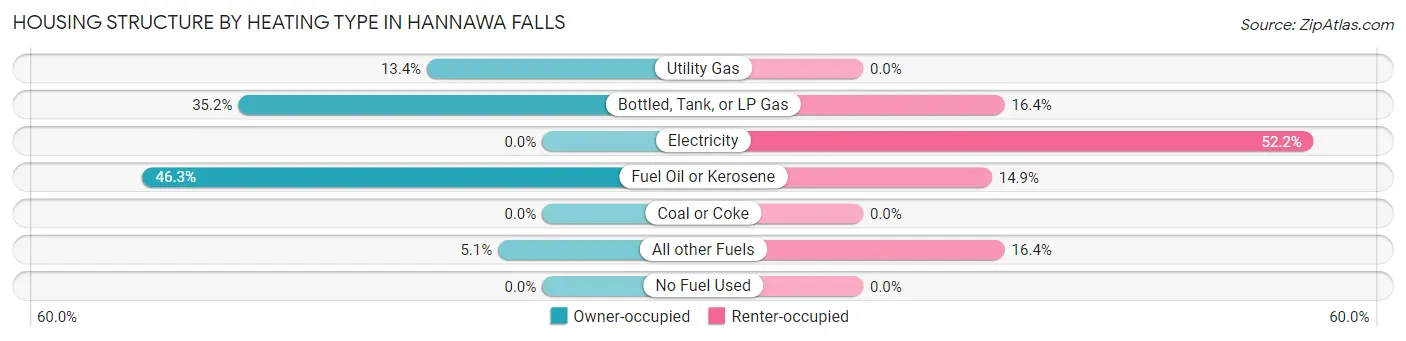
| Heating Type | Owner-occupied | Renter-occupied |
| Utility Gas | 47 (13.4%) | 0 (0.0%) |
| Bottled, Tank, or LP Gas | 124 (35.2%) | 11 (16.4%) |
| Electricity | 0 (0.0%) | 35 (52.2%) |
| Fuel Oil or Kerosene | 163 (46.3%) | 10 (14.9%) |
| Coal or Coke | 0 (0.0%) | 0 (0.0%) |
| All other Fuels | 18 (5.1%) | 11 (16.4%) |
| No Fuel Used | 0 (0.0%) | 0 (0.0%) |
| Total | 352 (100.0%) | 67 (100.0%) |
Household Vehicle Usage in Hannawa Falls
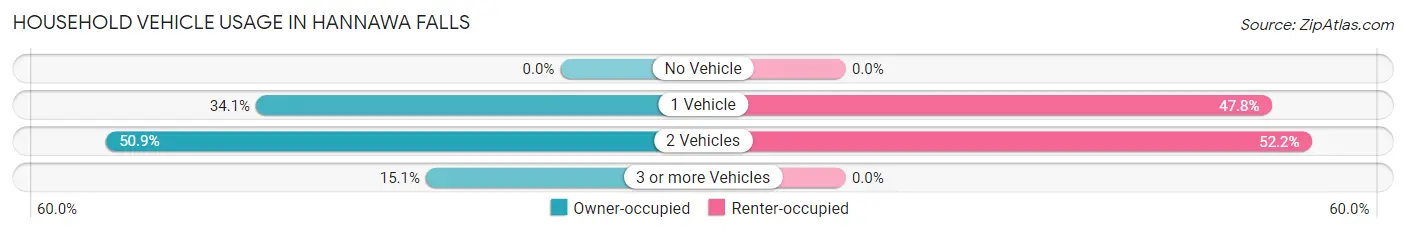
| Vehicles per Household | Owner-occupied | Renter-occupied |
| No Vehicle | 0 (0.0%) | 0 (0.0%) |
| 1 Vehicle | 120 (34.1%) | 32 (47.8%) |
| 2 Vehicles | 179 (50.8%) | 35 (52.2%) |
| 3 or more Vehicles | 53 (15.1%) | 0 (0.0%) |
| Total | 352 (100.0%) | 67 (100.0%) |
Real Estate & Mortgages in Hannawa Falls
Real Estate and Mortgage Overview in Hannawa Falls
| Characteristic | Without Mortgage | With Mortgage |
| Housing Units | 203 | 149 |
| Median Property Value | $140,800 | $256,800 |
| Median Household Income | - | - |
| Monthly Housing Costs | $388 | $21 |
| Real Estate Taxes | - | - |
Property Value by Mortgage Status in Hannawa Falls
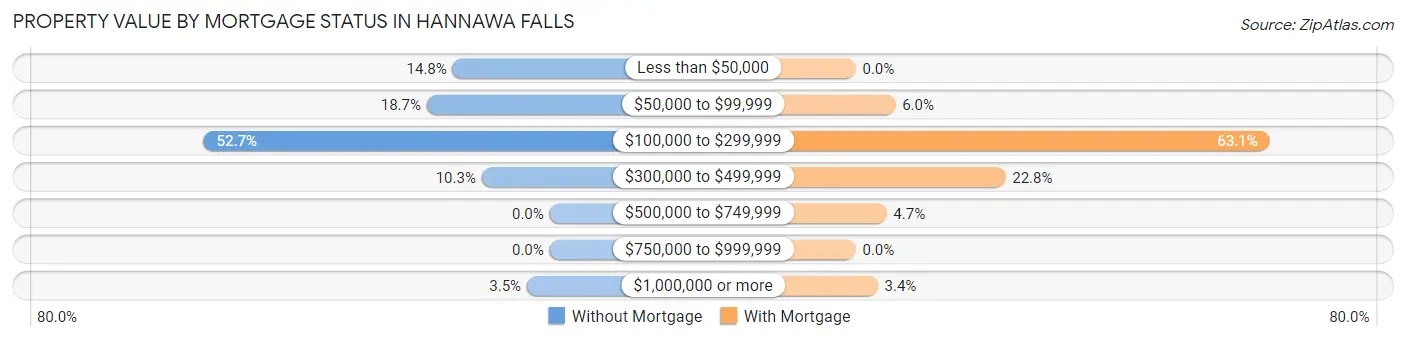
| Property Value | Without Mortgage | With Mortgage |
| Less than $50,000 | 30 (14.8%) | 0 (0.0%) |
| $50,000 to $99,999 | 38 (18.7%) | 9 (6.0%) |
| $100,000 to $299,999 | 107 (52.7%) | 94 (63.1%) |
| $300,000 to $499,999 | 21 (10.3%) | 34 (22.8%) |
| $500,000 to $749,999 | 0 (0.0%) | 7 (4.7%) |
| $750,000 to $999,999 | 0 (0.0%) | 0 (0.0%) |
| $1,000,000 or more | 7 (3.5%) | 5 (3.4%) |
| Total | 203 (100.0%) | 149 (100.0%) |
Household Income by Mortgage Status in Hannawa Falls
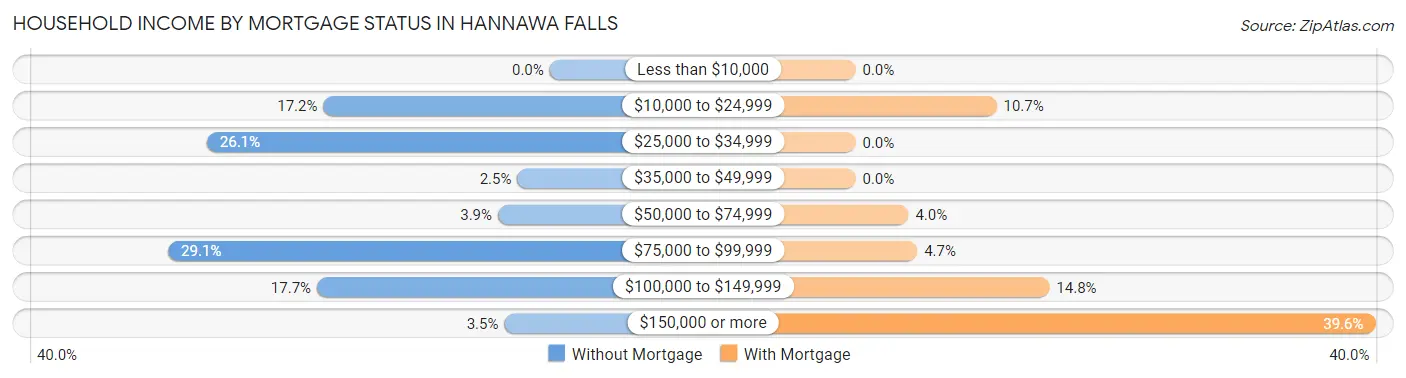
| Household Income | Without Mortgage | With Mortgage |
| Less than $10,000 | 0 (0.0%) | 0 (0.0%) |
| $10,000 to $24,999 | 35 (17.2%) | 16 (10.7%) |
| $25,000 to $34,999 | 53 (26.1%) | 0 (0.0%) |
| $35,000 to $49,999 | 5 (2.5%) | 0 (0.0%) |
| $50,000 to $74,999 | 8 (3.9%) | 6 (4.0%) |
| $75,000 to $99,999 | 59 (29.1%) | 7 (4.7%) |
| $100,000 to $149,999 | 36 (17.7%) | 22 (14.8%) |
| $150,000 or more | 7 (3.5%) | 59 (39.6%) |
| Total | 203 (100.0%) | 149 (100.0%) |
Property Value to Household Income Ratio in Hannawa Falls
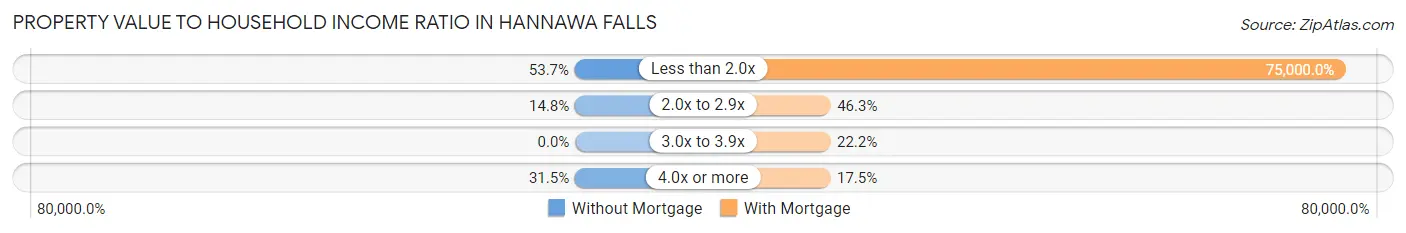
| Value-to-Income Ratio | Without Mortgage | With Mortgage |
| Less than 2.0x | 109 (53.7%) | 111,750 (75,000.0%) |
| 2.0x to 2.9x | 30 (14.8%) | 69 (46.3%) |
| 3.0x to 3.9x | 0 (0.0%) | 33 (22.2%) |
| 4.0x or more | 64 (31.5%) | 26 (17.4%) |
| Total | 203 (100.0%) | 149 (100.0%) |
Real Estate Taxes by Mortgage Status in Hannawa Falls
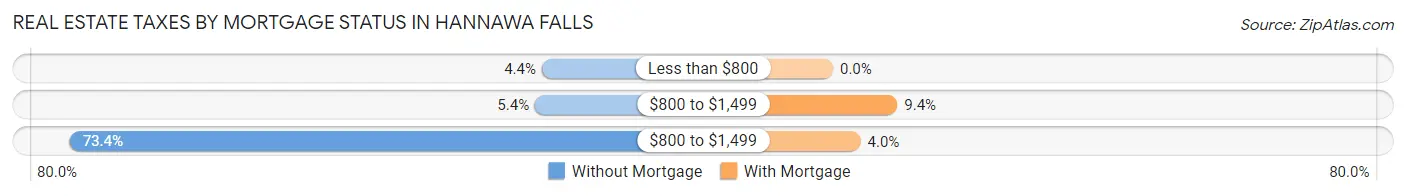
| Property Taxes | Without Mortgage | With Mortgage |
| Less than $800 | 9 (4.4%) | 0 (0.0%) |
| $800 to $1,499 | 11 (5.4%) | 14 (9.4%) |
| $800 to $1,499 | 149 (73.4%) | 6 (4.0%) |
| Total | 203 (100.0%) | 149 (100.0%) |
Health & Disability in Hannawa Falls
Health Insurance Coverage by Age in Hannawa Falls
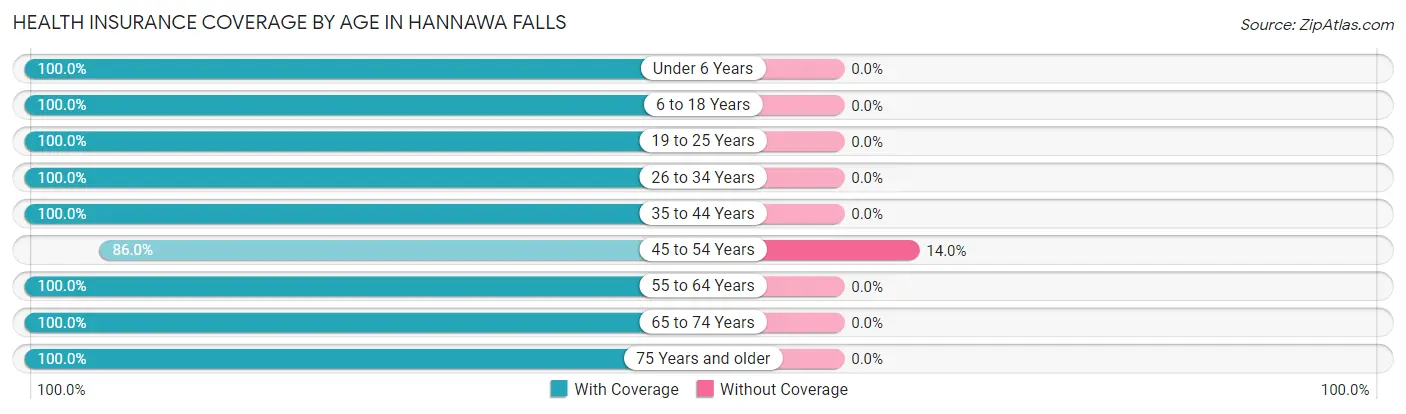
| Age Bracket | With Coverage | Without Coverage |
| Under 6 Years | 66 (100.0%) | 0 (0.0%) |
| 6 to 18 Years | 85 (100.0%) | 0 (0.0%) |
| 19 to 25 Years | 83 (100.0%) | 0 (0.0%) |
| 26 to 34 Years | 74 (100.0%) | 0 (0.0%) |
| 35 to 44 Years | 106 (100.0%) | 0 (0.0%) |
| 45 to 54 Years | 129 (86.0%) | 21 (14.0%) |
| 55 to 64 Years | 76 (100.0%) | 0 (0.0%) |
| 65 to 74 Years | 93 (100.0%) | 0 (0.0%) |
| 75 Years and older | 159 (100.0%) | 0 (0.0%) |
| Total | 871 (97.7%) | 21 (2.4%) |
Health Insurance Coverage by Citizenship Status in Hannawa Falls
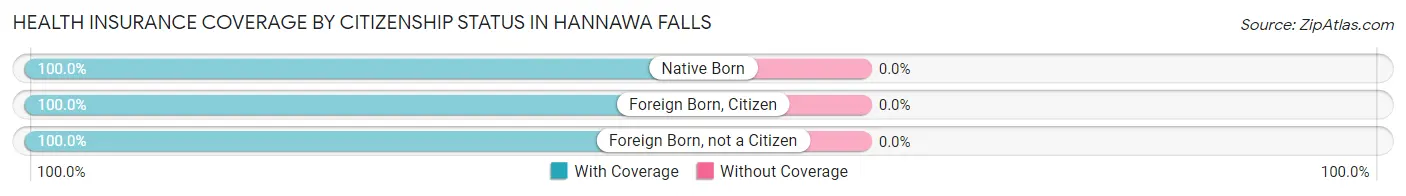
| Citizenship Status | With Coverage | Without Coverage |
| Native Born | 66 (100.0%) | 0 (0.0%) |
| Foreign Born, Citizen | 85 (100.0%) | 0 (0.0%) |
| Foreign Born, not a Citizen | 83 (100.0%) | 0 (0.0%) |
Health Insurance Coverage by Household Income in Hannawa Falls
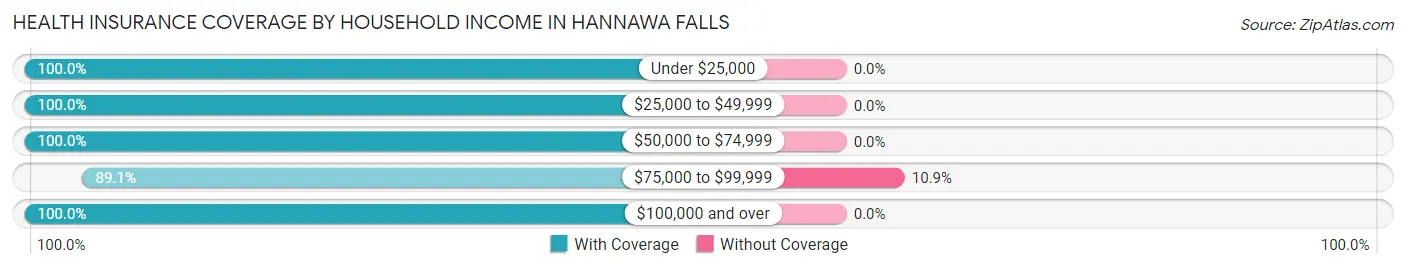
| Household Income | With Coverage | Without Coverage |
| Under $25,000 | 93 (100.0%) | 0 (0.0%) |
| $25,000 to $49,999 | 125 (100.0%) | 0 (0.0%) |
| $50,000 to $74,999 | 48 (100.0%) | 0 (0.0%) |
| $75,000 to $99,999 | 172 (89.1%) | 21 (10.9%) |
| $100,000 and over | 433 (100.0%) | 0 (0.0%) |
Public vs Private Health Insurance Coverage by Age in Hannawa Falls
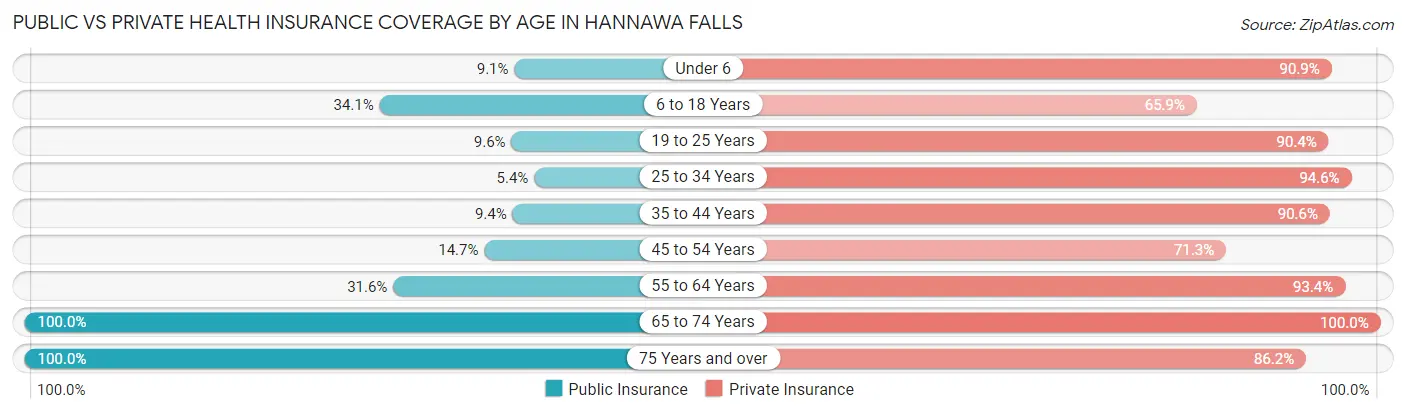
| Age Bracket | Public Insurance | Private Insurance |
| Under 6 | 6 (9.1%) | 60 (90.9%) |
| 6 to 18 Years | 29 (34.1%) | 56 (65.9%) |
| 19 to 25 Years | 8 (9.6%) | 75 (90.4%) |
| 25 to 34 Years | 4 (5.4%) | 70 (94.6%) |
| 35 to 44 Years | 10 (9.4%) | 96 (90.6%) |
| 45 to 54 Years | 22 (14.7%) | 107 (71.3%) |
| 55 to 64 Years | 24 (31.6%) | 71 (93.4%) |
| 65 to 74 Years | 93 (100.0%) | 93 (100.0%) |
| 75 Years and over | 159 (100.0%) | 137 (86.2%) |
| Total | 355 (39.8%) | 765 (85.8%) |
Disability Status by Sex by Age in Hannawa Falls
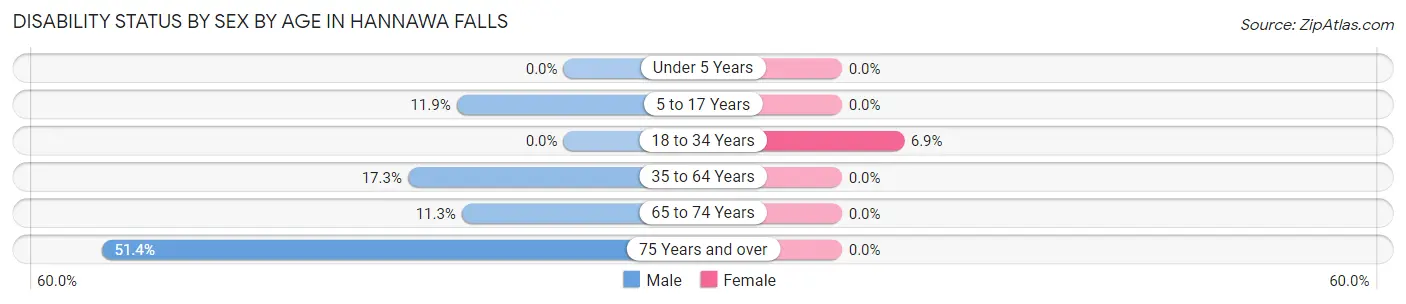
| Age Bracket | Male | Female |
| Under 5 Years | 0 (0.0%) | 0 (0.0%) |
| 5 to 17 Years | 5 (11.9%) | 0 (0.0%) |
| 18 to 34 Years | 0 (0.0%) | 6 (6.9%) |
| 35 to 64 Years | 35 (17.3%) | 0 (0.0%) |
| 65 to 74 Years | 6 (11.3%) | 0 (0.0%) |
| 75 Years and over | 36 (51.4%) | 0 (0.0%) |
Disability Class by Sex by Age in Hannawa Falls
Disability Class: Hearing Difficulty
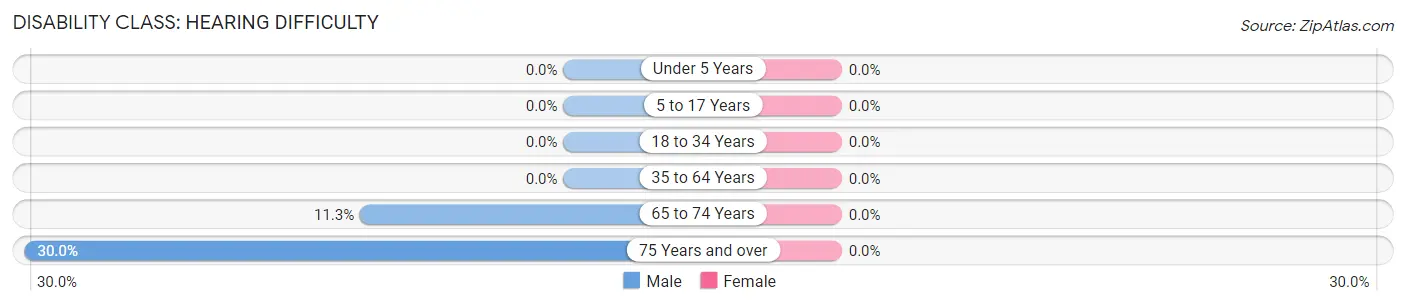
| Age Bracket | Male | Female |
| Under 5 Years | 0 (0.0%) | 0 (0.0%) |
| 5 to 17 Years | 0 (0.0%) | 0 (0.0%) |
| 18 to 34 Years | 0 (0.0%) | 0 (0.0%) |
| 35 to 64 Years | 0 (0.0%) | 0 (0.0%) |
| 65 to 74 Years | 6 (11.3%) | 0 (0.0%) |
| 75 Years and over | 21 (30.0%) | 0 (0.0%) |
Disability Class: Vision Difficulty
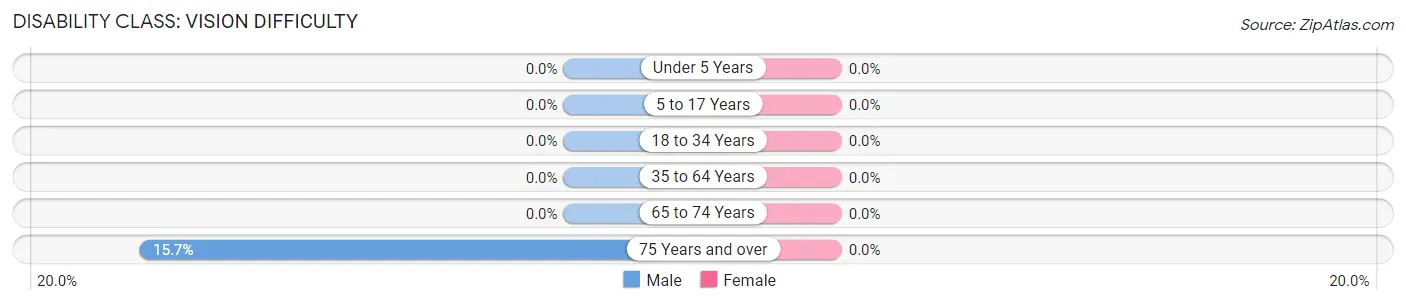
| Age Bracket | Male | Female |
| Under 5 Years | 0 (0.0%) | 0 (0.0%) |
| 5 to 17 Years | 0 (0.0%) | 0 (0.0%) |
| 18 to 34 Years | 0 (0.0%) | 0 (0.0%) |
| 35 to 64 Years | 0 (0.0%) | 0 (0.0%) |
| 65 to 74 Years | 0 (0.0%) | 0 (0.0%) |
| 75 Years and over | 11 (15.7%) | 0 (0.0%) |
Disability Class: Cognitive Difficulty
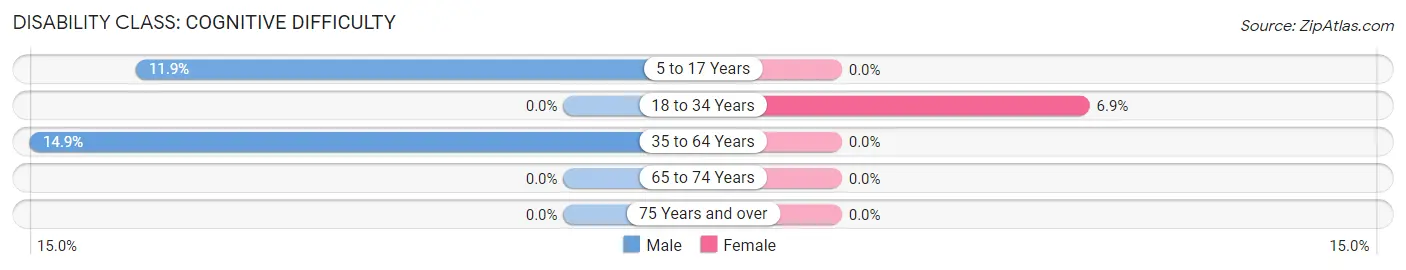
| Age Bracket | Male | Female |
| 5 to 17 Years | 5 (11.9%) | 0 (0.0%) |
| 18 to 34 Years | 0 (0.0%) | 6 (6.9%) |
| 35 to 64 Years | 30 (14.8%) | 0 (0.0%) |
| 65 to 74 Years | 0 (0.0%) | 0 (0.0%) |
| 75 Years and over | 0 (0.0%) | 0 (0.0%) |
Disability Class: Ambulatory Difficulty
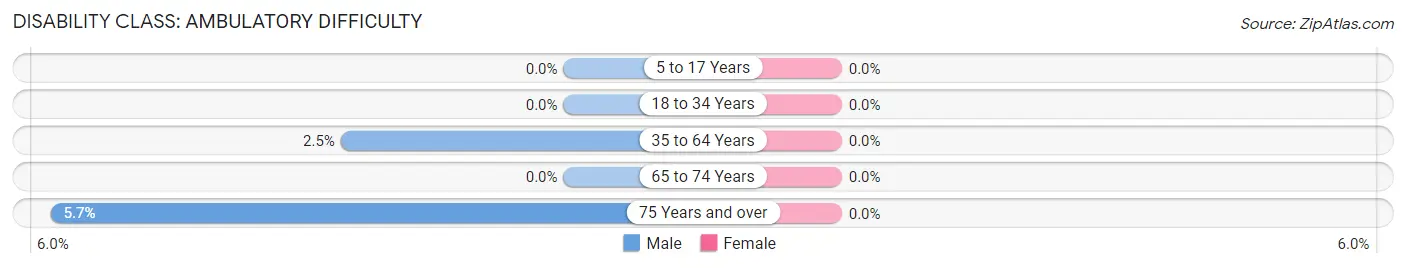
| Age Bracket | Male | Female |
| 5 to 17 Years | 0 (0.0%) | 0 (0.0%) |
| 18 to 34 Years | 0 (0.0%) | 0 (0.0%) |
| 35 to 64 Years | 5 (2.5%) | 0 (0.0%) |
| 65 to 74 Years | 0 (0.0%) | 0 (0.0%) |
| 75 Years and over | 4 (5.7%) | 0 (0.0%) |
Disability Class: Self-Care Difficulty
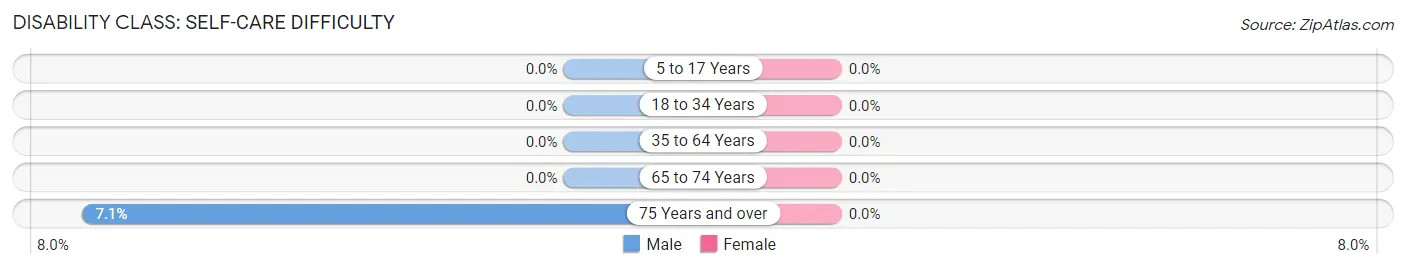
| Age Bracket | Male | Female |
| 5 to 17 Years | 0 (0.0%) | 0 (0.0%) |
| 18 to 34 Years | 0 (0.0%) | 0 (0.0%) |
| 35 to 64 Years | 0 (0.0%) | 0 (0.0%) |
| 65 to 74 Years | 0 (0.0%) | 0 (0.0%) |
| 75 Years and over | 5 (7.1%) | 0 (0.0%) |
Technology Access in Hannawa Falls
Computing Device Access in Hannawa Falls
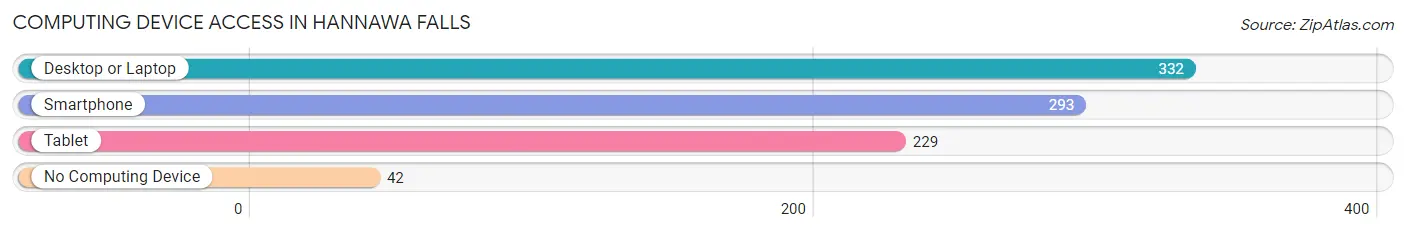
| Device Type | # Households | % Households |
| Desktop or Laptop | 332 | 79.2% |
| Smartphone | 293 | 69.9% |
| Tablet | 229 | 54.6% |
| No Computing Device | 42 | 10.0% |
| Total | 419 | 100.0% |
Internet Access in Hannawa Falls
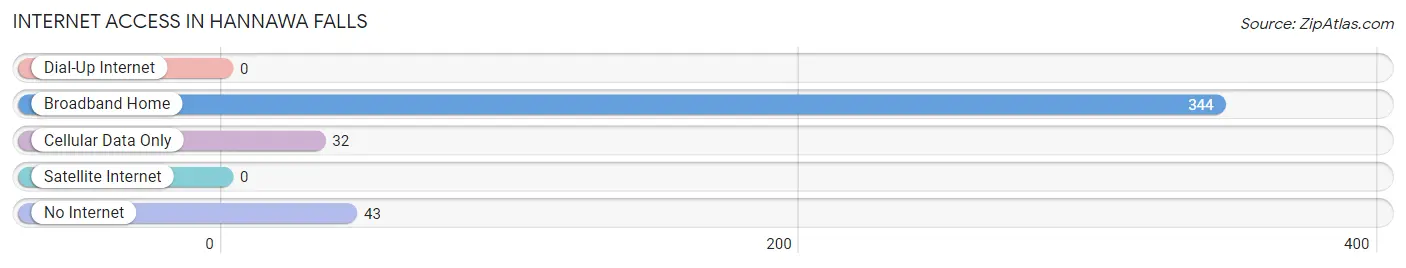
| Internet Type | # Households | % Households |
| Dial-Up Internet | 0 | 0.0% |
| Broadband Home | 344 | 82.1% |
| Cellular Data Only | 32 | 7.6% |
| Satellite Internet | 0 | 0.0% |
| No Internet | 43 | 10.3% |
| Total | 419 | 100.0% |
Hannawa Falls Summary
Hannawa Falls is a small hamlet located in St. Lawrence County, New York, United States. It is situated on the Raquette River, near the border of Franklin County. The population was estimated to be around 500 in the year 2000.
History
Hannawa Falls was first settled in the early 1800s by a group of settlers from Massachusetts. The settlers were attracted to the area due to its abundance of natural resources, including timber and water power. The first sawmill was built in 1810, and the first gristmill was built in 1820. The hamlet was named after the Hannawa family, who were among the first settlers.
The hamlet grew steadily throughout the 19th century, and by the early 20th century, it had become a thriving community. The economy was based on lumber, agriculture, and manufacturing. The first post office was established in 1845, and the first school was built in 1848.
Geography
Hannawa Falls is located in the northern part of St. Lawrence County, near the border of Franklin County. It is situated on the Raquette River, which flows through the hamlet. The terrain is mostly flat, with some rolling hills. The climate is humid continental, with cold winters and warm summers.
Economy
The economy of Hannawa Falls is largely based on agriculture and tourism. The hamlet is home to several farms, which produce a variety of crops, including corn, soybeans, and hay. There are also several small businesses in the area, including a grocery store, a hardware store, and a restaurant.
Tourism is an important part of the local economy. The hamlet is home to several attractions, including the Hannawa Falls State Park, which offers camping, fishing, and hiking. The Raquette River is also popular for canoeing and kayaking.
Demographics
As of the 2000 census, the population of Hannawa Falls was estimated to be around 500. The racial makeup of the hamlet was 97.2% White, 0.8% African American, 0.4% Native American, 0.2% Asian, and 1.4% from other races. The median household income was $35,000, and the median family income was $41,000. The per capita income was $17,000.
Conclusion
Hannawa Falls is a small hamlet located in St. Lawrence County, New York. It was first settled in the early 1800s, and the economy is largely based on agriculture and tourism. The population was estimated to be around 500 in the year 2000. The hamlet is home to several attractions, including the Hannawa Falls State Park, which offers camping, fishing, and hiking. The racial makeup of the hamlet was 97.2% White, 0.8% African American, 0.4% Native American, 0.2% Asian, and 1.4% from other races. The median household income was $35,000, and the median family income was $41,000.
Common Questions
What is Per Capita Income in Hannawa Falls?
Per Capita income in Hannawa Falls is $42,496.
What is the Median Family Income in Hannawa Falls?
Median Family Income in Hannawa Falls is $93,814.
What is the Median Household income in Hannawa Falls?
Median Household Income in Hannawa Falls is $92,818.
What is Income or Wage Gap in Hannawa Falls?
Income or Wage Gap in Hannawa Falls is 6.0%.
Women in Hannawa Falls earn 94.0 cents for every dollar earned by a man.
What is Inequality or Gini Index in Hannawa Falls?
Inequality or Gini Index in Hannawa Falls is 0.44.
What is the Total Population of Hannawa Falls?
Total Population of Hannawa Falls is 892.
What is the Total Male Population of Hannawa Falls?
Total Male Population of Hannawa Falls is 493.
What is the Total Female Population of Hannawa Falls?
Total Female Population of Hannawa Falls is 399.
What is the Ratio of Males per 100 Females in Hannawa Falls?
There are 123.56 Males per 100 Females in Hannawa Falls.
What is the Ratio of Females per 100 Males in Hannawa Falls?
There are 80.93 Females per 100 Males in Hannawa Falls.
What is the Median Population Age in Hannawa Falls?
Median Population Age in Hannawa Falls is 46.4 Years.
What is the Average Family Size in Hannawa Falls
Average Family Size in Hannawa Falls is 2.6 People.
What is the Average Household Size in Hannawa Falls
Average Household Size in Hannawa Falls is 2.1 People.
How Large is the Labor Force in Hannawa Falls?
There are 418 People in the Labor Forcein in Hannawa Falls.
What is the Percentage of People in the Labor Force in Hannawa Falls?
55.7% of People are in the Labor Force in Hannawa Falls.
What is the Unemployment Rate in Hannawa Falls?
Unemployment Rate in Hannawa Falls is 2.9%.