Zip Codes with the Highest Percentage of Population Employed in Office & Administration in Saint Charles, IL
RELATED REPORTS & OPTIONS
Office & Administration
Saint Charles
Compare Zip Codes
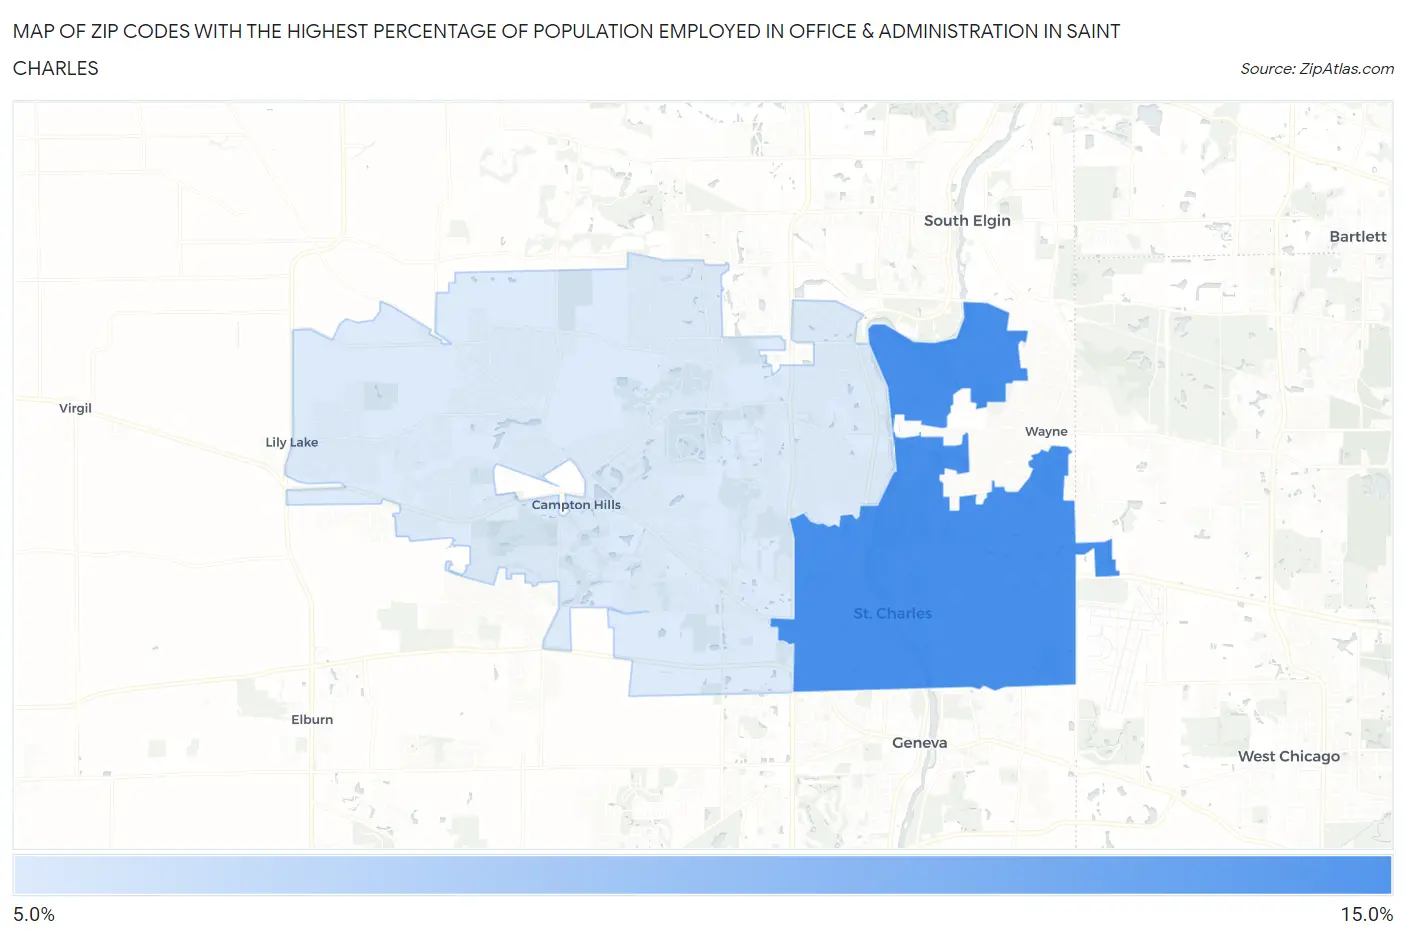
Map of Zip Codes with the Highest Percentage of Population Employed in Office & Administration in Saint Charles
6.3%
12.4%
Zip Codes with the Highest Percentage of Population Employed in Office & Administration in Saint Charles, IL
| Zip Code | % Employed | vs State | vs National | |
| 1. | 60174 | 12.4% | 10.8%(+1.62)#467 | 10.9%(+1.53)#9,600 |
| 2. | 60175 | 6.3% | 10.8%(-4.50)#1,187 | 10.9%(-4.59)#26,454 |
1
Common Questions
What are the Top Zip Codes with the Highest Percentage of Population Employed in Office & Administration in Saint Charles, IL?
Top Zip Codes with the Highest Percentage of Population Employed in Office & Administration in Saint Charles, IL are:
What zip code has the Highest Percentage of Population Employed in Office & Administration in Saint Charles, IL?
60174 has the Highest Percentage of Population Employed in Office & Administration in Saint Charles, IL with 12.4%.
What is the Percentage of Population Employed in Office & Administration in Illinois?
Percentage of Population Employed in Office & Administration in Illinois is 10.8%.
What is the Percentage of Population Employed in Office & Administration in the United States?
Percentage of Population Employed in Office & Administration in the United States is 10.9%.