Zip Codes with the Highest Percentage of Population Employed in Office & Administration in Glenview, IL
RELATED REPORTS & OPTIONS
Office & Administration
Glenview
Compare Zip Codes
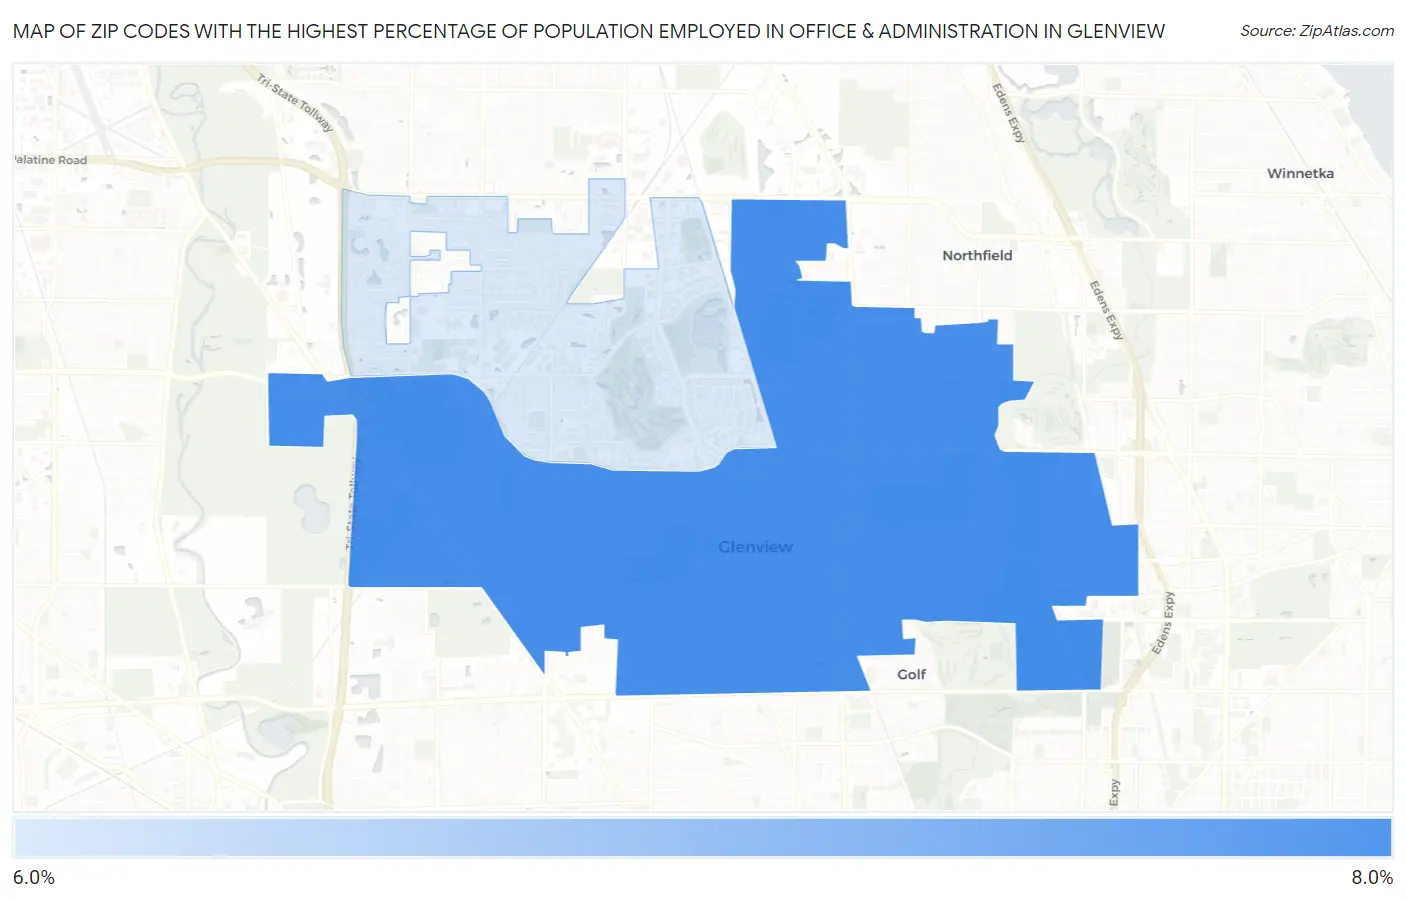
Map of Zip Codes with the Highest Percentage of Population Employed in Office & Administration in Glenview
6.1%
7.9%
Zip Codes with the Highest Percentage of Population Employed in Office & Administration in Glenview, IL
| Zip Code | % Employed | vs State | vs National | |
| 1. | 60025 | 7.9% | 10.8%(-2.88)#1,043 | 10.9%(-2.97)#23,294 |
| 2. | 60026 | 6.1% | 10.8%(-4.70)#1,195 | 10.9%(-4.79)#26,748 |
1
Common Questions
What are the Top Zip Codes with the Highest Percentage of Population Employed in Office & Administration in Glenview, IL?
Top Zip Codes with the Highest Percentage of Population Employed in Office & Administration in Glenview, IL are:
What zip code has the Highest Percentage of Population Employed in Office & Administration in Glenview, IL?
60025 has the Highest Percentage of Population Employed in Office & Administration in Glenview, IL with 7.9%.
What is the Percentage of Population Employed in Office & Administration in Glenview, IL?
Percentage of Population Employed in Office & Administration in Glenview is 6.7%.
What is the Percentage of Population Employed in Office & Administration in Illinois?
Percentage of Population Employed in Office & Administration in Illinois is 10.8%.
What is the Percentage of Population Employed in Office & Administration in the United States?
Percentage of Population Employed in Office & Administration in the United States is 10.9%.