Zip Codes with the Highest Percentage of Population Employed in Office & Administration in Plainfield, IL
RELATED REPORTS & OPTIONS
Office & Administration
Plainfield
Compare Zip Codes
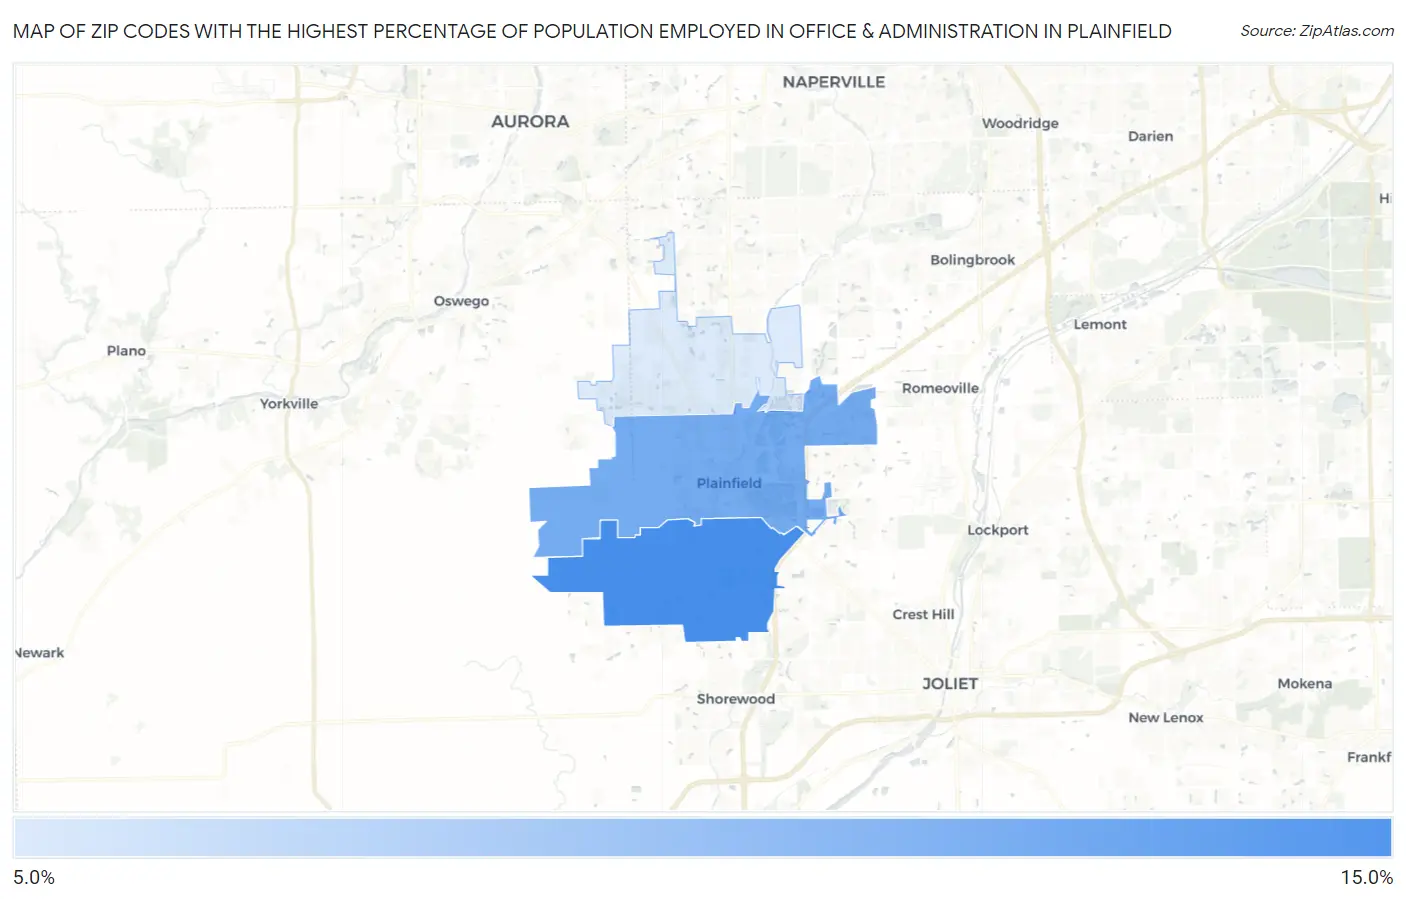
Map of Zip Codes with the Highest Percentage of Population Employed in Office & Administration in Plainfield
8.5%
11.3%
Zip Codes with the Highest Percentage of Population Employed in Office & Administration in Plainfield, IL
| Zip Code | % Employed | vs State | vs National | |
| 1. | 60586 | 11.3% | 10.8%(+0.518)#603 | 10.9%(+0.426)#12,934 |
| 2. | 60544 | 10.4% | 10.8%(-0.348)#717 | 10.9%(-0.440)#15,774 |
| 3. | 60585 | 8.5% | 10.8%(-2.26)#979 | 10.9%(-2.35)#21,678 |
1
Common Questions
What are the Top Zip Codes with the Highest Percentage of Population Employed in Office & Administration in Plainfield, IL?
Top Zip Codes with the Highest Percentage of Population Employed in Office & Administration in Plainfield, IL are:
What zip code has the Highest Percentage of Population Employed in Office & Administration in Plainfield, IL?
60586 has the Highest Percentage of Population Employed in Office & Administration in Plainfield, IL with 11.3%.
What is the Percentage of Population Employed in Office & Administration in Plainfield, IL?
Percentage of Population Employed in Office & Administration in Plainfield is 9.6%.
What is the Percentage of Population Employed in Office & Administration in Illinois?
Percentage of Population Employed in Office & Administration in Illinois is 10.8%.
What is the Percentage of Population Employed in Office & Administration in the United States?
Percentage of Population Employed in Office & Administration in the United States is 10.9%.