Zip Codes with the Highest Percentage of Population Employed in Office & Administration in Danville, IL
RELATED REPORTS & OPTIONS
Office & Administration
Danville
Compare Zip Codes
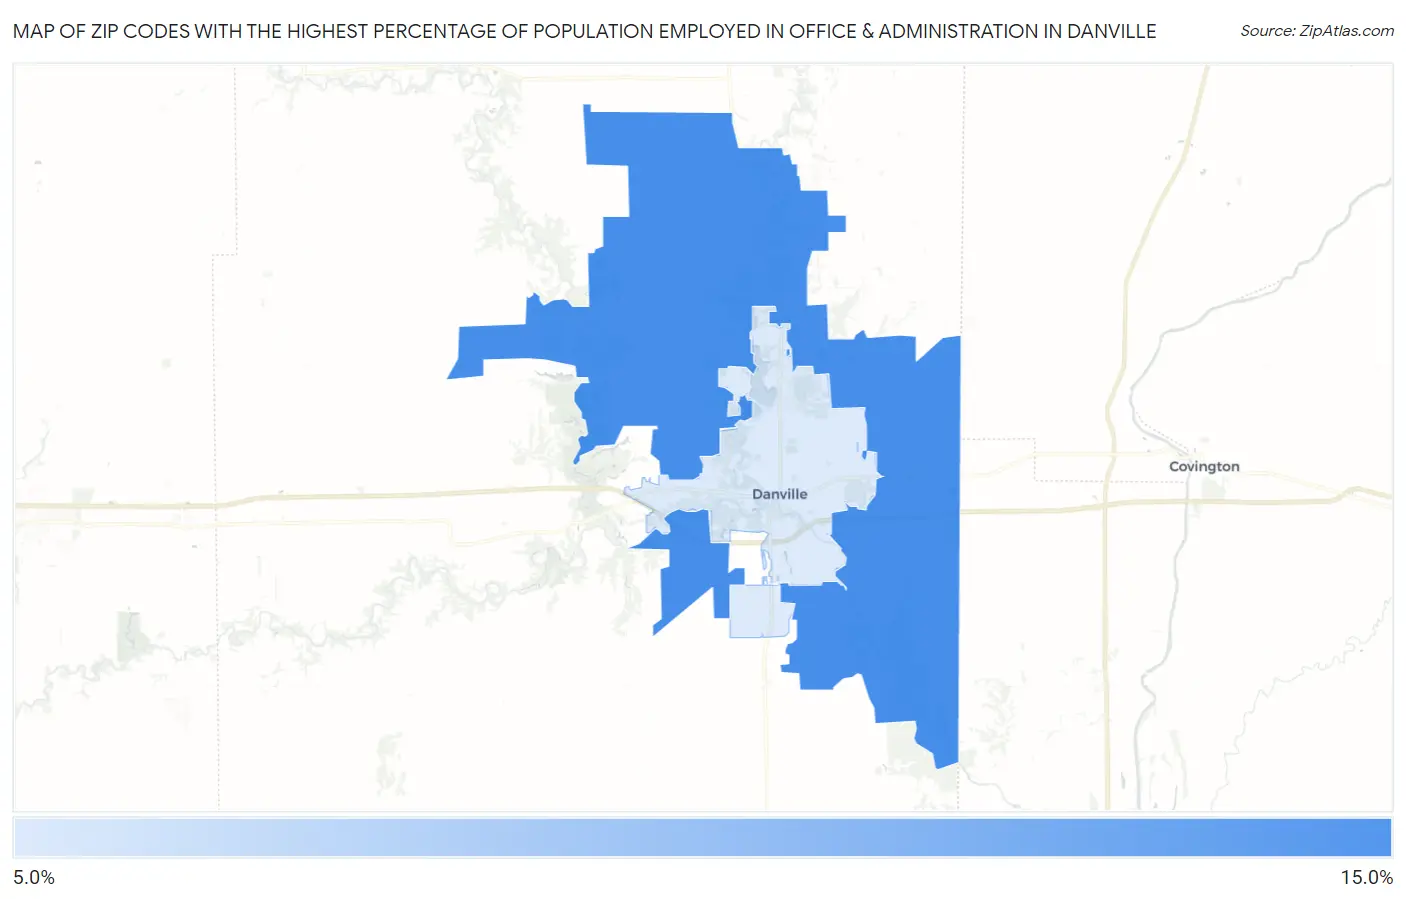
Map of Zip Codes with the Highest Percentage of Population Employed in Office & Administration in Danville
8.0%
13.4%
Zip Codes with the Highest Percentage of Population Employed in Office & Administration in Danville, IL
| Zip Code | % Employed | vs State | vs National | |
| 1. | 61834 | 13.4% | 10.8%(+2.60)#343 | 10.9%(+2.51)#7,233 |
| 2. | 61832 | 8.0% | 10.8%(-2.72)#1,026 | 10.9%(-2.81)#22,915 |
1
Common Questions
What are the Top Zip Codes with the Highest Percentage of Population Employed in Office & Administration in Danville, IL?
Top Zip Codes with the Highest Percentage of Population Employed in Office & Administration in Danville, IL are:
What zip code has the Highest Percentage of Population Employed in Office & Administration in Danville, IL?
61834 has the Highest Percentage of Population Employed in Office & Administration in Danville, IL with 13.4%.
What is the Percentage of Population Employed in Office & Administration in Danville, IL?
Percentage of Population Employed in Office & Administration in Danville is 7.9%.
What is the Percentage of Population Employed in Office & Administration in Illinois?
Percentage of Population Employed in Office & Administration in Illinois is 10.8%.
What is the Percentage of Population Employed in Office & Administration in the United States?
Percentage of Population Employed in Office & Administration in the United States is 10.9%.