Zip Codes with the Highest Percentage of Population Employed in Office & Administration in East Saint Louis, IL
RELATED REPORTS & OPTIONS
Office & Administration
East Saint Louis
Compare Zip Codes
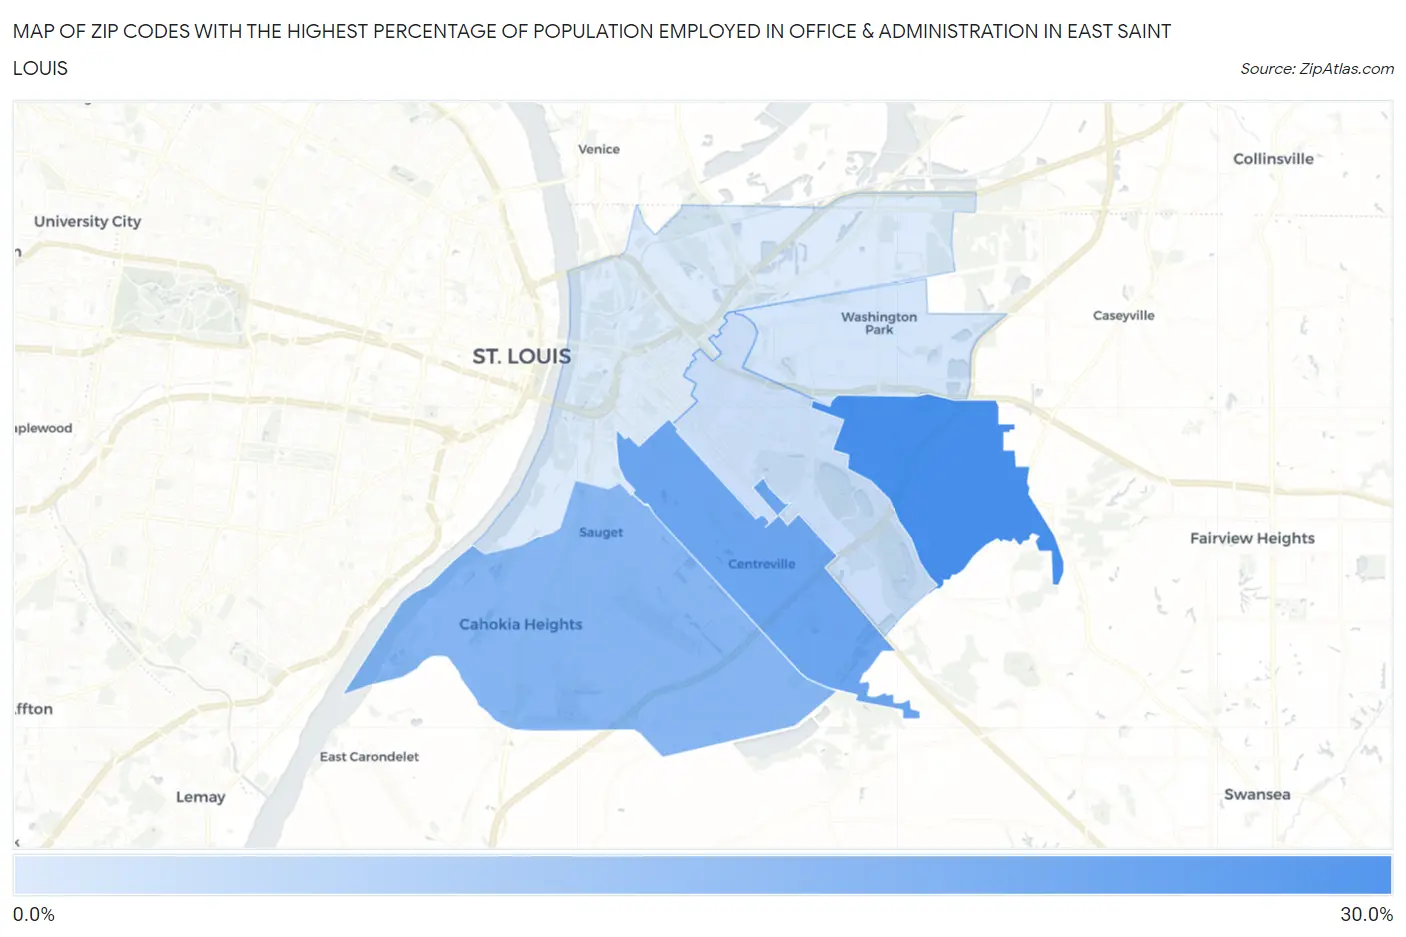
Map of Zip Codes with the Highest Percentage of Population Employed in Office & Administration in East Saint Louis
5.8%
25.2%
Zip Codes with the Highest Percentage of Population Employed in Office & Administration in East Saint Louis, IL
| Zip Code | % Employed | vs State | vs National | |
| 1. | 62203 | 25.2% | 10.8%(+14.4)#25 | 10.9%(+14.3)#904 |
| 2. | 62207 | 20.0% | 10.8%(+9.26)#59 | 10.9%(+9.17)#1,679 |
| 3. | 62206 | 16.6% | 10.8%(+5.80)#148 | 10.9%(+5.71)#3,123 |
| 4. | 62205 | 8.1% | 10.8%(-2.71)#1,022 | 10.9%(-2.80)#22,890 |
| 5. | 62204 | 6.9% | 10.8%(-3.88)#1,142 | 10.9%(-3.97)#25,427 |
| 6. | 62201 | 5.8% | 10.8%(-5.00)#1,210 | 10.9%(-5.10)#27,195 |
1
Common Questions
What are the Top 5 Zip Codes with the Highest Percentage of Population Employed in Office & Administration in East Saint Louis, IL?
Top 5 Zip Codes with the Highest Percentage of Population Employed in Office & Administration in East Saint Louis, IL are:
What zip code has the Highest Percentage of Population Employed in Office & Administration in East Saint Louis, IL?
62203 has the Highest Percentage of Population Employed in Office & Administration in East Saint Louis, IL with 25.2%.
What is the Percentage of Population Employed in Office & Administration in Illinois?
Percentage of Population Employed in Office & Administration in Illinois is 10.8%.
What is the Percentage of Population Employed in Office & Administration in the United States?
Percentage of Population Employed in Office & Administration in the United States is 10.9%.