Zip Codes with the Highest Percentage of Population Employed in Office & Administration in Quincy, IL
RELATED REPORTS & OPTIONS
Office & Administration
Quincy
Compare Zip Codes
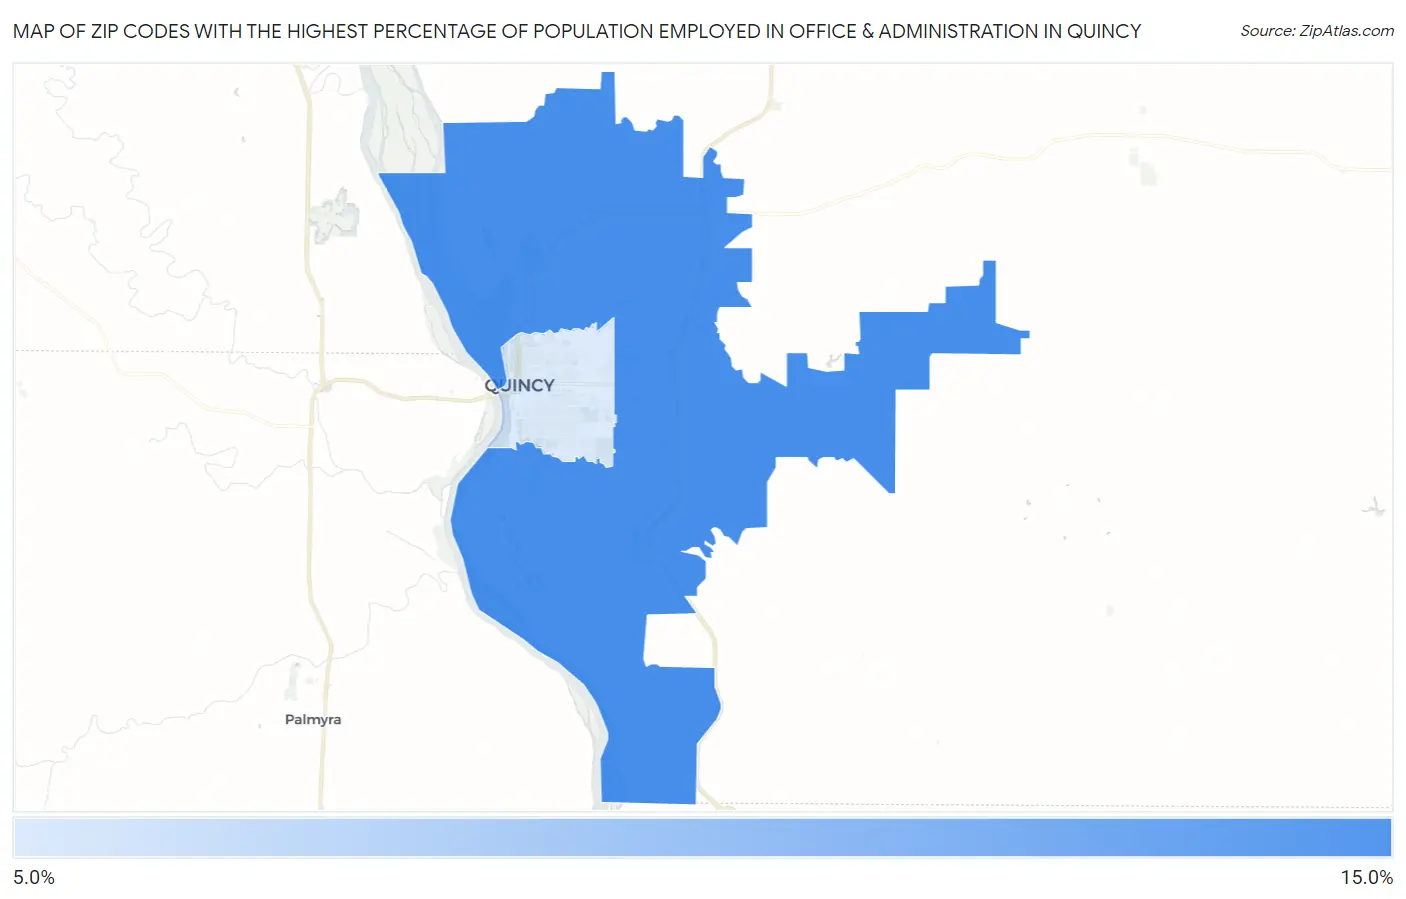
Map of Zip Codes with the Highest Percentage of Population Employed in Office & Administration in Quincy
12.3%
12.7%
Zip Codes with the Highest Percentage of Population Employed in Office & Administration in Quincy, IL
| Zip Code | % Employed | vs State | vs National | |
| 1. | 62305 | 12.7% | 10.8%(+1.89)#431 | 10.9%(+1.80)#8,898 |
| 2. | 62301 | 12.3% | 10.8%(+1.57)#476 | 10.9%(+1.48)#9,749 |
1
Common Questions
What are the Top Zip Codes with the Highest Percentage of Population Employed in Office & Administration in Quincy, IL?
Top Zip Codes with the Highest Percentage of Population Employed in Office & Administration in Quincy, IL are:
What zip code has the Highest Percentage of Population Employed in Office & Administration in Quincy, IL?
62305 has the Highest Percentage of Population Employed in Office & Administration in Quincy, IL with 12.7%.
What is the Percentage of Population Employed in Office & Administration in Quincy, IL?
Percentage of Population Employed in Office & Administration in Quincy is 12.7%.
What is the Percentage of Population Employed in Office & Administration in Illinois?
Percentage of Population Employed in Office & Administration in Illinois is 10.8%.
What is the Percentage of Population Employed in Office & Administration in the United States?
Percentage of Population Employed in Office & Administration in the United States is 10.9%.