Zip Codes with the Highest Percentage of Population Employed in Office & Administration in Rockford, IL
RELATED REPORTS & OPTIONS
Office & Administration
Rockford
Compare Zip Codes
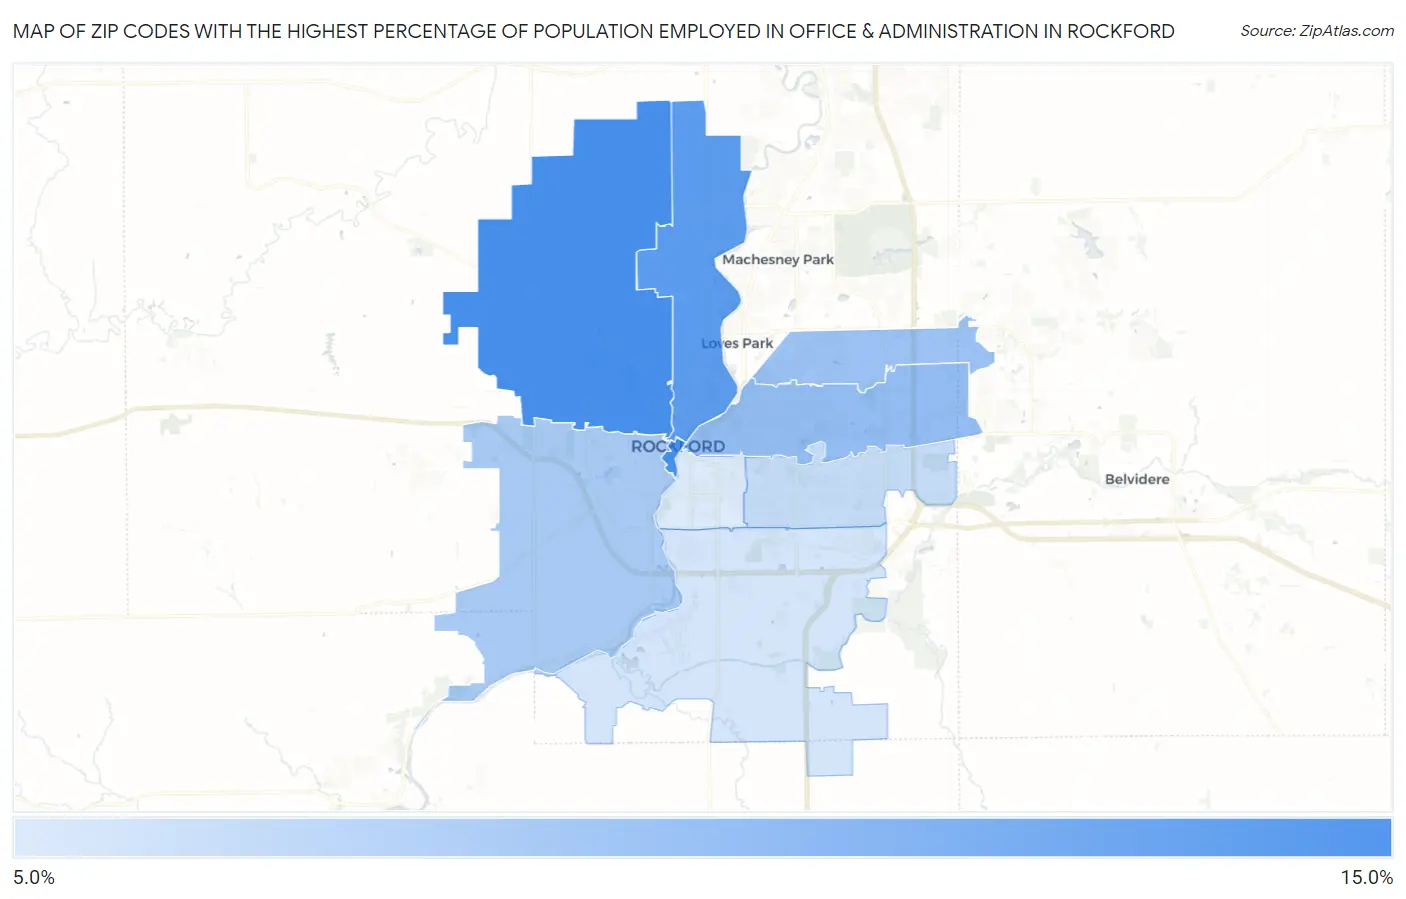
Map of Zip Codes with the Highest Percentage of Population Employed in Office & Administration in Rockford
8.6%
14.5%
Zip Codes with the Highest Percentage of Population Employed in Office & Administration in Rockford, IL
| Zip Code | % Employed | vs State | vs National | |
| 1. | 61101 | 14.5% | 10.8%(+3.71)#264 | 10.9%(+3.62)#5,284 |
| 2. | 61103 | 13.7% | 10.8%(+2.95)#314 | 10.9%(+2.85)#6,517 |
| 3. | 61107 | 11.4% | 10.8%(+0.664)#584 | 10.9%(+0.572)#12,447 |
| 4. | 61114 | 11.1% | 10.8%(+0.345)#629 | 10.9%(+0.253)#13,513 |
| 5. | 61102 | 10.7% | 10.8%(-0.104)#689 | 10.9%(-0.196)#14,936 |
| 6. | 61108 | 9.5% | 10.8%(-1.28)#848 | 10.9%(-1.37)#18,821 |
| 7. | 61109 | 8.9% | 10.8%(-1.84)#919 | 10.9%(-1.93)#20,477 |
| 8. | 61104 | 8.6% | 10.8%(-2.18)#972 | 10.9%(-2.27)#21,465 |
1
Common Questions
What are the Top 5 Zip Codes with the Highest Percentage of Population Employed in Office & Administration in Rockford, IL?
Top 5 Zip Codes with the Highest Percentage of Population Employed in Office & Administration in Rockford, IL are:
What zip code has the Highest Percentage of Population Employed in Office & Administration in Rockford, IL?
61101 has the Highest Percentage of Population Employed in Office & Administration in Rockford, IL with 14.5%.
What is the Percentage of Population Employed in Office & Administration in Rockford, IL?
Percentage of Population Employed in Office & Administration in Rockford is 11.1%.
What is the Percentage of Population Employed in Office & Administration in Illinois?
Percentage of Population Employed in Office & Administration in Illinois is 10.8%.
What is the Percentage of Population Employed in Office & Administration in the United States?
Percentage of Population Employed in Office & Administration in the United States is 10.9%.