Gilson, IL Map & Demographics
Gilson Map
Gilson Overview
$30,229
PER CAPITA INCOME
$68,333
AVG FAMILY INCOME
$64,063
AVG HOUSEHOLD INCOME
25.7%
WAGE / INCOME GAP [ % ]
74.3¢/ $1
WAGE / INCOME GAP [ $ ]
0.36
INEQUALITY / GINI INDEX
121
TOTAL POPULATION
53
MALE POPULATION
68
FEMALE POPULATION
77.94
MALES / 100 FEMALES
128.30
FEMALES / 100 MALES
58.9
MEDIAN AGE
2.2
AVG FAMILY SIZE
2.0
AVG HOUSEHOLD SIZE
69
LABOR FORCE [ PEOPLE ]
62.2%
PERCENT IN LABOR FORCE
Gilson Zip Codes
Gilson Area Codes
Income in Gilson
Income Overview in Gilson
Per Capita Income in Gilson is $30,229, while median incomes of families and households are $68,333 and $64,063 respectively.
| Characteristic | Number | Measure |
| Per Capita Income | 121 | $30,229 |
| Median Family Income | 52 | $68,333 |
| Mean Family Income | 52 | $79,815 |
| Median Household Income | 60 | $64,063 |
| Mean Household Income | 60 | $74,923 |
| Income Deficit | 52 | $0 |
| Wage / Income Gap (%) | 121 | 25.75% |
| Wage / Income Gap ($) | 121 | 74.25¢ per $1 |
| Gini / Inequality Index | 121 | 0.36 |
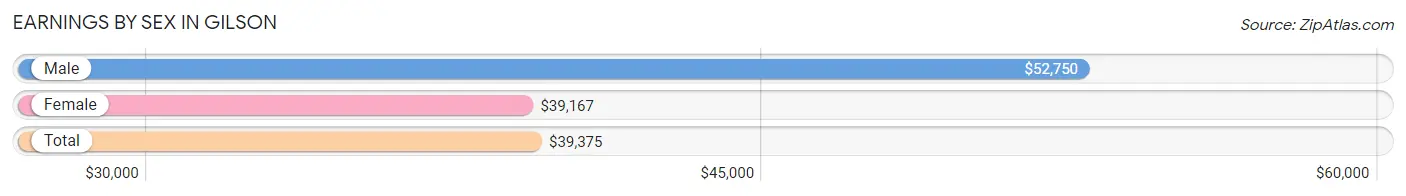
Earnings by Sex in Gilson
Average Earnings in Gilson are $39,375, $52,750 for men and $39,167 for women, a difference of 25.8%.
| Sex | Number | Average Earnings |
| Male | 31 (44.9%) | $52,750 |
| Female | 38 (55.1%) | $39,167 |
| Total | 69 (100.0%) | $39,375 |
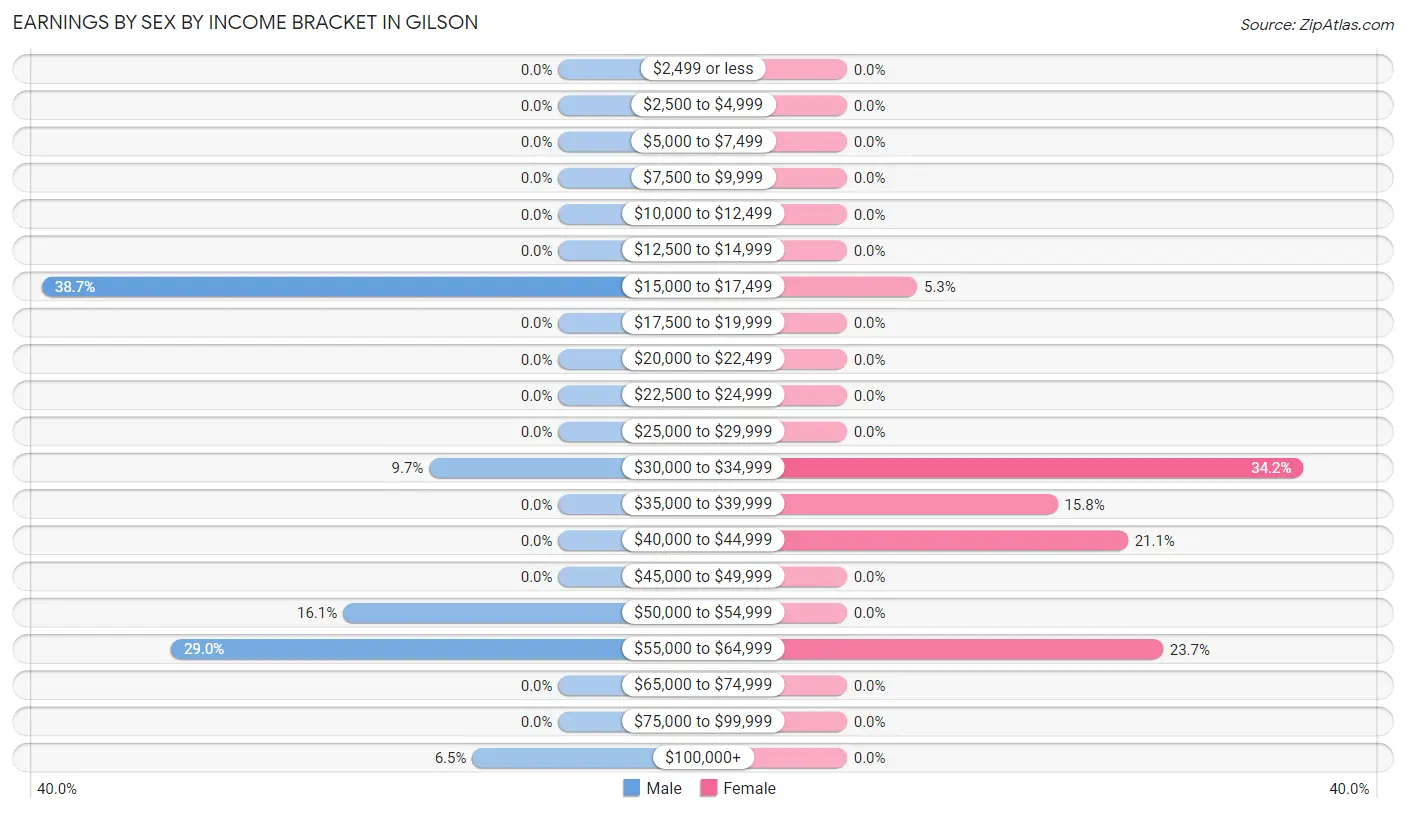
Earnings by Sex by Income Bracket in Gilson
The most common earnings brackets in Gilson are $15,000 to $17,499 for men (12 | 38.7%) and $30,000 to $34,999 for women (13 | 34.2%).
| Income | Male | Female |
| $2,499 or less | 0 (0.0%) | 0 (0.0%) |
| $2,500 to $4,999 | 0 (0.0%) | 0 (0.0%) |
| $5,000 to $7,499 | 0 (0.0%) | 0 (0.0%) |
| $7,500 to $9,999 | 0 (0.0%) | 0 (0.0%) |
| $10,000 to $12,499 | 0 (0.0%) | 0 (0.0%) |
| $12,500 to $14,999 | 0 (0.0%) | 0 (0.0%) |
| $15,000 to $17,499 | 12 (38.7%) | 2 (5.3%) |
| $17,500 to $19,999 | 0 (0.0%) | 0 (0.0%) |
| $20,000 to $22,499 | 0 (0.0%) | 0 (0.0%) |
| $22,500 to $24,999 | 0 (0.0%) | 0 (0.0%) |
| $25,000 to $29,999 | 0 (0.0%) | 0 (0.0%) |
| $30,000 to $34,999 | 3 (9.7%) | 13 (34.2%) |
| $35,000 to $39,999 | 0 (0.0%) | 6 (15.8%) |
| $40,000 to $44,999 | 0 (0.0%) | 8 (21.0%) |
| $45,000 to $49,999 | 0 (0.0%) | 0 (0.0%) |
| $50,000 to $54,999 | 5 (16.1%) | 0 (0.0%) |
| $55,000 to $64,999 | 9 (29.0%) | 9 (23.7%) |
| $65,000 to $74,999 | 0 (0.0%) | 0 (0.0%) |
| $75,000 to $99,999 | 0 (0.0%) | 0 (0.0%) |
| $100,000+ | 2 (6.5%) | 0 (0.0%) |
| Total | 31 (100.0%) | 38 (100.0%) |
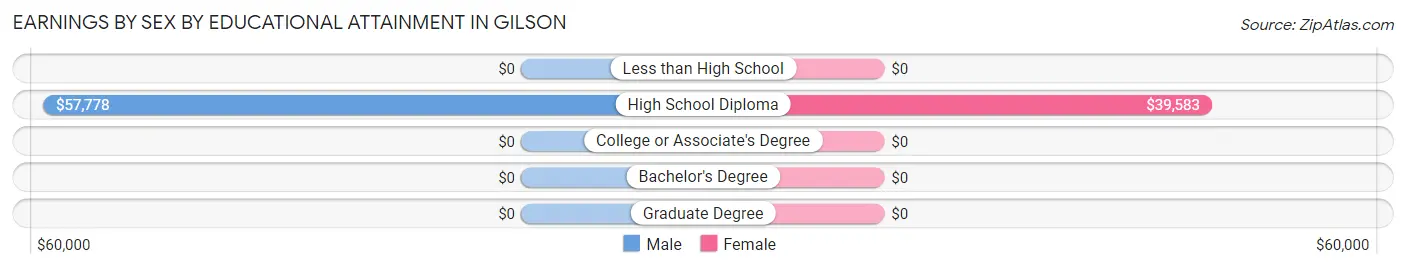
Earnings by Sex by Educational Attainment in Gilson
Average earnings in Gilson are $54,250 for men and $39,583 for women, a difference of 27.0%. Men with an educational attainment of high school diploma enjoy the highest average annual earnings of $57,778, while those with high school diploma education earn the least with $57,778. Women with an educational attainment of high school diploma earn the most with the average annual earnings of $39,583, while those with high school diploma education have the smallest earnings of $39,583.
| Educational Attainment | Male Income | Female Income |
| Less than High School | - | - |
| High School Diploma | $57,778 | $39,583 |
| College or Associate's Degree | - | - |
| Bachelor's Degree | - | - |
| Graduate Degree | - | - |
| Total | $54,250 | $39,583 |
Family Income in Gilson
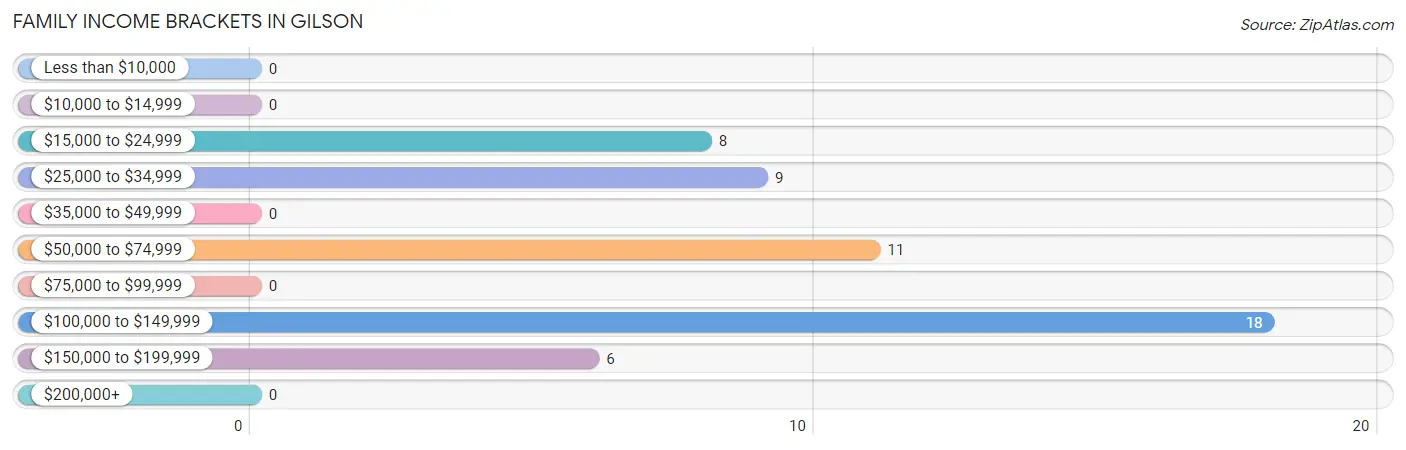
Family Income Brackets in Gilson
According to the Gilson family income data, there are 18 families falling into the $100,000 to $149,999 income range, which is the most common income bracket and makes up 34.6% of all families.
| Income Bracket | # Families | % Families |
| Less than $10,000 | 0 | 0.0% |
| $10,000 to $14,999 | 0 | 0.0% |
| $15,000 to $24,999 | 8 | 15.4% |
| $25,000 to $34,999 | 9 | 17.3% |
| $35,000 to $49,999 | 0 | 0.0% |
| $50,000 to $74,999 | 11 | 21.2% |
| $75,000 to $99,999 | 0 | 0.0% |
| $100,000 to $149,999 | 18 | 34.6% |
| $150,000 to $199,999 | 6 | 11.5% |
| $200,000+ | 0 | 0.0% |
Family Income by Famaliy Size in Gilson
| Income Bracket | # Families | Median Income |
| 2-Person Families | 37 (71.2%) | $0 |
| 3-Person Families | 0 (0.0%) | $0 |
| 4-Person Families | 9 (17.3%) | $0 |
| 5-Person Families | 6 (11.5%) | $0 |
| 6-Person Families | 0 (0.0%) | $0 |
| 7+ Person Families | 0 (0.0%) | $0 |
| Total | 52 (100.0%) | $68,333 |
Family Income by Number of Earners in Gilson
| Number of Earners | # Families | Median Income |
| No Earners | 17 (32.7%) | $0 |
| 1 Earner | 0 (0.0%) | $0 |
| 2 Earners | 20 (38.5%) | $0 |
| 3+ Earners | 15 (28.8%) | $0 |
| Total | 52 (100.0%) | $68,333 |
Household Income in Gilson
Household Income Brackets in Gilson
With 18 households falling in the category, the $100,000 to $149,999 income range is the most frequent in Gilson, accounting for 30.0% of all households.

| Income Bracket | # Households | % Households |
| Less than $10,000 | 0 | 0.0% |
| $10,000 to $14,999 | 0 | 0.0% |
| $15,000 to $24,999 | 8 | 13.3% |
| $25,000 to $34,999 | 9 | 15.0% |
| $35,000 to $49,999 | 8 | 13.3% |
| $50,000 to $74,999 | 11 | 18.3% |
| $75,000 to $99,999 | 0 | 0.0% |
| $100,000 to $149,999 | 18 | 30.0% |
| $150,000 to $199,999 | 6 | 10.0% |
| $200,000+ | 0 | 0.0% |
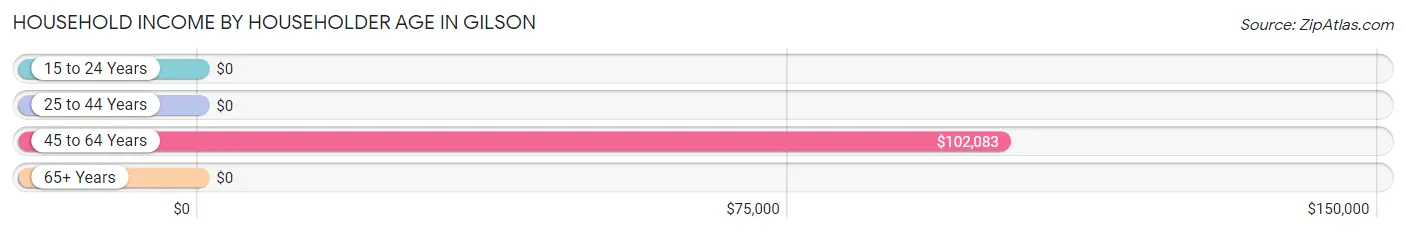
Household Income by Householder Age in Gilson
The median household income in Gilson is $64,063, with the highest median household income of $102,083 found in the 45 to 64 years age bracket for the primary householder. A total of 21 households (35.0%) fall into this category.
| Income Bracket | # Households | Median Income |
| 15 to 24 Years | 0 (0.0%) | $0 |
| 25 to 44 Years | 6 (10.0%) | $0 |
| 45 to 64 Years | 21 (35.0%) | $102,083 |
| 65+ Years | 33 (55.0%) | $0 |
| Total | 60 (100.0%) | $64,063 |
Poverty in Gilson
Income Below Poverty by Sex and Age in Gilson
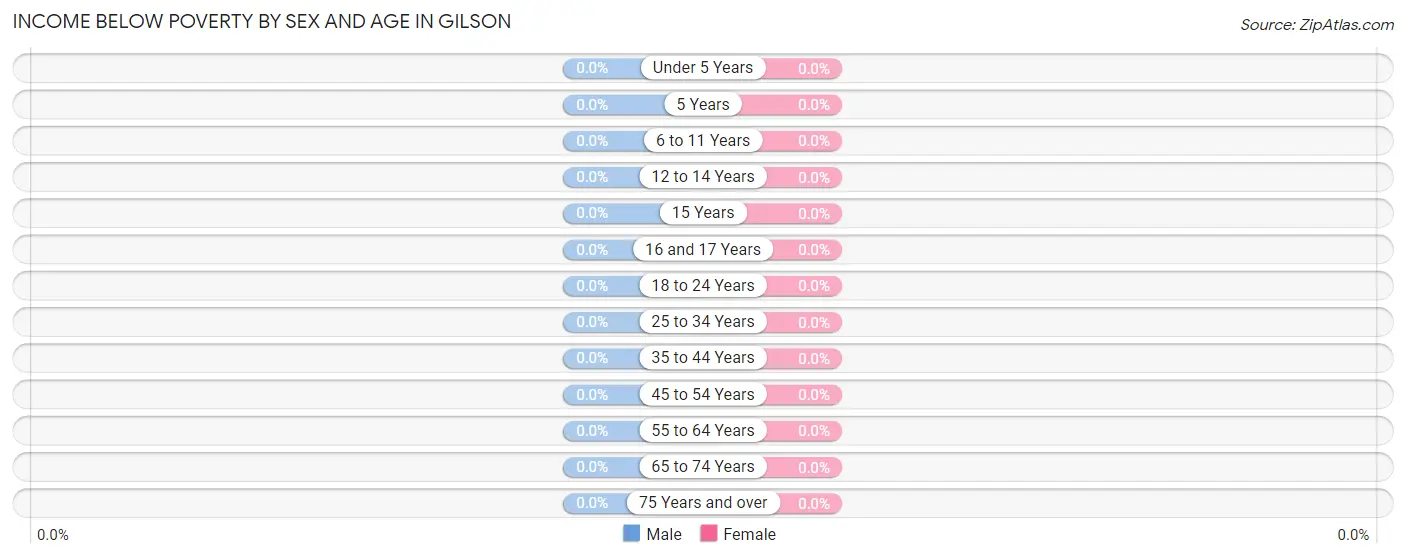
| Age Bracket | Male | Female |
| Under 5 Years | 0 (0.0%) | 0 (0.0%) |
| 5 Years | 0 (0.0%) | 0 (0.0%) |
| 6 to 11 Years | 0 (0.0%) | 0 (0.0%) |
| 12 to 14 Years | 0 (0.0%) | 0 (0.0%) |
| 15 Years | 0 (0.0%) | 0 (0.0%) |
| 16 and 17 Years | 0 (0.0%) | 0 (0.0%) |
| 18 to 24 Years | 0 (0.0%) | 0 (0.0%) |
| 25 to 34 Years | 0 (0.0%) | 0 (0.0%) |
| 35 to 44 Years | 0 (0.0%) | 0 (0.0%) |
| 45 to 54 Years | 0 (0.0%) | 0 (0.0%) |
| 55 to 64 Years | 0 (0.0%) | 0 (0.0%) |
| 65 to 74 Years | 0 (0.0%) | 0 (0.0%) |
| 75 Years and over | 0 (0.0%) | 0 (0.0%) |
| Total | 0 (0.0%) | 0 (0.0%) |
Income Above Poverty by Sex and Age in Gilson
According to the poverty statistics in Gilson, males aged 6 to 11 years and females aged 15 years are the age groups that are most secure financially, with 100.0% of males and 100.0% of females in these age groups living above the poverty line.
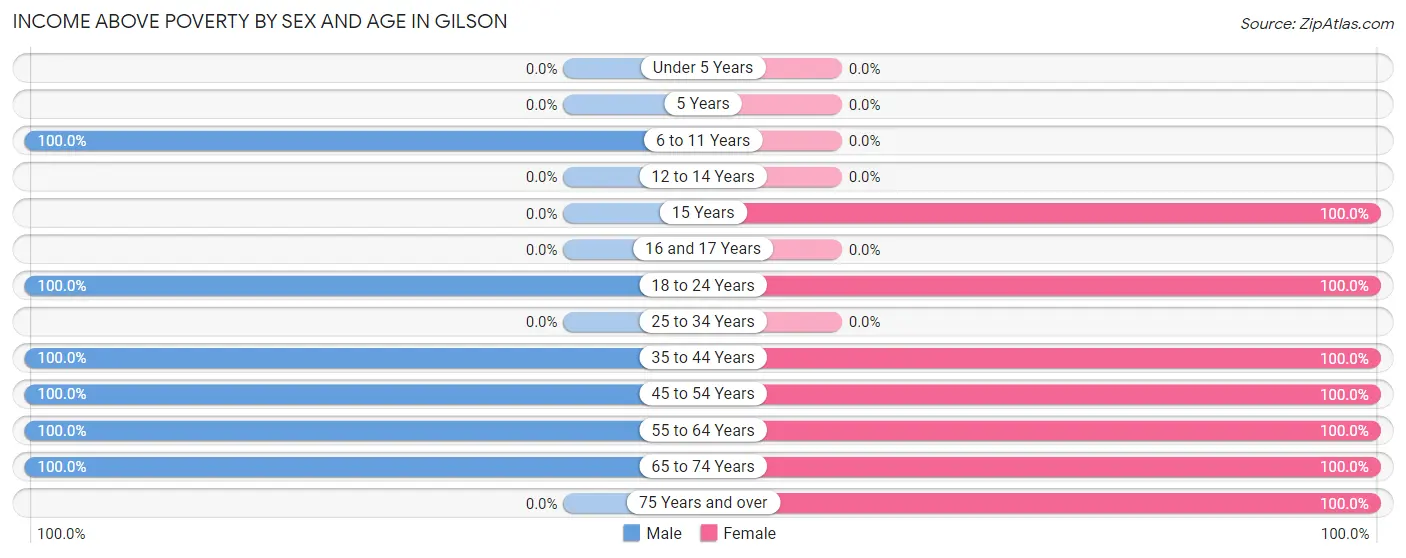
| Age Bracket | Male | Female |
| Under 5 Years | 0 (0.0%) | 0 (0.0%) |
| 5 Years | 0 (0.0%) | 0 (0.0%) |
| 6 to 11 Years | 4 (100.0%) | 0 (0.0%) |
| 12 to 14 Years | 0 (0.0%) | 0 (0.0%) |
| 15 Years | 0 (0.0%) | 6 (100.0%) |
| 16 and 17 Years | 0 (0.0%) | 0 (0.0%) |
| 18 to 24 Years | 6 (100.0%) | 2 (100.0%) |
| 25 to 34 Years | 0 (0.0%) | 0 (0.0%) |
| 35 to 44 Years | 13 (100.0%) | 6 (100.0%) |
| 45 to 54 Years | 3 (100.0%) | 9 (100.0%) |
| 55 to 64 Years | 9 (100.0%) | 21 (100.0%) |
| 65 to 74 Years | 18 (100.0%) | 16 (100.0%) |
| 75 Years and over | 0 (0.0%) | 8 (100.0%) |
| Total | 53 (100.0%) | 68 (100.0%) |
Income Below Poverty Among Married-Couple Families in Gilson
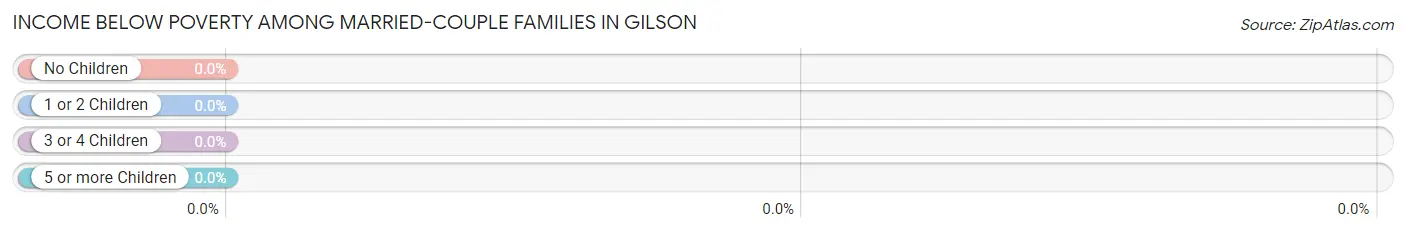
| Children | Above Poverty | Below Poverty |
| No Children | 29 (100.0%) | 0 (0.0%) |
| 1 or 2 Children | 15 (100.0%) | 0 (0.0%) |
| 3 or 4 Children | 0 (0.0%) | 0 (0.0%) |
| 5 or more Children | 0 (0.0%) | 0 (0.0%) |
| Total | 44 (100.0%) | 0 (0.0%) |
Income Below Poverty Among Single-Parent Households in Gilson
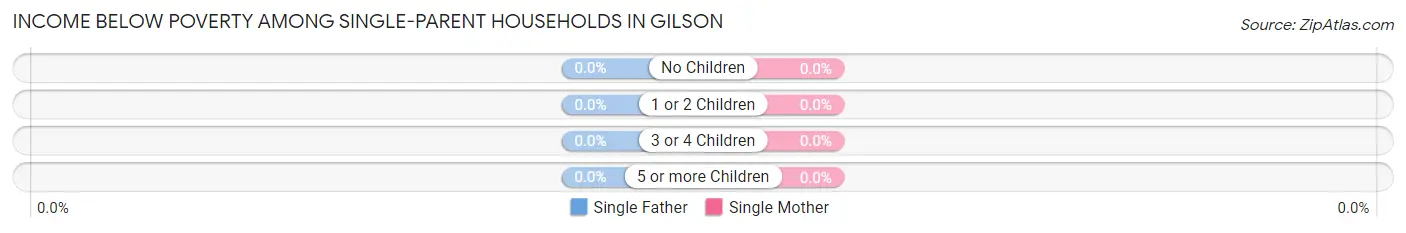
| Children | Single Father | Single Mother |
| No Children | 0 (0.0%) | 0 (0.0%) |
| 1 or 2 Children | 0 (0.0%) | 0 (0.0%) |
| 3 or 4 Children | 0 (0.0%) | 0 (0.0%) |
| 5 or more Children | 0 (0.0%) | 0 (0.0%) |
| Total | 0 (0.0%) | 0 (0.0%) |
Income Below Poverty Among Married-Couple vs Single-Parent Households in Gilson
| Children | Married-Couple Families | Single-Parent Households |
| No Children | 0 (0.0%) | 0 (0.0%) |
| 1 or 2 Children | 0 (0.0%) | 0 (0.0%) |
| 3 or 4 Children | 0 (0.0%) | 0 (0.0%) |
| 5 or more Children | 0 (0.0%) | 0 (0.0%) |
| Total | 0 (0.0%) | 0 (0.0%) |
Race in Gilson
The most populous races in Gilson are White / Caucasian (113 | 93.4%), and Native / Alaskan (8 | 6.6%).
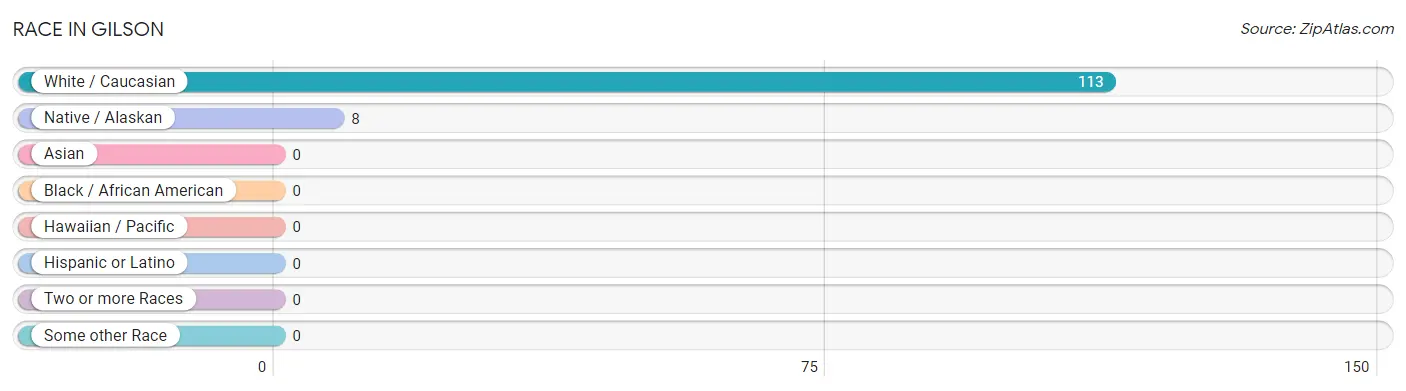
| Race | # Population | % Population |
| Asian | 0 | 0.0% |
| Black / African American | 0 | 0.0% |
| Hawaiian / Pacific | 0 | 0.0% |
| Hispanic or Latino | 0 | 0.0% |
| Native / Alaskan | 8 | 6.6% |
| White / Caucasian | 113 | 93.4% |
| Two or more Races | 0 | 0.0% |
| Some other Race | 0 | 0.0% |
| Total | 121 | 100.0% |
Ancestry in Gilson
The most populous ancestries reported in Gilson are German (66 | 54.5%), Irish (44 | 36.4%), Dutch (40 | 33.1%), Swedish (9 | 7.4%), and Tohono O'Odham (8 | 6.6%), together accounting for 138.0% of all Gilson residents.
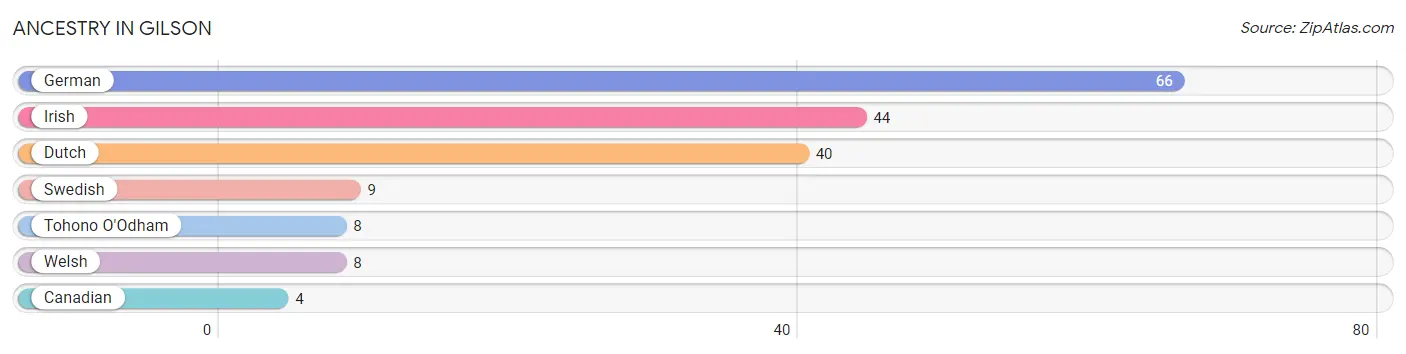
| Ancestry | # Population | % Population |
| Canadian | 4 | 3.3% |
| Dutch | 40 | 33.1% |
| German | 66 | 54.5% |
| Irish | 44 | 36.4% |
| Swedish | 9 | 7.4% |
| Tohono O'Odham | 8 | 6.6% |
| Welsh | 8 | 6.6% | View All 7 Rows |
Immigrants in Gilson

| Immigration Origin | # Population | % Population | View All 0 Rows |
Sex and Age in Gilson
Sex and Age in Gilson
The most populous age groups in Gilson are 65 to 69 Years (18 | 34.0%) for men and 65 to 69 Years (16 | 23.5%) for women.
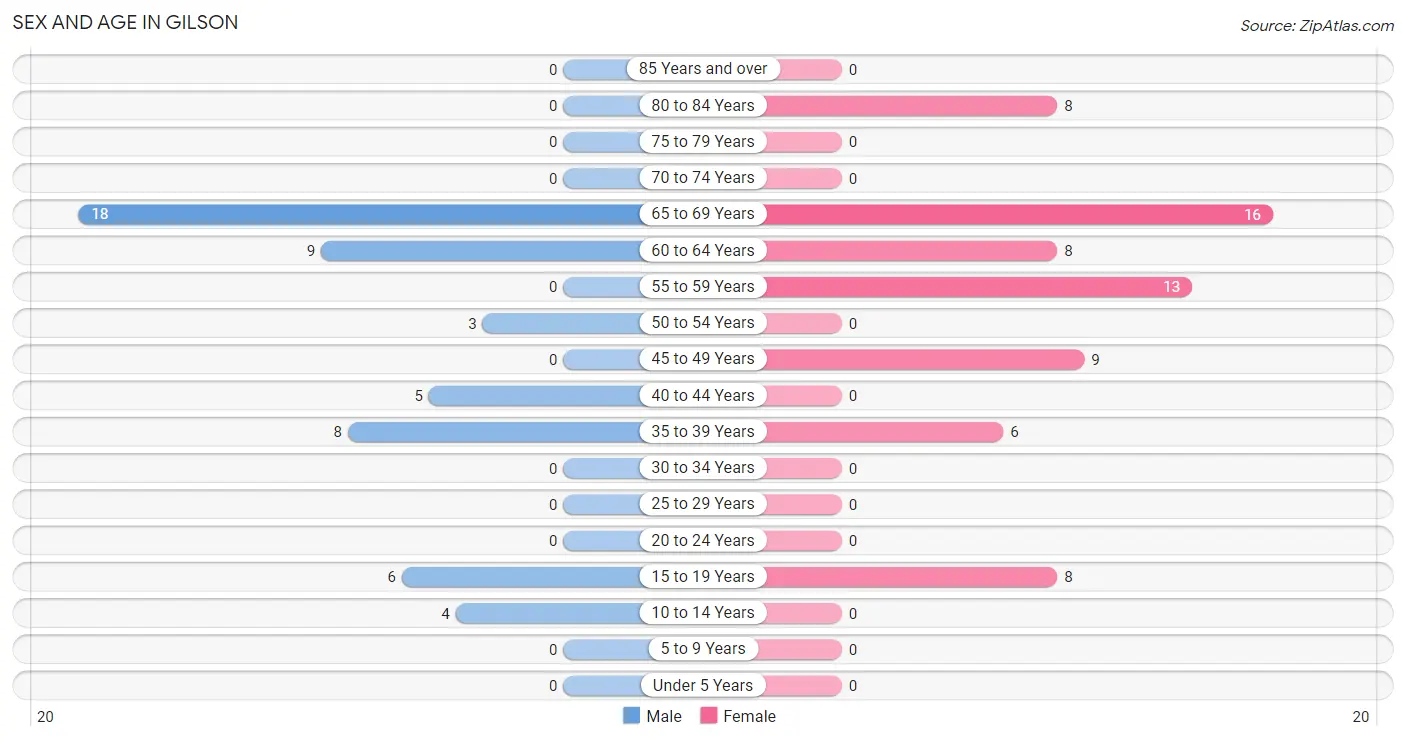
| Age Bracket | Male | Female |
| Under 5 Years | 0 (0.0%) | 0 (0.0%) |
| 5 to 9 Years | 0 (0.0%) | 0 (0.0%) |
| 10 to 14 Years | 4 (7.5%) | 0 (0.0%) |
| 15 to 19 Years | 6 (11.3%) | 8 (11.8%) |
| 20 to 24 Years | 0 (0.0%) | 0 (0.0%) |
| 25 to 29 Years | 0 (0.0%) | 0 (0.0%) |
| 30 to 34 Years | 0 (0.0%) | 0 (0.0%) |
| 35 to 39 Years | 8 (15.1%) | 6 (8.8%) |
| 40 to 44 Years | 5 (9.4%) | 0 (0.0%) |
| 45 to 49 Years | 0 (0.0%) | 9 (13.2%) |
| 50 to 54 Years | 3 (5.7%) | 0 (0.0%) |
| 55 to 59 Years | 0 (0.0%) | 13 (19.1%) |
| 60 to 64 Years | 9 (17.0%) | 8 (11.8%) |
| 65 to 69 Years | 18 (34.0%) | 16 (23.5%) |
| 70 to 74 Years | 0 (0.0%) | 0 (0.0%) |
| 75 to 79 Years | 0 (0.0%) | 0 (0.0%) |
| 80 to 84 Years | 0 (0.0%) | 8 (11.8%) |
| 85 Years and over | 0 (0.0%) | 0 (0.0%) |
| Total | 53 (100.0%) | 68 (100.0%) |
Families and Households in Gilson
Median Family Size in Gilson
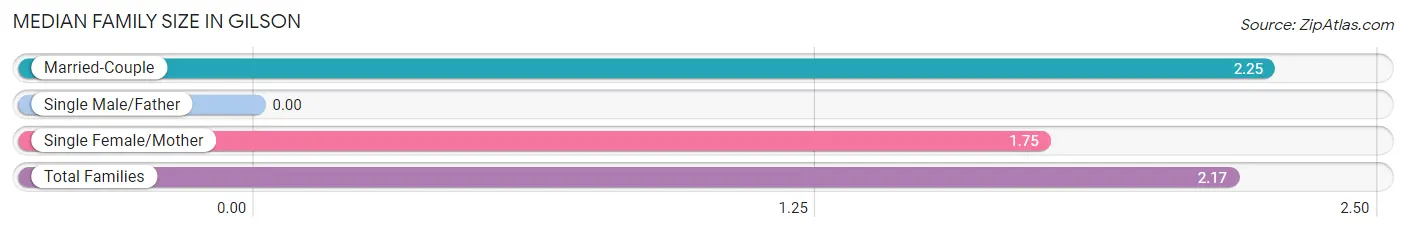
| Family Type | # Families | Family Size |
| Married-Couple | 44 (84.6%) | 2.25 |
| Single Male/Father | 0 (0.0%) | - |
| Single Female/Mother | 8 (15.4%) | 1.75 |
| Total Families | 52 (100.0%) | 2.17 |
Median Household Size in Gilson
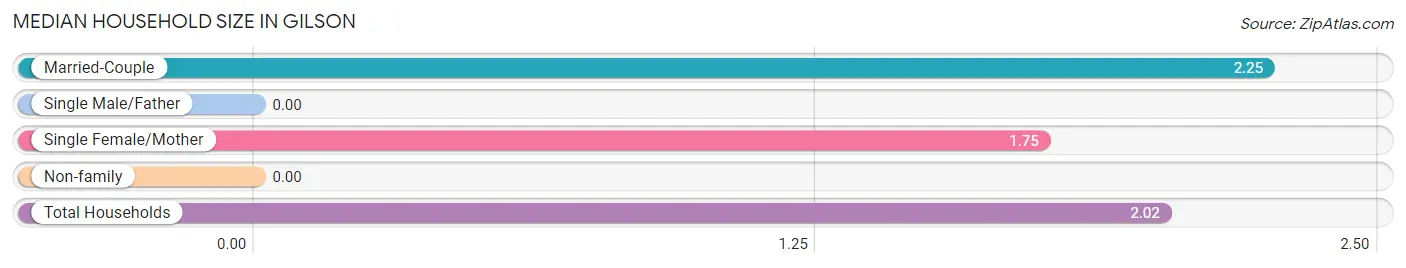
| Household Type | # Households | Household Size |
| Married-Couple | 44 (73.3%) | 2.25 |
| Single Male/Father | 0 (0.0%) | - |
| Single Female/Mother | 8 (13.3%) | 1.75 |
| Non-family | 8 (13.3%) | - |
| Total Households | 60 (100.0%) | 2.02 |
Household Size by Marriage Status in Gilson
Out of a total of 60 households in Gilson, 52 (86.7%) are family households, while 8 (13.3%) are nonfamily households. The most numerous type of family households are 2-person households, comprising 37, and the most common type of nonfamily households are 1-person households, comprising 8.
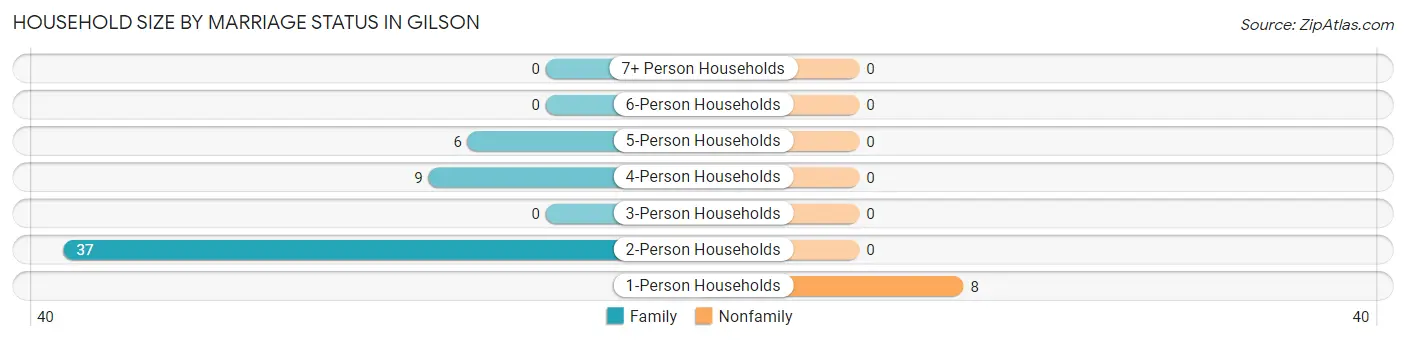
| Household Size | Family Households | Nonfamily Households |
| 1-Person Households | - | 8 (13.3%) |
| 2-Person Households | 37 (61.7%) | 0 (0.0%) |
| 3-Person Households | 0 (0.0%) | 0 (0.0%) |
| 4-Person Households | 9 (15.0%) | 0 (0.0%) |
| 5-Person Households | 6 (10.0%) | 0 (0.0%) |
| 6-Person Households | 0 (0.0%) | 0 (0.0%) |
| 7+ Person Households | 0 (0.0%) | 0 (0.0%) |
| Total | 52 (86.7%) | 8 (13.3%) |
Female Fertility in Gilson
Fertility by Age in Gilson
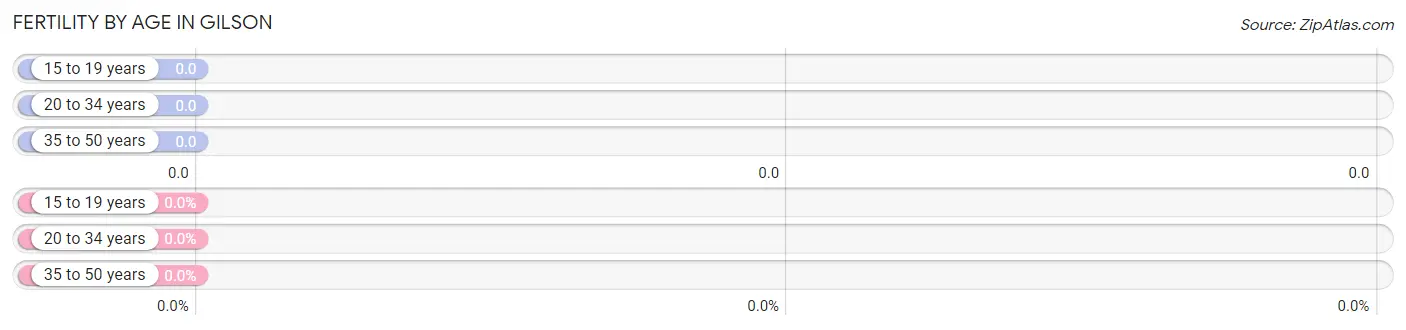
| Age Bracket | Women with Births | Births / 1,000 Women |
| 15 to 19 years | 0 (0.0%) | 0.0 |
| 20 to 34 years | 0 (0.0%) | 0.0 |
| 35 to 50 years | 0 (0.0%) | 0.0 |
| Total | 0 (0.0%) | 0.0 |
Fertility by Age by Marriage Status in Gilson
| Age Bracket | Married | Unmarried |
| 15 to 19 years | 0 (0.0%) | 0 (0.0%) |
| 20 to 34 years | 0 (0.0%) | 0 (0.0%) |
| 35 to 50 years | 0 (0.0%) | 0 (0.0%) |
| Total | 0 (0.0%) | 0 (0.0%) |
Fertility by Education in Gilson
| Educational Attainment | Women with Births | Births / 1,000 Women |
| Less than High School | 0 (0.0%) | 0.0 |
| High School Diploma | 0 (0.0%) | 0.0 |
| College or Associate's Degree | 0 (0.0%) | 0.0 |
| Bachelor's Degree | 0 (0.0%) | 0.0 |
| Graduate Degree | 0 (0.0%) | 0.0 |
| Total | 0 (0.0%) | 0.0 |
Fertility by Education by Marriage Status in Gilson
| Educational Attainment | Married | Unmarried |
| Less than High School | 0 (0.0%) | 0 (0.0%) |
| High School Diploma | 0 (0.0%) | 0 (0.0%) |
| College or Associate's Degree | 0 (0.0%) | 0 (0.0%) |
| Bachelor's Degree | 0 (0.0%) | 0 (0.0%) |
| Graduate Degree | 0 (0.0%) | 0 (0.0%) |
| Total | 0 (0.0%) | 0 (0.0%) |
Employment Characteristics in Gilson
Employment by Class of Employer in Gilson
Among the 69 employed individuals in Gilson, private company employees (58 | 84.1%), and not-for-profit organizations (11 | 15.9%) make up the most common classes of employment.
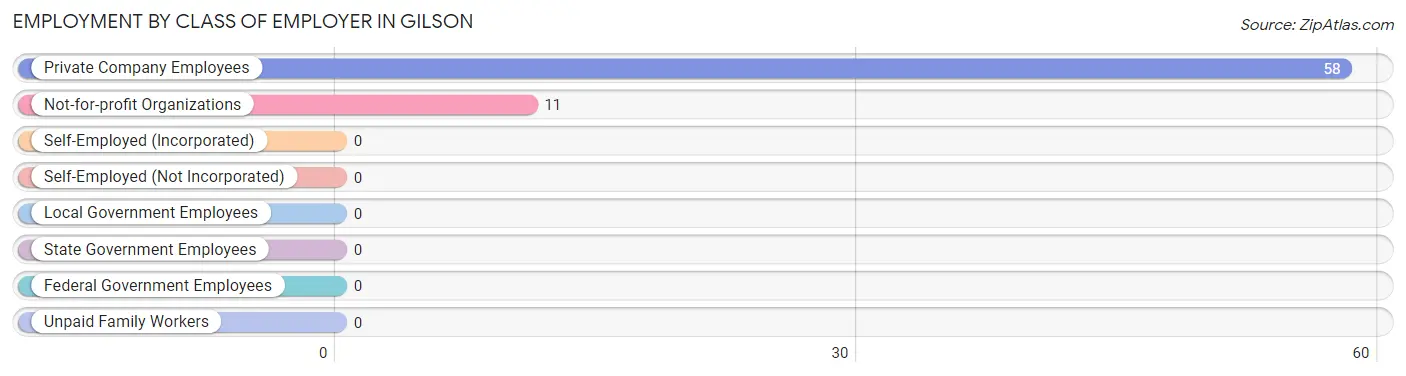
| Employer Class | # Employees | % Employees |
| Private Company Employees | 58 | 84.1% |
| Self-Employed (Incorporated) | 0 | 0.0% |
| Self-Employed (Not Incorporated) | 0 | 0.0% |
| Not-for-profit Organizations | 11 | 15.9% |
| Local Government Employees | 0 | 0.0% |
| State Government Employees | 0 | 0.0% |
| Federal Government Employees | 0 | 0.0% |
| Unpaid Family Workers | 0 | 0.0% |
| Total | 69 | 100.0% |
Employment Status by Age in Gilson
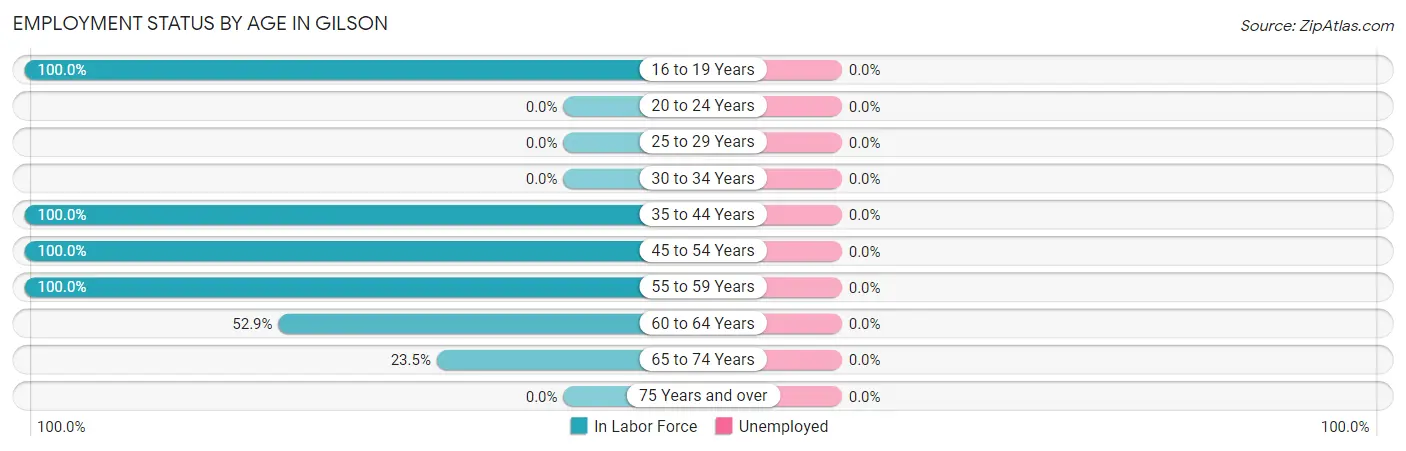
| Age Bracket | In Labor Force | Unemployed |
| 16 to 19 Years | 8 (100.0%) | 0 (0.0%) |
| 20 to 24 Years | 0 (0.0%) | 0 (0.0%) |
| 25 to 29 Years | 0 (0.0%) | 0 (0.0%) |
| 30 to 34 Years | 0 (0.0%) | 0 (0.0%) |
| 35 to 44 Years | 19 (100.0%) | 0 (0.0%) |
| 45 to 54 Years | 12 (100.0%) | 0 (0.0%) |
| 55 to 59 Years | 13 (100.0%) | 0 (0.0%) |
| 60 to 64 Years | 9 (52.9%) | 0 (0.0%) |
| 65 to 74 Years | 8 (23.5%) | 0 (0.0%) |
| 75 Years and over | 0 (0.0%) | 0 (0.0%) |
| Total | 69 (62.2%) | 0 (0.0%) |
Employment Status by Educational Attainment in Gilson
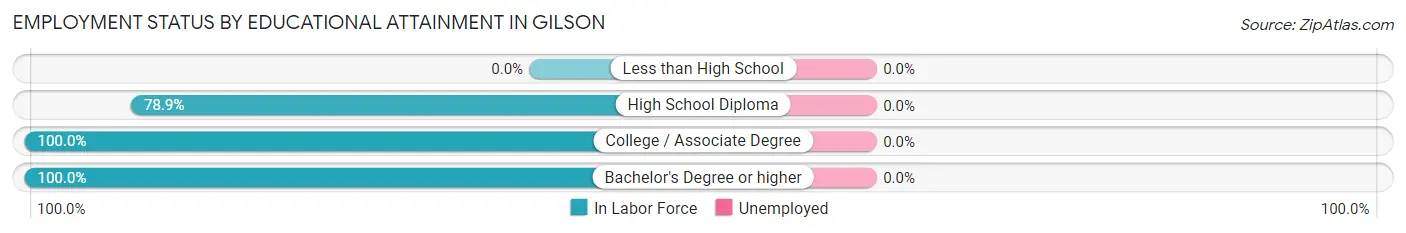
| Educational Attainment | In Labor Force | Unemployed |
| Less than High School | 0 (0.0%) | 0 (0.0%) |
| High School Diploma | 30 (78.9%) | 0 (0.0%) |
| College / Associate Degree | 14 (100.0%) | 0 (0.0%) |
| Bachelor's Degree or higher | 9 (100.0%) | 0 (0.0%) |
| Total | 53 (86.9%) | 0 (0.0%) |
Employment Occupations by Sex in Gilson
Management, Business, Science and Arts Occupations
The most common Management, Business, Science and Arts occupations in Gilson are Health Diagnosing & Treating (9 | 13.0%), and Health Technologists (9 | 13.0%).
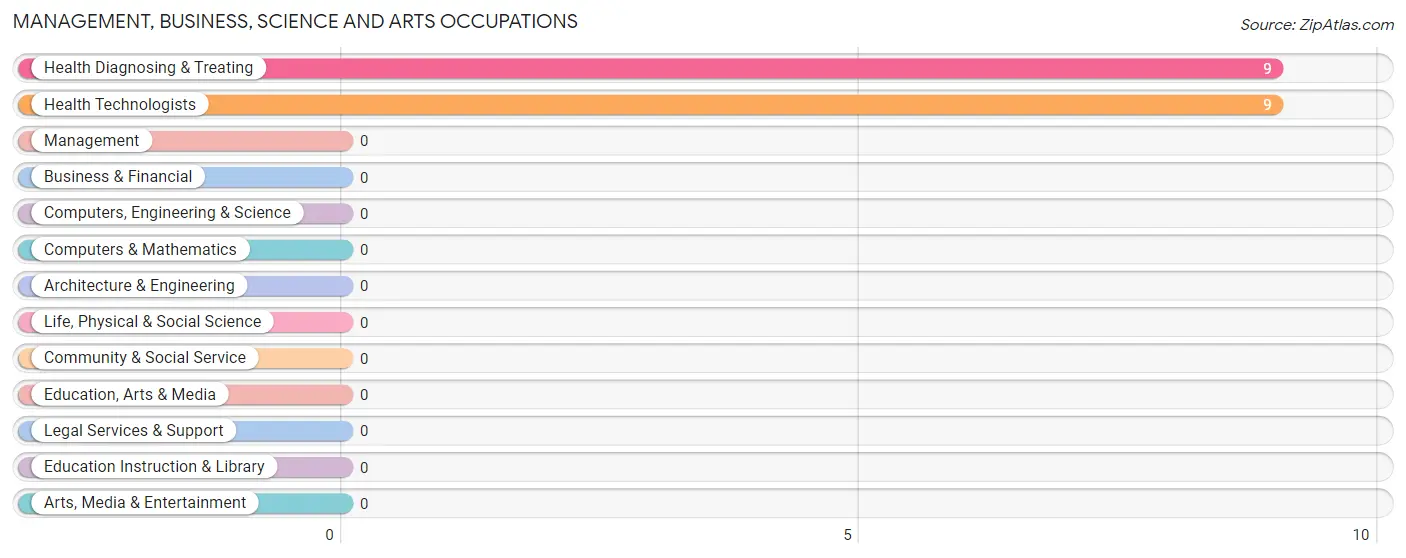
Management, Business, Science and Arts Occupations by Sex
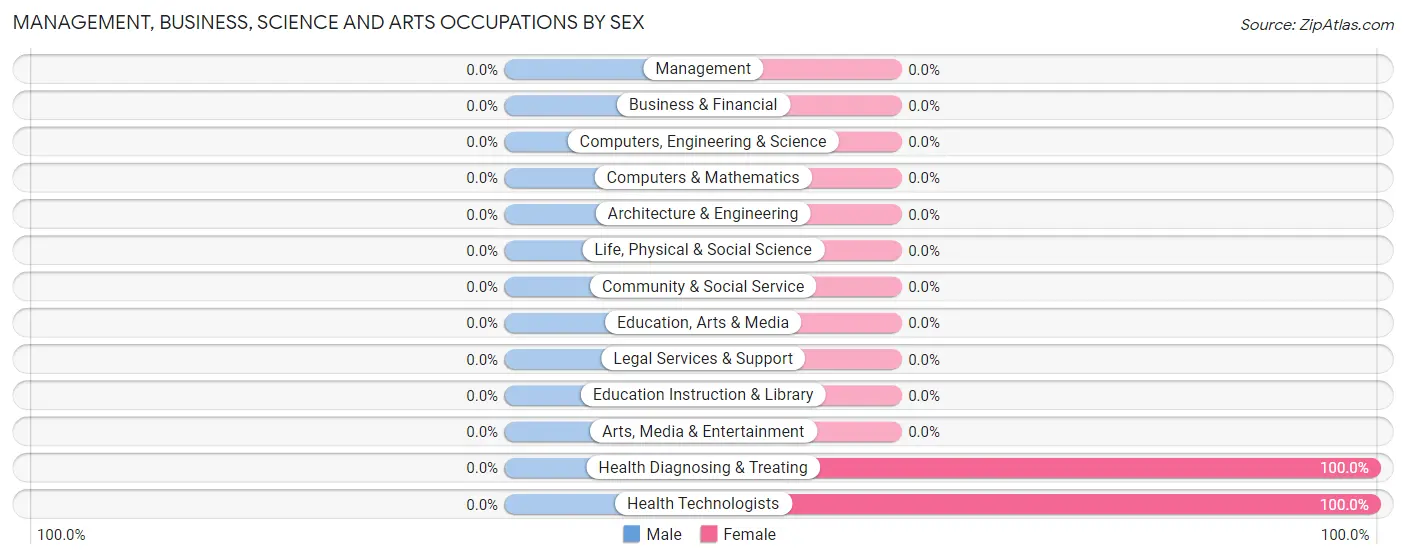
| Occupation | Male | Female |
| Management | 0 (0.0%) | 0 (0.0%) |
| Business & Financial | 0 (0.0%) | 0 (0.0%) |
| Computers, Engineering & Science | 0 (0.0%) | 0 (0.0%) |
| Computers & Mathematics | 0 (0.0%) | 0 (0.0%) |
| Architecture & Engineering | 0 (0.0%) | 0 (0.0%) |
| Life, Physical & Social Science | 0 (0.0%) | 0 (0.0%) |
| Community & Social Service | 0 (0.0%) | 0 (0.0%) |
| Education, Arts & Media | 0 (0.0%) | 0 (0.0%) |
| Legal Services & Support | 0 (0.0%) | 0 (0.0%) |
| Education Instruction & Library | 0 (0.0%) | 0 (0.0%) |
| Arts, Media & Entertainment | 0 (0.0%) | 0 (0.0%) |
| Health Diagnosing & Treating | 0 (0.0%) | 9 (100.0%) |
| Health Technologists | 0 (0.0%) | 9 (100.0%) |
| Total (Category) | 0 (0.0%) | 9 (100.0%) |
| Total (Overall) | 31 (44.9%) | 38 (55.1%) |
Services Occupations
The most common Services occupations in Gilson are , and Cleaning & Maintenance (6 | 8.7%).
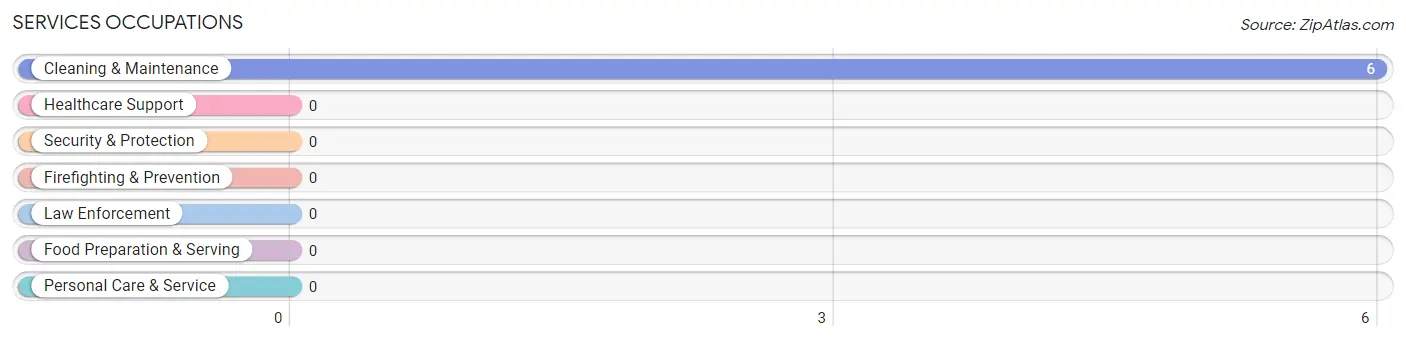
Services Occupations by Sex
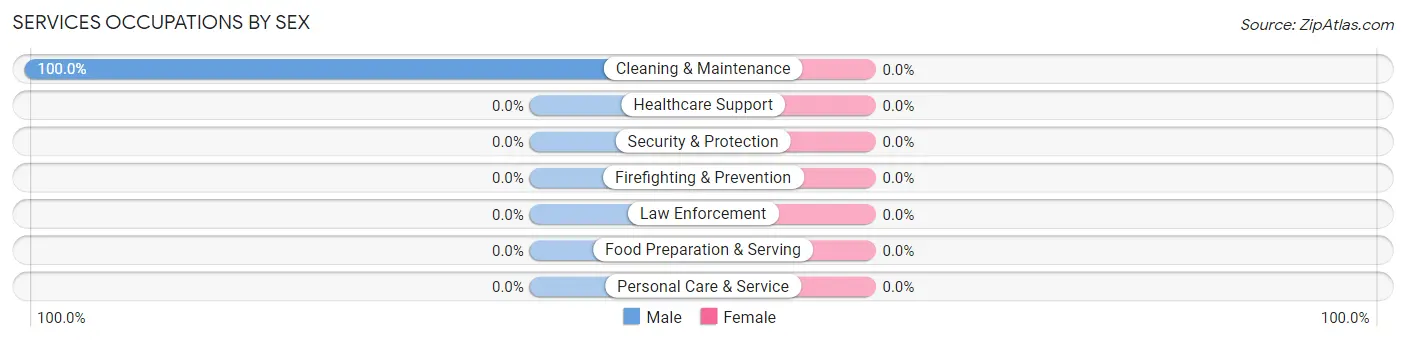
| Occupation | Male | Female |
| Healthcare Support | 0 (0.0%) | 0 (0.0%) |
| Security & Protection | 0 (0.0%) | 0 (0.0%) |
| Firefighting & Prevention | 0 (0.0%) | 0 (0.0%) |
| Law Enforcement | 0 (0.0%) | 0 (0.0%) |
| Food Preparation & Serving | 0 (0.0%) | 0 (0.0%) |
| Cleaning & Maintenance | 6 (100.0%) | 0 (0.0%) |
| Personal Care & Service | 0 (0.0%) | 0 (0.0%) |
| Total (Category) | 6 (100.0%) | 0 (0.0%) |
| Total (Overall) | 31 (44.9%) | 38 (55.1%) |
Sales and Office Occupations
The most common Sales and Office occupations in Gilson are Office & Administration (29 | 42.0%), and Sales & Related (11 | 15.9%).
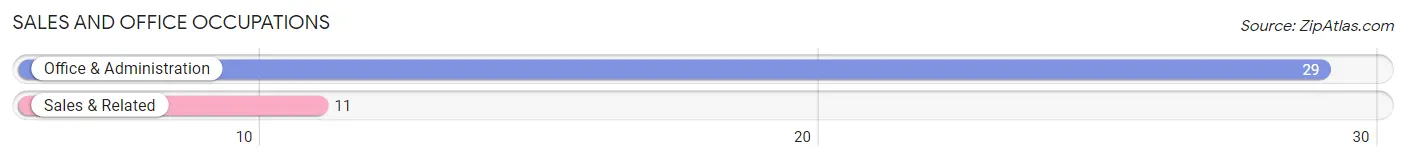
Sales and Office Occupations by Sex
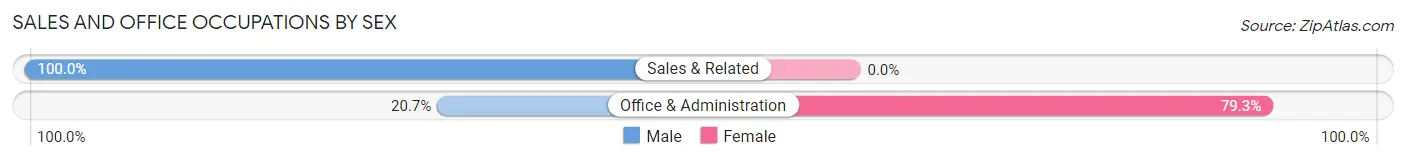
| Occupation | Male | Female |
| Sales & Related | 11 (100.0%) | 0 (0.0%) |
| Office & Administration | 6 (20.7%) | 23 (79.3%) |
| Total (Category) | 17 (42.5%) | 23 (57.5%) |
| Total (Overall) | 31 (44.9%) | 38 (55.1%) |
Natural Resources, Construction and Maintenance Occupations
The most common Natural Resources, Construction and Maintenance occupations in Gilson are , and Installation, Maintenance & Repair (3 | 4.3%).
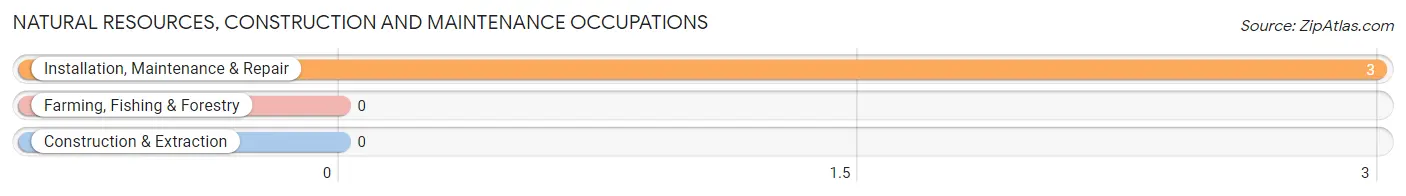
Natural Resources, Construction and Maintenance Occupations by Sex
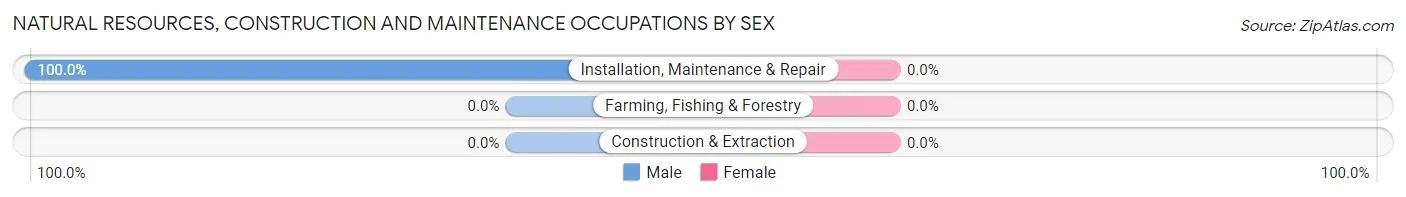
| Occupation | Male | Female |
| Farming, Fishing & Forestry | 0 (0.0%) | 0 (0.0%) |
| Construction & Extraction | 0 (0.0%) | 0 (0.0%) |
| Installation, Maintenance & Repair | 3 (100.0%) | 0 (0.0%) |
| Total (Category) | 3 (100.0%) | 0 (0.0%) |
| Total (Overall) | 31 (44.9%) | 38 (55.1%) |
Production, Transportation and Moving Occupations
The most common Production, Transportation and Moving occupations in Gilson are Material Moving (6 | 8.7%), and Production (5 | 7.2%).
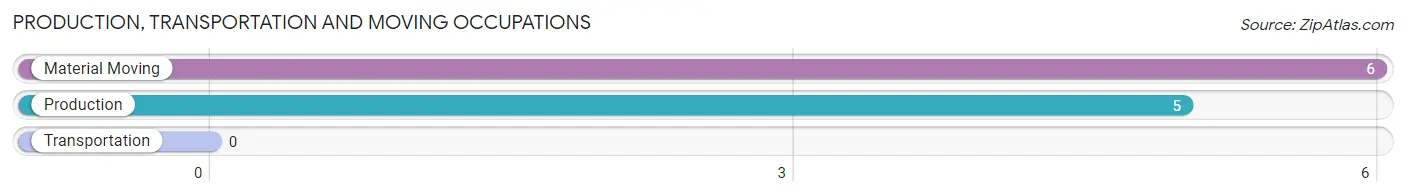
Production, Transportation and Moving Occupations by Sex
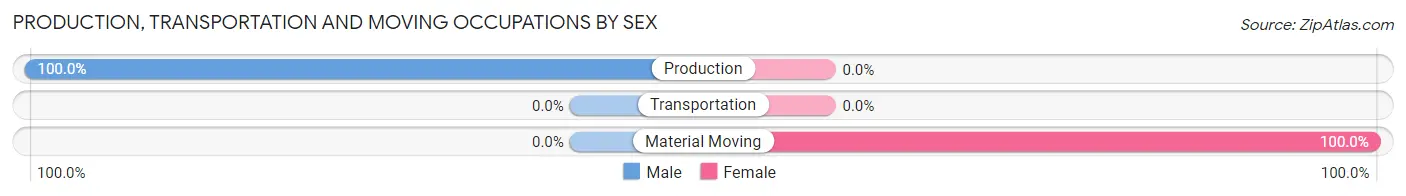
| Occupation | Male | Female |
| Production | 5 (100.0%) | 0 (0.0%) |
| Transportation | 0 (0.0%) | 0 (0.0%) |
| Material Moving | 0 (0.0%) | 6 (100.0%) |
| Total (Category) | 5 (45.5%) | 6 (54.5%) |
| Total (Overall) | 31 (44.9%) | 38 (55.1%) |
Employment Industries by Sex in Gilson
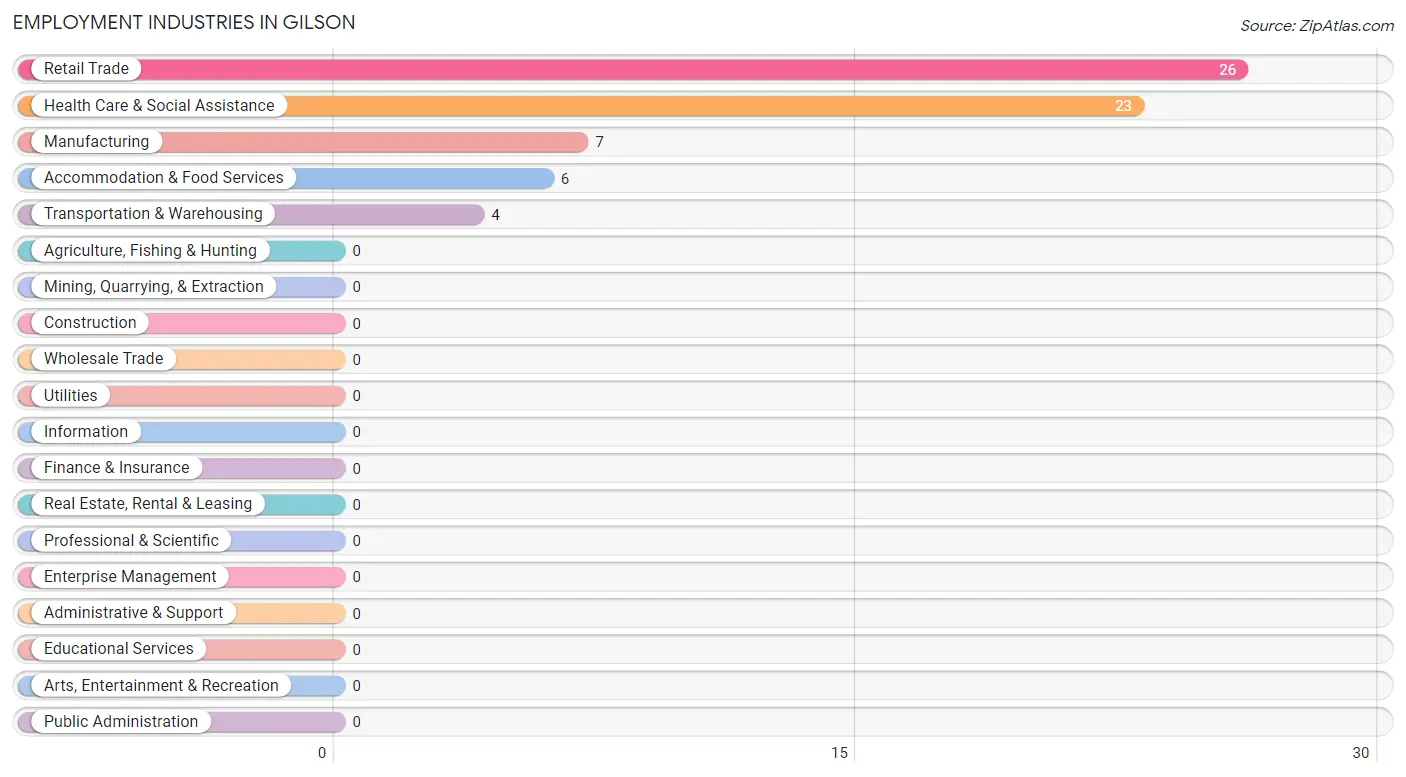
Employment Industries in Gilson
The major employment industries in Gilson include Retail Trade (26 | 37.7%), Health Care & Social Assistance (23 | 33.3%), Manufacturing (7 | 10.1%), Accommodation & Food Services (6 | 8.7%), and Transportation & Warehousing (4 | 5.8%).
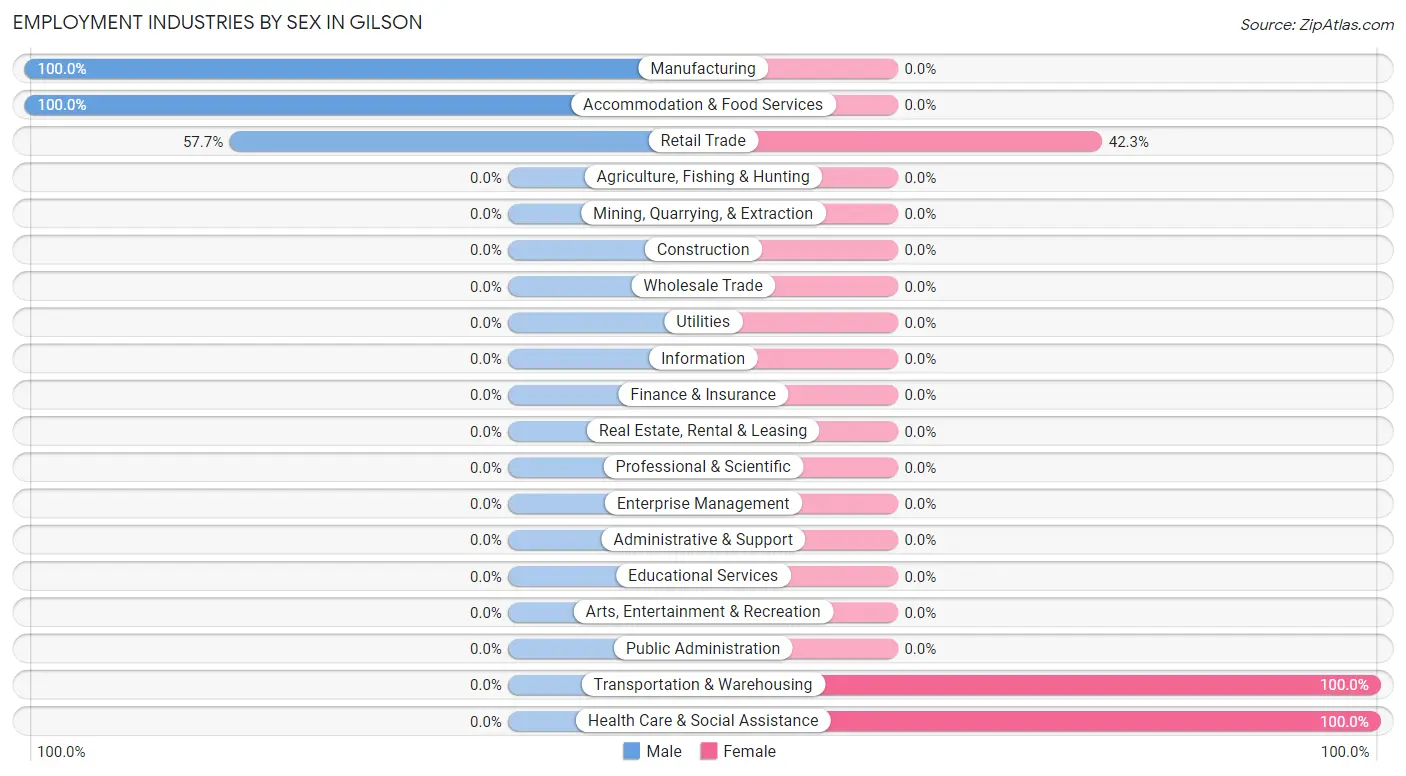
Employment Industries by Sex in Gilson
The Gilson industries that see more men than women are Manufacturing (100.0%), Accommodation & Food Services (100.0%), and Retail Trade (57.7%), whereas the industries that tend to have a higher number of women are Transportation & Warehousing (100.0%), Health Care & Social Assistance (100.0%), and Retail Trade (42.3%).
| Industry | Male | Female |
| Agriculture, Fishing & Hunting | 0 (0.0%) | 0 (0.0%) |
| Mining, Quarrying, & Extraction | 0 (0.0%) | 0 (0.0%) |
| Construction | 0 (0.0%) | 0 (0.0%) |
| Manufacturing | 7 (100.0%) | 0 (0.0%) |
| Wholesale Trade | 0 (0.0%) | 0 (0.0%) |
| Retail Trade | 15 (57.7%) | 11 (42.3%) |
| Transportation & Warehousing | 0 (0.0%) | 4 (100.0%) |
| Utilities | 0 (0.0%) | 0 (0.0%) |
| Information | 0 (0.0%) | 0 (0.0%) |
| Finance & Insurance | 0 (0.0%) | 0 (0.0%) |
| Real Estate, Rental & Leasing | 0 (0.0%) | 0 (0.0%) |
| Professional & Scientific | 0 (0.0%) | 0 (0.0%) |
| Enterprise Management | 0 (0.0%) | 0 (0.0%) |
| Administrative & Support | 0 (0.0%) | 0 (0.0%) |
| Educational Services | 0 (0.0%) | 0 (0.0%) |
| Health Care & Social Assistance | 0 (0.0%) | 23 (100.0%) |
| Arts, Entertainment & Recreation | 0 (0.0%) | 0 (0.0%) |
| Accommodation & Food Services | 6 (100.0%) | 0 (0.0%) |
| Public Administration | 0 (0.0%) | 0 (0.0%) |
| Total | 31 (44.9%) | 38 (55.1%) |
Education in Gilson
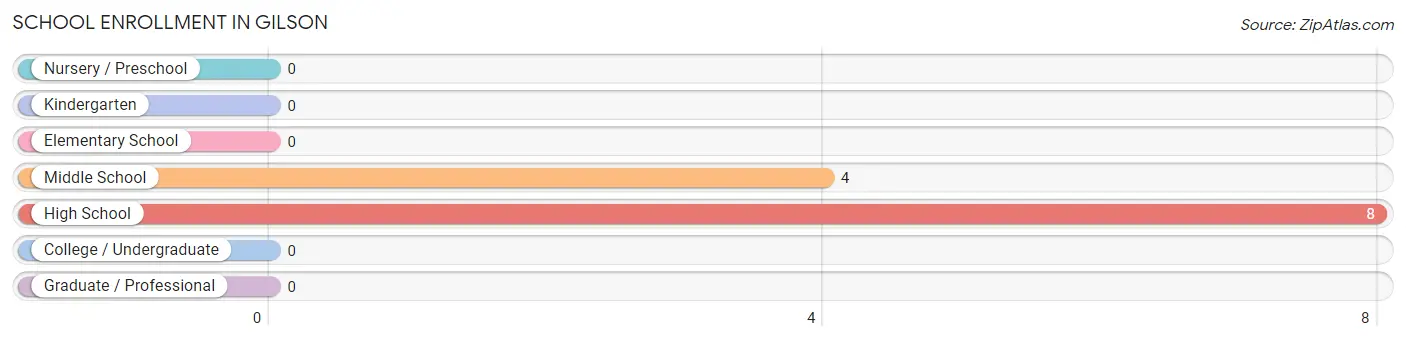
School Enrollment in Gilson
The most common levels of schooling among the 12 students in Gilson are high school (8 | 66.7%), and middle school (4 | 33.3%).
| School Level | # Students | % Students |
| Nursery / Preschool | 0 | 0.0% |
| Kindergarten | 0 | 0.0% |
| Elementary School | 0 | 0.0% |
| Middle School | 4 | 33.3% |
| High School | 8 | 66.7% |
| College / Undergraduate | 0 | 0.0% |
| Graduate / Professional | 0 | 0.0% |
| Total | 12 | 100.0% |
School Enrollment by Age by Funding Source in Gilson
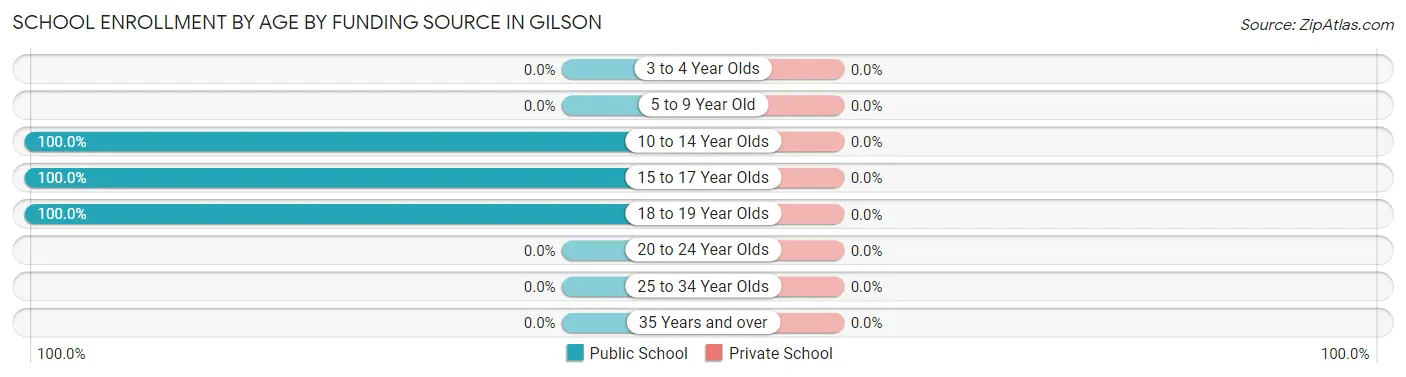
| Age Bracket | Public School | Private School |
| 3 to 4 Year Olds | 0 (0.0%) | 0 (0.0%) |
| 5 to 9 Year Old | 0 (0.0%) | 0 (0.0%) |
| 10 to 14 Year Olds | 4 (100.0%) | 0 (0.0%) |
| 15 to 17 Year Olds | 6 (100.0%) | 0 (0.0%) |
| 18 to 19 Year Olds | 2 (100.0%) | 0 (0.0%) |
| 20 to 24 Year Olds | 0 (0.0%) | 0 (0.0%) |
| 25 to 34 Year Olds | 0 (0.0%) | 0 (0.0%) |
| 35 Years and over | 0 (0.0%) | 0 (0.0%) |
| Total | 12 (100.0%) | 0 (0.0%) |
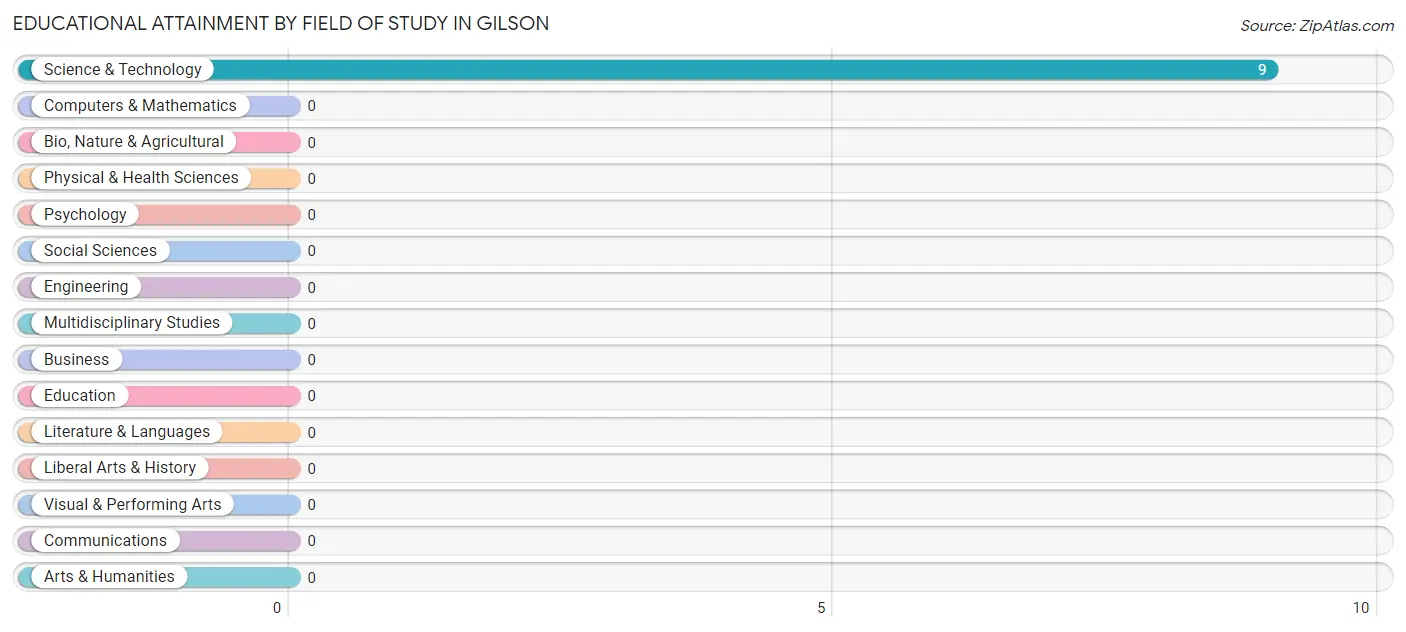
Educational Attainment by Field of Study in Gilson
, and science & technology (9 | 100.0%) are the most common fields of study among 9 individuals in Gilson who have obtained a bachelor's degree or higher.
| Field of Study | # Graduates | % Graduates |
| Computers & Mathematics | 0 | 0.0% |
| Bio, Nature & Agricultural | 0 | 0.0% |
| Physical & Health Sciences | 0 | 0.0% |
| Psychology | 0 | 0.0% |
| Social Sciences | 0 | 0.0% |
| Engineering | 0 | 0.0% |
| Multidisciplinary Studies | 0 | 0.0% |
| Science & Technology | 9 | 100.0% |
| Business | 0 | 0.0% |
| Education | 0 | 0.0% |
| Literature & Languages | 0 | 0.0% |
| Liberal Arts & History | 0 | 0.0% |
| Visual & Performing Arts | 0 | 0.0% |
| Communications | 0 | 0.0% |
| Arts & Humanities | 0 | 0.0% |
| Total | 9 | 100.0% |
Transportation & Commute in Gilson
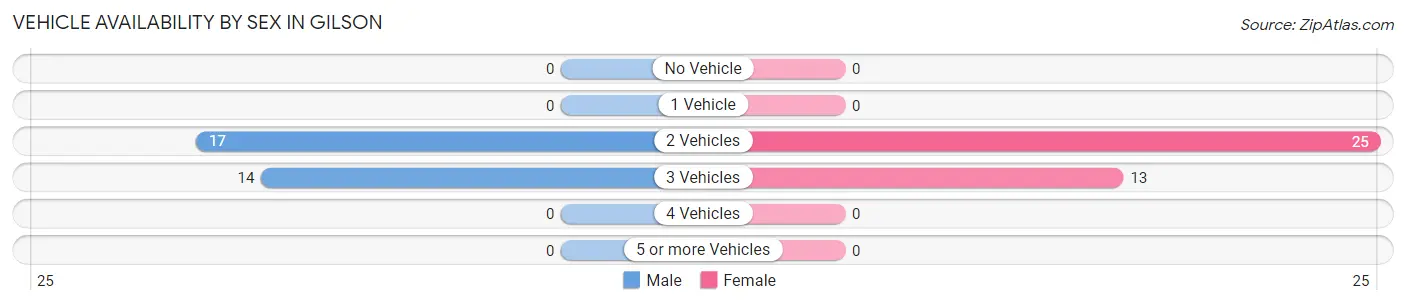
Vehicle Availability by Sex in Gilson
The most prevalent vehicle ownership categories in Gilson are males with 2 vehicles (17, accounting for 54.8%) and females with 2 vehicles (25, making up 44.7%).
| Vehicles Available | Male | Female |
| No Vehicle | 0 (0.0%) | 0 (0.0%) |
| 1 Vehicle | 0 (0.0%) | 0 (0.0%) |
| 2 Vehicles | 17 (54.8%) | 25 (65.8%) |
| 3 Vehicles | 14 (45.2%) | 13 (34.2%) |
| 4 Vehicles | 0 (0.0%) | 0 (0.0%) |
| 5 or more Vehicles | 0 (0.0%) | 0 (0.0%) |
| Total | 31 (100.0%) | 38 (100.0%) |
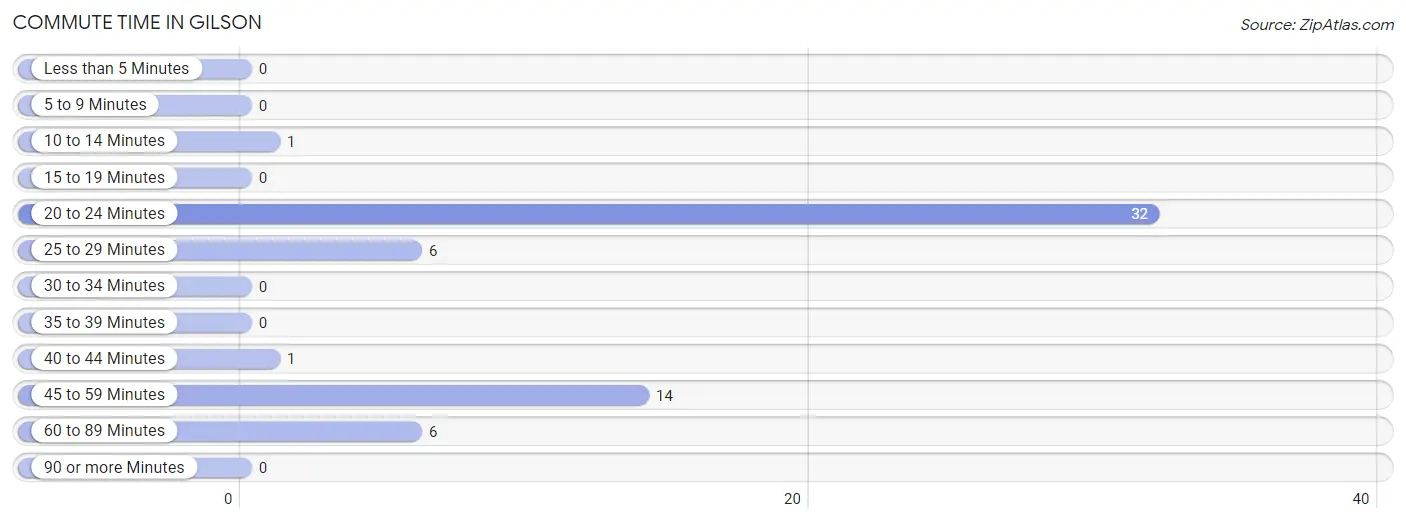
Commute Time in Gilson
The most frequently occuring commute durations in Gilson are 20 to 24 minutes (32 commuters, 53.3%), 45 to 59 minutes (14 commuters, 23.3%), and 25 to 29 minutes (6 commuters, 10.0%).
| Commute Time | # Commuters | % Commuters |
| Less than 5 Minutes | 0 | 0.0% |
| 5 to 9 Minutes | 0 | 0.0% |
| 10 to 14 Minutes | 1 | 1.7% |
| 15 to 19 Minutes | 0 | 0.0% |
| 20 to 24 Minutes | 32 | 53.3% |
| 25 to 29 Minutes | 6 | 10.0% |
| 30 to 34 Minutes | 0 | 0.0% |
| 35 to 39 Minutes | 0 | 0.0% |
| 40 to 44 Minutes | 1 | 1.7% |
| 45 to 59 Minutes | 14 | 23.3% |
| 60 to 89 Minutes | 6 | 10.0% |
| 90 or more Minutes | 0 | 0.0% |
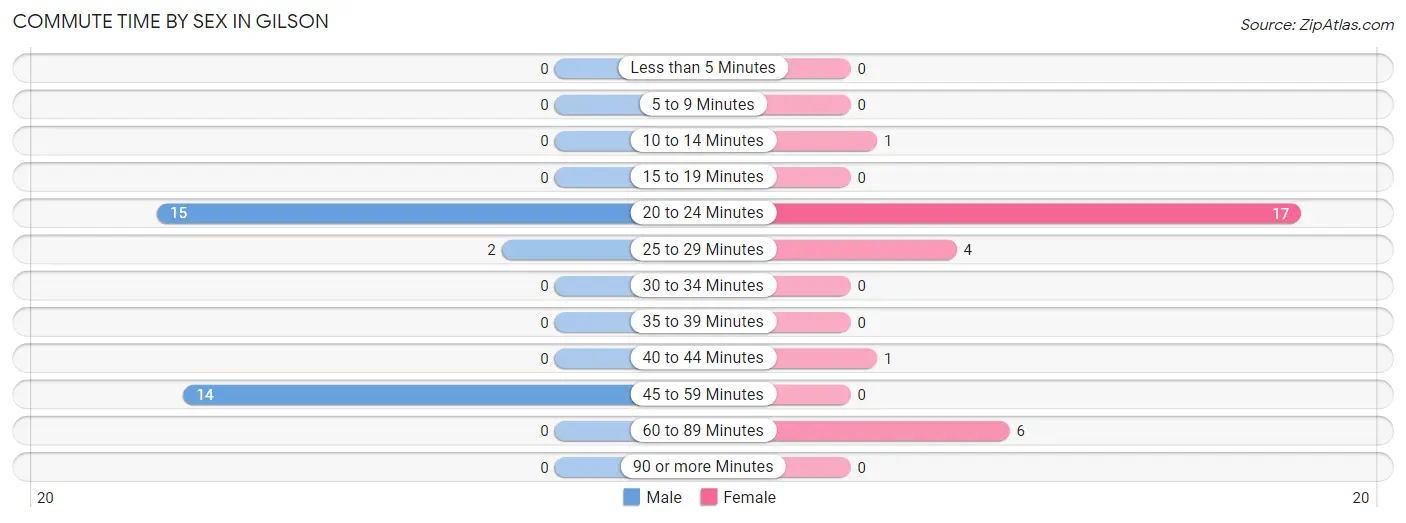
Commute Time by Sex in Gilson
The most common commute times in Gilson are 20 to 24 minutes (15 commuters, 48.4%) for males and 20 to 24 minutes (17 commuters, 58.6%) for females.
| Commute Time | Male | Female |
| Less than 5 Minutes | 0 (0.0%) | 0 (0.0%) |
| 5 to 9 Minutes | 0 (0.0%) | 0 (0.0%) |
| 10 to 14 Minutes | 0 (0.0%) | 1 (3.5%) |
| 15 to 19 Minutes | 0 (0.0%) | 0 (0.0%) |
| 20 to 24 Minutes | 15 (48.4%) | 17 (58.6%) |
| 25 to 29 Minutes | 2 (6.5%) | 4 (13.8%) |
| 30 to 34 Minutes | 0 (0.0%) | 0 (0.0%) |
| 35 to 39 Minutes | 0 (0.0%) | 0 (0.0%) |
| 40 to 44 Minutes | 0 (0.0%) | 1 (3.5%) |
| 45 to 59 Minutes | 14 (45.2%) | 0 (0.0%) |
| 60 to 89 Minutes | 0 (0.0%) | 6 (20.7%) |
| 90 or more Minutes | 0 (0.0%) | 0 (0.0%) |
Time of Departure to Work by Sex in Gilson
The most frequent times of departure to work in Gilson are 5:30 AM to 5:59 AM (15, 48.4%) for males and 6:00 AM to 6:29 AM (10, 34.5%) for females.
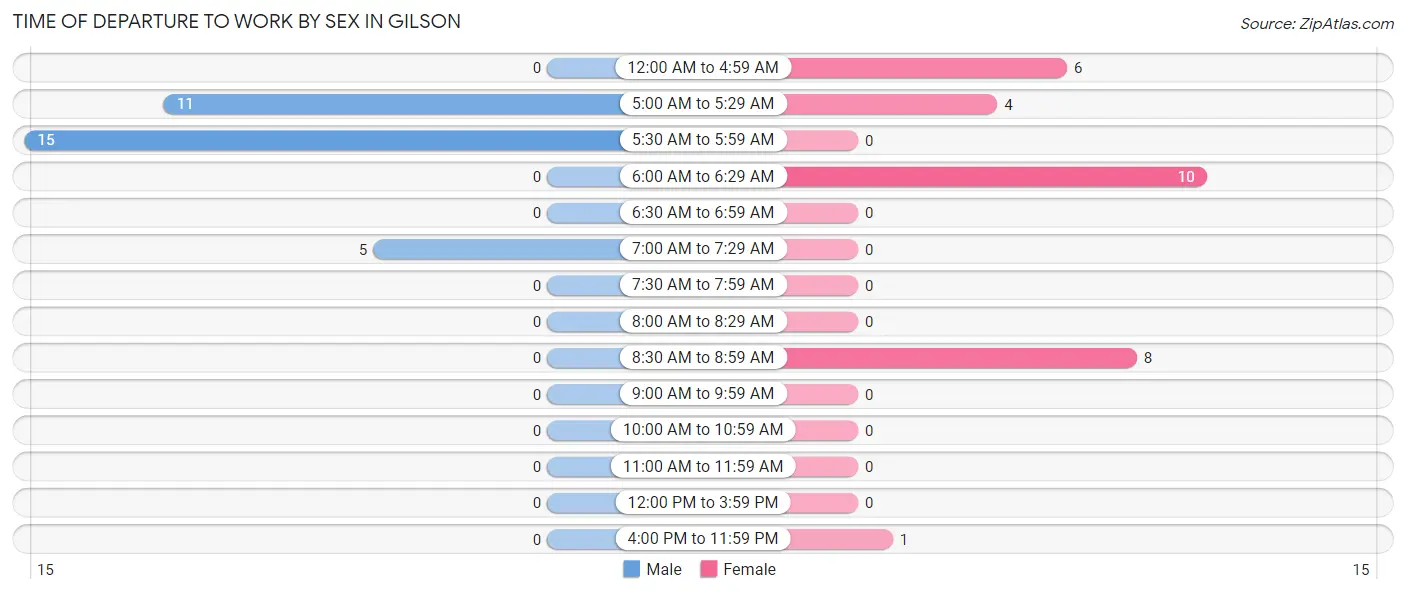
| Time of Departure | Male | Female |
| 12:00 AM to 4:59 AM | 0 (0.0%) | 6 (20.7%) |
| 5:00 AM to 5:29 AM | 11 (35.5%) | 4 (13.8%) |
| 5:30 AM to 5:59 AM | 15 (48.4%) | 0 (0.0%) |
| 6:00 AM to 6:29 AM | 0 (0.0%) | 10 (34.5%) |
| 6:30 AM to 6:59 AM | 0 (0.0%) | 0 (0.0%) |
| 7:00 AM to 7:29 AM | 5 (16.1%) | 0 (0.0%) |
| 7:30 AM to 7:59 AM | 0 (0.0%) | 0 (0.0%) |
| 8:00 AM to 8:29 AM | 0 (0.0%) | 0 (0.0%) |
| 8:30 AM to 8:59 AM | 0 (0.0%) | 8 (27.6%) |
| 9:00 AM to 9:59 AM | 0 (0.0%) | 0 (0.0%) |
| 10:00 AM to 10:59 AM | 0 (0.0%) | 0 (0.0%) |
| 11:00 AM to 11:59 AM | 0 (0.0%) | 0 (0.0%) |
| 12:00 PM to 3:59 PM | 0 (0.0%) | 0 (0.0%) |
| 4:00 PM to 11:59 PM | 0 (0.0%) | 1 (3.5%) |
| Total | 31 (100.0%) | 29 (100.0%) |
Housing Occupancy in Gilson
Occupancy by Ownership in Gilson
Of the total 60 dwellings in Gilson, owner-occupied units account for 51 (85.0%), while renter-occupied units make up 9 (15.0%).
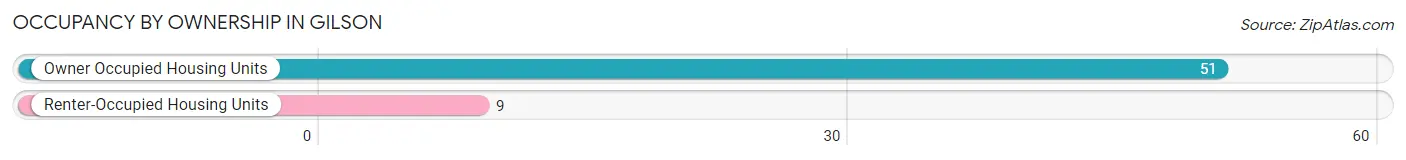
| Occupancy | # Housing Units | % Housing Units |
| Owner Occupied Housing Units | 51 | 85.0% |
| Renter-Occupied Housing Units | 9 | 15.0% |
| Total Occupied Housing Units | 60 | 100.0% |
Occupancy by Household Size in Gilson
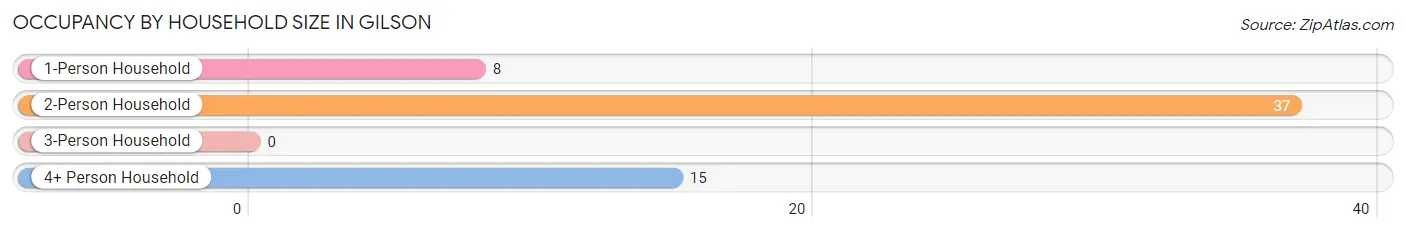
| Household Size | # Housing Units | % Housing Units |
| 1-Person Household | 8 | 13.3% |
| 2-Person Household | 37 | 61.7% |
| 3-Person Household | 0 | 0.0% |
| 4+ Person Household | 15 | 25.0% |
| Total Housing Units | 60 | 100.0% |
Occupancy by Ownership by Household Size in Gilson
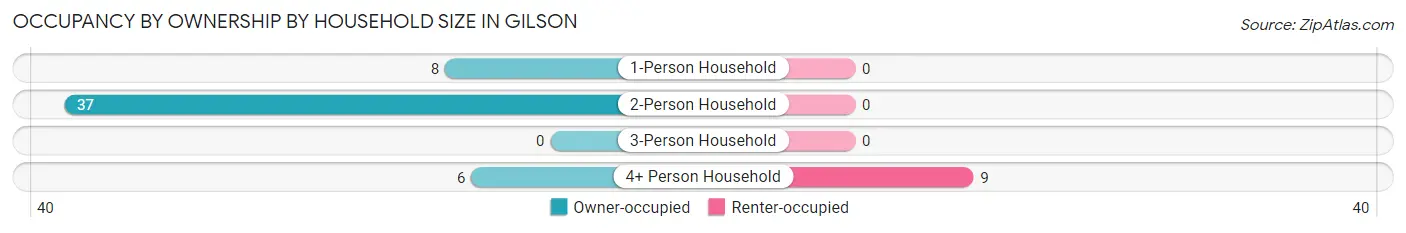
| Household Size | Owner-occupied | Renter-occupied |
| 1-Person Household | 8 (100.0%) | 0 (0.0%) |
| 2-Person Household | 37 (100.0%) | 0 (0.0%) |
| 3-Person Household | 0 (0.0%) | 0 (0.0%) |
| 4+ Person Household | 6 (40.0%) | 9 (60.0%) |
| Total Housing Units | 51 (85.0%) | 9 (15.0%) |
Occupancy by Educational Attainment in Gilson
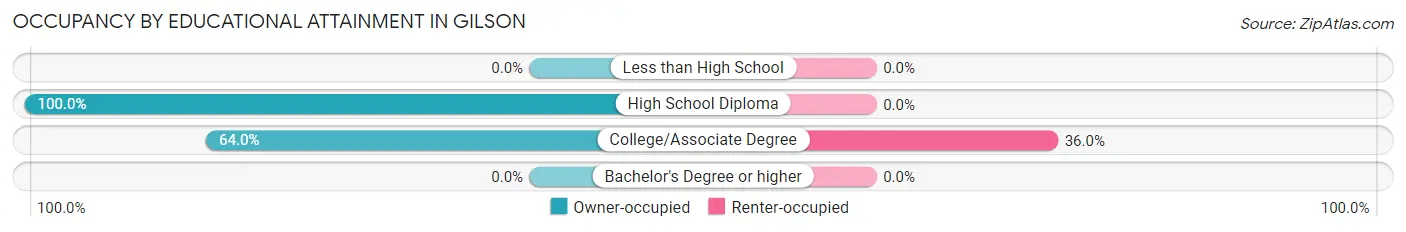
| Household Size | Owner-occupied | Renter-occupied |
| Less than High School | 0 (0.0%) | 0 (0.0%) |
| High School Diploma | 35 (100.0%) | 0 (0.0%) |
| College/Associate Degree | 16 (64.0%) | 9 (36.0%) |
| Bachelor's Degree or higher | 0 (0.0%) | 0 (0.0%) |
Occupancy by Age of Householder in Gilson
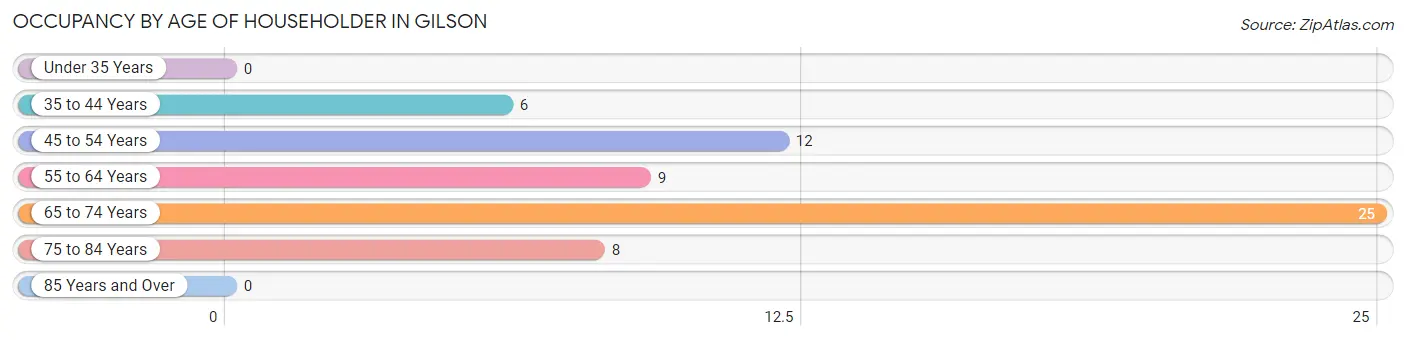
| Age Bracket | # Households | % Households |
| Under 35 Years | 0 | 0.0% |
| 35 to 44 Years | 6 | 10.0% |
| 45 to 54 Years | 12 | 20.0% |
| 55 to 64 Years | 9 | 15.0% |
| 65 to 74 Years | 25 | 41.7% |
| 75 to 84 Years | 8 | 13.3% |
| 85 Years and Over | 0 | 0.0% |
| Total | 60 | 100.0% |
Housing Finances in Gilson
Median Income by Occupancy in Gilson
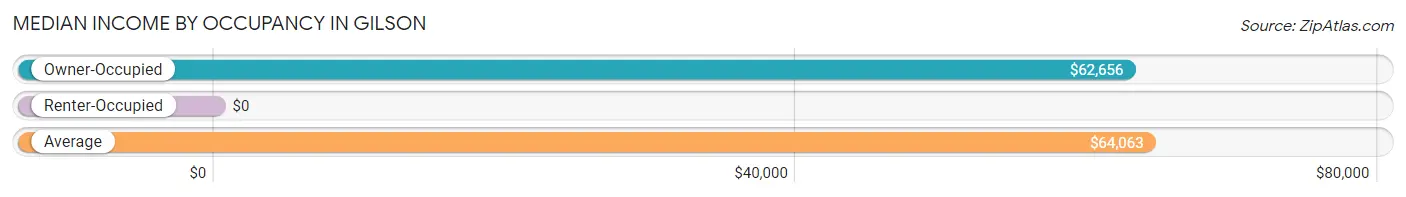
| Occupancy Type | # Households | Median Income |
| Owner-Occupied | 51 (85.0%) | $62,656 |
| Renter-Occupied | 9 (15.0%) | $0 |
| Average | 60 (100.0%) | $64,063 |
Occupancy by Householder Income Bracket in Gilson
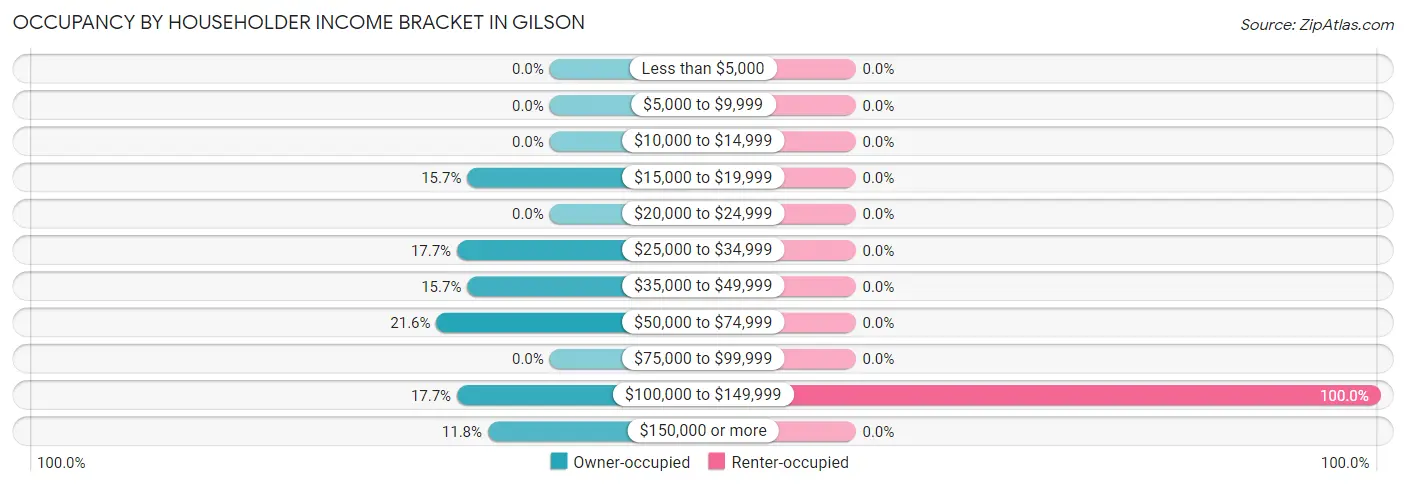
| Income Bracket | Owner-occupied | Renter-occupied |
| Less than $5,000 | 0 (0.0%) | 0 (0.0%) |
| $5,000 to $9,999 | 0 (0.0%) | 0 (0.0%) |
| $10,000 to $14,999 | 0 (0.0%) | 0 (0.0%) |
| $15,000 to $19,999 | 8 (15.7%) | 0 (0.0%) |
| $20,000 to $24,999 | 0 (0.0%) | 0 (0.0%) |
| $25,000 to $34,999 | 9 (17.6%) | 0 (0.0%) |
| $35,000 to $49,999 | 8 (15.7%) | 0 (0.0%) |
| $50,000 to $74,999 | 11 (21.6%) | 0 (0.0%) |
| $75,000 to $99,999 | 0 (0.0%) | 0 (0.0%) |
| $100,000 to $149,999 | 9 (17.6%) | 9 (100.0%) |
| $150,000 or more | 6 (11.8%) | 0 (0.0%) |
| Total | 51 (100.0%) | 9 (100.0%) |
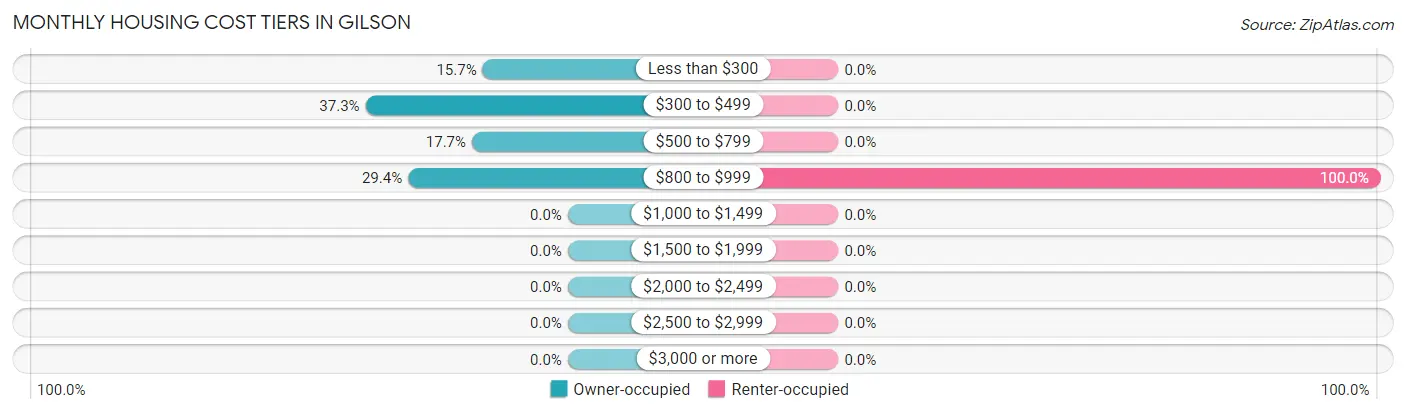
Monthly Housing Cost Tiers in Gilson
| Monthly Cost | Owner-occupied | Renter-occupied |
| Less than $300 | 8 (15.7%) | 0 (0.0%) |
| $300 to $499 | 19 (37.2%) | 0 (0.0%) |
| $500 to $799 | 9 (17.6%) | 0 (0.0%) |
| $800 to $999 | 15 (29.4%) | 9 (100.0%) |
| $1,000 to $1,499 | 0 (0.0%) | 0 (0.0%) |
| $1,500 to $1,999 | 0 (0.0%) | 0 (0.0%) |
| $2,000 to $2,499 | 0 (0.0%) | 0 (0.0%) |
| $2,500 to $2,999 | 0 (0.0%) | 0 (0.0%) |
| $3,000 or more | 0 (0.0%) | 0 (0.0%) |
| Total | 51 (100.0%) | 9 (100.0%) |
Physical Housing Characteristics in Gilson
Housing Structures in Gilson
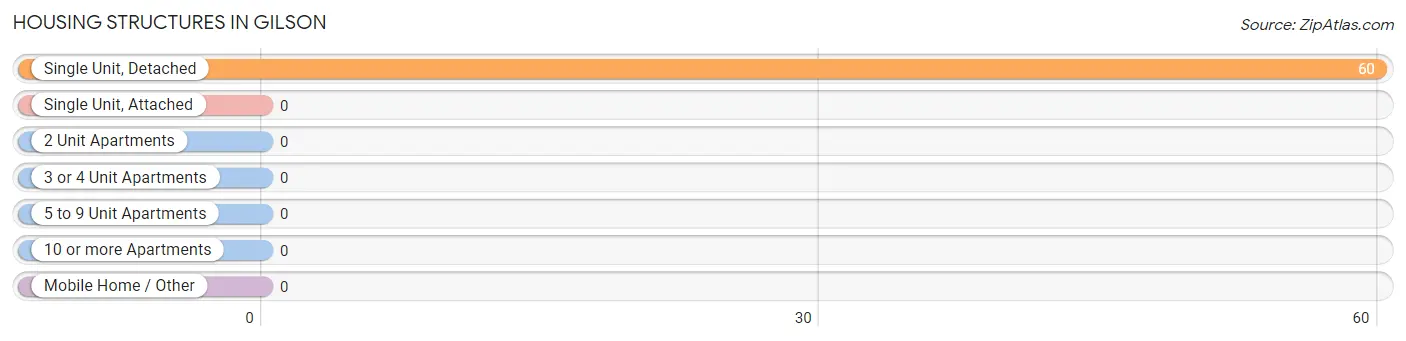
| Structure Type | # Housing Units | % Housing Units |
| Single Unit, Detached | 60 | 100.0% |
| Single Unit, Attached | 0 | 0.0% |
| 2 Unit Apartments | 0 | 0.0% |
| 3 or 4 Unit Apartments | 0 | 0.0% |
| 5 to 9 Unit Apartments | 0 | 0.0% |
| 10 or more Apartments | 0 | 0.0% |
| Mobile Home / Other | 0 | 0.0% |
| Total | 60 | 100.0% |
Housing Structures by Occupancy in Gilson
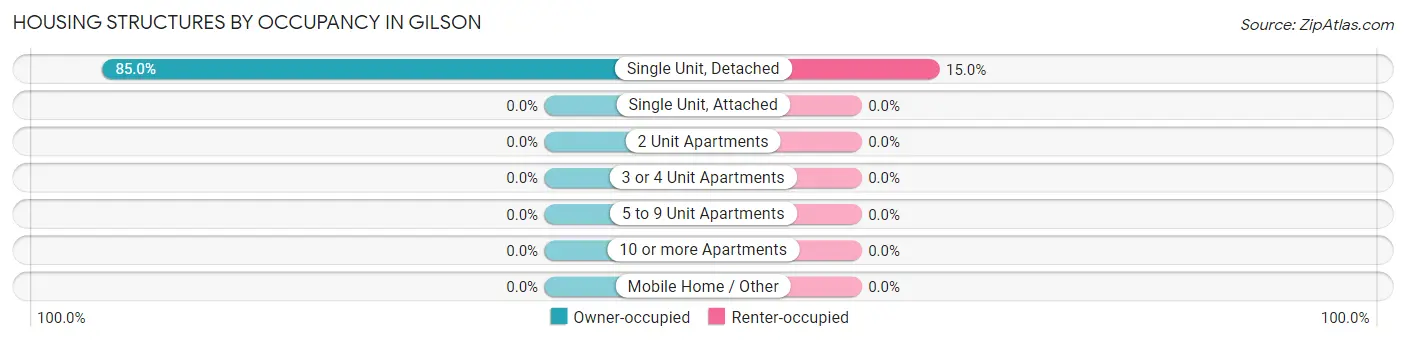
| Structure Type | Owner-occupied | Renter-occupied |
| Single Unit, Detached | 51 (85.0%) | 9 (15.0%) |
| Single Unit, Attached | 0 (0.0%) | 0 (0.0%) |
| 2 Unit Apartments | 0 (0.0%) | 0 (0.0%) |
| 3 or 4 Unit Apartments | 0 (0.0%) | 0 (0.0%) |
| 5 to 9 Unit Apartments | 0 (0.0%) | 0 (0.0%) |
| 10 or more Apartments | 0 (0.0%) | 0 (0.0%) |
| Mobile Home / Other | 0 (0.0%) | 0 (0.0%) |
| Total | 51 (85.0%) | 9 (15.0%) |
Housing Structures by Number of Rooms in Gilson
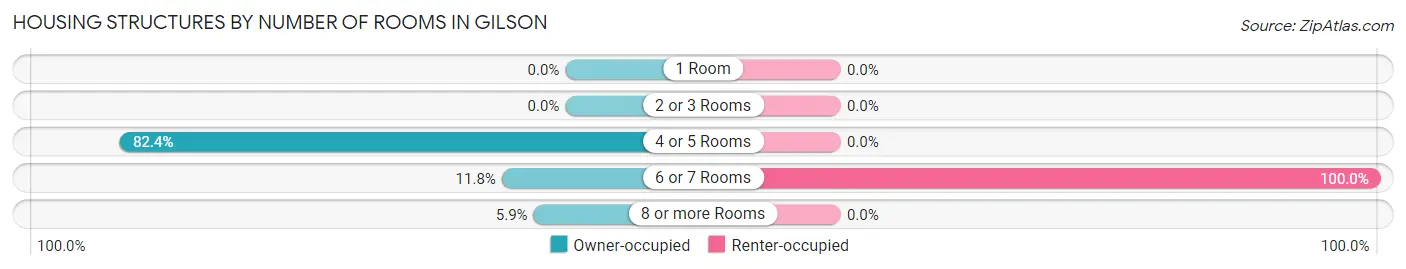
| Number of Rooms | Owner-occupied | Renter-occupied |
| 1 Room | 0 (0.0%) | 0 (0.0%) |
| 2 or 3 Rooms | 0 (0.0%) | 0 (0.0%) |
| 4 or 5 Rooms | 42 (82.4%) | 0 (0.0%) |
| 6 or 7 Rooms | 6 (11.8%) | 9 (100.0%) |
| 8 or more Rooms | 3 (5.9%) | 0 (0.0%) |
| Total | 51 (100.0%) | 9 (100.0%) |
Housing Structure by Heating Type in Gilson
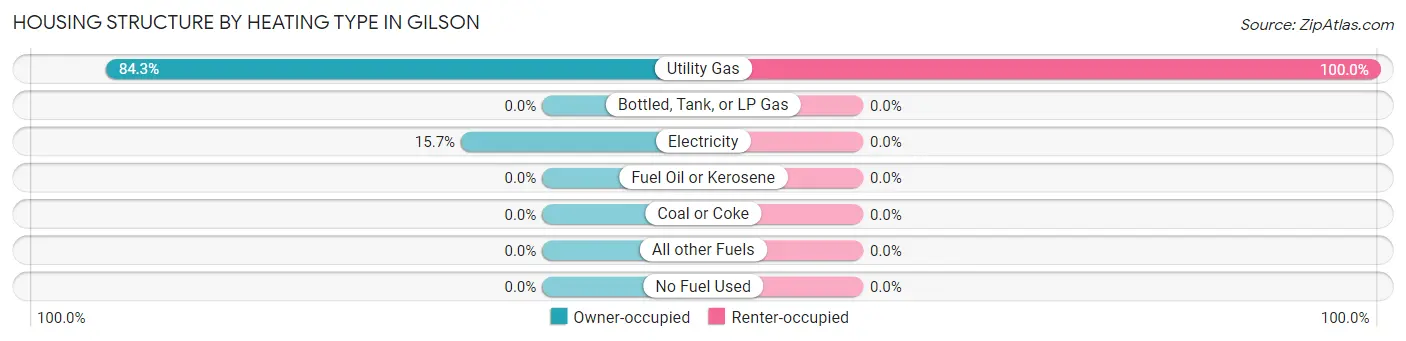
| Heating Type | Owner-occupied | Renter-occupied |
| Utility Gas | 43 (84.3%) | 9 (100.0%) |
| Bottled, Tank, or LP Gas | 0 (0.0%) | 0 (0.0%) |
| Electricity | 8 (15.7%) | 0 (0.0%) |
| Fuel Oil or Kerosene | 0 (0.0%) | 0 (0.0%) |
| Coal or Coke | 0 (0.0%) | 0 (0.0%) |
| All other Fuels | 0 (0.0%) | 0 (0.0%) |
| No Fuel Used | 0 (0.0%) | 0 (0.0%) |
| Total | 51 (100.0%) | 9 (100.0%) |
Household Vehicle Usage in Gilson
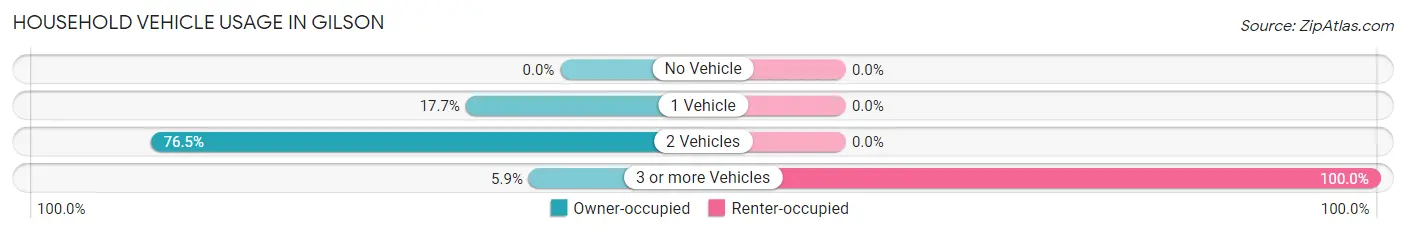
| Vehicles per Household | Owner-occupied | Renter-occupied |
| No Vehicle | 0 (0.0%) | 0 (0.0%) |
| 1 Vehicle | 9 (17.6%) | 0 (0.0%) |
| 2 Vehicles | 39 (76.5%) | 0 (0.0%) |
| 3 or more Vehicles | 3 (5.9%) | 9 (100.0%) |
| Total | 51 (100.0%) | 9 (100.0%) |
Real Estate & Mortgages in Gilson
Real Estate and Mortgage Overview in Gilson
| Characteristic | Without Mortgage | With Mortgage |
| Housing Units | 16 | 35 |
| Median Property Value | - | - |
| Median Household Income | - | - |
| Monthly Housing Costs | - | - |
| Real Estate Taxes | - | - |
Property Value by Mortgage Status in Gilson
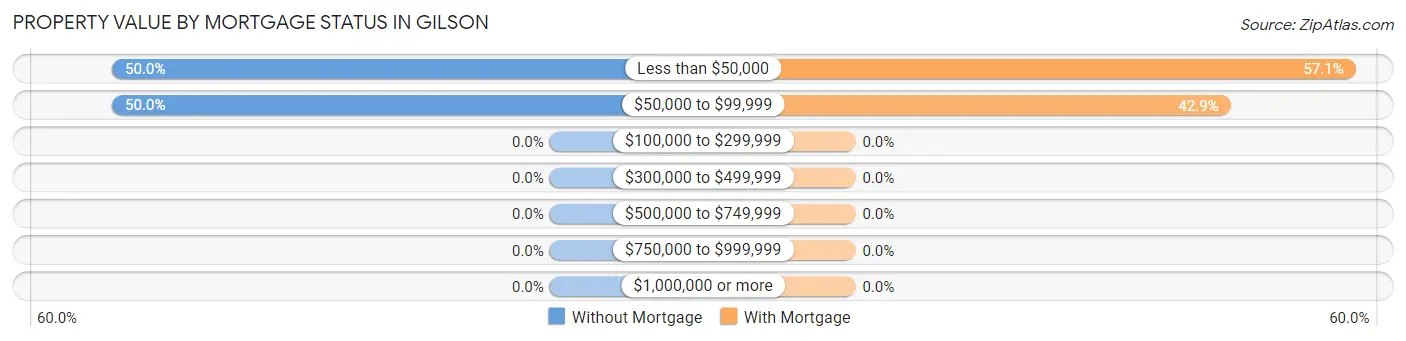
| Property Value | Without Mortgage | With Mortgage |
| Less than $50,000 | 8 (50.0%) | 20 (57.1%) |
| $50,000 to $99,999 | 8 (50.0%) | 15 (42.9%) |
| $100,000 to $299,999 | 0 (0.0%) | 0 (0.0%) |
| $300,000 to $499,999 | 0 (0.0%) | 0 (0.0%) |
| $500,000 to $749,999 | 0 (0.0%) | 0 (0.0%) |
| $750,000 to $999,999 | 0 (0.0%) | 0 (0.0%) |
| $1,000,000 or more | 0 (0.0%) | 0 (0.0%) |
| Total | 16 (100.0%) | 35 (100.0%) |
Household Income by Mortgage Status in Gilson
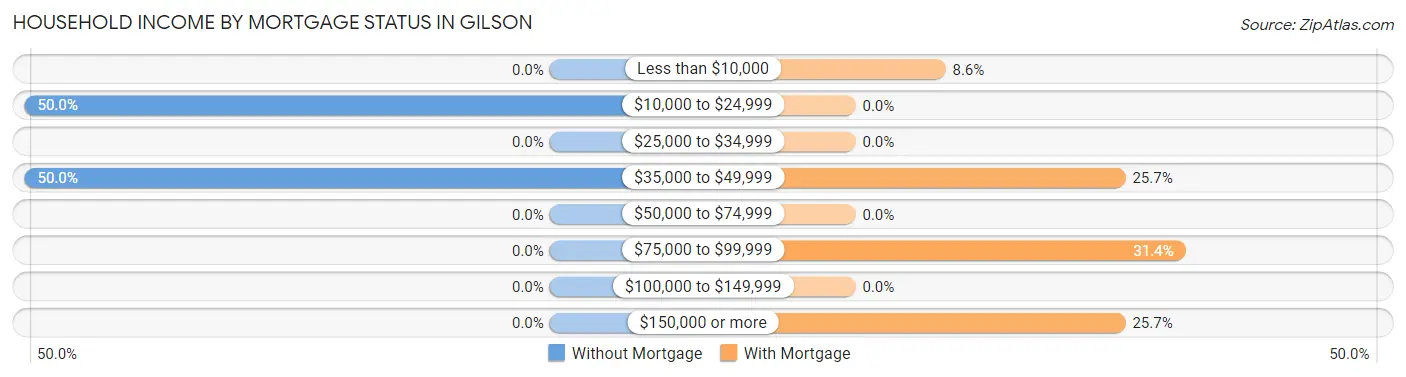
| Household Income | Without Mortgage | With Mortgage |
| Less than $10,000 | 0 (0.0%) | 3 (8.6%) |
| $10,000 to $24,999 | 8 (50.0%) | 0 (0.0%) |
| $25,000 to $34,999 | 0 (0.0%) | 0 (0.0%) |
| $35,000 to $49,999 | 8 (50.0%) | 9 (25.7%) |
| $50,000 to $74,999 | 0 (0.0%) | 0 (0.0%) |
| $75,000 to $99,999 | 0 (0.0%) | 11 (31.4%) |
| $100,000 to $149,999 | 0 (0.0%) | 0 (0.0%) |
| $150,000 or more | 0 (0.0%) | 9 (25.7%) |
| Total | 16 (100.0%) | 35 (100.0%) |
Property Value to Household Income Ratio in Gilson
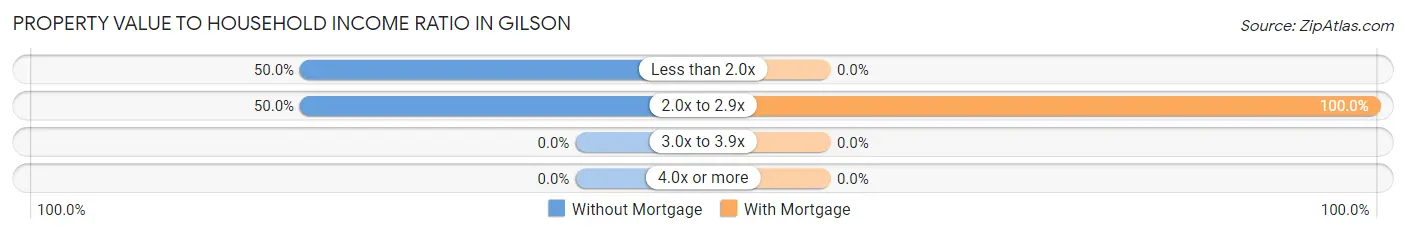
| Value-to-Income Ratio | Without Mortgage | With Mortgage |
| Less than 2.0x | 8 (50.0%) | 0 (0.0%) |
| 2.0x to 2.9x | 8 (50.0%) | 35 (100.0%) |
| 3.0x to 3.9x | 0 (0.0%) | 0 (0.0%) |
| 4.0x or more | 0 (0.0%) | 0 (0.0%) |
| Total | 16 (100.0%) | 35 (100.0%) |
Real Estate Taxes by Mortgage Status in Gilson
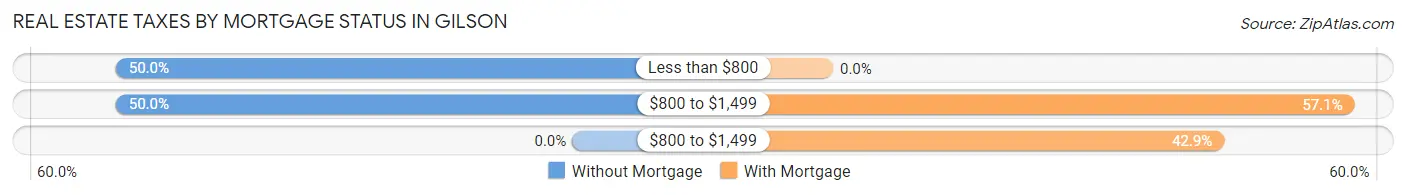
| Property Taxes | Without Mortgage | With Mortgage |
| Less than $800 | 8 (50.0%) | 0 (0.0%) |
| $800 to $1,499 | 8 (50.0%) | 20 (57.1%) |
| $800 to $1,499 | 0 (0.0%) | 15 (42.9%) |
| Total | 16 (100.0%) | 35 (100.0%) |
Health & Disability in Gilson
Health Insurance Coverage by Age in Gilson
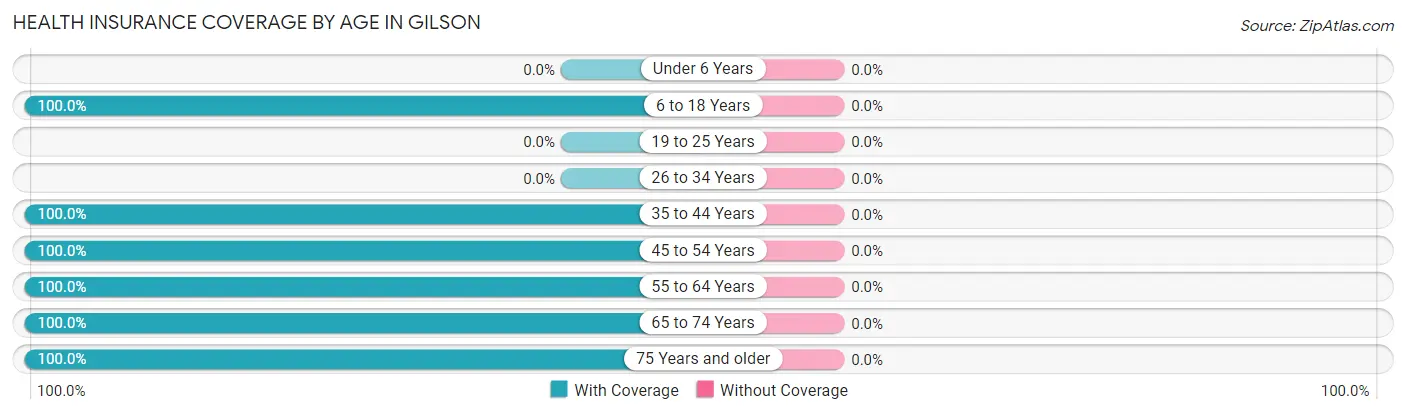
| Age Bracket | With Coverage | Without Coverage |
| Under 6 Years | 0 (0.0%) | 0 (0.0%) |
| 6 to 18 Years | 18 (100.0%) | 0 (0.0%) |
| 19 to 25 Years | 0 (0.0%) | 0 (0.0%) |
| 26 to 34 Years | 0 (0.0%) | 0 (0.0%) |
| 35 to 44 Years | 19 (100.0%) | 0 (0.0%) |
| 45 to 54 Years | 12 (100.0%) | 0 (0.0%) |
| 55 to 64 Years | 30 (100.0%) | 0 (0.0%) |
| 65 to 74 Years | 34 (100.0%) | 0 (0.0%) |
| 75 Years and older | 8 (100.0%) | 0 (0.0%) |
| Total | 121 (100.0%) | 0 (0.0%) |
Health Insurance Coverage by Citizenship Status in Gilson
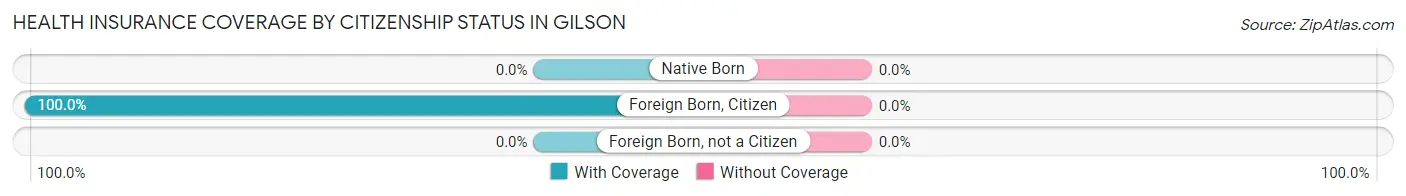
| Citizenship Status | With Coverage | Without Coverage |
| Native Born | 0 (0.0%) | 0 (0.0%) |
| Foreign Born, Citizen | 18 (100.0%) | 0 (0.0%) |
| Foreign Born, not a Citizen | 0 (0.0%) | 0 (0.0%) |
Health Insurance Coverage by Household Income in Gilson
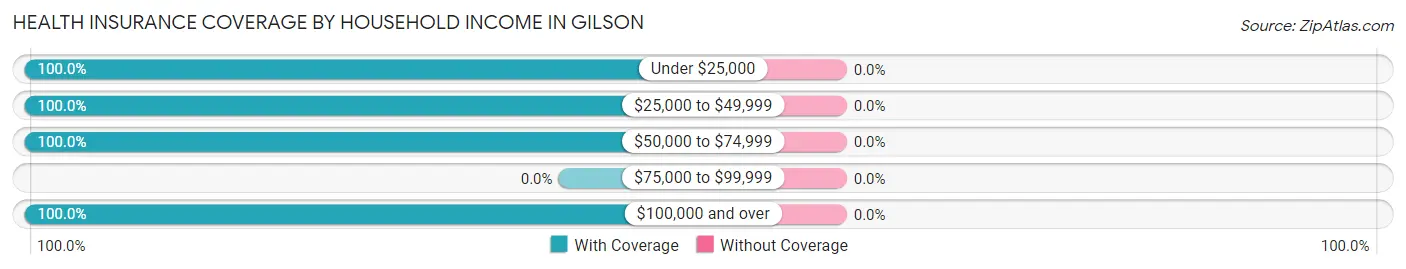
| Household Income | With Coverage | Without Coverage |
| Under $25,000 | 17 (100.0%) | 0 (0.0%) |
| $25,000 to $49,999 | 25 (100.0%) | 0 (0.0%) |
| $50,000 to $74,999 | 21 (100.0%) | 0 (0.0%) |
| $75,000 to $99,999 | 0 (0.0%) | 0 (0.0%) |
| $100,000 and over | 58 (100.0%) | 0 (0.0%) |
Public vs Private Health Insurance Coverage by Age in Gilson
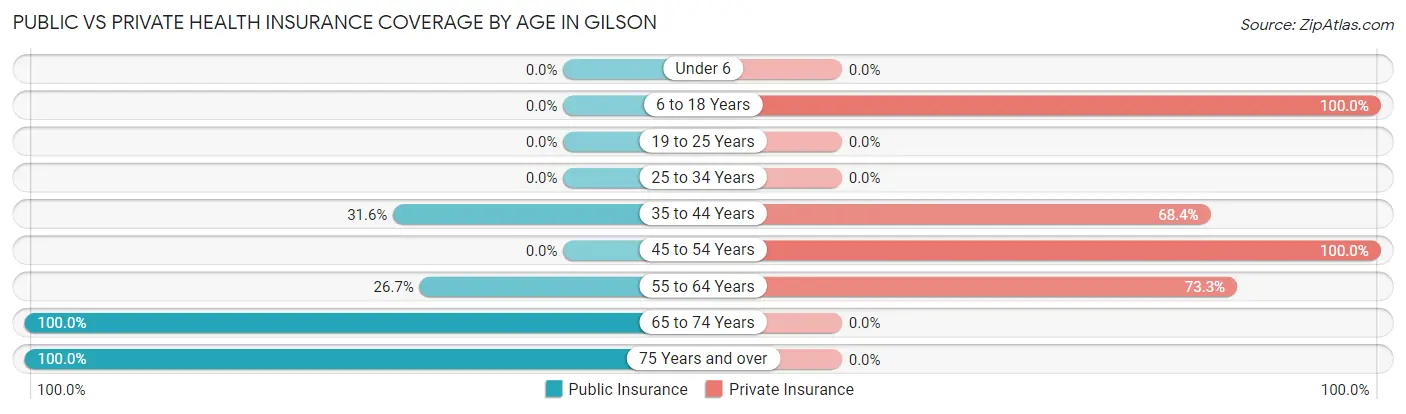
| Age Bracket | Public Insurance | Private Insurance |
| Under 6 | 0 (0.0%) | 0 (0.0%) |
| 6 to 18 Years | 0 (0.0%) | 18 (100.0%) |
| 19 to 25 Years | 0 (0.0%) | 0 (0.0%) |
| 25 to 34 Years | 0 (0.0%) | 0 (0.0%) |
| 35 to 44 Years | 6 (31.6%) | 13 (68.4%) |
| 45 to 54 Years | 0 (0.0%) | 12 (100.0%) |
| 55 to 64 Years | 8 (26.7%) | 22 (73.3%) |
| 65 to 74 Years | 34 (100.0%) | 0 (0.0%) |
| 75 Years and over | 8 (100.0%) | 0 (0.0%) |
| Total | 56 (46.3%) | 65 (53.7%) |
Disability Status by Sex by Age in Gilson
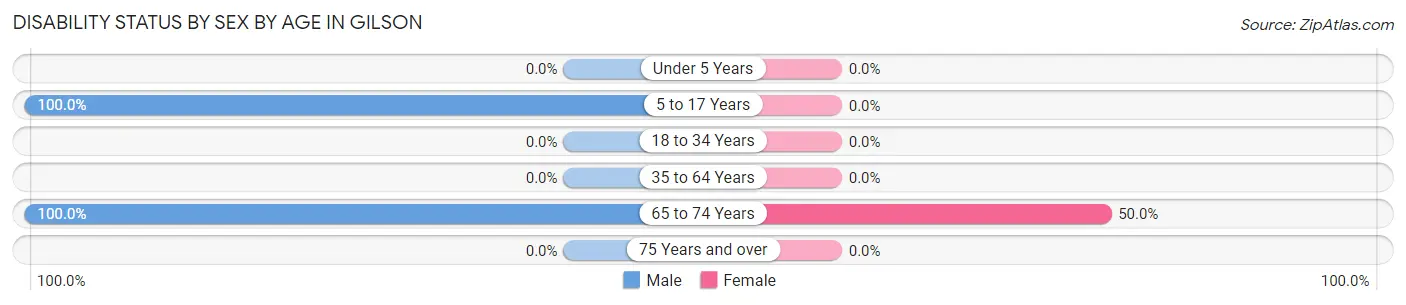
| Age Bracket | Male | Female |
| Under 5 Years | 0 (0.0%) | 0 (0.0%) |
| 5 to 17 Years | 4 (100.0%) | 0 (0.0%) |
| 18 to 34 Years | 0 (0.0%) | 0 (0.0%) |
| 35 to 64 Years | 0 (0.0%) | 0 (0.0%) |
| 65 to 74 Years | 18 (100.0%) | 8 (50.0%) |
| 75 Years and over | 0 (0.0%) | 0 (0.0%) |
Disability Class by Sex by Age in Gilson
Disability Class: Hearing Difficulty
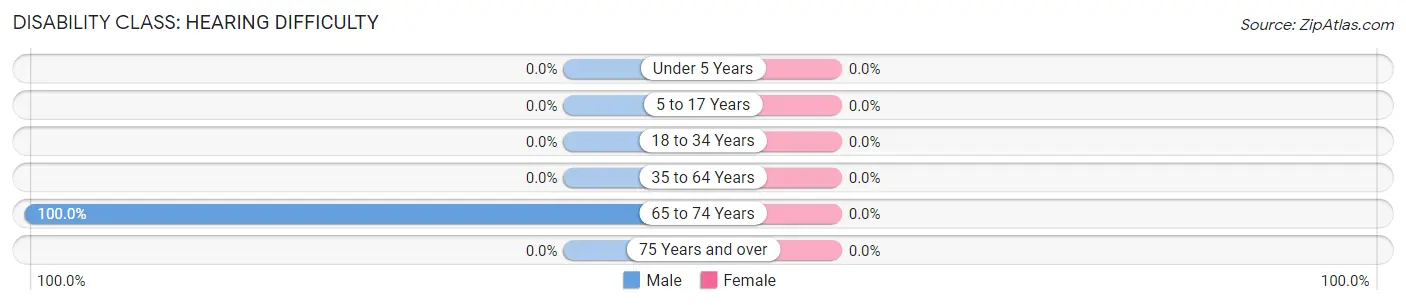
| Age Bracket | Male | Female |
| Under 5 Years | 0 (0.0%) | 0 (0.0%) |
| 5 to 17 Years | 0 (0.0%) | 0 (0.0%) |
| 18 to 34 Years | 0 (0.0%) | 0 (0.0%) |
| 35 to 64 Years | 0 (0.0%) | 0 (0.0%) |
| 65 to 74 Years | 18 (100.0%) | 0 (0.0%) |
| 75 Years and over | 0 (0.0%) | 0 (0.0%) |
Disability Class: Vision Difficulty
| Age Bracket | Male | Female |
| Under 5 Years | 0 (0.0%) | 0 (0.0%) |
| 5 to 17 Years | 0 (0.0%) | 0 (0.0%) |
| 18 to 34 Years | 0 (0.0%) | 0 (0.0%) |
| 35 to 64 Years | 0 (0.0%) | 0 (0.0%) |
| 65 to 74 Years | 0 (0.0%) | 0 (0.0%) |
| 75 Years and over | 0 (0.0%) | 0 (0.0%) |
Disability Class: Cognitive Difficulty
| Age Bracket | Male | Female |
| 5 to 17 Years | 0 (0.0%) | 0 (0.0%) |
| 18 to 34 Years | 0 (0.0%) | 0 (0.0%) |
| 35 to 64 Years | 0 (0.0%) | 0 (0.0%) |
| 65 to 74 Years | 0 (0.0%) | 0 (0.0%) |
| 75 Years and over | 0 (0.0%) | 0 (0.0%) |
Disability Class: Ambulatory Difficulty
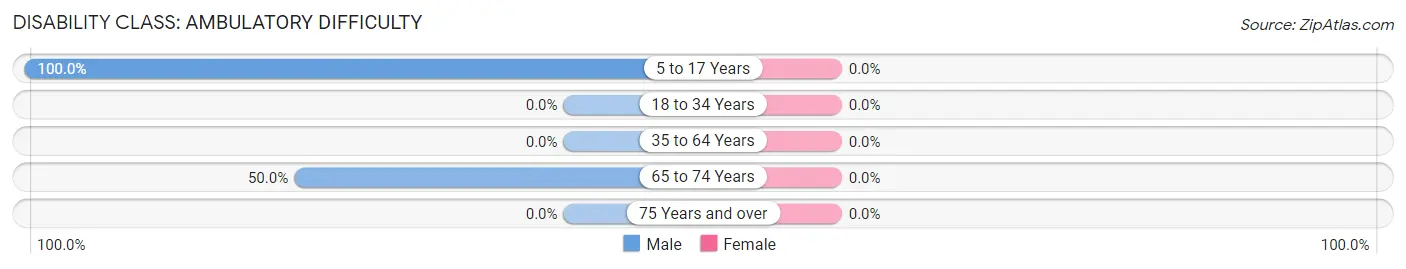
| Age Bracket | Male | Female |
| 5 to 17 Years | 4 (100.0%) | 0 (0.0%) |
| 18 to 34 Years | 0 (0.0%) | 0 (0.0%) |
| 35 to 64 Years | 0 (0.0%) | 0 (0.0%) |
| 65 to 74 Years | 9 (50.0%) | 0 (0.0%) |
| 75 Years and over | 0 (0.0%) | 0 (0.0%) |
Disability Class: Self-Care Difficulty
| Age Bracket | Male | Female |
| 5 to 17 Years | 0 (0.0%) | 0 (0.0%) |
| 18 to 34 Years | 0 (0.0%) | 0 (0.0%) |
| 35 to 64 Years | 0 (0.0%) | 0 (0.0%) |
| 65 to 74 Years | 0 (0.0%) | 0 (0.0%) |
| 75 Years and over | 0 (0.0%) | 0 (0.0%) |
Technology Access in Gilson
Computing Device Access in Gilson
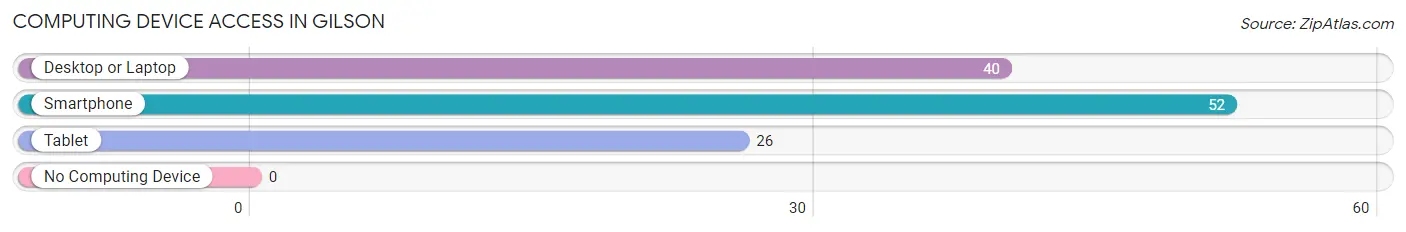
| Device Type | # Households | % Households |
| Desktop or Laptop | 40 | 66.7% |
| Smartphone | 52 | 86.7% |
| Tablet | 26 | 43.3% |
| No Computing Device | 0 | 0.0% |
| Total | 60 | 100.0% |
Internet Access in Gilson
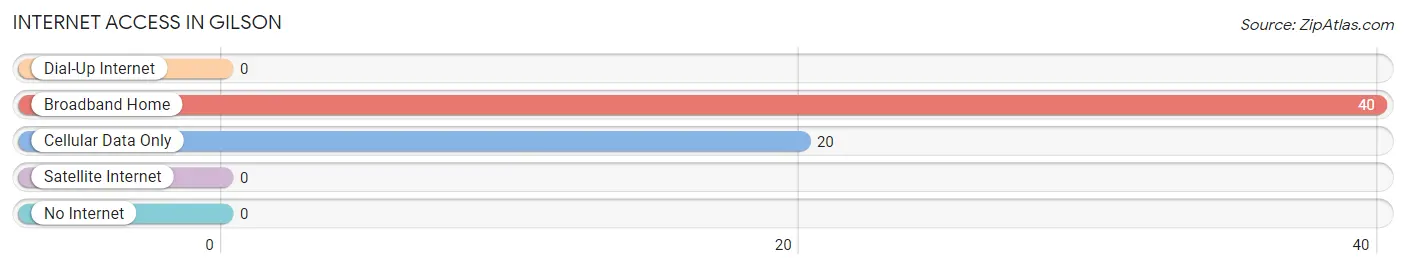
| Internet Type | # Households | % Households |
| Dial-Up Internet | 0 | 0.0% |
| Broadband Home | 40 | 66.7% |
| Cellular Data Only | 20 | 33.3% |
| Satellite Internet | 0 | 0.0% |
| No Internet | 0 | 0.0% |
| Total | 60 | 100.0% |
Gilson Summary
Gilson, Illinois is a small village located in Knox County, Illinois. It is situated on the banks of the Spoon River, approximately 10 miles south of Galesburg. The population of Gilson was estimated to be 545 in the year 2000.
History
The area that is now Gilson was first settled in 1835 by a group of settlers from New York. The village was originally known as “Spoon River”, but was later renamed “Gilson” in honor of the first settler, John Gilson. The village was officially incorporated in 1867.
In the late 19th century, Gilson was a thriving agricultural community. The village was home to several grain elevators, a flour mill, a sawmill, and a brickyard. The village also had a post office, a bank, a hotel, and several stores.
Geography
Gilson is located in the western part of Knox County, Illinois. It is situated on the banks of the Spoon River, approximately 10 miles south of Galesburg. The village is surrounded by rolling hills and farmland. The climate in Gilson is generally mild, with hot summers and cold winters.
Economy
The economy of Gilson is largely based on agriculture. The village is home to several grain elevators, a flour mill, and a sawmill. The village also has a post office, a bank, a hotel, and several stores.
Demographics
As of the 2000 census, the population of Gilson was 545. The racial makeup of the village was 97.3% White, 0.2% African American, 0.2% Native American, 0.2% Asian, 0.4% from other races, and 1.7% from two or more races. Hispanic or Latino of any race were 1.3% of the population.
The median income for a household in Gilson was $37,500, and the median income for a family was $45,000. The per capita income for the village was $17,845. About 8.3% of families and 10.2% of the population were below the poverty line, including 11.3% of those under age 18 and 8.3% of those age 65 or over.
Conclusion
Gilson, Illinois is a small village located in Knox County, Illinois. It is situated on the banks of the Spoon River, approximately 10 miles south of Galesburg. The population of Gilson was estimated to be 545 in the year 2000. The village has a long history of agriculture and is home to several grain elevators, a flour mill, a sawmill, and a brickyard. The economy of Gilson is largely based on agriculture, and the village has a post office, a bank, a hotel, and several stores. The racial makeup of the village is predominantly White, with a small percentage of African American, Native American, and Asian residents. The median income for a household in Gilson was $37,500, and the median income for a family was $45,000.
Common Questions
What is Per Capita Income in Gilson?
Per Capita income in Gilson is $30,229.
What is the Median Family Income in Gilson?
Median Family Income in Gilson is $68,333.
What is the Median Household income in Gilson?
Median Household Income in Gilson is $64,063.
What is Income or Wage Gap in Gilson?
Income or Wage Gap in Gilson is 25.7%.
Women in Gilson earn 74.3 cents for every dollar earned by a man.
What is Inequality or Gini Index in Gilson?
Inequality or Gini Index in Gilson is 0.36.
What is the Total Population of Gilson?
Total Population of Gilson is 121.
What is the Total Male Population of Gilson?
Total Male Population of Gilson is 53.
What is the Total Female Population of Gilson?
Total Female Population of Gilson is 68.
What is the Ratio of Males per 100 Females in Gilson?
There are 77.94 Males per 100 Females in Gilson.
What is the Ratio of Females per 100 Males in Gilson?
There are 128.30 Females per 100 Males in Gilson.
What is the Median Population Age in Gilson?
Median Population Age in Gilson is 58.9 Years.
What is the Average Family Size in Gilson
Average Family Size in Gilson is 2.2 People.
What is the Average Household Size in Gilson
Average Household Size in Gilson is 2.0 People.
How Large is the Labor Force in Gilson?
There are 69 People in the Labor Forcein in Gilson.
What is the Percentage of People in the Labor Force in Gilson?
62.2% of People are in the Labor Force in Gilson.