West Point, IL Map & Demographics
West Point Map
West Point Overview
$24,423
PER CAPITA INCOME
$83,750
AVG FAMILY INCOME
$73,750
AVG HOUSEHOLD INCOME
40.7%
WAGE / INCOME GAP [ % ]
59.3¢/ $1
WAGE / INCOME GAP [ $ ]
0.35
INEQUALITY / GINI INDEX
239
TOTAL POPULATION
114
MALE POPULATION
125
FEMALE POPULATION
91.20
MALES / 100 FEMALES
109.65
FEMALES / 100 MALES
35.5
MEDIAN AGE
4.2
AVG FAMILY SIZE
3.7
AVG HOUSEHOLD SIZE
90
LABOR FORCE [ PEOPLE ]
48.6%
PERCENT IN LABOR FORCE
West Point Zip Codes
West Point Area Codes
Income in West Point
Income Overview in West Point
Per Capita Income in West Point is $24,423, while median incomes of families and households are $83,750 and $73,750 respectively.
| Characteristic | Number | Measure |
| Per Capita Income | 239 | $24,423 |
| Median Family Income | 52 | $83,750 |
| Mean Family Income | 52 | $78,135 |
| Median Household Income | 64 | $73,750 |
| Mean Household Income | 64 | $68,641 |
| Income Deficit | 52 | $0 |
| Wage / Income Gap (%) | 239 | 40.66% |
| Wage / Income Gap ($) | 239 | 59.34¢ per $1 |
| Gini / Inequality Index | 239 | 0.35 |
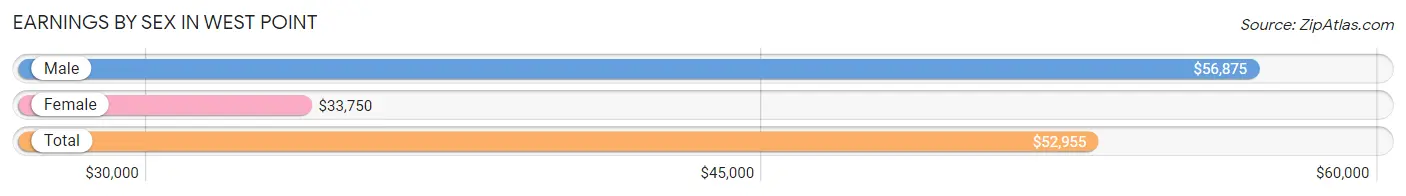
Earnings by Sex in West Point
Average Earnings in West Point are $52,955, $56,875 for men and $33,750 for women, a difference of 40.7%.
| Sex | Number | Average Earnings |
| Male | 58 (63.0%) | $56,875 |
| Female | 34 (37.0%) | $33,750 |
| Total | 92 (100.0%) | $52,955 |
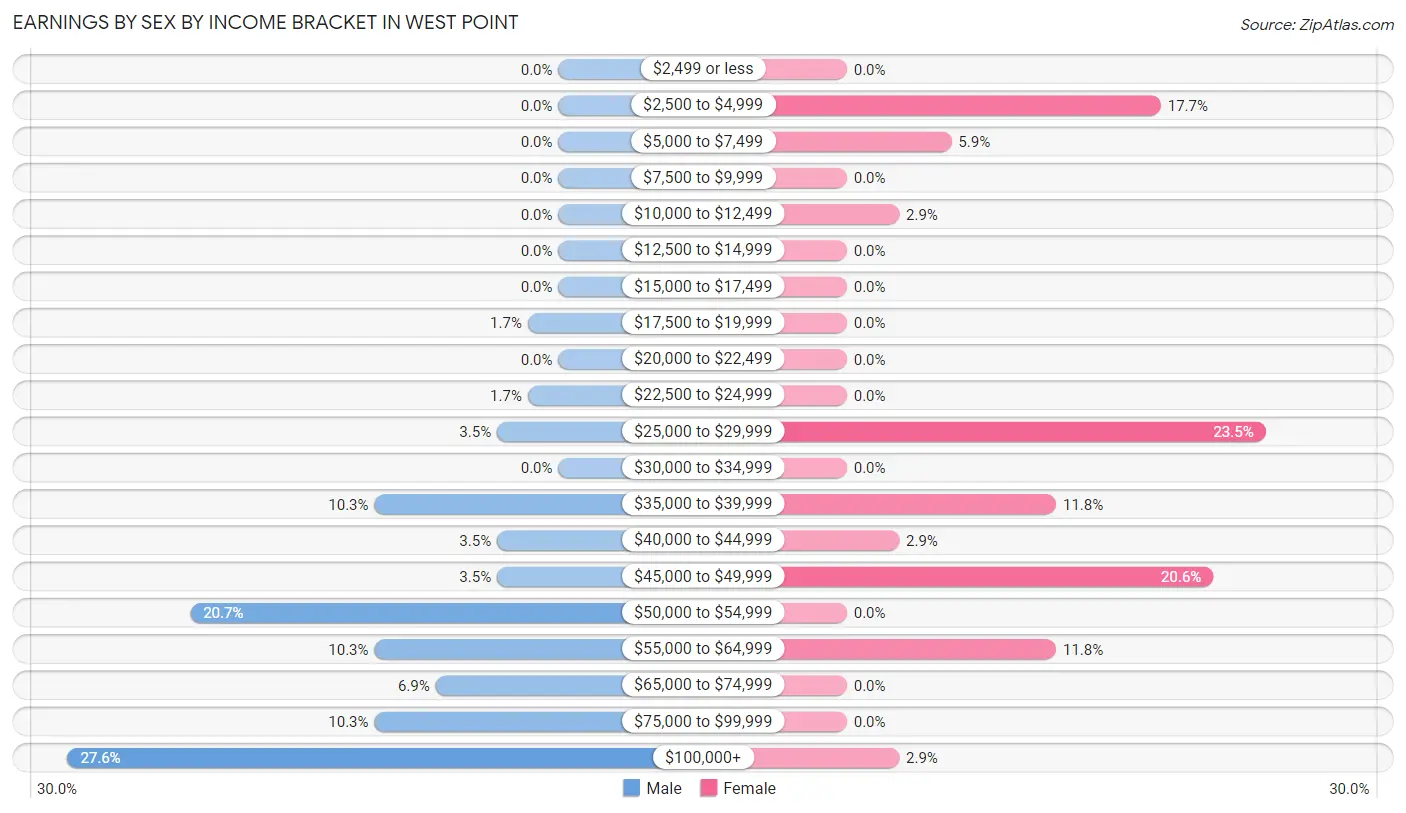
Earnings by Sex by Income Bracket in West Point
The most common earnings brackets in West Point are $100,000+ for men (16 | 27.6%) and $25,000 to $29,999 for women (8 | 23.5%).
| Income | Male | Female |
| $2,499 or less | 0 (0.0%) | 0 (0.0%) |
| $2,500 to $4,999 | 0 (0.0%) | 6 (17.6%) |
| $5,000 to $7,499 | 0 (0.0%) | 2 (5.9%) |
| $7,500 to $9,999 | 0 (0.0%) | 0 (0.0%) |
| $10,000 to $12,499 | 0 (0.0%) | 1 (2.9%) |
| $12,500 to $14,999 | 0 (0.0%) | 0 (0.0%) |
| $15,000 to $17,499 | 0 (0.0%) | 0 (0.0%) |
| $17,500 to $19,999 | 1 (1.7%) | 0 (0.0%) |
| $20,000 to $22,499 | 0 (0.0%) | 0 (0.0%) |
| $22,500 to $24,999 | 1 (1.7%) | 0 (0.0%) |
| $25,000 to $29,999 | 2 (3.5%) | 8 (23.5%) |
| $30,000 to $34,999 | 0 (0.0%) | 0 (0.0%) |
| $35,000 to $39,999 | 6 (10.3%) | 4 (11.8%) |
| $40,000 to $44,999 | 2 (3.5%) | 1 (2.9%) |
| $45,000 to $49,999 | 2 (3.5%) | 7 (20.6%) |
| $50,000 to $54,999 | 12 (20.7%) | 0 (0.0%) |
| $55,000 to $64,999 | 6 (10.3%) | 4 (11.8%) |
| $65,000 to $74,999 | 4 (6.9%) | 0 (0.0%) |
| $75,000 to $99,999 | 6 (10.3%) | 0 (0.0%) |
| $100,000+ | 16 (27.6%) | 1 (2.9%) |
| Total | 58 (100.0%) | 34 (100.0%) |
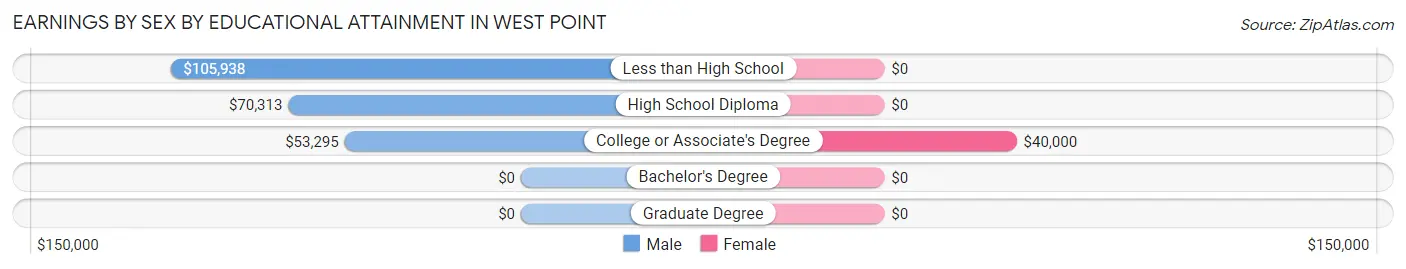
Earnings by Sex by Educational Attainment in West Point
Average earnings in West Point are $61,250 for men and $33,750 for women, a difference of 44.9%. Men with an educational attainment of less than high school enjoy the highest average annual earnings of $105,938, while those with college or associate's degree education earn the least with $53,295. Women with an educational attainment of college or associate's degree earn the most with the average annual earnings of $40,000, while those with college or associate's degree education have the smallest earnings of $40,000.
| Educational Attainment | Male Income | Female Income |
| Less than High School | $105,938 | $0 |
| High School Diploma | $70,313 | $0 |
| College or Associate's Degree | $53,295 | $40,000 |
| Bachelor's Degree | - | - |
| Graduate Degree | - | - |
| Total | $61,250 | $33,750 |
Family Income in West Point
Family Income Brackets in West Point
According to the West Point family income data, there are 16 families falling into the $100,000 to $149,999 income range, which is the most common income bracket and makes up 30.8% of all families.
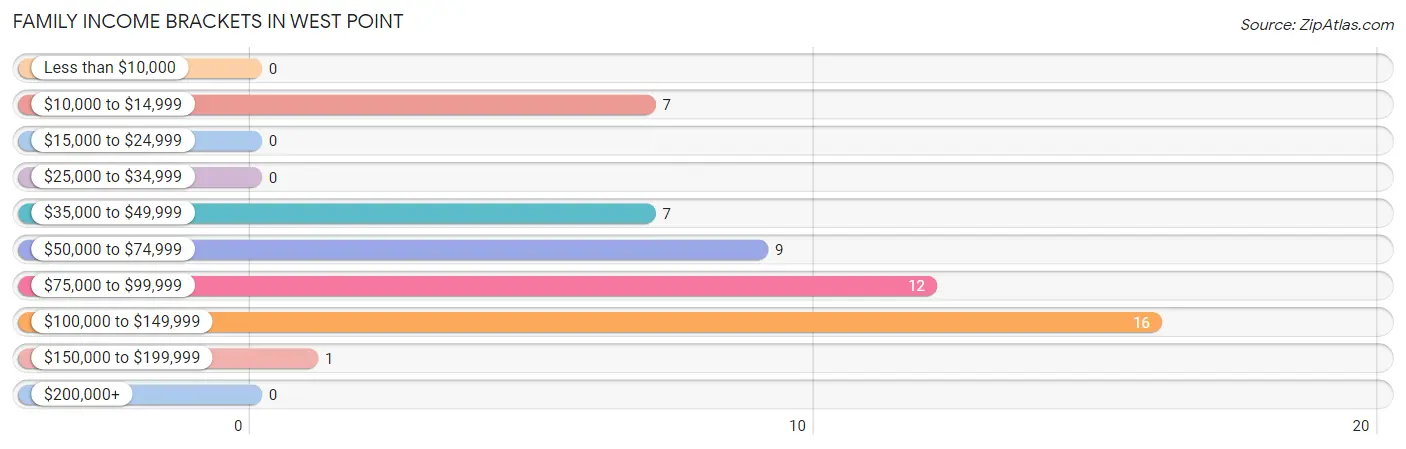
| Income Bracket | # Families | % Families |
| Less than $10,000 | 0 | 0.0% |
| $10,000 to $14,999 | 7 | 13.5% |
| $15,000 to $24,999 | 0 | 0.0% |
| $25,000 to $34,999 | 0 | 0.0% |
| $35,000 to $49,999 | 7 | 13.5% |
| $50,000 to $74,999 | 9 | 17.3% |
| $75,000 to $99,999 | 12 | 23.1% |
| $100,000 to $149,999 | 16 | 30.8% |
| $150,000 to $199,999 | 1 | 1.9% |
| $200,000+ | 0 | 0.0% |
Family Income by Famaliy Size in West Point
2-person families (30 | 57.7%) account for the highest median family income in West Point with $71,250 per family, while 2-person families (30 | 57.7%) have the highest median income of $35,625 per family member.
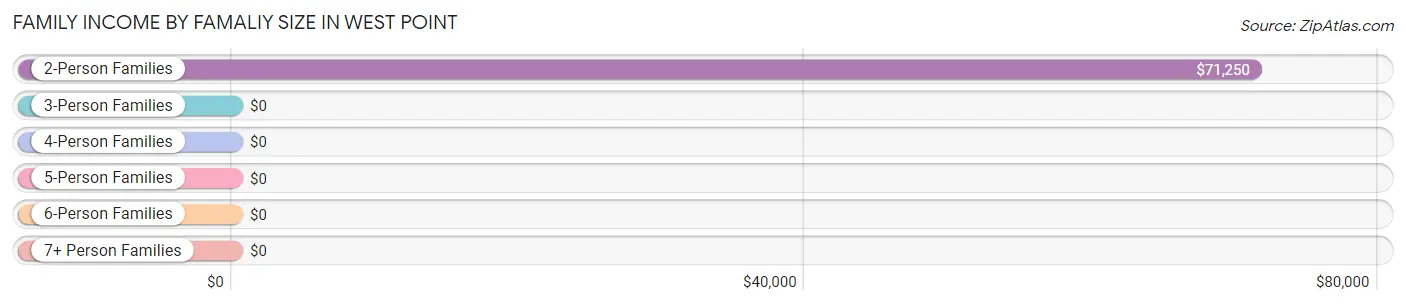
| Income Bracket | # Families | Median Income |
| 2-Person Families | 30 (57.7%) | $71,250 |
| 3-Person Families | 0 (0.0%) | $0 |
| 4-Person Families | 6 (11.5%) | $0 |
| 5-Person Families | 11 (21.1%) | $0 |
| 6-Person Families | 1 (1.9%) | $0 |
| 7+ Person Families | 4 (7.7%) | $0 |
| Total | 52 (100.0%) | $83,750 |
Family Income by Number of Earners in West Point
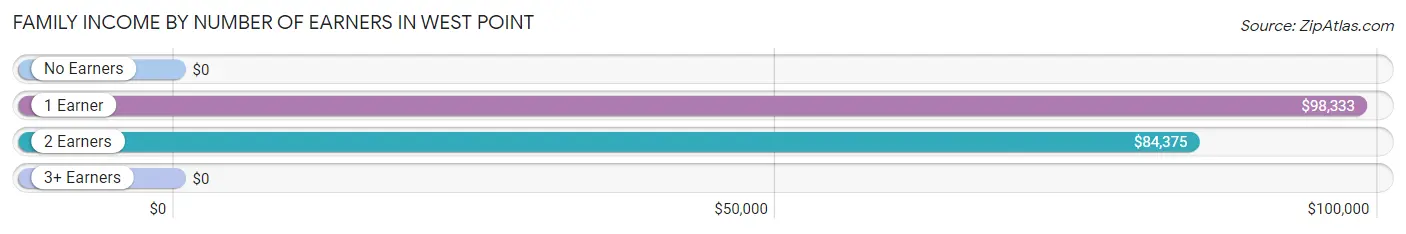
| Number of Earners | # Families | Median Income |
| No Earners | 10 (19.2%) | $0 |
| 1 Earner | 18 (34.6%) | $98,333 |
| 2 Earners | 19 (36.5%) | $84,375 |
| 3+ Earners | 5 (9.6%) | $0 |
| Total | 52 (100.0%) | $83,750 |
Household Income in West Point
Household Income Brackets in West Point
With 16 households falling in the category, the $100,000 to $149,999 income range is the most frequent in West Point, accounting for 25.0% of all households.
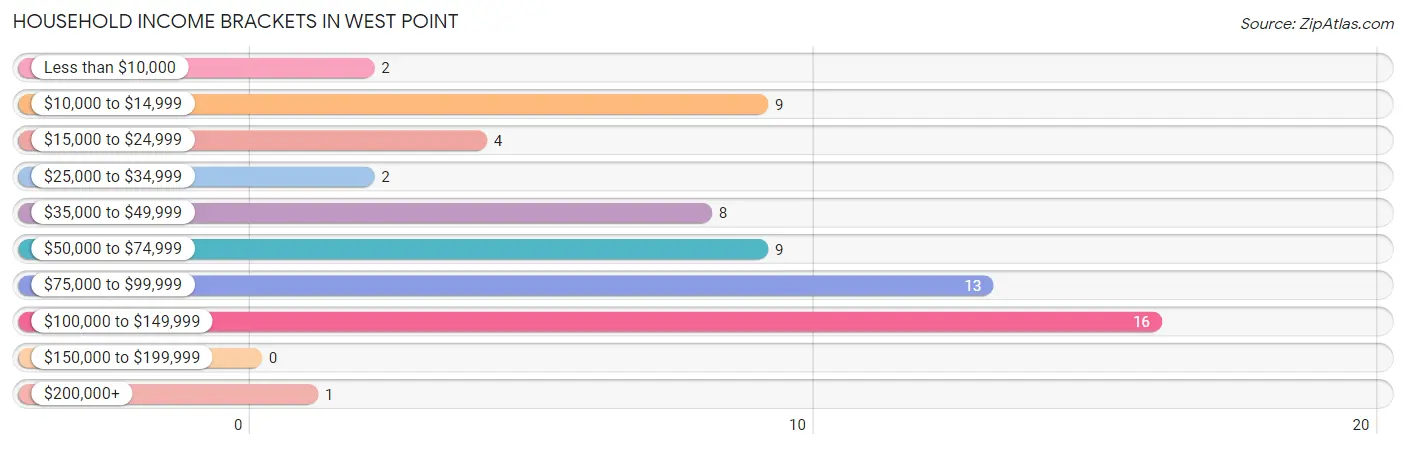
| Income Bracket | # Households | % Households |
| Less than $10,000 | 2 | 3.1% |
| $10,000 to $14,999 | 9 | 14.1% |
| $15,000 to $24,999 | 4 | 6.3% |
| $25,000 to $34,999 | 2 | 3.1% |
| $35,000 to $49,999 | 8 | 12.5% |
| $50,000 to $74,999 | 9 | 14.1% |
| $75,000 to $99,999 | 13 | 20.3% |
| $100,000 to $149,999 | 16 | 25.0% |
| $150,000 to $199,999 | 0 | 0.0% |
| $200,000+ | 1 | 1.6% |
Household Income by Householder Age in West Point
The median household income in West Point is $73,750, with the highest median household income of $88,750 found in the 45 to 64 years age bracket for the primary householder. A total of 27 households (42.2%) fall into this category. Meanwhile, the 15 to 24 years age bracket for the primary householder has the lowest median household income of $0, with 4 households (6.2%) in this group.
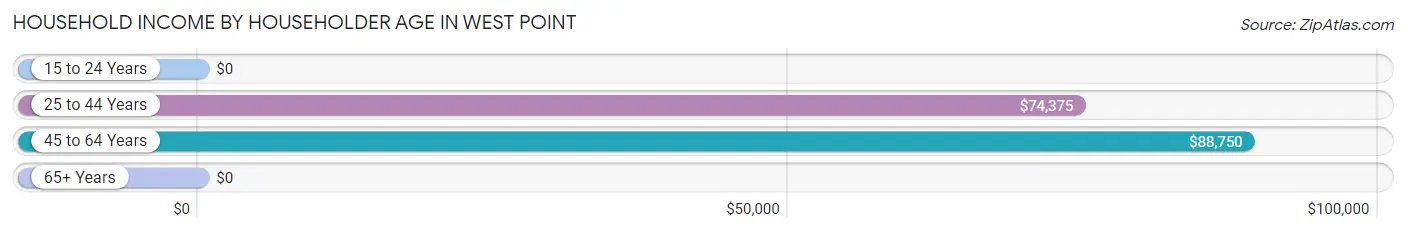
| Income Bracket | # Households | Median Income |
| 15 to 24 Years | 4 (6.2%) | $0 |
| 25 to 44 Years | 16 (25.0%) | $74,375 |
| 45 to 64 Years | 27 (42.2%) | $88,750 |
| 65+ Years | 17 (26.6%) | $0 |
| Total | 64 (100.0%) | $73,750 |
Poverty in West Point
Income Below Poverty by Sex and Age in West Point
With 11.4% poverty level for males and 8.0% for females among the residents of West Point, 45 to 54 year old males and 25 to 34 year old females are the most vulnerable to poverty, with 2 males (66.7%) and 5 females (71.4%) in their respective age groups living below the poverty level.
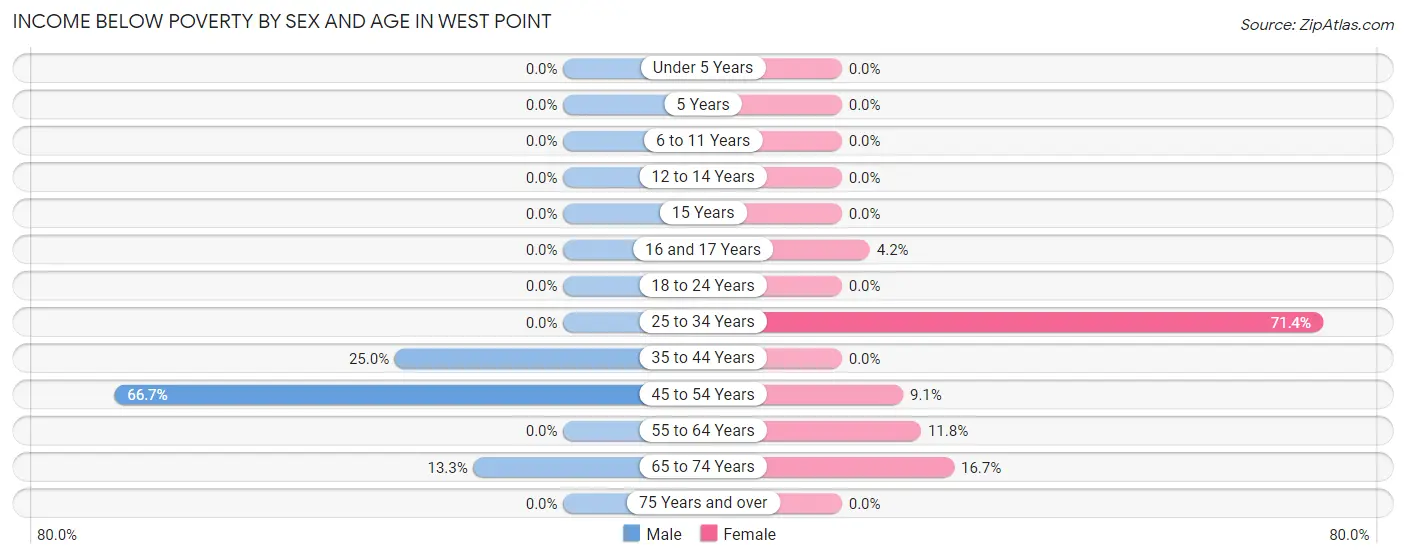
| Age Bracket | Male | Female |
| Under 5 Years | 0 (0.0%) | 0 (0.0%) |
| 5 Years | 0 (0.0%) | 0 (0.0%) |
| 6 to 11 Years | 0 (0.0%) | 0 (0.0%) |
| 12 to 14 Years | 0 (0.0%) | 0 (0.0%) |
| 15 Years | 0 (0.0%) | 0 (0.0%) |
| 16 and 17 Years | 0 (0.0%) | 1 (4.2%) |
| 18 to 24 Years | 0 (0.0%) | 0 (0.0%) |
| 25 to 34 Years | 0 (0.0%) | 5 (71.4%) |
| 35 to 44 Years | 9 (25.0%) | 0 (0.0%) |
| 45 to 54 Years | 2 (66.7%) | 1 (9.1%) |
| 55 to 64 Years | 0 (0.0%) | 2 (11.8%) |
| 65 to 74 Years | 2 (13.3%) | 1 (16.7%) |
| 75 Years and over | 0 (0.0%) | 0 (0.0%) |
| Total | 13 (11.4%) | 10 (8.0%) |
Income Above Poverty by Sex and Age in West Point
According to the poverty statistics in West Point, males aged under 5 years and females aged under 5 years are the age groups that are most secure financially, with 100.0% of males and 100.0% of females in these age groups living above the poverty line.
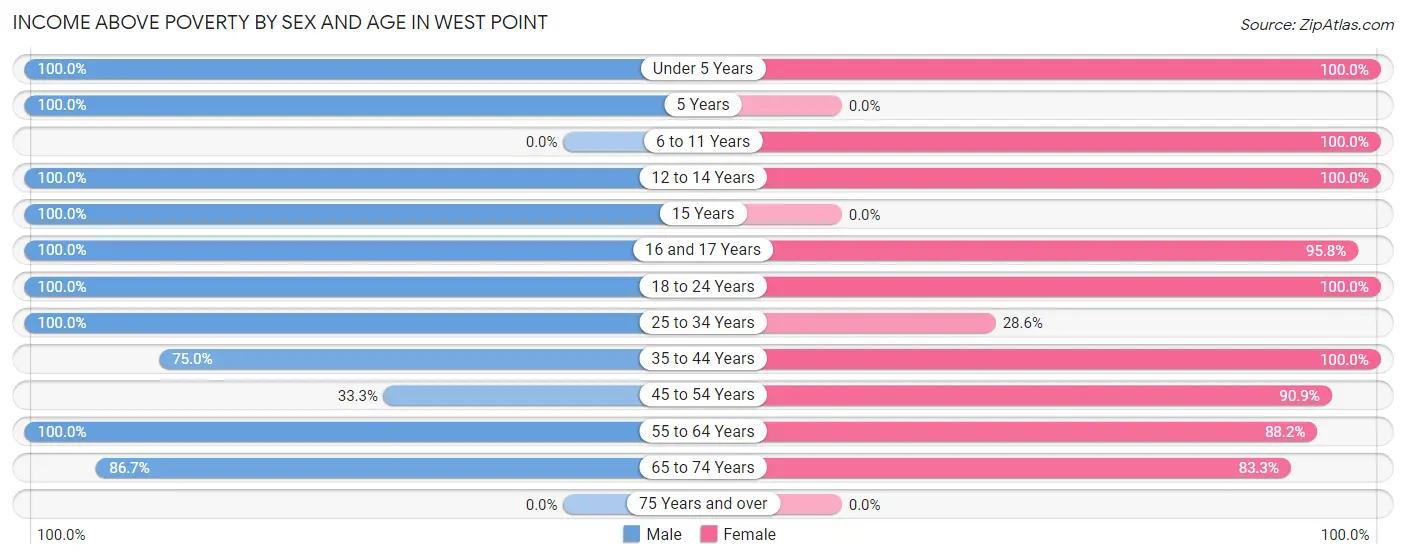
| Age Bracket | Male | Female |
| Under 5 Years | 9 (100.0%) | 5 (100.0%) |
| 5 Years | 2 (100.0%) | 0 (0.0%) |
| 6 to 11 Years | 0 (0.0%) | 4 (100.0%) |
| 12 to 14 Years | 10 (100.0%) | 20 (100.0%) |
| 15 Years | 4 (100.0%) | 0 (0.0%) |
| 16 and 17 Years | 4 (100.0%) | 23 (95.8%) |
| 18 to 24 Years | 4 (100.0%) | 9 (100.0%) |
| 25 to 34 Years | 8 (100.0%) | 2 (28.6%) |
| 35 to 44 Years | 27 (75.0%) | 22 (100.0%) |
| 45 to 54 Years | 1 (33.3%) | 10 (90.9%) |
| 55 to 64 Years | 19 (100.0%) | 15 (88.2%) |
| 65 to 74 Years | 13 (86.7%) | 5 (83.3%) |
| 75 Years and over | 0 (0.0%) | 0 (0.0%) |
| Total | 101 (88.6%) | 115 (92.0%) |
Income Below Poverty Among Married-Couple Families in West Point
The poverty statistics for married-couple families in West Point show that 5.1% or 2 of the total 39 families live below the poverty line. Families with no children have the highest poverty rate of 8.3%, comprising of 2 families. On the other hand, families with 1 or 2 children have the lowest poverty rate of 0.0%, which includes 0 families.
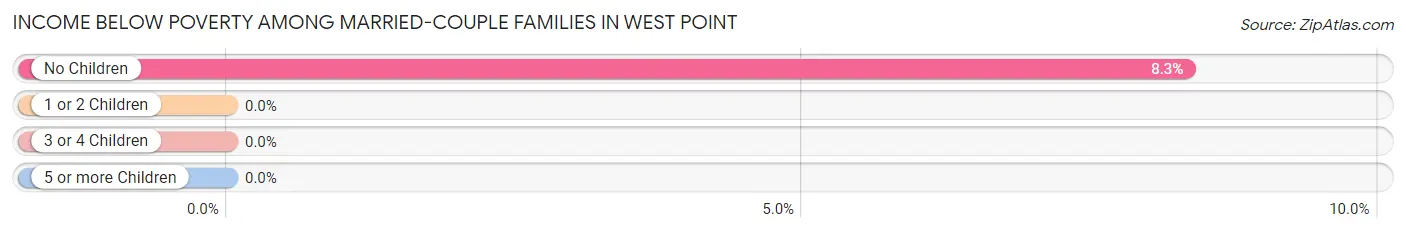
| Children | Above Poverty | Below Poverty |
| No Children | 22 (91.7%) | 2 (8.3%) |
| 1 or 2 Children | 11 (100.0%) | 0 (0.0%) |
| 3 or 4 Children | 0 (0.0%) | 0 (0.0%) |
| 5 or more Children | 4 (100.0%) | 0 (0.0%) |
| Total | 37 (94.9%) | 2 (5.1%) |
Income Below Poverty Among Single-Parent Households in West Point
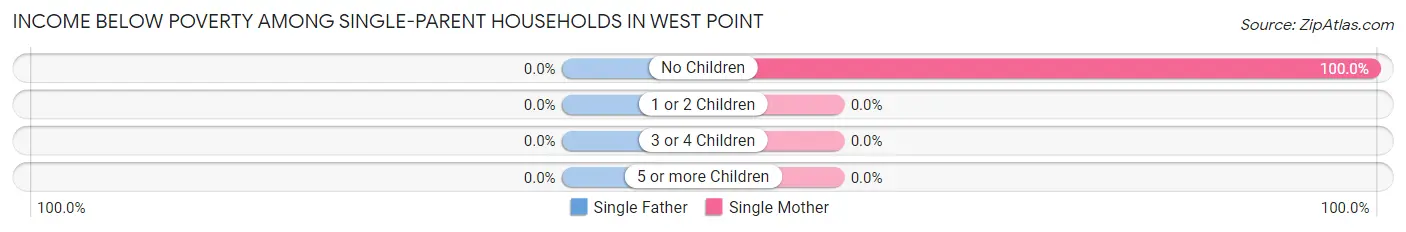
| Children | Single Father | Single Mother |
| No Children | 0 (0.0%) | 5 (100.0%) |
| 1 or 2 Children | 0 (0.0%) | 0 (0.0%) |
| 3 or 4 Children | 0 (0.0%) | 0 (0.0%) |
| 5 or more Children | 0 (0.0%) | 0 (0.0%) |
| Total | 0 (0.0%) | 5 (100.0%) |
Income Below Poverty Among Married-Couple vs Single-Parent Households in West Point
The poverty data for West Point shows that 2 of the married-couple family households (5.1%) and 5 of the single-parent households (38.5%) are living below the poverty level. Within the married-couple family households, those with no children have the highest poverty rate, with 2 households (8.3%) falling below the poverty line. Among the single-parent households, those with no children have the highest poverty rate, with 5 household (83.3%) living below poverty.
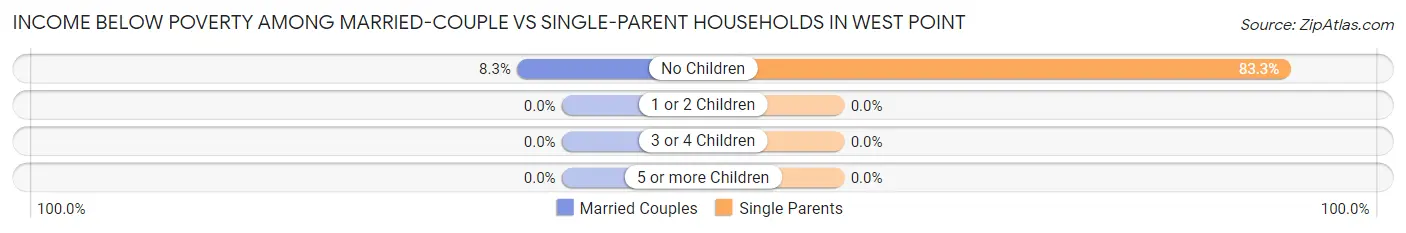
| Children | Married-Couple Families | Single-Parent Households |
| No Children | 2 (8.3%) | 5 (83.3%) |
| 1 or 2 Children | 0 (0.0%) | 0 (0.0%) |
| 3 or 4 Children | 0 (0.0%) | 0 (0.0%) |
| 5 or more Children | 0 (0.0%) | 0 (0.0%) |
| Total | 2 (5.1%) | 5 (38.5%) |
Race in West Point
The most populous races in West Point are White / Caucasian (237 | 99.2%), and Asian (2 | 0.8%).
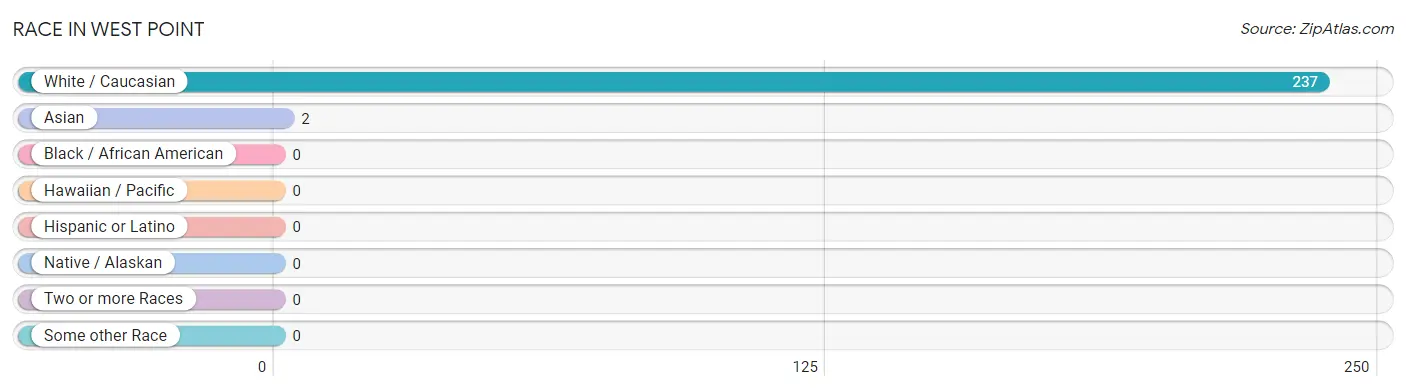
| Race | # Population | % Population |
| Asian | 2 | 0.8% |
| Black / African American | 0 | 0.0% |
| Hawaiian / Pacific | 0 | 0.0% |
| Hispanic or Latino | 0 | 0.0% |
| Native / Alaskan | 0 | 0.0% |
| White / Caucasian | 237 | 99.2% |
| Two or more Races | 0 | 0.0% |
| Some other Race | 0 | 0.0% |
| Total | 239 | 100.0% |
Ancestry in West Point
The most populous ancestries reported in West Point are German (51 | 21.3%), Irish (23 | 9.6%), English (15 | 6.3%), American (10 | 4.2%), and Italian (5 | 2.1%), together accounting for 43.5% of all West Point residents.
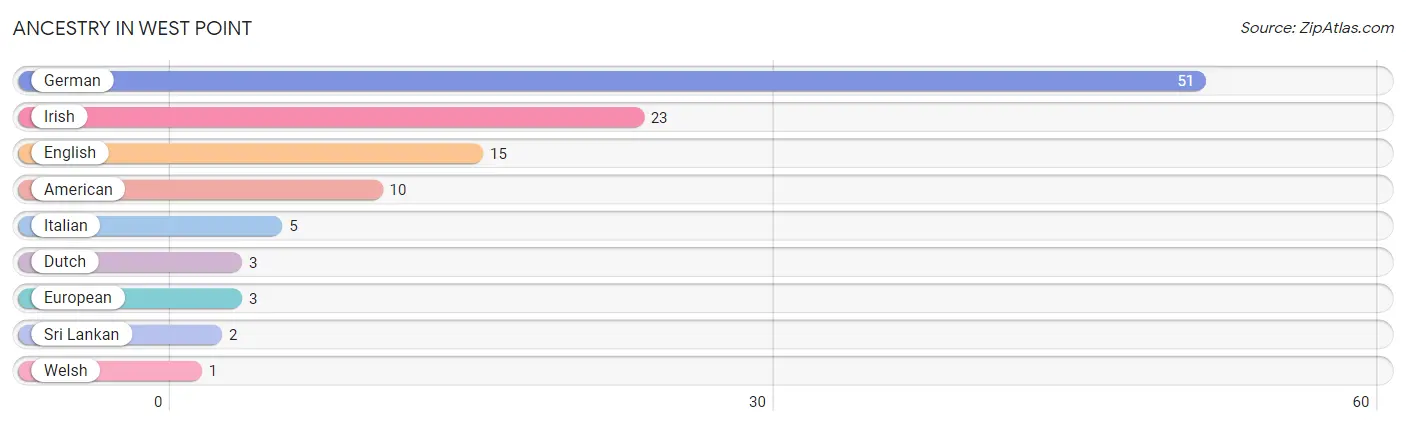
| Ancestry | # Population | % Population |
| American | 10 | 4.2% |
| Dutch | 3 | 1.3% |
| English | 15 | 6.3% |
| European | 3 | 1.3% |
| German | 51 | 21.3% |
| Irish | 23 | 9.6% |
| Italian | 5 | 2.1% |
| Sri Lankan | 2 | 0.8% |
| Welsh | 1 | 0.4% | View All 9 Rows |
Immigrants in West Point
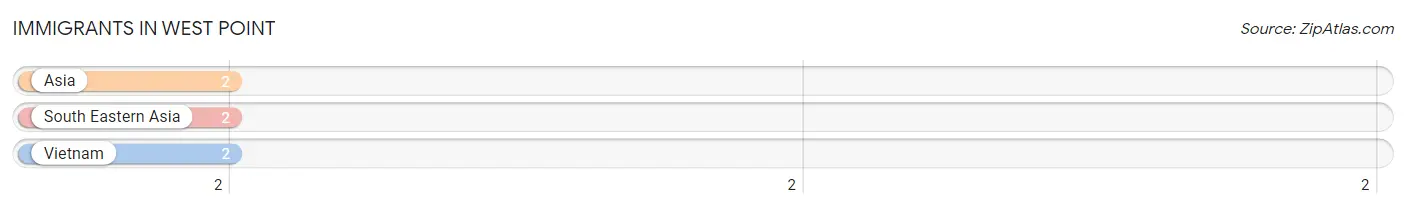
The most numerous immigrant groups reported in West Point came from Asia (2 | 0.8%), South Eastern Asia (2 | 0.8%), and Vietnam (2 | 0.8%), together accounting for 2.5% of all West Point residents.
| Immigration Origin | # Population | % Population |
| Asia | 2 | 0.8% |
| South Eastern Asia | 2 | 0.8% |
| Vietnam | 2 | 0.8% | View All 3 Rows |
Sex and Age in West Point
Sex and Age in West Point
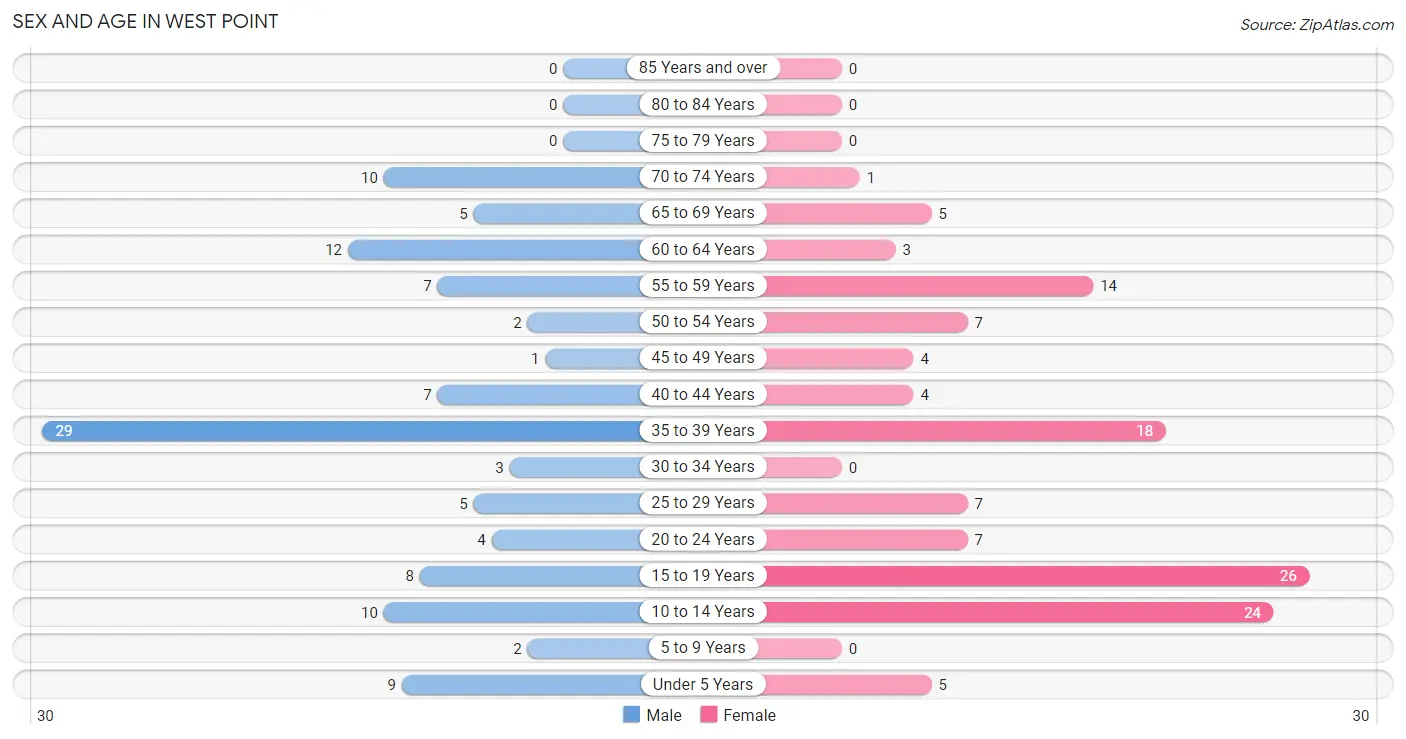
The most populous age groups in West Point are 35 to 39 Years (29 | 25.4%) for men and 15 to 19 Years (26 | 20.8%) for women.
| Age Bracket | Male | Female |
| Under 5 Years | 9 (7.9%) | 5 (4.0%) |
| 5 to 9 Years | 2 (1.8%) | 0 (0.0%) |
| 10 to 14 Years | 10 (8.8%) | 24 (19.2%) |
| 15 to 19 Years | 8 (7.0%) | 26 (20.8%) |
| 20 to 24 Years | 4 (3.5%) | 7 (5.6%) |
| 25 to 29 Years | 5 (4.4%) | 7 (5.6%) |
| 30 to 34 Years | 3 (2.6%) | 0 (0.0%) |
| 35 to 39 Years | 29 (25.4%) | 18 (14.4%) |
| 40 to 44 Years | 7 (6.1%) | 4 (3.2%) |
| 45 to 49 Years | 1 (0.9%) | 4 (3.2%) |
| 50 to 54 Years | 2 (1.8%) | 7 (5.6%) |
| 55 to 59 Years | 7 (6.1%) | 14 (11.2%) |
| 60 to 64 Years | 12 (10.5%) | 3 (2.4%) |
| 65 to 69 Years | 5 (4.4%) | 5 (4.0%) |
| 70 to 74 Years | 10 (8.8%) | 1 (0.8%) |
| 75 to 79 Years | 0 (0.0%) | 0 (0.0%) |
| 80 to 84 Years | 0 (0.0%) | 0 (0.0%) |
| 85 Years and over | 0 (0.0%) | 0 (0.0%) |
| Total | 114 (100.0%) | 125 (100.0%) |
Families and Households in West Point
Median Family Size in West Point
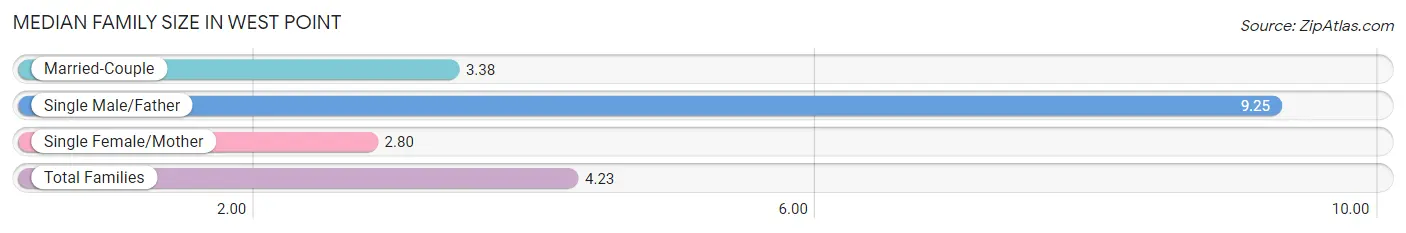
The median family size in West Point is 4.23 persons per family, with single male/father families (8 | 15.4%) accounting for the largest median family size of 9.25 persons per family. On the other hand, single female/mother families (5 | 9.6%) represent the smallest median family size with 2.80 persons per family.
| Family Type | # Families | Family Size |
| Married-Couple | 39 (75.0%) | 3.38 |
| Single Male/Father | 8 (15.4%) | 9.25 |
| Single Female/Mother | 5 (9.6%) | 2.80 |
| Total Families | 52 (100.0%) | 4.23 |
Median Household Size in West Point
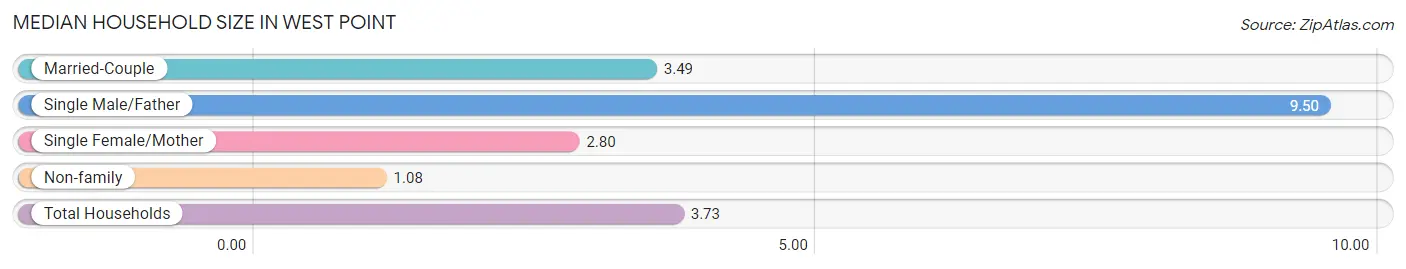
The median household size in West Point is 3.73 persons per household, with single male/father households (8 | 12.5%) accounting for the largest median household size of 9.5 persons per household. non-family households (12 | 18.8%) represent the smallest median household size with 1.08 persons per household.
| Household Type | # Households | Household Size |
| Married-Couple | 39 (60.9%) | 3.49 |
| Single Male/Father | 8 (12.5%) | 9.50 |
| Single Female/Mother | 5 (7.8%) | 2.80 |
| Non-family | 12 (18.8%) | 1.08 |
| Total Households | 64 (100.0%) | 3.73 |
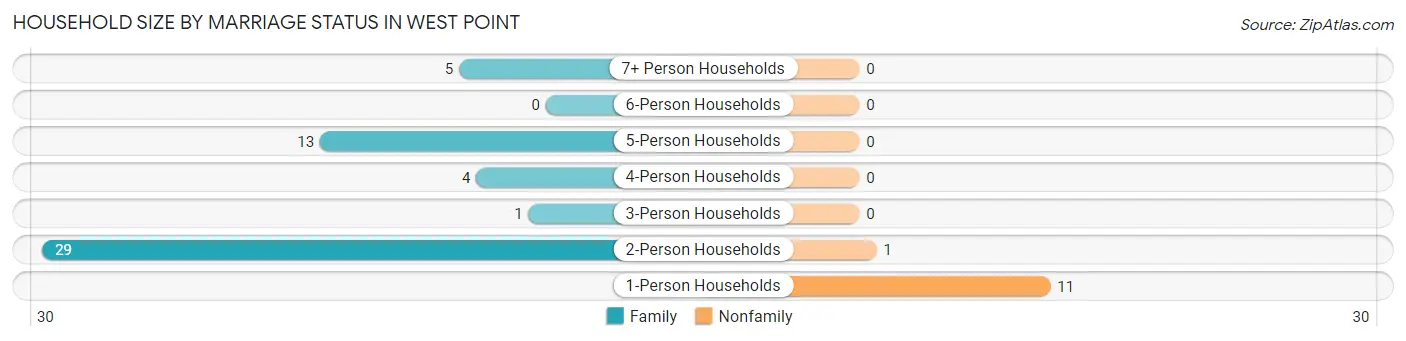
Household Size by Marriage Status in West Point
Out of a total of 64 households in West Point, 52 (81.2%) are family households, while 12 (18.8%) are nonfamily households. The most numerous type of family households are 2-person households, comprising 29, and the most common type of nonfamily households are 1-person households, comprising 11.
| Household Size | Family Households | Nonfamily Households |
| 1-Person Households | - | 11 (17.2%) |
| 2-Person Households | 29 (45.3%) | 1 (1.6%) |
| 3-Person Households | 1 (1.6%) | 0 (0.0%) |
| 4-Person Households | 4 (6.2%) | 0 (0.0%) |
| 5-Person Households | 13 (20.3%) | 0 (0.0%) |
| 6-Person Households | 0 (0.0%) | 0 (0.0%) |
| 7+ Person Households | 5 (7.8%) | 0 (0.0%) |
| Total | 52 (81.2%) | 12 (18.8%) |
Female Fertility in West Point
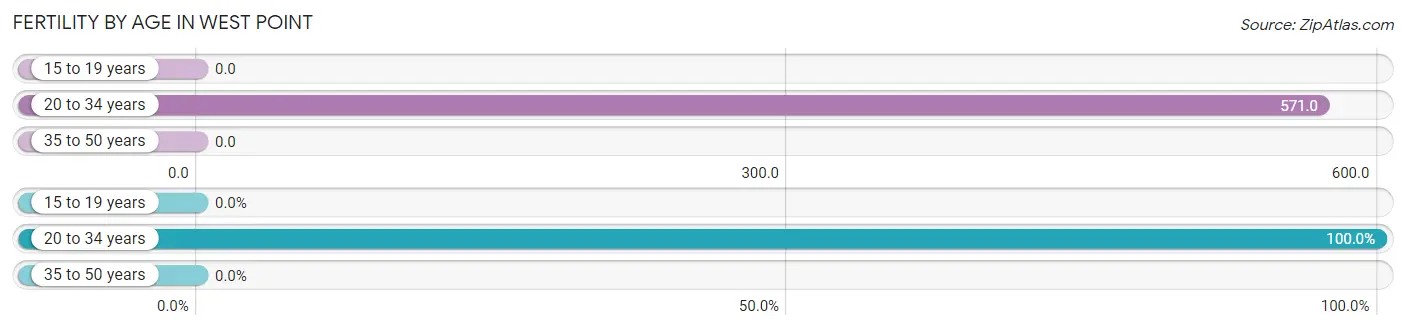
Fertility by Age in West Point
Average fertility rate in West Point is 121.0 births per 1,000 women. Women in the age bracket of 20 to 34 years have the highest fertility rate with 571.0 births per 1,000 women. Women in the age bracket of 20 to 34 years acount for 100.0% of all women with births.
| Age Bracket | Women with Births | Births / 1,000 Women |
| 15 to 19 years | 0 (0.0%) | 0.0 |
| 20 to 34 years | 8 (100.0%) | 571.0 |
| 35 to 50 years | 0 (0.0%) | 0.0 |
| Total | 8 (100.0%) | 121.0 |
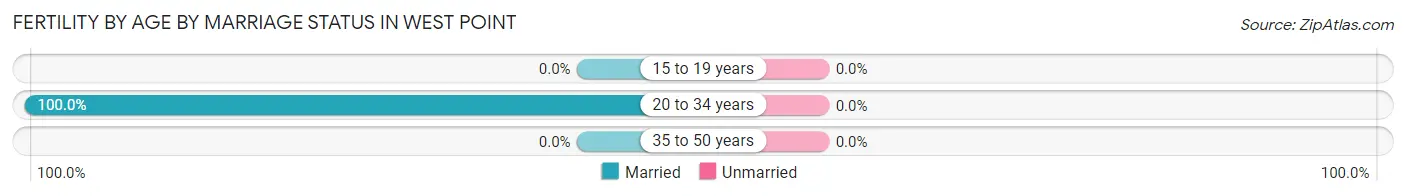
Fertility by Age by Marriage Status in West Point
| Age Bracket | Married | Unmarried |
| 15 to 19 years | 0 (0.0%) | 0 (0.0%) |
| 20 to 34 years | 8 (100.0%) | 0 (0.0%) |
| 35 to 50 years | 0 (0.0%) | 0 (0.0%) |
| Total | 8 (100.0%) | 0 (0.0%) |
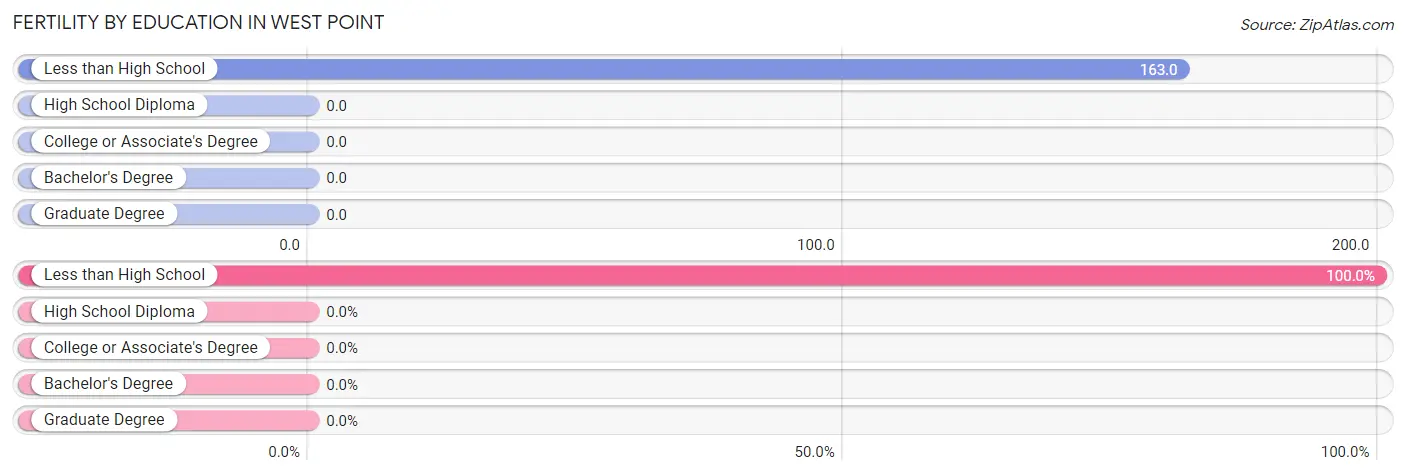
Fertility by Education in West Point
| Educational Attainment | Women with Births | Births / 1,000 Women |
| Less than High School | 8 (100.0%) | 163.0 |
| High School Diploma | 0 (0.0%) | 0.0 |
| College or Associate's Degree | 0 (0.0%) | 0.0 |
| Bachelor's Degree | 0 (0.0%) | 0.0 |
| Graduate Degree | 0 (0.0%) | 0.0 |
| Total | 8 (100.0%) | 121.0 |
Fertility by Education by Marriage Status in West Point
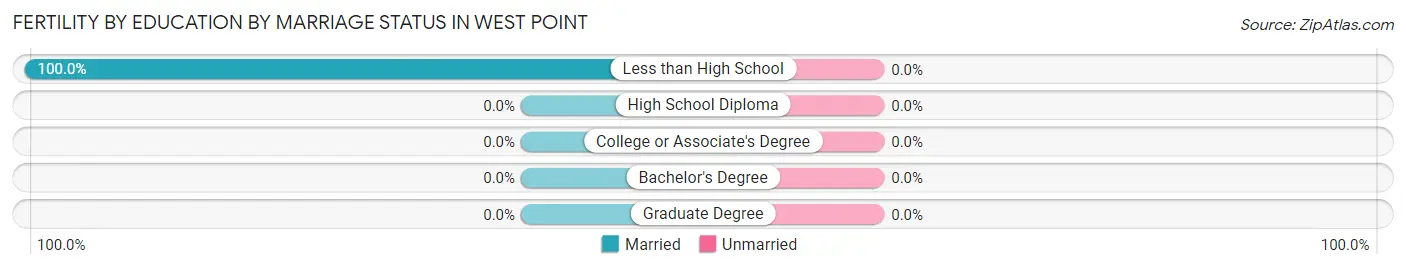
| Educational Attainment | Married | Unmarried |
| Less than High School | 8 (100.0%) | 0 (0.0%) |
| High School Diploma | 0 (0.0%) | 0 (0.0%) |
| College or Associate's Degree | 0 (0.0%) | 0 (0.0%) |
| Bachelor's Degree | 0 (0.0%) | 0 (0.0%) |
| Graduate Degree | 0 (0.0%) | 0 (0.0%) |
| Total | 8 (100.0%) | 0 (0.0%) |
Employment Characteristics in West Point
Employment by Class of Employer in West Point
Among the 90 employed individuals in West Point, private company employees (74 | 82.2%), not-for-profit organizations (8 | 8.9%), and local government employees (5 | 5.6%) make up the most common classes of employment.
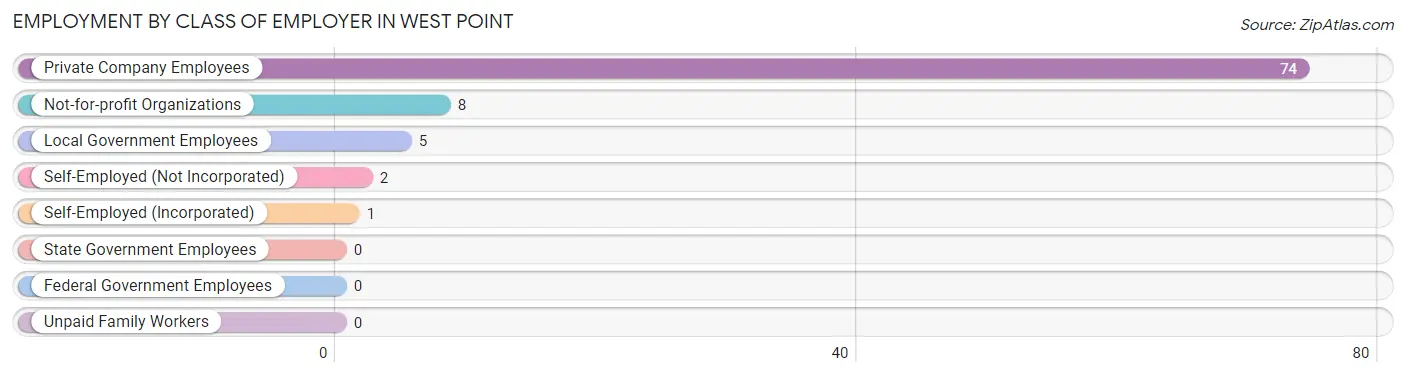
| Employer Class | # Employees | % Employees |
| Private Company Employees | 74 | 82.2% |
| Self-Employed (Incorporated) | 1 | 1.1% |
| Self-Employed (Not Incorporated) | 2 | 2.2% |
| Not-for-profit Organizations | 8 | 8.9% |
| Local Government Employees | 5 | 5.6% |
| State Government Employees | 0 | 0.0% |
| Federal Government Employees | 0 | 0.0% |
| Unpaid Family Workers | 0 | 0.0% |
| Total | 90 | 100.0% |
Employment Status by Age in West Point
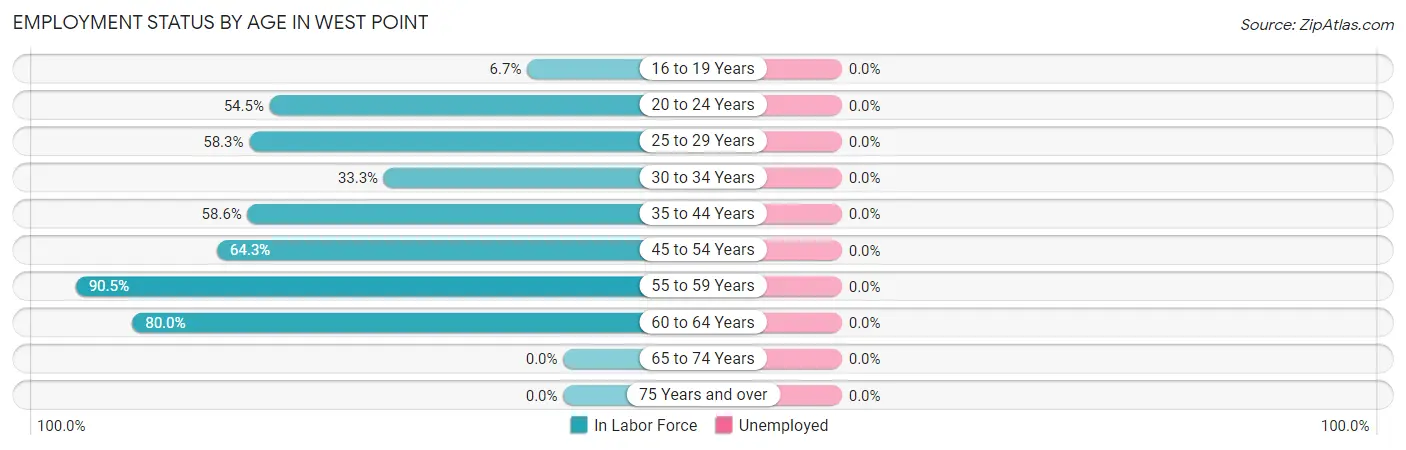
| Age Bracket | In Labor Force | Unemployed |
| 16 to 19 Years | 2 (6.7%) | 0 (0.0%) |
| 20 to 24 Years | 6 (54.5%) | 0 (0.0%) |
| 25 to 29 Years | 7 (58.3%) | 0 (0.0%) |
| 30 to 34 Years | 1 (33.3%) | 0 (0.0%) |
| 35 to 44 Years | 34 (58.6%) | 0 (0.0%) |
| 45 to 54 Years | 9 (64.3%) | 0 (0.0%) |
| 55 to 59 Years | 19 (90.5%) | 0 (0.0%) |
| 60 to 64 Years | 12 (80.0%) | 0 (0.0%) |
| 65 to 74 Years | 0 (0.0%) | 0 (0.0%) |
| 75 Years and over | 0 (0.0%) | 0 (0.0%) |
| Total | 90 (48.6%) | 0 (0.0%) |
Employment Status by Educational Attainment in West Point

| Educational Attainment | In Labor Force | Unemployed |
| Less than High School | 20 (40.8%) | 0 (0.0%) |
| High School Diploma | 36 (90.0%) | 0 (0.0%) |
| College / Associate Degree | 26 (81.3%) | 0 (0.0%) |
| Bachelor's Degree or higher | 0 (0.0%) | 0 (0.0%) |
| Total | 82 (66.7%) | 0 (0.0%) |
Employment Occupations by Sex in West Point
Management, Business, Science and Arts Occupations
The most common Management, Business, Science and Arts occupations in West Point are Community & Social Service (6 | 6.7%), Education Instruction & Library (6 | 6.7%), Management (2 | 2.2%), Health Diagnosing & Treating (2 | 2.2%), and Health Technologists (2 | 2.2%).
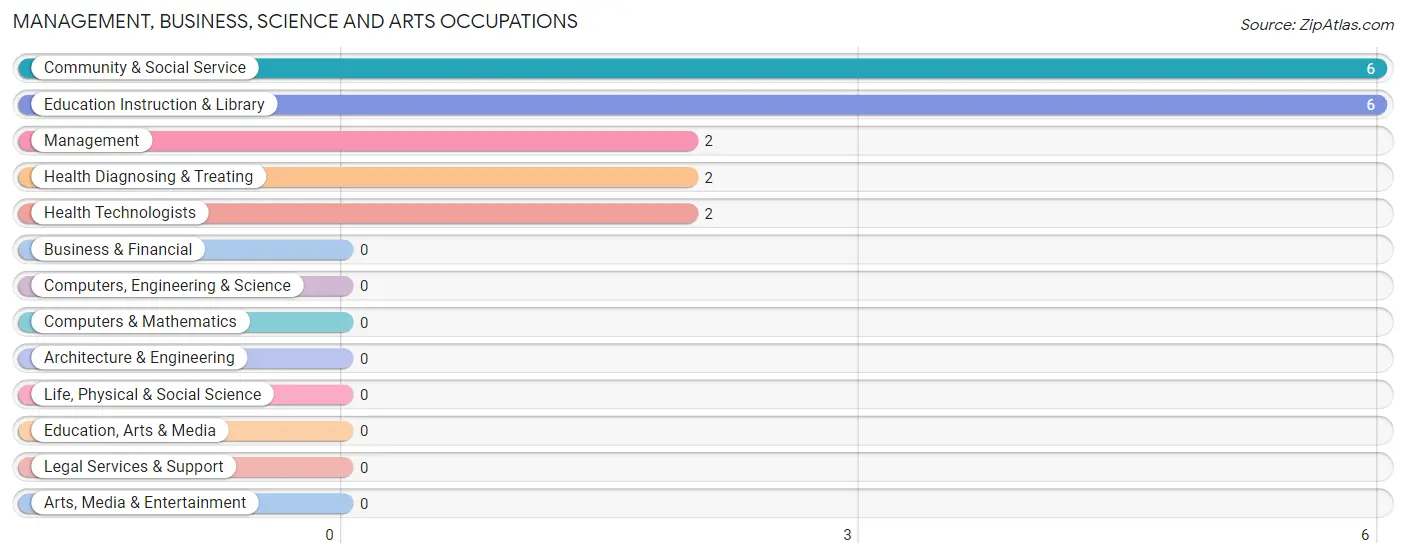
Management, Business, Science and Arts Occupations by Sex
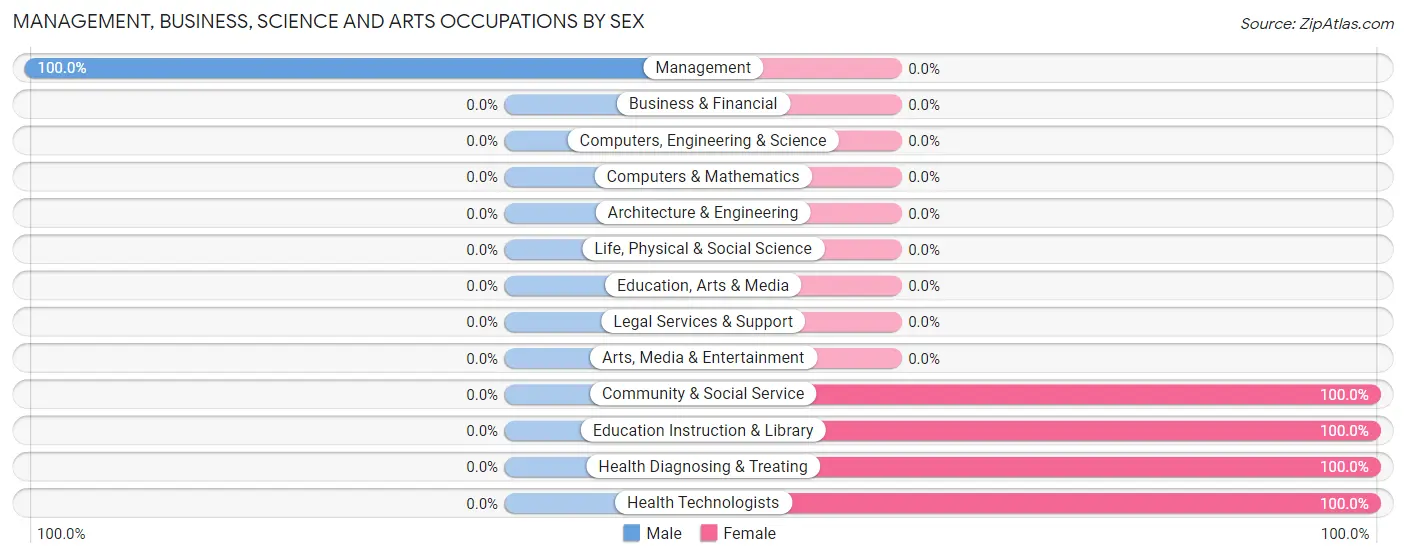
| Occupation | Male | Female |
| Management | 2 (100.0%) | 0 (0.0%) |
| Business & Financial | 0 (0.0%) | 0 (0.0%) |
| Computers, Engineering & Science | 0 (0.0%) | 0 (0.0%) |
| Computers & Mathematics | 0 (0.0%) | 0 (0.0%) |
| Architecture & Engineering | 0 (0.0%) | 0 (0.0%) |
| Life, Physical & Social Science | 0 (0.0%) | 0 (0.0%) |
| Community & Social Service | 0 (0.0%) | 6 (100.0%) |
| Education, Arts & Media | 0 (0.0%) | 0 (0.0%) |
| Legal Services & Support | 0 (0.0%) | 0 (0.0%) |
| Education Instruction & Library | 0 (0.0%) | 6 (100.0%) |
| Arts, Media & Entertainment | 0 (0.0%) | 0 (0.0%) |
| Health Diagnosing & Treating | 0 (0.0%) | 2 (100.0%) |
| Health Technologists | 0 (0.0%) | 2 (100.0%) |
| Total (Category) | 2 (20.0%) | 8 (80.0%) |
| Total (Overall) | 56 (62.2%) | 34 (37.8%) |
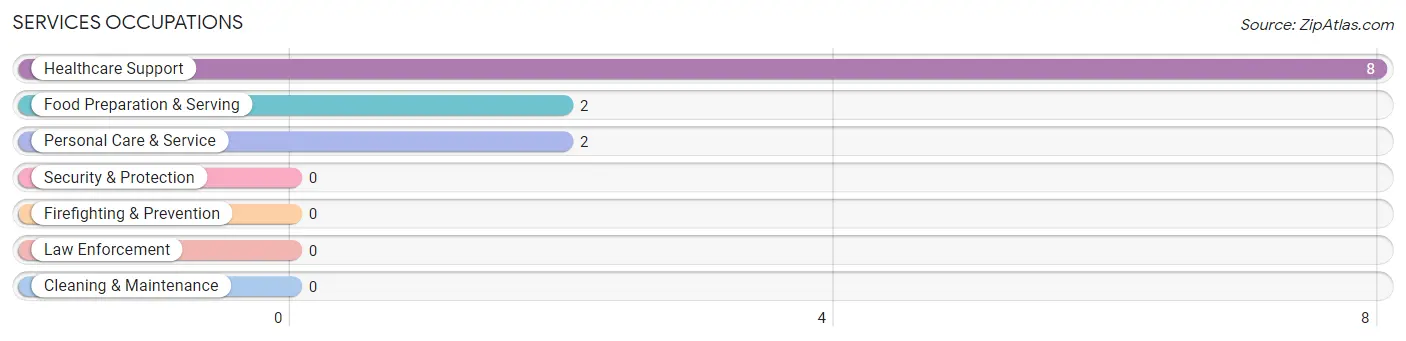
Services Occupations
The most common Services occupations in West Point are Healthcare Support (8 | 8.9%), Food Preparation & Serving (2 | 2.2%), and Personal Care & Service (2 | 2.2%).
Services Occupations by Sex
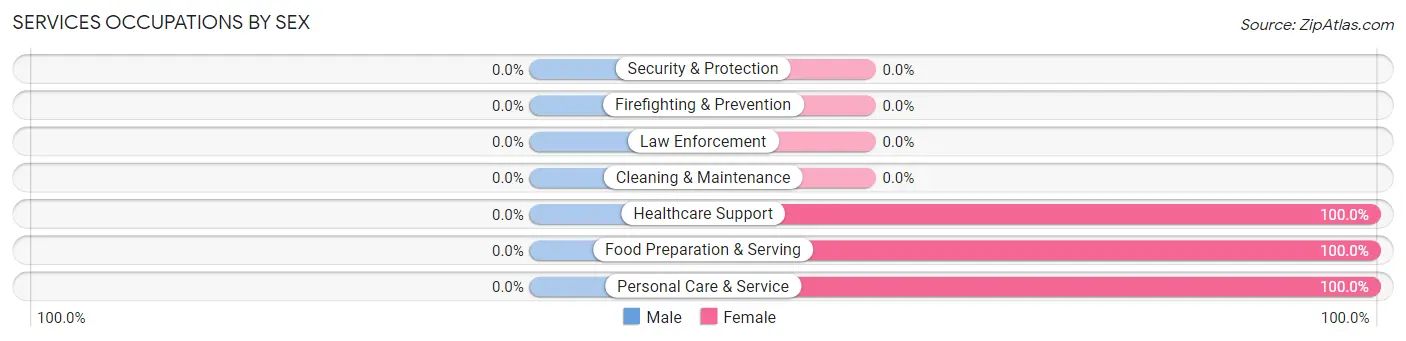
| Occupation | Male | Female |
| Healthcare Support | 0 (0.0%) | 8 (100.0%) |
| Security & Protection | 0 (0.0%) | 0 (0.0%) |
| Firefighting & Prevention | 0 (0.0%) | 0 (0.0%) |
| Law Enforcement | 0 (0.0%) | 0 (0.0%) |
| Food Preparation & Serving | 0 (0.0%) | 2 (100.0%) |
| Cleaning & Maintenance | 0 (0.0%) | 0 (0.0%) |
| Personal Care & Service | 0 (0.0%) | 2 (100.0%) |
| Total (Category) | 0 (0.0%) | 12 (100.0%) |
| Total (Overall) | 56 (62.2%) | 34 (37.8%) |
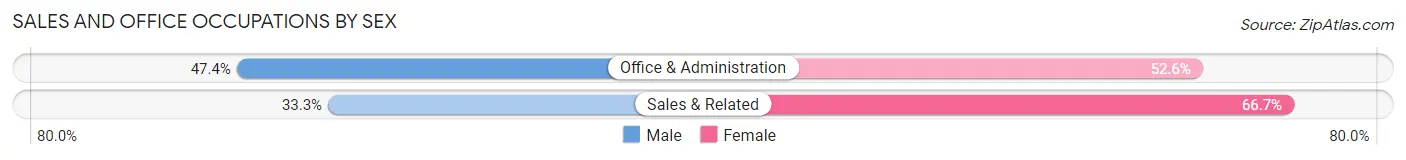
Sales and Office Occupations
The most common Sales and Office occupations in West Point are Office & Administration (19 | 21.1%), and Sales & Related (6 | 6.7%).
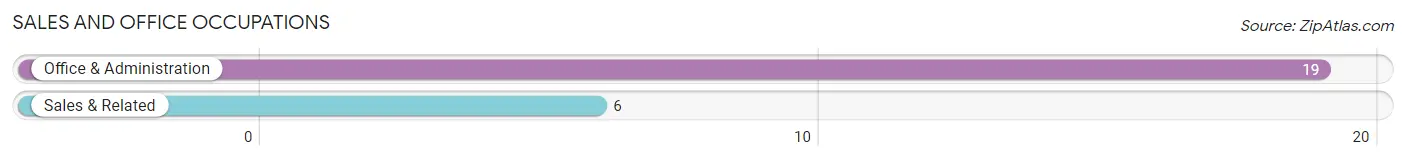
Sales and Office Occupations by Sex
| Occupation | Male | Female |
| Sales & Related | 2 (33.3%) | 4 (66.7%) |
| Office & Administration | 9 (47.4%) | 10 (52.6%) |
| Total (Category) | 11 (44.0%) | 14 (56.0%) |
| Total (Overall) | 56 (62.2%) | 34 (37.8%) |
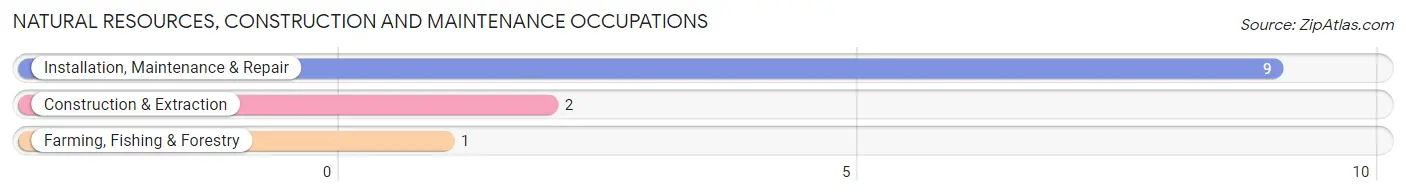
Natural Resources, Construction and Maintenance Occupations
The most common Natural Resources, Construction and Maintenance occupations in West Point are Installation, Maintenance & Repair (9 | 10.0%), Construction & Extraction (2 | 2.2%), and Farming, Fishing & Forestry (1 | 1.1%).
Natural Resources, Construction and Maintenance Occupations by Sex
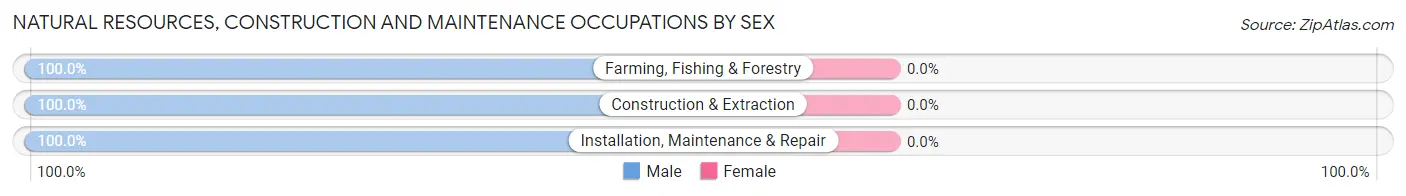
| Occupation | Male | Female |
| Farming, Fishing & Forestry | 1 (100.0%) | 0 (0.0%) |
| Construction & Extraction | 2 (100.0%) | 0 (0.0%) |
| Installation, Maintenance & Repair | 9 (100.0%) | 0 (0.0%) |
| Total (Category) | 12 (100.0%) | 0 (0.0%) |
| Total (Overall) | 56 (62.2%) | 34 (37.8%) |
Production, Transportation and Moving Occupations
The most common Production, Transportation and Moving occupations in West Point are Production (20 | 22.2%), and Transportation (11 | 12.2%).
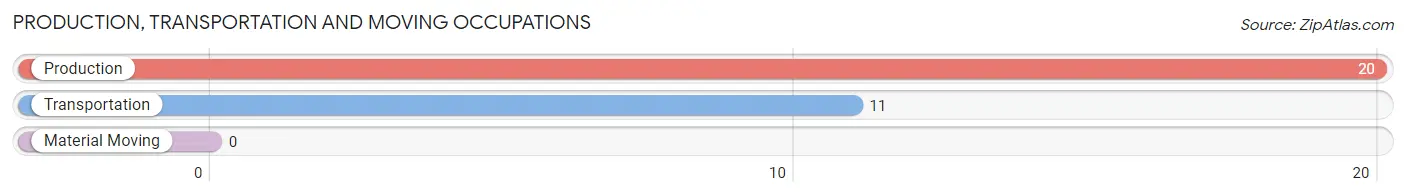
Production, Transportation and Moving Occupations by Sex
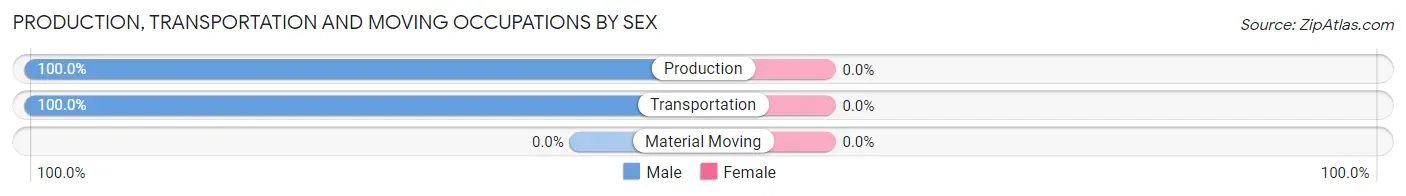
| Occupation | Male | Female |
| Production | 20 (100.0%) | 0 (0.0%) |
| Transportation | 11 (100.0%) | 0 (0.0%) |
| Material Moving | 0 (0.0%) | 0 (0.0%) |
| Total (Category) | 31 (100.0%) | 0 (0.0%) |
| Total (Overall) | 56 (62.2%) | 34 (37.8%) |
Employment Industries by Sex in West Point
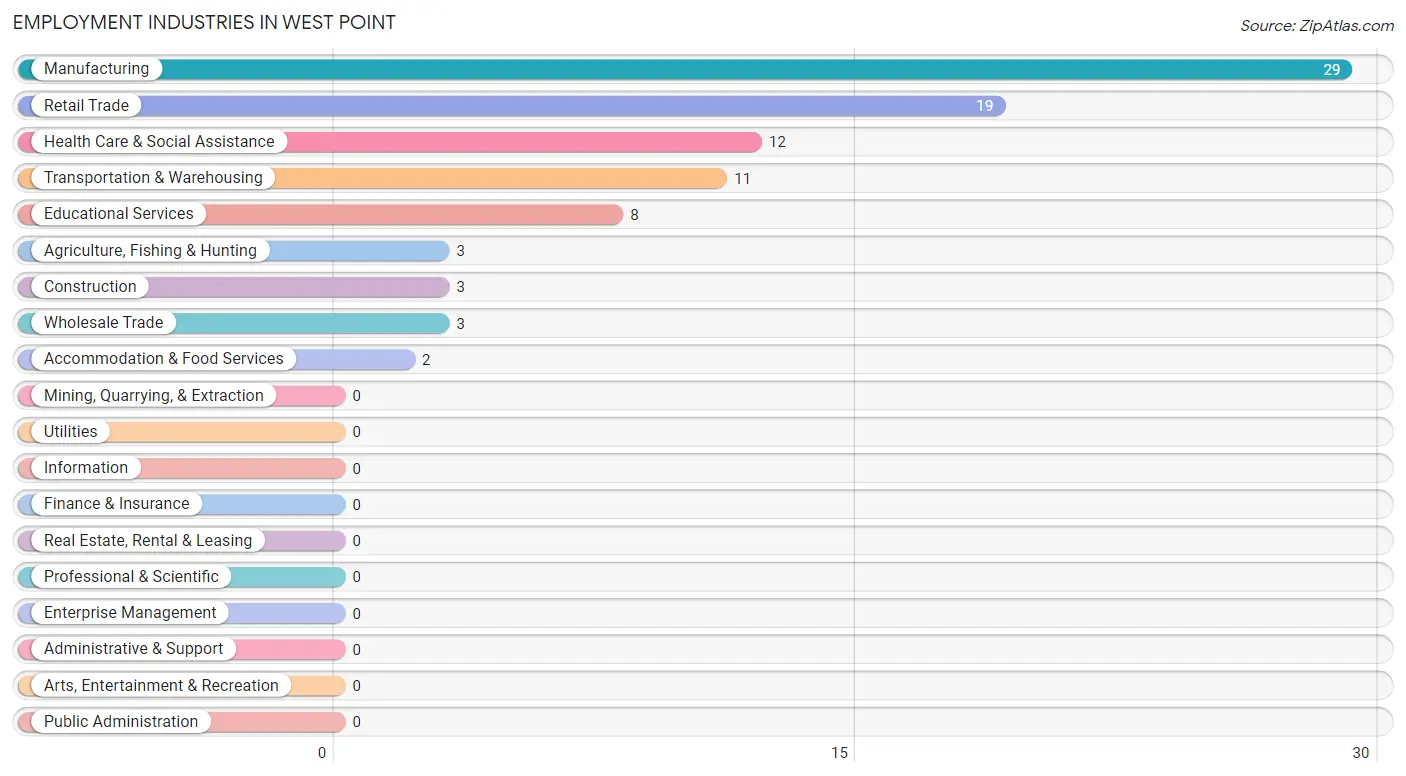
Employment Industries in West Point
The major employment industries in West Point include Manufacturing (29 | 32.2%), Retail Trade (19 | 21.1%), Health Care & Social Assistance (12 | 13.3%), Transportation & Warehousing (11 | 12.2%), and Educational Services (8 | 8.9%).
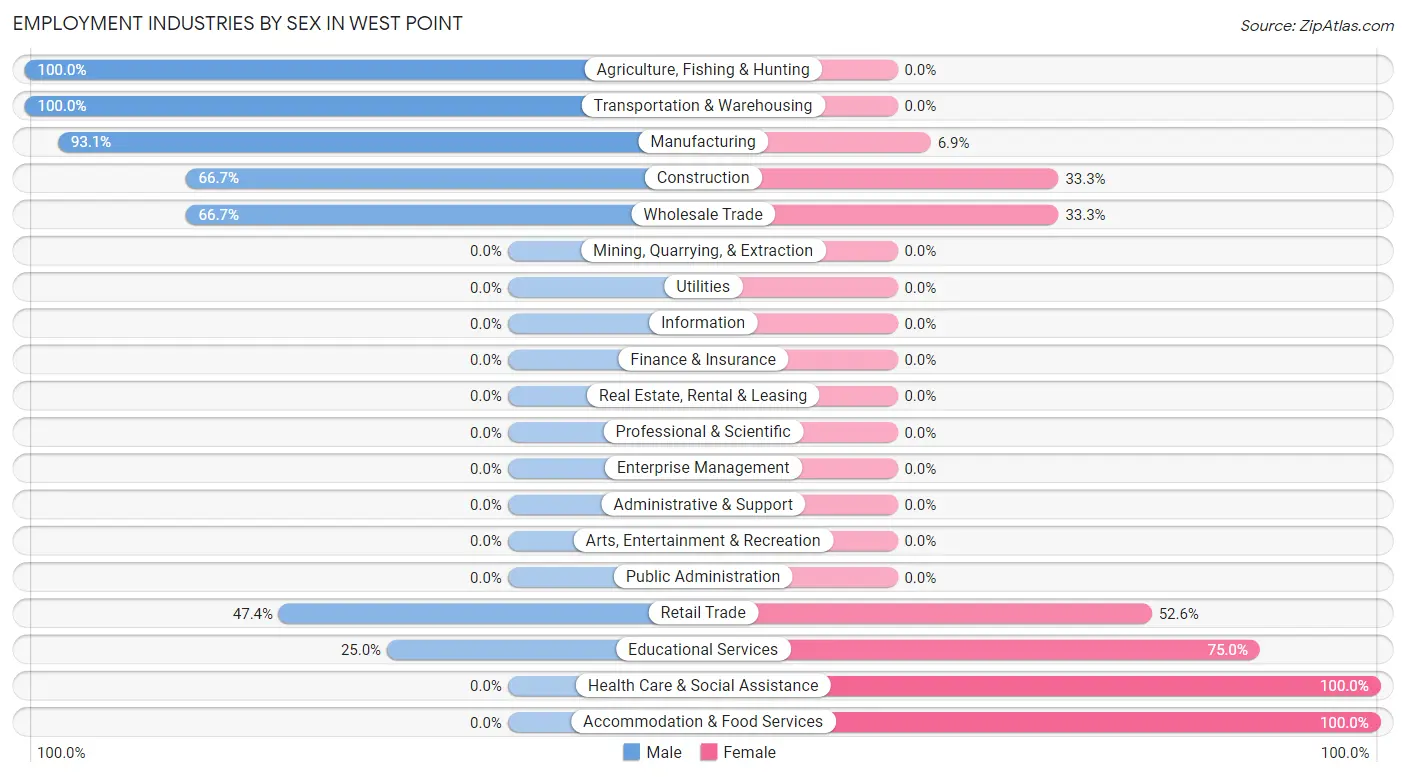
Employment Industries by Sex in West Point
The West Point industries that see more men than women are Agriculture, Fishing & Hunting (100.0%), Transportation & Warehousing (100.0%), and Manufacturing (93.1%), whereas the industries that tend to have a higher number of women are Health Care & Social Assistance (100.0%), Accommodation & Food Services (100.0%), and Educational Services (75.0%).
| Industry | Male | Female |
| Agriculture, Fishing & Hunting | 3 (100.0%) | 0 (0.0%) |
| Mining, Quarrying, & Extraction | 0 (0.0%) | 0 (0.0%) |
| Construction | 2 (66.7%) | 1 (33.3%) |
| Manufacturing | 27 (93.1%) | 2 (6.9%) |
| Wholesale Trade | 2 (66.7%) | 1 (33.3%) |
| Retail Trade | 9 (47.4%) | 10 (52.6%) |
| Transportation & Warehousing | 11 (100.0%) | 0 (0.0%) |
| Utilities | 0 (0.0%) | 0 (0.0%) |
| Information | 0 (0.0%) | 0 (0.0%) |
| Finance & Insurance | 0 (0.0%) | 0 (0.0%) |
| Real Estate, Rental & Leasing | 0 (0.0%) | 0 (0.0%) |
| Professional & Scientific | 0 (0.0%) | 0 (0.0%) |
| Enterprise Management | 0 (0.0%) | 0 (0.0%) |
| Administrative & Support | 0 (0.0%) | 0 (0.0%) |
| Educational Services | 2 (25.0%) | 6 (75.0%) |
| Health Care & Social Assistance | 0 (0.0%) | 12 (100.0%) |
| Arts, Entertainment & Recreation | 0 (0.0%) | 0 (0.0%) |
| Accommodation & Food Services | 0 (0.0%) | 2 (100.0%) |
| Public Administration | 0 (0.0%) | 0 (0.0%) |
| Total | 56 (62.2%) | 34 (37.8%) |
Education in West Point
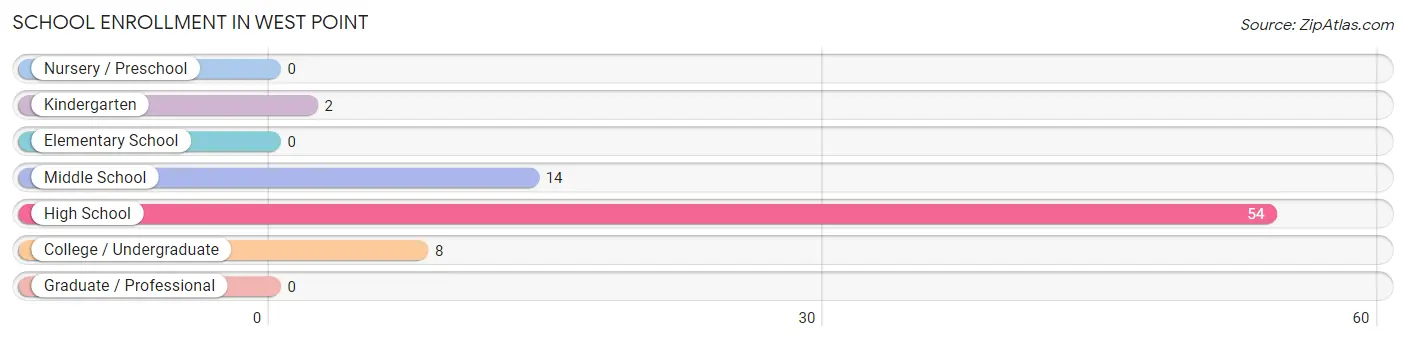
School Enrollment in West Point
The most common levels of schooling among the 78 students in West Point are high school (54 | 69.2%), middle school (14 | 17.9%), and college / undergraduate (8 | 10.3%).
| School Level | # Students | % Students |
| Nursery / Preschool | 0 | 0.0% |
| Kindergarten | 2 | 2.6% |
| Elementary School | 0 | 0.0% |
| Middle School | 14 | 17.9% |
| High School | 54 | 69.2% |
| College / Undergraduate | 8 | 10.3% |
| Graduate / Professional | 0 | 0.0% |
| Total | 78 | 100.0% |
School Enrollment by Age by Funding Source in West Point
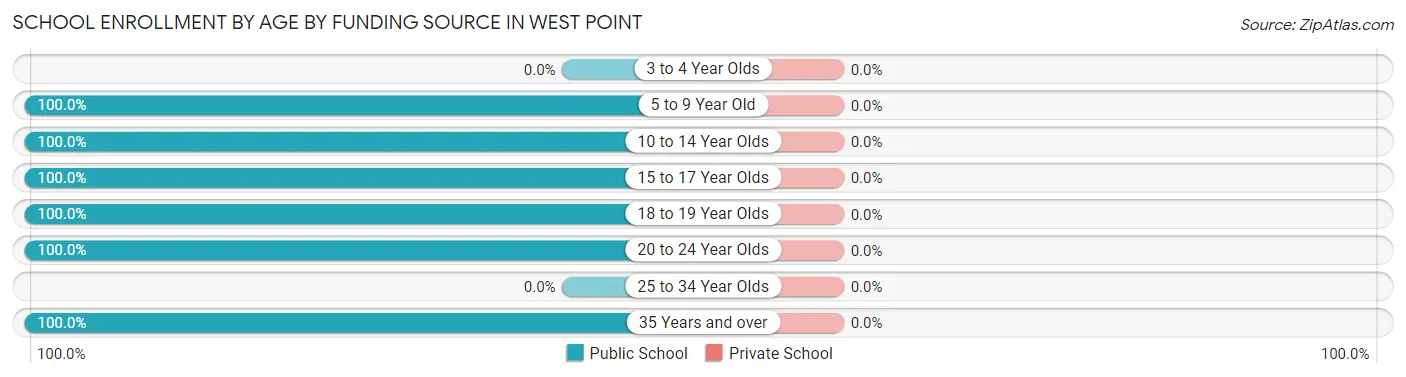
| Age Bracket | Public School | Private School |
| 3 to 4 Year Olds | 0 (0.0%) | 0 (0.0%) |
| 5 to 9 Year Old | 2 (100.0%) | 0 (0.0%) |
| 10 to 14 Year Olds | 34 (100.0%) | 0 (0.0%) |
| 15 to 17 Year Olds | 32 (100.0%) | 0 (0.0%) |
| 18 to 19 Year Olds | 2 (100.0%) | 0 (0.0%) |
| 20 to 24 Year Olds | 2 (100.0%) | 0 (0.0%) |
| 25 to 34 Year Olds | 0 (0.0%) | 0 (0.0%) |
| 35 Years and over | 6 (100.0%) | 0 (0.0%) |
| Total | 78 (100.0%) | 0 (0.0%) |
Educational Attainment by Field of Study in West Point
Business (2 | 66.7%), and education (1 | 33.3%) are the most common fields of study among 3 individuals in West Point who have obtained a bachelor's degree or higher.
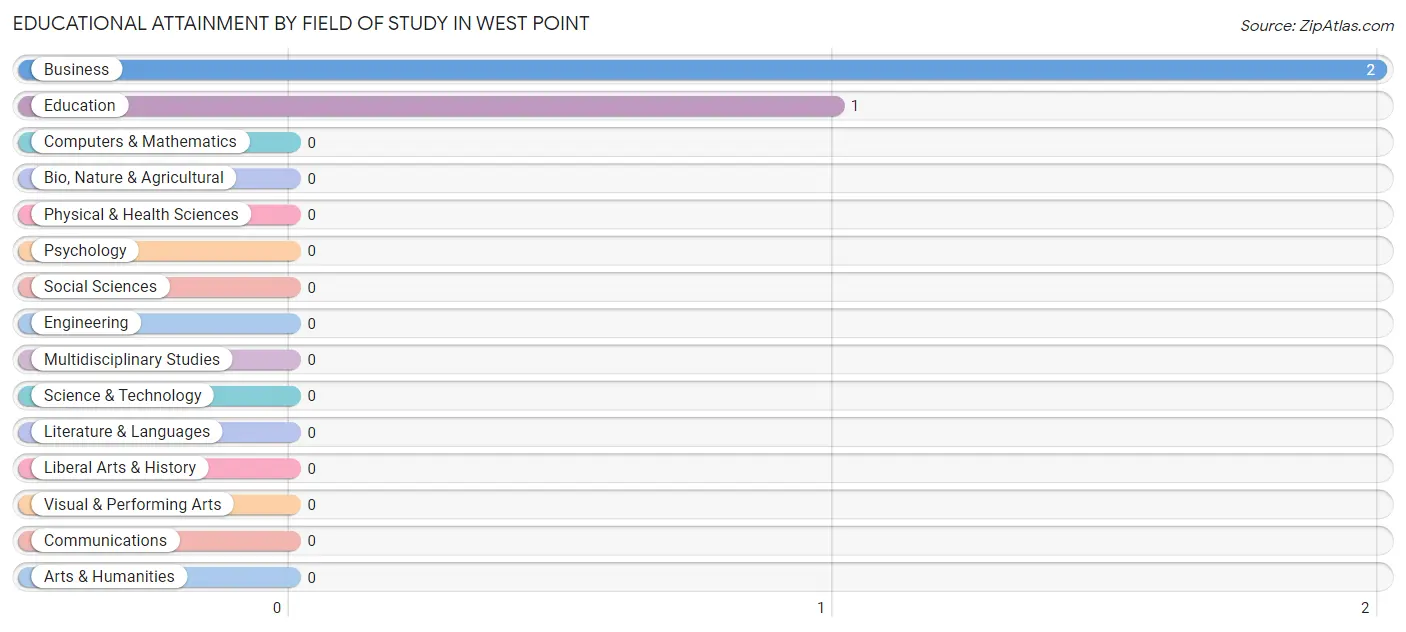
| Field of Study | # Graduates | % Graduates |
| Computers & Mathematics | 0 | 0.0% |
| Bio, Nature & Agricultural | 0 | 0.0% |
| Physical & Health Sciences | 0 | 0.0% |
| Psychology | 0 | 0.0% |
| Social Sciences | 0 | 0.0% |
| Engineering | 0 | 0.0% |
| Multidisciplinary Studies | 0 | 0.0% |
| Science & Technology | 0 | 0.0% |
| Business | 2 | 66.7% |
| Education | 1 | 33.3% |
| Literature & Languages | 0 | 0.0% |
| Liberal Arts & History | 0 | 0.0% |
| Visual & Performing Arts | 0 | 0.0% |
| Communications | 0 | 0.0% |
| Arts & Humanities | 0 | 0.0% |
| Total | 3 | 100.0% |
Transportation & Commute in West Point
Vehicle Availability by Sex in West Point
The most prevalent vehicle ownership categories in West Point are males with 2 vehicles (21, accounting for 37.5%) and females with 2 vehicles (9, making up 61.8%).
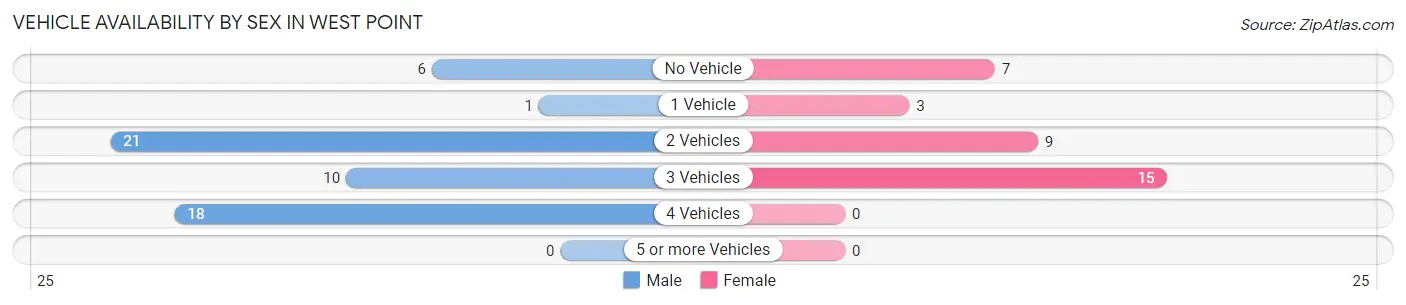
| Vehicles Available | Male | Female |
| No Vehicle | 6 (10.7%) | 7 (20.6%) |
| 1 Vehicle | 1 (1.8%) | 3 (8.8%) |
| 2 Vehicles | 21 (37.5%) | 9 (26.5%) |
| 3 Vehicles | 10 (17.9%) | 15 (44.1%) |
| 4 Vehicles | 18 (32.1%) | 0 (0.0%) |
| 5 or more Vehicles | 0 (0.0%) | 0 (0.0%) |
| Total | 56 (100.0%) | 34 (100.0%) |
Commute Time in West Point
The most frequently occuring commute durations in West Point are 40 to 44 minutes (19 commuters, 25.0%), 45 to 59 minutes (18 commuters, 23.7%), and 35 to 39 minutes (12 commuters, 15.8%).
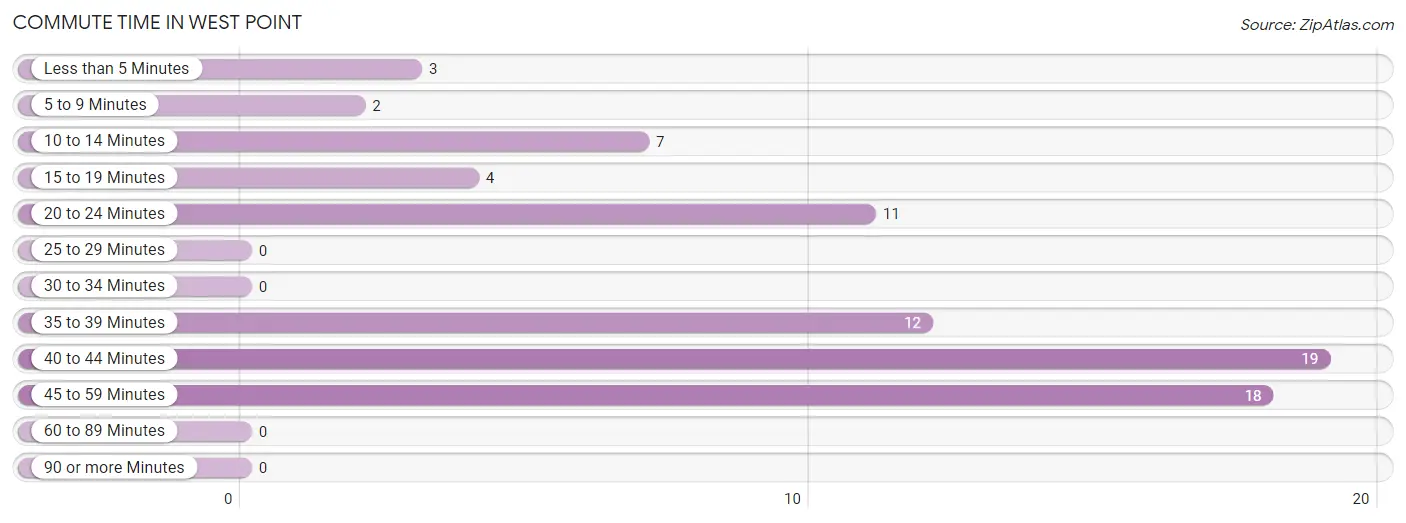
| Commute Time | # Commuters | % Commuters |
| Less than 5 Minutes | 3 | 4.0% |
| 5 to 9 Minutes | 2 | 2.6% |
| 10 to 14 Minutes | 7 | 9.2% |
| 15 to 19 Minutes | 4 | 5.3% |
| 20 to 24 Minutes | 11 | 14.5% |
| 25 to 29 Minutes | 0 | 0.0% |
| 30 to 34 Minutes | 0 | 0.0% |
| 35 to 39 Minutes | 12 | 15.8% |
| 40 to 44 Minutes | 19 | 25.0% |
| 45 to 59 Minutes | 18 | 23.7% |
| 60 to 89 Minutes | 0 | 0.0% |
| 90 or more Minutes | 0 | 0.0% |
Commute Time by Sex in West Point
The most common commute times in West Point are 45 to 59 minutes (16 commuters, 34.8%) for males and 40 to 44 minutes (11 commuters, 36.7%) for females.
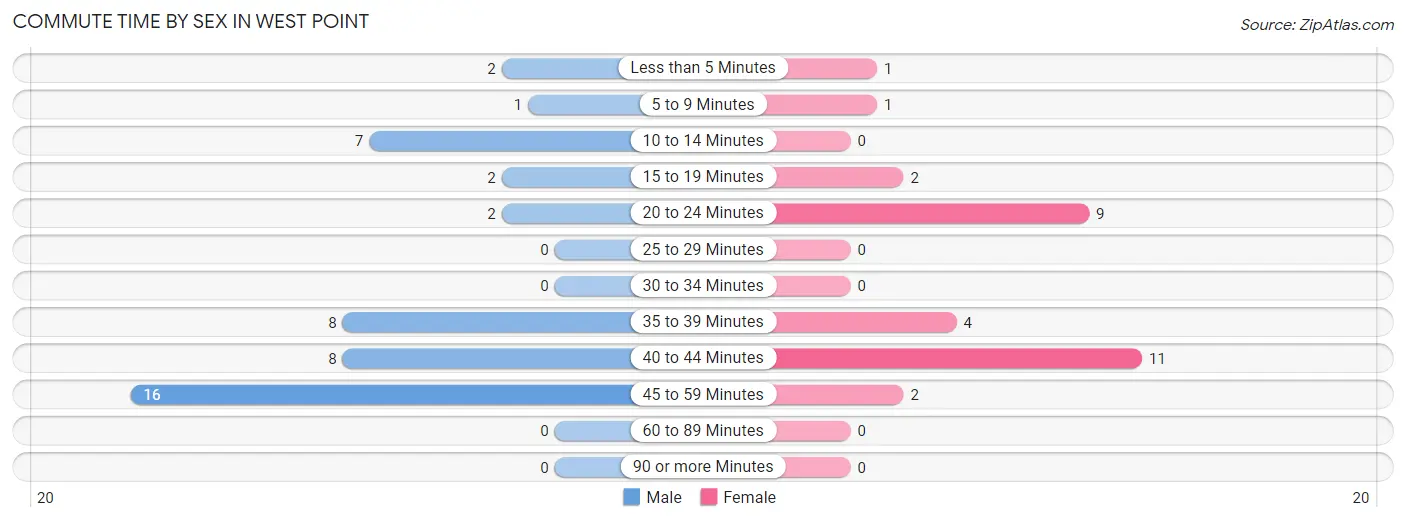
| Commute Time | Male | Female |
| Less than 5 Minutes | 2 (4.3%) | 1 (3.3%) |
| 5 to 9 Minutes | 1 (2.2%) | 1 (3.3%) |
| 10 to 14 Minutes | 7 (15.2%) | 0 (0.0%) |
| 15 to 19 Minutes | 2 (4.3%) | 2 (6.7%) |
| 20 to 24 Minutes | 2 (4.3%) | 9 (30.0%) |
| 25 to 29 Minutes | 0 (0.0%) | 0 (0.0%) |
| 30 to 34 Minutes | 0 (0.0%) | 0 (0.0%) |
| 35 to 39 Minutes | 8 (17.4%) | 4 (13.3%) |
| 40 to 44 Minutes | 8 (17.4%) | 11 (36.7%) |
| 45 to 59 Minutes | 16 (34.8%) | 2 (6.7%) |
| 60 to 89 Minutes | 0 (0.0%) | 0 (0.0%) |
| 90 or more Minutes | 0 (0.0%) | 0 (0.0%) |
Time of Departure to Work by Sex in West Point
The most frequent times of departure to work in West Point are 5:00 AM to 5:29 AM (16, 34.8%) for males and 6:00 AM to 6:29 AM (11, 36.7%) for females.
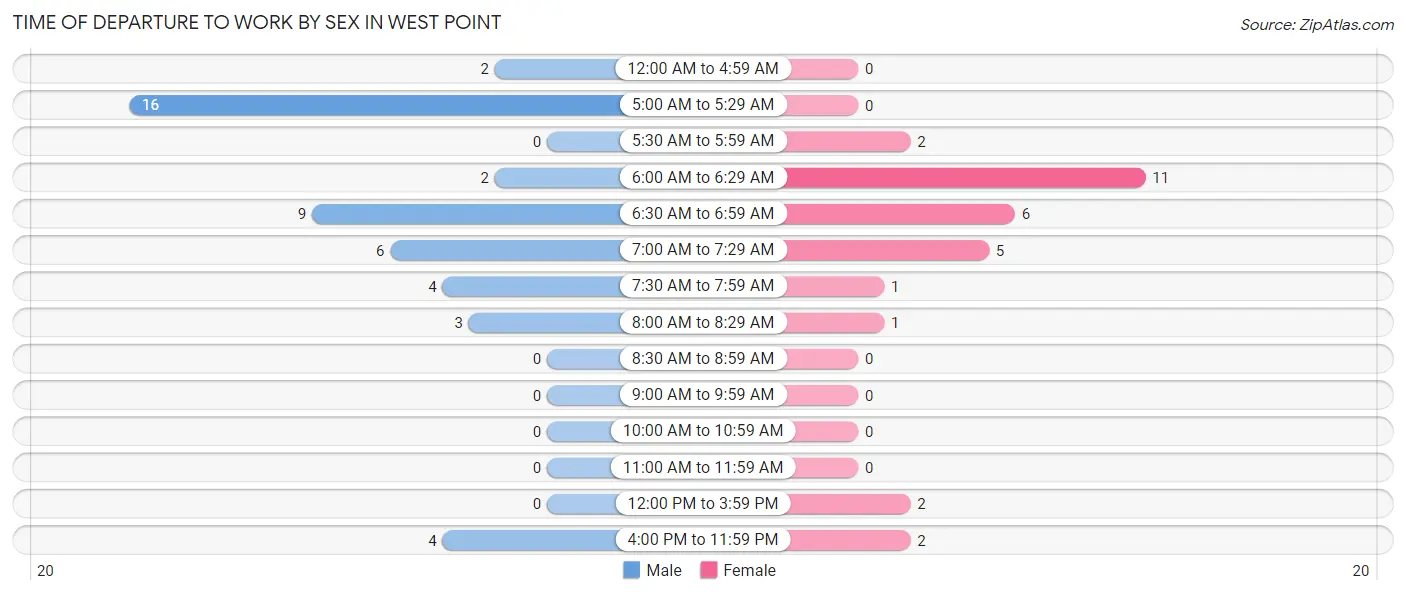
| Time of Departure | Male | Female |
| 12:00 AM to 4:59 AM | 2 (4.3%) | 0 (0.0%) |
| 5:00 AM to 5:29 AM | 16 (34.8%) | 0 (0.0%) |
| 5:30 AM to 5:59 AM | 0 (0.0%) | 2 (6.7%) |
| 6:00 AM to 6:29 AM | 2 (4.3%) | 11 (36.7%) |
| 6:30 AM to 6:59 AM | 9 (19.6%) | 6 (20.0%) |
| 7:00 AM to 7:29 AM | 6 (13.0%) | 5 (16.7%) |
| 7:30 AM to 7:59 AM | 4 (8.7%) | 1 (3.3%) |
| 8:00 AM to 8:29 AM | 3 (6.5%) | 1 (3.3%) |
| 8:30 AM to 8:59 AM | 0 (0.0%) | 0 (0.0%) |
| 9:00 AM to 9:59 AM | 0 (0.0%) | 0 (0.0%) |
| 10:00 AM to 10:59 AM | 0 (0.0%) | 0 (0.0%) |
| 11:00 AM to 11:59 AM | 0 (0.0%) | 0 (0.0%) |
| 12:00 PM to 3:59 PM | 0 (0.0%) | 2 (6.7%) |
| 4:00 PM to 11:59 PM | 4 (8.7%) | 2 (6.7%) |
| Total | 46 (100.0%) | 30 (100.0%) |
Housing Occupancy in West Point
Occupancy by Ownership in West Point
Of the total 64 dwellings in West Point, owner-occupied units account for 55 (85.9%), while renter-occupied units make up 9 (14.1%).
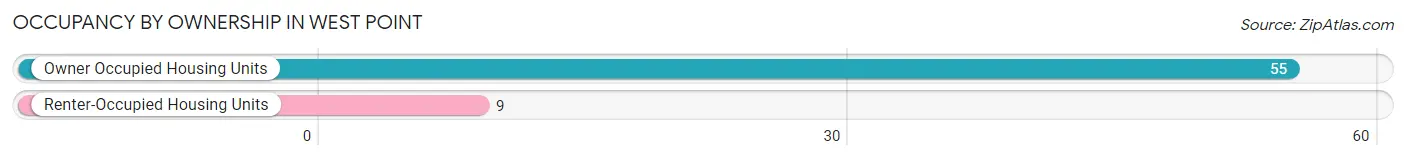
| Occupancy | # Housing Units | % Housing Units |
| Owner Occupied Housing Units | 55 | 85.9% |
| Renter-Occupied Housing Units | 9 | 14.1% |
| Total Occupied Housing Units | 64 | 100.0% |
Occupancy by Household Size in West Point
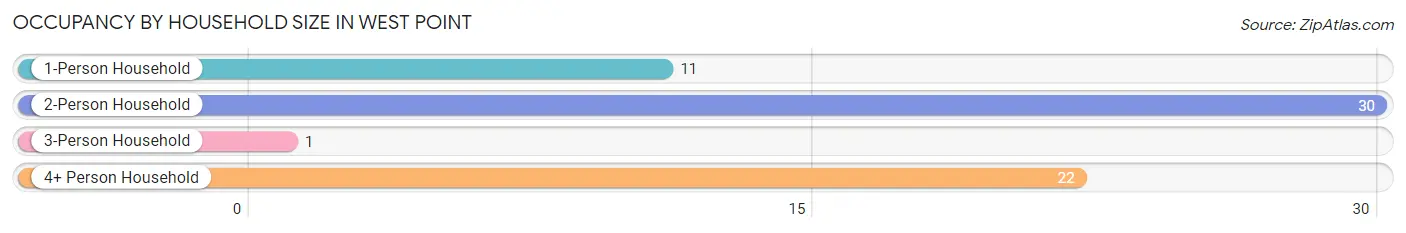
| Household Size | # Housing Units | % Housing Units |
| 1-Person Household | 11 | 17.2% |
| 2-Person Household | 30 | 46.9% |
| 3-Person Household | 1 | 1.6% |
| 4+ Person Household | 22 | 34.4% |
| Total Housing Units | 64 | 100.0% |
Occupancy by Ownership by Household Size in West Point
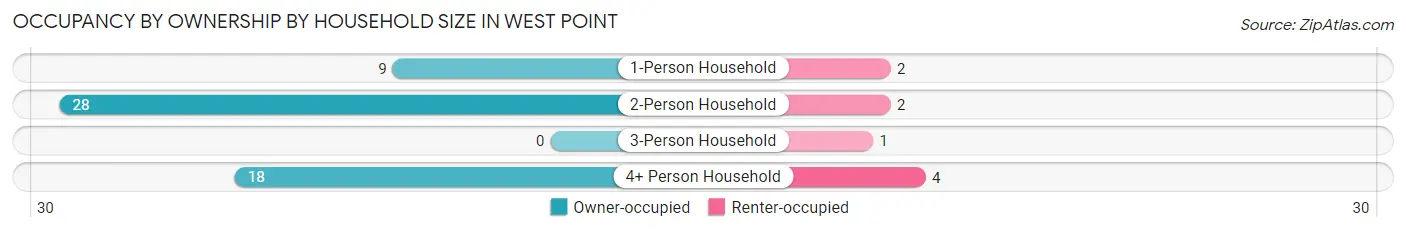
| Household Size | Owner-occupied | Renter-occupied |
| 1-Person Household | 9 (81.8%) | 2 (18.2%) |
| 2-Person Household | 28 (93.3%) | 2 (6.7%) |
| 3-Person Household | 0 (0.0%) | 1 (100.0%) |
| 4+ Person Household | 18 (81.8%) | 4 (18.2%) |
| Total Housing Units | 55 (85.9%) | 9 (14.1%) |
Occupancy by Educational Attainment in West Point
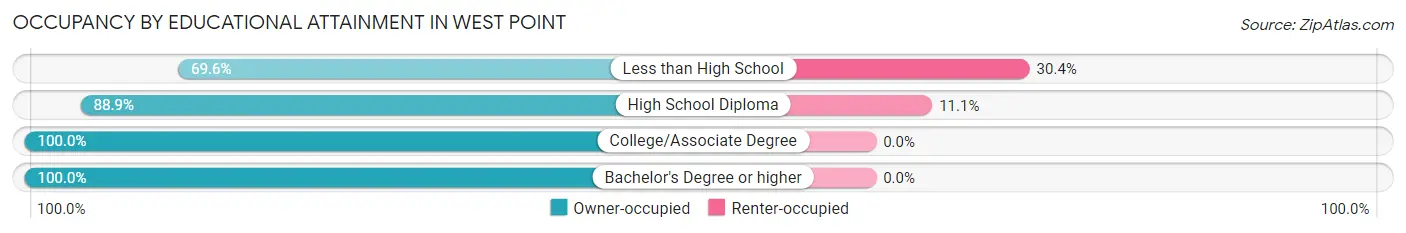
| Household Size | Owner-occupied | Renter-occupied |
| Less than High School | 16 (69.6%) | 7 (30.4%) |
| High School Diploma | 16 (88.9%) | 2 (11.1%) |
| College/Associate Degree | 20 (100.0%) | 0 (0.0%) |
| Bachelor's Degree or higher | 3 (100.0%) | 0 (0.0%) |
Occupancy by Age of Householder in West Point
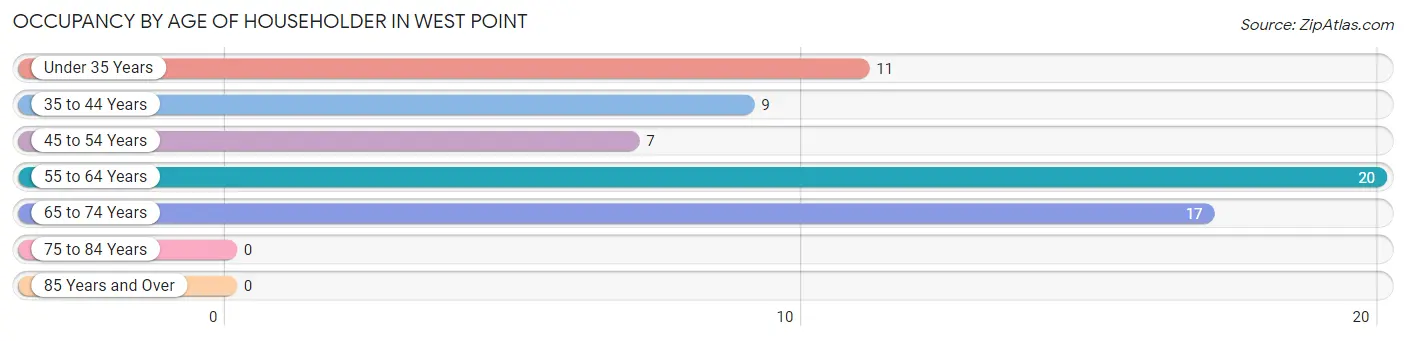
| Age Bracket | # Households | % Households |
| Under 35 Years | 11 | 17.2% |
| 35 to 44 Years | 9 | 14.1% |
| 45 to 54 Years | 7 | 10.9% |
| 55 to 64 Years | 20 | 31.2% |
| 65 to 74 Years | 17 | 26.6% |
| 75 to 84 Years | 0 | 0.0% |
| 85 Years and Over | 0 | 0.0% |
| Total | 64 | 100.0% |
Housing Finances in West Point
Median Income by Occupancy in West Point
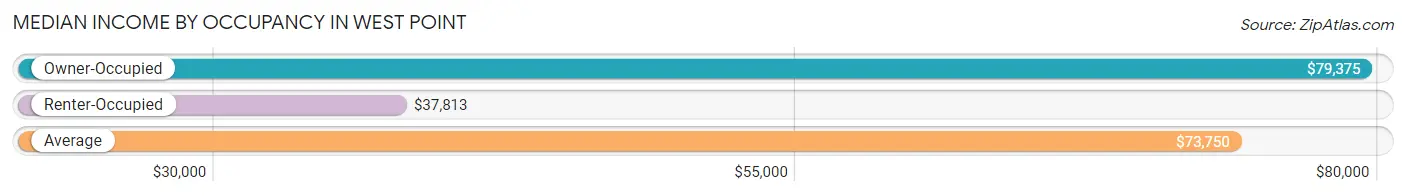
| Occupancy Type | # Households | Median Income |
| Owner-Occupied | 55 (85.9%) | $79,375 |
| Renter-Occupied | 9 (14.1%) | $37,813 |
| Average | 64 (100.0%) | $73,750 |
Occupancy by Householder Income Bracket in West Point
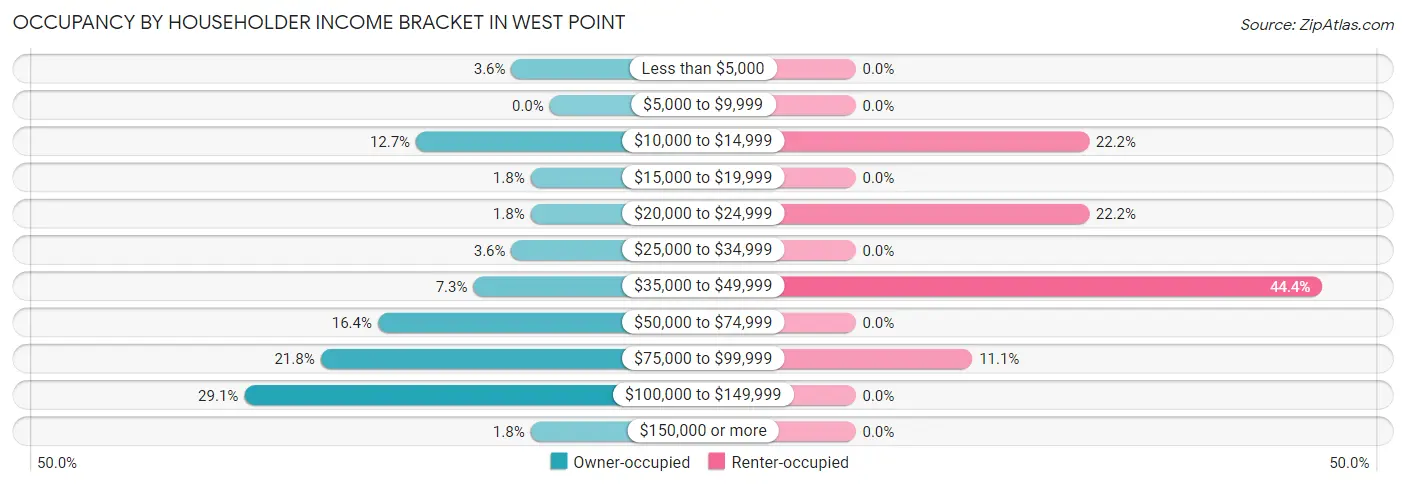
| Income Bracket | Owner-occupied | Renter-occupied |
| Less than $5,000 | 2 (3.6%) | 0 (0.0%) |
| $5,000 to $9,999 | 0 (0.0%) | 0 (0.0%) |
| $10,000 to $14,999 | 7 (12.7%) | 2 (22.2%) |
| $15,000 to $19,999 | 1 (1.8%) | 0 (0.0%) |
| $20,000 to $24,999 | 1 (1.8%) | 2 (22.2%) |
| $25,000 to $34,999 | 2 (3.6%) | 0 (0.0%) |
| $35,000 to $49,999 | 4 (7.3%) | 4 (44.4%) |
| $50,000 to $74,999 | 9 (16.4%) | 0 (0.0%) |
| $75,000 to $99,999 | 12 (21.8%) | 1 (11.1%) |
| $100,000 to $149,999 | 16 (29.1%) | 0 (0.0%) |
| $150,000 or more | 1 (1.8%) | 0 (0.0%) |
| Total | 55 (100.0%) | 9 (100.0%) |
Monthly Housing Cost Tiers in West Point
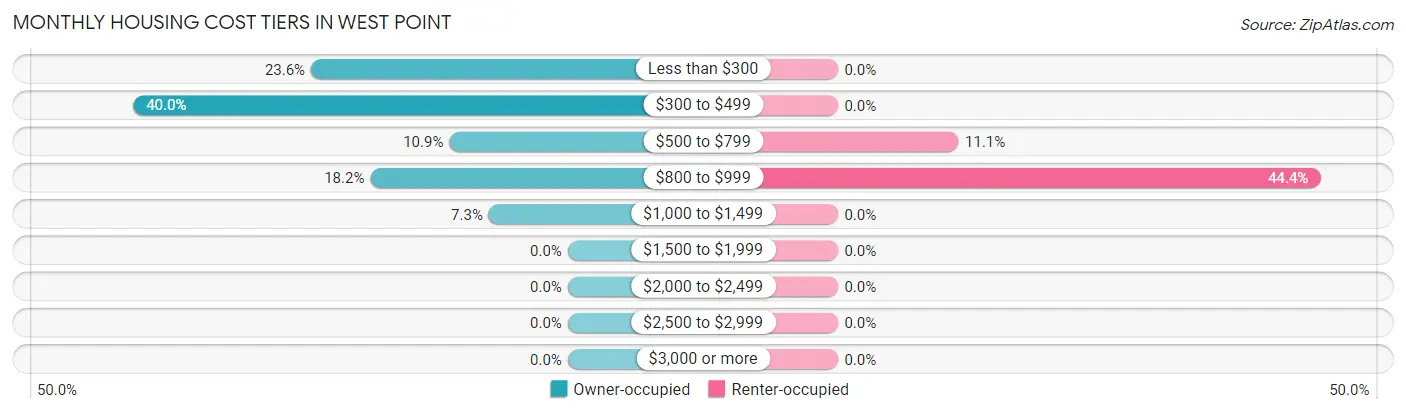
| Monthly Cost | Owner-occupied | Renter-occupied |
| Less than $300 | 13 (23.6%) | 0 (0.0%) |
| $300 to $499 | 22 (40.0%) | 0 (0.0%) |
| $500 to $799 | 6 (10.9%) | 1 (11.1%) |
| $800 to $999 | 10 (18.2%) | 4 (44.4%) |
| $1,000 to $1,499 | 4 (7.3%) | 0 (0.0%) |
| $1,500 to $1,999 | 0 (0.0%) | 0 (0.0%) |
| $2,000 to $2,499 | 0 (0.0%) | 0 (0.0%) |
| $2,500 to $2,999 | 0 (0.0%) | 0 (0.0%) |
| $3,000 or more | 0 (0.0%) | 0 (0.0%) |
| Total | 55 (100.0%) | 9 (100.0%) |
Physical Housing Characteristics in West Point
Housing Structures in West Point
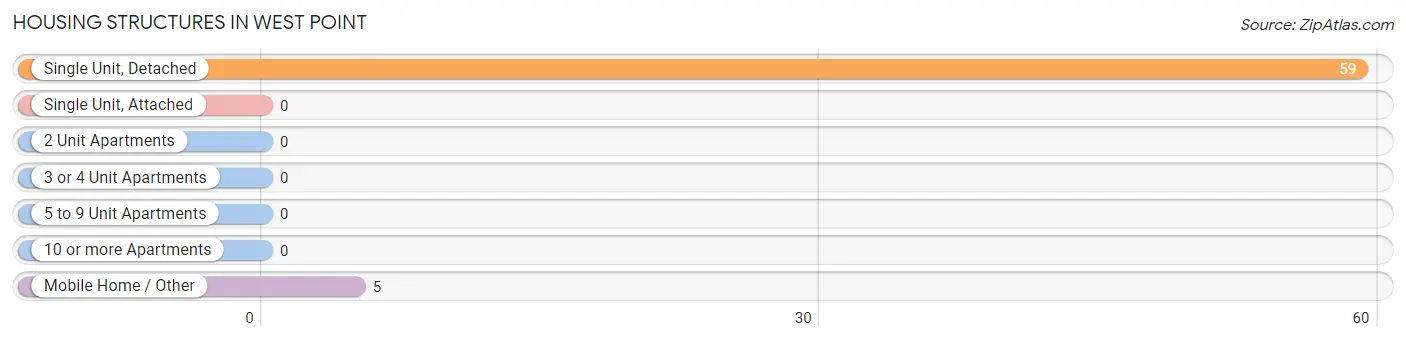
| Structure Type | # Housing Units | % Housing Units |
| Single Unit, Detached | 59 | 92.2% |
| Single Unit, Attached | 0 | 0.0% |
| 2 Unit Apartments | 0 | 0.0% |
| 3 or 4 Unit Apartments | 0 | 0.0% |
| 5 to 9 Unit Apartments | 0 | 0.0% |
| 10 or more Apartments | 0 | 0.0% |
| Mobile Home / Other | 5 | 7.8% |
| Total | 64 | 100.0% |
Housing Structures by Occupancy in West Point
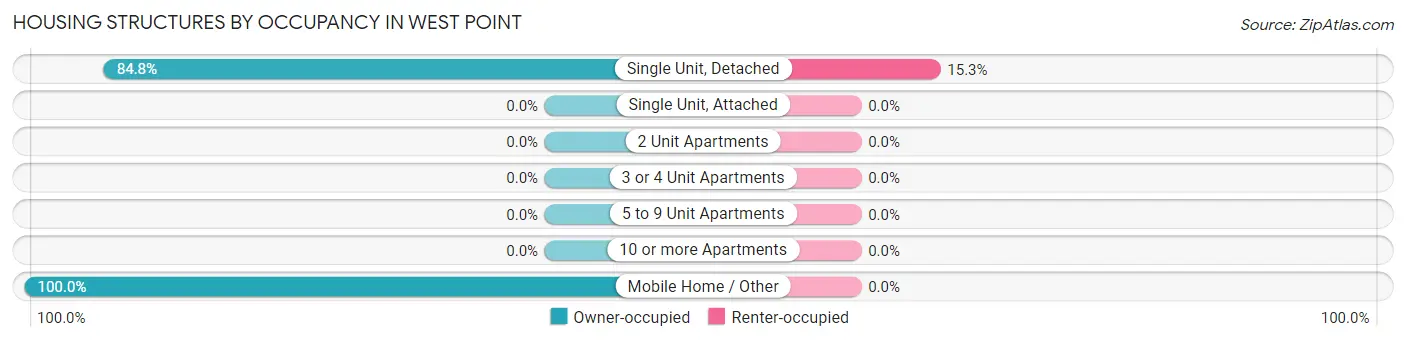
| Structure Type | Owner-occupied | Renter-occupied |
| Single Unit, Detached | 50 (84.8%) | 9 (15.2%) |
| Single Unit, Attached | 0 (0.0%) | 0 (0.0%) |
| 2 Unit Apartments | 0 (0.0%) | 0 (0.0%) |
| 3 or 4 Unit Apartments | 0 (0.0%) | 0 (0.0%) |
| 5 to 9 Unit Apartments | 0 (0.0%) | 0 (0.0%) |
| 10 or more Apartments | 0 (0.0%) | 0 (0.0%) |
| Mobile Home / Other | 5 (100.0%) | 0 (0.0%) |
| Total | 55 (85.9%) | 9 (14.1%) |
Housing Structures by Number of Rooms in West Point
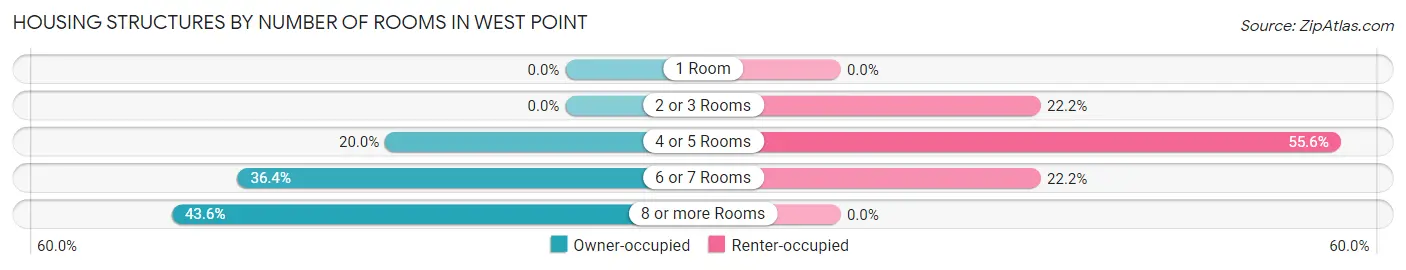
| Number of Rooms | Owner-occupied | Renter-occupied |
| 1 Room | 0 (0.0%) | 0 (0.0%) |
| 2 or 3 Rooms | 0 (0.0%) | 2 (22.2%) |
| 4 or 5 Rooms | 11 (20.0%) | 5 (55.6%) |
| 6 or 7 Rooms | 20 (36.4%) | 2 (22.2%) |
| 8 or more Rooms | 24 (43.6%) | 0 (0.0%) |
| Total | 55 (100.0%) | 9 (100.0%) |
Housing Structure by Heating Type in West Point
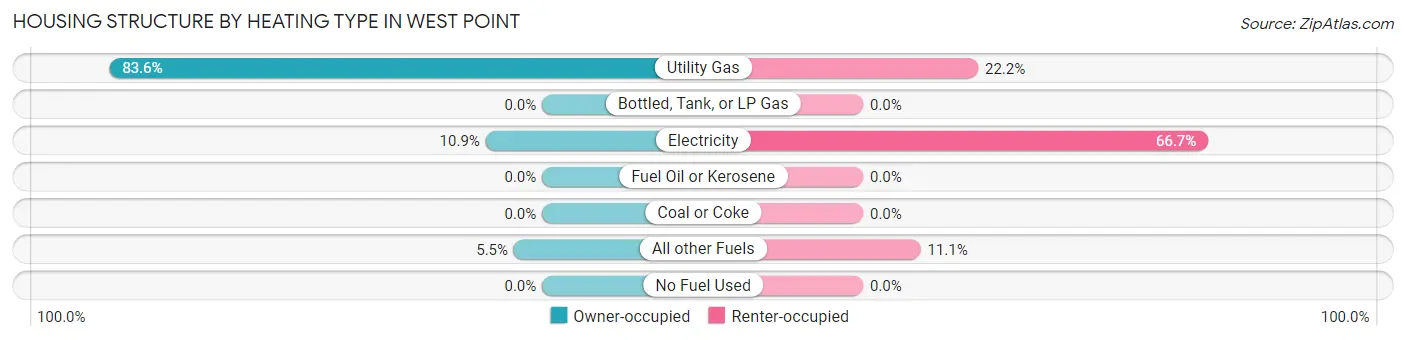
| Heating Type | Owner-occupied | Renter-occupied |
| Utility Gas | 46 (83.6%) | 2 (22.2%) |
| Bottled, Tank, or LP Gas | 0 (0.0%) | 0 (0.0%) |
| Electricity | 6 (10.9%) | 6 (66.7%) |
| Fuel Oil or Kerosene | 0 (0.0%) | 0 (0.0%) |
| Coal or Coke | 0 (0.0%) | 0 (0.0%) |
| All other Fuels | 3 (5.4%) | 1 (11.1%) |
| No Fuel Used | 0 (0.0%) | 0 (0.0%) |
| Total | 55 (100.0%) | 9 (100.0%) |
Household Vehicle Usage in West Point
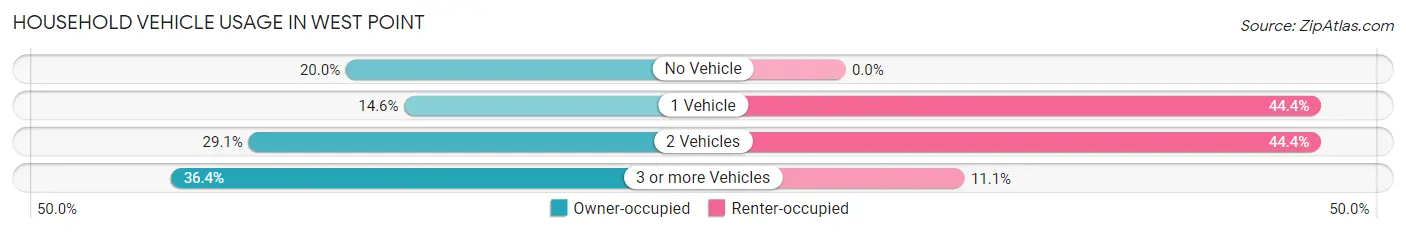
| Vehicles per Household | Owner-occupied | Renter-occupied |
| No Vehicle | 11 (20.0%) | 0 (0.0%) |
| 1 Vehicle | 8 (14.5%) | 4 (44.4%) |
| 2 Vehicles | 16 (29.1%) | 4 (44.4%) |
| 3 or more Vehicles | 20 (36.4%) | 1 (11.1%) |
| Total | 55 (100.0%) | 9 (100.0%) |
Real Estate & Mortgages in West Point
Real Estate and Mortgage Overview in West Point
| Characteristic | Without Mortgage | With Mortgage |
| Housing Units | 41 | 14 |
| Median Property Value | $34,200 | $51,700 |
| Median Household Income | $88,750 | $0 |
| Monthly Housing Costs | $370 | $0 |
| Real Estate Taxes | $265 | $2 |
Property Value by Mortgage Status in West Point
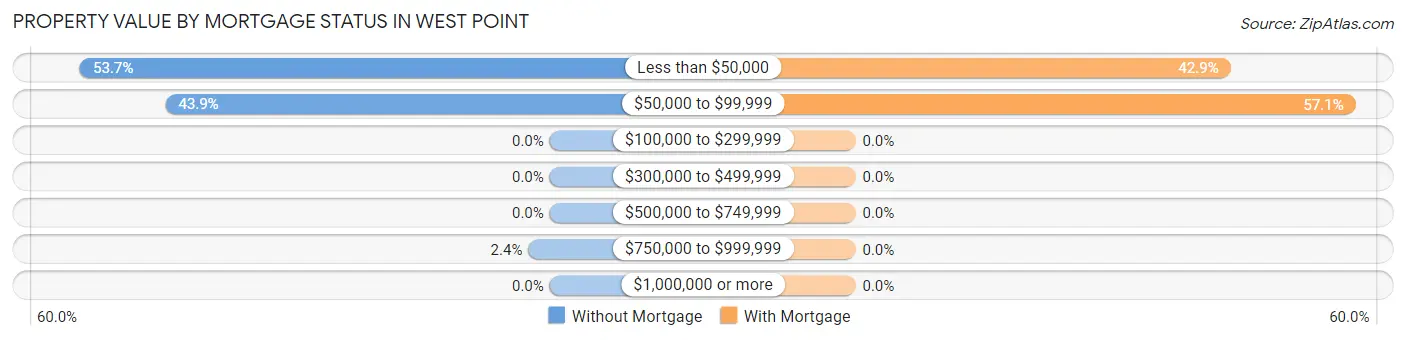
| Property Value | Without Mortgage | With Mortgage |
| Less than $50,000 | 22 (53.7%) | 6 (42.9%) |
| $50,000 to $99,999 | 18 (43.9%) | 8 (57.1%) |
| $100,000 to $299,999 | 0 (0.0%) | 0 (0.0%) |
| $300,000 to $499,999 | 0 (0.0%) | 0 (0.0%) |
| $500,000 to $749,999 | 0 (0.0%) | 0 (0.0%) |
| $750,000 to $999,999 | 1 (2.4%) | 0 (0.0%) |
| $1,000,000 or more | 0 (0.0%) | 0 (0.0%) |
| Total | 41 (100.0%) | 14 (100.0%) |
Household Income by Mortgage Status in West Point
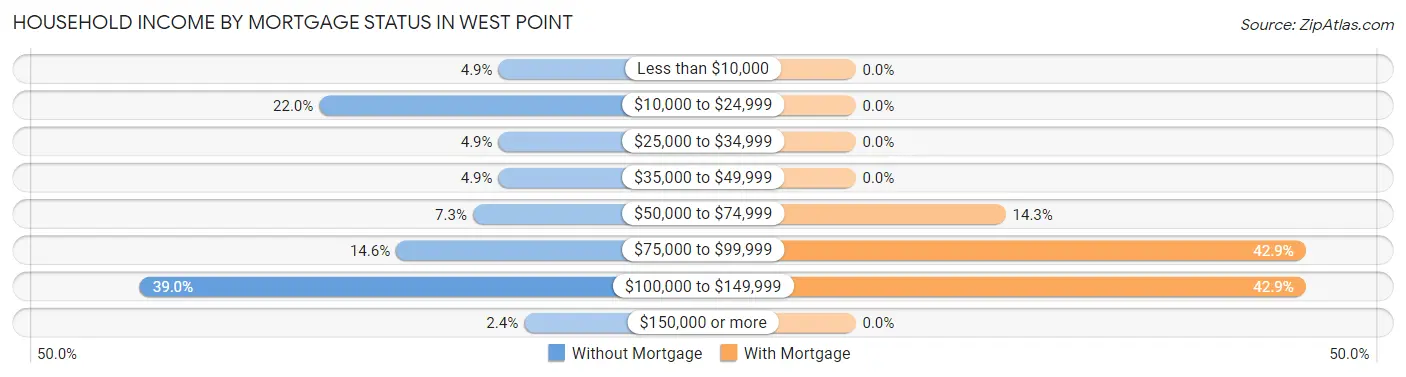
| Household Income | Without Mortgage | With Mortgage |
| Less than $10,000 | 2 (4.9%) | 0 (0.0%) |
| $10,000 to $24,999 | 9 (22.0%) | 0 (0.0%) |
| $25,000 to $34,999 | 2 (4.9%) | 0 (0.0%) |
| $35,000 to $49,999 | 2 (4.9%) | 0 (0.0%) |
| $50,000 to $74,999 | 3 (7.3%) | 2 (14.3%) |
| $75,000 to $99,999 | 6 (14.6%) | 6 (42.9%) |
| $100,000 to $149,999 | 16 (39.0%) | 6 (42.9%) |
| $150,000 or more | 1 (2.4%) | 0 (0.0%) |
| Total | 41 (100.0%) | 14 (100.0%) |
Property Value to Household Income Ratio in West Point
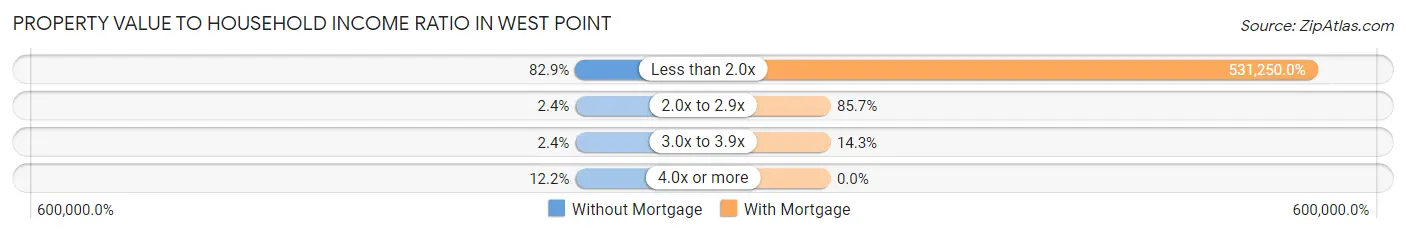
| Value-to-Income Ratio | Without Mortgage | With Mortgage |
| Less than 2.0x | 34 (82.9%) | 74,375 (531,250.0%) |
| 2.0x to 2.9x | 1 (2.4%) | 12 (85.7%) |
| 3.0x to 3.9x | 1 (2.4%) | 2 (14.3%) |
| 4.0x or more | 5 (12.2%) | 0 (0.0%) |
| Total | 41 (100.0%) | 14 (100.0%) |
Real Estate Taxes by Mortgage Status in West Point
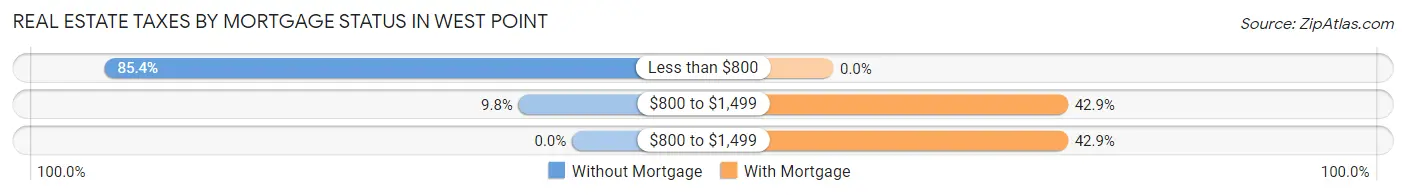
| Property Taxes | Without Mortgage | With Mortgage |
| Less than $800 | 35 (85.4%) | 0 (0.0%) |
| $800 to $1,499 | 4 (9.8%) | 6 (42.9%) |
| $800 to $1,499 | 0 (0.0%) | 6 (42.9%) |
| Total | 41 (100.0%) | 14 (100.0%) |
Health & Disability in West Point
Health Insurance Coverage by Age in West Point
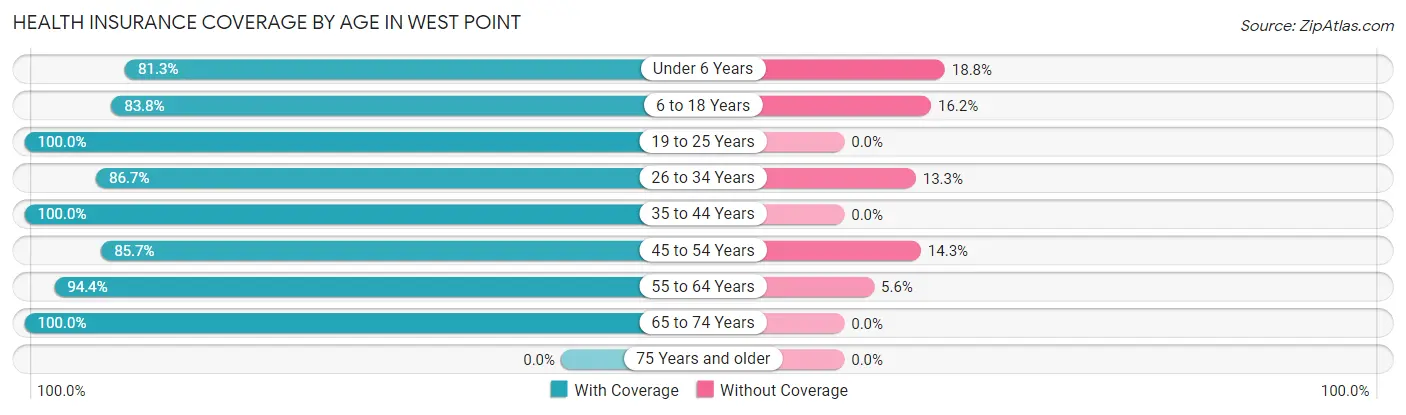
| Age Bracket | With Coverage | Without Coverage |
| Under 6 Years | 13 (81.2%) | 3 (18.8%) |
| 6 to 18 Years | 57 (83.8%) | 11 (16.2%) |
| 19 to 25 Years | 11 (100.0%) | 0 (0.0%) |
| 26 to 34 Years | 13 (86.7%) | 2 (13.3%) |
| 35 to 44 Years | 58 (100.0%) | 0 (0.0%) |
| 45 to 54 Years | 12 (85.7%) | 2 (14.3%) |
| 55 to 64 Years | 34 (94.4%) | 2 (5.6%) |
| 65 to 74 Years | 21 (100.0%) | 0 (0.0%) |
| 75 Years and older | 0 (0.0%) | 0 (0.0%) |
| Total | 219 (91.6%) | 20 (8.4%) |
Health Insurance Coverage by Citizenship Status in West Point
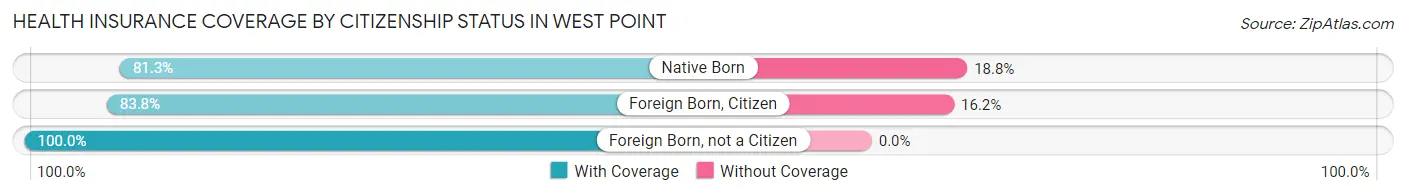
| Citizenship Status | With Coverage | Without Coverage |
| Native Born | 13 (81.2%) | 3 (18.8%) |
| Foreign Born, Citizen | 57 (83.8%) | 11 (16.2%) |
| Foreign Born, not a Citizen | 11 (100.0%) | 0 (0.0%) |
Health Insurance Coverage by Household Income in West Point
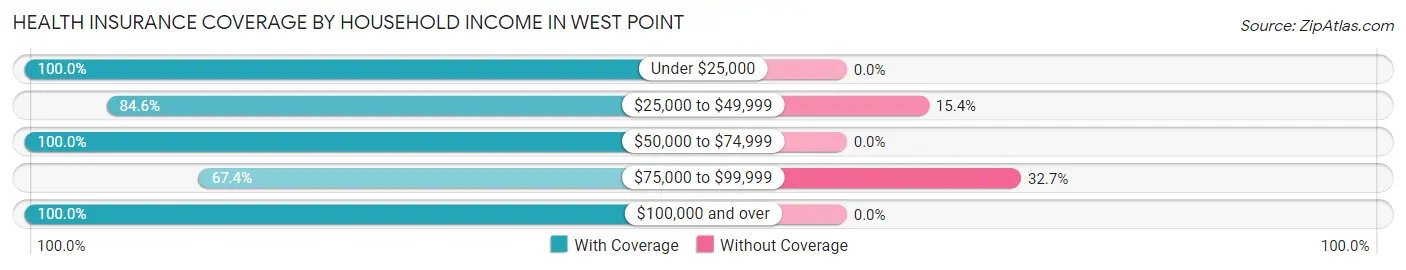
| Household Income | With Coverage | Without Coverage |
| Under $25,000 | 25 (100.0%) | 0 (0.0%) |
| $25,000 to $49,999 | 22 (84.6%) | 4 (15.4%) |
| $50,000 to $74,999 | 38 (100.0%) | 0 (0.0%) |
| $75,000 to $99,999 | 33 (67.3%) | 16 (32.7%) |
| $100,000 and over | 101 (100.0%) | 0 (0.0%) |
Public vs Private Health Insurance Coverage by Age in West Point
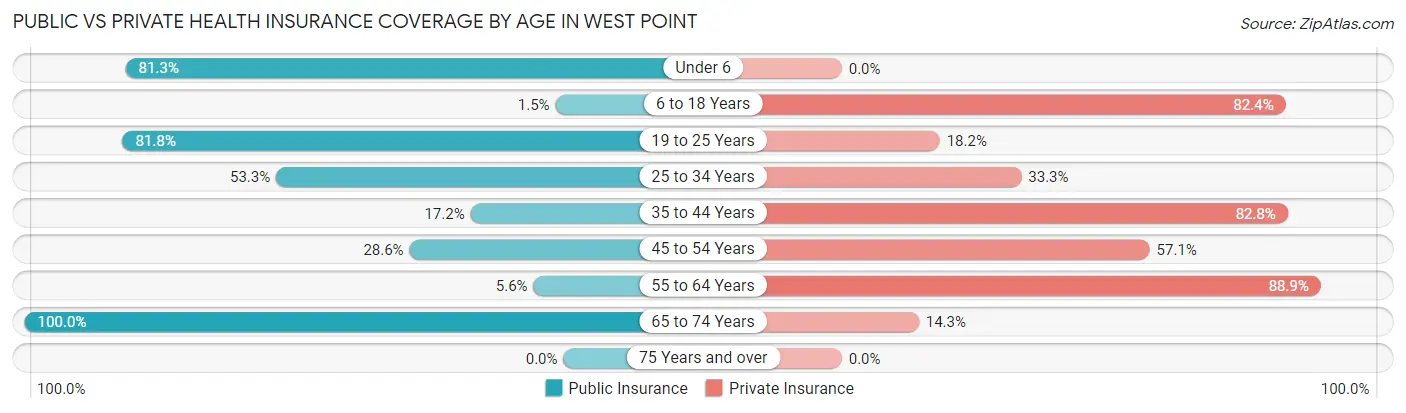
| Age Bracket | Public Insurance | Private Insurance |
| Under 6 | 13 (81.2%) | 0 (0.0%) |
| 6 to 18 Years | 1 (1.5%) | 56 (82.4%) |
| 19 to 25 Years | 9 (81.8%) | 2 (18.2%) |
| 25 to 34 Years | 8 (53.3%) | 5 (33.3%) |
| 35 to 44 Years | 10 (17.2%) | 48 (82.8%) |
| 45 to 54 Years | 4 (28.6%) | 8 (57.1%) |
| 55 to 64 Years | 2 (5.6%) | 32 (88.9%) |
| 65 to 74 Years | 21 (100.0%) | 3 (14.3%) |
| 75 Years and over | 0 (0.0%) | 0 (0.0%) |
| Total | 68 (28.4%) | 154 (64.4%) |
Disability Status by Sex by Age in West Point
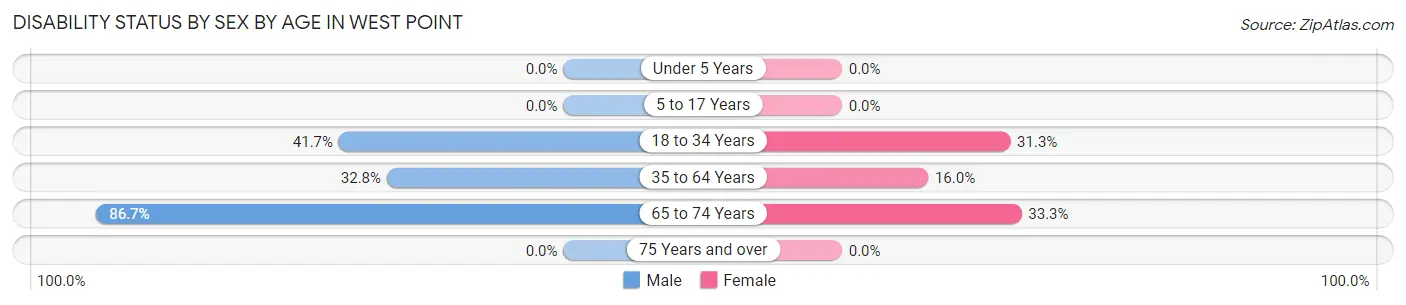
| Age Bracket | Male | Female |
| Under 5 Years | 0 (0.0%) | 0 (0.0%) |
| 5 to 17 Years | 0 (0.0%) | 0 (0.0%) |
| 18 to 34 Years | 5 (41.7%) | 5 (31.2%) |
| 35 to 64 Years | 19 (32.8%) | 8 (16.0%) |
| 65 to 74 Years | 13 (86.7%) | 2 (33.3%) |
| 75 Years and over | 0 (0.0%) | 0 (0.0%) |
Disability Class by Sex by Age in West Point
Disability Class: Hearing Difficulty
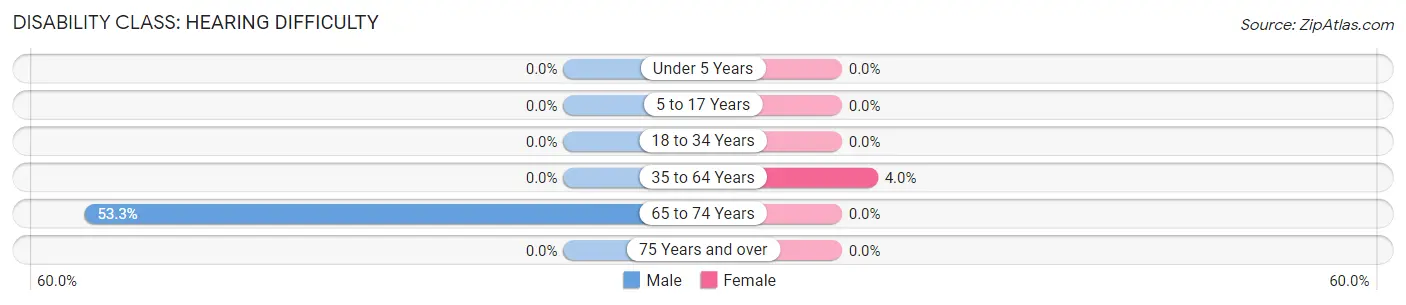
| Age Bracket | Male | Female |
| Under 5 Years | 0 (0.0%) | 0 (0.0%) |
| 5 to 17 Years | 0 (0.0%) | 0 (0.0%) |
| 18 to 34 Years | 0 (0.0%) | 0 (0.0%) |
| 35 to 64 Years | 0 (0.0%) | 2 (4.0%) |
| 65 to 74 Years | 8 (53.3%) | 0 (0.0%) |
| 75 Years and over | 0 (0.0%) | 0 (0.0%) |
Disability Class: Vision Difficulty
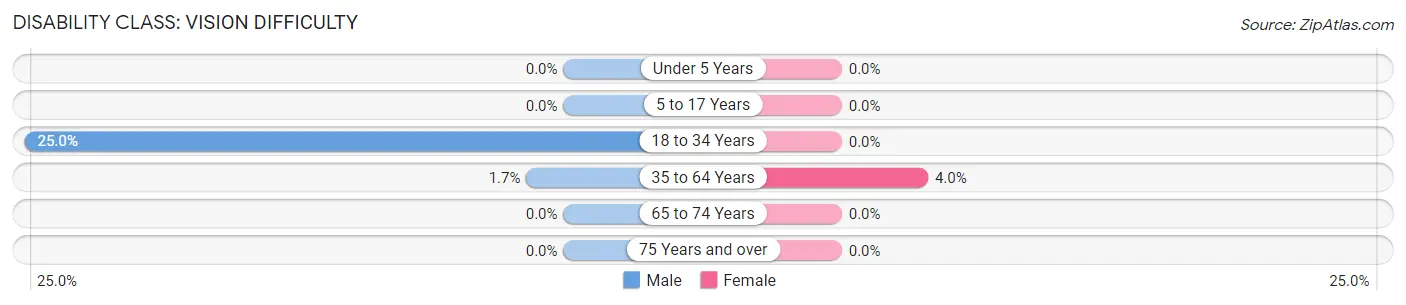
| Age Bracket | Male | Female |
| Under 5 Years | 0 (0.0%) | 0 (0.0%) |
| 5 to 17 Years | 0 (0.0%) | 0 (0.0%) |
| 18 to 34 Years | 3 (25.0%) | 0 (0.0%) |
| 35 to 64 Years | 1 (1.7%) | 2 (4.0%) |
| 65 to 74 Years | 0 (0.0%) | 0 (0.0%) |
| 75 Years and over | 0 (0.0%) | 0 (0.0%) |
Disability Class: Cognitive Difficulty
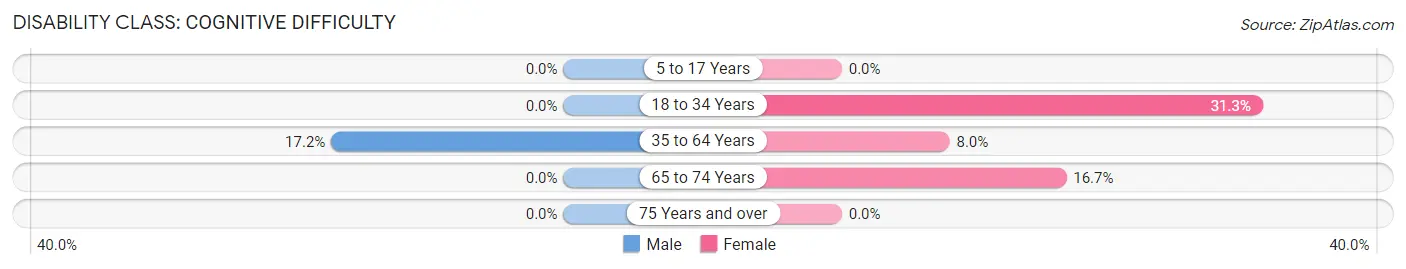
| Age Bracket | Male | Female |
| 5 to 17 Years | 0 (0.0%) | 0 (0.0%) |
| 18 to 34 Years | 0 (0.0%) | 5 (31.2%) |
| 35 to 64 Years | 10 (17.2%) | 4 (8.0%) |
| 65 to 74 Years | 0 (0.0%) | 1 (16.7%) |
| 75 Years and over | 0 (0.0%) | 0 (0.0%) |
Disability Class: Ambulatory Difficulty
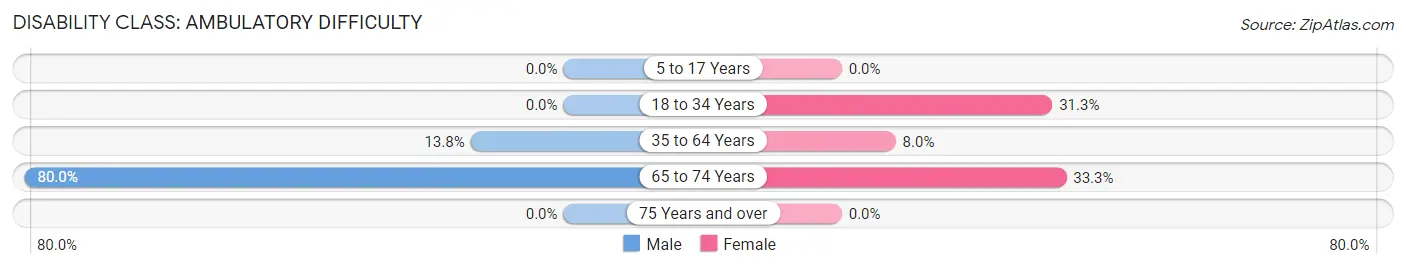
| Age Bracket | Male | Female |
| 5 to 17 Years | 0 (0.0%) | 0 (0.0%) |
| 18 to 34 Years | 0 (0.0%) | 5 (31.2%) |
| 35 to 64 Years | 8 (13.8%) | 4 (8.0%) |
| 65 to 74 Years | 12 (80.0%) | 2 (33.3%) |
| 75 Years and over | 0 (0.0%) | 0 (0.0%) |
Disability Class: Self-Care Difficulty
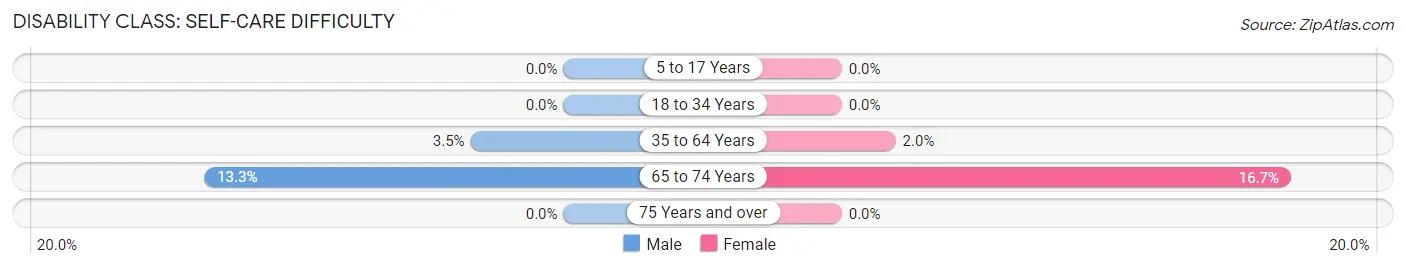
| Age Bracket | Male | Female |
| 5 to 17 Years | 0 (0.0%) | 0 (0.0%) |
| 18 to 34 Years | 0 (0.0%) | 0 (0.0%) |
| 35 to 64 Years | 2 (3.5%) | 1 (2.0%) |
| 65 to 74 Years | 2 (13.3%) | 1 (16.7%) |
| 75 Years and over | 0 (0.0%) | 0 (0.0%) |
Technology Access in West Point
Computing Device Access in West Point
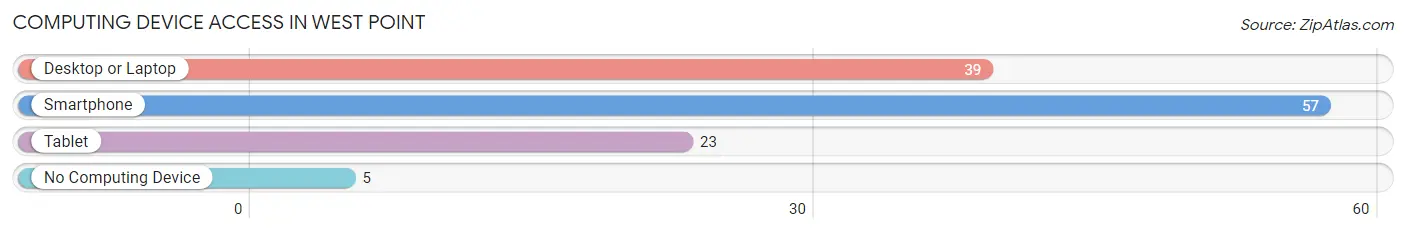
| Device Type | # Households | % Households |
| Desktop or Laptop | 39 | 60.9% |
| Smartphone | 57 | 89.1% |
| Tablet | 23 | 35.9% |
| No Computing Device | 5 | 7.8% |
| Total | 64 | 100.0% |
Internet Access in West Point
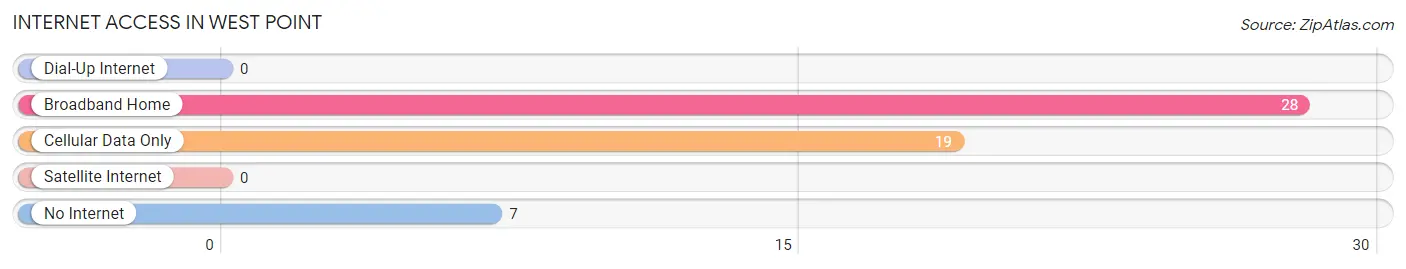
| Internet Type | # Households | % Households |
| Dial-Up Internet | 0 | 0.0% |
| Broadband Home | 28 | 43.8% |
| Cellular Data Only | 19 | 29.7% |
| Satellite Internet | 0 | 0.0% |
| No Internet | 7 | 10.9% |
| Total | 64 | 100.0% |
West Point Summary
West Point is a small village located in the state of Illinois, United States. It is situated in the county of Tazewell, and is part of the Peoria Metropolitan Statistical Area. The village has a population of approximately 1,000 people, and is located about 10 miles south of the city of Peoria.
History
West Point was first settled in 1837 by a group of settlers from New York. The village was originally known as “West Point Settlement”, and was named after the nearby West Point Township. The village was officially incorporated in 1867, and the first mayor was elected in 1868.
In the late 19th century, West Point was a thriving agricultural community, with many farms and businesses. The village was also home to a number of churches, including the Methodist Episcopal Church, the Presbyterian Church, and the Baptist Church.
In the early 20th century, West Point began to experience a decline in population, as many of the residents moved away to larger cities. The village was also affected by the Great Depression, and many of the businesses closed.
Geography
West Point is located in the central part of the state of Illinois, in the county of Tazewell. The village is situated on the banks of the Illinois River, and is about 10 miles south of the city of Peoria.
The village has a total area of 0.7 square miles, all of which is land. The terrain is mostly flat, with some rolling hills in the surrounding area. The climate is humid continental, with hot summers and cold winters.
Economy
West Point’s economy is largely based on agriculture and tourism. The village is home to several farms, which produce a variety of crops, including corn, soybeans, and wheat. The village also has a number of small businesses, including restaurants, shops, and a few manufacturing companies.
Tourism is also an important part of the local economy. The village is home to several historic sites, including the West Point Cemetery, the West Point Methodist Church, and the West Point Schoolhouse. The village also hosts a number of festivals and events throughout the year, including the West Point Festival and the West Point Car Show.
Demographics
As of the 2010 census, West Point had a population of 1,000 people. The racial makeup of the village was 97.2% White, 0.7% African American, 0.2% Native American, 0.2% Asian, 0.2% from other races, and 1.7% from two or more races. Hispanic or Latino of any race were 1.2% of the population.
The median household income in West Point was $45,000, and the median family income was $50,000. The per capita income for the village was $20,000. About 8.3% of families and 10.2% of the population were below the poverty line, including 14.3% of those under age 18 and 5.2% of those age 65 or over.
Conclusion
West Point is a small village located in the state of Illinois, United States. It is situated in the county of Tazewell, and is part of the Peoria Metropolitan Statistical Area. The village has a population of approximately 1,000 people, and is located about 10 miles south of the city of Peoria. West Point’s economy is largely based on agriculture and tourism, and the village is home to several historic sites. The racial makeup of the village is mostly White, with a small percentage of African American, Native American, and Asian residents. The median household income in West Point is $45,000, and the per capita income is $20,000.
Common Questions
What is Per Capita Income in West Point?
Per Capita income in West Point is $24,423.
What is the Median Family Income in West Point?
Median Family Income in West Point is $83,750.
What is the Median Household income in West Point?
Median Household Income in West Point is $73,750.
What is Income or Wage Gap in West Point?
Income or Wage Gap in West Point is 40.7%.
Women in West Point earn 59.3 cents for every dollar earned by a man.
What is Inequality or Gini Index in West Point?
Inequality or Gini Index in West Point is 0.35.
What is the Total Population of West Point?
Total Population of West Point is 239.
What is the Total Male Population of West Point?
Total Male Population of West Point is 114.
What is the Total Female Population of West Point?
Total Female Population of West Point is 125.
What is the Ratio of Males per 100 Females in West Point?
There are 91.20 Males per 100 Females in West Point.
What is the Ratio of Females per 100 Males in West Point?
There are 109.65 Females per 100 Males in West Point.
What is the Median Population Age in West Point?
Median Population Age in West Point is 35.5 Years.
What is the Average Family Size in West Point
Average Family Size in West Point is 4.2 People.
What is the Average Household Size in West Point
Average Household Size in West Point is 3.7 People.
How Large is the Labor Force in West Point?
There are 90 People in the Labor Forcein in West Point.
What is the Percentage of People in the Labor Force in West Point?
48.6% of People are in the Labor Force in West Point.