Langleyville, IL Map & Demographics
Langleyville Map
Langleyville Overview
$32,085
PER CAPITA INCOME
$64,167
AVG FAMILY INCOME
$70,179
AVG HOUSEHOLD INCOME
43.3%
WAGE / INCOME GAP [ % ]
56.7¢/ $1
WAGE / INCOME GAP [ $ ]
0.27
INEQUALITY / GINI INDEX
342
TOTAL POPULATION
128
MALE POPULATION
214
FEMALE POPULATION
59.81
MALES / 100 FEMALES
167.19
FEMALES / 100 MALES
65.1
MEDIAN AGE
2.3
AVG FAMILY SIZE
2.4
AVG HOUSEHOLD SIZE
112
LABOR FORCE [ PEOPLE ]
40.4%
PERCENT IN LABOR FORCE
Langleyville Area Codes
Income in Langleyville
Income Overview in Langleyville
Per Capita Income in Langleyville is $32,085, while median incomes of families and households are $64,167 and $70,179 respectively.
| Characteristic | Number | Measure |
| Per Capita Income | 342 | $32,085 |
| Median Family Income | 116 | $64,167 |
| Mean Family Income | 116 | $65,828 |
| Median Household Income | 142 | $70,179 |
| Mean Household Income | 142 | $72,357 |
| Income Deficit | 116 | $0 |
| Wage / Income Gap (%) | 342 | 43.29% |
| Wage / Income Gap ($) | 342 | 56.71¢ per $1 |
| Gini / Inequality Index | 342 | 0.27 |
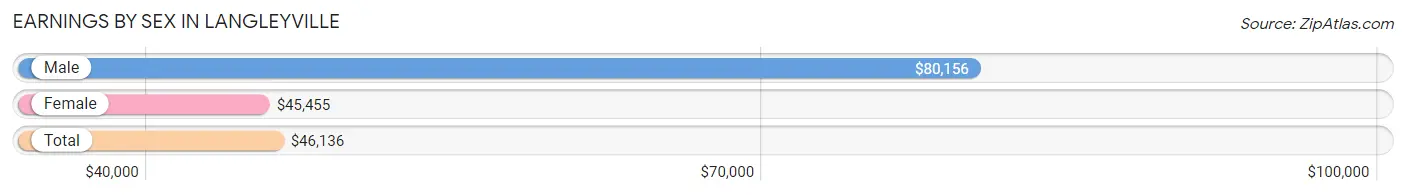
Earnings by Sex in Langleyville
Average Earnings in Langleyville are $46,136, $80,156 for men and $45,455 for women, a difference of 43.3%.
| Sex | Number | Average Earnings |
| Male | 30 (26.8%) | $80,156 |
| Female | 82 (73.2%) | $45,455 |
| Total | 112 (100.0%) | $46,136 |
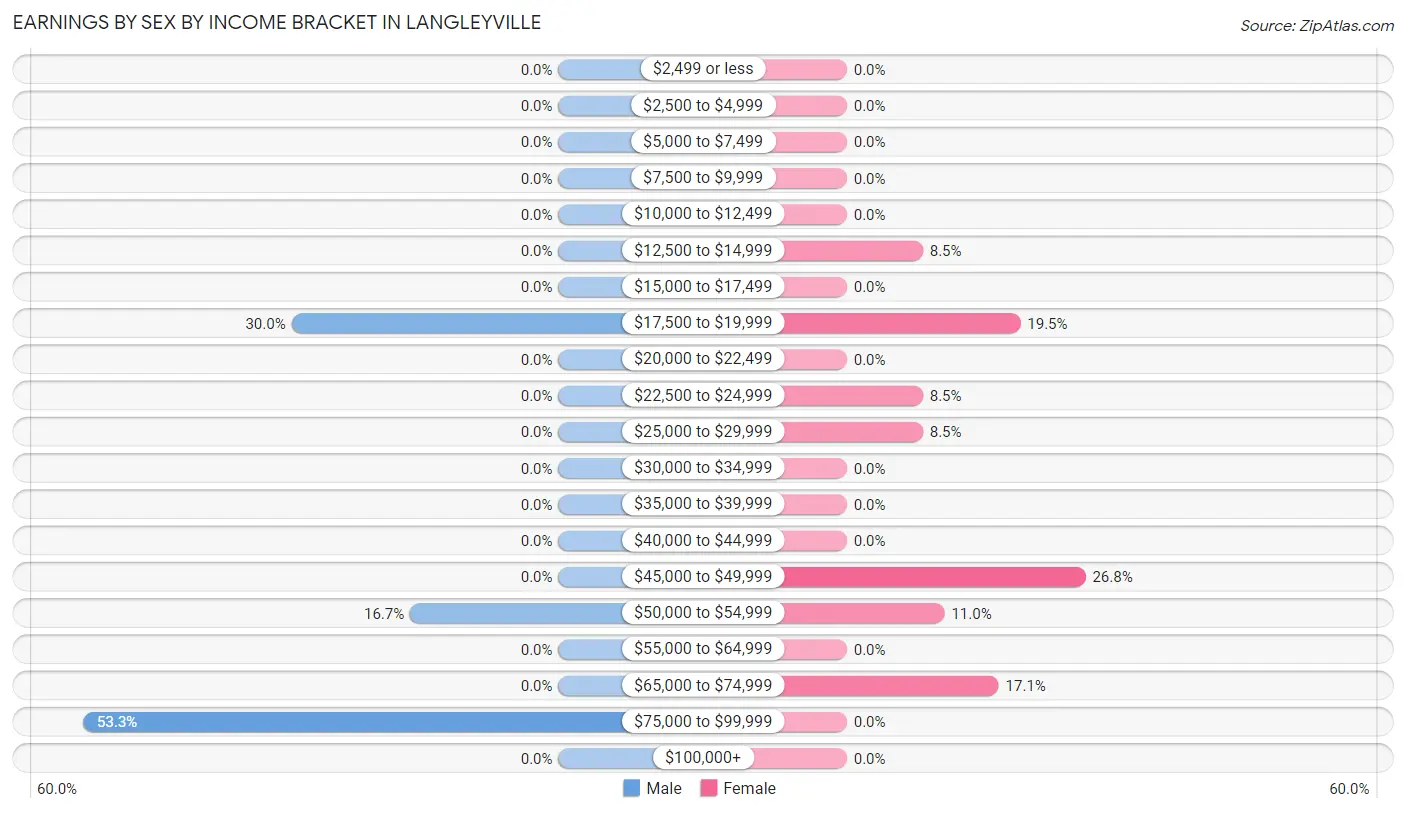
Earnings by Sex by Income Bracket in Langleyville
The most common earnings brackets in Langleyville are $75,000 to $99,999 for men (16 | 53.3%) and $45,000 to $49,999 for women (22 | 26.8%).
| Income | Male | Female |
| $2,499 or less | 0 (0.0%) | 0 (0.0%) |
| $2,500 to $4,999 | 0 (0.0%) | 0 (0.0%) |
| $5,000 to $7,499 | 0 (0.0%) | 0 (0.0%) |
| $7,500 to $9,999 | 0 (0.0%) | 0 (0.0%) |
| $10,000 to $12,499 | 0 (0.0%) | 0 (0.0%) |
| $12,500 to $14,999 | 0 (0.0%) | 7 (8.5%) |
| $15,000 to $17,499 | 0 (0.0%) | 0 (0.0%) |
| $17,500 to $19,999 | 9 (30.0%) | 16 (19.5%) |
| $20,000 to $22,499 | 0 (0.0%) | 0 (0.0%) |
| $22,500 to $24,999 | 0 (0.0%) | 7 (8.5%) |
| $25,000 to $29,999 | 0 (0.0%) | 7 (8.5%) |
| $30,000 to $34,999 | 0 (0.0%) | 0 (0.0%) |
| $35,000 to $39,999 | 0 (0.0%) | 0 (0.0%) |
| $40,000 to $44,999 | 0 (0.0%) | 0 (0.0%) |
| $45,000 to $49,999 | 0 (0.0%) | 22 (26.8%) |
| $50,000 to $54,999 | 5 (16.7%) | 9 (11.0%) |
| $55,000 to $64,999 | 0 (0.0%) | 0 (0.0%) |
| $65,000 to $74,999 | 0 (0.0%) | 14 (17.1%) |
| $75,000 to $99,999 | 16 (53.3%) | 0 (0.0%) |
| $100,000+ | 0 (0.0%) | 0 (0.0%) |
| Total | 30 (100.0%) | 82 (100.0%) |
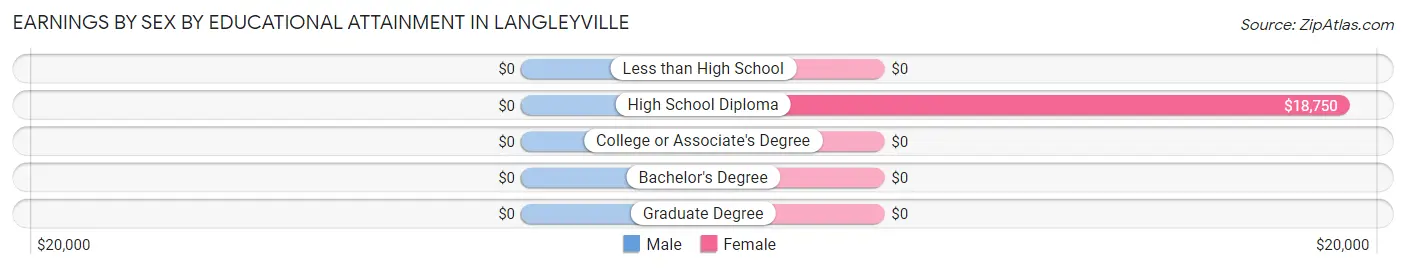
Earnings by Sex by Educational Attainment in Langleyville
| Educational Attainment | Male Income | Female Income |
| Less than High School | - | - |
| High School Diploma | - | - |
| College or Associate's Degree | - | - |
| Bachelor's Degree | - | - |
| Graduate Degree | - | - |
| Total | $80,156 | $45,455 |
Family Income in Langleyville
Family Income Brackets in Langleyville
According to the Langleyville family income data, there are 52 families falling into the $35,000 to $49,999 income range, which is the most common income bracket and makes up 44.8% of all families.
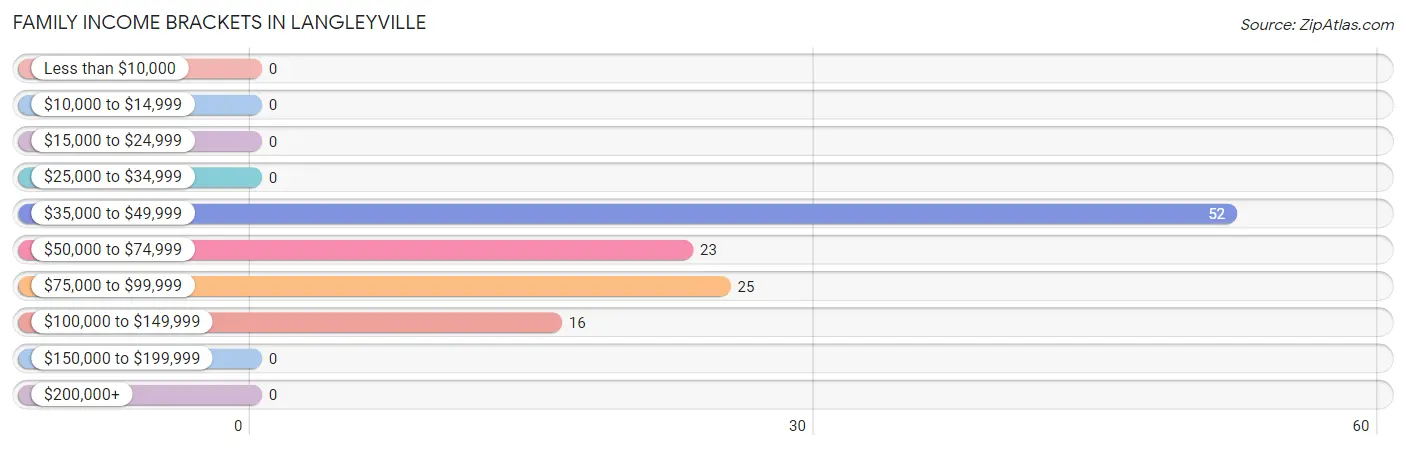
| Income Bracket | # Families | % Families |
| Less than $10,000 | 0 | 0.0% |
| $10,000 to $14,999 | 0 | 0.0% |
| $15,000 to $24,999 | 0 | 0.0% |
| $25,000 to $34,999 | 0 | 0.0% |
| $35,000 to $49,999 | 52 | 44.8% |
| $50,000 to $74,999 | 23 | 19.8% |
| $75,000 to $99,999 | 25 | 21.6% |
| $100,000 to $149,999 | 16 | 13.8% |
| $150,000 to $199,999 | 0 | 0.0% |
| $200,000+ | 0 | 0.0% |
Family Income by Famaliy Size in Langleyville
2-person families (107 | 92.2%) account for the highest median family income in Langleyville with $70,268 per family, while 2-person families (107 | 92.2%) have the highest median income of $35,134 per family member.
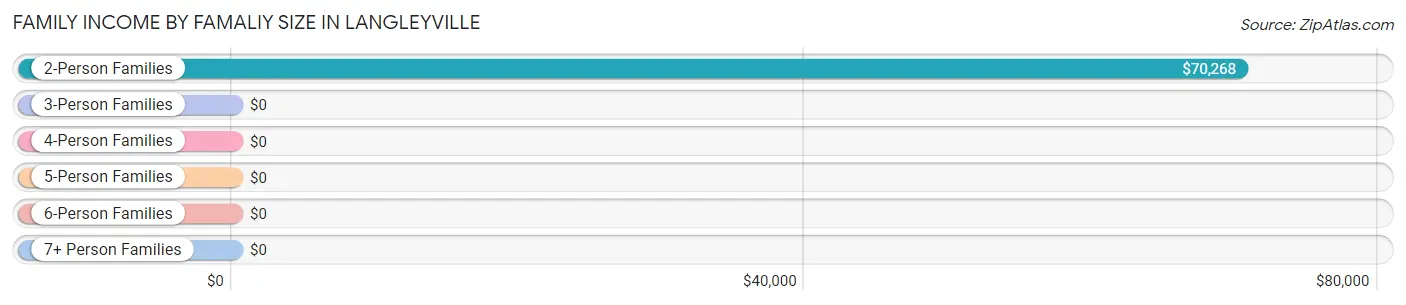
| Income Bracket | # Families | Median Income |
| 2-Person Families | 107 (92.2%) | $70,268 |
| 3-Person Families | 0 (0.0%) | $0 |
| 4-Person Families | 0 (0.0%) | $0 |
| 5-Person Families | 0 (0.0%) | $0 |
| 6-Person Families | 9 (7.8%) | $0 |
| 7+ Person Families | 0 (0.0%) | $0 |
| Total | 116 (100.0%) | $64,167 |
Family Income by Number of Earners in Langleyville
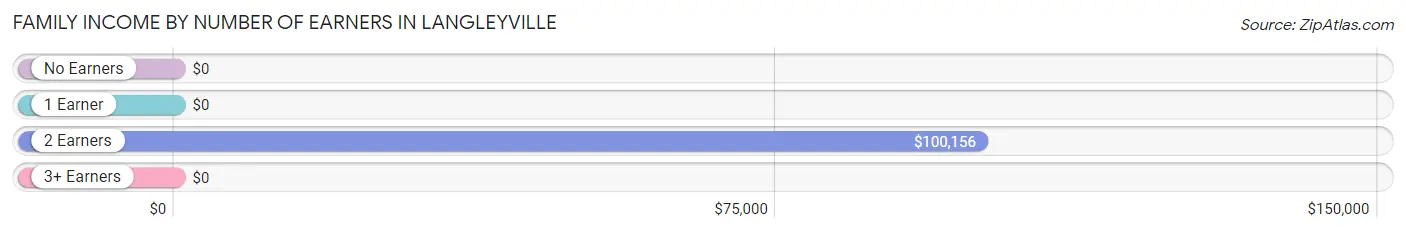
| Number of Earners | # Families | Median Income |
| No Earners | 50 (43.1%) | $0 |
| 1 Earner | 36 (31.0%) | $0 |
| 2 Earners | 30 (25.9%) | $100,156 |
| 3+ Earners | 0 (0.0%) | $0 |
| Total | 116 (100.0%) | $64,167 |
Household Income in Langleyville
Household Income Brackets in Langleyville
With 52 households falling in the category, the $35,000 to $49,999 income range is the most frequent in Langleyville, accounting for 36.6% of all households.
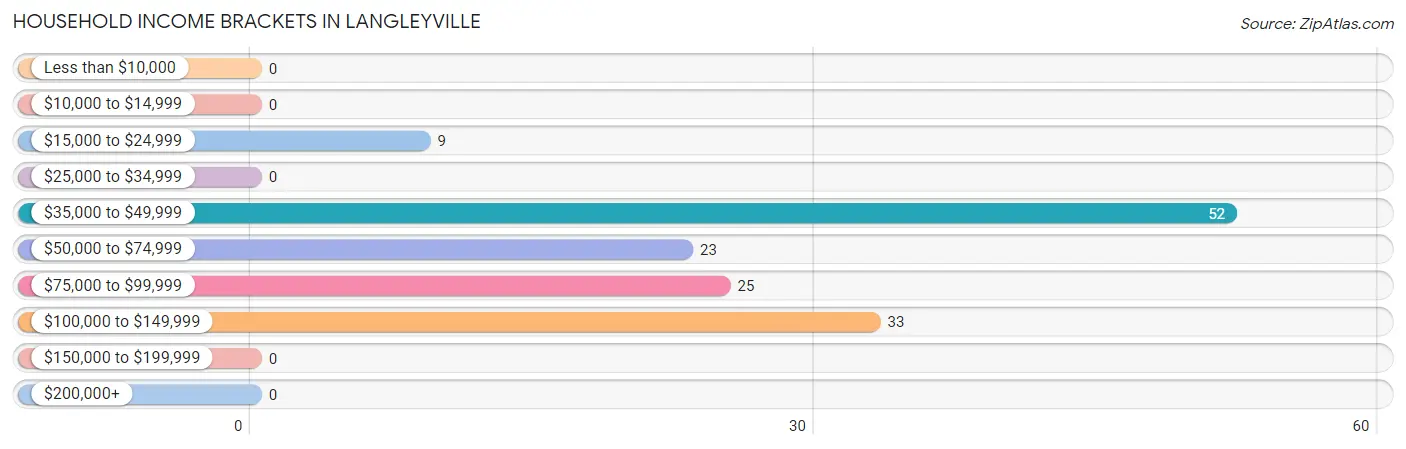
| Income Bracket | # Households | % Households |
| Less than $10,000 | 0 | 0.0% |
| $10,000 to $14,999 | 0 | 0.0% |
| $15,000 to $24,999 | 9 | 6.3% |
| $25,000 to $34,999 | 0 | 0.0% |
| $35,000 to $49,999 | 52 | 36.6% |
| $50,000 to $74,999 | 23 | 16.2% |
| $75,000 to $99,999 | 25 | 17.6% |
| $100,000 to $149,999 | 33 | 23.2% |
| $150,000 to $199,999 | 0 | 0.0% |
| $200,000+ | 0 | 0.0% |
Household Income by Householder Age in Langleyville
The median household income in Langleyville is $70,179, with the highest median household income of $92,750 found in the 65+ years age bracket for the primary householder. A total of 82 households (57.8%) fall into this category.
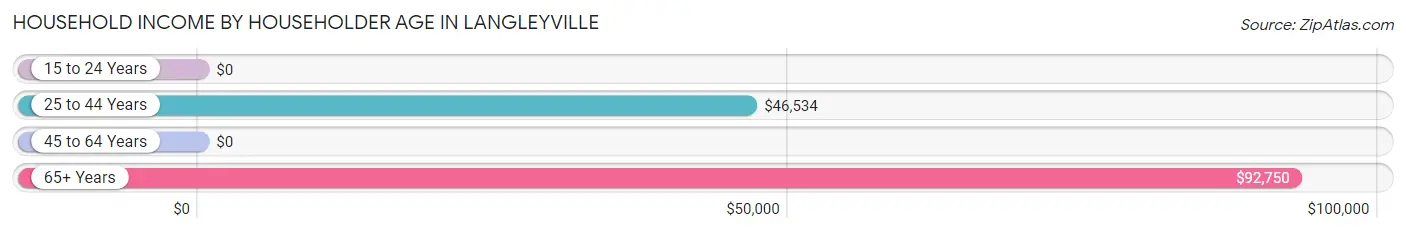
| Income Bracket | # Households | Median Income |
| 15 to 24 Years | 0 (0.0%) | $0 |
| 25 to 44 Years | 45 (31.7%) | $46,534 |
| 45 to 64 Years | 15 (10.6%) | $0 |
| 65+ Years | 82 (57.8%) | $92,750 |
| Total | 142 (100.0%) | $70,179 |
Poverty in Langleyville
Income Below Poverty by Sex and Age in Langleyville
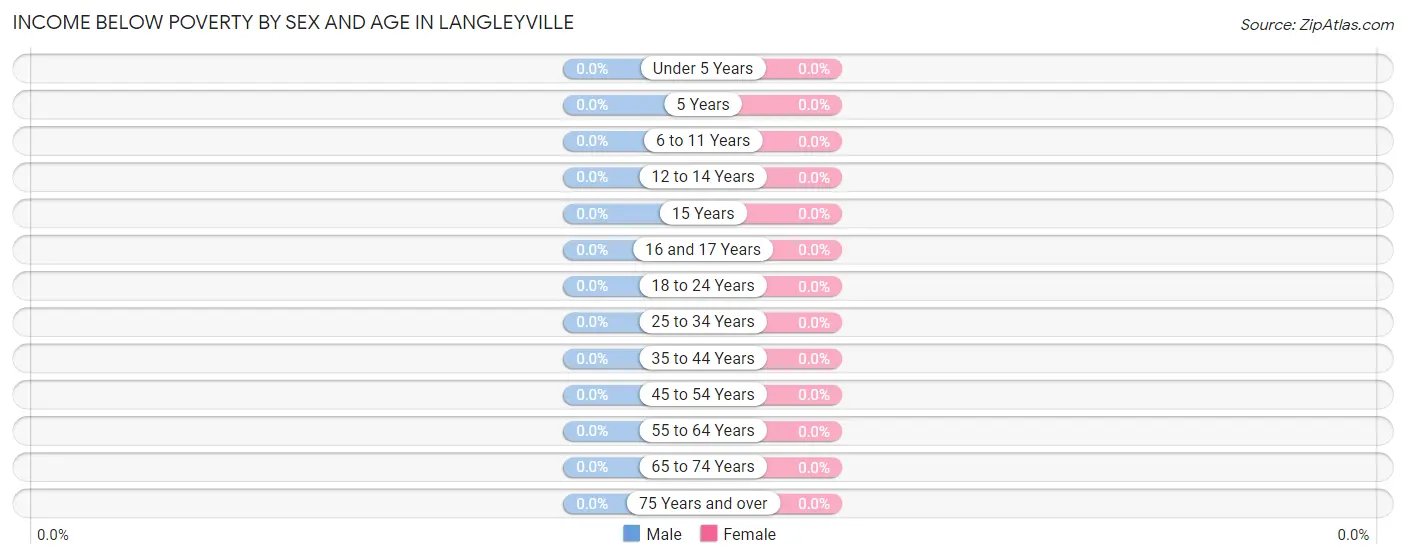
| Age Bracket | Male | Female |
| Under 5 Years | 0 (0.0%) | 0 (0.0%) |
| 5 Years | 0 (0.0%) | 0 (0.0%) |
| 6 to 11 Years | 0 (0.0%) | 0 (0.0%) |
| 12 to 14 Years | 0 (0.0%) | 0 (0.0%) |
| 15 Years | 0 (0.0%) | 0 (0.0%) |
| 16 and 17 Years | 0 (0.0%) | 0 (0.0%) |
| 18 to 24 Years | 0 (0.0%) | 0 (0.0%) |
| 25 to 34 Years | 0 (0.0%) | 0 (0.0%) |
| 35 to 44 Years | 0 (0.0%) | 0 (0.0%) |
| 45 to 54 Years | 0 (0.0%) | 0 (0.0%) |
| 55 to 64 Years | 0 (0.0%) | 0 (0.0%) |
| 65 to 74 Years | 0 (0.0%) | 0 (0.0%) |
| 75 Years and over | 0 (0.0%) | 0 (0.0%) |
| Total | 0 (0.0%) | 0 (0.0%) |
Income Above Poverty by Sex and Age in Langleyville
According to the poverty statistics in Langleyville, males aged under 5 years and females aged 6 to 11 years are the age groups that are most secure financially, with 100.0% of males and 100.0% of females in these age groups living above the poverty line.
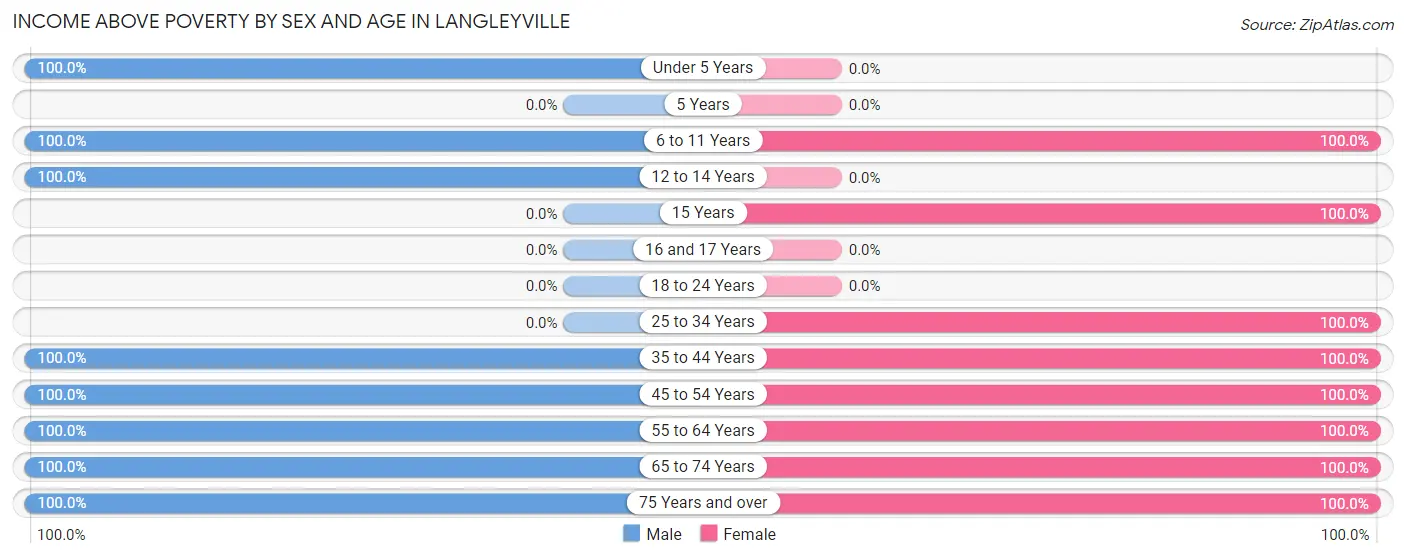
| Age Bracket | Male | Female |
| Under 5 Years | 15 (100.0%) | 0 (0.0%) |
| 5 Years | 0 (0.0%) | 0 (0.0%) |
| 6 to 11 Years | 13 (100.0%) | 9 (100.0%) |
| 12 to 14 Years | 10 (100.0%) | 0 (0.0%) |
| 15 Years | 0 (0.0%) | 18 (100.0%) |
| 16 and 17 Years | 0 (0.0%) | 0 (0.0%) |
| 18 to 24 Years | 0 (0.0%) | 0 (0.0%) |
| 25 to 34 Years | 0 (0.0%) | 29 (100.0%) |
| 35 to 44 Years | 9 (100.0%) | 14 (100.0%) |
| 45 to 54 Years | 10 (100.0%) | 16 (100.0%) |
| 55 to 64 Years | 5 (100.0%) | 16 (100.0%) |
| 65 to 74 Years | 57 (100.0%) | 105 (100.0%) |
| 75 Years and over | 9 (100.0%) | 7 (100.0%) |
| Total | 128 (100.0%) | 214 (100.0%) |
Income Below Poverty Among Married-Couple Families in Langleyville
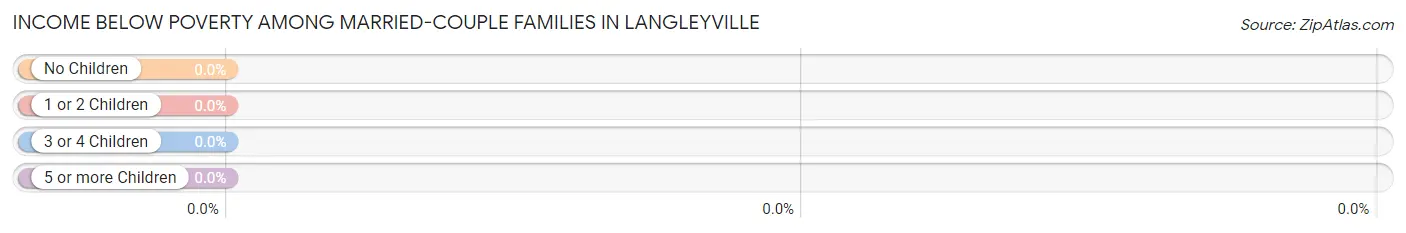
| Children | Above Poverty | Below Poverty |
| No Children | 62 (100.0%) | 0 (0.0%) |
| 1 or 2 Children | 0 (0.0%) | 0 (0.0%) |
| 3 or 4 Children | 9 (100.0%) | 0 (0.0%) |
| 5 or more Children | 0 (0.0%) | 0 (0.0%) |
| Total | 71 (100.0%) | 0 (0.0%) |
Income Below Poverty Among Single-Parent Households in Langleyville
| Children | Single Father | Single Mother |
| No Children | 0 (0.0%) | 0 (0.0%) |
| 1 or 2 Children | 0 (0.0%) | 0 (0.0%) |
| 3 or 4 Children | 0 (0.0%) | 0 (0.0%) |
| 5 or more Children | 0 (0.0%) | 0 (0.0%) |
| Total | 0 (0.0%) | 0 (0.0%) |
Income Below Poverty Among Married-Couple vs Single-Parent Households in Langleyville
| Children | Married-Couple Families | Single-Parent Households |
| No Children | 0 (0.0%) | 0 (0.0%) |
| 1 or 2 Children | 0 (0.0%) | 0 (0.0%) |
| 3 or 4 Children | 0 (0.0%) | 0 (0.0%) |
| 5 or more Children | 0 (0.0%) | 0 (0.0%) |
| Total | 0 (0.0%) | 0 (0.0%) |
Race in Langleyville
The most populous races in Langleyville are , and White / Caucasian (342 | 100.0%).
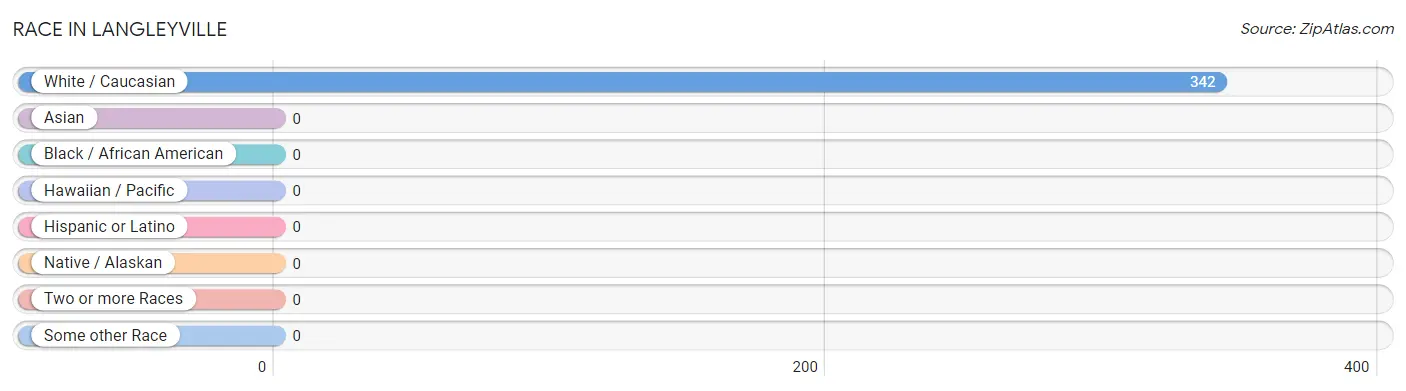
| Race | # Population | % Population |
| Asian | 0 | 0.0% |
| Black / African American | 0 | 0.0% |
| Hawaiian / Pacific | 0 | 0.0% |
| Hispanic or Latino | 0 | 0.0% |
| Native / Alaskan | 0 | 0.0% |
| White / Caucasian | 342 | 100.0% |
| Two or more Races | 0 | 0.0% |
| Some other Race | 0 | 0.0% |
| Total | 342 | 100.0% |
Ancestry in Langleyville
The most populous ancestries reported in Langleyville are American (155 | 45.3%), German (51 | 14.9%), English (48 | 14.0%), Italian (40 | 11.7%), and Swedish (40 | 11.7%), together accounting for 97.7% of all Langleyville residents.
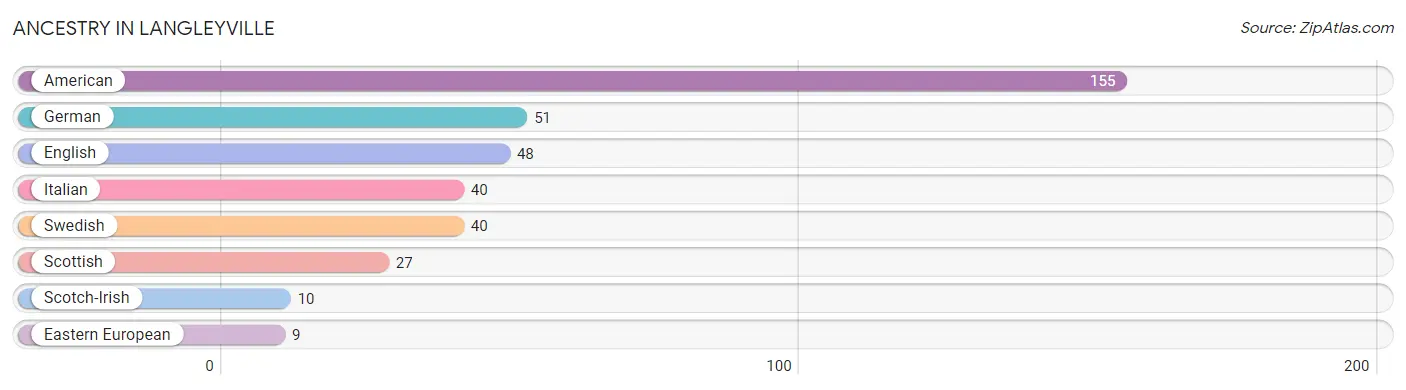
| Ancestry | # Population | % Population |
| American | 155 | 45.3% |
| Eastern European | 9 | 2.6% |
| English | 48 | 14.0% |
| German | 51 | 14.9% |
| Italian | 40 | 11.7% |
| Scotch-Irish | 10 | 2.9% |
| Scottish | 27 | 7.9% |
| Swedish | 40 | 11.7% | View All 8 Rows |
Immigrants in Langleyville

| Immigration Origin | # Population | % Population | View All 0 Rows |
Sex and Age in Langleyville
Sex and Age in Langleyville
The most populous age groups in Langleyville are 65 to 69 Years (37 | 28.9%) for men and 70 to 74 Years (68 | 31.8%) for women.
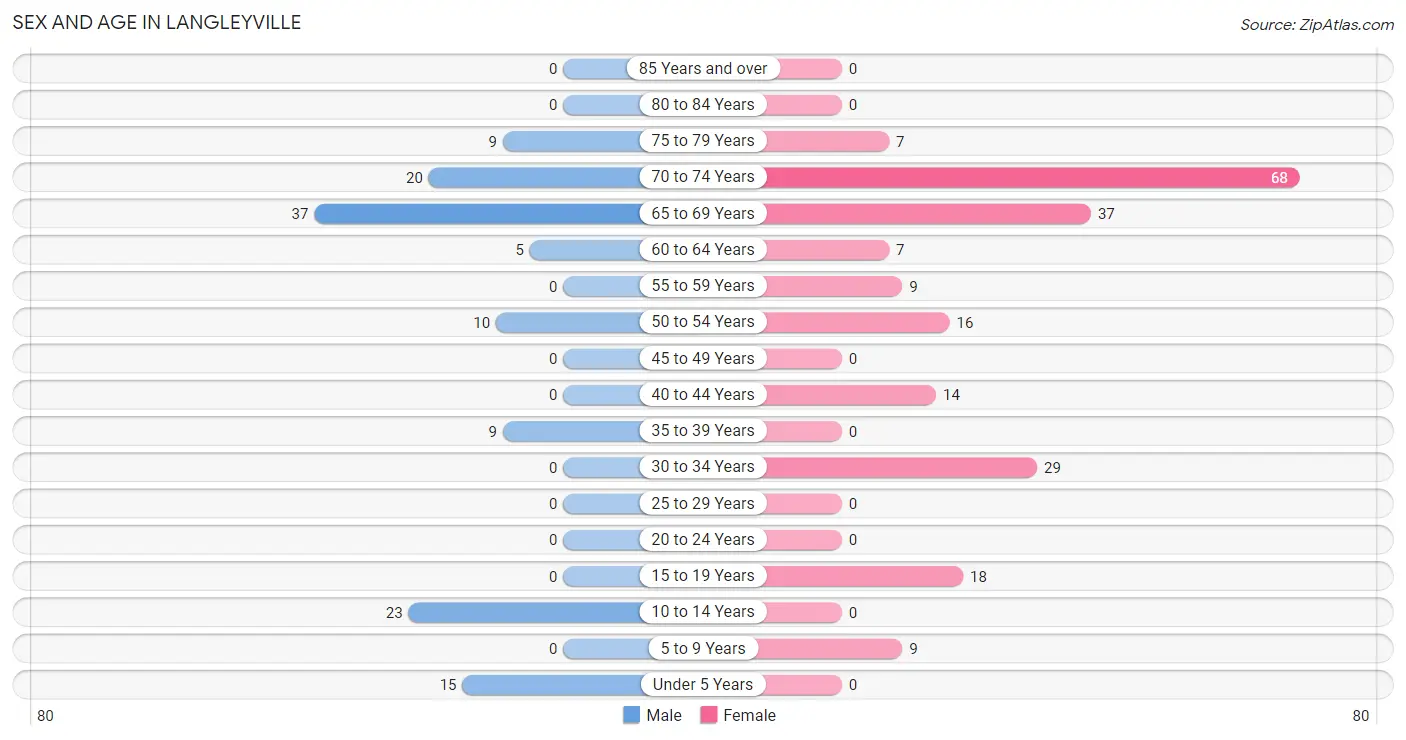
| Age Bracket | Male | Female |
| Under 5 Years | 15 (11.7%) | 0 (0.0%) |
| 5 to 9 Years | 0 (0.0%) | 9 (4.2%) |
| 10 to 14 Years | 23 (18.0%) | 0 (0.0%) |
| 15 to 19 Years | 0 (0.0%) | 18 (8.4%) |
| 20 to 24 Years | 0 (0.0%) | 0 (0.0%) |
| 25 to 29 Years | 0 (0.0%) | 0 (0.0%) |
| 30 to 34 Years | 0 (0.0%) | 29 (13.6%) |
| 35 to 39 Years | 9 (7.0%) | 0 (0.0%) |
| 40 to 44 Years | 0 (0.0%) | 14 (6.5%) |
| 45 to 49 Years | 0 (0.0%) | 0 (0.0%) |
| 50 to 54 Years | 10 (7.8%) | 16 (7.5%) |
| 55 to 59 Years | 0 (0.0%) | 9 (4.2%) |
| 60 to 64 Years | 5 (3.9%) | 7 (3.3%) |
| 65 to 69 Years | 37 (28.9%) | 37 (17.3%) |
| 70 to 74 Years | 20 (15.6%) | 68 (31.8%) |
| 75 to 79 Years | 9 (7.0%) | 7 (3.3%) |
| 80 to 84 Years | 0 (0.0%) | 0 (0.0%) |
| 85 Years and over | 0 (0.0%) | 0 (0.0%) |
| Total | 128 (100.0%) | 214 (100.0%) |
Families and Households in Langleyville
Median Family Size in Langleyville
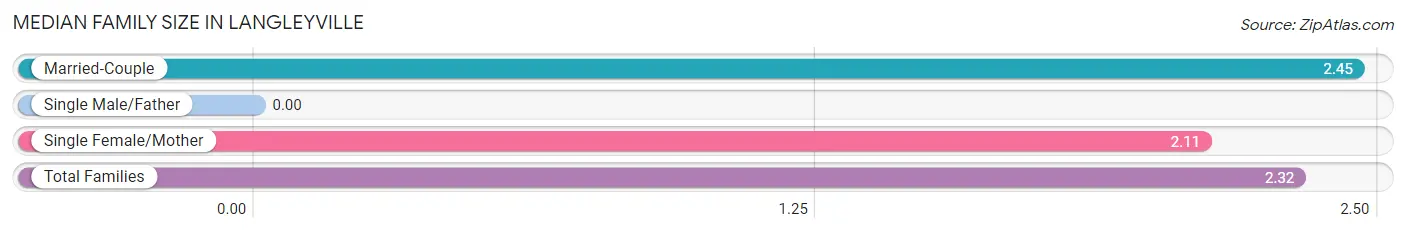
| Family Type | # Families | Family Size |
| Married-Couple | 71 (61.2%) | 2.45 |
| Single Male/Father | 0 (0.0%) | - |
| Single Female/Mother | 45 (38.8%) | 2.11 |
| Total Families | 116 (100.0%) | 2.32 |
Median Household Size in Langleyville
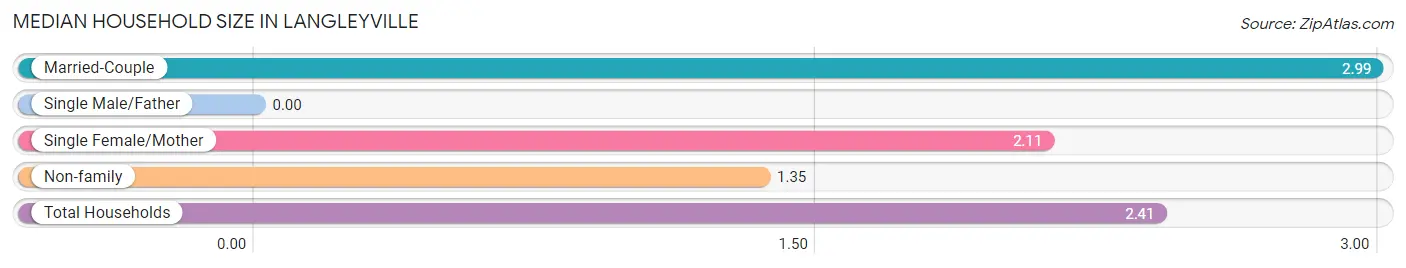
| Household Type | # Households | Household Size |
| Married-Couple | 71 (50.0%) | 2.99 |
| Single Male/Father | 0 (0.0%) | - |
| Single Female/Mother | 45 (31.7%) | 2.11 |
| Non-family | 26 (18.3%) | 1.35 |
| Total Households | 142 (100.0%) | 2.41 |
Household Size by Marriage Status in Langleyville
Out of a total of 142 households in Langleyville, 116 (81.7%) are family households, while 26 (18.3%) are nonfamily households. The most numerous type of family households are 2-person households, comprising 91, and the most common type of nonfamily households are 1-person households, comprising 16.
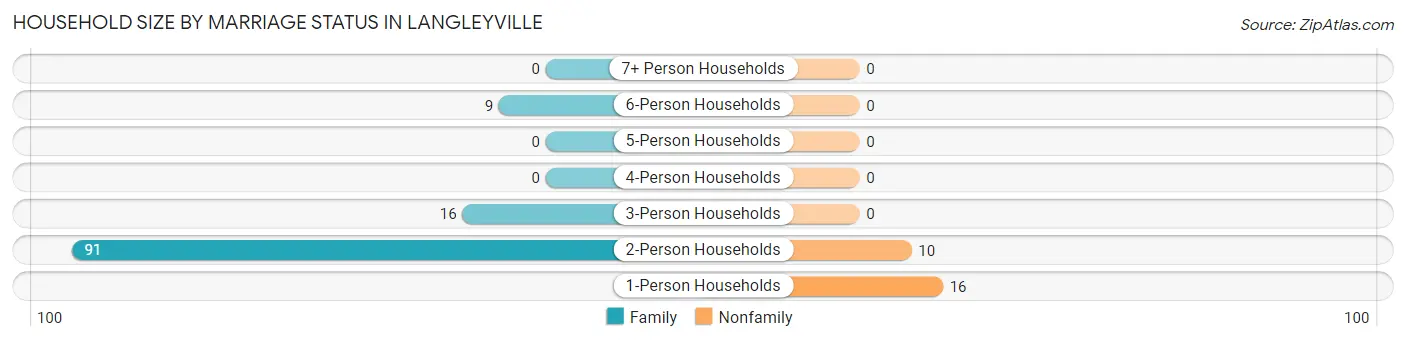
| Household Size | Family Households | Nonfamily Households |
| 1-Person Households | - | 16 (11.3%) |
| 2-Person Households | 91 (64.1%) | 10 (7.0%) |
| 3-Person Households | 16 (11.3%) | 0 (0.0%) |
| 4-Person Households | 0 (0.0%) | 0 (0.0%) |
| 5-Person Households | 0 (0.0%) | 0 (0.0%) |
| 6-Person Households | 9 (6.3%) | 0 (0.0%) |
| 7+ Person Households | 0 (0.0%) | 0 (0.0%) |
| Total | 116 (81.7%) | 26 (18.3%) |
Female Fertility in Langleyville
Fertility by Age in Langleyville
| Age Bracket | Women with Births | Births / 1,000 Women |
| 15 to 19 years | 0 (0.0%) | 0.0 |
| 20 to 34 years | 0 (0.0%) | 0.0 |
| 35 to 50 years | 0 (0.0%) | 0.0 |
| Total | 0 (0.0%) | 0.0 |
Fertility by Age by Marriage Status in Langleyville
| Age Bracket | Married | Unmarried |
| 15 to 19 years | 0 (0.0%) | 0 (0.0%) |
| 20 to 34 years | 0 (0.0%) | 0 (0.0%) |
| 35 to 50 years | 0 (0.0%) | 0 (0.0%) |
| Total | 0 (0.0%) | 0 (0.0%) |
Fertility by Education in Langleyville
| Educational Attainment | Women with Births | Births / 1,000 Women |
| Less than High School | 0 (0.0%) | 0.0 |
| High School Diploma | 0 (0.0%) | 0.0 |
| College or Associate's Degree | 0 (0.0%) | 0.0 |
| Bachelor's Degree | 0 (0.0%) | 0.0 |
| Graduate Degree | 0 (0.0%) | 0.0 |
| Total | 0 (0.0%) | 0.0 |
Fertility by Education by Marriage Status in Langleyville
| Educational Attainment | Married | Unmarried |
| Less than High School | 0 (0.0%) | 0 (0.0%) |
| High School Diploma | 0 (0.0%) | 0 (0.0%) |
| College or Associate's Degree | 0 (0.0%) | 0 (0.0%) |
| Bachelor's Degree | 0 (0.0%) | 0 (0.0%) |
| Graduate Degree | 0 (0.0%) | 0 (0.0%) |
| Total | 0 (0.0%) | 0 (0.0%) |
Employment Characteristics in Langleyville
Employment by Class of Employer in Langleyville
Among the 107 employed individuals in Langleyville, private company employees (61 | 57.0%), self-employed (not incorporated) (16 | 14.9%), and state government employees (14 | 13.1%) make up the most common classes of employment.
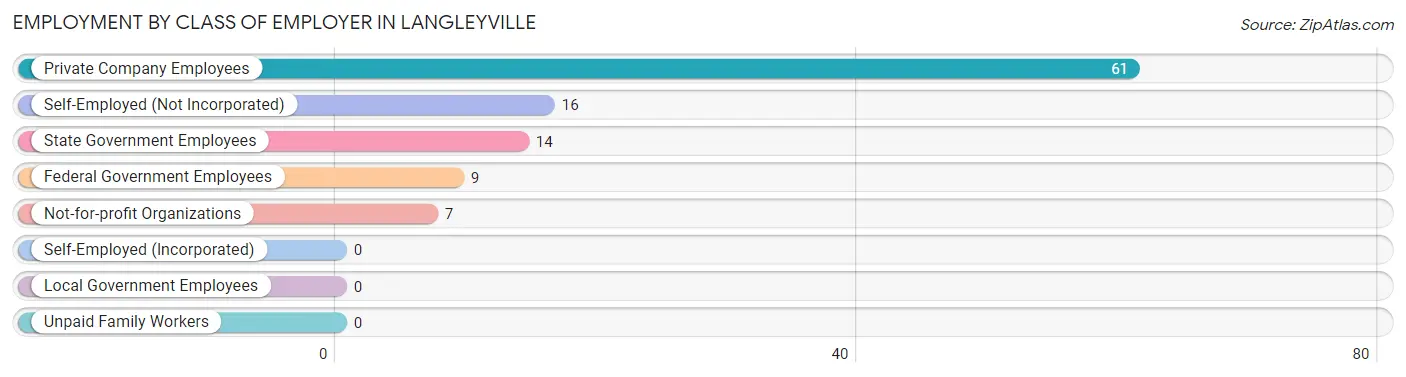
| Employer Class | # Employees | % Employees |
| Private Company Employees | 61 | 57.0% |
| Self-Employed (Incorporated) | 0 | 0.0% |
| Self-Employed (Not Incorporated) | 16 | 14.9% |
| Not-for-profit Organizations | 7 | 6.5% |
| Local Government Employees | 0 | 0.0% |
| State Government Employees | 14 | 13.1% |
| Federal Government Employees | 9 | 8.4% |
| Unpaid Family Workers | 0 | 0.0% |
| Total | 107 | 100.0% |
Employment Status by Age in Langleyville
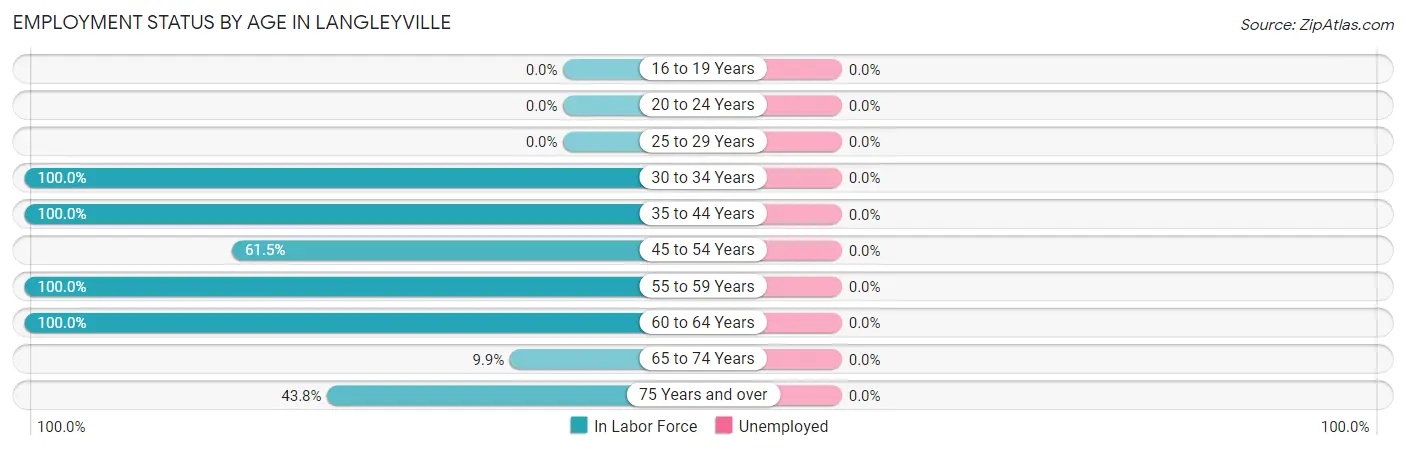
| Age Bracket | In Labor Force | Unemployed |
| 16 to 19 Years | 0 (0.0%) | 0 (0.0%) |
| 20 to 24 Years | 0 (0.0%) | 0 (0.0%) |
| 25 to 29 Years | 0 (0.0%) | 0 (0.0%) |
| 30 to 34 Years | 29 (100.0%) | 0 (0.0%) |
| 35 to 44 Years | 23 (100.0%) | 0 (0.0%) |
| 45 to 54 Years | 16 (61.5%) | 0 (0.0%) |
| 55 to 59 Years | 9 (100.0%) | 0 (0.0%) |
| 60 to 64 Years | 12 (100.0%) | 0 (0.0%) |
| 65 to 74 Years | 16 (9.9%) | 0 (0.0%) |
| 75 Years and over | 7 (43.8%) | 0 (0.0%) |
| Total | 112 (40.4%) | 0 (0.0%) |
Employment Status by Educational Attainment in Langleyville
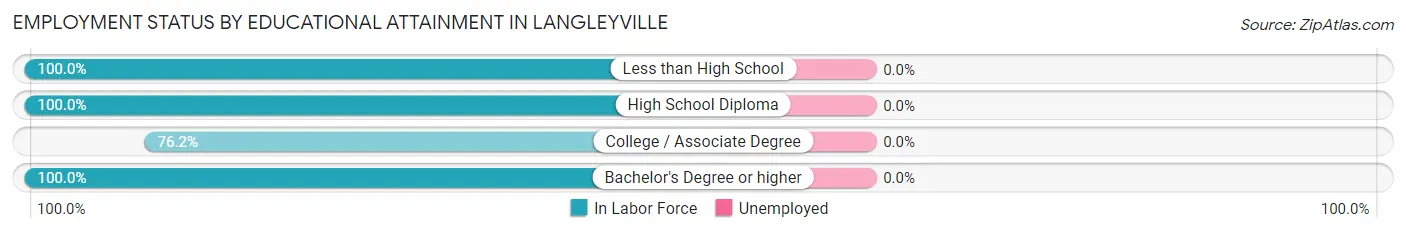
| Educational Attainment | In Labor Force | Unemployed |
| Less than High School | 7 (100.0%) | 0 (0.0%) |
| High School Diploma | 28 (100.0%) | 0 (0.0%) |
| College / Associate Degree | 32 (76.2%) | 0 (0.0%) |
| Bachelor's Degree or higher | 22 (100.0%) | 0 (0.0%) |
| Total | 89 (89.9%) | 0 (0.0%) |
Employment Occupations by Sex in Langleyville
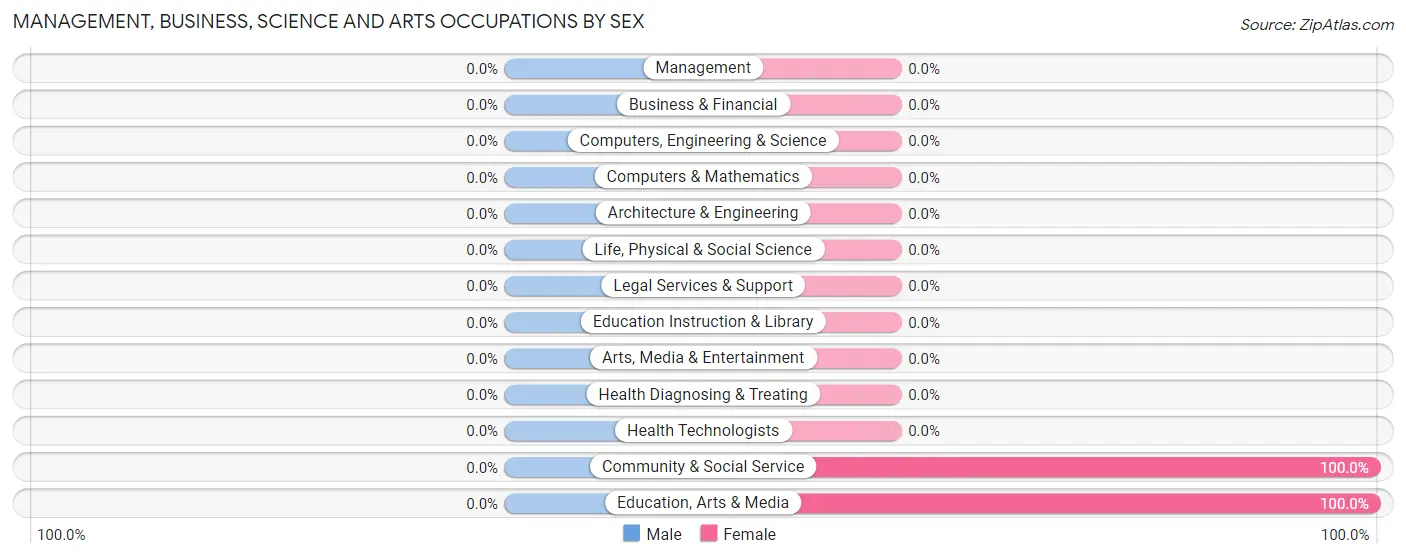
Management, Business, Science and Arts Occupations
The most common Management, Business, Science and Arts occupations in Langleyville are Community & Social Service (14 | 12.5%), and Education, Arts & Media (14 | 12.5%).
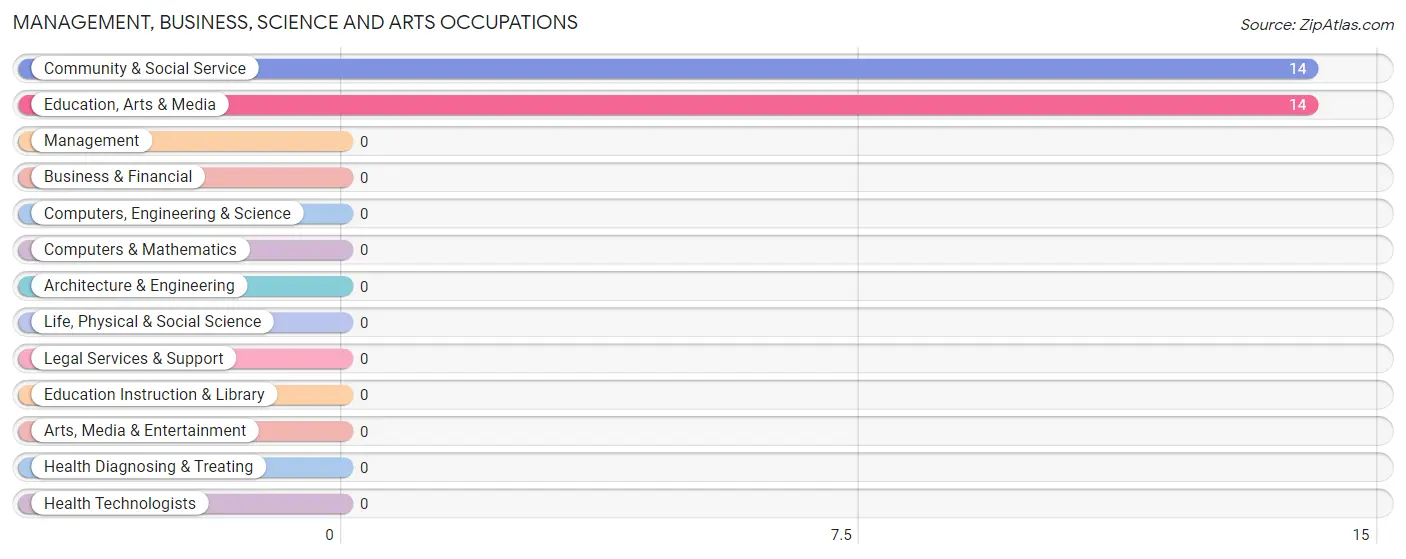
Management, Business, Science and Arts Occupations by Sex
| Occupation | Male | Female |
| Management | 0 (0.0%) | 0 (0.0%) |
| Business & Financial | 0 (0.0%) | 0 (0.0%) |
| Computers, Engineering & Science | 0 (0.0%) | 0 (0.0%) |
| Computers & Mathematics | 0 (0.0%) | 0 (0.0%) |
| Architecture & Engineering | 0 (0.0%) | 0 (0.0%) |
| Life, Physical & Social Science | 0 (0.0%) | 0 (0.0%) |
| Community & Social Service | 0 (0.0%) | 14 (100.0%) |
| Education, Arts & Media | 0 (0.0%) | 14 (100.0%) |
| Legal Services & Support | 0 (0.0%) | 0 (0.0%) |
| Education Instruction & Library | 0 (0.0%) | 0 (0.0%) |
| Arts, Media & Entertainment | 0 (0.0%) | 0 (0.0%) |
| Health Diagnosing & Treating | 0 (0.0%) | 0 (0.0%) |
| Health Technologists | 0 (0.0%) | 0 (0.0%) |
| Total (Category) | 0 (0.0%) | 14 (100.0%) |
| Total (Overall) | 30 (26.8%) | 82 (73.2%) |
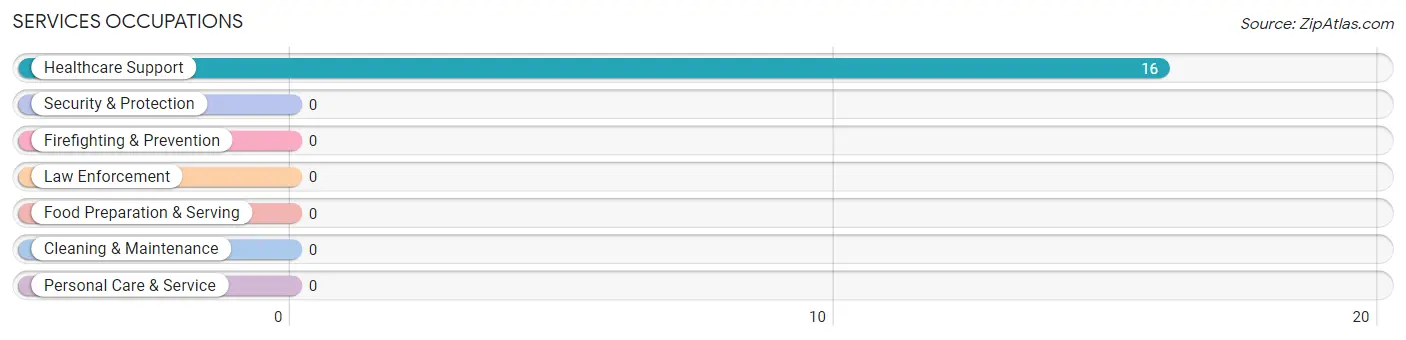
Services Occupations
The most common Services occupations in Langleyville are , and Healthcare Support (16 | 14.3%).
Services Occupations by Sex
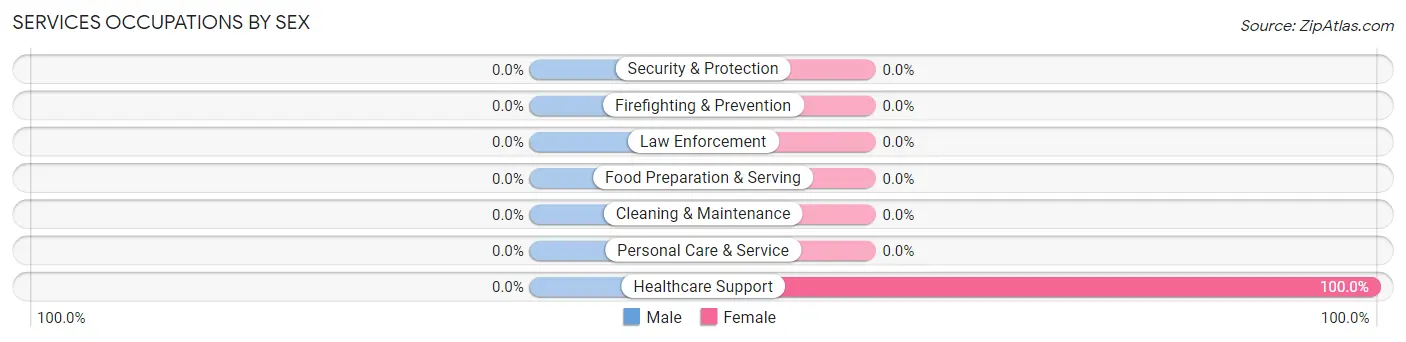
| Occupation | Male | Female |
| Healthcare Support | 0 (0.0%) | 16 (100.0%) |
| Security & Protection | 0 (0.0%) | 0 (0.0%) |
| Firefighting & Prevention | 0 (0.0%) | 0 (0.0%) |
| Law Enforcement | 0 (0.0%) | 0 (0.0%) |
| Food Preparation & Serving | 0 (0.0%) | 0 (0.0%) |
| Cleaning & Maintenance | 0 (0.0%) | 0 (0.0%) |
| Personal Care & Service | 0 (0.0%) | 0 (0.0%) |
| Total (Category) | 0 (0.0%) | 16 (100.0%) |
| Total (Overall) | 30 (26.8%) | 82 (73.2%) |
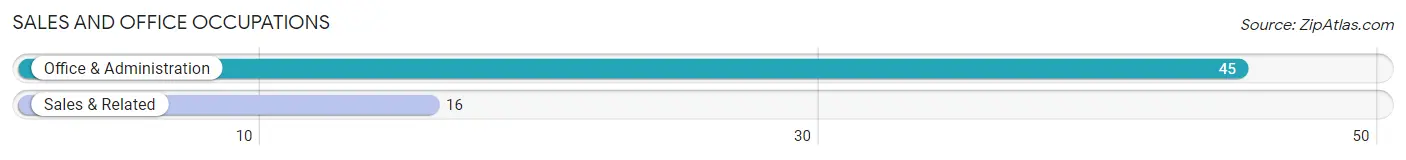
Sales and Office Occupations
The most common Sales and Office occupations in Langleyville are Office & Administration (45 | 40.2%), and Sales & Related (16 | 14.3%).
Sales and Office Occupations by Sex
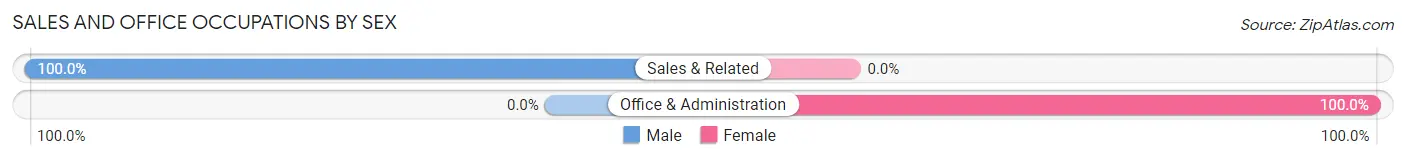
| Occupation | Male | Female |
| Sales & Related | 16 (100.0%) | 0 (0.0%) |
| Office & Administration | 0 (0.0%) | 45 (100.0%) |
| Total (Category) | 16 (26.2%) | 45 (73.8%) |
| Total (Overall) | 30 (26.8%) | 82 (73.2%) |
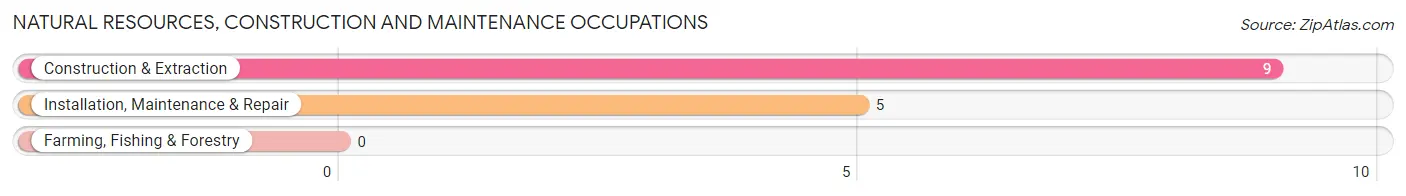
Natural Resources, Construction and Maintenance Occupations
The most common Natural Resources, Construction and Maintenance occupations in Langleyville are Construction & Extraction (9 | 8.0%), and Installation, Maintenance & Repair (5 | 4.5%).
Natural Resources, Construction and Maintenance Occupations by Sex
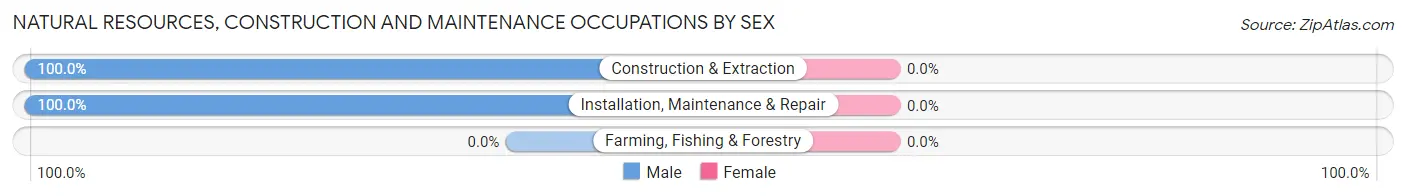
| Occupation | Male | Female |
| Farming, Fishing & Forestry | 0 (0.0%) | 0 (0.0%) |
| Construction & Extraction | 9 (100.0%) | 0 (0.0%) |
| Installation, Maintenance & Repair | 5 (100.0%) | 0 (0.0%) |
| Total (Category) | 14 (100.0%) | 0 (0.0%) |
| Total (Overall) | 30 (26.8%) | 82 (73.2%) |
Production, Transportation and Moving Occupations
The most common Production, Transportation and Moving occupations in Langleyville are , and Material Moving (7 | 6.2%).
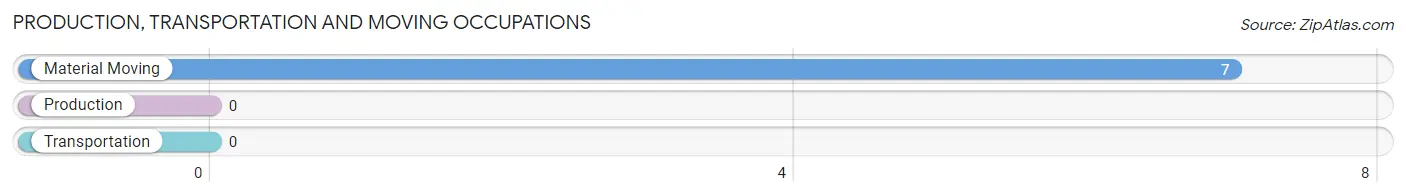
Production, Transportation and Moving Occupations by Sex
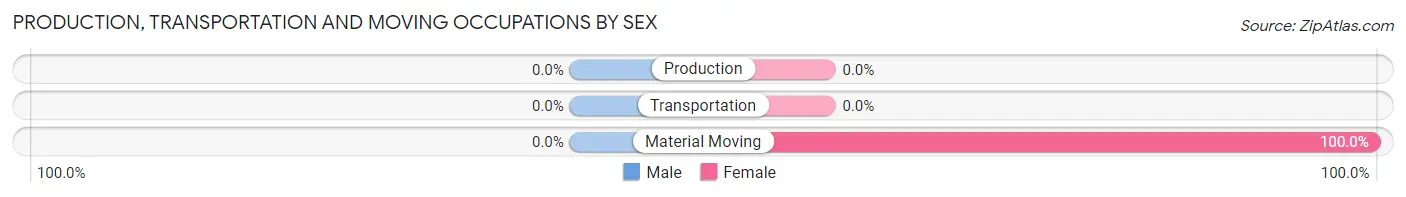
| Occupation | Male | Female |
| Production | 0 (0.0%) | 0 (0.0%) |
| Transportation | 0 (0.0%) | 0 (0.0%) |
| Material Moving | 0 (0.0%) | 7 (100.0%) |
| Total (Category) | 0 (0.0%) | 7 (100.0%) |
| Total (Overall) | 30 (26.8%) | 82 (73.2%) |
Employment Industries by Sex in Langleyville
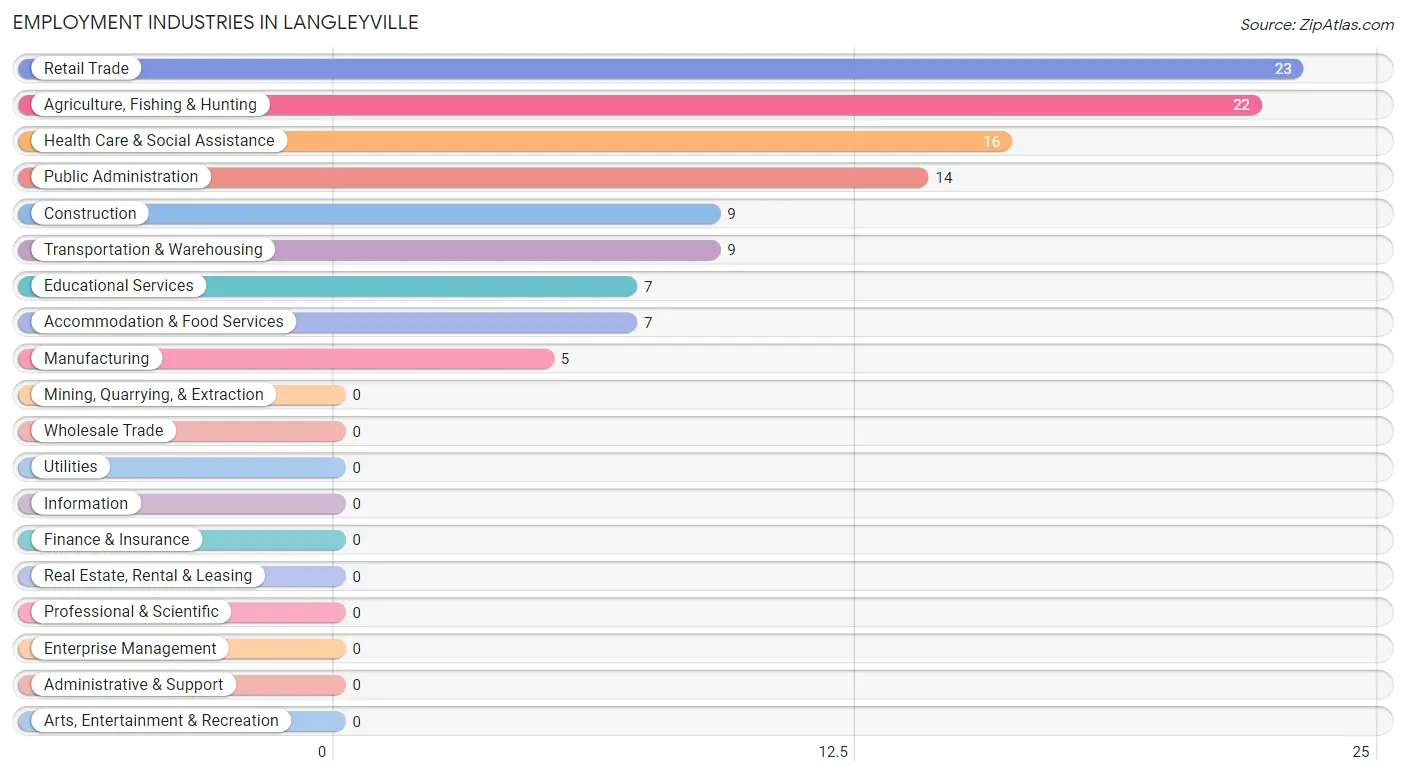
Employment Industries in Langleyville
The major employment industries in Langleyville include Retail Trade (23 | 20.5%), Agriculture, Fishing & Hunting (22 | 19.6%), Health Care & Social Assistance (16 | 14.3%), Public Administration (14 | 12.5%), and Construction (9 | 8.0%).
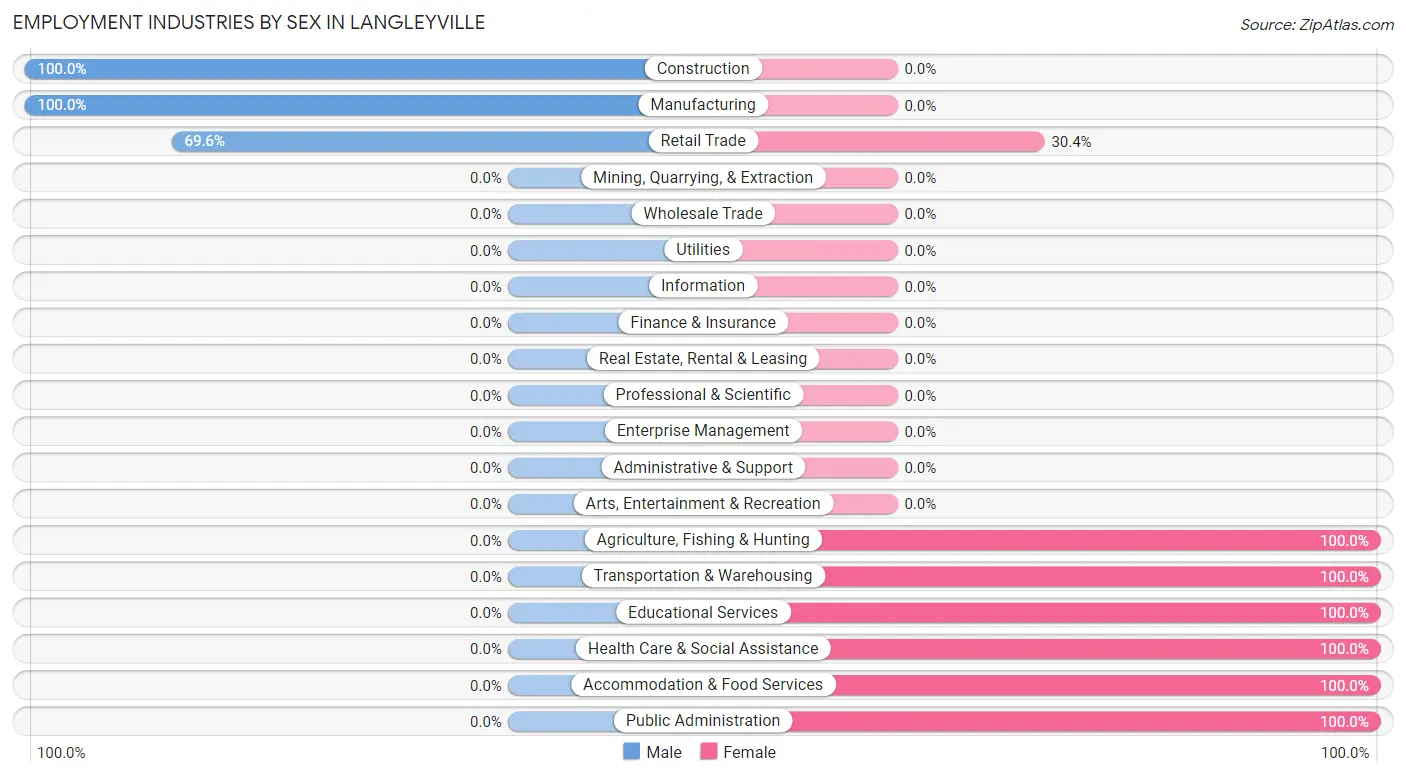
Employment Industries by Sex in Langleyville
The Langleyville industries that see more men than women are Construction (100.0%), Manufacturing (100.0%), and Retail Trade (69.6%), whereas the industries that tend to have a higher number of women are Agriculture, Fishing & Hunting (100.0%), Transportation & Warehousing (100.0%), and Educational Services (100.0%).
| Industry | Male | Female |
| Agriculture, Fishing & Hunting | 0 (0.0%) | 22 (100.0%) |
| Mining, Quarrying, & Extraction | 0 (0.0%) | 0 (0.0%) |
| Construction | 9 (100.0%) | 0 (0.0%) |
| Manufacturing | 5 (100.0%) | 0 (0.0%) |
| Wholesale Trade | 0 (0.0%) | 0 (0.0%) |
| Retail Trade | 16 (69.6%) | 7 (30.4%) |
| Transportation & Warehousing | 0 (0.0%) | 9 (100.0%) |
| Utilities | 0 (0.0%) | 0 (0.0%) |
| Information | 0 (0.0%) | 0 (0.0%) |
| Finance & Insurance | 0 (0.0%) | 0 (0.0%) |
| Real Estate, Rental & Leasing | 0 (0.0%) | 0 (0.0%) |
| Professional & Scientific | 0 (0.0%) | 0 (0.0%) |
| Enterprise Management | 0 (0.0%) | 0 (0.0%) |
| Administrative & Support | 0 (0.0%) | 0 (0.0%) |
| Educational Services | 0 (0.0%) | 7 (100.0%) |
| Health Care & Social Assistance | 0 (0.0%) | 16 (100.0%) |
| Arts, Entertainment & Recreation | 0 (0.0%) | 0 (0.0%) |
| Accommodation & Food Services | 0 (0.0%) | 7 (100.0%) |
| Public Administration | 0 (0.0%) | 14 (100.0%) |
| Total | 30 (26.8%) | 82 (73.2%) |
Education in Langleyville
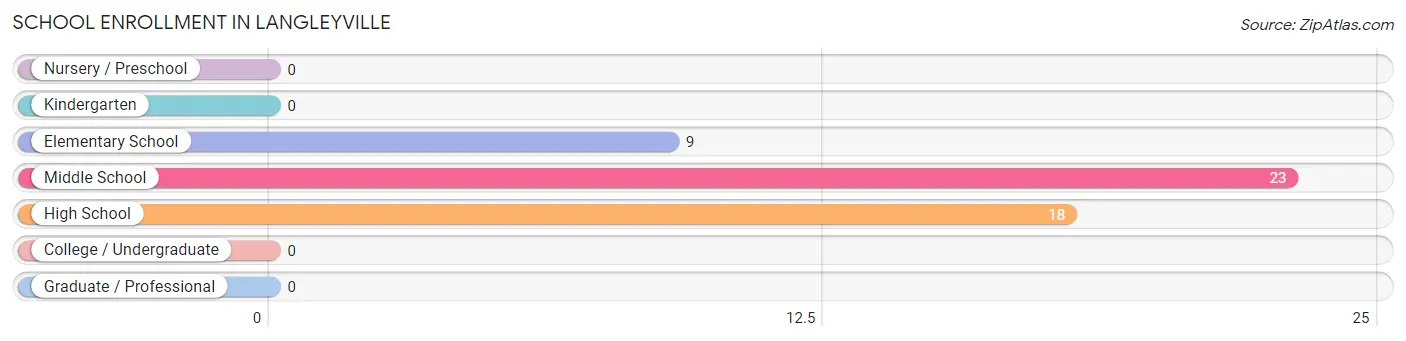
School Enrollment in Langleyville
The most common levels of schooling among the 50 students in Langleyville are middle school (23 | 46.0%), high school (18 | 36.0%), and elementary school (9 | 18.0%).
| School Level | # Students | % Students |
| Nursery / Preschool | 0 | 0.0% |
| Kindergarten | 0 | 0.0% |
| Elementary School | 9 | 18.0% |
| Middle School | 23 | 46.0% |
| High School | 18 | 36.0% |
| College / Undergraduate | 0 | 0.0% |
| Graduate / Professional | 0 | 0.0% |
| Total | 50 | 100.0% |
School Enrollment by Age by Funding Source in Langleyville
Out of a total of 50 students who are enrolled in schools in Langleyville, 19 (38.0%) attend a private institution, while the remaining 31 (62.0%) are enrolled in public schools. The age group of 5 to 9 year old has the highest likelihood of being enrolled in private schools, with 9 (100.0% in the age bracket) enrolled. Conversely, the age group of 15 to 17 year olds has the lowest likelihood of being enrolled in a private school, with 18 (100.0% in the age bracket) attending a public institution.
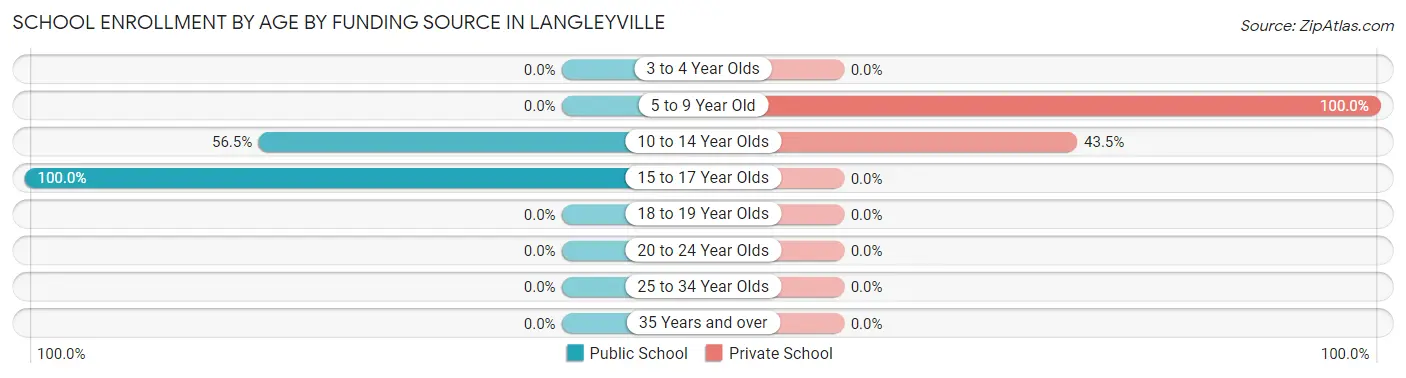
| Age Bracket | Public School | Private School |
| 3 to 4 Year Olds | 0 (0.0%) | 0 (0.0%) |
| 5 to 9 Year Old | 0 (0.0%) | 9 (100.0%) |
| 10 to 14 Year Olds | 13 (56.5%) | 10 (43.5%) |
| 15 to 17 Year Olds | 18 (100.0%) | 0 (0.0%) |
| 18 to 19 Year Olds | 0 (0.0%) | 0 (0.0%) |
| 20 to 24 Year Olds | 0 (0.0%) | 0 (0.0%) |
| 25 to 34 Year Olds | 0 (0.0%) | 0 (0.0%) |
| 35 Years and over | 0 (0.0%) | 0 (0.0%) |
| Total | 31 (62.0%) | 19 (38.0%) |
Educational Attainment by Field of Study in Langleyville
, and liberal arts & history (22 | 100.0%) are the most common fields of study among 22 individuals in Langleyville who have obtained a bachelor's degree or higher.
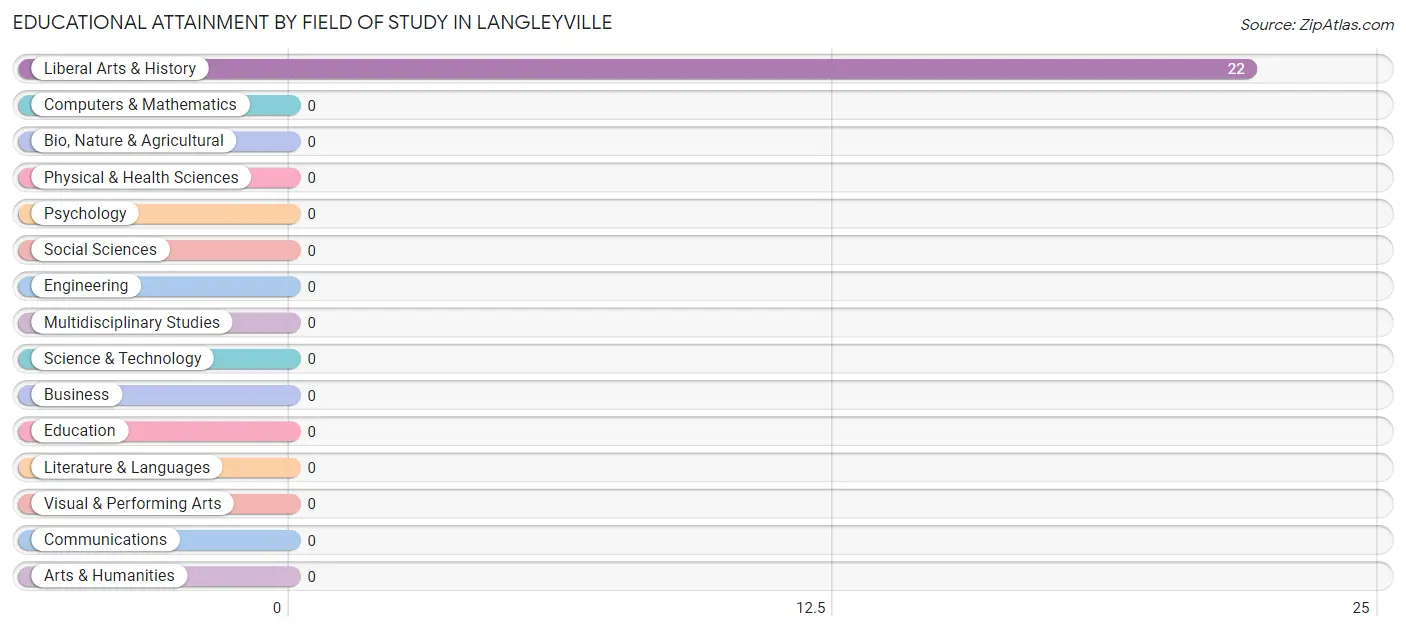
| Field of Study | # Graduates | % Graduates |
| Computers & Mathematics | 0 | 0.0% |
| Bio, Nature & Agricultural | 0 | 0.0% |
| Physical & Health Sciences | 0 | 0.0% |
| Psychology | 0 | 0.0% |
| Social Sciences | 0 | 0.0% |
| Engineering | 0 | 0.0% |
| Multidisciplinary Studies | 0 | 0.0% |
| Science & Technology | 0 | 0.0% |
| Business | 0 | 0.0% |
| Education | 0 | 0.0% |
| Literature & Languages | 0 | 0.0% |
| Liberal Arts & History | 22 | 100.0% |
| Visual & Performing Arts | 0 | 0.0% |
| Communications | 0 | 0.0% |
| Arts & Humanities | 0 | 0.0% |
| Total | 22 | 100.0% |
Transportation & Commute in Langleyville
Vehicle Availability by Sex in Langleyville
The most prevalent vehicle ownership categories in Langleyville are males with 3 vehicles (25, accounting for 100.0%) and females with 3 vehicles (23, making up 30.5%).
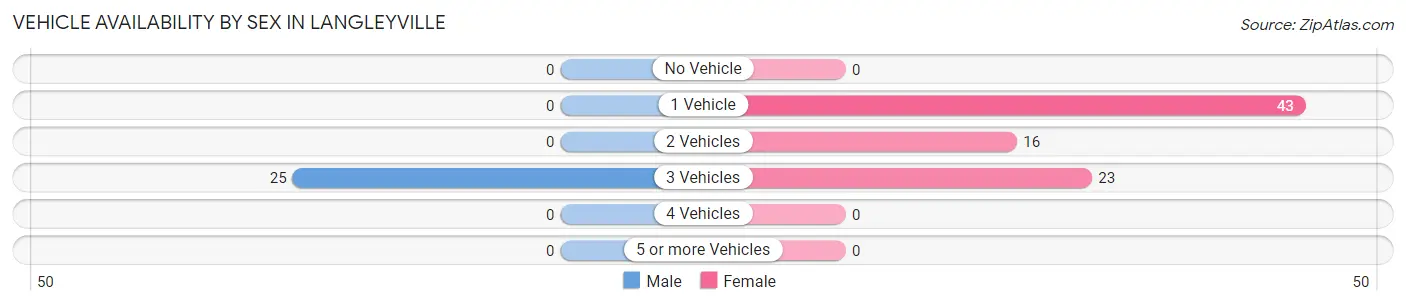
| Vehicles Available | Male | Female |
| No Vehicle | 0 (0.0%) | 0 (0.0%) |
| 1 Vehicle | 0 (0.0%) | 43 (52.4%) |
| 2 Vehicles | 0 (0.0%) | 16 (19.5%) |
| 3 Vehicles | 25 (100.0%) | 23 (28.1%) |
| 4 Vehicles | 0 (0.0%) | 0 (0.0%) |
| 5 or more Vehicles | 0 (0.0%) | 0 (0.0%) |
| Total | 25 (100.0%) | 82 (100.0%) |
Commute Time in Langleyville
The most frequently occuring commute durations in Langleyville are 10 to 14 minutes (39 commuters, 36.4%), 25 to 29 minutes (22 commuters, 20.6%), and 20 to 24 minutes (16 commuters, 14.9%).
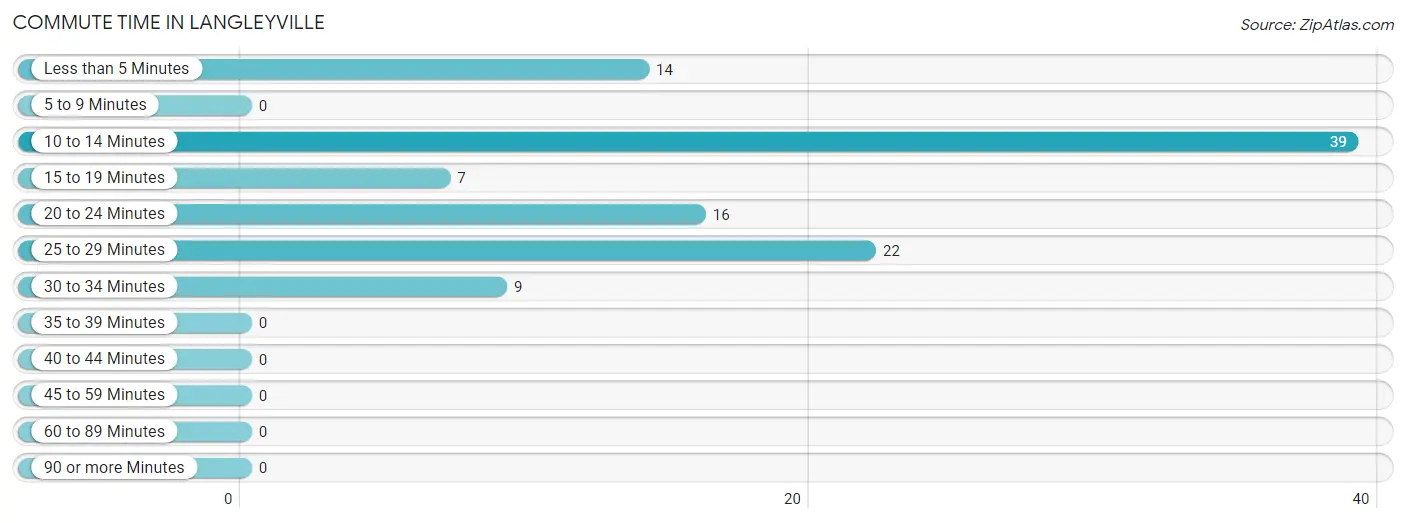
| Commute Time | # Commuters | % Commuters |
| Less than 5 Minutes | 14 | 13.1% |
| 5 to 9 Minutes | 0 | 0.0% |
| 10 to 14 Minutes | 39 | 36.4% |
| 15 to 19 Minutes | 7 | 6.5% |
| 20 to 24 Minutes | 16 | 14.9% |
| 25 to 29 Minutes | 22 | 20.6% |
| 30 to 34 Minutes | 9 | 8.4% |
| 35 to 39 Minutes | 0 | 0.0% |
| 40 to 44 Minutes | 0 | 0.0% |
| 45 to 59 Minutes | 0 | 0.0% |
| 60 to 89 Minutes | 0 | 0.0% |
| 90 or more Minutes | 0 | 0.0% |
Commute Time by Sex in Langleyville
The most common commute times in Langleyville are 20 to 24 minutes (16 commuters, 64.0%) for males and 10 to 14 minutes (30 commuters, 36.6%) for females.
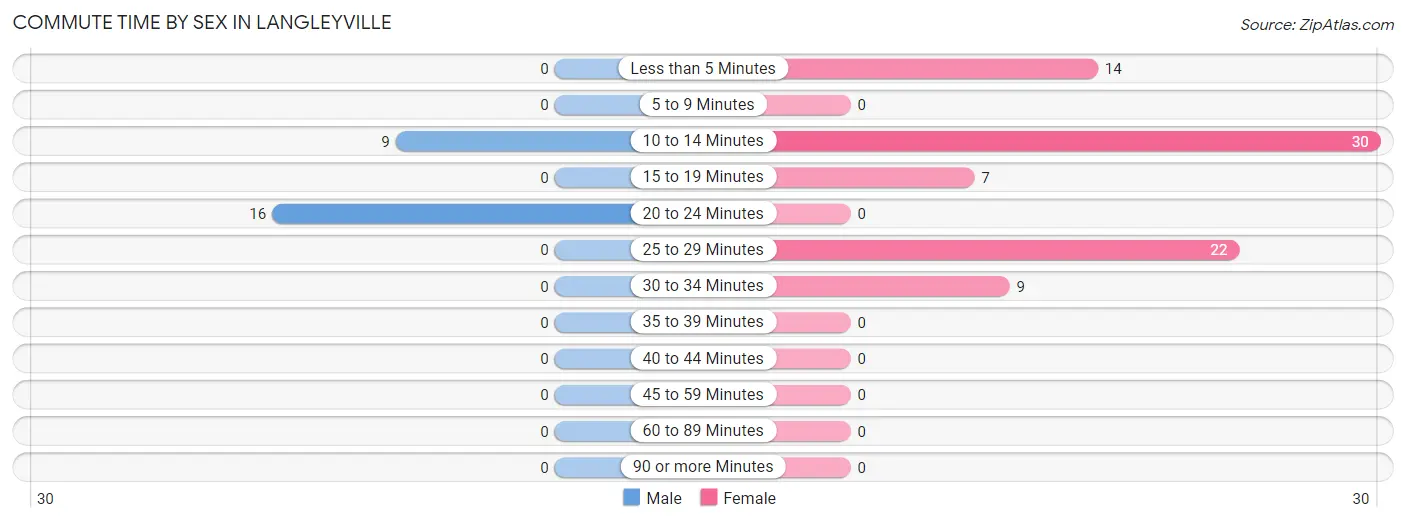
| Commute Time | Male | Female |
| Less than 5 Minutes | 0 (0.0%) | 14 (17.1%) |
| 5 to 9 Minutes | 0 (0.0%) | 0 (0.0%) |
| 10 to 14 Minutes | 9 (36.0%) | 30 (36.6%) |
| 15 to 19 Minutes | 0 (0.0%) | 7 (8.5%) |
| 20 to 24 Minutes | 16 (64.0%) | 0 (0.0%) |
| 25 to 29 Minutes | 0 (0.0%) | 22 (26.8%) |
| 30 to 34 Minutes | 0 (0.0%) | 9 (11.0%) |
| 35 to 39 Minutes | 0 (0.0%) | 0 (0.0%) |
| 40 to 44 Minutes | 0 (0.0%) | 0 (0.0%) |
| 45 to 59 Minutes | 0 (0.0%) | 0 (0.0%) |
| 60 to 89 Minutes | 0 (0.0%) | 0 (0.0%) |
| 90 or more Minutes | 0 (0.0%) | 0 (0.0%) |
Time of Departure to Work by Sex in Langleyville
The most frequent times of departure to work in Langleyville are 6:30 AM to 6:59 AM (16, 64.0%) for males and 5:30 AM to 5:59 AM (25, 30.5%) for females.
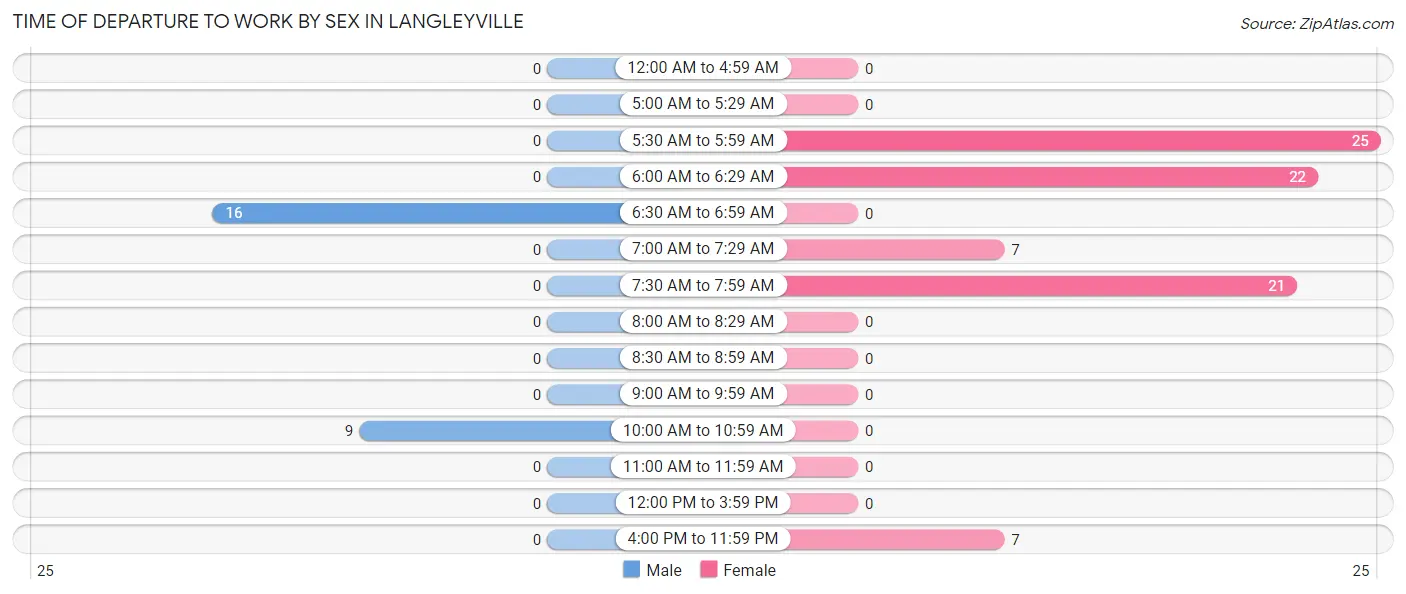
| Time of Departure | Male | Female |
| 12:00 AM to 4:59 AM | 0 (0.0%) | 0 (0.0%) |
| 5:00 AM to 5:29 AM | 0 (0.0%) | 0 (0.0%) |
| 5:30 AM to 5:59 AM | 0 (0.0%) | 25 (30.5%) |
| 6:00 AM to 6:29 AM | 0 (0.0%) | 22 (26.8%) |
| 6:30 AM to 6:59 AM | 16 (64.0%) | 0 (0.0%) |
| 7:00 AM to 7:29 AM | 0 (0.0%) | 7 (8.5%) |
| 7:30 AM to 7:59 AM | 0 (0.0%) | 21 (25.6%) |
| 8:00 AM to 8:29 AM | 0 (0.0%) | 0 (0.0%) |
| 8:30 AM to 8:59 AM | 0 (0.0%) | 0 (0.0%) |
| 9:00 AM to 9:59 AM | 0 (0.0%) | 0 (0.0%) |
| 10:00 AM to 10:59 AM | 9 (36.0%) | 0 (0.0%) |
| 11:00 AM to 11:59 AM | 0 (0.0%) | 0 (0.0%) |
| 12:00 PM to 3:59 PM | 0 (0.0%) | 0 (0.0%) |
| 4:00 PM to 11:59 PM | 0 (0.0%) | 7 (8.5%) |
| Total | 25 (100.0%) | 82 (100.0%) |
Housing Occupancy in Langleyville
Occupancy by Ownership in Langleyville
Of the total 142 dwellings in Langleyville, owner-occupied units account for 128 (90.1%), while renter-occupied units make up 14 (9.9%).
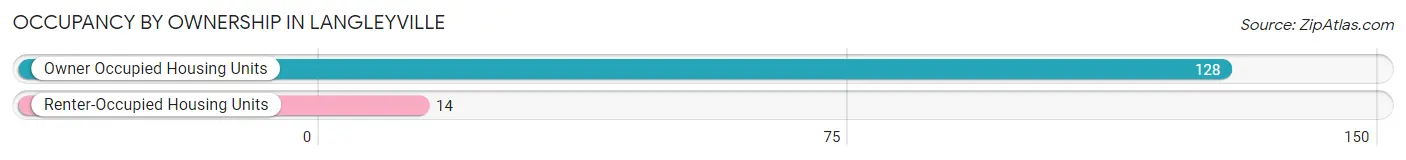
| Occupancy | # Housing Units | % Housing Units |
| Owner Occupied Housing Units | 128 | 90.1% |
| Renter-Occupied Housing Units | 14 | 9.9% |
| Total Occupied Housing Units | 142 | 100.0% |
Occupancy by Household Size in Langleyville
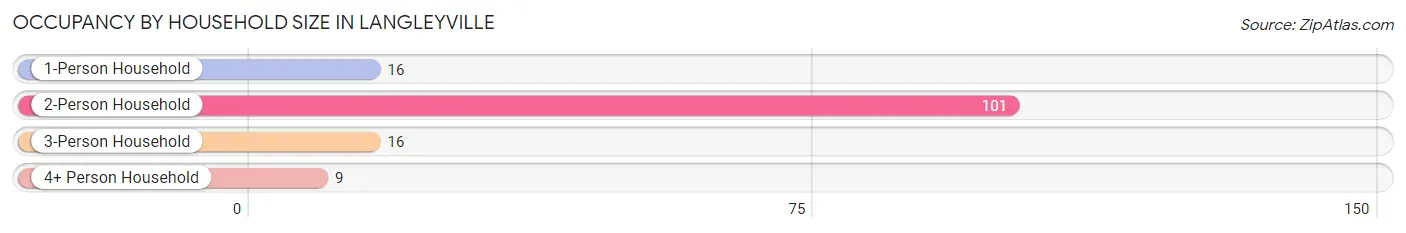
| Household Size | # Housing Units | % Housing Units |
| 1-Person Household | 16 | 11.3% |
| 2-Person Household | 101 | 71.1% |
| 3-Person Household | 16 | 11.3% |
| 4+ Person Household | 9 | 6.3% |
| Total Housing Units | 142 | 100.0% |
Occupancy by Ownership by Household Size in Langleyville
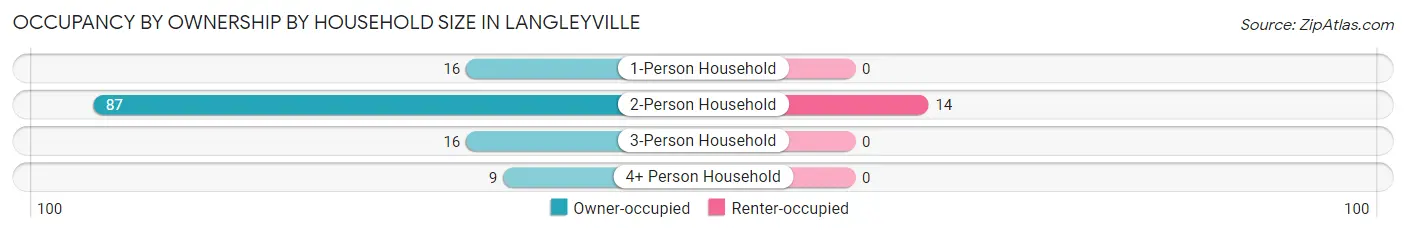
| Household Size | Owner-occupied | Renter-occupied |
| 1-Person Household | 16 (100.0%) | 0 (0.0%) |
| 2-Person Household | 87 (86.1%) | 14 (13.9%) |
| 3-Person Household | 16 (100.0%) | 0 (0.0%) |
| 4+ Person Household | 9 (100.0%) | 0 (0.0%) |
| Total Housing Units | 128 (90.1%) | 14 (9.9%) |
Occupancy by Educational Attainment in Langleyville
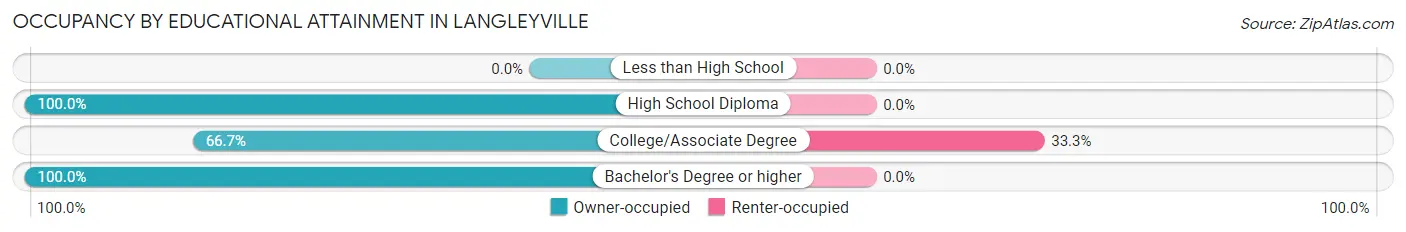
| Household Size | Owner-occupied | Renter-occupied |
| Less than High School | 0 (0.0%) | 0 (0.0%) |
| High School Diploma | 78 (100.0%) | 0 (0.0%) |
| College/Associate Degree | 28 (66.7%) | 14 (33.3%) |
| Bachelor's Degree or higher | 22 (100.0%) | 0 (0.0%) |
Occupancy by Age of Householder in Langleyville
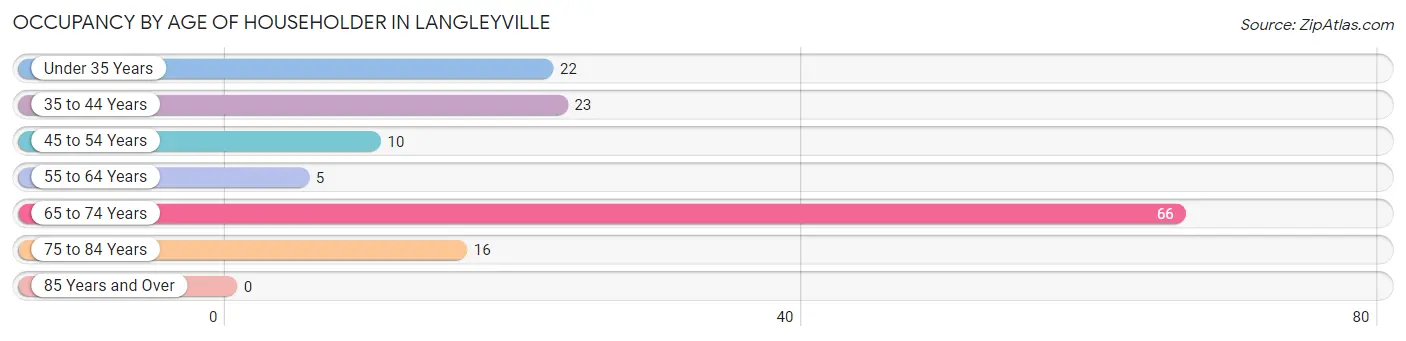
| Age Bracket | # Households | % Households |
| Under 35 Years | 22 | 15.5% |
| 35 to 44 Years | 23 | 16.2% |
| 45 to 54 Years | 10 | 7.0% |
| 55 to 64 Years | 5 | 3.5% |
| 65 to 74 Years | 66 | 46.5% |
| 75 to 84 Years | 16 | 11.3% |
| 85 Years and Over | 0 | 0.0% |
| Total | 142 | 100.0% |
Housing Finances in Langleyville
Median Income by Occupancy in Langleyville
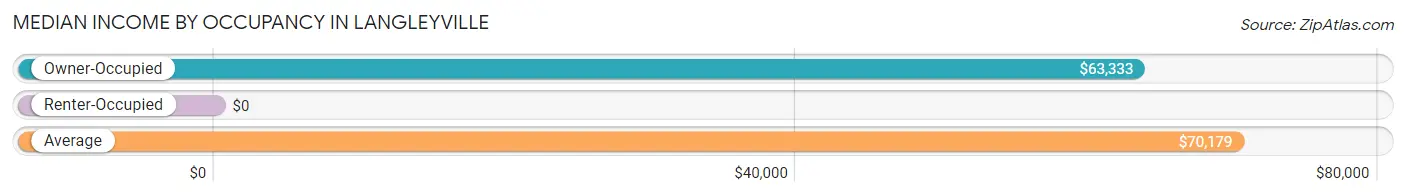
| Occupancy Type | # Households | Median Income |
| Owner-Occupied | 128 (90.1%) | $63,333 |
| Renter-Occupied | 14 (9.9%) | $0 |
| Average | 142 (100.0%) | $70,179 |
Occupancy by Householder Income Bracket in Langleyville
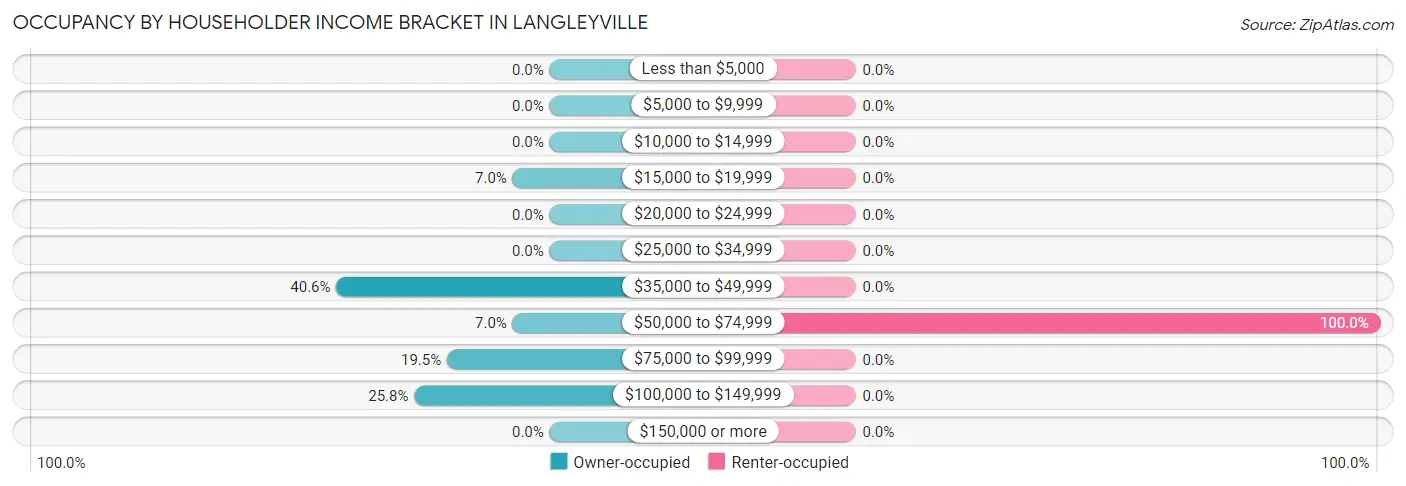
| Income Bracket | Owner-occupied | Renter-occupied |
| Less than $5,000 | 0 (0.0%) | 0 (0.0%) |
| $5,000 to $9,999 | 0 (0.0%) | 0 (0.0%) |
| $10,000 to $14,999 | 0 (0.0%) | 0 (0.0%) |
| $15,000 to $19,999 | 9 (7.0%) | 0 (0.0%) |
| $20,000 to $24,999 | 0 (0.0%) | 0 (0.0%) |
| $25,000 to $34,999 | 0 (0.0%) | 0 (0.0%) |
| $35,000 to $49,999 | 52 (40.6%) | 0 (0.0%) |
| $50,000 to $74,999 | 9 (7.0%) | 14 (100.0%) |
| $75,000 to $99,999 | 25 (19.5%) | 0 (0.0%) |
| $100,000 to $149,999 | 33 (25.8%) | 0 (0.0%) |
| $150,000 or more | 0 (0.0%) | 0 (0.0%) |
| Total | 128 (100.0%) | 14 (100.0%) |
Monthly Housing Cost Tiers in Langleyville
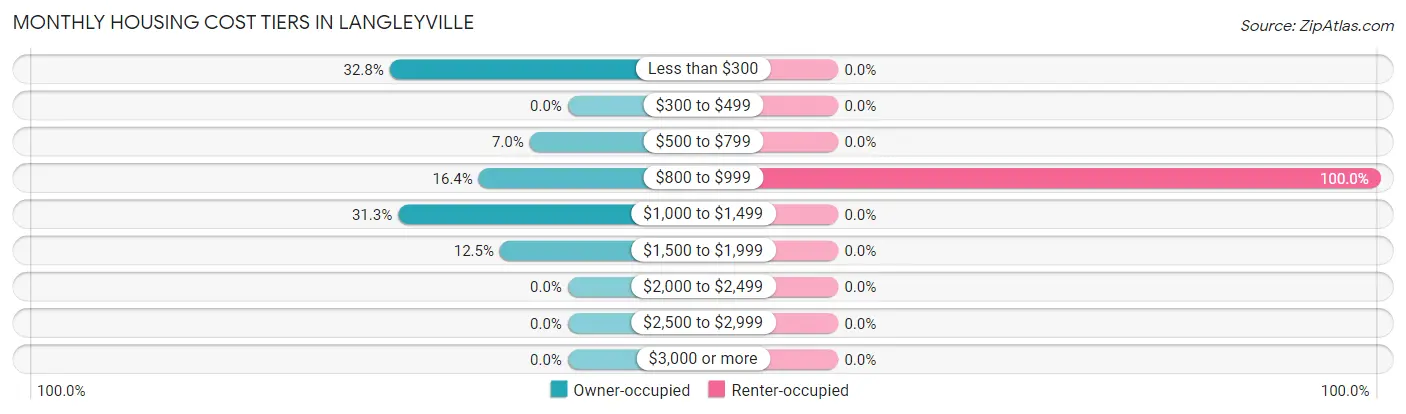
| Monthly Cost | Owner-occupied | Renter-occupied |
| Less than $300 | 42 (32.8%) | 0 (0.0%) |
| $300 to $499 | 0 (0.0%) | 0 (0.0%) |
| $500 to $799 | 9 (7.0%) | 0 (0.0%) |
| $800 to $999 | 21 (16.4%) | 14 (100.0%) |
| $1,000 to $1,499 | 40 (31.2%) | 0 (0.0%) |
| $1,500 to $1,999 | 16 (12.5%) | 0 (0.0%) |
| $2,000 to $2,499 | 0 (0.0%) | 0 (0.0%) |
| $2,500 to $2,999 | 0 (0.0%) | 0 (0.0%) |
| $3,000 or more | 0 (0.0%) | 0 (0.0%) |
| Total | 128 (100.0%) | 14 (100.0%) |
Physical Housing Characteristics in Langleyville
Housing Structures in Langleyville
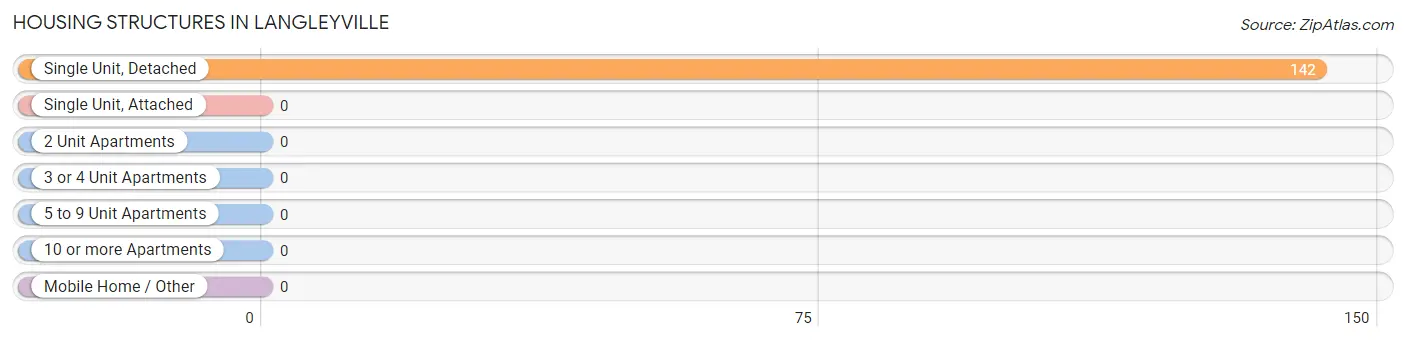
| Structure Type | # Housing Units | % Housing Units |
| Single Unit, Detached | 142 | 100.0% |
| Single Unit, Attached | 0 | 0.0% |
| 2 Unit Apartments | 0 | 0.0% |
| 3 or 4 Unit Apartments | 0 | 0.0% |
| 5 to 9 Unit Apartments | 0 | 0.0% |
| 10 or more Apartments | 0 | 0.0% |
| Mobile Home / Other | 0 | 0.0% |
| Total | 142 | 100.0% |
Housing Structures by Occupancy in Langleyville
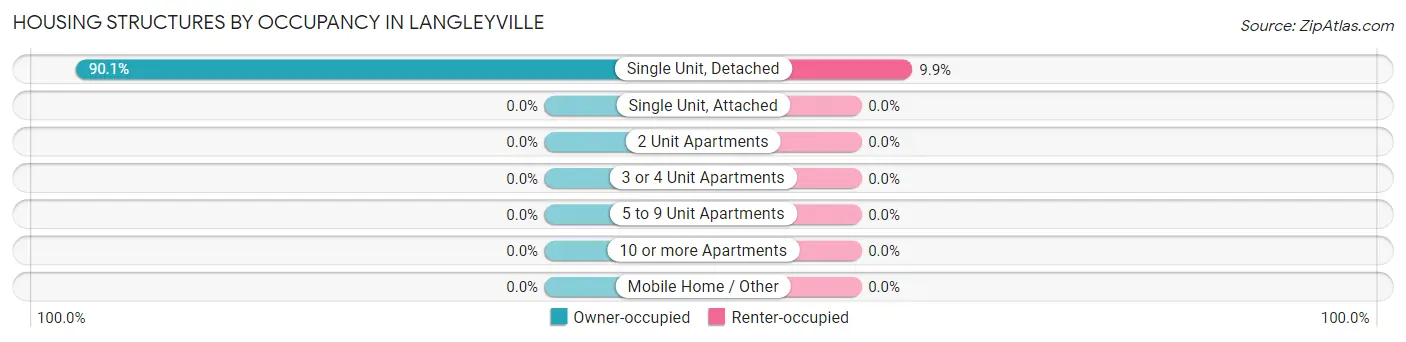
| Structure Type | Owner-occupied | Renter-occupied |
| Single Unit, Detached | 128 (90.1%) | 14 (9.9%) |
| Single Unit, Attached | 0 (0.0%) | 0 (0.0%) |
| 2 Unit Apartments | 0 (0.0%) | 0 (0.0%) |
| 3 or 4 Unit Apartments | 0 (0.0%) | 0 (0.0%) |
| 5 to 9 Unit Apartments | 0 (0.0%) | 0 (0.0%) |
| 10 or more Apartments | 0 (0.0%) | 0 (0.0%) |
| Mobile Home / Other | 0 (0.0%) | 0 (0.0%) |
| Total | 128 (90.1%) | 14 (9.9%) |
Housing Structures by Number of Rooms in Langleyville
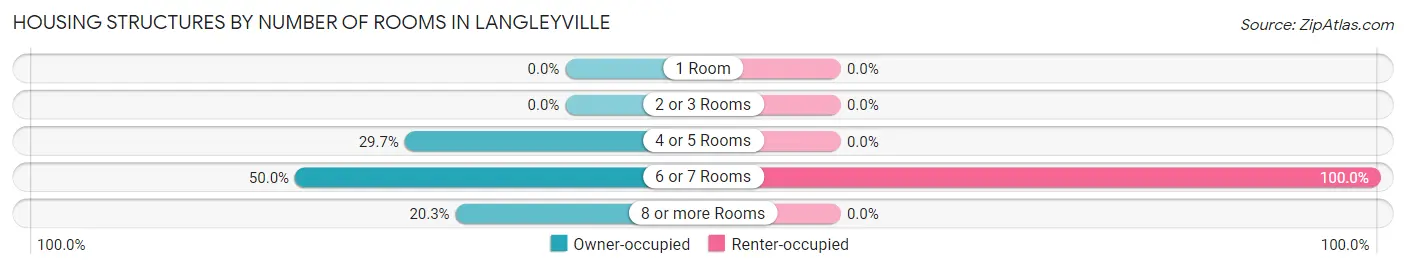
| Number of Rooms | Owner-occupied | Renter-occupied |
| 1 Room | 0 (0.0%) | 0 (0.0%) |
| 2 or 3 Rooms | 0 (0.0%) | 0 (0.0%) |
| 4 or 5 Rooms | 38 (29.7%) | 0 (0.0%) |
| 6 or 7 Rooms | 64 (50.0%) | 14 (100.0%) |
| 8 or more Rooms | 26 (20.3%) | 0 (0.0%) |
| Total | 128 (100.0%) | 14 (100.0%) |
Housing Structure by Heating Type in Langleyville
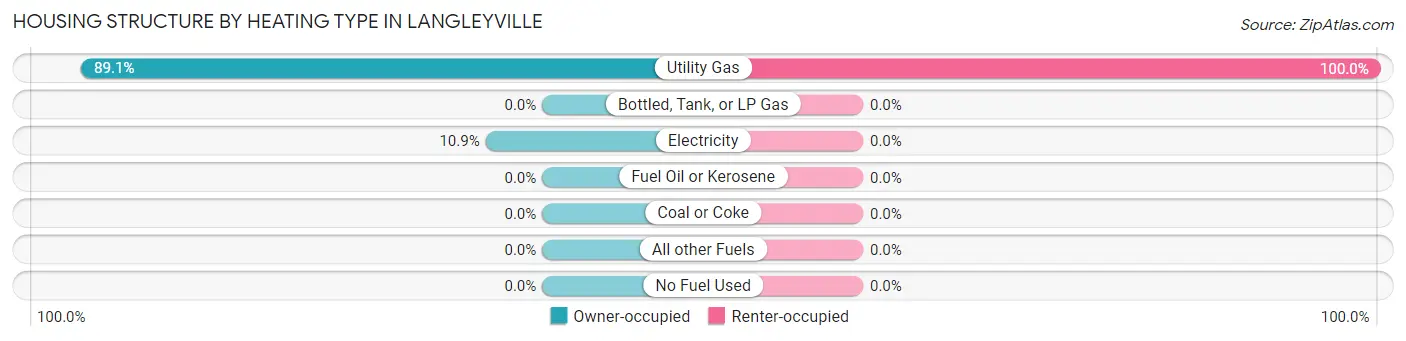
| Heating Type | Owner-occupied | Renter-occupied |
| Utility Gas | 114 (89.1%) | 14 (100.0%) |
| Bottled, Tank, or LP Gas | 0 (0.0%) | 0 (0.0%) |
| Electricity | 14 (10.9%) | 0 (0.0%) |
| Fuel Oil or Kerosene | 0 (0.0%) | 0 (0.0%) |
| Coal or Coke | 0 (0.0%) | 0 (0.0%) |
| All other Fuels | 0 (0.0%) | 0 (0.0%) |
| No Fuel Used | 0 (0.0%) | 0 (0.0%) |
| Total | 128 (100.0%) | 14 (100.0%) |
Household Vehicle Usage in Langleyville
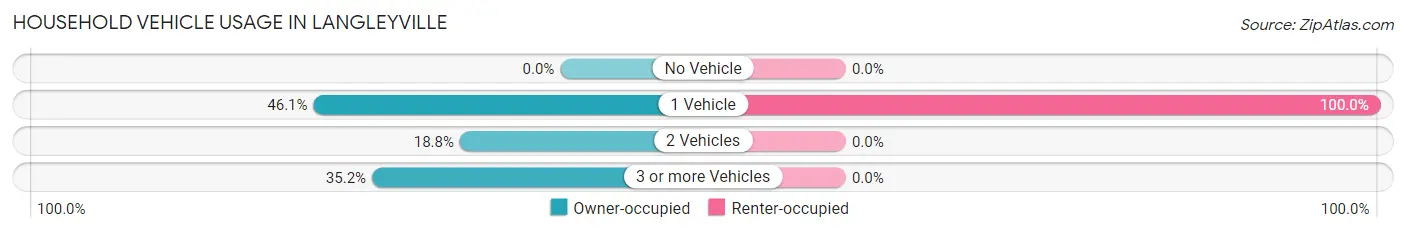
| Vehicles per Household | Owner-occupied | Renter-occupied |
| No Vehicle | 0 (0.0%) | 0 (0.0%) |
| 1 Vehicle | 59 (46.1%) | 14 (100.0%) |
| 2 Vehicles | 24 (18.8%) | 0 (0.0%) |
| 3 or more Vehicles | 45 (35.2%) | 0 (0.0%) |
| Total | 128 (100.0%) | 14 (100.0%) |
Real Estate & Mortgages in Langleyville
Real Estate and Mortgage Overview in Langleyville
| Characteristic | Without Mortgage | With Mortgage |
| Housing Units | 51 | 77 |
| Median Property Value | - | - |
| Median Household Income | $63,472 | $0 |
| Monthly Housing Costs | $259 | $0 |
| Real Estate Taxes | - | - |
Property Value by Mortgage Status in Langleyville
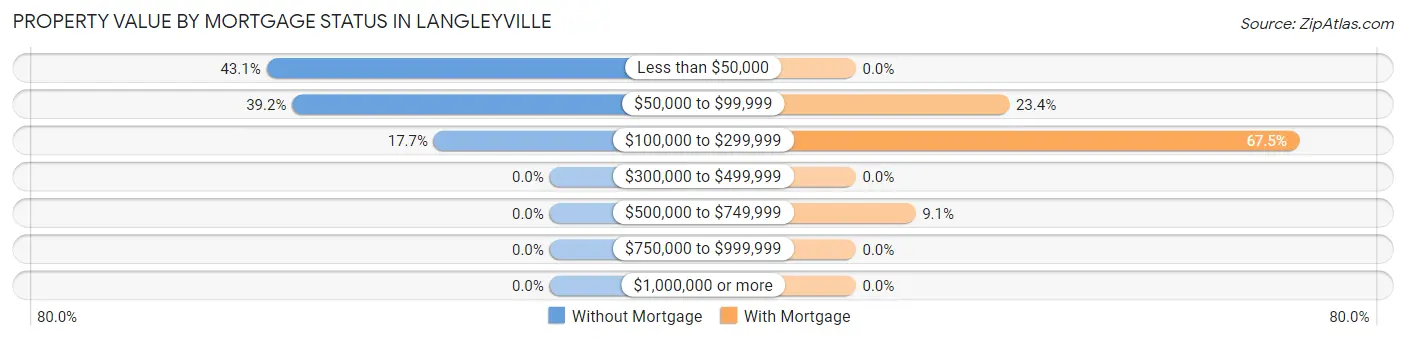
| Property Value | Without Mortgage | With Mortgage |
| Less than $50,000 | 22 (43.1%) | 0 (0.0%) |
| $50,000 to $99,999 | 20 (39.2%) | 18 (23.4%) |
| $100,000 to $299,999 | 9 (17.6%) | 52 (67.5%) |
| $300,000 to $499,999 | 0 (0.0%) | 0 (0.0%) |
| $500,000 to $749,999 | 0 (0.0%) | 7 (9.1%) |
| $750,000 to $999,999 | 0 (0.0%) | 0 (0.0%) |
| $1,000,000 or more | 0 (0.0%) | 0 (0.0%) |
| Total | 51 (100.0%) | 77 (100.0%) |
Household Income by Mortgage Status in Langleyville
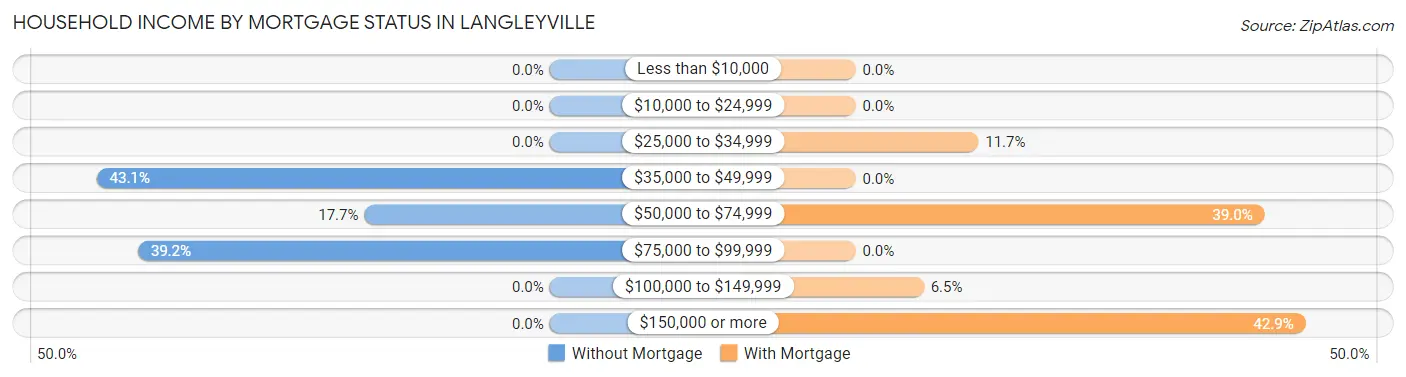
| Household Income | Without Mortgage | With Mortgage |
| Less than $10,000 | 0 (0.0%) | 0 (0.0%) |
| $10,000 to $24,999 | 0 (0.0%) | 0 (0.0%) |
| $25,000 to $34,999 | 0 (0.0%) | 9 (11.7%) |
| $35,000 to $49,999 | 22 (43.1%) | 0 (0.0%) |
| $50,000 to $74,999 | 9 (17.6%) | 30 (39.0%) |
| $75,000 to $99,999 | 20 (39.2%) | 0 (0.0%) |
| $100,000 to $149,999 | 0 (0.0%) | 5 (6.5%) |
| $150,000 or more | 0 (0.0%) | 33 (42.9%) |
| Total | 51 (100.0%) | 77 (100.0%) |
Property Value to Household Income Ratio in Langleyville
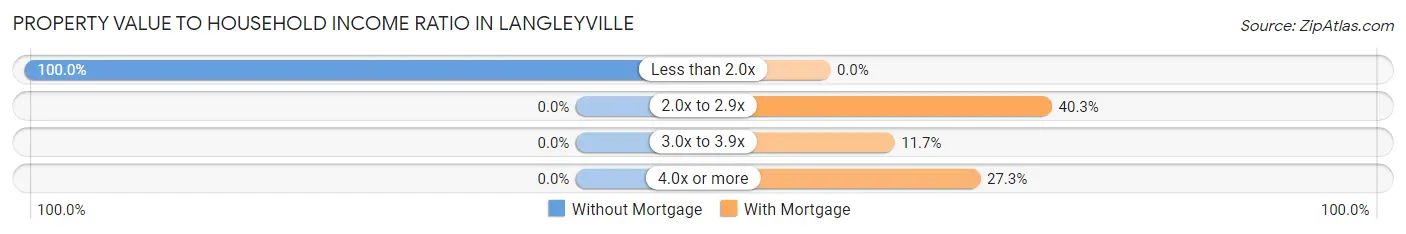
| Value-to-Income Ratio | Without Mortgage | With Mortgage |
| Less than 2.0x | 51 (100.0%) | 0 (0.0%) |
| 2.0x to 2.9x | 0 (0.0%) | 31 (40.3%) |
| 3.0x to 3.9x | 0 (0.0%) | 9 (11.7%) |
| 4.0x or more | 0 (0.0%) | 21 (27.3%) |
| Total | 51 (100.0%) | 77 (100.0%) |
Real Estate Taxes by Mortgage Status in Langleyville
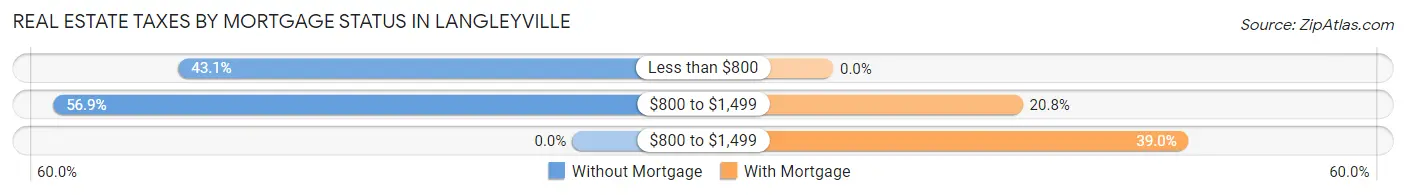
| Property Taxes | Without Mortgage | With Mortgage |
| Less than $800 | 22 (43.1%) | 0 (0.0%) |
| $800 to $1,499 | 29 (56.9%) | 16 (20.8%) |
| $800 to $1,499 | 0 (0.0%) | 30 (39.0%) |
| Total | 51 (100.0%) | 77 (100.0%) |
Health & Disability in Langleyville
Health Insurance Coverage by Age in Langleyville
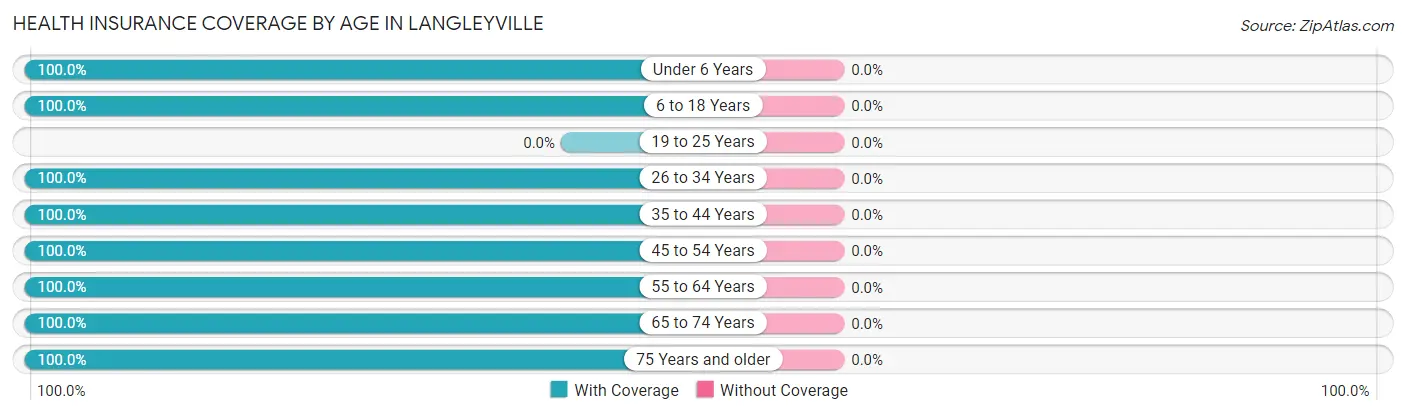
| Age Bracket | With Coverage | Without Coverage |
| Under 6 Years | 15 (100.0%) | 0 (0.0%) |
| 6 to 18 Years | 50 (100.0%) | 0 (0.0%) |
| 19 to 25 Years | 0 (0.0%) | 0 (0.0%) |
| 26 to 34 Years | 29 (100.0%) | 0 (0.0%) |
| 35 to 44 Years | 23 (100.0%) | 0 (0.0%) |
| 45 to 54 Years | 26 (100.0%) | 0 (0.0%) |
| 55 to 64 Years | 21 (100.0%) | 0 (0.0%) |
| 65 to 74 Years | 162 (100.0%) | 0 (0.0%) |
| 75 Years and older | 16 (100.0%) | 0 (0.0%) |
| Total | 342 (100.0%) | 0 (0.0%) |
Health Insurance Coverage by Citizenship Status in Langleyville
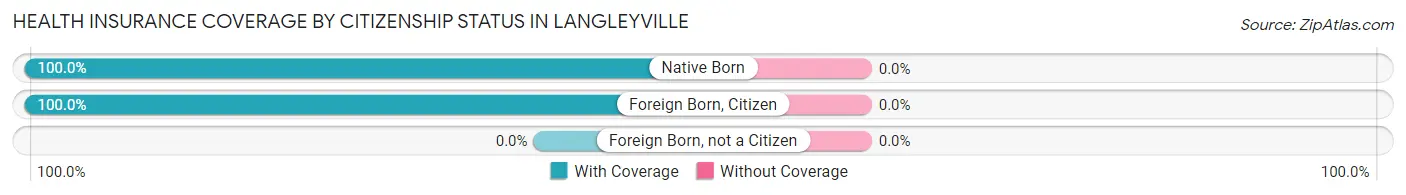
| Citizenship Status | With Coverage | Without Coverage |
| Native Born | 15 (100.0%) | 0 (0.0%) |
| Foreign Born, Citizen | 50 (100.0%) | 0 (0.0%) |
| Foreign Born, not a Citizen | 0 (0.0%) | 0 (0.0%) |
Health Insurance Coverage by Household Income in Langleyville
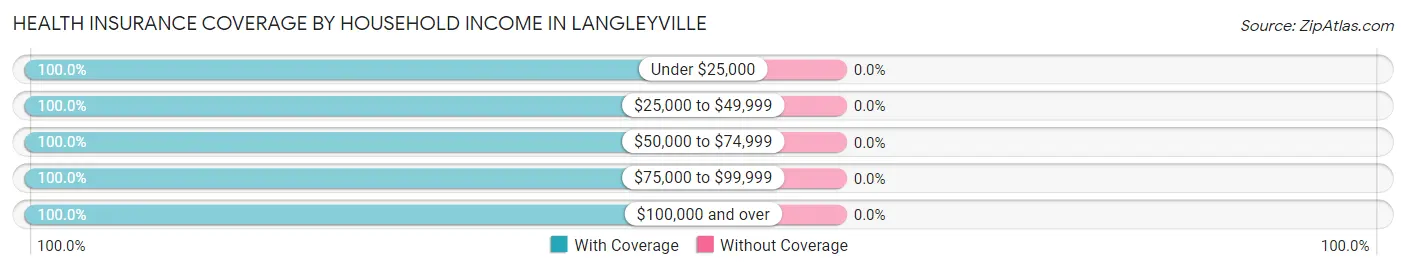
| Household Income | With Coverage | Without Coverage |
| Under $25,000 | 9 (100.0%) | 0 (0.0%) |
| $25,000 to $49,999 | 129 (100.0%) | 0 (0.0%) |
| $50,000 to $74,999 | 55 (100.0%) | 0 (0.0%) |
| $75,000 to $99,999 | 53 (100.0%) | 0 (0.0%) |
| $100,000 and over | 96 (100.0%) | 0 (0.0%) |
Public vs Private Health Insurance Coverage by Age in Langleyville
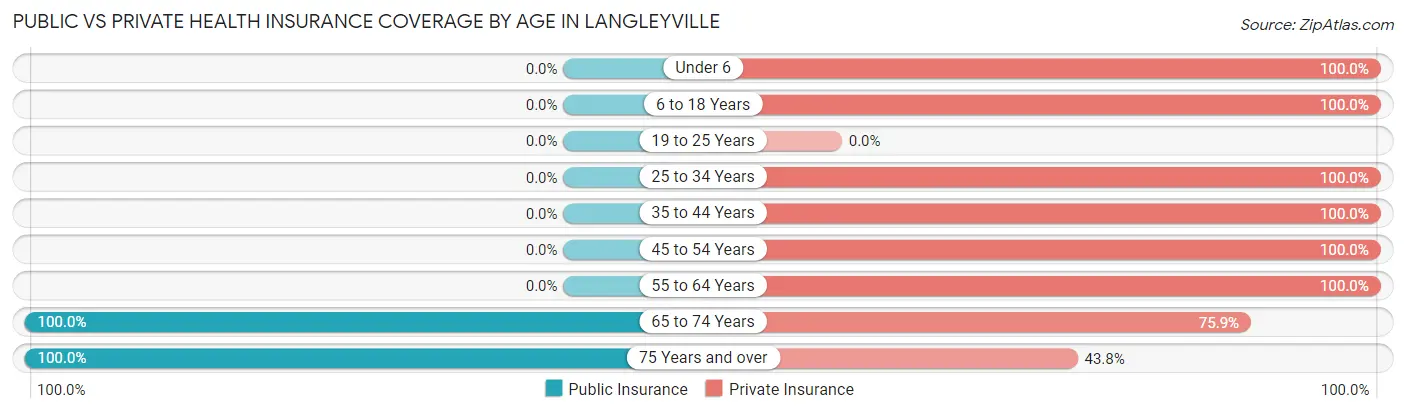
| Age Bracket | Public Insurance | Private Insurance |
| Under 6 | 0 (0.0%) | 15 (100.0%) |
| 6 to 18 Years | 0 (0.0%) | 50 (100.0%) |
| 19 to 25 Years | 0 (0.0%) | 0 (0.0%) |
| 25 to 34 Years | 0 (0.0%) | 29 (100.0%) |
| 35 to 44 Years | 0 (0.0%) | 23 (100.0%) |
| 45 to 54 Years | 0 (0.0%) | 26 (100.0%) |
| 55 to 64 Years | 0 (0.0%) | 21 (100.0%) |
| 65 to 74 Years | 162 (100.0%) | 123 (75.9%) |
| 75 Years and over | 16 (100.0%) | 7 (43.8%) |
| Total | 178 (52.0%) | 294 (86.0%) |
Disability Status by Sex by Age in Langleyville
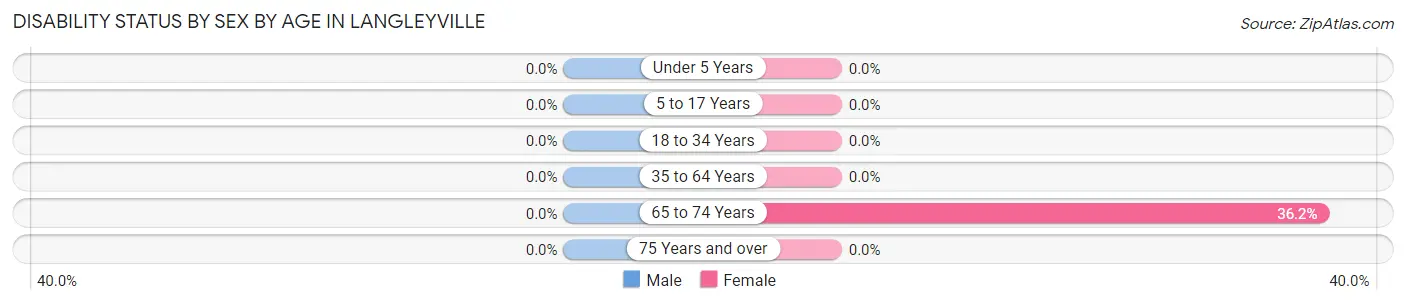
| Age Bracket | Male | Female |
| Under 5 Years | 0 (0.0%) | 0 (0.0%) |
| 5 to 17 Years | 0 (0.0%) | 0 (0.0%) |
| 18 to 34 Years | 0 (0.0%) | 0 (0.0%) |
| 35 to 64 Years | 0 (0.0%) | 0 (0.0%) |
| 65 to 74 Years | 0 (0.0%) | 38 (36.2%) |
| 75 Years and over | 0 (0.0%) | 0 (0.0%) |
Disability Class by Sex by Age in Langleyville
Disability Class: Hearing Difficulty
| Age Bracket | Male | Female |
| Under 5 Years | 0 (0.0%) | 0 (0.0%) |
| 5 to 17 Years | 0 (0.0%) | 0 (0.0%) |
| 18 to 34 Years | 0 (0.0%) | 0 (0.0%) |
| 35 to 64 Years | 0 (0.0%) | 0 (0.0%) |
| 65 to 74 Years | 0 (0.0%) | 0 (0.0%) |
| 75 Years and over | 0 (0.0%) | 0 (0.0%) |
Disability Class: Vision Difficulty
| Age Bracket | Male | Female |
| Under 5 Years | 0 (0.0%) | 0 (0.0%) |
| 5 to 17 Years | 0 (0.0%) | 0 (0.0%) |
| 18 to 34 Years | 0 (0.0%) | 0 (0.0%) |
| 35 to 64 Years | 0 (0.0%) | 0 (0.0%) |
| 65 to 74 Years | 0 (0.0%) | 0 (0.0%) |
| 75 Years and over | 0 (0.0%) | 0 (0.0%) |
Disability Class: Cognitive Difficulty
| Age Bracket | Male | Female |
| 5 to 17 Years | 0 (0.0%) | 0 (0.0%) |
| 18 to 34 Years | 0 (0.0%) | 0 (0.0%) |
| 35 to 64 Years | 0 (0.0%) | 0 (0.0%) |
| 65 to 74 Years | 0 (0.0%) | 0 (0.0%) |
| 75 Years and over | 0 (0.0%) | 0 (0.0%) |
Disability Class: Ambulatory Difficulty
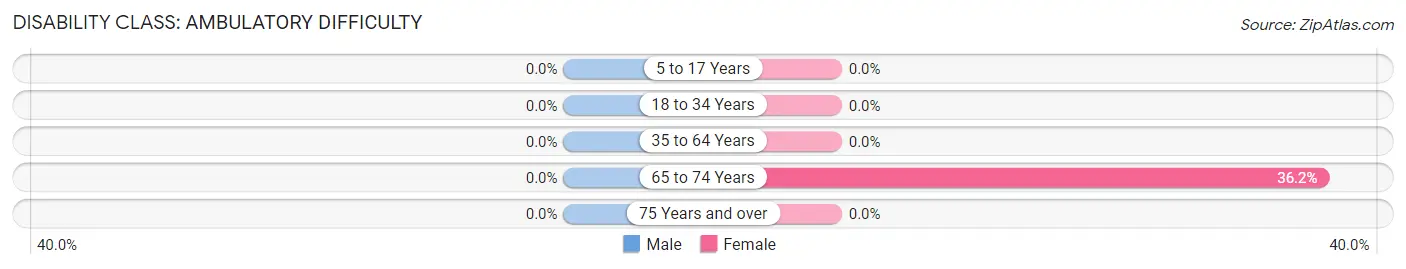
| Age Bracket | Male | Female |
| 5 to 17 Years | 0 (0.0%) | 0 (0.0%) |
| 18 to 34 Years | 0 (0.0%) | 0 (0.0%) |
| 35 to 64 Years | 0 (0.0%) | 0 (0.0%) |
| 65 to 74 Years | 0 (0.0%) | 38 (36.2%) |
| 75 Years and over | 0 (0.0%) | 0 (0.0%) |
Disability Class: Self-Care Difficulty

| Age Bracket | Male | Female |
| 5 to 17 Years | 0 (0.0%) | 0 (0.0%) |
| 18 to 34 Years | 0 (0.0%) | 0 (0.0%) |
| 35 to 64 Years | 0 (0.0%) | 0 (0.0%) |
| 65 to 74 Years | 0 (0.0%) | 0 (0.0%) |
| 75 Years and over | 0 (0.0%) | 0 (0.0%) |
Technology Access in Langleyville
Computing Device Access in Langleyville
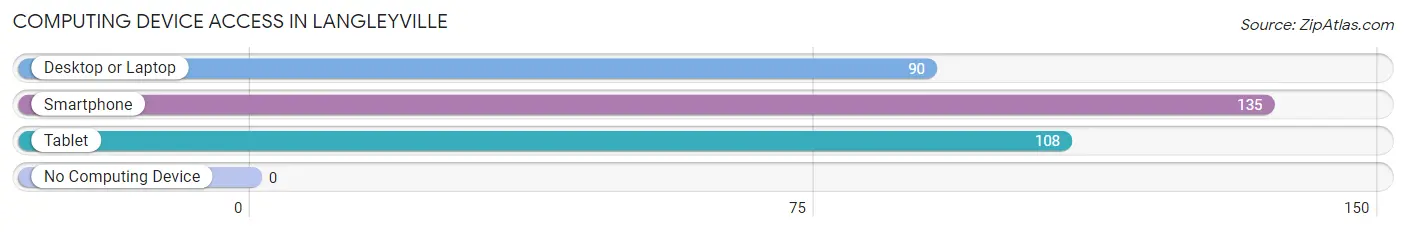
| Device Type | # Households | % Households |
| Desktop or Laptop | 90 | 63.4% |
| Smartphone | 135 | 95.1% |
| Tablet | 108 | 76.1% |
| No Computing Device | 0 | 0.0% |
| Total | 142 | 100.0% |
Internet Access in Langleyville
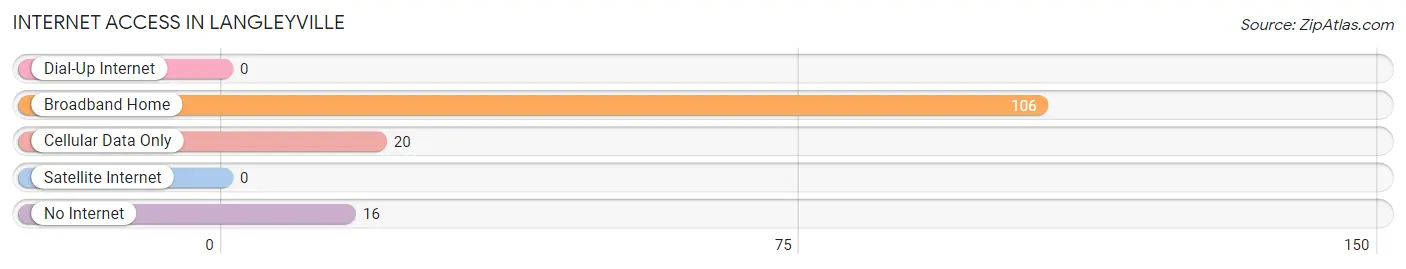
| Internet Type | # Households | % Households |
| Dial-Up Internet | 0 | 0.0% |
| Broadband Home | 106 | 74.7% |
| Cellular Data Only | 20 | 14.1% |
| Satellite Internet | 0 | 0.0% |
| No Internet | 16 | 11.3% |
| Total | 142 | 100.0% |
Langleyville Summary
Langleyville is a small village located in the state of Illinois, United States. It is situated in the northern part of the state, in the county of Ogle. The village has a population of around 1,000 people, and is located about 30 miles west of Rockford.
History
Langleyville was founded in 1837 by William Langley, a settler from England. He purchased the land from the government and began to build a small village. The village was named after him, and it quickly grew in size. By the late 1800s, Langleyville had become a thriving community with a population of over 500 people.
The village was home to a variety of businesses, including a general store, a blacksmith, a post office, and a school. The village also had a railroad station, which allowed for easy transportation of goods and people.
In the early 1900s, Langleyville experienced a period of growth and prosperity. The village was home to several factories, including a brickyard, a sawmill, and a flour mill. The village also had a variety of stores, including a grocery store, a drug store, and a hardware store.
Geography
Langleyville is located in the northern part of the state of Illinois, in the county of Ogle. The village is situated on the banks of the Rock River, and is surrounded by rolling hills and farmland. The village is located about 30 miles west of Rockford, and is about an hour and a half drive from Chicago.
The village has a total area of 0.6 square miles, all of which is land. The village has a humid continental climate, with hot summers and cold winters. The average temperature in the summer is around 75 degrees Fahrenheit, and the average temperature in the winter is around 25 degrees Fahrenheit.
Economy
Langleyville is a small village, and the economy is largely based on agriculture. The village is home to several farms, which produce a variety of crops, including corn, soybeans, and wheat. The village also has a few small businesses, including a general store, a hardware store, and a post office.
Demographics
As of the 2010 census, the population of Langleyville was 1,000 people. The village is predominantly white, with about 95% of the population being white. The remaining 5% of the population is made up of African Americans, Hispanics, and other ethnicities. The median household income in the village is around $50,000, and the median home value is around $150,000.
Conclusion
Langleyville is a small village located in the northern part of the state of Illinois. The village was founded in 1837 by William Langley, and has since grown to a population of 1,000 people. The village is largely based on agriculture, and is home to several farms and small businesses. The village is predominantly white, with a median household income of around $50,000 and a median home value of around $150,000.
Common Questions
What is Per Capita Income in Langleyville?
Per Capita income in Langleyville is $32,085.
What is the Median Family Income in Langleyville?
Median Family Income in Langleyville is $64,167.
What is the Median Household income in Langleyville?
Median Household Income in Langleyville is $70,179.
What is Income or Wage Gap in Langleyville?
Income or Wage Gap in Langleyville is 43.3%.
Women in Langleyville earn 56.7 cents for every dollar earned by a man.
What is Inequality or Gini Index in Langleyville?
Inequality or Gini Index in Langleyville is 0.27.
What is the Total Population of Langleyville?
Total Population of Langleyville is 342.
What is the Total Male Population of Langleyville?
Total Male Population of Langleyville is 128.
What is the Total Female Population of Langleyville?
Total Female Population of Langleyville is 214.
What is the Ratio of Males per 100 Females in Langleyville?
There are 59.81 Males per 100 Females in Langleyville.
What is the Ratio of Females per 100 Males in Langleyville?
There are 167.19 Females per 100 Males in Langleyville.
What is the Median Population Age in Langleyville?
Median Population Age in Langleyville is 65.1 Years.
What is the Average Family Size in Langleyville
Average Family Size in Langleyville is 2.3 People.
What is the Average Household Size in Langleyville
Average Household Size in Langleyville is 2.4 People.
How Large is the Labor Force in Langleyville?
There are 112 People in the Labor Forcein in Langleyville.
What is the Percentage of People in the Labor Force in Langleyville?
40.4% of People are in the Labor Force in Langleyville.