St Joseph, IL Map & Demographics
St Joseph Map
St Joseph Overview
$42,317
PER CAPITA INCOME
$128,272
AVG FAMILY INCOME
$101,087
AVG HOUSEHOLD INCOME
16.5%
WAGE / INCOME GAP [ % ]
83.5¢/ $1
WAGE / INCOME GAP [ $ ]
0.38
INEQUALITY / GINI INDEX
3,931
TOTAL POPULATION
1,807
MALE POPULATION
2,124
FEMALE POPULATION
85.08
MALES / 100 FEMALES
117.54
FEMALES / 100 MALES
39.8
MEDIAN AGE
3.4
AVG FAMILY SIZE
2.6
AVG HOUSEHOLD SIZE
2,001
LABOR FORCE [ PEOPLE ]
65.9%
PERCENT IN LABOR FORCE
0.7%
UNEMPLOYMENT RATE
Income in St Joseph
Income Overview in St Joseph
Per Capita Income in St Joseph is $42,317, while median incomes of families and households are $128,272 and $101,087 respectively.
| Characteristic | Number | Measure |
| Per Capita Income | 3,931 | $42,317 |
| Median Family Income | 981 | $128,272 |
| Mean Family Income | 981 | $129,478 |
| Median Household Income | 1,494 | $101,087 |
| Mean Household Income | 1,494 | $107,751 |
| Income Deficit | 981 | $0 |
| Wage / Income Gap (%) | 3,931 | 16.53% |
| Wage / Income Gap ($) | 3,931 | 83.47¢ per $1 |
| Gini / Inequality Index | 3,931 | 0.38 |
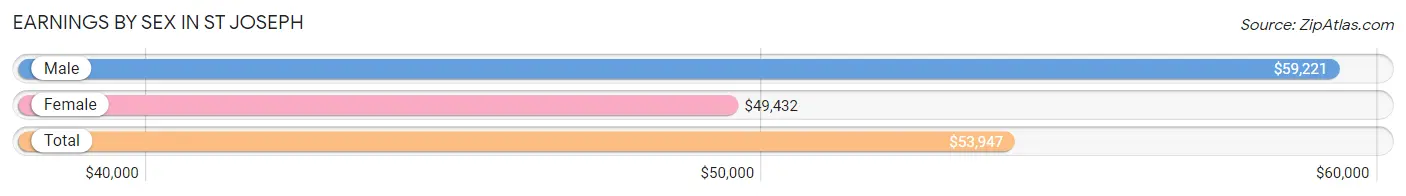
Earnings by Sex in St Joseph
Average Earnings in St Joseph are $53,947, $59,221 for men and $49,432 for women, a difference of 16.5%.
| Sex | Number | Average Earnings |
| Male | 973 (47.0%) | $59,221 |
| Female | 1,095 (52.9%) | $49,432 |
| Total | 2,068 (100.0%) | $53,947 |
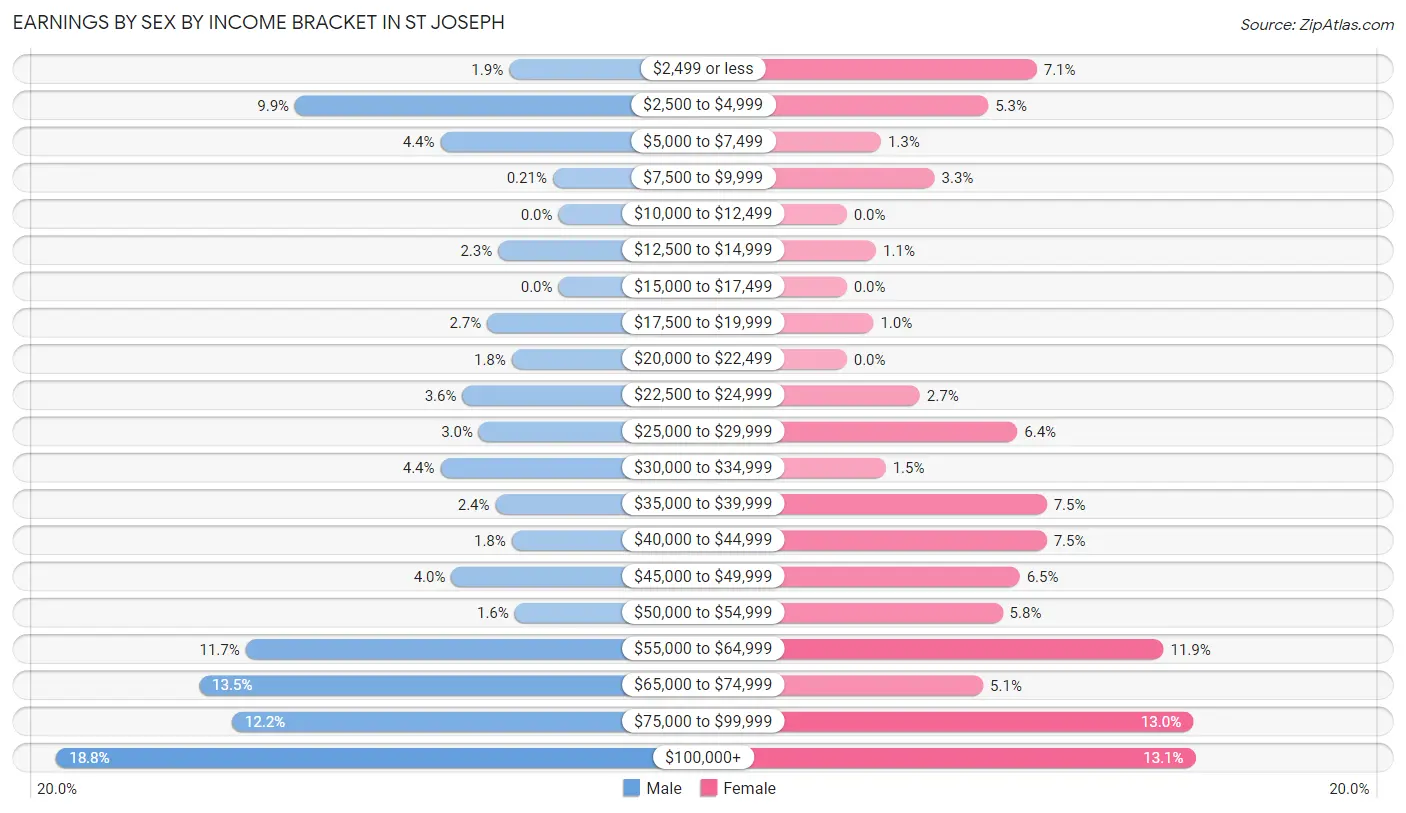
Earnings by Sex by Income Bracket in St Joseph
The most common earnings brackets in St Joseph are $100,000+ for men (183 | 18.8%) and $100,000+ for women (143 | 13.1%).
| Income | Male | Female |
| $2,499 or less | 18 (1.8%) | 78 (7.1%) |
| $2,500 to $4,999 | 96 (9.9%) | 58 (5.3%) |
| $5,000 to $7,499 | 43 (4.4%) | 14 (1.3%) |
| $7,500 to $9,999 | 2 (0.2%) | 36 (3.3%) |
| $10,000 to $12,499 | 0 (0.0%) | 0 (0.0%) |
| $12,500 to $14,999 | 22 (2.3%) | 12 (1.1%) |
| $15,000 to $17,499 | 0 (0.0%) | 0 (0.0%) |
| $17,500 to $19,999 | 26 (2.7%) | 11 (1.0%) |
| $20,000 to $22,499 | 17 (1.8%) | 0 (0.0%) |
| $22,500 to $24,999 | 35 (3.6%) | 30 (2.7%) |
| $25,000 to $29,999 | 29 (3.0%) | 70 (6.4%) |
| $30,000 to $34,999 | 43 (4.4%) | 16 (1.5%) |
| $35,000 to $39,999 | 23 (2.4%) | 82 (7.5%) |
| $40,000 to $44,999 | 17 (1.8%) | 82 (7.5%) |
| $45,000 to $49,999 | 39 (4.0%) | 71 (6.5%) |
| $50,000 to $54,999 | 16 (1.6%) | 64 (5.8%) |
| $55,000 to $64,999 | 114 (11.7%) | 130 (11.9%) |
| $65,000 to $74,999 | 131 (13.5%) | 56 (5.1%) |
| $75,000 to $99,999 | 119 (12.2%) | 142 (13.0%) |
| $100,000+ | 183 (18.8%) | 143 (13.1%) |
| Total | 973 (100.0%) | 1,095 (100.0%) |
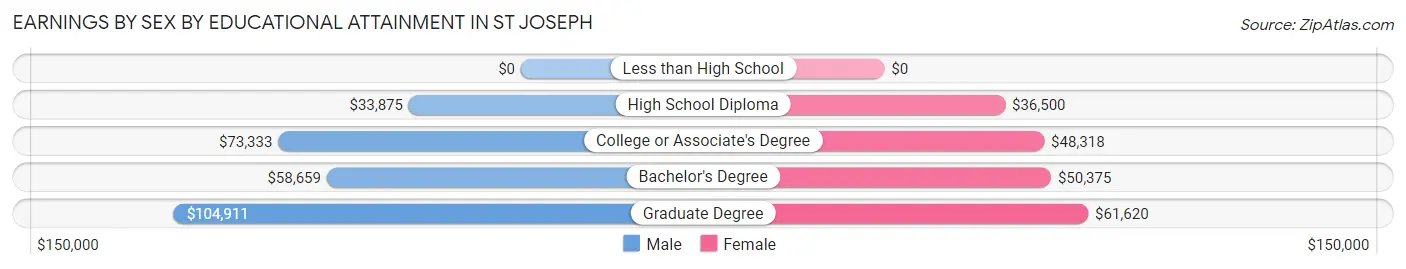
Earnings by Sex by Educational Attainment in St Joseph
Average earnings in St Joseph are $65,227 for men and $53,409 for women, a difference of 18.1%. Men with an educational attainment of graduate degree enjoy the highest average annual earnings of $104,911, while those with high school diploma education earn the least with $33,875. Women with an educational attainment of graduate degree earn the most with the average annual earnings of $61,620, while those with high school diploma education have the smallest earnings of $36,500.
| Educational Attainment | Male Income | Female Income |
| Less than High School | - | - |
| High School Diploma | $33,875 | $36,500 |
| College or Associate's Degree | $73,333 | $48,318 |
| Bachelor's Degree | $58,659 | $50,375 |
| Graduate Degree | $104,911 | $61,620 |
| Total | $65,227 | $53,409 |
Family Income in St Joseph
Family Income Brackets in St Joseph
According to the St Joseph family income data, there are 333 families falling into the $100,000 to $149,999 income range, which is the most common income bracket and makes up 33.9% of all families.
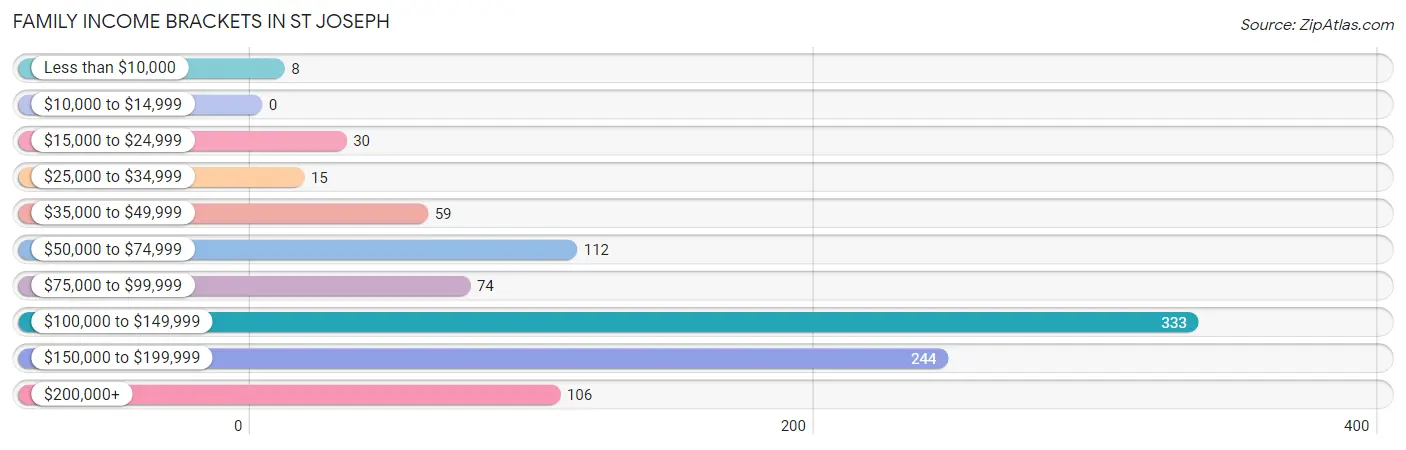
| Income Bracket | # Families | % Families |
| Less than $10,000 | 8 | 0.8% |
| $10,000 to $14,999 | 0 | 0.0% |
| $15,000 to $24,999 | 30 | 3.1% |
| $25,000 to $34,999 | 15 | 1.5% |
| $35,000 to $49,999 | 59 | 6.0% |
| $50,000 to $74,999 | 112 | 11.4% |
| $75,000 to $99,999 | 74 | 7.5% |
| $100,000 to $149,999 | 333 | 33.9% |
| $150,000 to $199,999 | 244 | 24.9% |
| $200,000+ | 106 | 10.8% |
Family Income by Famaliy Size in St Joseph
4-person families (288 | 29.4%) account for the highest median family income in St Joseph with $151,300 per family, while 2-person families (341 | 34.8%) have the highest median income of $52,463 per family member.
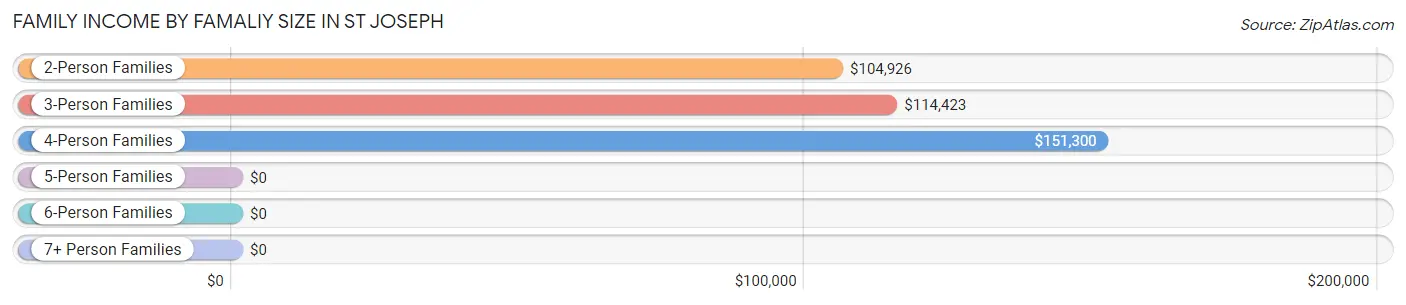
| Income Bracket | # Families | Median Income |
| 2-Person Families | 341 (34.8%) | $104,926 |
| 3-Person Families | 268 (27.3%) | $114,423 |
| 4-Person Families | 288 (29.4%) | $151,300 |
| 5-Person Families | 59 (6.0%) | $0 |
| 6-Person Families | 25 (2.5%) | $0 |
| 7+ Person Families | 0 (0.0%) | $0 |
| Total | 981 (100.0%) | $128,272 |
Family Income by Number of Earners in St Joseph
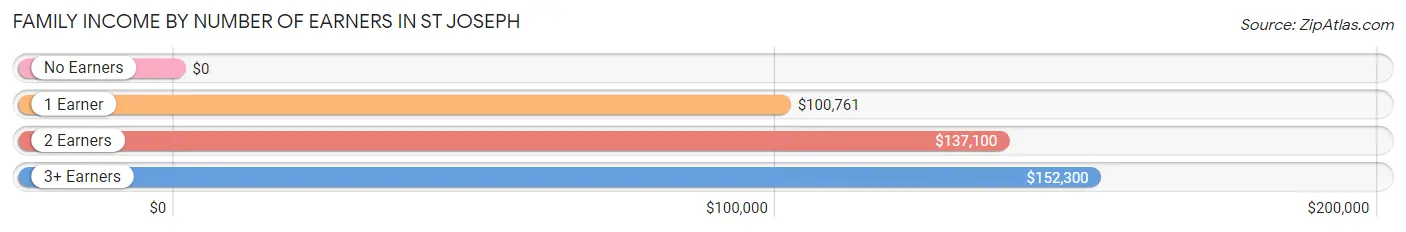
| Number of Earners | # Families | Median Income |
| No Earners | 103 (10.5%) | $0 |
| 1 Earner | 262 (26.7%) | $100,761 |
| 2 Earners | 470 (47.9%) | $137,100 |
| 3+ Earners | 146 (14.9%) | $152,300 |
| Total | 981 (100.0%) | $128,272 |
Household Income in St Joseph
Household Income Brackets in St Joseph
With 357 households falling in the category, the $100,000 to $149,999 income range is the most frequent in St Joseph, accounting for 23.9% of all households.
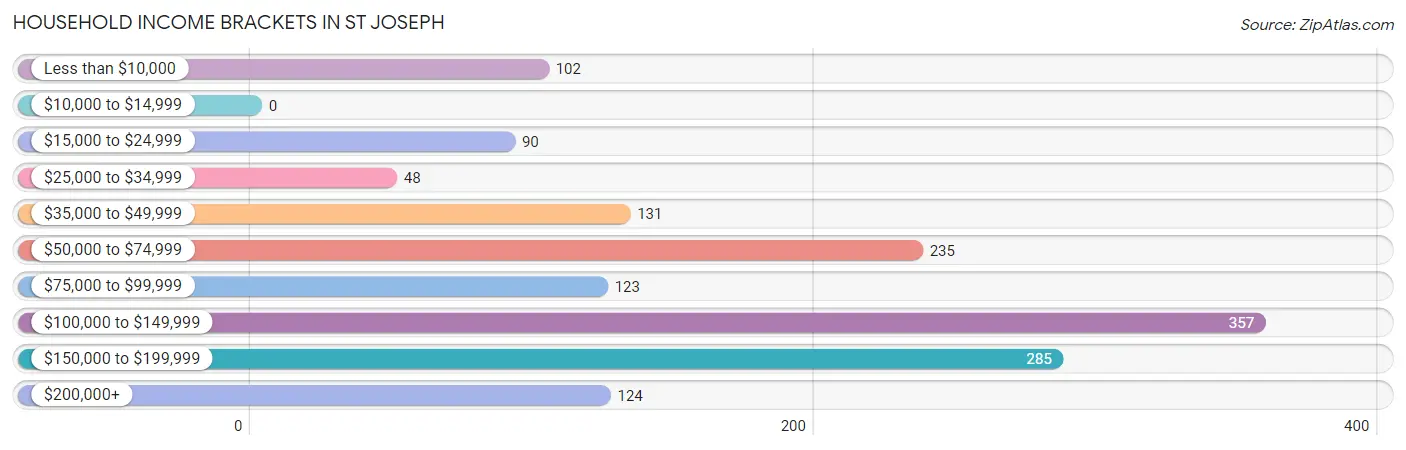
| Income Bracket | # Households | % Households |
| Less than $10,000 | 102 | 6.8% |
| $10,000 to $14,999 | 0 | 0.0% |
| $15,000 to $24,999 | 90 | 6.0% |
| $25,000 to $34,999 | 48 | 3.2% |
| $35,000 to $49,999 | 131 | 8.8% |
| $50,000 to $74,999 | 235 | 15.7% |
| $75,000 to $99,999 | 123 | 8.2% |
| $100,000 to $149,999 | 357 | 23.9% |
| $150,000 to $199,999 | 285 | 19.1% |
| $200,000+ | 124 | 8.3% |
Household Income by Householder Age in St Joseph
The median household income in St Joseph is $101,087, with the highest median household income of $127,537 found in the 25 to 44 years age bracket for the primary householder. A total of 449 households (30.0%) fall into this category. Meanwhile, the 65+ years age bracket for the primary householder has the lowest median household income of $43,974, with 476 households (31.9%) in this group.
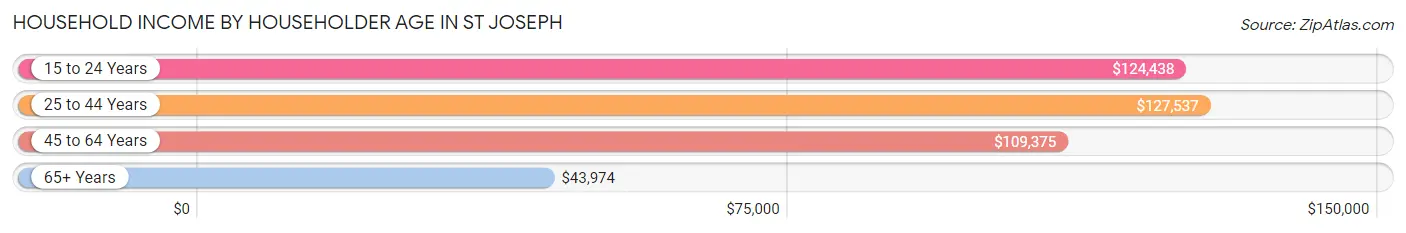
| Income Bracket | # Households | Median Income |
| 15 to 24 Years | 59 (4.0%) | $124,438 |
| 25 to 44 Years | 449 (30.0%) | $127,537 |
| 45 to 64 Years | 510 (34.1%) | $109,375 |
| 65+ Years | 476 (31.9%) | $43,974 |
| Total | 1,494 (100.0%) | $101,087 |
Poverty in St Joseph
Income Below Poverty by Sex and Age in St Joseph
With 3.2% poverty level for males and 9.4% for females among the residents of St Joseph, 18 to 24 year old males and 65 to 74 year old females are the most vulnerable to poverty, with 26 males (23.2%) and 123 females (41.1%) in their respective age groups living below the poverty level.
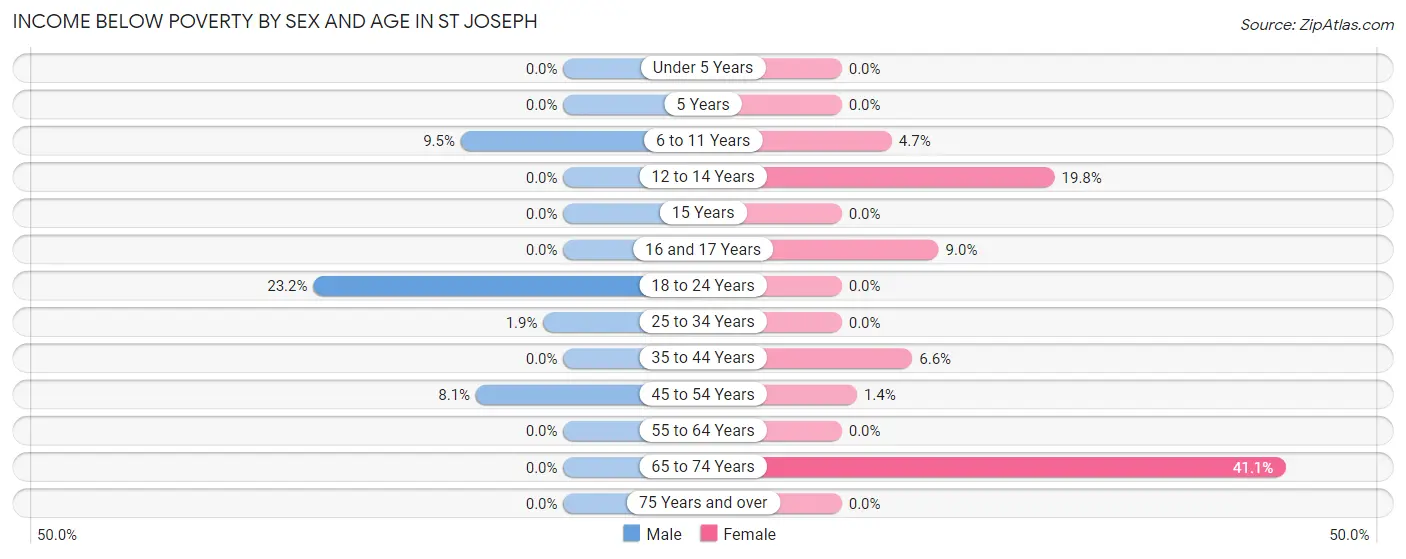
| Age Bracket | Male | Female |
| Under 5 Years | 0 (0.0%) | 0 (0.0%) |
| 5 Years | 0 (0.0%) | 0 (0.0%) |
| 6 to 11 Years | 14 (9.5%) | 8 (4.6%) |
| 12 to 14 Years | 0 (0.0%) | 32 (19.8%) |
| 15 Years | 0 (0.0%) | 0 (0.0%) |
| 16 and 17 Years | 0 (0.0%) | 8 (9.0%) |
| 18 to 24 Years | 26 (23.2%) | 0 (0.0%) |
| 25 to 34 Years | 3 (1.9%) | 0 (0.0%) |
| 35 to 44 Years | 0 (0.0%) | 27 (6.6%) |
| 45 to 54 Years | 15 (8.1%) | 2 (1.4%) |
| 55 to 64 Years | 0 (0.0%) | 0 (0.0%) |
| 65 to 74 Years | 0 (0.0%) | 123 (41.1%) |
| 75 Years and over | 0 (0.0%) | 0 (0.0%) |
| Total | 58 (3.2%) | 200 (9.4%) |
Income Above Poverty by Sex and Age in St Joseph
According to the poverty statistics in St Joseph, males aged under 5 years and females aged under 5 years are the age groups that are most secure financially, with 100.0% of males and 100.0% of females in these age groups living above the poverty line.
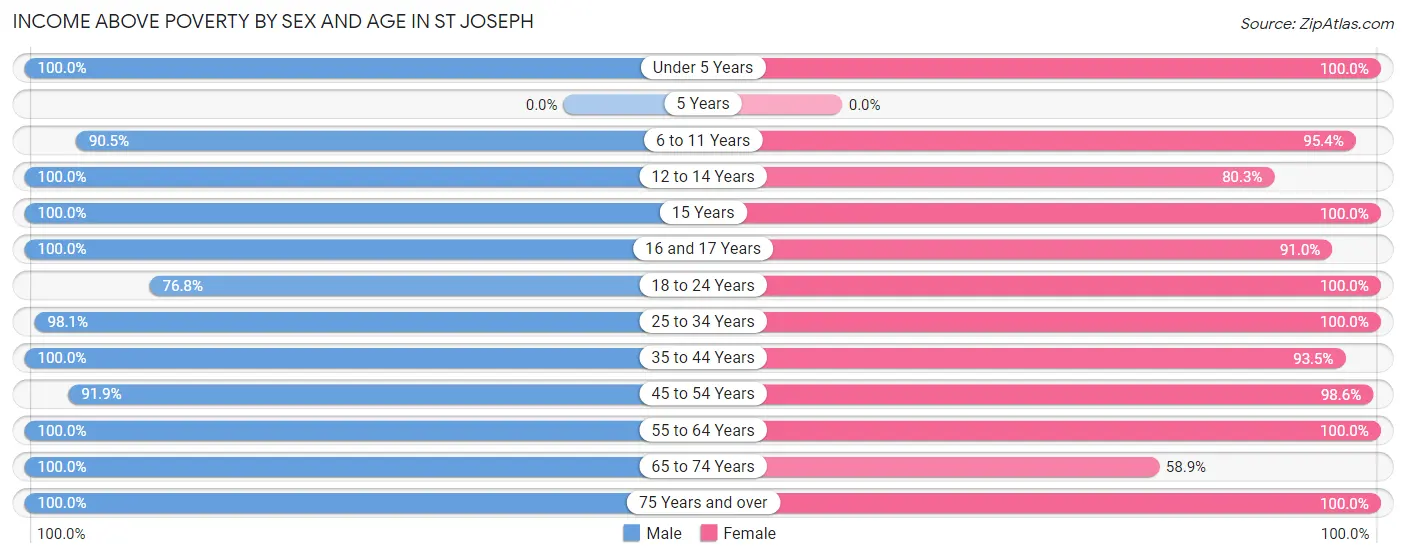
| Age Bracket | Male | Female |
| Under 5 Years | 145 (100.0%) | 47 (100.0%) |
| 5 Years | 0 (0.0%) | 0 (0.0%) |
| 6 to 11 Years | 133 (90.5%) | 164 (95.4%) |
| 12 to 14 Years | 165 (100.0%) | 130 (80.2%) |
| 15 Years | 12 (100.0%) | 44 (100.0%) |
| 16 and 17 Years | 103 (100.0%) | 81 (91.0%) |
| 18 to 24 Years | 86 (76.8%) | 150 (100.0%) |
| 25 to 34 Years | 158 (98.1%) | 174 (100.0%) |
| 35 to 44 Years | 216 (100.0%) | 385 (93.4%) |
| 45 to 54 Years | 170 (91.9%) | 140 (98.6%) |
| 55 to 64 Years | 321 (100.0%) | 296 (100.0%) |
| 65 to 74 Years | 181 (100.0%) | 176 (58.9%) |
| 75 Years and over | 59 (100.0%) | 137 (100.0%) |
| Total | 1,749 (96.8%) | 1,924 (90.6%) |
Income Below Poverty Among Married-Couple Families in St Joseph
The poverty statistics for married-couple families in St Joseph show that 1.9% or 15 of the total 788 families live below the poverty line. Families with 1 or 2 children have the highest poverty rate of 4.0%, comprising of 15 families. On the other hand, families with no children have the lowest poverty rate of 0.0%, which includes 0 families.
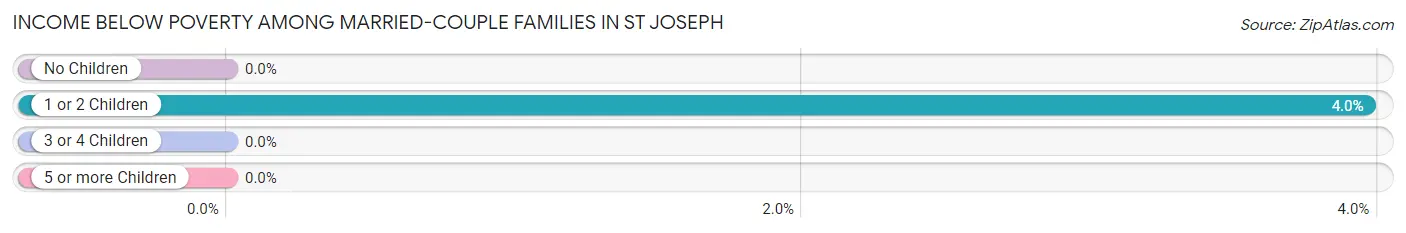
| Children | Above Poverty | Below Poverty |
| No Children | 360 (100.0%) | 0 (0.0%) |
| 1 or 2 Children | 364 (96.0%) | 15 (4.0%) |
| 3 or 4 Children | 49 (100.0%) | 0 (0.0%) |
| 5 or more Children | 0 (0.0%) | 0 (0.0%) |
| Total | 773 (98.1%) | 15 (1.9%) |
Income Below Poverty Among Single-Parent Households in St Joseph
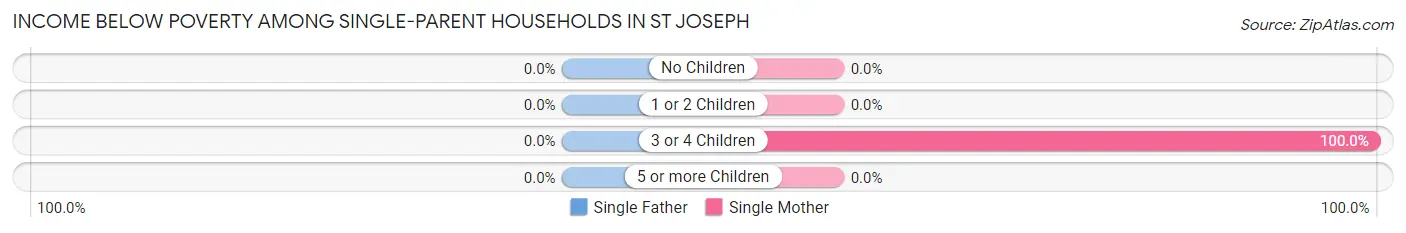
| Children | Single Father | Single Mother |
| No Children | 0 (0.0%) | 0 (0.0%) |
| 1 or 2 Children | 0 (0.0%) | 0 (0.0%) |
| 3 or 4 Children | 0 (0.0%) | 8 (100.0%) |
| 5 or more Children | 0 (0.0%) | 0 (0.0%) |
| Total | 0 (0.0%) | 8 (4.5%) |
Income Below Poverty Among Married-Couple vs Single-Parent Households in St Joseph
The poverty data for St Joseph shows that 15 of the married-couple family households (1.9%) and 8 of the single-parent households (4.2%) are living below the poverty level. Within the married-couple family households, those with 1 or 2 children have the highest poverty rate, with 15 households (4.0%) falling below the poverty line. Among the single-parent households, those with 3 or 4 children have the highest poverty rate, with 8 household (100.0%) living below poverty.
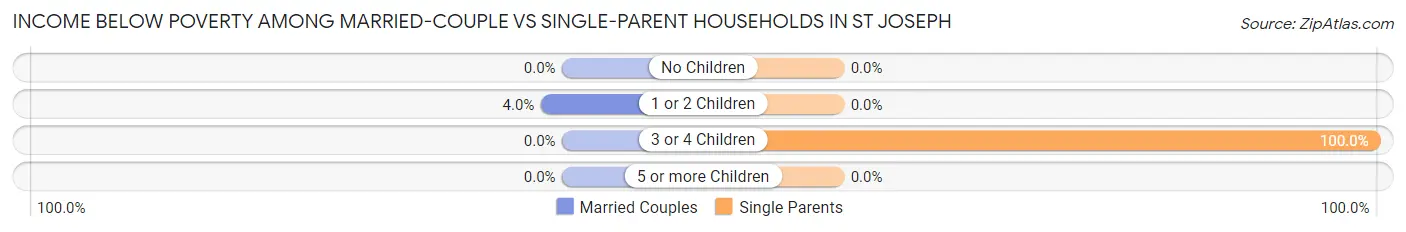
| Children | Married-Couple Families | Single-Parent Households |
| No Children | 0 (0.0%) | 0 (0.0%) |
| 1 or 2 Children | 15 (4.0%) | 0 (0.0%) |
| 3 or 4 Children | 0 (0.0%) | 8 (100.0%) |
| 5 or more Children | 0 (0.0%) | 0 (0.0%) |
| Total | 15 (1.9%) | 8 (4.2%) |
Race in St Joseph
The most populous races in St Joseph are White / Caucasian (3,776 | 96.1%), Two or more Races (87 | 2.2%), and Hispanic or Latino (76 | 1.9%).
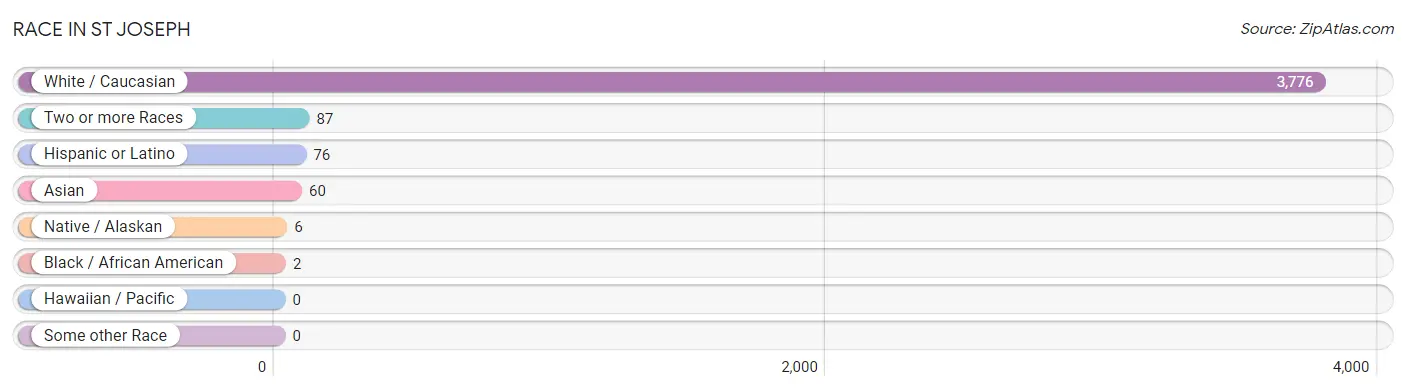
| Race | # Population | % Population |
| Asian | 60 | 1.5% |
| Black / African American | 2 | 0.1% |
| Hawaiian / Pacific | 0 | 0.0% |
| Hispanic or Latino | 76 | 1.9% |
| Native / Alaskan | 6 | 0.2% |
| White / Caucasian | 3,776 | 96.1% |
| Two or more Races | 87 | 2.2% |
| Some other Race | 0 | 0.0% |
| Total | 3,931 | 100.0% |
Ancestry in St Joseph
The most populous ancestries reported in St Joseph are German (1,100 | 28.0%), English (576 | 14.6%), Irish (412 | 10.5%), Italian (253 | 6.4%), and American (182 | 4.6%), together accounting for 64.2% of all St Joseph residents.
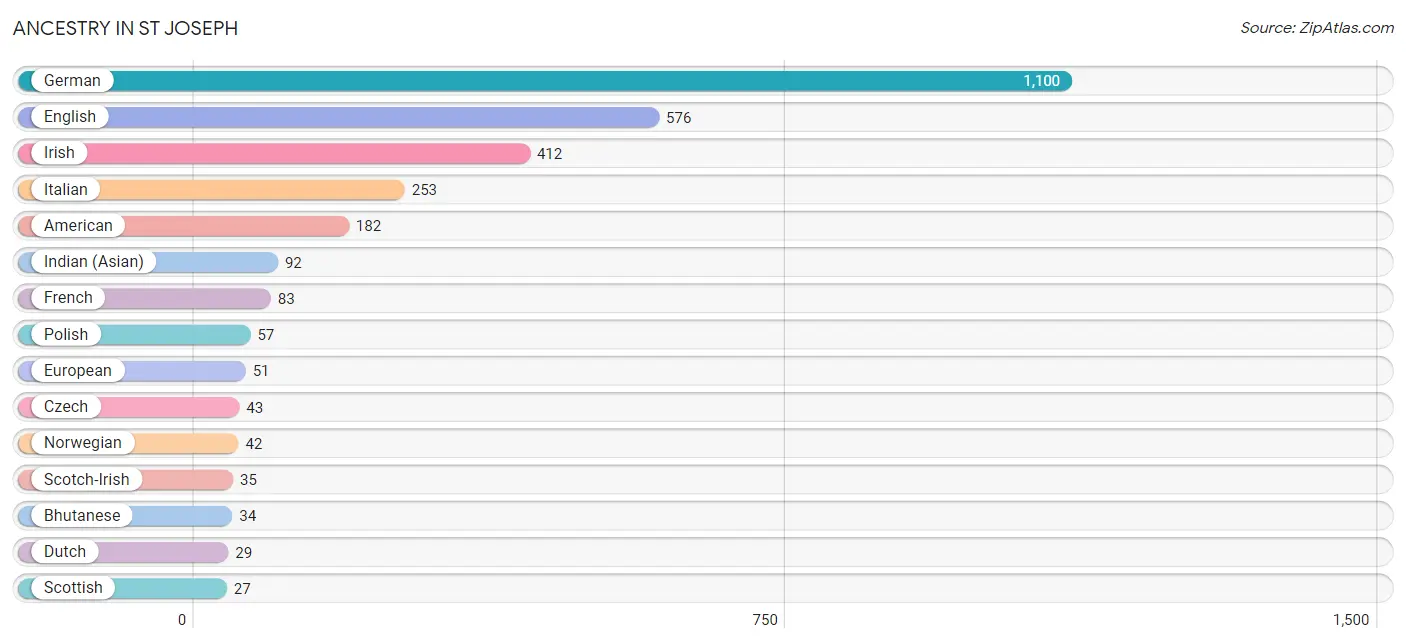
| Ancestry | # Population | % Population |
| American | 182 | 4.6% |
| Belgian | 10 | 0.3% |
| Bhutanese | 34 | 0.9% |
| British | 24 | 0.6% |
| Chilean | 26 | 0.7% |
| Comanche | 4 | 0.1% |
| Cuban | 17 | 0.4% |
| Czech | 43 | 1.1% |
| Dutch | 29 | 0.7% |
| English | 576 | 14.6% |
| European | 51 | 1.3% |
| French | 83 | 2.1% |
| German | 1,100 | 28.0% |
| Greek | 20 | 0.5% |
| Houma | 6 | 0.2% |
| Indian (Asian) | 92 | 2.3% |
| Irish | 412 | 10.5% |
| Italian | 253 | 6.4% |
| Mexican | 23 | 0.6% |
| Norwegian | 42 | 1.1% |
| Polish | 57 | 1.5% |
| Puerto Rican | 10 | 0.3% |
| Scotch-Irish | 35 | 0.9% |
| Scottish | 27 | 0.7% |
| South American | 26 | 0.7% |
| Swedish | 27 | 0.7% |
| Swiss | 15 | 0.4% |
| Welsh | 14 | 0.4% | View All 28 Rows |
Immigrants in St Joseph
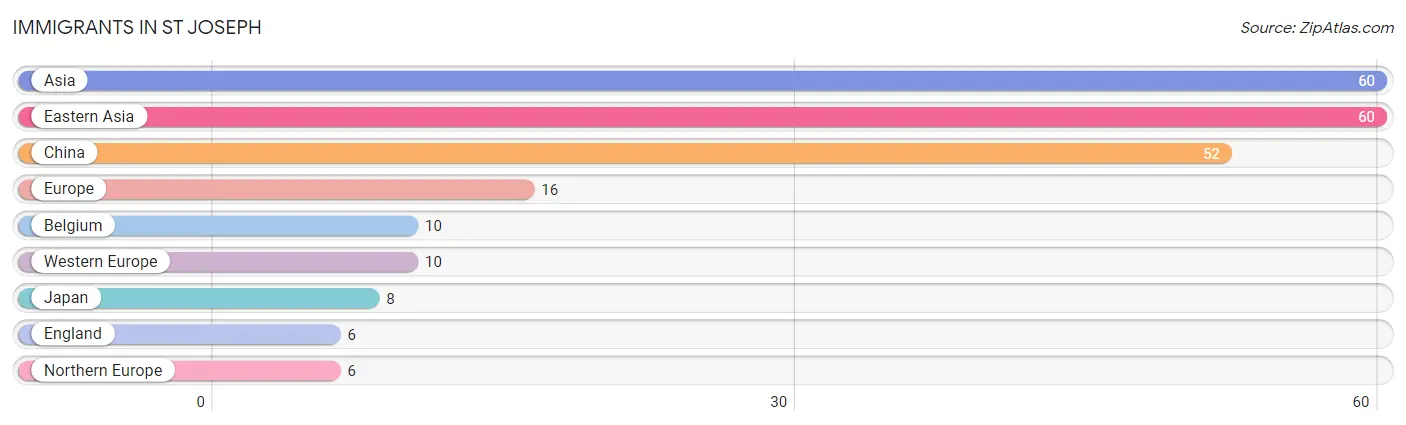
The most numerous immigrant groups reported in St Joseph came from Asia (60 | 1.5%), Eastern Asia (60 | 1.5%), China (52 | 1.3%), Europe (16 | 0.4%), and Belgium (10 | 0.3%), together accounting for 5.0% of all St Joseph residents.
| Immigration Origin | # Population | % Population |
| Asia | 60 | 1.5% |
| Belgium | 10 | 0.3% |
| China | 52 | 1.3% |
| Eastern Asia | 60 | 1.5% |
| England | 6 | 0.2% |
| Europe | 16 | 0.4% |
| Japan | 8 | 0.2% |
| Northern Europe | 6 | 0.2% |
| Western Europe | 10 | 0.3% | View All 9 Rows |
Sex and Age in St Joseph
Sex and Age in St Joseph
The most populous age groups in St Joseph are 60 to 64 Years (248 | 13.7%) for men and 10 to 14 Years (240 | 11.3%) for women.
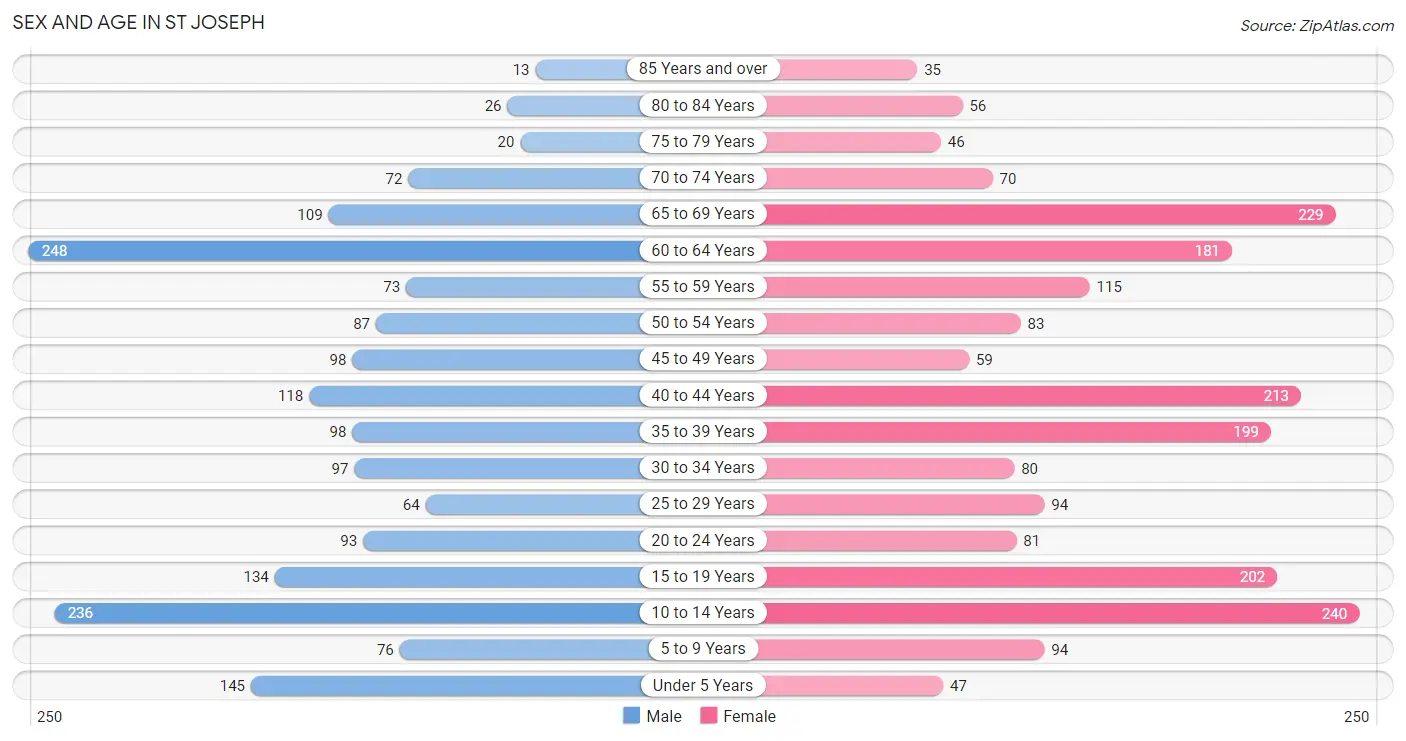
| Age Bracket | Male | Female |
| Under 5 Years | 145 (8.0%) | 47 (2.2%) |
| 5 to 9 Years | 76 (4.2%) | 94 (4.4%) |
| 10 to 14 Years | 236 (13.1%) | 240 (11.3%) |
| 15 to 19 Years | 134 (7.4%) | 202 (9.5%) |
| 20 to 24 Years | 93 (5.1%) | 81 (3.8%) |
| 25 to 29 Years | 64 (3.5%) | 94 (4.4%) |
| 30 to 34 Years | 97 (5.4%) | 80 (3.8%) |
| 35 to 39 Years | 98 (5.4%) | 199 (9.4%) |
| 40 to 44 Years | 118 (6.5%) | 213 (10.0%) |
| 45 to 49 Years | 98 (5.4%) | 59 (2.8%) |
| 50 to 54 Years | 87 (4.8%) | 83 (3.9%) |
| 55 to 59 Years | 73 (4.0%) | 115 (5.4%) |
| 60 to 64 Years | 248 (13.7%) | 181 (8.5%) |
| 65 to 69 Years | 109 (6.0%) | 229 (10.8%) |
| 70 to 74 Years | 72 (4.0%) | 70 (3.3%) |
| 75 to 79 Years | 20 (1.1%) | 46 (2.2%) |
| 80 to 84 Years | 26 (1.4%) | 56 (2.6%) |
| 85 Years and over | 13 (0.7%) | 35 (1.7%) |
| Total | 1,807 (100.0%) | 2,124 (100.0%) |
Families and Households in St Joseph
Median Family Size in St Joseph
The median family size in St Joseph is 3.39 persons per family, with single female/mother families (179 | 18.2%) accounting for the largest median family size of 3.4 persons per family. On the other hand, single male/father families (14 | 1.4%) represent the smallest median family size with 3.07 persons per family.
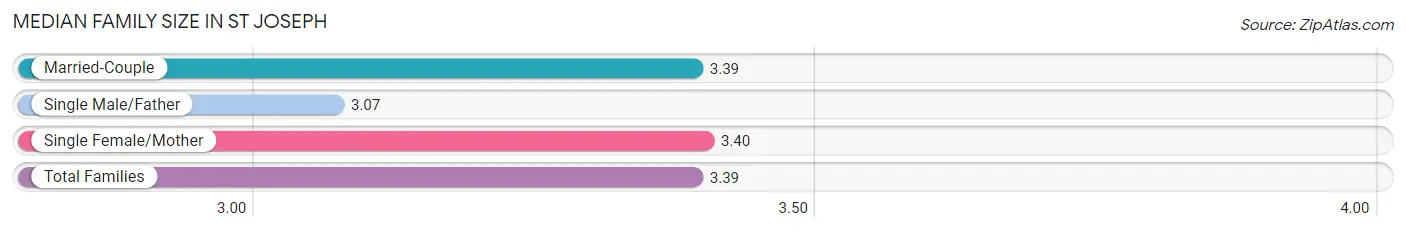
| Family Type | # Families | Family Size |
| Married-Couple | 788 (80.3%) | 3.39 |
| Single Male/Father | 14 (1.4%) | 3.07 |
| Single Female/Mother | 179 (18.2%) | 3.40 |
| Total Families | 981 (100.0%) | 3.39 |
Median Household Size in St Joseph
The median household size in St Joseph is 2.62 persons per household, with married-couple households (788 | 52.7%) accounting for the largest median household size of 3.43 persons per household. non-family households (513 | 34.3%) represent the smallest median household size with 1.09 persons per household.
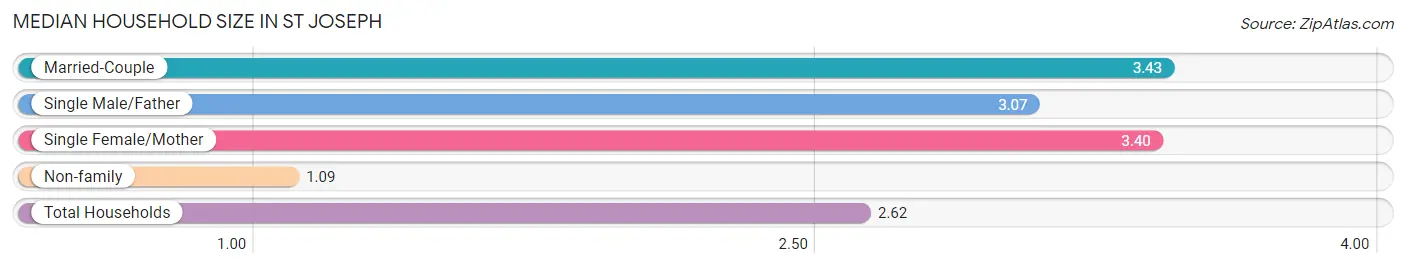
| Household Type | # Households | Household Size |
| Married-Couple | 788 (52.7%) | 3.43 |
| Single Male/Father | 14 (0.9%) | 3.07 |
| Single Female/Mother | 179 (12.0%) | 3.40 |
| Non-family | 513 (34.3%) | 1.09 |
| Total Households | 1,494 (100.0%) | 2.62 |
Household Size by Marriage Status in St Joseph
Out of a total of 1,494 households in St Joseph, 981 (65.7%) are family households, while 513 (34.3%) are nonfamily households. The most numerous type of family households are 2-person households, comprising 341, and the most common type of nonfamily households are 1-person households, comprising 471.
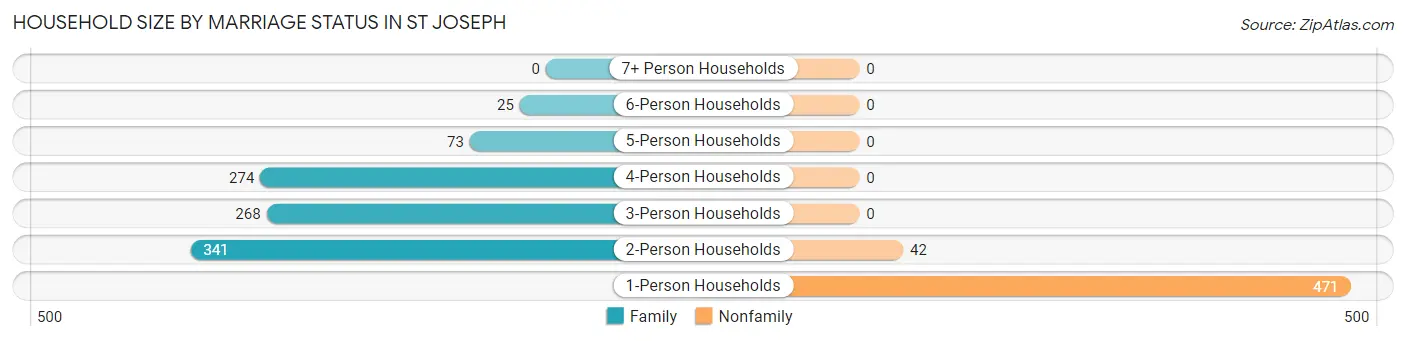
| Household Size | Family Households | Nonfamily Households |
| 1-Person Households | - | 471 (31.5%) |
| 2-Person Households | 341 (22.8%) | 42 (2.8%) |
| 3-Person Households | 268 (17.9%) | 0 (0.0%) |
| 4-Person Households | 274 (18.3%) | 0 (0.0%) |
| 5-Person Households | 73 (4.9%) | 0 (0.0%) |
| 6-Person Households | 25 (1.7%) | 0 (0.0%) |
| 7+ Person Households | 0 (0.0%) | 0 (0.0%) |
| Total | 981 (65.7%) | 513 (34.3%) |
Female Fertility in St Joseph
Fertility by Age in St Joseph
Average fertility rate in St Joseph is 14.0 births per 1,000 women. Women in the age bracket of 35 to 50 years have the highest fertility rate with 28.0 births per 1,000 women. Women in the age bracket of 35 to 50 years acount for 100.0% of all women with births.
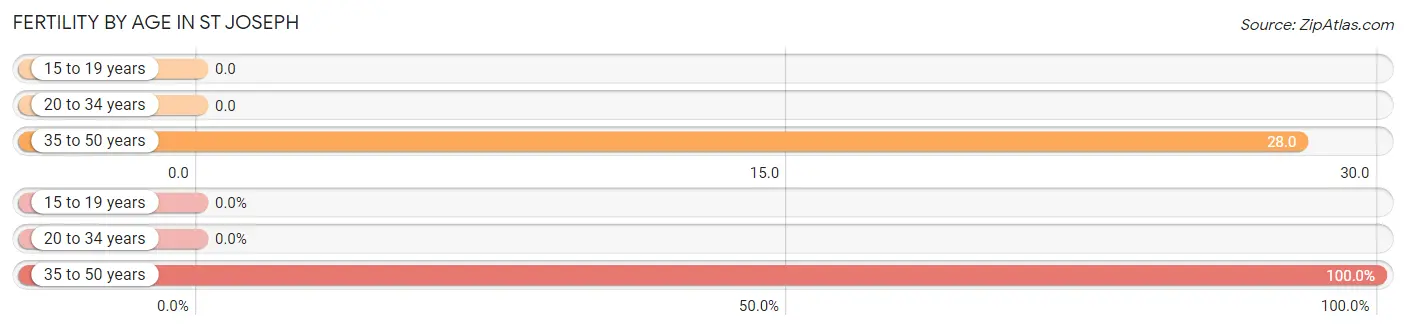
| Age Bracket | Women with Births | Births / 1,000 Women |
| 15 to 19 years | 0 (0.0%) | 0.0 |
| 20 to 34 years | 0 (0.0%) | 0.0 |
| 35 to 50 years | 13 (100.0%) | 28.0 |
| Total | 13 (100.0%) | 14.0 |
Fertility by Age by Marriage Status in St Joseph
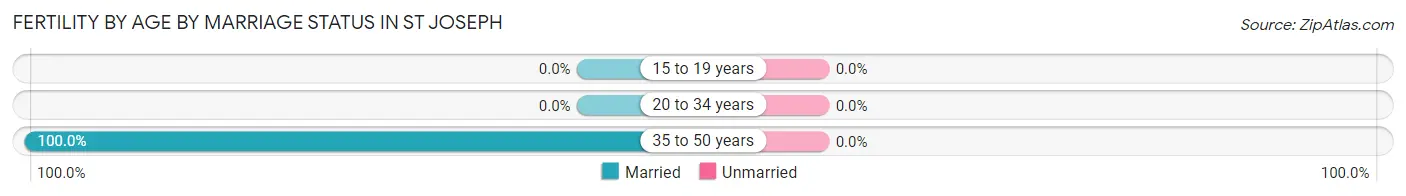
| Age Bracket | Married | Unmarried |
| 15 to 19 years | 0 (0.0%) | 0 (0.0%) |
| 20 to 34 years | 0 (0.0%) | 0 (0.0%) |
| 35 to 50 years | 13 (100.0%) | 0 (0.0%) |
| Total | 13 (100.0%) | 0 (0.0%) |
Fertility by Education in St Joseph
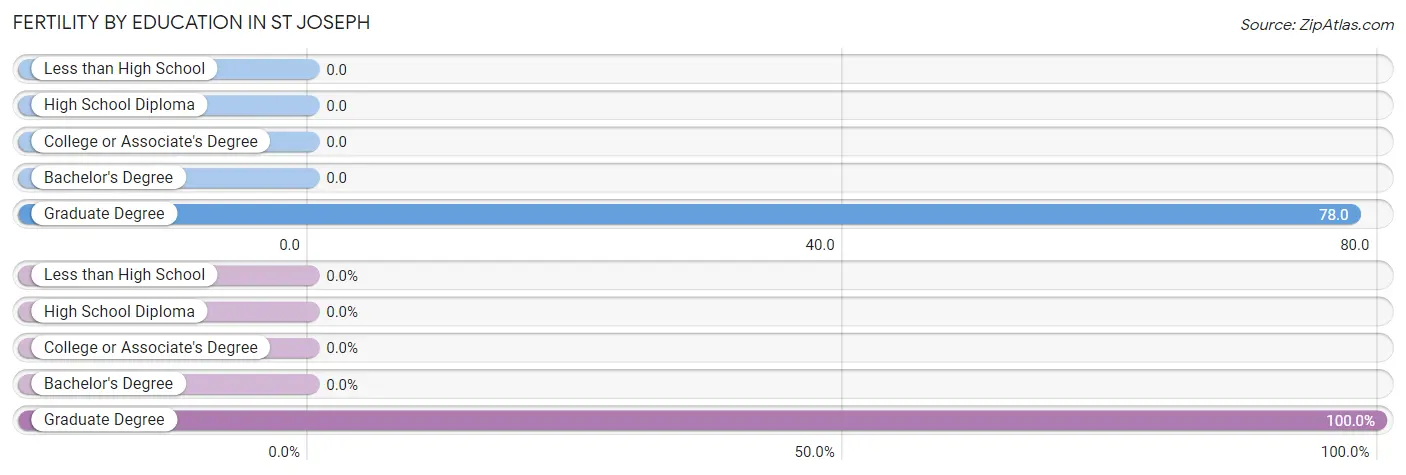
| Educational Attainment | Women with Births | Births / 1,000 Women |
| Less than High School | 0 (0.0%) | 0.0 |
| High School Diploma | 0 (0.0%) | 0.0 |
| College or Associate's Degree | 0 (0.0%) | 0.0 |
| Bachelor's Degree | 0 (0.0%) | 0.0 |
| Graduate Degree | 13 (100.0%) | 78.0 |
| Total | 13 (100.0%) | 14.0 |
Fertility by Education by Marriage Status in St Joseph
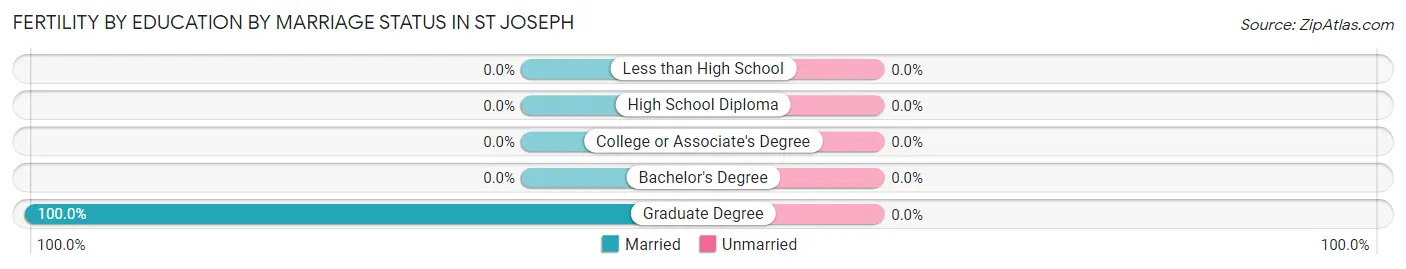
| Educational Attainment | Married | Unmarried |
| Less than High School | 0 (0.0%) | 0 (0.0%) |
| High School Diploma | 0 (0.0%) | 0 (0.0%) |
| College or Associate's Degree | 0 (0.0%) | 0 (0.0%) |
| Bachelor's Degree | 0 (0.0%) | 0 (0.0%) |
| Graduate Degree | 13 (100.0%) | 0 (0.0%) |
| Total | 13 (100.0%) | 0 (0.0%) |
Employment Characteristics in St Joseph
Employment by Class of Employer in St Joseph
Among the 1,973 employed individuals in St Joseph, private company employees (1,209 | 61.3%), state government employees (279 | 14.1%), and local government employees (189 | 9.6%) make up the most common classes of employment.
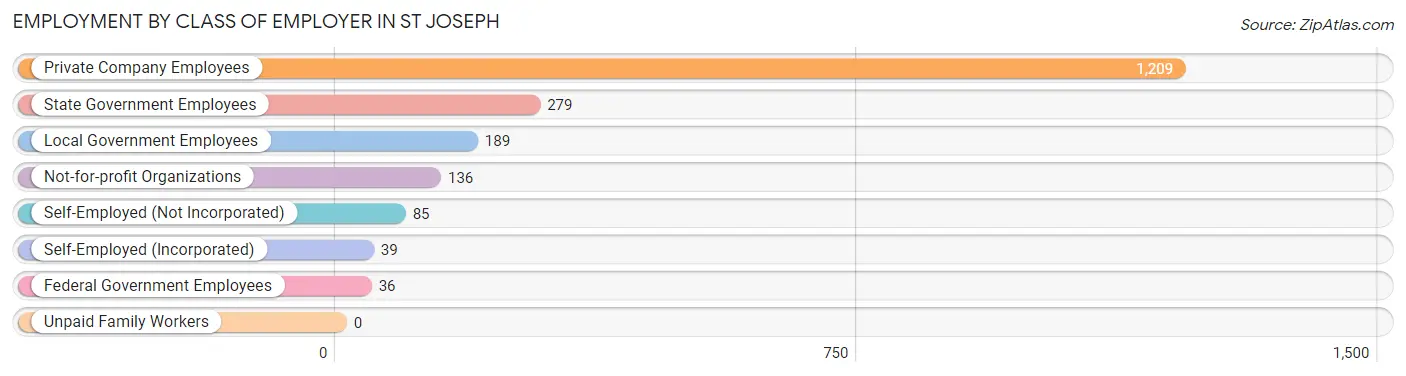
| Employer Class | # Employees | % Employees |
| Private Company Employees | 1,209 | 61.3% |
| Self-Employed (Incorporated) | 39 | 2.0% |
| Self-Employed (Not Incorporated) | 85 | 4.3% |
| Not-for-profit Organizations | 136 | 6.9% |
| Local Government Employees | 189 | 9.6% |
| State Government Employees | 279 | 14.1% |
| Federal Government Employees | 36 | 1.8% |
| Unpaid Family Workers | 0 | 0.0% |
| Total | 1,973 | 100.0% |
Employment Status by Age in St Joseph
According to the labor force statistics for St Joseph, out of the total population over 16 years of age (3,037), 65.9% or 2,001 individuals are in the labor force, with 0.7% or 14 of them unemployed. The age group with the highest labor force participation rate is 20 to 24 years, with 100.0% or 174 individuals in the labor force. Within the labor force, the 55 to 59 years age range has the highest percentage of unemployed individuals, with 9.1% or 15 of them being unemployed.
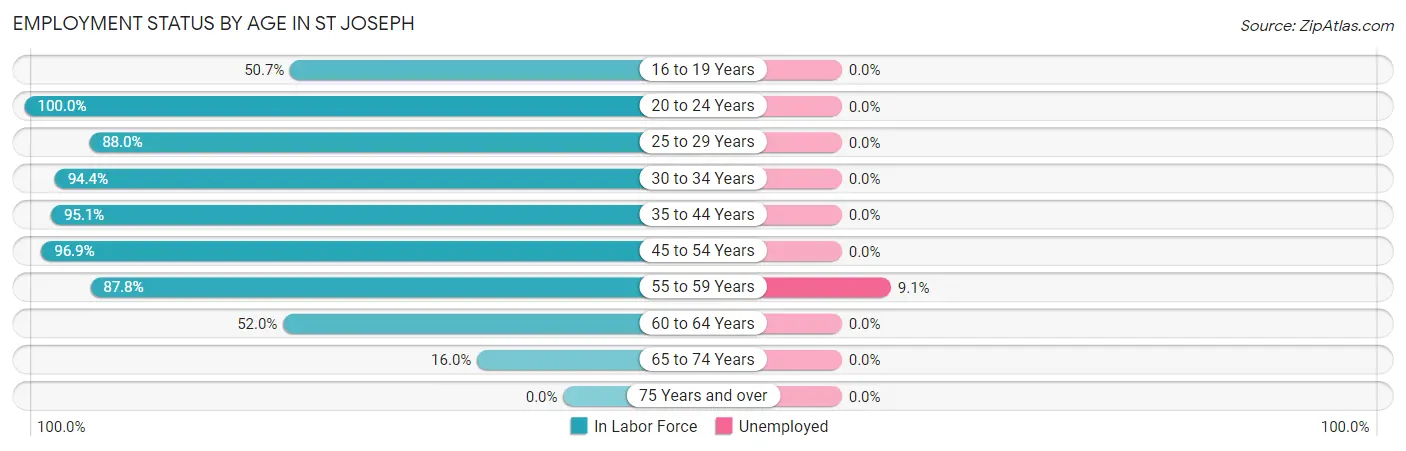
| Age Bracket | In Labor Force | Unemployed |
| 16 to 19 Years | 142 (50.7%) | 0 (0.0%) |
| 20 to 24 Years | 174 (100.0%) | 0 (0.0%) |
| 25 to 29 Years | 139 (88.0%) | 0 (0.0%) |
| 30 to 34 Years | 167 (94.4%) | 0 (0.0%) |
| 35 to 44 Years | 597 (95.1%) | 0 (0.0%) |
| 45 to 54 Years | 317 (96.9%) | 0 (0.0%) |
| 55 to 59 Years | 165 (87.8%) | 15 (9.1%) |
| 60 to 64 Years | 223 (52.0%) | 0 (0.0%) |
| 65 to 74 Years | 77 (16.0%) | 0 (0.0%) |
| 75 Years and over | 0 (0.0%) | 0 (0.0%) |
| Total | 2,001 (65.9%) | 14 (0.7%) |
Employment Status by Educational Attainment in St Joseph
According to labor force statistics for St Joseph, 84.3% of individuals (1,608) out of the total population between 25 and 64 years of age (1,907) are in the labor force, with 0.9% or 14 of them being unemployed. The group with the highest labor force participation rate are those with the educational attainment of bachelor's degree or higher, with 95.0% or 717 individuals in the labor force. Within the labor force, individuals with college / associate degree education have the highest percentage of unemployment, with 2.2% or 15 of them being unemployed.
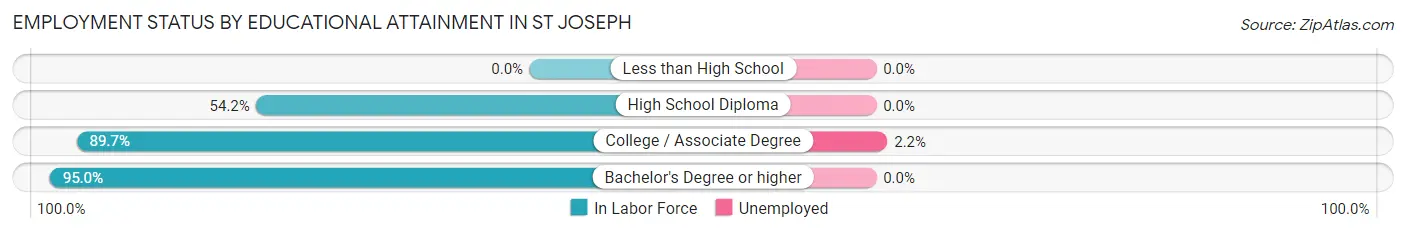
| Educational Attainment | In Labor Force | Unemployed |
| Less than High School | 0 (0.0%) | 0 (0.0%) |
| High School Diploma | 214 (54.2%) | 0 (0.0%) |
| College / Associate Degree | 677 (89.7%) | 17 (2.2%) |
| Bachelor's Degree or higher | 717 (95.0%) | 0 (0.0%) |
| Total | 1,608 (84.3%) | 17 (0.9%) |
Employment Occupations by Sex in St Joseph
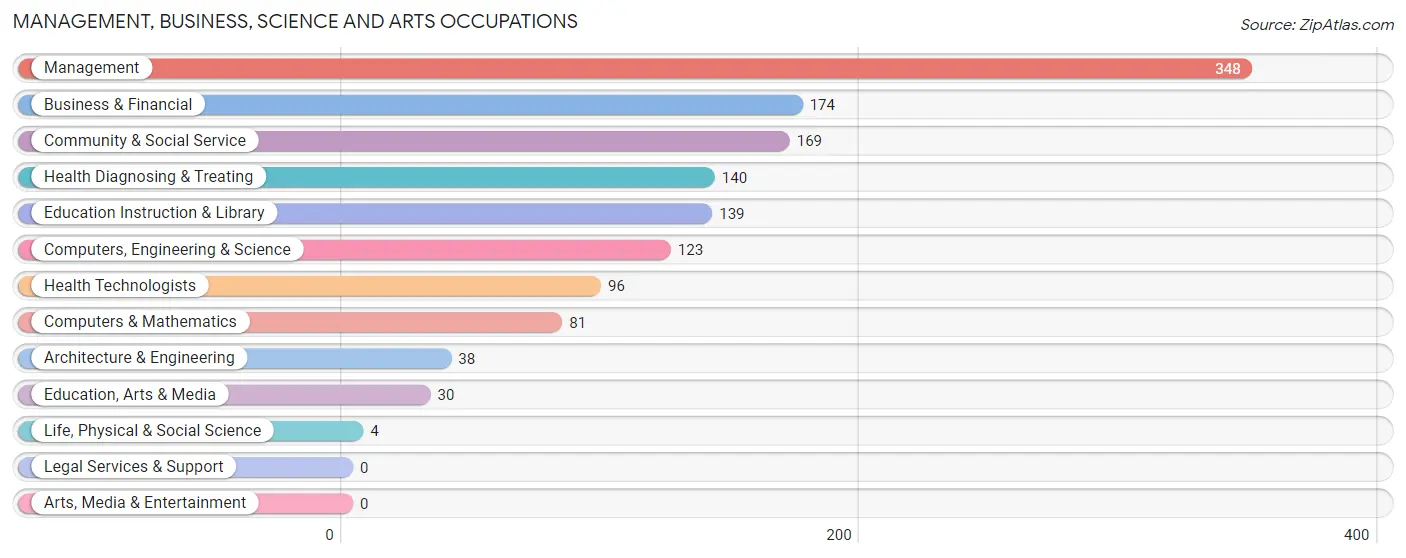
Management, Business, Science and Arts Occupations
The most common Management, Business, Science and Arts occupations in St Joseph are Management (348 | 17.5%), Business & Financial (174 | 8.8%), Community & Social Service (169 | 8.5%), Health Diagnosing & Treating (140 | 7.0%), and Education Instruction & Library (139 | 7.0%).
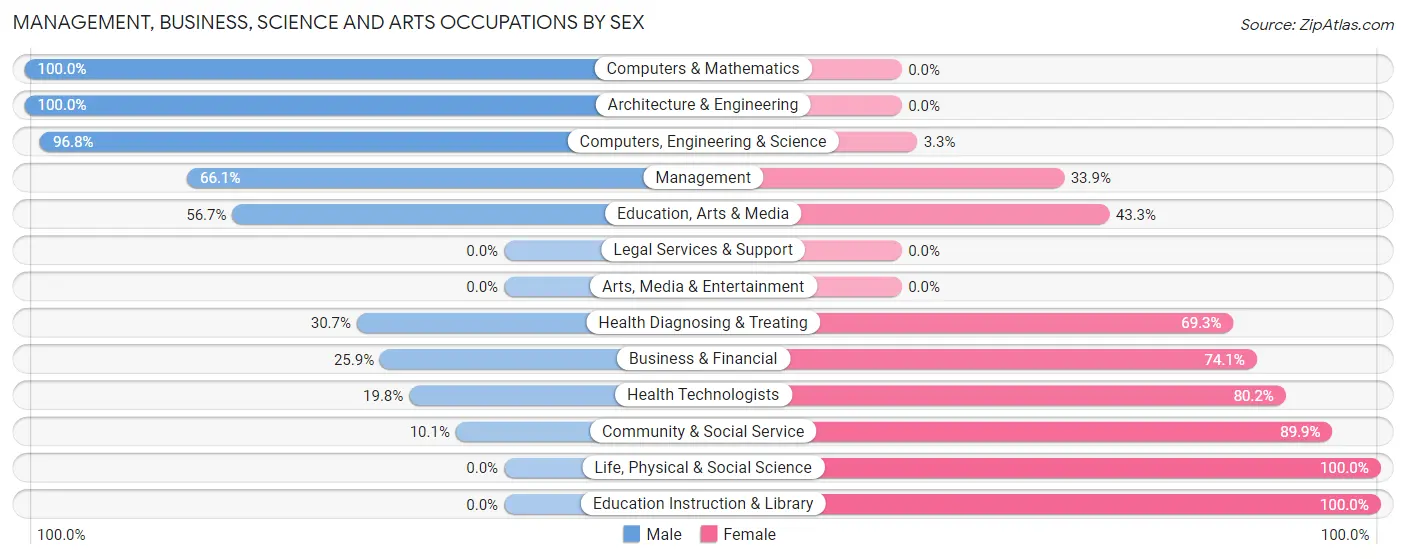
Management, Business, Science and Arts Occupations by Sex
Within the Management, Business, Science and Arts occupations in St Joseph, the most male-oriented occupations are Computers & Mathematics (100.0%), Architecture & Engineering (100.0%), and Computers, Engineering & Science (96.8%), while the most female-oriented occupations are Life, Physical & Social Science (100.0%), Education Instruction & Library (100.0%), and Community & Social Service (89.9%).
| Occupation | Male | Female |
| Management | 230 (66.1%) | 118 (33.9%) |
| Business & Financial | 45 (25.9%) | 129 (74.1%) |
| Computers, Engineering & Science | 119 (96.8%) | 4 (3.3%) |
| Computers & Mathematics | 81 (100.0%) | 0 (0.0%) |
| Architecture & Engineering | 38 (100.0%) | 0 (0.0%) |
| Life, Physical & Social Science | 0 (0.0%) | 4 (100.0%) |
| Community & Social Service | 17 (10.1%) | 152 (89.9%) |
| Education, Arts & Media | 17 (56.7%) | 13 (43.3%) |
| Legal Services & Support | 0 (0.0%) | 0 (0.0%) |
| Education Instruction & Library | 0 (0.0%) | 139 (100.0%) |
| Arts, Media & Entertainment | 0 (0.0%) | 0 (0.0%) |
| Health Diagnosing & Treating | 43 (30.7%) | 97 (69.3%) |
| Health Technologists | 19 (19.8%) | 77 (80.2%) |
| Total (Category) | 454 (47.6%) | 500 (52.4%) |
| Total (Overall) | 937 (47.2%) | 1,049 (52.8%) |
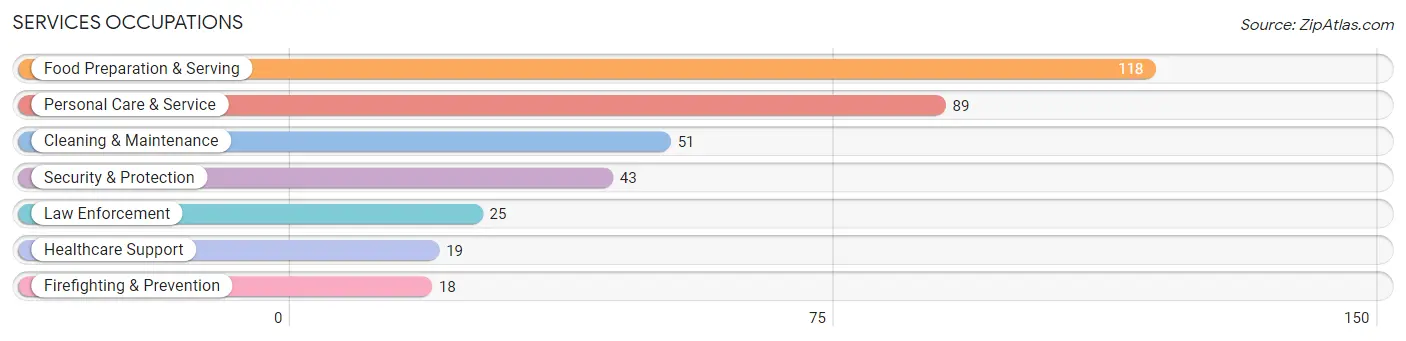
Services Occupations
The most common Services occupations in St Joseph are Food Preparation & Serving (118 | 5.9%), Personal Care & Service (89 | 4.5%), Cleaning & Maintenance (51 | 2.6%), Security & Protection (43 | 2.2%), and Law Enforcement (25 | 1.3%).
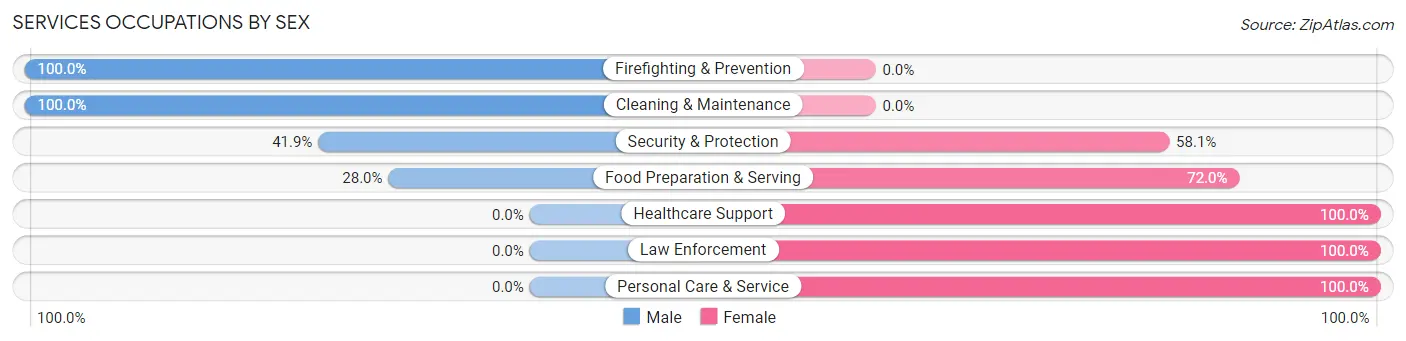
Services Occupations by Sex
Within the Services occupations in St Joseph, the most male-oriented occupations are Firefighting & Prevention (100.0%), Cleaning & Maintenance (100.0%), and Security & Protection (41.9%), while the most female-oriented occupations are Healthcare Support (100.0%), Law Enforcement (100.0%), and Personal Care & Service (100.0%).
| Occupation | Male | Female |
| Healthcare Support | 0 (0.0%) | 19 (100.0%) |
| Security & Protection | 18 (41.9%) | 25 (58.1%) |
| Firefighting & Prevention | 18 (100.0%) | 0 (0.0%) |
| Law Enforcement | 0 (0.0%) | 25 (100.0%) |
| Food Preparation & Serving | 33 (28.0%) | 85 (72.0%) |
| Cleaning & Maintenance | 51 (100.0%) | 0 (0.0%) |
| Personal Care & Service | 0 (0.0%) | 89 (100.0%) |
| Total (Category) | 102 (31.9%) | 218 (68.1%) |
| Total (Overall) | 937 (47.2%) | 1,049 (52.8%) |
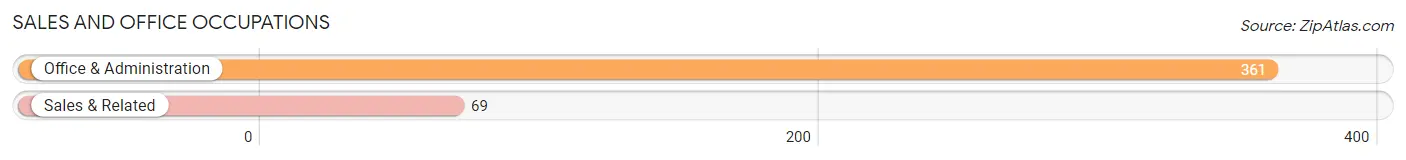
Sales and Office Occupations
The most common Sales and Office occupations in St Joseph are Office & Administration (361 | 18.2%), and Sales & Related (69 | 3.5%).
Sales and Office Occupations by Sex
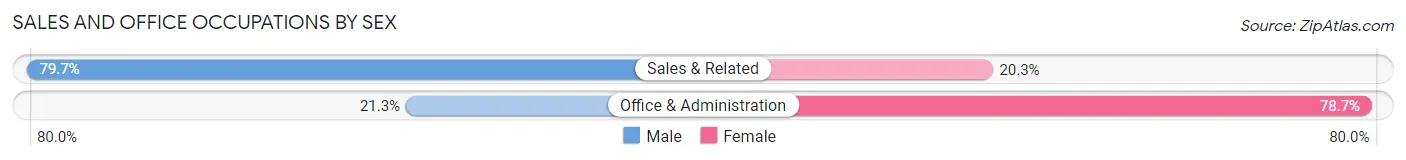
| Occupation | Male | Female |
| Sales & Related | 55 (79.7%) | 14 (20.3%) |
| Office & Administration | 77 (21.3%) | 284 (78.7%) |
| Total (Category) | 132 (30.7%) | 298 (69.3%) |
| Total (Overall) | 937 (47.2%) | 1,049 (52.8%) |
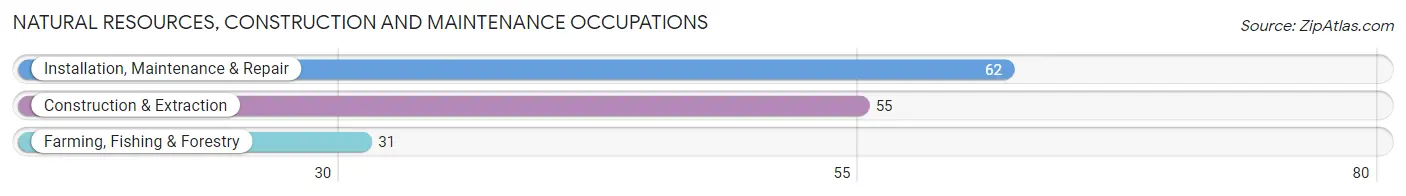
Natural Resources, Construction and Maintenance Occupations
The most common Natural Resources, Construction and Maintenance occupations in St Joseph are Installation, Maintenance & Repair (62 | 3.1%), Construction & Extraction (55 | 2.8%), and Farming, Fishing & Forestry (31 | 1.6%).
Natural Resources, Construction and Maintenance Occupations by Sex
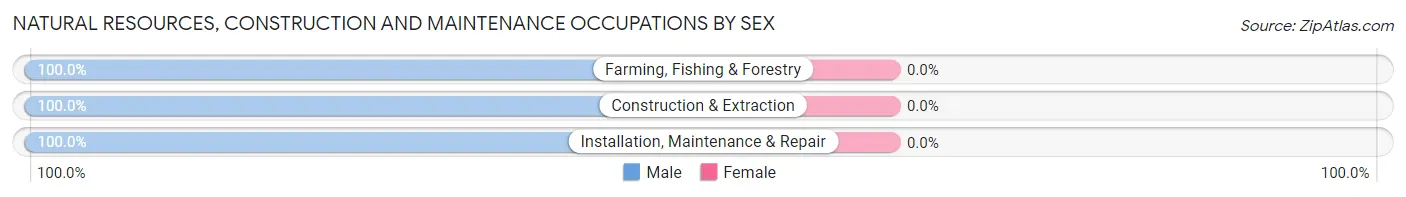
| Occupation | Male | Female |
| Farming, Fishing & Forestry | 31 (100.0%) | 0 (0.0%) |
| Construction & Extraction | 55 (100.0%) | 0 (0.0%) |
| Installation, Maintenance & Repair | 62 (100.0%) | 0 (0.0%) |
| Total (Category) | 148 (100.0%) | 0 (0.0%) |
| Total (Overall) | 937 (47.2%) | 1,049 (52.8%) |
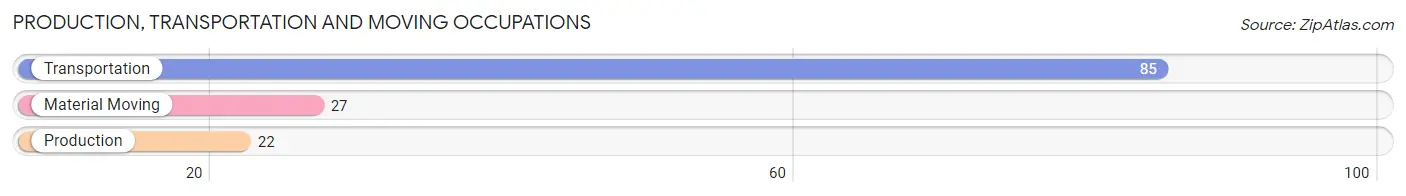
Production, Transportation and Moving Occupations
The most common Production, Transportation and Moving occupations in St Joseph are Transportation (85 | 4.3%), Material Moving (27 | 1.4%), and Production (22 | 1.1%).
Production, Transportation and Moving Occupations by Sex
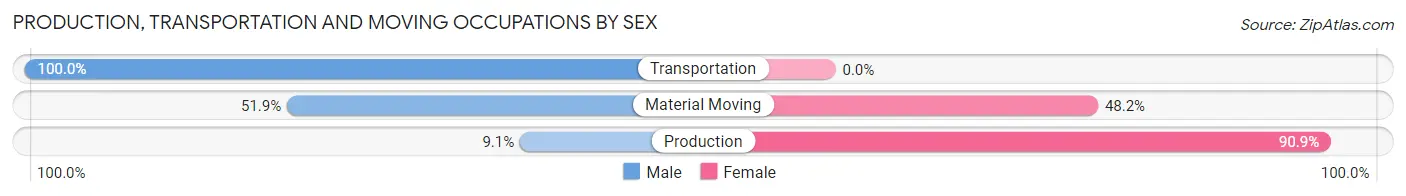
| Occupation | Male | Female |
| Production | 2 (9.1%) | 20 (90.9%) |
| Transportation | 85 (100.0%) | 0 (0.0%) |
| Material Moving | 14 (51.8%) | 13 (48.1%) |
| Total (Category) | 101 (75.4%) | 33 (24.6%) |
| Total (Overall) | 937 (47.2%) | 1,049 (52.8%) |
Employment Industries by Sex in St Joseph
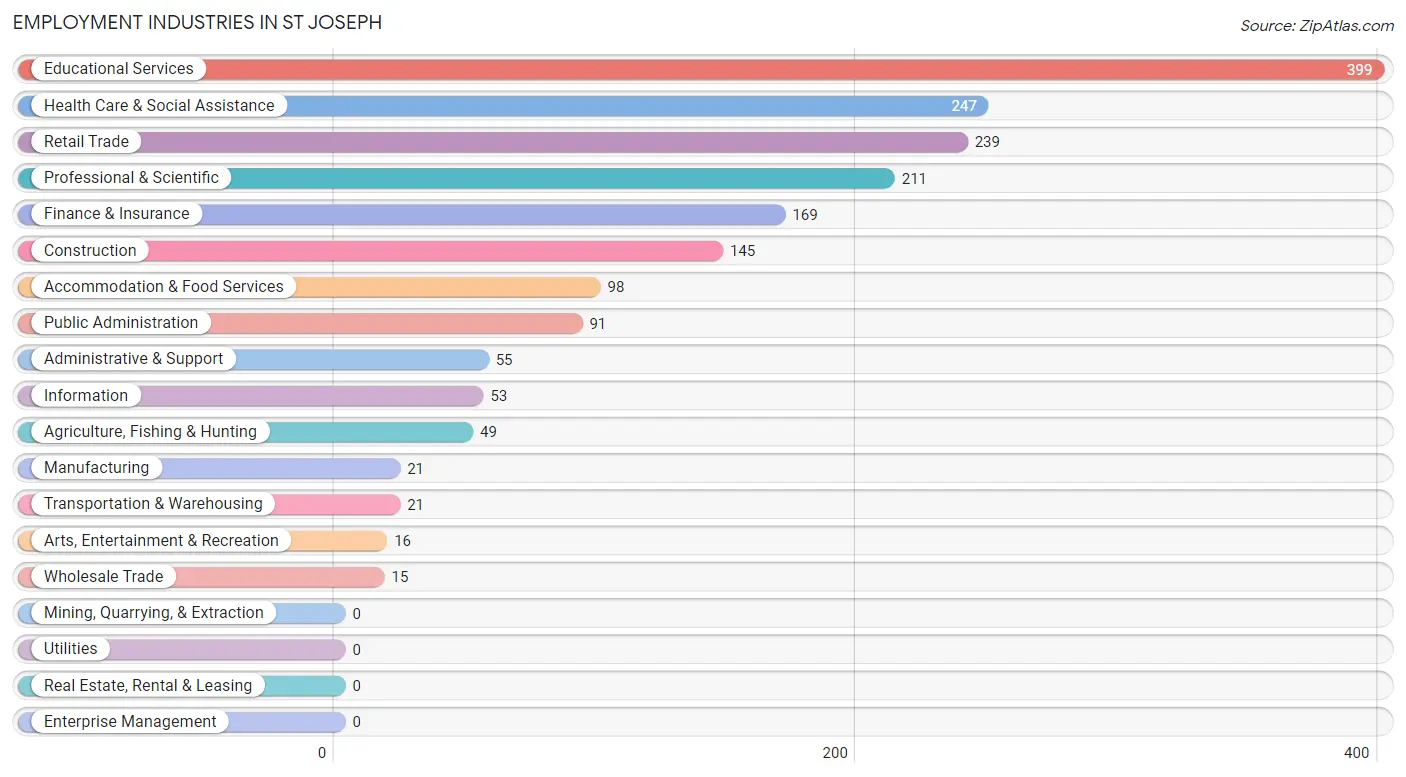
Employment Industries in St Joseph
The major employment industries in St Joseph include Educational Services (399 | 20.1%), Health Care & Social Assistance (247 | 12.4%), Retail Trade (239 | 12.0%), Professional & Scientific (211 | 10.6%), and Finance & Insurance (169 | 8.5%).
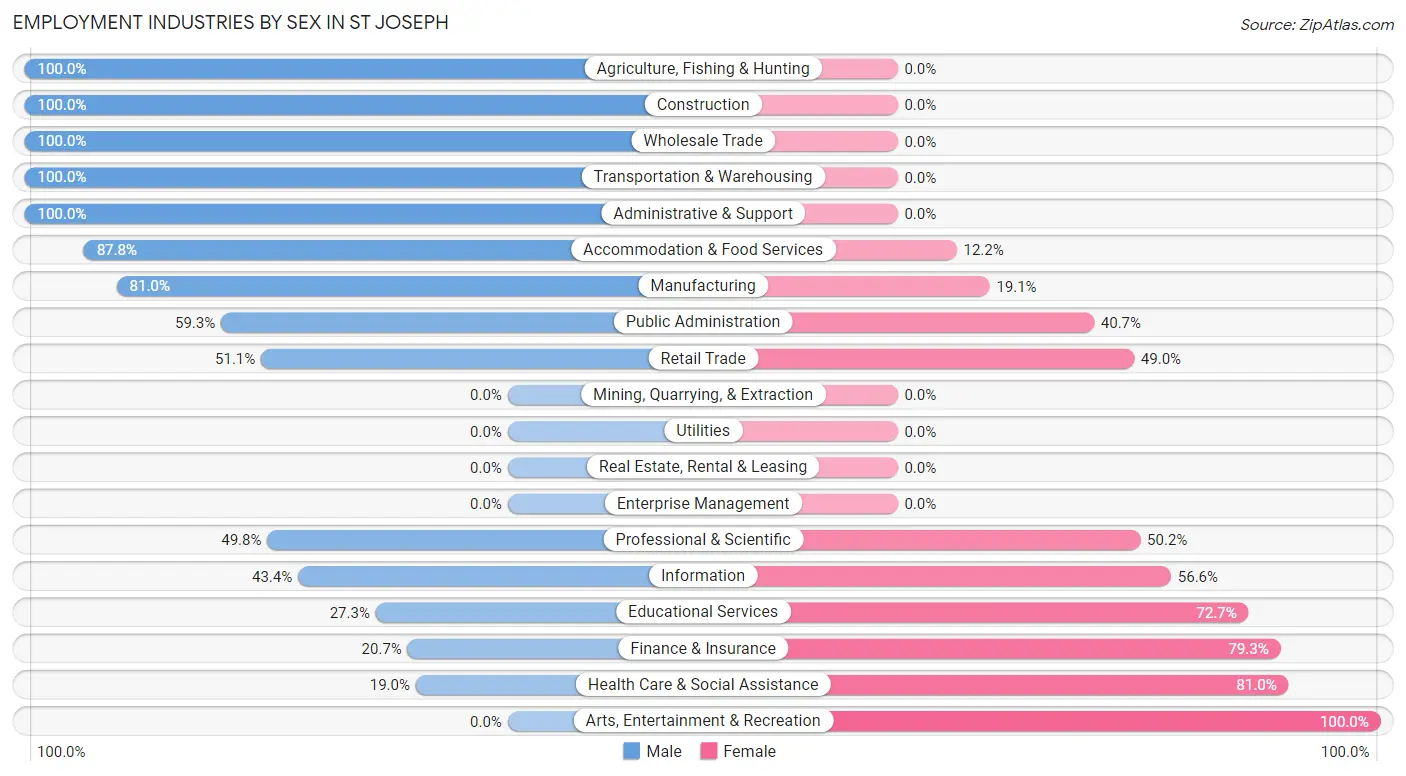
Employment Industries by Sex in St Joseph
The St Joseph industries that see more men than women are Agriculture, Fishing & Hunting (100.0%), Construction (100.0%), and Wholesale Trade (100.0%), whereas the industries that tend to have a higher number of women are Arts, Entertainment & Recreation (100.0%), Health Care & Social Assistance (81.0%), and Finance & Insurance (79.3%).
| Industry | Male | Female |
| Agriculture, Fishing & Hunting | 49 (100.0%) | 0 (0.0%) |
| Mining, Quarrying, & Extraction | 0 (0.0%) | 0 (0.0%) |
| Construction | 145 (100.0%) | 0 (0.0%) |
| Manufacturing | 17 (80.9%) | 4 (19.1%) |
| Wholesale Trade | 15 (100.0%) | 0 (0.0%) |
| Retail Trade | 122 (51.0%) | 117 (48.9%) |
| Transportation & Warehousing | 21 (100.0%) | 0 (0.0%) |
| Utilities | 0 (0.0%) | 0 (0.0%) |
| Information | 23 (43.4%) | 30 (56.6%) |
| Finance & Insurance | 35 (20.7%) | 134 (79.3%) |
| Real Estate, Rental & Leasing | 0 (0.0%) | 0 (0.0%) |
| Professional & Scientific | 105 (49.8%) | 106 (50.2%) |
| Enterprise Management | 0 (0.0%) | 0 (0.0%) |
| Administrative & Support | 55 (100.0%) | 0 (0.0%) |
| Educational Services | 109 (27.3%) | 290 (72.7%) |
| Health Care & Social Assistance | 47 (19.0%) | 200 (81.0%) |
| Arts, Entertainment & Recreation | 0 (0.0%) | 16 (100.0%) |
| Accommodation & Food Services | 86 (87.8%) | 12 (12.2%) |
| Public Administration | 54 (59.3%) | 37 (40.7%) |
| Total | 937 (47.2%) | 1,049 (52.8%) |
Education in St Joseph
School Enrollment in St Joseph
The most common levels of schooling among the 1,050 students in St Joseph are middle school (406 | 38.7%), high school (347 | 33.1%), and elementary school (200 | 19.1%).
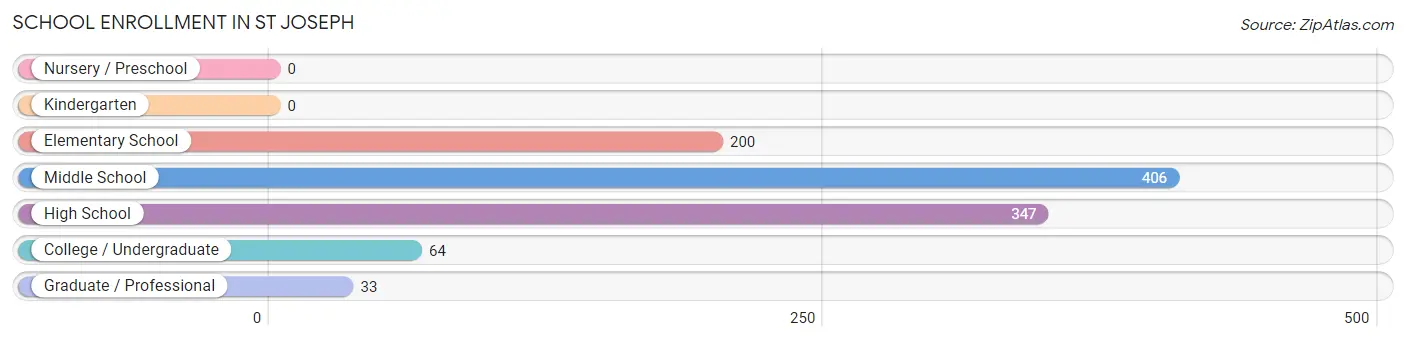
| School Level | # Students | % Students |
| Nursery / Preschool | 0 | 0.0% |
| Kindergarten | 0 | 0.0% |
| Elementary School | 200 | 19.1% |
| Middle School | 406 | 38.7% |
| High School | 347 | 33.1% |
| College / Undergraduate | 64 | 6.1% |
| Graduate / Professional | 33 | 3.1% |
| Total | 1,050 | 100.0% |
School Enrollment by Age by Funding Source in St Joseph
Out of a total of 1,050 students who are enrolled in schools in St Joseph, 77 (7.3%) attend a private institution, while the remaining 973 (92.7%) are enrolled in public schools. The age group of 5 to 9 year old has the highest likelihood of being enrolled in private schools, with 27 (15.9% in the age bracket) enrolled. Conversely, the age group of 15 to 17 year olds has the lowest likelihood of being enrolled in a private school, with 248 (100.0% in the age bracket) attending a public institution.
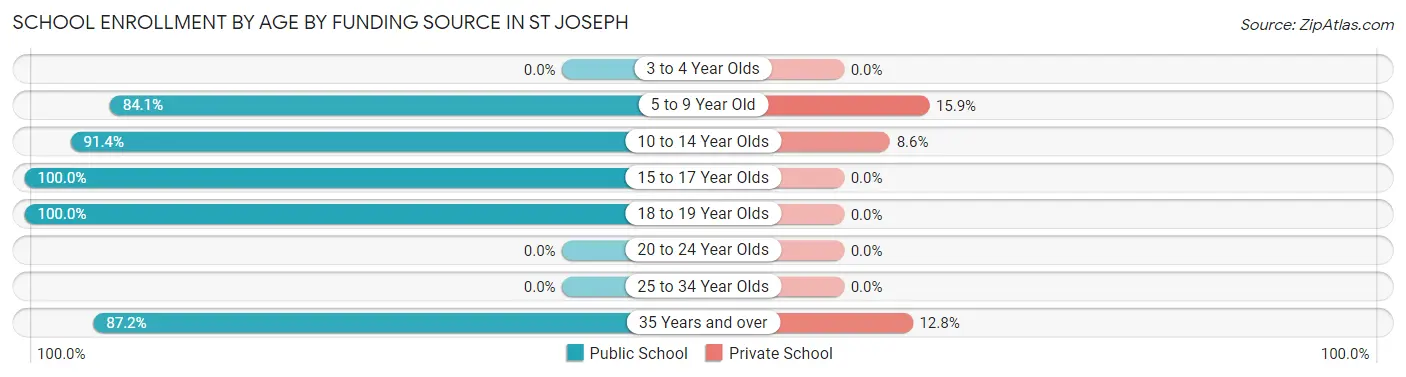
| Age Bracket | Public School | Private School |
| 3 to 4 Year Olds | 0 (0.0%) | 0 (0.0%) |
| 5 to 9 Year Old | 143 (84.1%) | 27 (15.9%) |
| 10 to 14 Year Olds | 426 (91.4%) | 40 (8.6%) |
| 15 to 17 Year Olds | 248 (100.0%) | 0 (0.0%) |
| 18 to 19 Year Olds | 88 (100.0%) | 0 (0.0%) |
| 20 to 24 Year Olds | 0 (0.0%) | 0 (0.0%) |
| 25 to 34 Year Olds | 0 (0.0%) | 0 (0.0%) |
| 35 Years and over | 68 (87.2%) | 10 (12.8%) |
| Total | 973 (92.7%) | 77 (7.3%) |
Educational Attainment by Field of Study in St Joseph
Business (303 | 31.8%), education (209 | 22.0%), science & technology (105 | 11.0%), computers & mathematics (53 | 5.6%), and bio, nature & agricultural (53 | 5.6%) are the most common fields of study among 952 individuals in St Joseph who have obtained a bachelor's degree or higher.
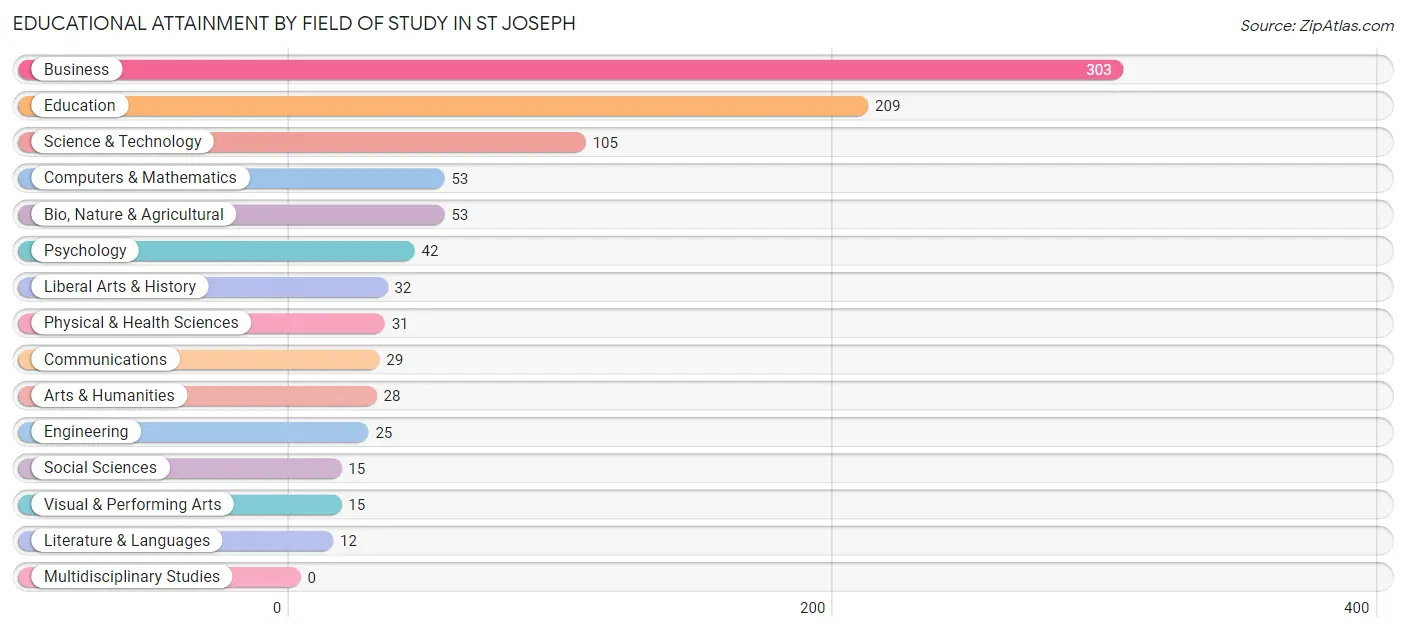
| Field of Study | # Graduates | % Graduates |
| Computers & Mathematics | 53 | 5.6% |
| Bio, Nature & Agricultural | 53 | 5.6% |
| Physical & Health Sciences | 31 | 3.3% |
| Psychology | 42 | 4.4% |
| Social Sciences | 15 | 1.6% |
| Engineering | 25 | 2.6% |
| Multidisciplinary Studies | 0 | 0.0% |
| Science & Technology | 105 | 11.0% |
| Business | 303 | 31.8% |
| Education | 209 | 22.0% |
| Literature & Languages | 12 | 1.3% |
| Liberal Arts & History | 32 | 3.4% |
| Visual & Performing Arts | 15 | 1.6% |
| Communications | 29 | 3.0% |
| Arts & Humanities | 28 | 2.9% |
| Total | 952 | 100.0% |
Transportation & Commute in St Joseph
Vehicle Availability by Sex in St Joseph
The most prevalent vehicle ownership categories in St Joseph are males with 2 vehicles (467, accounting for 50.1%) and females with 2 vehicles (409, making up 45.1%).
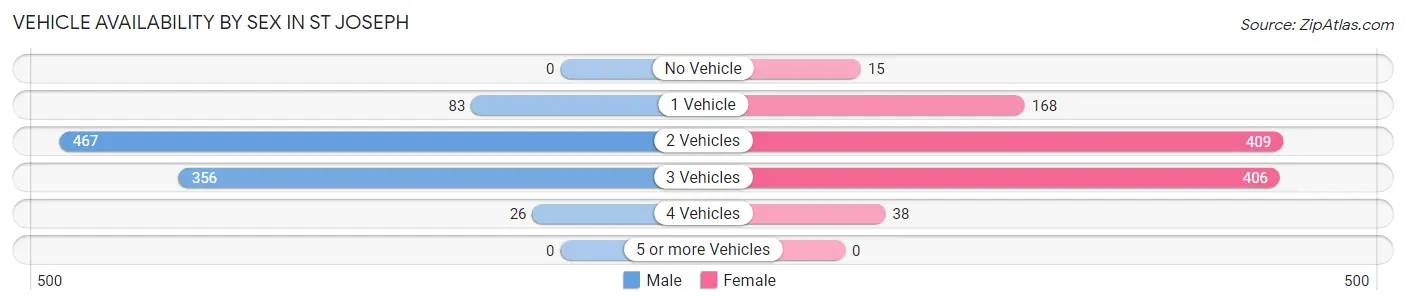
| Vehicles Available | Male | Female |
| No Vehicle | 0 (0.0%) | 15 (1.5%) |
| 1 Vehicle | 83 (8.9%) | 168 (16.2%) |
| 2 Vehicles | 467 (50.1%) | 409 (39.5%) |
| 3 Vehicles | 356 (38.2%) | 406 (39.2%) |
| 4 Vehicles | 26 (2.8%) | 38 (3.7%) |
| 5 or more Vehicles | 0 (0.0%) | 0 (0.0%) |
| Total | 932 (100.0%) | 1,036 (100.0%) |
Commute Time in St Joseph
The most frequently occuring commute durations in St Joseph are 20 to 24 minutes (328 commuters, 20.0%), 25 to 29 minutes (292 commuters, 17.8%), and 15 to 19 minutes (263 commuters, 16.0%).
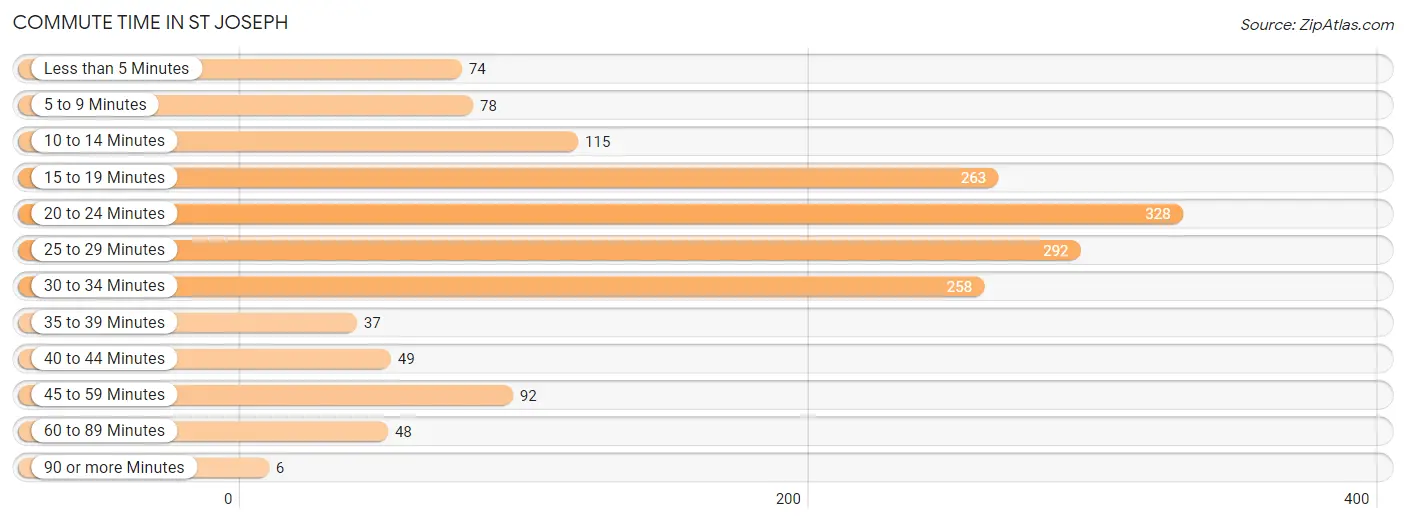
| Commute Time | # Commuters | % Commuters |
| Less than 5 Minutes | 74 | 4.5% |
| 5 to 9 Minutes | 78 | 4.8% |
| 10 to 14 Minutes | 115 | 7.0% |
| 15 to 19 Minutes | 263 | 16.0% |
| 20 to 24 Minutes | 328 | 20.0% |
| 25 to 29 Minutes | 292 | 17.8% |
| 30 to 34 Minutes | 258 | 15.7% |
| 35 to 39 Minutes | 37 | 2.3% |
| 40 to 44 Minutes | 49 | 3.0% |
| 45 to 59 Minutes | 92 | 5.6% |
| 60 to 89 Minutes | 48 | 2.9% |
| 90 or more Minutes | 6 | 0.4% |
Commute Time by Sex in St Joseph
The most common commute times in St Joseph are 20 to 24 minutes (217 commuters, 27.5%) for males and 30 to 34 minutes (205 commuters, 24.1%) for females.
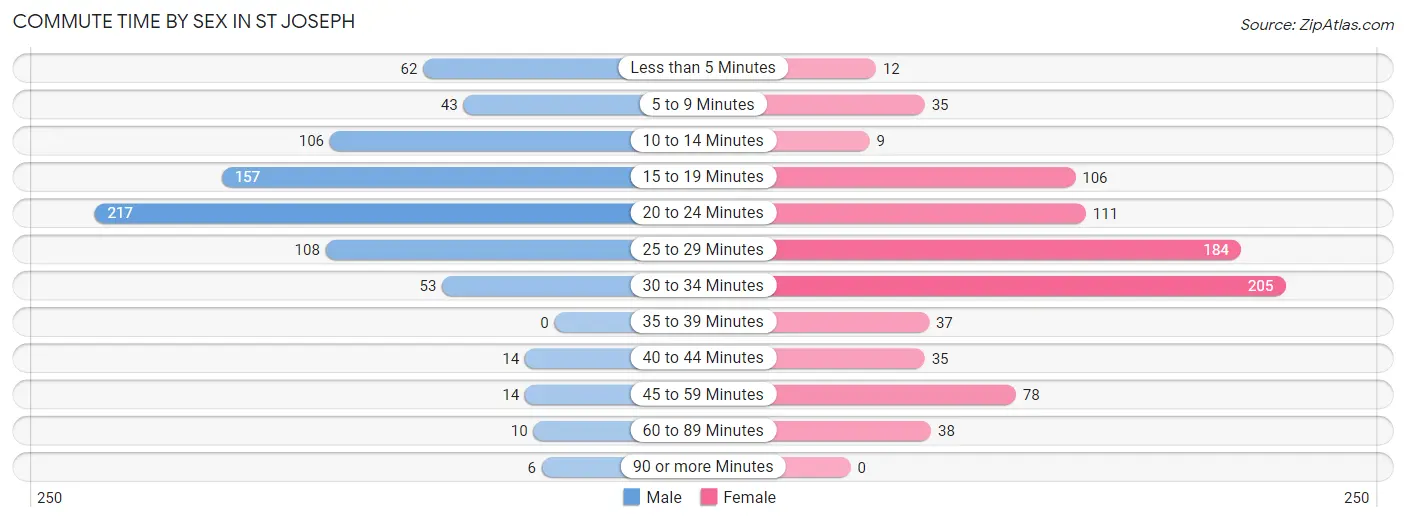
| Commute Time | Male | Female |
| Less than 5 Minutes | 62 (7.9%) | 12 (1.4%) |
| 5 to 9 Minutes | 43 (5.4%) | 35 (4.1%) |
| 10 to 14 Minutes | 106 (13.4%) | 9 (1.1%) |
| 15 to 19 Minutes | 157 (19.9%) | 106 (12.5%) |
| 20 to 24 Minutes | 217 (27.5%) | 111 (13.1%) |
| 25 to 29 Minutes | 108 (13.7%) | 184 (21.6%) |
| 30 to 34 Minutes | 53 (6.7%) | 205 (24.1%) |
| 35 to 39 Minutes | 0 (0.0%) | 37 (4.3%) |
| 40 to 44 Minutes | 14 (1.8%) | 35 (4.1%) |
| 45 to 59 Minutes | 14 (1.8%) | 78 (9.2%) |
| 60 to 89 Minutes | 10 (1.3%) | 38 (4.5%) |
| 90 or more Minutes | 6 (0.8%) | 0 (0.0%) |
Time of Departure to Work by Sex in St Joseph
The most frequent times of departure to work in St Joseph are 7:30 AM to 7:59 AM (168, 21.3%) for males and 7:30 AM to 7:59 AM (208, 24.5%) for females.
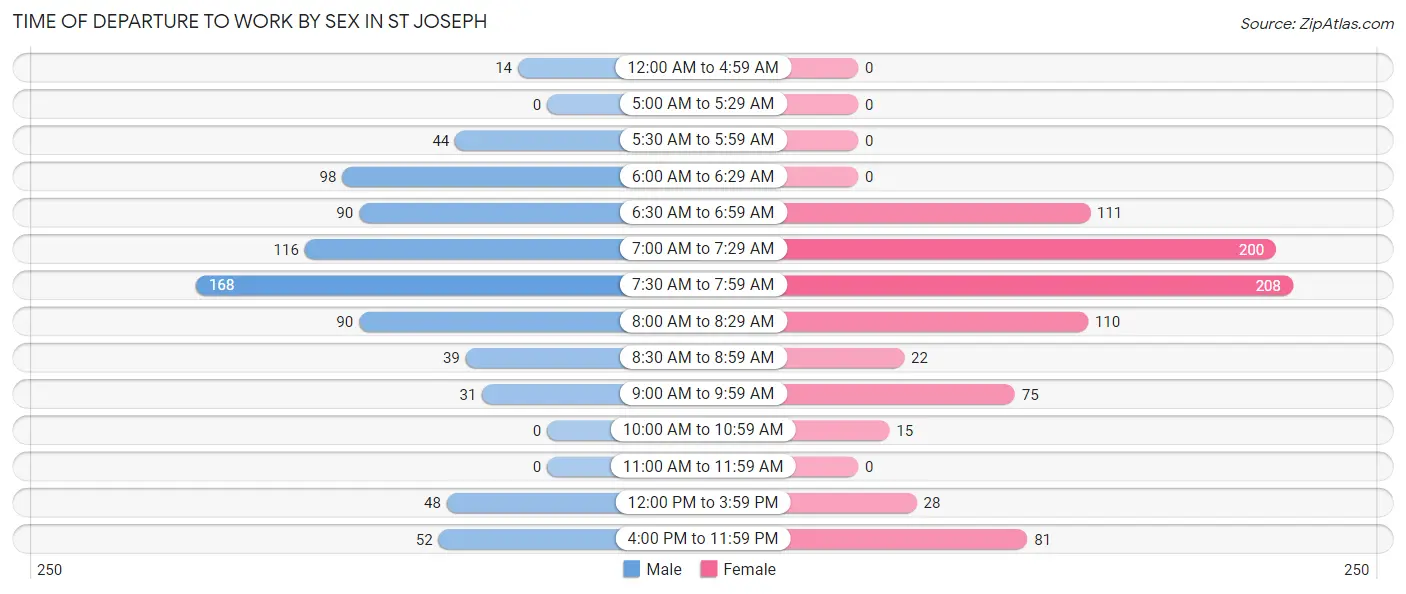
| Time of Departure | Male | Female |
| 12:00 AM to 4:59 AM | 14 (1.8%) | 0 (0.0%) |
| 5:00 AM to 5:29 AM | 0 (0.0%) | 0 (0.0%) |
| 5:30 AM to 5:59 AM | 44 (5.6%) | 0 (0.0%) |
| 6:00 AM to 6:29 AM | 98 (12.4%) | 0 (0.0%) |
| 6:30 AM to 6:59 AM | 90 (11.4%) | 111 (13.1%) |
| 7:00 AM to 7:29 AM | 116 (14.7%) | 200 (23.5%) |
| 7:30 AM to 7:59 AM | 168 (21.3%) | 208 (24.5%) |
| 8:00 AM to 8:29 AM | 90 (11.4%) | 110 (12.9%) |
| 8:30 AM to 8:59 AM | 39 (4.9%) | 22 (2.6%) |
| 9:00 AM to 9:59 AM | 31 (3.9%) | 75 (8.8%) |
| 10:00 AM to 10:59 AM | 0 (0.0%) | 15 (1.8%) |
| 11:00 AM to 11:59 AM | 0 (0.0%) | 0 (0.0%) |
| 12:00 PM to 3:59 PM | 48 (6.1%) | 28 (3.3%) |
| 4:00 PM to 11:59 PM | 52 (6.6%) | 81 (9.5%) |
| Total | 790 (100.0%) | 850 (100.0%) |
Housing Occupancy in St Joseph
Occupancy by Ownership in St Joseph
Of the total 1,494 dwellings in St Joseph, owner-occupied units account for 1,281 (85.7%), while renter-occupied units make up 213 (14.3%).
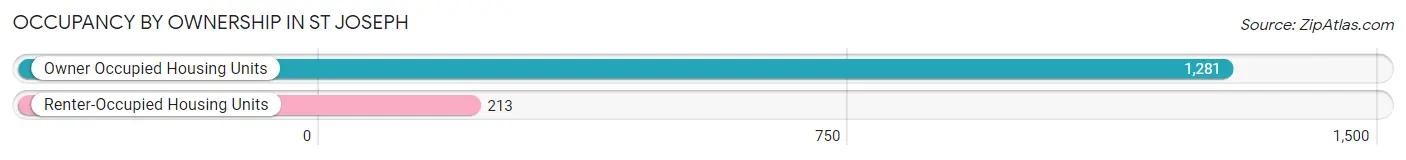
| Occupancy | # Housing Units | % Housing Units |
| Owner Occupied Housing Units | 1,281 | 85.7% |
| Renter-Occupied Housing Units | 213 | 14.3% |
| Total Occupied Housing Units | 1,494 | 100.0% |
Occupancy by Household Size in St Joseph
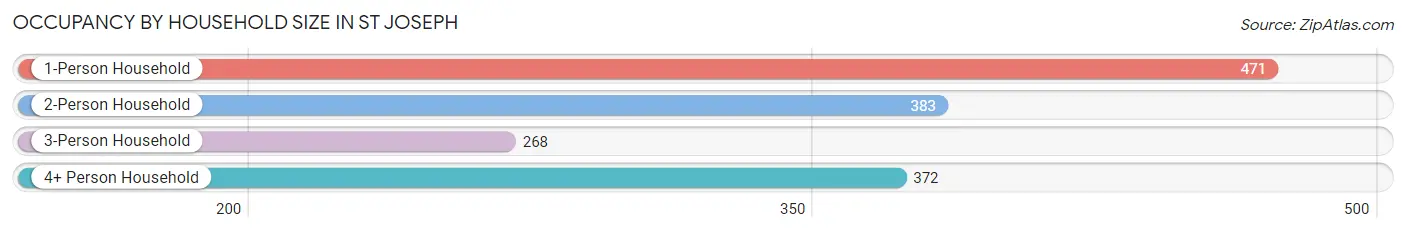
| Household Size | # Housing Units | % Housing Units |
| 1-Person Household | 471 | 31.5% |
| 2-Person Household | 383 | 25.6% |
| 3-Person Household | 268 | 17.9% |
| 4+ Person Household | 372 | 24.9% |
| Total Housing Units | 1,494 | 100.0% |
Occupancy by Ownership by Household Size in St Joseph
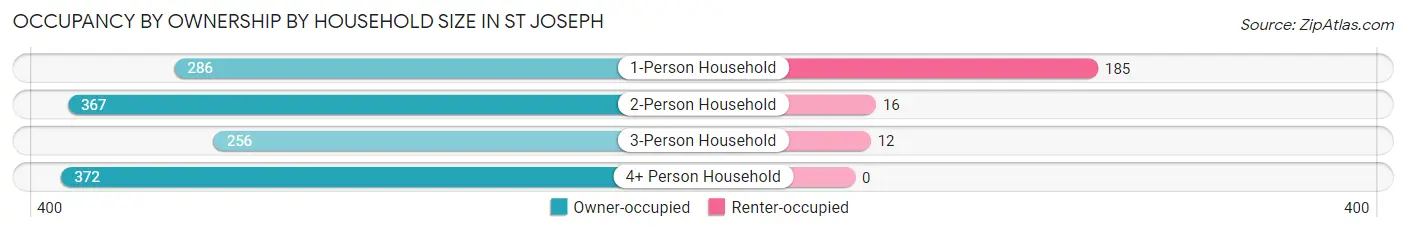
| Household Size | Owner-occupied | Renter-occupied |
| 1-Person Household | 286 (60.7%) | 185 (39.3%) |
| 2-Person Household | 367 (95.8%) | 16 (4.2%) |
| 3-Person Household | 256 (95.5%) | 12 (4.5%) |
| 4+ Person Household | 372 (100.0%) | 0 (0.0%) |
| Total Housing Units | 1,281 (85.7%) | 213 (14.3%) |
Occupancy by Educational Attainment in St Joseph
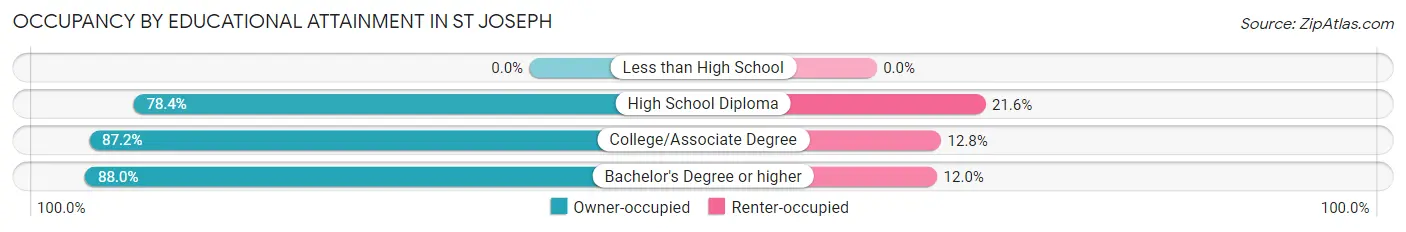
| Household Size | Owner-occupied | Renter-occupied |
| Less than High School | 0 (0.0%) | 0 (0.0%) |
| High School Diploma | 236 (78.4%) | 65 (21.6%) |
| College/Associate Degree | 546 (87.2%) | 80 (12.8%) |
| Bachelor's Degree or higher | 499 (88.0%) | 68 (12.0%) |
Occupancy by Age of Householder in St Joseph
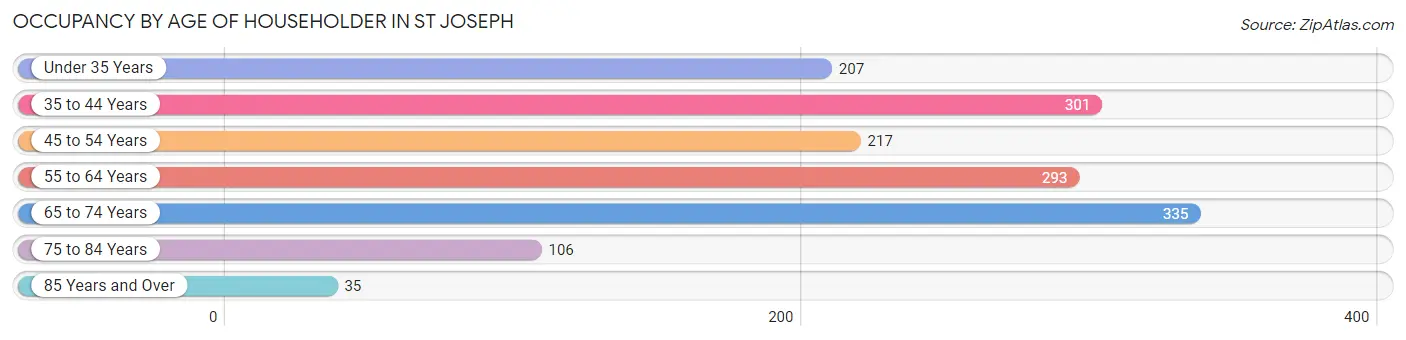
| Age Bracket | # Households | % Households |
| Under 35 Years | 207 | 13.9% |
| 35 to 44 Years | 301 | 20.2% |
| 45 to 54 Years | 217 | 14.5% |
| 55 to 64 Years | 293 | 19.6% |
| 65 to 74 Years | 335 | 22.4% |
| 75 to 84 Years | 106 | 7.1% |
| 85 Years and Over | 35 | 2.3% |
| Total | 1,494 | 100.0% |
Housing Finances in St Joseph
Median Income by Occupancy in St Joseph
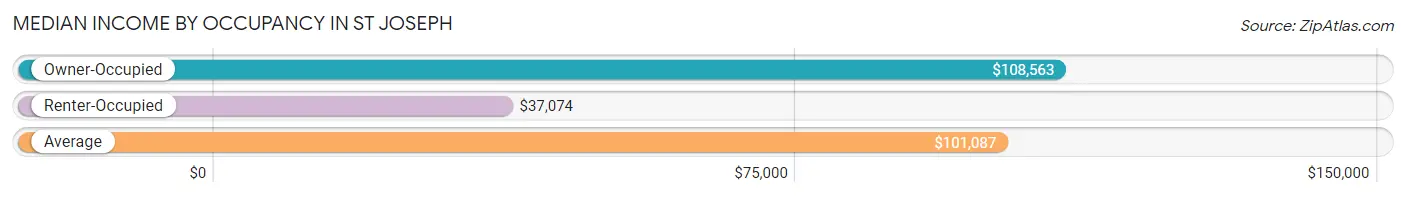
| Occupancy Type | # Households | Median Income |
| Owner-Occupied | 1,281 (85.7%) | $108,563 |
| Renter-Occupied | 213 (14.3%) | $37,074 |
| Average | 1,494 (100.0%) | $101,087 |
Occupancy by Householder Income Bracket in St Joseph
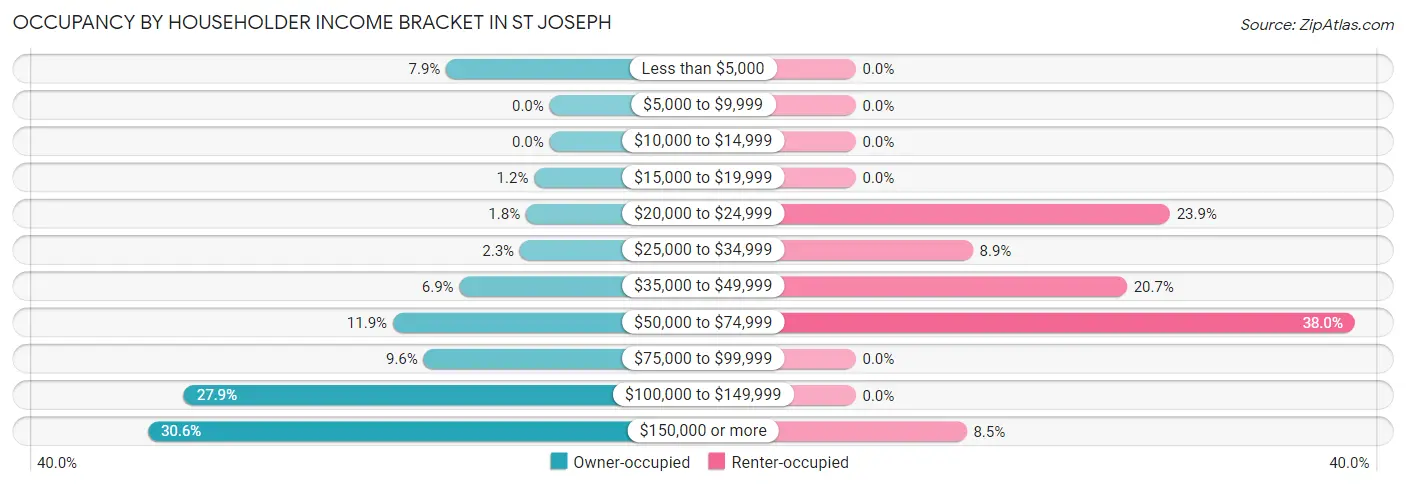
| Income Bracket | Owner-occupied | Renter-occupied |
| Less than $5,000 | 101 (7.9%) | 0 (0.0%) |
| $5,000 to $9,999 | 0 (0.0%) | 0 (0.0%) |
| $10,000 to $14,999 | 0 (0.0%) | 0 (0.0%) |
| $15,000 to $19,999 | 15 (1.2%) | 0 (0.0%) |
| $20,000 to $24,999 | 23 (1.8%) | 51 (23.9%) |
| $25,000 to $34,999 | 29 (2.3%) | 19 (8.9%) |
| $35,000 to $49,999 | 88 (6.9%) | 44 (20.7%) |
| $50,000 to $74,999 | 153 (11.9%) | 81 (38.0%) |
| $75,000 to $99,999 | 123 (9.6%) | 0 (0.0%) |
| $100,000 to $149,999 | 357 (27.9%) | 0 (0.0%) |
| $150,000 or more | 392 (30.6%) | 18 (8.5%) |
| Total | 1,281 (100.0%) | 213 (100.0%) |
Monthly Housing Cost Tiers in St Joseph
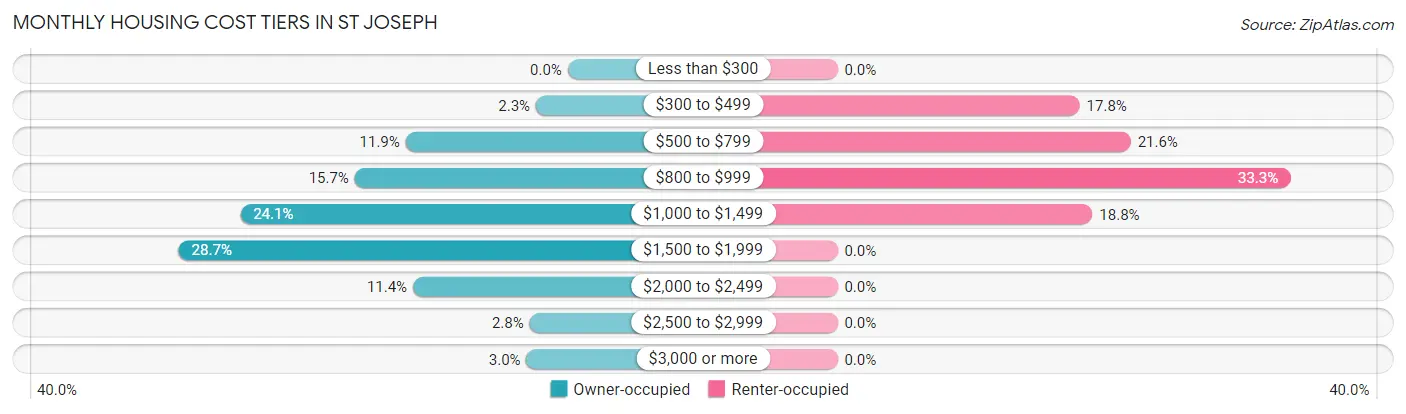
| Monthly Cost | Owner-occupied | Renter-occupied |
| Less than $300 | 0 (0.0%) | 0 (0.0%) |
| $300 to $499 | 30 (2.3%) | 38 (17.8%) |
| $500 to $799 | 153 (11.9%) | 46 (21.6%) |
| $800 to $999 | 201 (15.7%) | 71 (33.3%) |
| $1,000 to $1,499 | 309 (24.1%) | 40 (18.8%) |
| $1,500 to $1,999 | 367 (28.6%) | 0 (0.0%) |
| $2,000 to $2,499 | 146 (11.4%) | 0 (0.0%) |
| $2,500 to $2,999 | 36 (2.8%) | 0 (0.0%) |
| $3,000 or more | 39 (3.0%) | 0 (0.0%) |
| Total | 1,281 (100.0%) | 213 (100.0%) |
Physical Housing Characteristics in St Joseph
Housing Structures in St Joseph
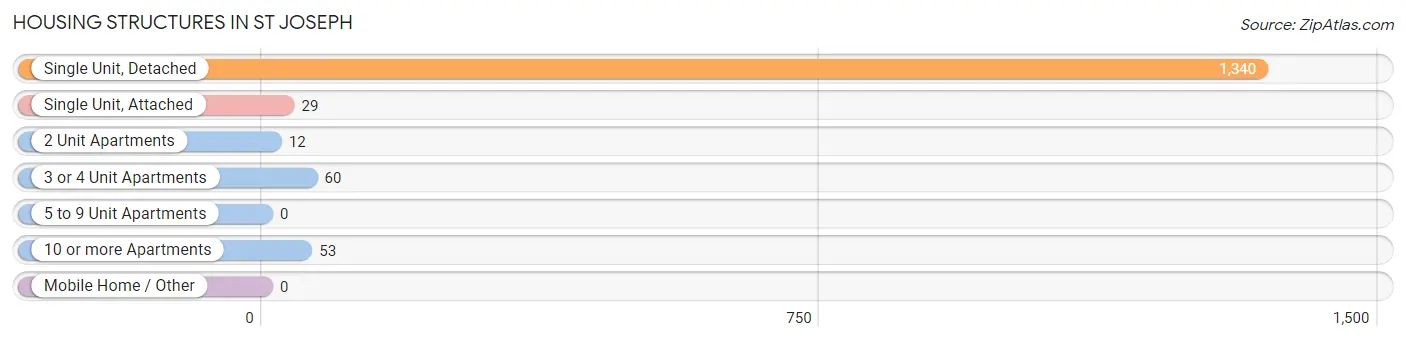
| Structure Type | # Housing Units | % Housing Units |
| Single Unit, Detached | 1,340 | 89.7% |
| Single Unit, Attached | 29 | 1.9% |
| 2 Unit Apartments | 12 | 0.8% |
| 3 or 4 Unit Apartments | 60 | 4.0% |
| 5 to 9 Unit Apartments | 0 | 0.0% |
| 10 or more Apartments | 53 | 3.5% |
| Mobile Home / Other | 0 | 0.0% |
| Total | 1,494 | 100.0% |
Housing Structures by Occupancy in St Joseph
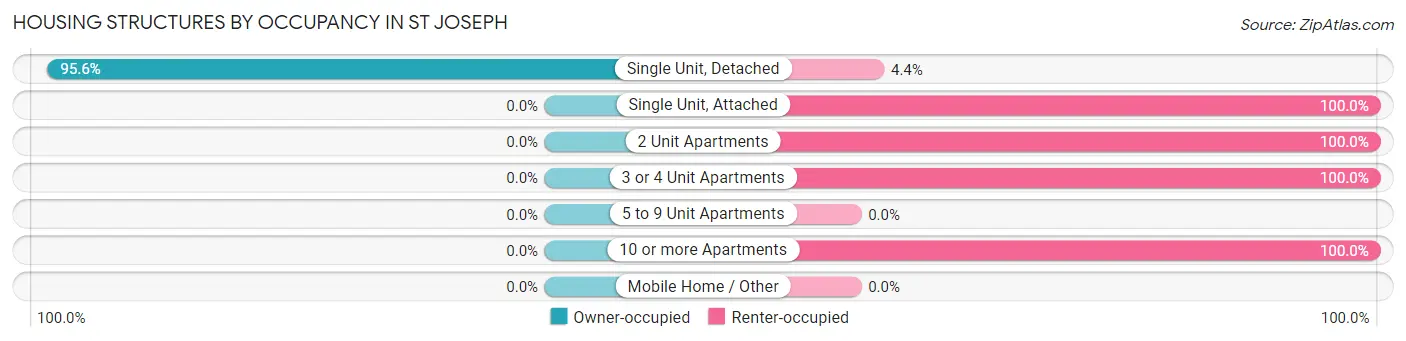
| Structure Type | Owner-occupied | Renter-occupied |
| Single Unit, Detached | 1,281 (95.6%) | 59 (4.4%) |
| Single Unit, Attached | 0 (0.0%) | 29 (100.0%) |
| 2 Unit Apartments | 0 (0.0%) | 12 (100.0%) |
| 3 or 4 Unit Apartments | 0 (0.0%) | 60 (100.0%) |
| 5 to 9 Unit Apartments | 0 (0.0%) | 0 (0.0%) |
| 10 or more Apartments | 0 (0.0%) | 53 (100.0%) |
| Mobile Home / Other | 0 (0.0%) | 0 (0.0%) |
| Total | 1,281 (85.7%) | 213 (14.3%) |
Housing Structures by Number of Rooms in St Joseph
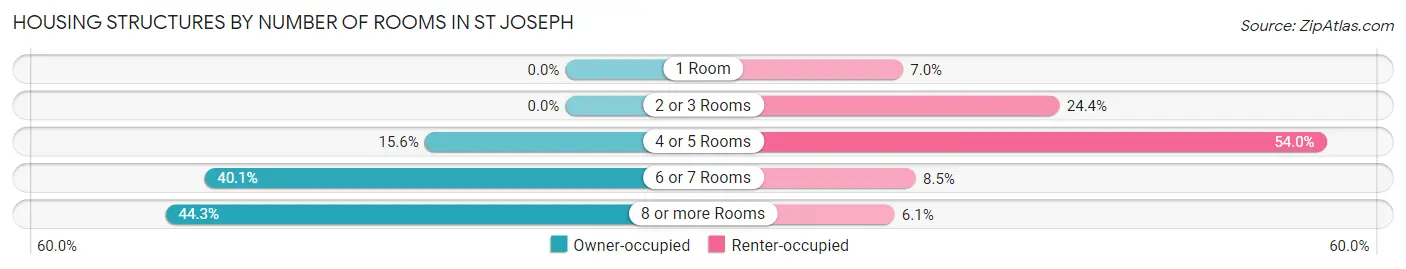
| Number of Rooms | Owner-occupied | Renter-occupied |
| 1 Room | 0 (0.0%) | 15 (7.0%) |
| 2 or 3 Rooms | 0 (0.0%) | 52 (24.4%) |
| 4 or 5 Rooms | 200 (15.6%) | 115 (54.0%) |
| 6 or 7 Rooms | 513 (40.1%) | 18 (8.5%) |
| 8 or more Rooms | 568 (44.3%) | 13 (6.1%) |
| Total | 1,281 (100.0%) | 213 (100.0%) |
Housing Structure by Heating Type in St Joseph
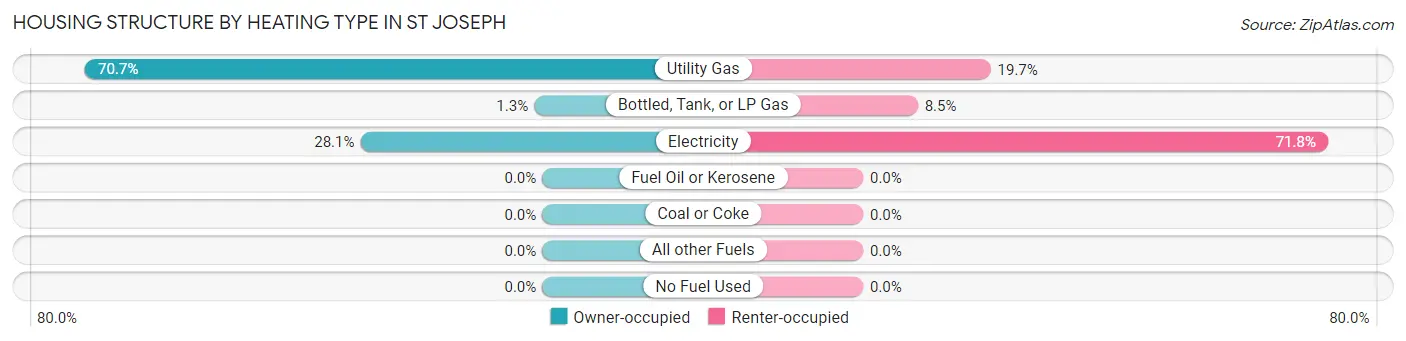
| Heating Type | Owner-occupied | Renter-occupied |
| Utility Gas | 905 (70.7%) | 42 (19.7%) |
| Bottled, Tank, or LP Gas | 16 (1.3%) | 18 (8.5%) |
| Electricity | 360 (28.1%) | 153 (71.8%) |
| Fuel Oil or Kerosene | 0 (0.0%) | 0 (0.0%) |
| Coal or Coke | 0 (0.0%) | 0 (0.0%) |
| All other Fuels | 0 (0.0%) | 0 (0.0%) |
| No Fuel Used | 0 (0.0%) | 0 (0.0%) |
| Total | 1,281 (100.0%) | 213 (100.0%) |
Household Vehicle Usage in St Joseph
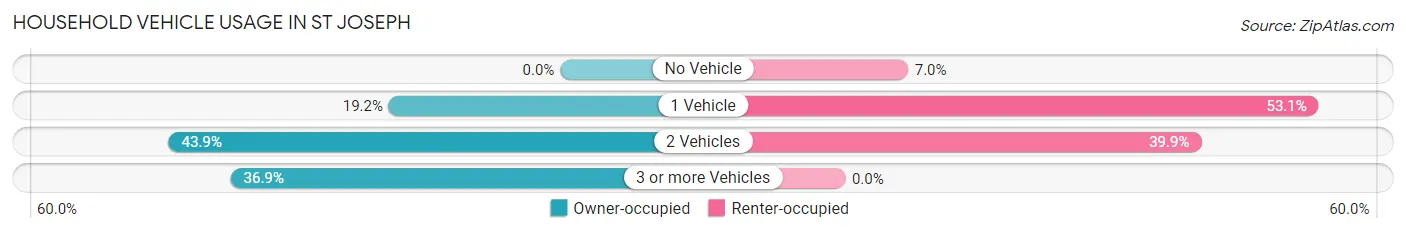
| Vehicles per Household | Owner-occupied | Renter-occupied |
| No Vehicle | 0 (0.0%) | 15 (7.0%) |
| 1 Vehicle | 246 (19.2%) | 113 (53.0%) |
| 2 Vehicles | 562 (43.9%) | 85 (39.9%) |
| 3 or more Vehicles | 473 (36.9%) | 0 (0.0%) |
| Total | 1,281 (100.0%) | 213 (100.0%) |
Real Estate & Mortgages in St Joseph
Real Estate and Mortgage Overview in St Joseph
| Characteristic | Without Mortgage | With Mortgage |
| Housing Units | 475 | 806 |
| Median Property Value | $284,700 | $220,700 |
| Median Household Income | $88,068 | $261 |
| Monthly Housing Costs | $841 | $39 |
| Real Estate Taxes | $5,176 | $25 |
Property Value by Mortgage Status in St Joseph
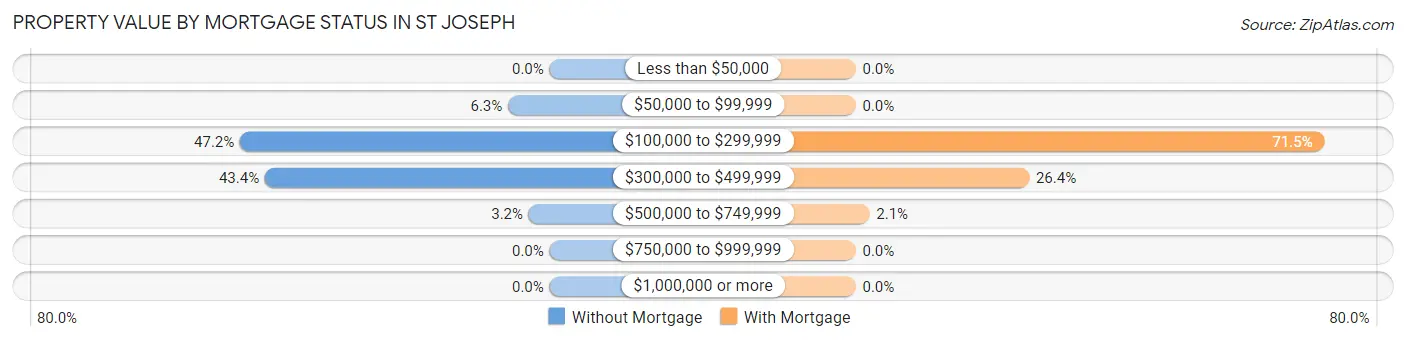
| Property Value | Without Mortgage | With Mortgage |
| Less than $50,000 | 0 (0.0%) | 0 (0.0%) |
| $50,000 to $99,999 | 30 (6.3%) | 0 (0.0%) |
| $100,000 to $299,999 | 224 (47.2%) | 576 (71.5%) |
| $300,000 to $499,999 | 206 (43.4%) | 213 (26.4%) |
| $500,000 to $749,999 | 15 (3.2%) | 17 (2.1%) |
| $750,000 to $999,999 | 0 (0.0%) | 0 (0.0%) |
| $1,000,000 or more | 0 (0.0%) | 0 (0.0%) |
| Total | 475 (100.0%) | 806 (100.0%) |
Household Income by Mortgage Status in St Joseph
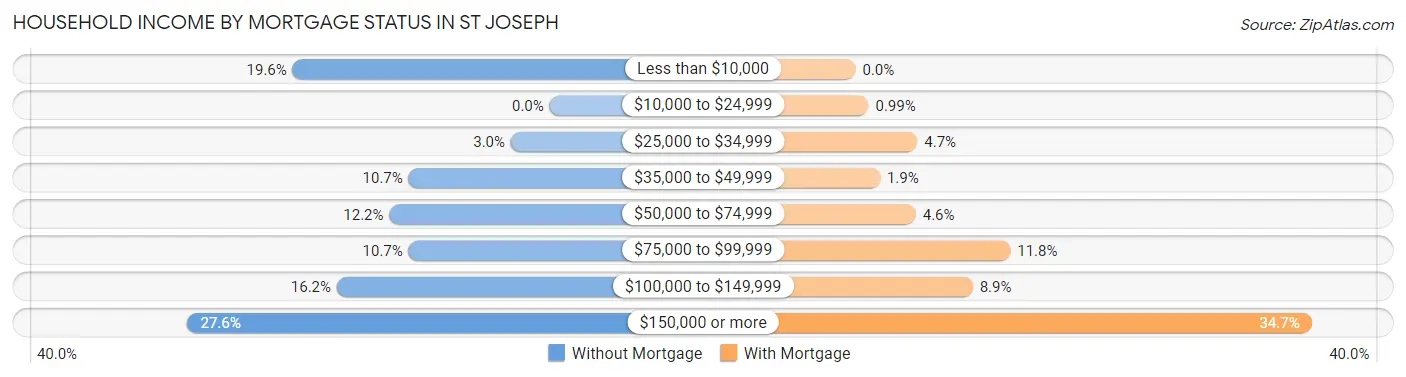
| Household Income | Without Mortgage | With Mortgage |
| Less than $10,000 | 93 (19.6%) | 0 (0.0%) |
| $10,000 to $24,999 | 0 (0.0%) | 8 (1.0%) |
| $25,000 to $34,999 | 14 (2.9%) | 38 (4.7%) |
| $35,000 to $49,999 | 51 (10.7%) | 15 (1.9%) |
| $50,000 to $74,999 | 58 (12.2%) | 37 (4.6%) |
| $75,000 to $99,999 | 51 (10.7%) | 95 (11.8%) |
| $100,000 to $149,999 | 77 (16.2%) | 72 (8.9%) |
| $150,000 or more | 131 (27.6%) | 280 (34.7%) |
| Total | 475 (100.0%) | 806 (100.0%) |
Property Value to Household Income Ratio in St Joseph
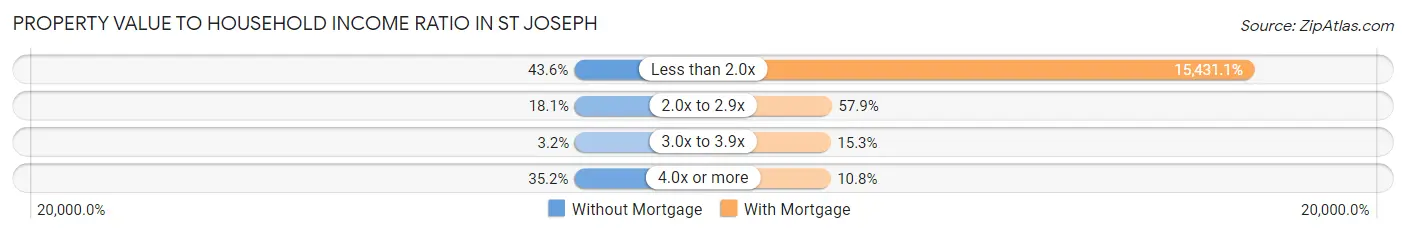
| Value-to-Income Ratio | Without Mortgage | With Mortgage |
| Less than 2.0x | 207 (43.6%) | 124,375 (15,431.1%) |
| 2.0x to 2.9x | 86 (18.1%) | 467 (57.9%) |
| 3.0x to 3.9x | 15 (3.2%) | 123 (15.3%) |
| 4.0x or more | 167 (35.2%) | 87 (10.8%) |
| Total | 475 (100.0%) | 806 (100.0%) |
Real Estate Taxes by Mortgage Status in St Joseph
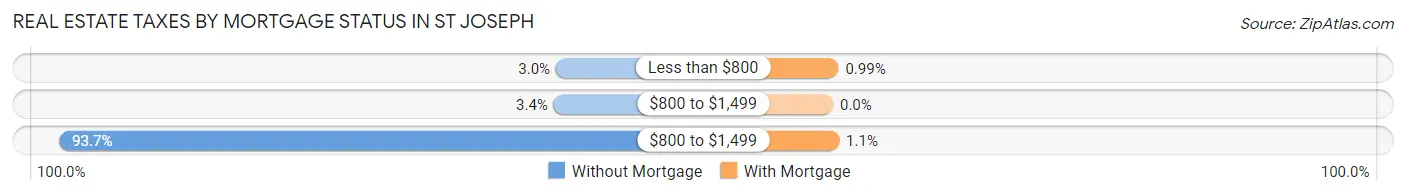
| Property Taxes | Without Mortgage | With Mortgage |
| Less than $800 | 14 (2.9%) | 8 (1.0%) |
| $800 to $1,499 | 16 (3.4%) | 0 (0.0%) |
| $800 to $1,499 | 445 (93.7%) | 9 (1.1%) |
| Total | 475 (100.0%) | 806 (100.0%) |
Health & Disability in St Joseph
Health Insurance Coverage by Age in St Joseph
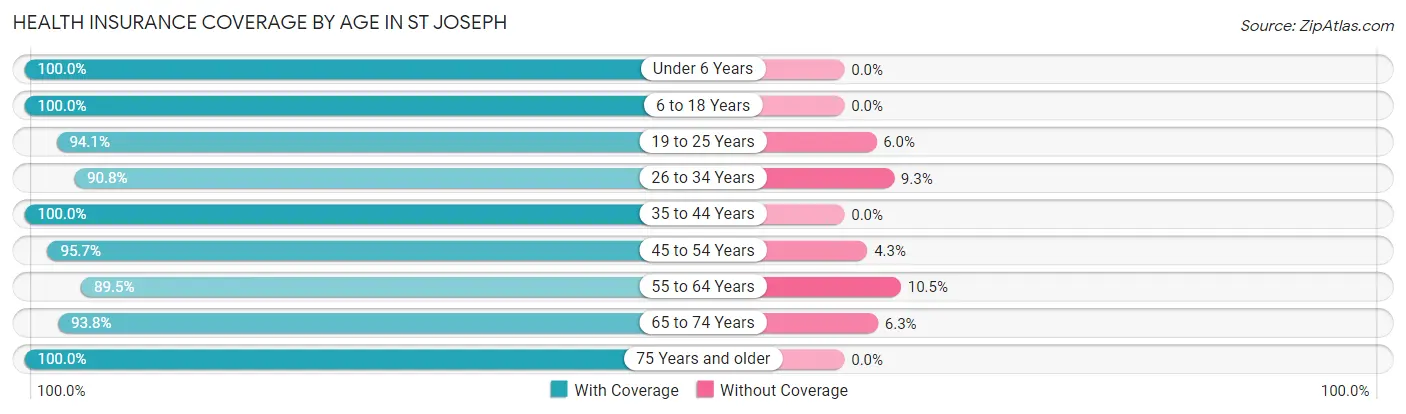
| Age Bracket | With Coverage | Without Coverage |
| Under 6 Years | 192 (100.0%) | 0 (0.0%) |
| 6 to 18 Years | 971 (100.0%) | 0 (0.0%) |
| 19 to 25 Years | 174 (94.1%) | 11 (5.9%) |
| 26 to 34 Years | 304 (90.7%) | 31 (9.2%) |
| 35 to 44 Years | 628 (100.0%) | 0 (0.0%) |
| 45 to 54 Years | 313 (95.7%) | 14 (4.3%) |
| 55 to 64 Years | 552 (89.5%) | 65 (10.5%) |
| 65 to 74 Years | 450 (93.8%) | 30 (6.2%) |
| 75 Years and older | 196 (100.0%) | 0 (0.0%) |
| Total | 3,780 (96.2%) | 151 (3.8%) |
Health Insurance Coverage by Citizenship Status in St Joseph
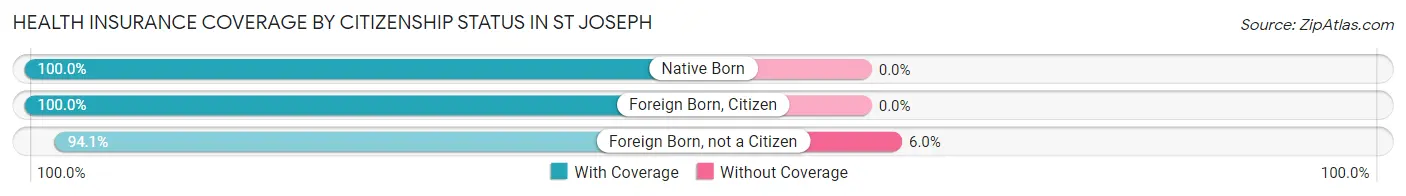
| Citizenship Status | With Coverage | Without Coverage |
| Native Born | 192 (100.0%) | 0 (0.0%) |
| Foreign Born, Citizen | 971 (100.0%) | 0 (0.0%) |
| Foreign Born, not a Citizen | 174 (94.1%) | 11 (5.9%) |
Health Insurance Coverage by Household Income in St Joseph
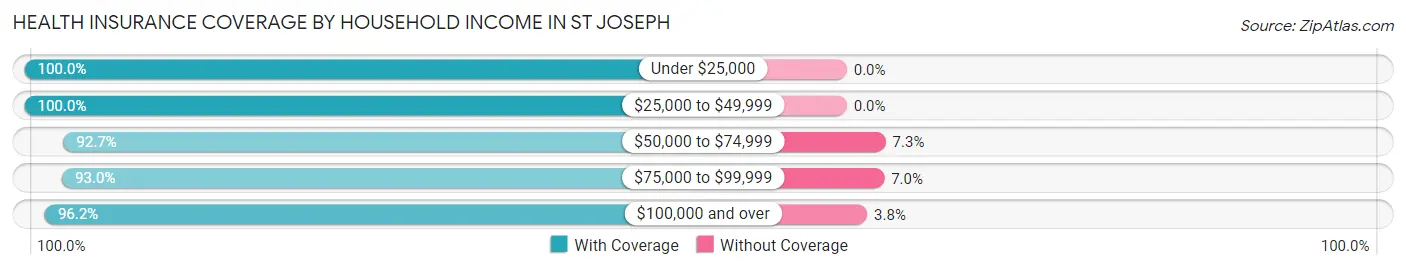
| Household Income | With Coverage | Without Coverage |
| Under $25,000 | 252 (100.0%) | 0 (0.0%) |
| $25,000 to $49,999 | 325 (100.0%) | 0 (0.0%) |
| $50,000 to $74,999 | 395 (92.7%) | 31 (7.3%) |
| $75,000 to $99,999 | 252 (93.0%) | 19 (7.0%) |
| $100,000 and over | 2,541 (96.2%) | 101 (3.8%) |
Public vs Private Health Insurance Coverage by Age in St Joseph
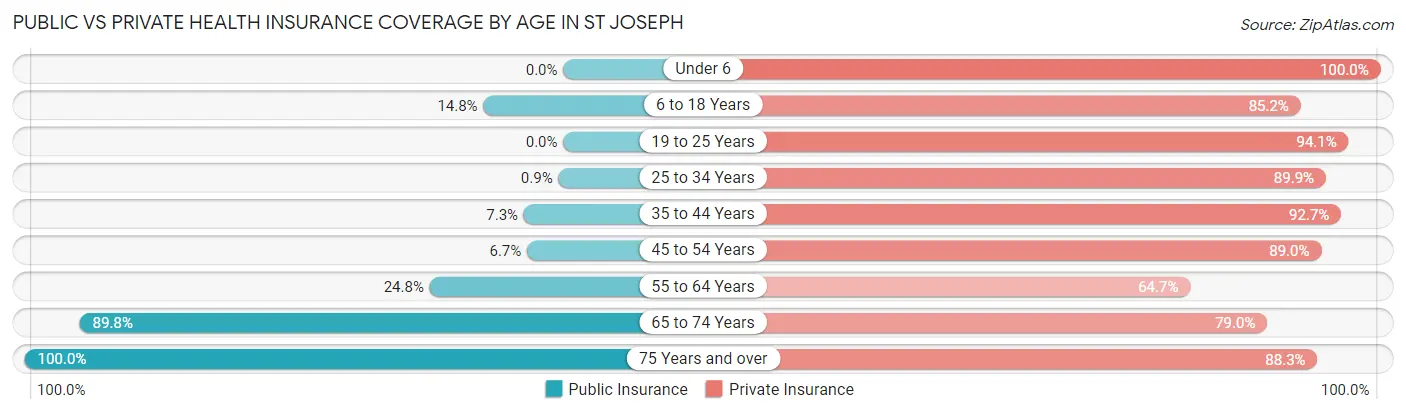
| Age Bracket | Public Insurance | Private Insurance |
| Under 6 | 0 (0.0%) | 192 (100.0%) |
| 6 to 18 Years | 144 (14.8%) | 827 (85.2%) |
| 19 to 25 Years | 0 (0.0%) | 174 (94.1%) |
| 25 to 34 Years | 3 (0.9%) | 301 (89.8%) |
| 35 to 44 Years | 46 (7.3%) | 582 (92.7%) |
| 45 to 54 Years | 22 (6.7%) | 291 (89.0%) |
| 55 to 64 Years | 153 (24.8%) | 399 (64.7%) |
| 65 to 74 Years | 431 (89.8%) | 379 (79.0%) |
| 75 Years and over | 196 (100.0%) | 173 (88.3%) |
| Total | 995 (25.3%) | 3,318 (84.4%) |
Disability Status by Sex by Age in St Joseph
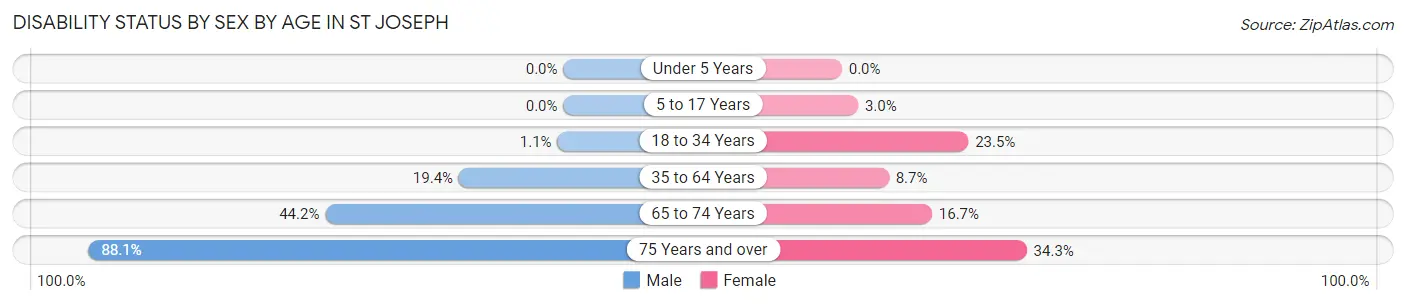
| Age Bracket | Male | Female |
| Under 5 Years | 0 (0.0%) | 0 (0.0%) |
| 5 to 17 Years | 0 (0.0%) | 14 (3.0%) |
| 18 to 34 Years | 3 (1.1%) | 76 (23.5%) |
| 35 to 64 Years | 140 (19.4%) | 74 (8.7%) |
| 65 to 74 Years | 80 (44.2%) | 50 (16.7%) |
| 75 Years and over | 52 (88.1%) | 47 (34.3%) |
Disability Class by Sex by Age in St Joseph
Disability Class: Hearing Difficulty
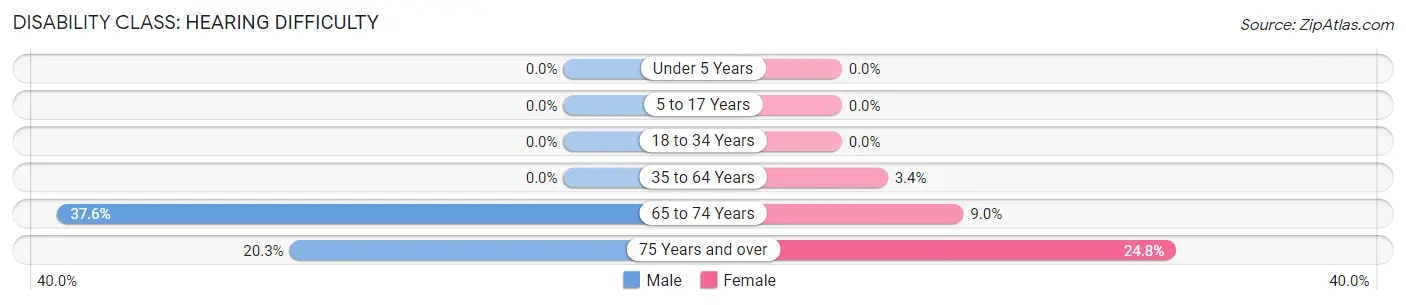
| Age Bracket | Male | Female |
| Under 5 Years | 0 (0.0%) | 0 (0.0%) |
| 5 to 17 Years | 0 (0.0%) | 0 (0.0%) |
| 18 to 34 Years | 0 (0.0%) | 0 (0.0%) |
| 35 to 64 Years | 0 (0.0%) | 29 (3.4%) |
| 65 to 74 Years | 68 (37.6%) | 27 (9.0%) |
| 75 Years and over | 12 (20.3%) | 34 (24.8%) |
Disability Class: Vision Difficulty
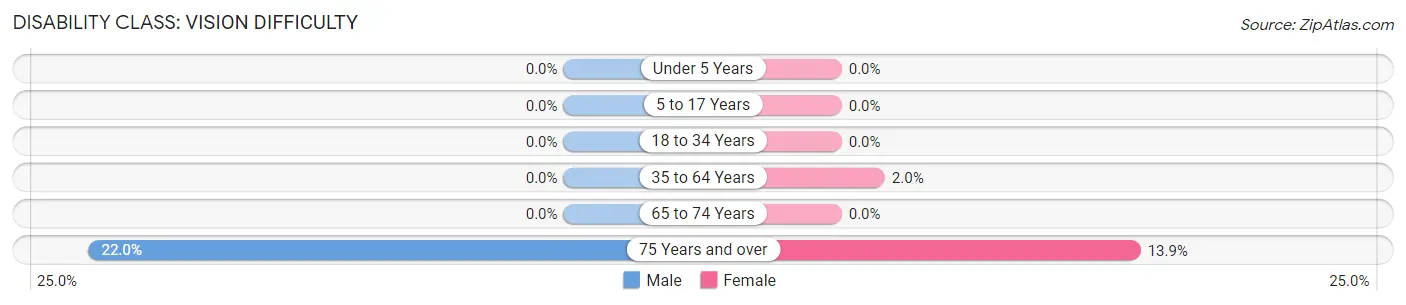
| Age Bracket | Male | Female |
| Under 5 Years | 0 (0.0%) | 0 (0.0%) |
| 5 to 17 Years | 0 (0.0%) | 0 (0.0%) |
| 18 to 34 Years | 0 (0.0%) | 0 (0.0%) |
| 35 to 64 Years | 0 (0.0%) | 17 (2.0%) |
| 65 to 74 Years | 0 (0.0%) | 0 (0.0%) |
| 75 Years and over | 13 (22.0%) | 19 (13.9%) |
Disability Class: Cognitive Difficulty
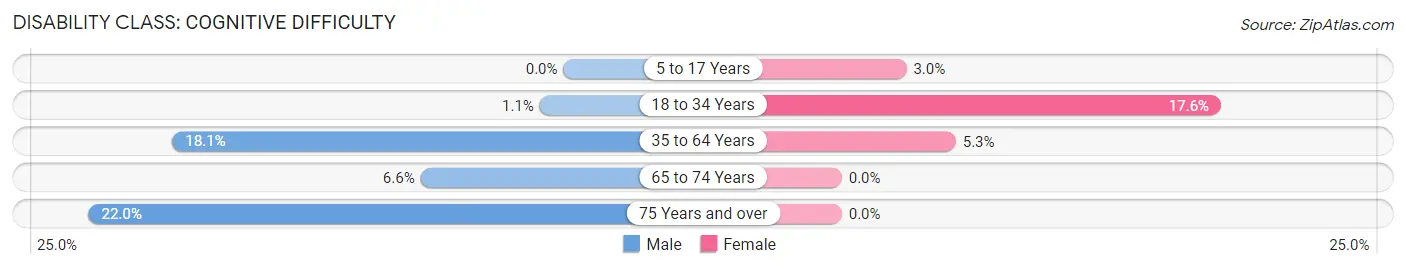
| Age Bracket | Male | Female |
| 5 to 17 Years | 0 (0.0%) | 14 (3.0%) |
| 18 to 34 Years | 3 (1.1%) | 57 (17.6%) |
| 35 to 64 Years | 131 (18.1%) | 45 (5.3%) |
| 65 to 74 Years | 12 (6.6%) | 0 (0.0%) |
| 75 Years and over | 13 (22.0%) | 0 (0.0%) |
Disability Class: Ambulatory Difficulty
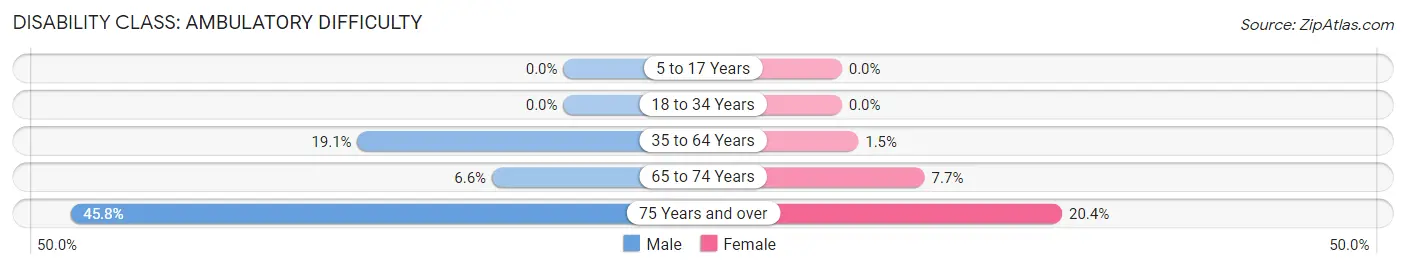
| Age Bracket | Male | Female |
| 5 to 17 Years | 0 (0.0%) | 0 (0.0%) |
| 18 to 34 Years | 0 (0.0%) | 0 (0.0%) |
| 35 to 64 Years | 138 (19.1%) | 13 (1.5%) |
| 65 to 74 Years | 12 (6.6%) | 23 (7.7%) |
| 75 Years and over | 27 (45.8%) | 28 (20.4%) |
Disability Class: Self-Care Difficulty
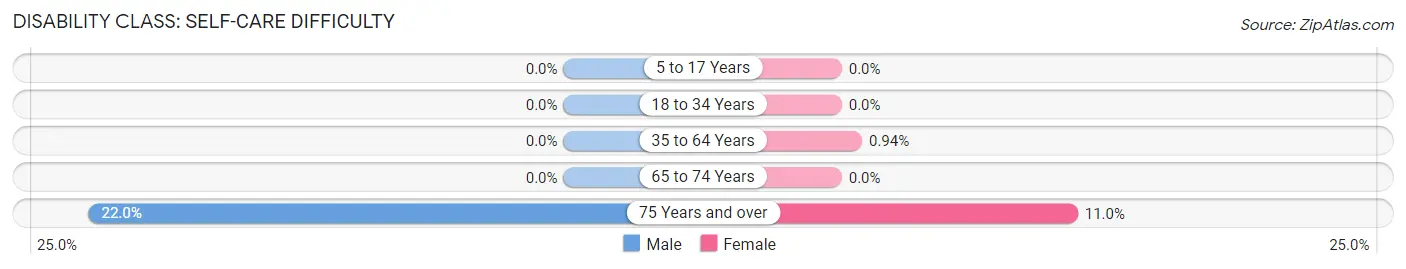
| Age Bracket | Male | Female |
| 5 to 17 Years | 0 (0.0%) | 0 (0.0%) |
| 18 to 34 Years | 0 (0.0%) | 0 (0.0%) |
| 35 to 64 Years | 0 (0.0%) | 8 (0.9%) |
| 65 to 74 Years | 0 (0.0%) | 0 (0.0%) |
| 75 Years and over | 13 (22.0%) | 15 (11.0%) |
Technology Access in St Joseph
Computing Device Access in St Joseph
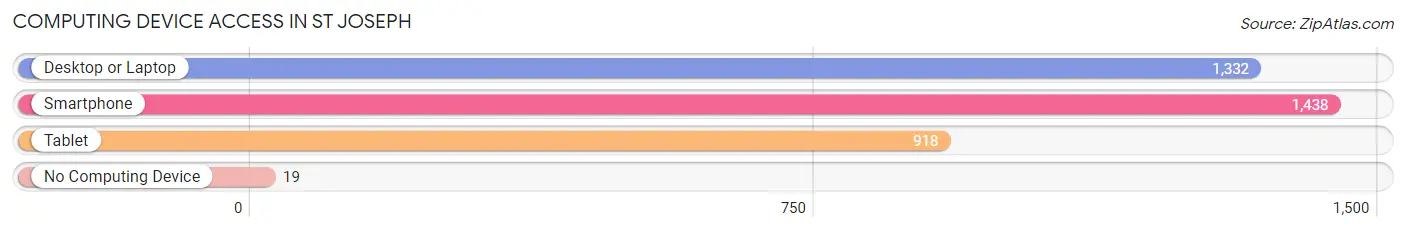
| Device Type | # Households | % Households |
| Desktop or Laptop | 1,332 | 89.2% |
| Smartphone | 1,438 | 96.3% |
| Tablet | 918 | 61.5% |
| No Computing Device | 19 | 1.3% |
| Total | 1,494 | 100.0% |
Internet Access in St Joseph
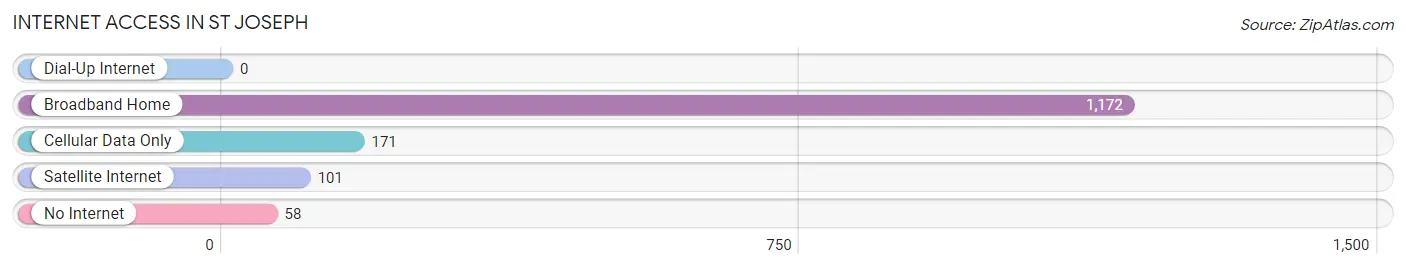
| Internet Type | # Households | % Households |
| Dial-Up Internet | 0 | 0.0% |
| Broadband Home | 1,172 | 78.4% |
| Cellular Data Only | 171 | 11.5% |
| Satellite Internet | 101 | 6.8% |
| No Internet | 58 | 3.9% |
| Total | 1,494 | 100.0% |
St Joseph Summary
St. Joseph, Illinois is a small village located in Champaign County, Illinois. It is situated in the east-central part of the state, about 25 miles south of the city of Champaign. The village has a population of approximately 1,000 people and covers an area of 0.6 square miles.
History
St. Joseph was founded in 1854 by a group of German immigrants who had come to the area in search of a better life. The village was named after St. Joseph, the patron saint of the Catholic Church. The first settlers built a log cabin and a small church, which still stands today.
The village grew slowly over the years, and by the early 1900s, it had become a thriving agricultural community. The main crops grown in the area were corn, wheat, and oats. The village also had a few small businesses, including a general store, a blacksmith shop, and a post office.
In the 1950s, St. Joseph began to experience a population decline as many of its residents moved away in search of better job opportunities. The village was also affected by the decline of the agricultural industry in the area. However, in recent years, the village has seen a resurgence in population and economic activity.
Geography
St. Joseph is located in the east-central part of Champaign County, Illinois. It is situated about 25 miles south of the city of Champaign. The village is surrounded by farmland and is located near the Sangamon River. The village has a total area of 0.6 square miles, all of which is land.
The climate in St. Joseph is typical of the Midwest, with hot summers and cold winters. The average temperature in the summer is around 75 degrees Fahrenheit, while the average temperature in the winter is around 25 degrees Fahrenheit.
Economy
The economy of St. Joseph is largely based on agriculture. The main crops grown in the area are corn, wheat, and oats. The village also has a few small businesses, including a general store, a blacksmith shop, and a post office.
In recent years, the village has seen an increase in tourism. The village is home to several historic sites, including the St. Joseph Church, which was built in 1854. The village also has a number of parks and recreational areas, including the St. Joseph Park and the St. Joseph Nature Preserve.
Demographics
As of the 2010 census, the population of St. Joseph was 1,000. The racial makeup of the village was 97.2% White, 0.7% African American, 0.3% Native American, 0.3% Asian, and 1.5% from other races. The median household income in the village was $45,000.
St. Joseph is a small, rural village with a close-knit community. The village is home to a number of churches, including the St. Joseph Church, which was built in 1854. The village also has a number of parks and recreational areas, including the St. Joseph Park and the St. Joseph Nature Preserve. The village is also home to a number of small businesses, including a general store, a blacksmith shop, and a post office.
Common Questions
What is Per Capita Income in St Joseph?
Per Capita income in St Joseph is $42,317.
What is the Median Family Income in St Joseph?
Median Family Income in St Joseph is $128,272.
What is the Median Household income in St Joseph?
Median Household Income in St Joseph is $101,087.
What is Income or Wage Gap in St Joseph?
Income or Wage Gap in St Joseph is 16.5%.
Women in St Joseph earn 83.5 cents for every dollar earned by a man.
What is Inequality or Gini Index in St Joseph?
Inequality or Gini Index in St Joseph is 0.38.
What is the Total Population of St Joseph?
Total Population of St Joseph is 3,931.
What is the Total Male Population of St Joseph?
Total Male Population of St Joseph is 1,807.
What is the Total Female Population of St Joseph?
Total Female Population of St Joseph is 2,124.
What is the Ratio of Males per 100 Females in St Joseph?
There are 85.08 Males per 100 Females in St Joseph.
What is the Ratio of Females per 100 Males in St Joseph?
There are 117.54 Females per 100 Males in St Joseph.
What is the Median Population Age in St Joseph?
Median Population Age in St Joseph is 39.8 Years.
What is the Average Family Size in St Joseph
Average Family Size in St Joseph is 3.4 People.
What is the Average Household Size in St Joseph
Average Household Size in St Joseph is 2.6 People.
How Large is the Labor Force in St Joseph?
There are 2,001 People in the Labor Forcein in St Joseph.
What is the Percentage of People in the Labor Force in St Joseph?
65.9% of People are in the Labor Force in St Joseph.
What is the Unemployment Rate in St Joseph?
Unemployment Rate in St Joseph is 0.7%.