North Riverside, IL Map & Demographics
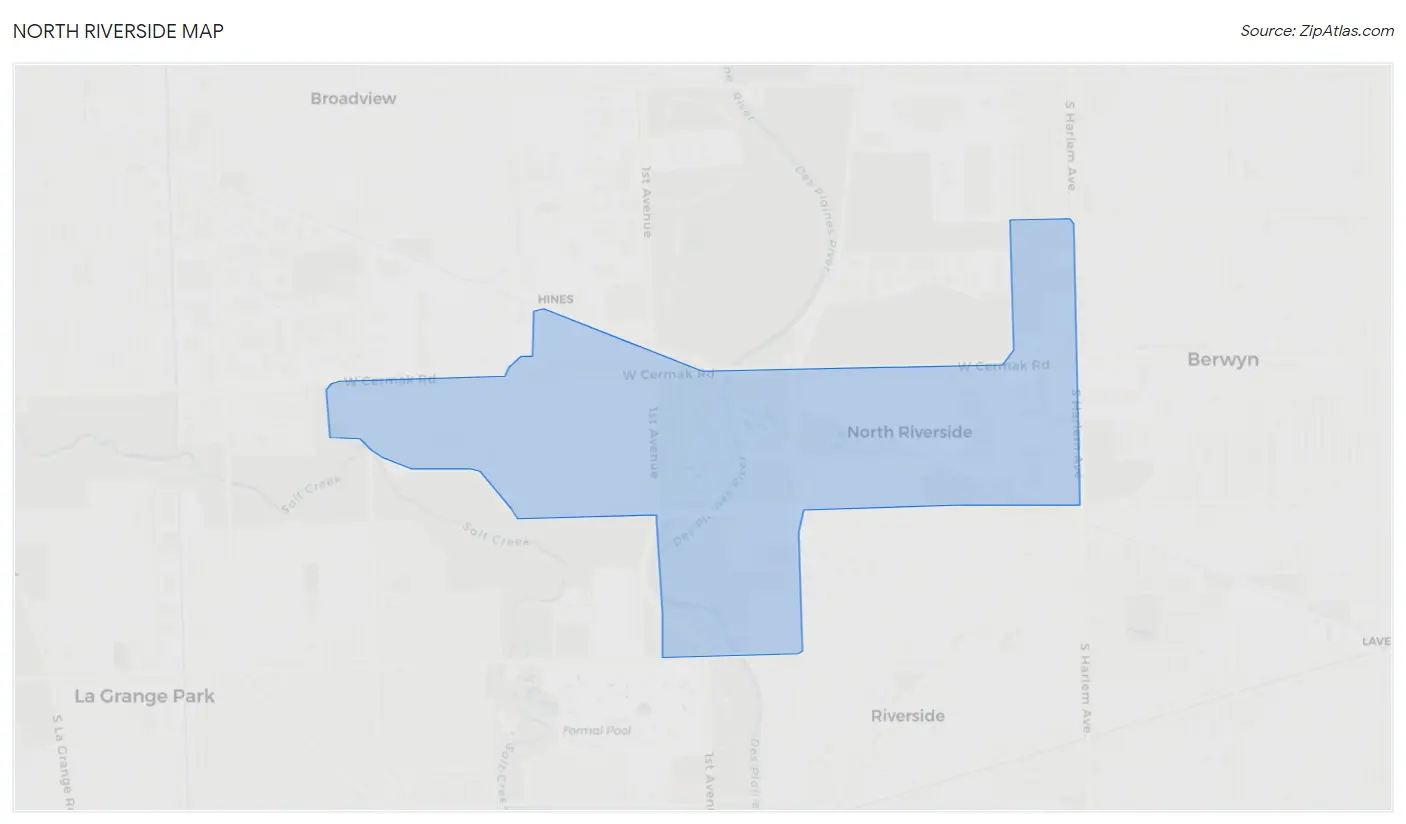
North Riverside Map
North Riverside Overview
$41,272
PER CAPITA INCOME
$92,439
AVG FAMILY INCOME
$63,625
AVG HOUSEHOLD INCOME
5.0%
WAGE / INCOME GAP [ % ]
95.0¢/ $1
WAGE / INCOME GAP [ $ ]
0.50
INEQUALITY / GINI INDEX
7,245
TOTAL POPULATION
3,600
MALE POPULATION
3,645
FEMALE POPULATION
98.77
MALES / 100 FEMALES
101.25
FEMALES / 100 MALES
39.7
MEDIAN AGE
3.1
AVG FAMILY SIZE
2.5
AVG HOUSEHOLD SIZE
3,299
LABOR FORCE [ PEOPLE ]
56.6%
PERCENT IN LABOR FORCE
5.6%
UNEMPLOYMENT RATE
North Riverside Area Codes
Income in North Riverside
Income Overview in North Riverside
Per Capita Income in North Riverside is $41,272, while median incomes of families and households are $92,439 and $63,625 respectively.
| Characteristic | Number | Measure |
| Per Capita Income | 7,245 | $41,272 |
| Median Family Income | 1,920 | $92,439 |
| Mean Family Income | 1,920 | $108,694 |
| Median Household Income | 2,938 | $63,625 |
| Mean Household Income | 2,938 | $100,737 |
| Income Deficit | 1,920 | $0 |
| Wage / Income Gap (%) | 7,245 | 4.98% |
| Wage / Income Gap ($) | 7,245 | 95.02¢ per $1 |
| Gini / Inequality Index | 7,245 | 0.50 |
Earnings by Sex in North Riverside
Average Earnings in North Riverside are $45,549, $44,086 for men and $46,397 for women, a difference of 5.0%.
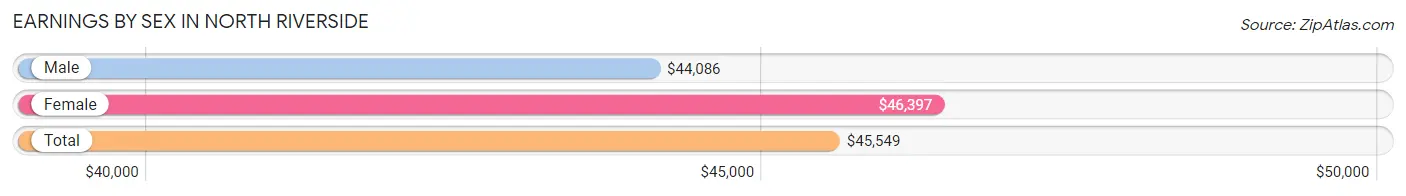
| Sex | Number | Average Earnings |
| Male | 1,836 (54.9%) | $44,086 |
| Female | 1,509 (45.1%) | $46,397 |
| Total | 3,345 (100.0%) | $45,549 |
Earnings by Sex by Income Bracket in North Riverside
The most common earnings brackets in North Riverside are $100,000+ for men (381 | 20.7%) and $75,000 to $99,999 for women (301 | 20.0%).
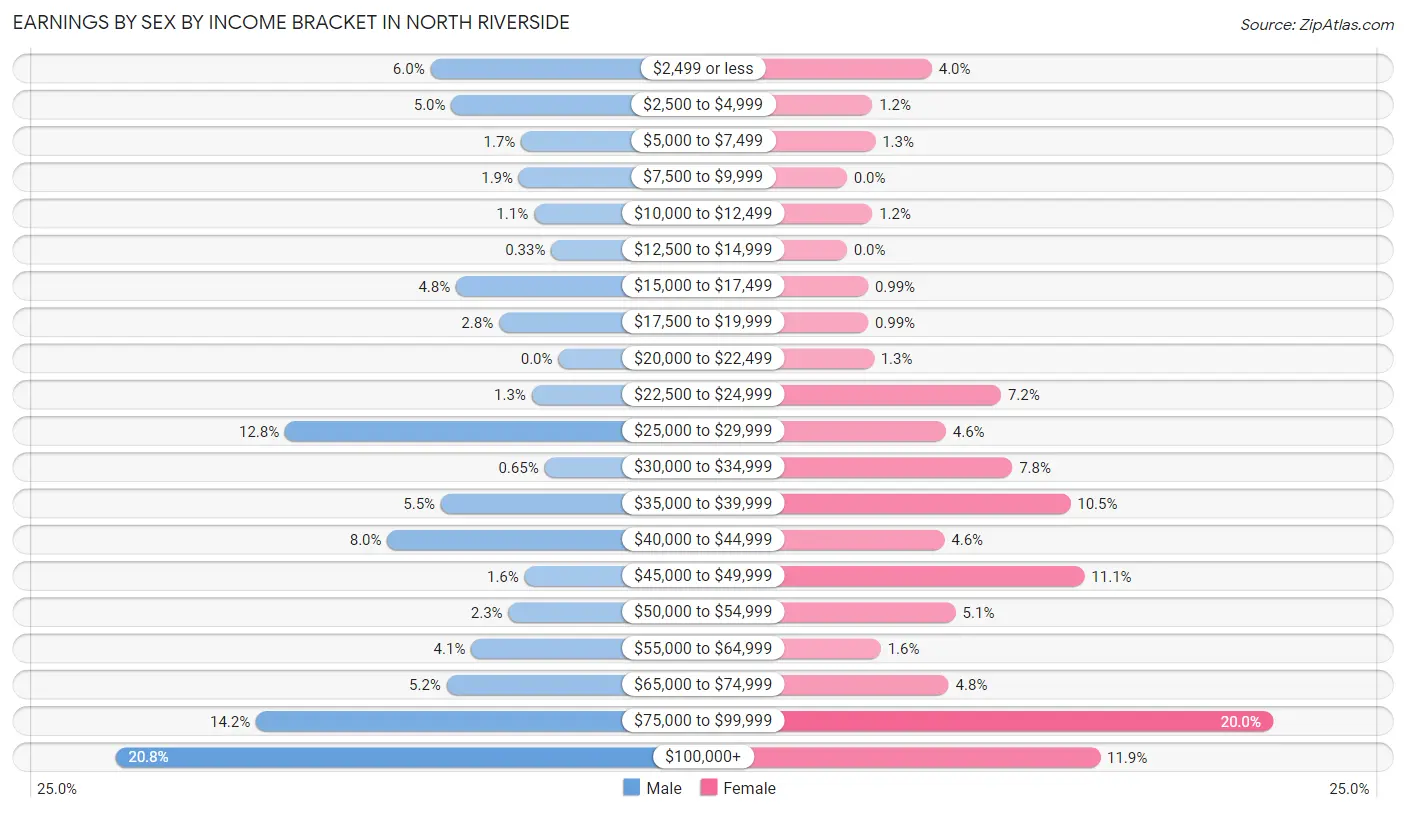
| Income | Male | Female |
| $2,499 or less | 110 (6.0%) | 60 (4.0%) |
| $2,500 to $4,999 | 92 (5.0%) | 18 (1.2%) |
| $5,000 to $7,499 | 32 (1.7%) | 20 (1.3%) |
| $7,500 to $9,999 | 34 (1.8%) | 0 (0.0%) |
| $10,000 to $12,499 | 21 (1.1%) | 18 (1.2%) |
| $12,500 to $14,999 | 6 (0.3%) | 0 (0.0%) |
| $15,000 to $17,499 | 88 (4.8%) | 15 (1.0%) |
| $17,500 to $19,999 | 51 (2.8%) | 15 (1.0%) |
| $20,000 to $22,499 | 0 (0.0%) | 19 (1.3%) |
| $22,500 to $24,999 | 23 (1.3%) | 109 (7.2%) |
| $25,000 to $29,999 | 235 (12.8%) | 70 (4.6%) |
| $30,000 to $34,999 | 12 (0.6%) | 117 (7.7%) |
| $35,000 to $39,999 | 101 (5.5%) | 158 (10.5%) |
| $40,000 to $44,999 | 147 (8.0%) | 69 (4.6%) |
| $45,000 to $49,999 | 29 (1.6%) | 168 (11.1%) |
| $50,000 to $54,999 | 43 (2.3%) | 77 (5.1%) |
| $55,000 to $64,999 | 75 (4.1%) | 24 (1.6%) |
| $65,000 to $74,999 | 96 (5.2%) | 72 (4.8%) |
| $75,000 to $99,999 | 260 (14.2%) | 301 (20.0%) |
| $100,000+ | 381 (20.7%) | 179 (11.9%) |
| Total | 1,836 (100.0%) | 1,509 (100.0%) |
Earnings by Sex by Educational Attainment in North Riverside
Average earnings in North Riverside are $61,801 for men and $46,660 for women, a difference of 24.5%. Men with an educational attainment of bachelor's degree enjoy the highest average annual earnings of $101,500, while those with high school diploma education earn the least with $37,560. Women with an educational attainment of bachelor's degree earn the most with the average annual earnings of $83,256, while those with high school diploma education have the smallest earnings of $38,464.
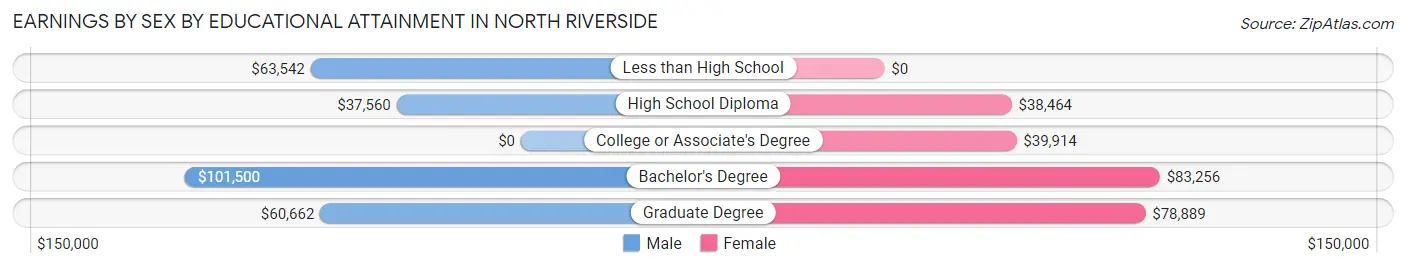
| Educational Attainment | Male Income | Female Income |
| Less than High School | $63,542 | $0 |
| High School Diploma | $37,560 | $38,464 |
| College or Associate's Degree | - | - |
| Bachelor's Degree | $101,500 | $83,256 |
| Graduate Degree | $60,662 | $78,889 |
| Total | $61,801 | $46,660 |
Family Income in North Riverside
Family Income Brackets in North Riverside
According to the North Riverside family income data, there are 493 families falling into the $100,000 to $149,999 income range, which is the most common income bracket and makes up 25.7% of all families. Conversely, the $10,000 to $14,999 income bracket is the least frequent group with only 19 families (1.0%) belonging to this category.
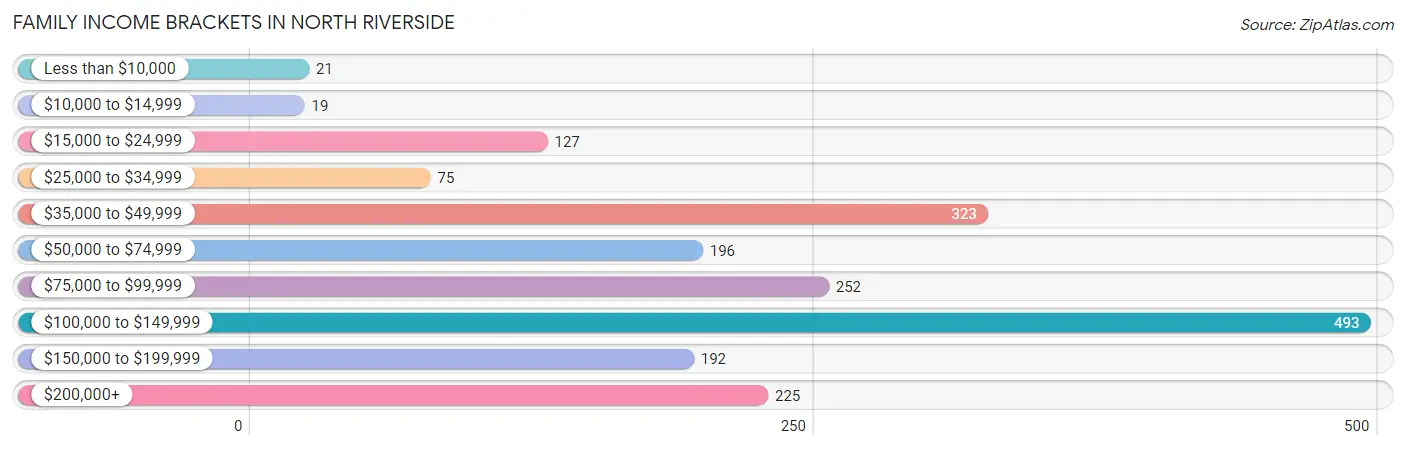
| Income Bracket | # Families | % Families |
| Less than $10,000 | 21 | 1.1% |
| $10,000 to $14,999 | 19 | 1.0% |
| $15,000 to $24,999 | 127 | 6.6% |
| $25,000 to $34,999 | 75 | 3.9% |
| $35,000 to $49,999 | 323 | 16.8% |
| $50,000 to $74,999 | 196 | 10.2% |
| $75,000 to $99,999 | 252 | 13.1% |
| $100,000 to $149,999 | 493 | 25.7% |
| $150,000 to $199,999 | 192 | 10.0% |
| $200,000+ | 225 | 11.7% |
Family Income by Famaliy Size in North Riverside
4-person families (384 | 20.0%) account for the highest median family income in North Riverside with $135,833 per family, while 2-person families (891 | 46.4%) have the highest median income of $40,688 per family member.
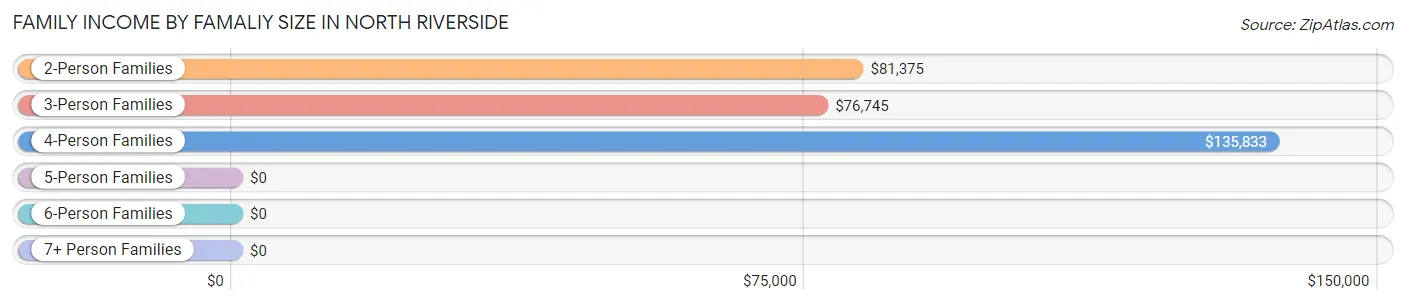
| Income Bracket | # Families | Median Income |
| 2-Person Families | 891 (46.4%) | $81,375 |
| 3-Person Families | 408 (21.2%) | $76,745 |
| 4-Person Families | 384 (20.0%) | $135,833 |
| 5-Person Families | 171 (8.9%) | $0 |
| 6-Person Families | 66 (3.4%) | $0 |
| 7+ Person Families | 0 (0.0%) | $0 |
| Total | 1,920 (100.0%) | $92,439 |
Family Income by Number of Earners in North Riverside
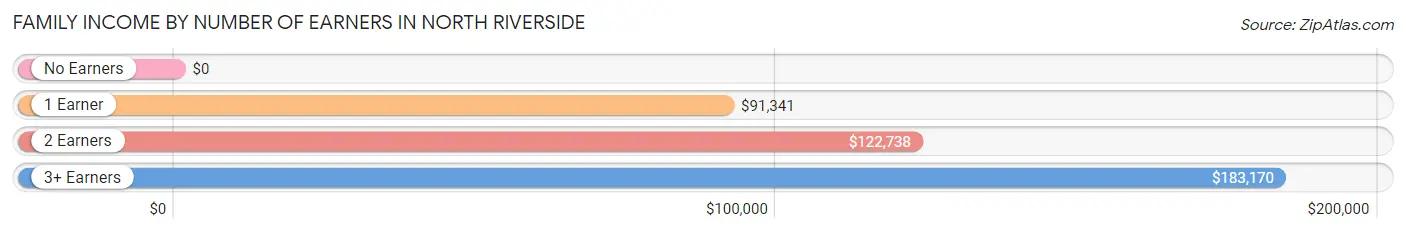
| Number of Earners | # Families | Median Income |
| No Earners | 379 (19.7%) | $0 |
| 1 Earner | 496 (25.8%) | $91,341 |
| 2 Earners | 914 (47.6%) | $122,738 |
| 3+ Earners | 131 (6.8%) | $183,170 |
| Total | 1,920 (100.0%) | $92,439 |
Household Income in North Riverside
Household Income Brackets in North Riverside
With 476 households falling in the category, the $35,000 to $49,999 income range is the most frequent in North Riverside, accounting for 16.2% of all households. In contrast, only 59 households (2.0%) fall into the $10,000 to $14,999 income bracket, making it the least populous group.
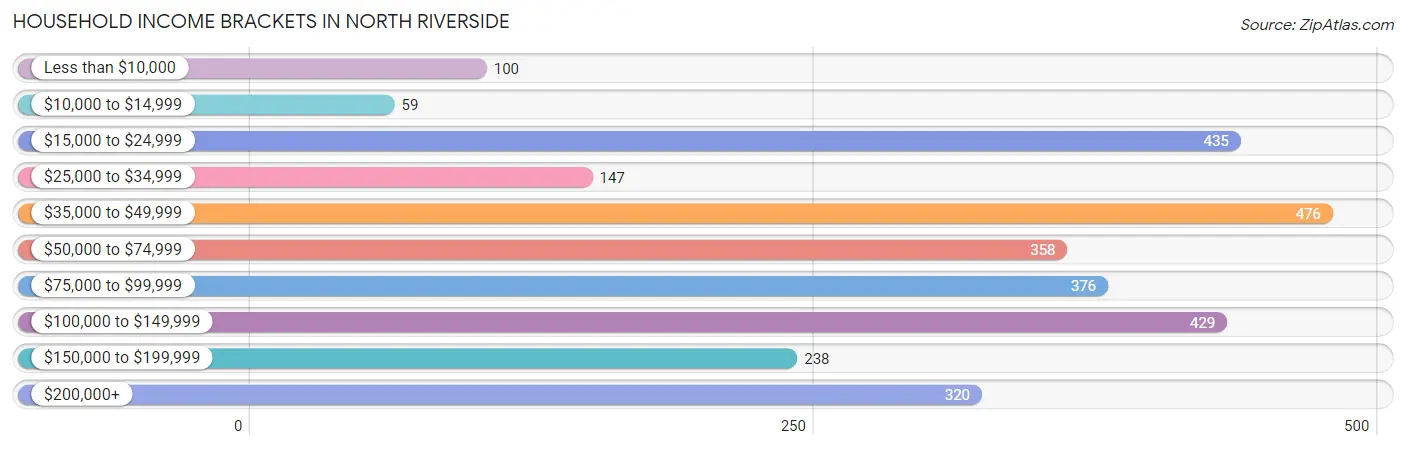
| Income Bracket | # Households | % Households |
| Less than $10,000 | 100 | 3.4% |
| $10,000 to $14,999 | 59 | 2.0% |
| $15,000 to $24,999 | 435 | 14.8% |
| $25,000 to $34,999 | 147 | 5.0% |
| $35,000 to $49,999 | 476 | 16.2% |
| $50,000 to $74,999 | 358 | 12.2% |
| $75,000 to $99,999 | 376 | 12.8% |
| $100,000 to $149,999 | 429 | 14.6% |
| $150,000 to $199,999 | 238 | 8.1% |
| $200,000+ | 320 | 10.9% |
Household Income by Householder Age in North Riverside
The median household income in North Riverside is $63,625, with the highest median household income of $115,850 found in the 25 to 44 years age bracket for the primary householder. A total of 813 households (27.7%) fall into this category. Meanwhile, the 15 to 24 years age bracket for the primary householder has the lowest median household income of $0, with 17 households (0.6%) in this group.
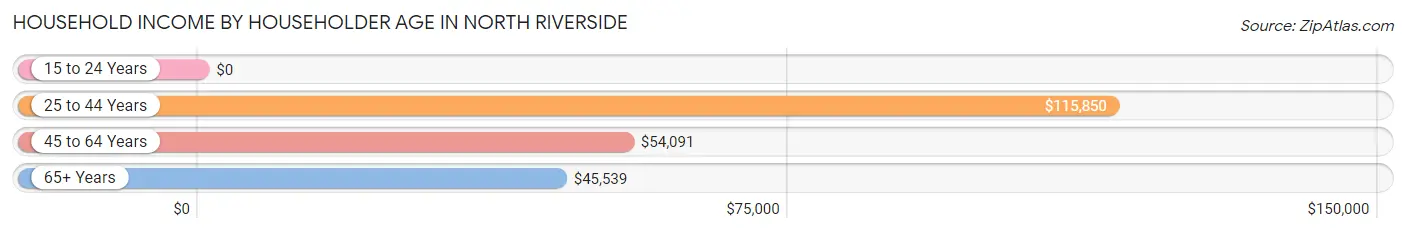
| Income Bracket | # Households | Median Income |
| 15 to 24 Years | 17 (0.6%) | $0 |
| 25 to 44 Years | 813 (27.7%) | $115,850 |
| 45 to 64 Years | 1,156 (39.4%) | $54,091 |
| 65+ Years | 952 (32.4%) | $45,539 |
| Total | 2,938 (100.0%) | $63,625 |
Poverty in North Riverside
Income Below Poverty by Sex and Age in North Riverside
With 4.3% poverty level for males and 5.0% for females among the residents of North Riverside, 25 to 34 year old males and 65 to 74 year old females are the most vulnerable to poverty, with 55 males (17.1%) and 79 females (17.0%) in their respective age groups living below the poverty level.
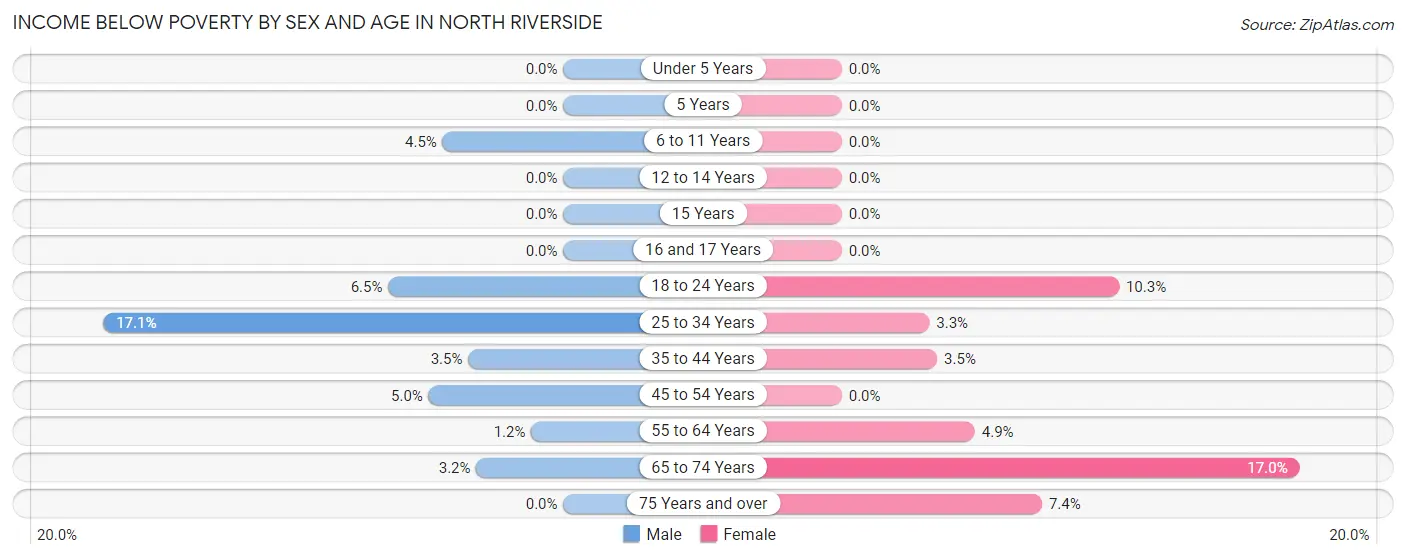
| Age Bracket | Male | Female |
| Under 5 Years | 0 (0.0%) | 0 (0.0%) |
| 5 Years | 0 (0.0%) | 0 (0.0%) |
| 6 to 11 Years | 12 (4.5%) | 0 (0.0%) |
| 12 to 14 Years | 0 (0.0%) | 0 (0.0%) |
| 15 Years | 0 (0.0%) | 0 (0.0%) |
| 16 and 17 Years | 0 (0.0%) | 0 (0.0%) |
| 18 to 24 Years | 36 (6.5%) | 18 (10.3%) |
| 25 to 34 Years | 55 (17.1%) | 13 (3.3%) |
| 35 to 44 Years | 21 (3.5%) | 18 (3.5%) |
| 45 to 54 Years | 17 (5.0%) | 0 (0.0%) |
| 55 to 64 Years | 6 (1.2%) | 23 (4.9%) |
| 65 to 74 Years | 8 (3.2%) | 79 (17.0%) |
| 75 Years and over | 0 (0.0%) | 30 (7.4%) |
| Total | 155 (4.3%) | 181 (5.0%) |
Income Above Poverty by Sex and Age in North Riverside
According to the poverty statistics in North Riverside, males aged under 5 years and females aged under 5 years are the age groups that are most secure financially, with 100.0% of males and 100.0% of females in these age groups living above the poverty line.
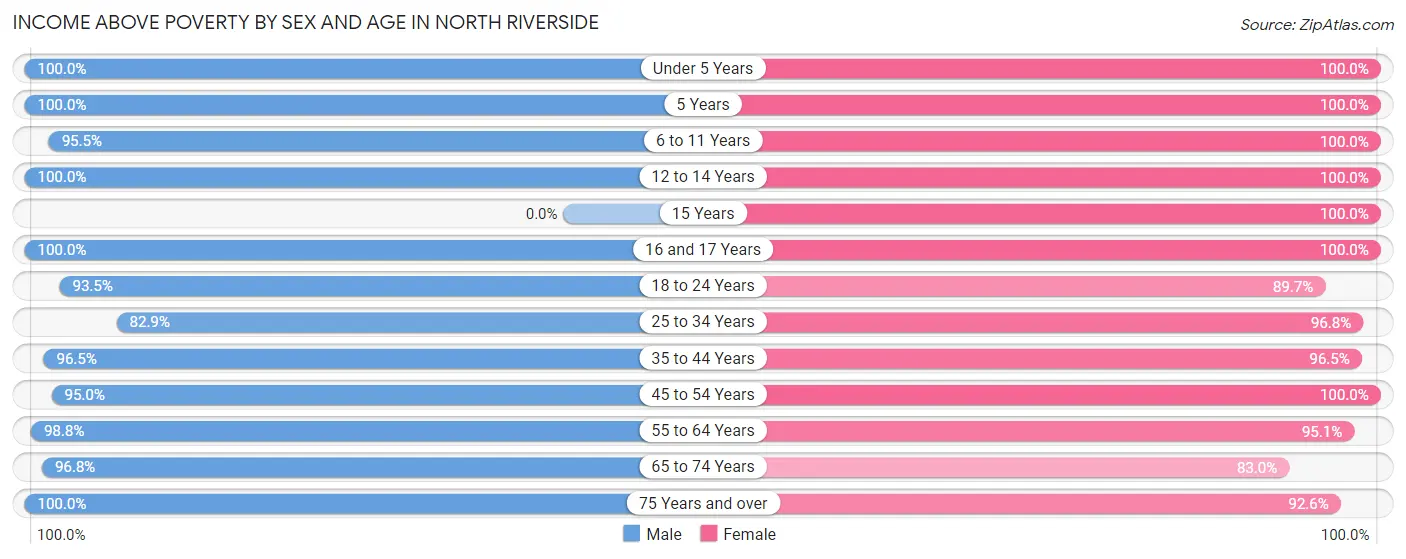
| Age Bracket | Male | Female |
| Under 5 Years | 139 (100.0%) | 136 (100.0%) |
| 5 Years | 6 (100.0%) | 55 (100.0%) |
| 6 to 11 Years | 256 (95.5%) | 397 (100.0%) |
| 12 to 14 Years | 261 (100.0%) | 102 (100.0%) |
| 15 Years | 0 (0.0%) | 52 (100.0%) |
| 16 and 17 Years | 83 (100.0%) | 34 (100.0%) |
| 18 to 24 Years | 518 (93.5%) | 157 (89.7%) |
| 25 to 34 Years | 267 (82.9%) | 387 (96.8%) |
| 35 to 44 Years | 574 (96.5%) | 490 (96.5%) |
| 45 to 54 Years | 323 (95.0%) | 409 (100.0%) |
| 55 to 64 Years | 498 (98.8%) | 443 (95.1%) |
| 65 to 74 Years | 240 (96.8%) | 386 (83.0%) |
| 75 Years and over | 272 (100.0%) | 374 (92.6%) |
| Total | 3,437 (95.7%) | 3,422 (95.0%) |
Income Below Poverty Among Married-Couple Families in North Riverside
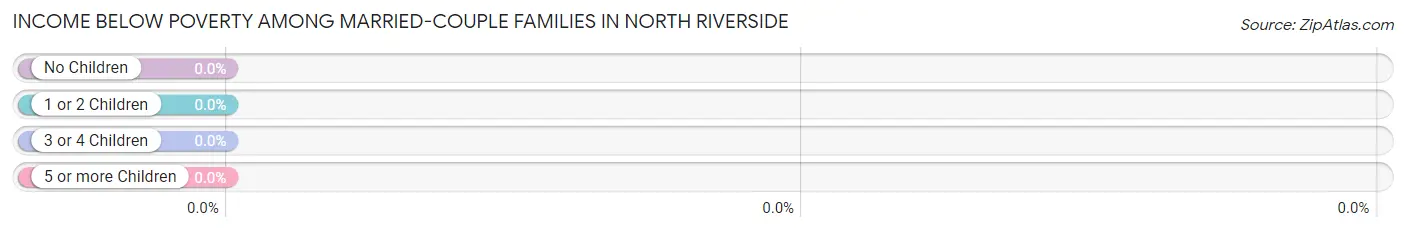
| Children | Above Poverty | Below Poverty |
| No Children | 721 (100.0%) | 0 (0.0%) |
| 1 or 2 Children | 403 (100.0%) | 0 (0.0%) |
| 3 or 4 Children | 106 (100.0%) | 0 (0.0%) |
| 5 or more Children | 0 (0.0%) | 0 (0.0%) |
| Total | 1,230 (100.0%) | 0 (0.0%) |
Income Below Poverty Among Single-Parent Households in North Riverside
According to the poverty data in North Riverside, 8.0% or 16 single-father households and 4.9% or 24 single-mother households are living below the poverty line. Among single-father households, those with 1 or 2 children have the highest poverty rate, with 4 households (16.7%) experiencing poverty. Likewise, among single-mother households, those with no children have the highest poverty rate, with 24 households (12.8%) falling below the poverty line.
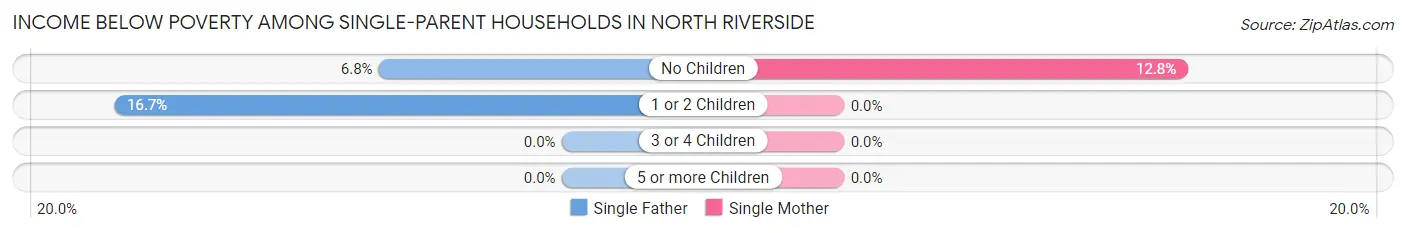
| Children | Single Father | Single Mother |
| No Children | 12 (6.8%) | 24 (12.8%) |
| 1 or 2 Children | 4 (16.7%) | 0 (0.0%) |
| 3 or 4 Children | 0 (0.0%) | 0 (0.0%) |
| 5 or more Children | 0 (0.0%) | 0 (0.0%) |
| Total | 16 (8.0%) | 24 (4.9%) |
Income Below Poverty Among Married-Couple vs Single-Parent Households in North Riverside
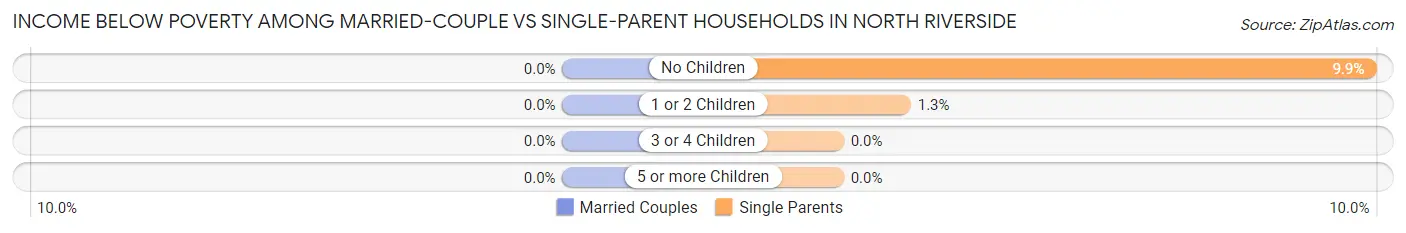
| Children | Married-Couple Families | Single-Parent Households |
| No Children | 0 (0.0%) | 36 (9.9%) |
| 1 or 2 Children | 0 (0.0%) | 4 (1.3%) |
| 3 or 4 Children | 0 (0.0%) | 0 (0.0%) |
| 5 or more Children | 0 (0.0%) | 0 (0.0%) |
| Total | 0 (0.0%) | 40 (5.8%) |
Race in North Riverside
The most populous races in North Riverside are White / Caucasian (5,480 | 75.6%), Hispanic or Latino (1,383 | 19.1%), and Black / African American (691 | 9.5%).
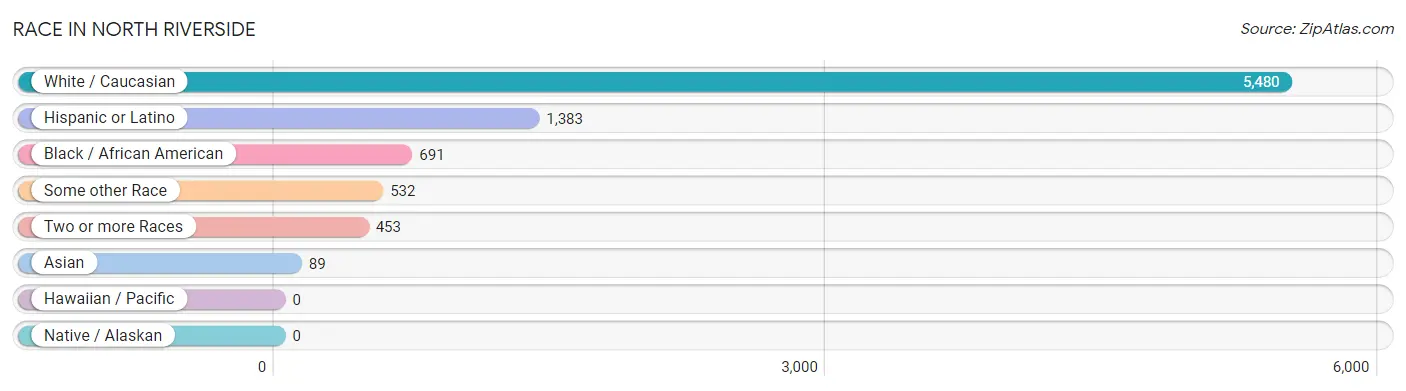
| Race | # Population | % Population |
| Asian | 89 | 1.2% |
| Black / African American | 691 | 9.5% |
| Hawaiian / Pacific | 0 | 0.0% |
| Hispanic or Latino | 1,383 | 19.1% |
| Native / Alaskan | 0 | 0.0% |
| White / Caucasian | 5,480 | 75.6% |
| Two or more Races | 453 | 6.2% |
| Some other Race | 532 | 7.3% |
| Total | 7,245 | 100.0% |
Ancestry in North Riverside
The most populous ancestries reported in North Riverside are Mexican (1,370 | 18.9%), German (703 | 9.7%), Polish (665 | 9.2%), Irish (630 | 8.7%), and Czech (606 | 8.4%), together accounting for 54.8% of all North Riverside residents.
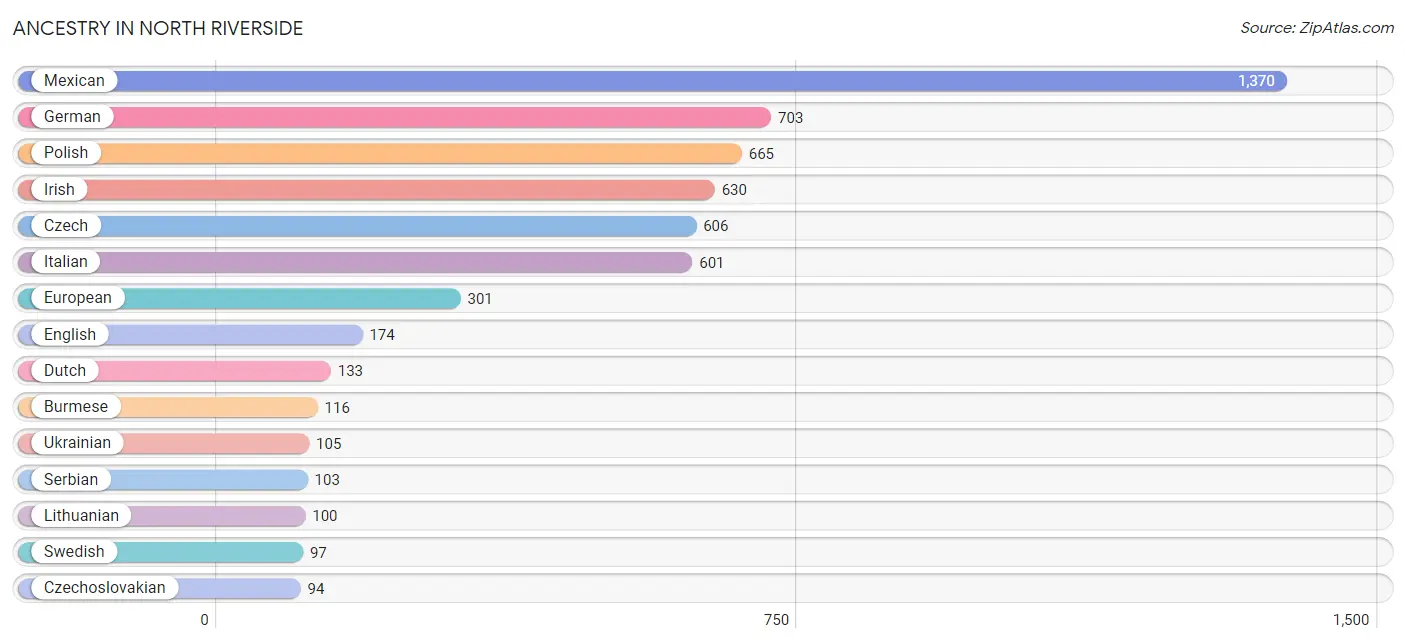
| Ancestry | # Population | % Population |
| American | 93 | 1.3% |
| Arab | 31 | 0.4% |
| Austrian | 31 | 0.4% |
| Belgian | 15 | 0.2% |
| British | 5 | 0.1% |
| Burmese | 116 | 1.6% |
| Central American | 12 | 0.2% |
| Cherokee | 17 | 0.2% |
| Croatian | 81 | 1.1% |
| Czech | 606 | 8.4% |
| Czechoslovakian | 94 | 1.3% |
| Danish | 17 | 0.2% |
| Dutch | 133 | 1.8% |
| English | 174 | 2.4% |
| European | 301 | 4.2% |
| French | 36 | 0.5% |
| French Canadian | 13 | 0.2% |
| German | 703 | 9.7% |
| Guatemalan | 12 | 0.2% |
| Hungarian | 25 | 0.4% |
| Indian (Asian) | 18 | 0.3% |
| Irish | 630 | 8.7% |
| Italian | 601 | 8.3% |
| Jordanian | 31 | 0.4% |
| Korean | 25 | 0.4% |
| Lithuanian | 100 | 1.4% |
| Luxembourger | 13 | 0.2% |
| Mexican | 1,370 | 18.9% |
| Norwegian | 43 | 0.6% |
| Polish | 665 | 9.2% |
| Puerto Rican | 1 | 0.0% |
| Russian | 93 | 1.3% |
| Scotch-Irish | 13 | 0.2% |
| Scottish | 17 | 0.2% |
| Serbian | 103 | 1.4% |
| Slovak | 48 | 0.7% |
| Subsaharan African | 1 | 0.0% |
| Swedish | 97 | 1.3% |
| Ukrainian | 105 | 1.5% |
| Welsh | 12 | 0.2% | View All 40 Rows |
Immigrants in North Riverside
The most numerous immigrant groups reported in North Riverside came from Central America (565 | 7.8%), Latin America (565 | 7.8%), Mexico (565 | 7.8%), Europe (157 | 2.2%), and Asia (110 | 1.5%), together accounting for 27.1% of all North Riverside residents.
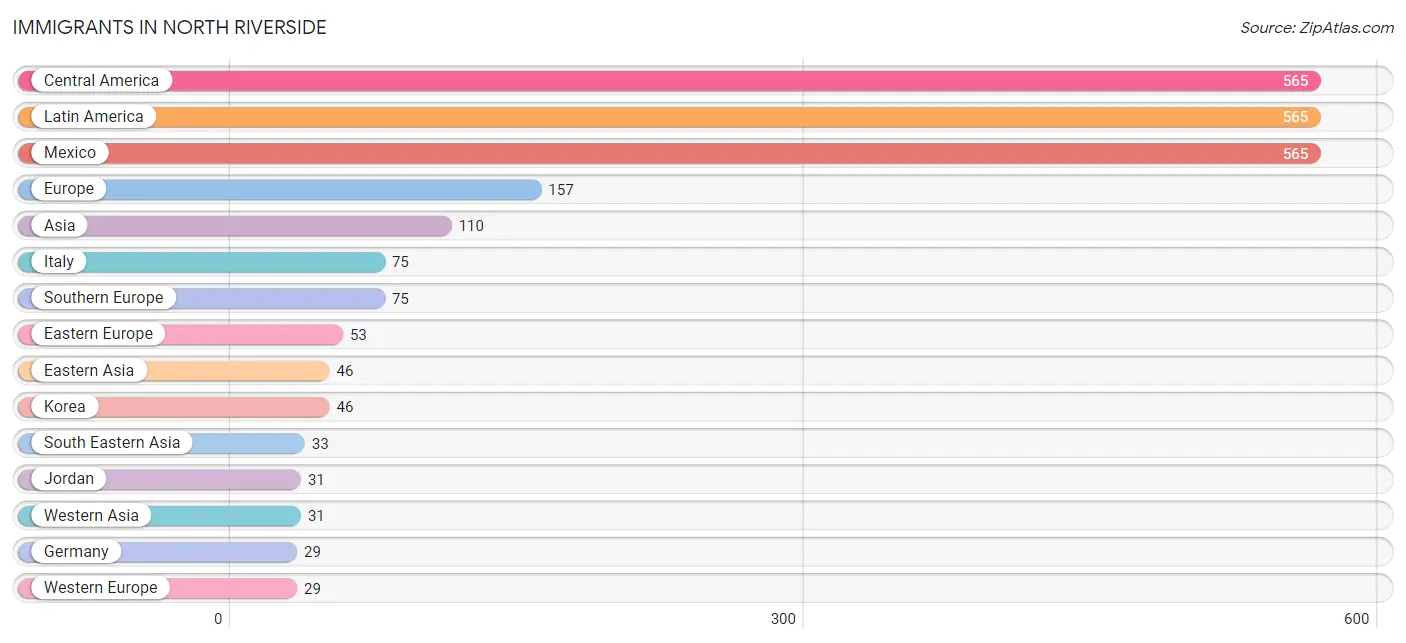
| Immigration Origin | # Population | % Population |
| Africa | 3 | 0.0% |
| Asia | 110 | 1.5% |
| Central America | 565 | 7.8% |
| Congo | 2 | 0.0% |
| Croatia | 5 | 0.1% |
| Eastern Africa | 1 | 0.0% |
| Eastern Asia | 46 | 0.6% |
| Eastern Europe | 53 | 0.7% |
| Europe | 157 | 2.2% |
| Germany | 29 | 0.4% |
| Italy | 75 | 1.0% |
| Jordan | 31 | 0.4% |
| Korea | 46 | 0.6% |
| Latin America | 565 | 7.8% |
| Mexico | 565 | 7.8% |
| Middle Africa | 2 | 0.0% |
| Philippines | 25 | 0.4% |
| South Eastern Asia | 33 | 0.5% |
| Southern Europe | 75 | 1.0% |
| Ukraine | 11 | 0.2% |
| Vietnam | 8 | 0.1% |
| Western Asia | 31 | 0.4% |
| Western Europe | 29 | 0.4% | View All 23 Rows |
Sex and Age in North Riverside
Sex and Age in North Riverside
The most populous age groups in North Riverside are 35 to 39 Years (447 | 12.4%) for men and 5 to 9 Years (359 | 9.9%) for women.
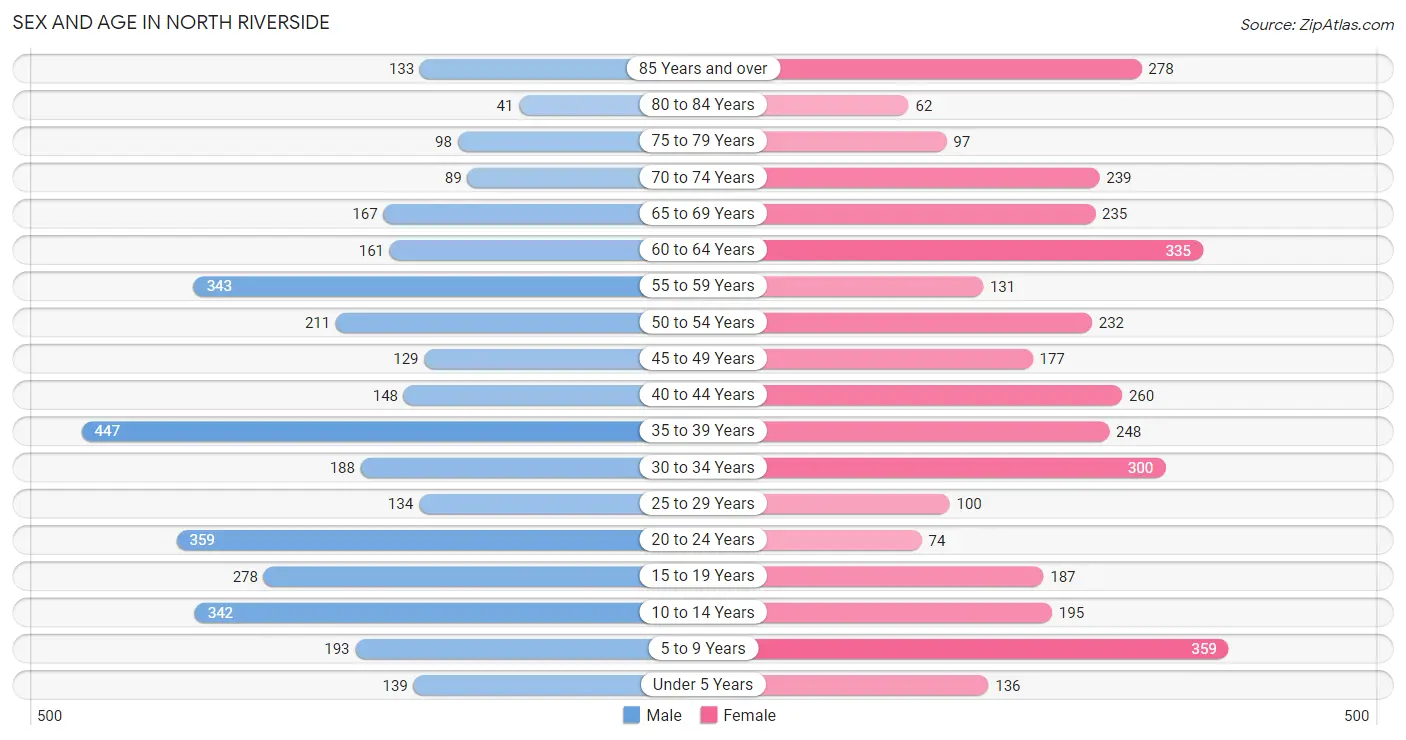
| Age Bracket | Male | Female |
| Under 5 Years | 139 (3.9%) | 136 (3.7%) |
| 5 to 9 Years | 193 (5.4%) | 359 (9.9%) |
| 10 to 14 Years | 342 (9.5%) | 195 (5.3%) |
| 15 to 19 Years | 278 (7.7%) | 187 (5.1%) |
| 20 to 24 Years | 359 (10.0%) | 74 (2.0%) |
| 25 to 29 Years | 134 (3.7%) | 100 (2.7%) |
| 30 to 34 Years | 188 (5.2%) | 300 (8.2%) |
| 35 to 39 Years | 447 (12.4%) | 248 (6.8%) |
| 40 to 44 Years | 148 (4.1%) | 260 (7.1%) |
| 45 to 49 Years | 129 (3.6%) | 177 (4.9%) |
| 50 to 54 Years | 211 (5.9%) | 232 (6.4%) |
| 55 to 59 Years | 343 (9.5%) | 131 (3.6%) |
| 60 to 64 Years | 161 (4.5%) | 335 (9.2%) |
| 65 to 69 Years | 167 (4.6%) | 235 (6.5%) |
| 70 to 74 Years | 89 (2.5%) | 239 (6.6%) |
| 75 to 79 Years | 98 (2.7%) | 97 (2.7%) |
| 80 to 84 Years | 41 (1.1%) | 62 (1.7%) |
| 85 Years and over | 133 (3.7%) | 278 (7.6%) |
| Total | 3,600 (100.0%) | 3,645 (100.0%) |
Families and Households in North Riverside
Median Family Size in North Riverside
The median family size in North Riverside is 3.10 persons per family, with single male/father families (200 | 10.4%) accounting for the largest median family size of 3.63 persons per family. On the other hand, single female/mother families (490 | 25.5%) represent the smallest median family size with 2.75 persons per family.
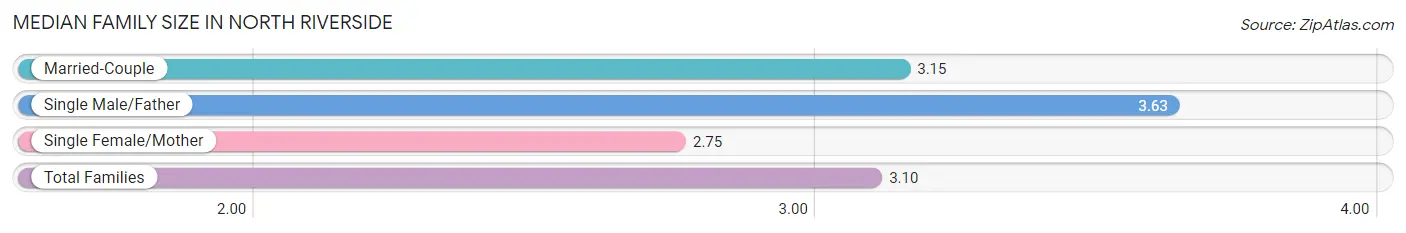
| Family Type | # Families | Family Size |
| Married-Couple | 1,230 (64.1%) | 3.15 |
| Single Male/Father | 200 (10.4%) | 3.63 |
| Single Female/Mother | 490 (25.5%) | 2.75 |
| Total Families | 1,920 (100.0%) | 3.10 |
Median Household Size in North Riverside
The median household size in North Riverside is 2.45 persons per household, with single male/father households (200 | 6.8%) accounting for the largest median household size of 3.71 persons per household. non-family households (1,018 | 34.6%) represent the smallest median household size with 1.10 persons per household.
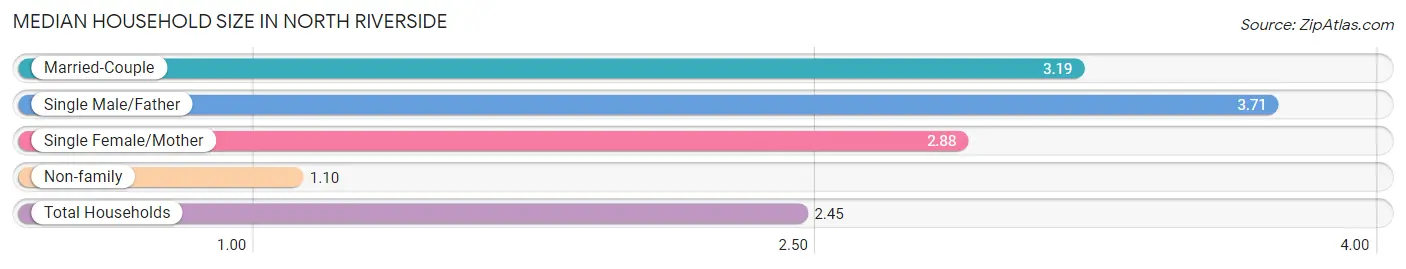
| Household Type | # Households | Household Size |
| Married-Couple | 1,230 (41.9%) | 3.19 |
| Single Male/Father | 200 (6.8%) | 3.71 |
| Single Female/Mother | 490 (16.7%) | 2.88 |
| Non-family | 1,018 (34.6%) | 1.10 |
| Total Households | 2,938 (100.0%) | 2.45 |
Household Size by Marriage Status in North Riverside
Out of a total of 2,938 households in North Riverside, 1,920 (65.3%) are family households, while 1,018 (34.6%) are nonfamily households. The most numerous type of family households are 2-person households, comprising 872, and the most common type of nonfamily households are 1-person households, comprising 928.
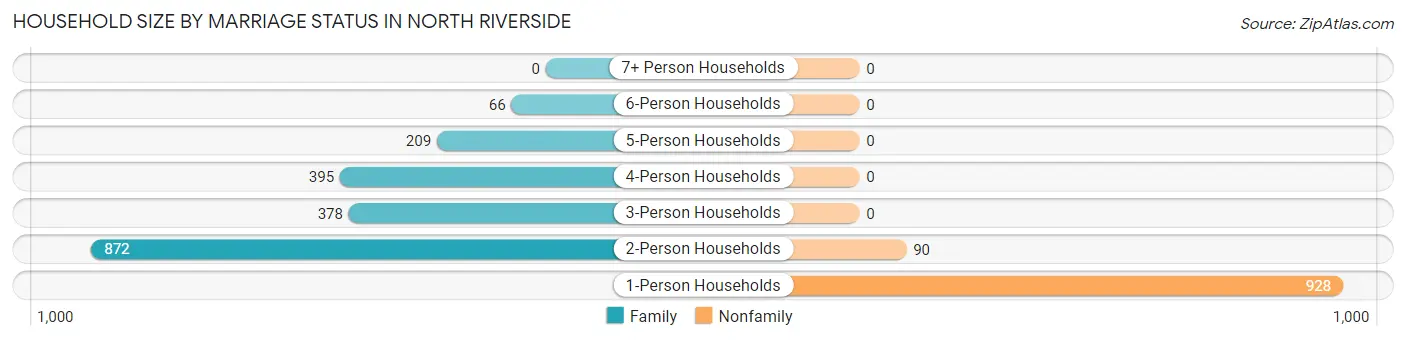
| Household Size | Family Households | Nonfamily Households |
| 1-Person Households | - | 928 (31.6%) |
| 2-Person Households | 872 (29.7%) | 90 (3.1%) |
| 3-Person Households | 378 (12.9%) | 0 (0.0%) |
| 4-Person Households | 395 (13.4%) | 0 (0.0%) |
| 5-Person Households | 209 (7.1%) | 0 (0.0%) |
| 6-Person Households | 66 (2.2%) | 0 (0.0%) |
| 7+ Person Households | 0 (0.0%) | 0 (0.0%) |
| Total | 1,920 (65.3%) | 1,018 (34.6%) |
Female Fertility in North Riverside
Fertility by Age in North Riverside
Average fertility rate in North Riverside is 68.0 births per 1,000 women. Women in the age bracket of 20 to 34 years have the highest fertility rate with 120.0 births per 1,000 women. Women in the age bracket of 20 to 34 years acount for 60.0% of all women with births.
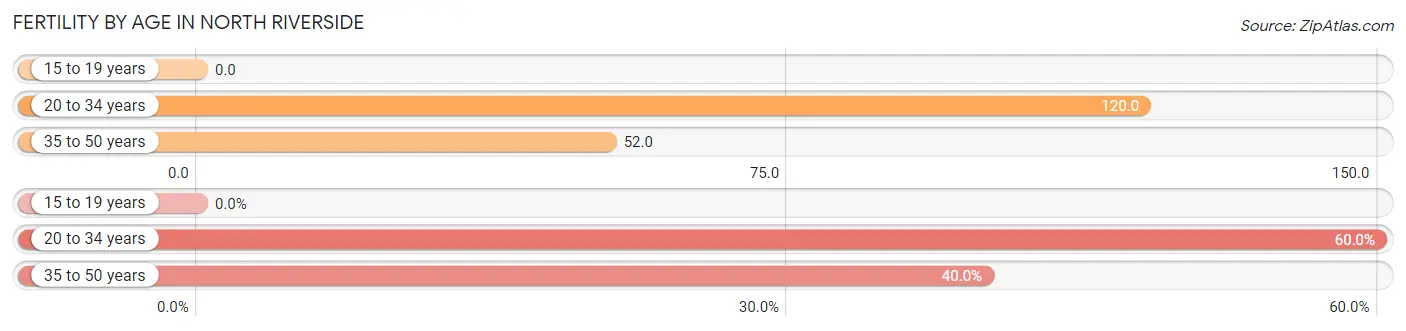
| Age Bracket | Women with Births | Births / 1,000 Women |
| 15 to 19 years | 0 (0.0%) | 0.0 |
| 20 to 34 years | 57 (60.0%) | 120.0 |
| 35 to 50 years | 38 (40.0%) | 52.0 |
| Total | 95 (100.0%) | 68.0 |
Fertility by Age by Marriage Status in North Riverside
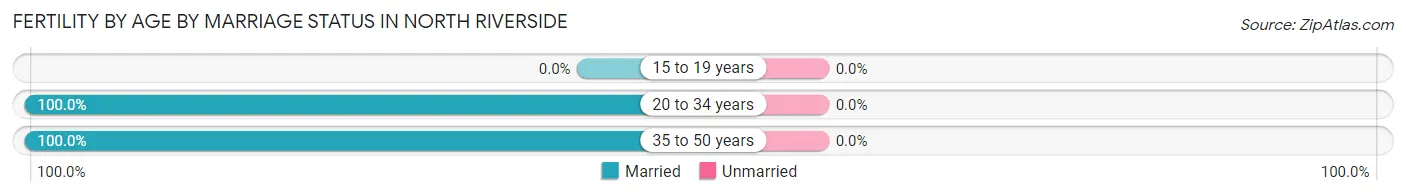
| Age Bracket | Married | Unmarried |
| 15 to 19 years | 0 (0.0%) | 0 (0.0%) |
| 20 to 34 years | 57 (100.0%) | 0 (0.0%) |
| 35 to 50 years | 38 (100.0%) | 0 (0.0%) |
| Total | 95 (100.0%) | 0 (0.0%) |
Fertility by Education in North Riverside
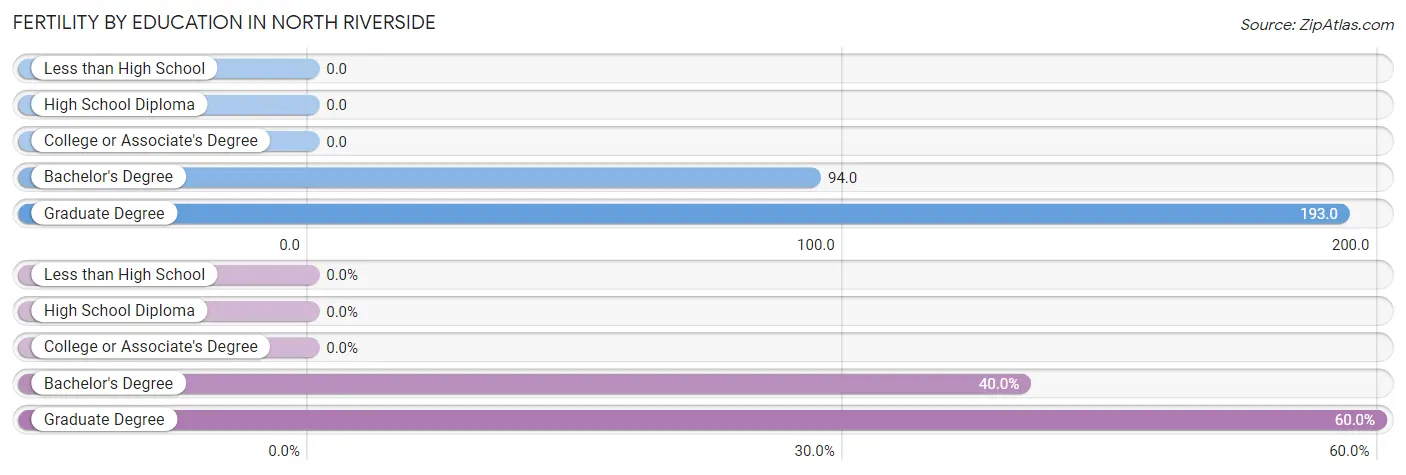
| Educational Attainment | Women with Births | Births / 1,000 Women |
| Less than High School | 0 (0.0%) | 0.0 |
| High School Diploma | 0 (0.0%) | 0.0 |
| College or Associate's Degree | 0 (0.0%) | 0.0 |
| Bachelor's Degree | 38 (40.0%) | 94.0 |
| Graduate Degree | 57 (60.0%) | 193.0 |
| Total | 95 (100.0%) | 68.0 |
Fertility by Education by Marriage Status in North Riverside
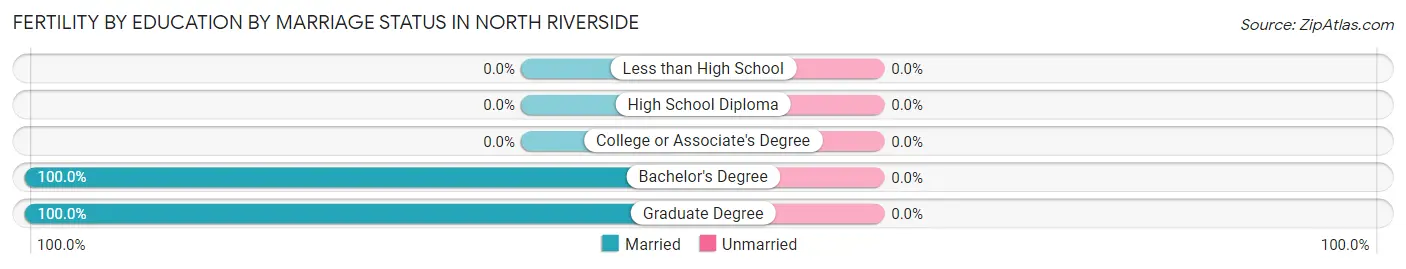
| Educational Attainment | Married | Unmarried |
| Less than High School | 0 (0.0%) | 0 (0.0%) |
| High School Diploma | 0 (0.0%) | 0 (0.0%) |
| College or Associate's Degree | 0 (0.0%) | 0 (0.0%) |
| Bachelor's Degree | 38 (100.0%) | 0 (0.0%) |
| Graduate Degree | 57 (100.0%) | 0 (0.0%) |
| Total | 95 (100.0%) | 0 (0.0%) |
Employment Characteristics in North Riverside
Employment by Class of Employer in North Riverside
Among the 3,042 employed individuals in North Riverside, private company employees (2,174 | 71.5%), not-for-profit organizations (269 | 8.8%), and local government employees (243 | 8.0%) make up the most common classes of employment.
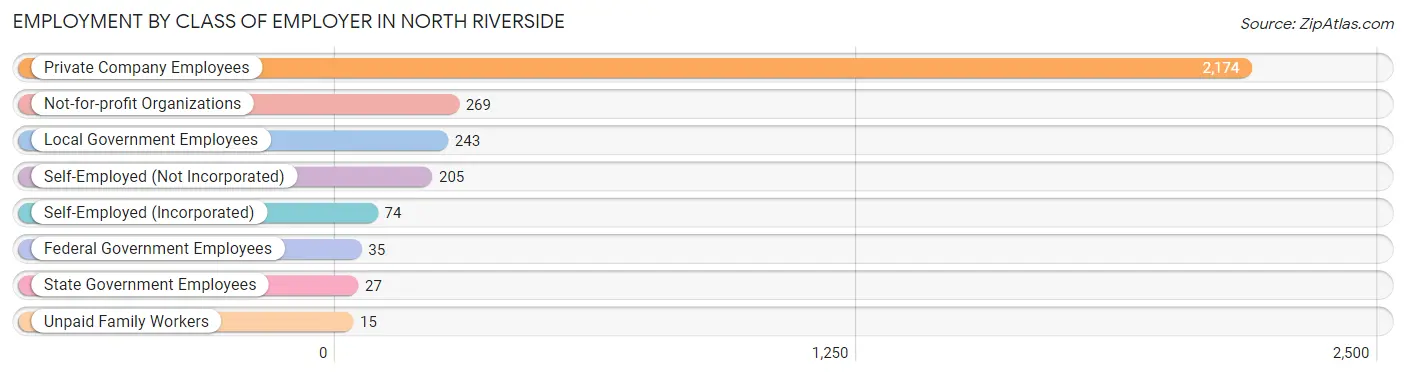
| Employer Class | # Employees | % Employees |
| Private Company Employees | 2,174 | 71.5% |
| Self-Employed (Incorporated) | 74 | 2.4% |
| Self-Employed (Not Incorporated) | 205 | 6.7% |
| Not-for-profit Organizations | 269 | 8.8% |
| Local Government Employees | 243 | 8.0% |
| State Government Employees | 27 | 0.9% |
| Federal Government Employees | 35 | 1.1% |
| Unpaid Family Workers | 15 | 0.5% |
| Total | 3,042 | 100.0% |
Employment Status by Age in North Riverside
According to the labor force statistics for North Riverside, out of the total population over 16 years of age (5,829), 56.6% or 3,299 individuals are in the labor force, with 5.6% or 185 of them unemployed. The age group with the highest labor force participation rate is 45 to 54 years, with 93.6% or 701 individuals in the labor force. Within the labor force, the 16 to 19 years age range has the highest percentage of unemployed individuals, with 28.9% or 26 of them being unemployed.
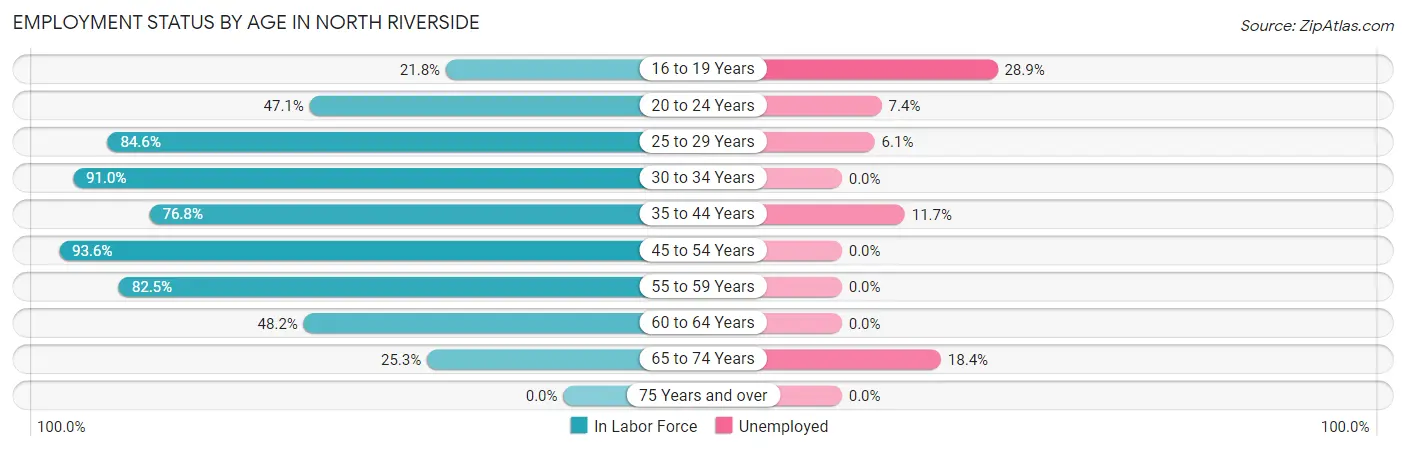
| Age Bracket | In Labor Force | Unemployed |
| 16 to 19 Years | 90 (21.8%) | 26 (28.9%) |
| 20 to 24 Years | 204 (47.1%) | 15 (7.4%) |
| 25 to 29 Years | 198 (84.6%) | 12 (6.1%) |
| 30 to 34 Years | 444 (91.0%) | 0 (0.0%) |
| 35 to 44 Years | 847 (76.8%) | 99 (11.7%) |
| 45 to 54 Years | 701 (93.6%) | 0 (0.0%) |
| 55 to 59 Years | 391 (82.5%) | 0 (0.0%) |
| 60 to 64 Years | 239 (48.2%) | 0 (0.0%) |
| 65 to 74 Years | 185 (25.3%) | 34 (18.4%) |
| 75 Years and over | 0 (0.0%) | 0 (0.0%) |
| Total | 3,299 (56.6%) | 185 (5.6%) |
Employment Status by Educational Attainment in North Riverside
According to labor force statistics for North Riverside, 79.6% of individuals (2,821) out of the total population between 25 and 64 years of age (3,544) are in the labor force, with 3.9% or 110 of them being unemployed. The group with the highest labor force participation rate are those with the educational attainment of high school diploma, with 88.4% or 653 individuals in the labor force. Within the labor force, individuals with bachelor's degree or higher education have the highest percentage of unemployment, with 7.2% or 95 of them being unemployed.
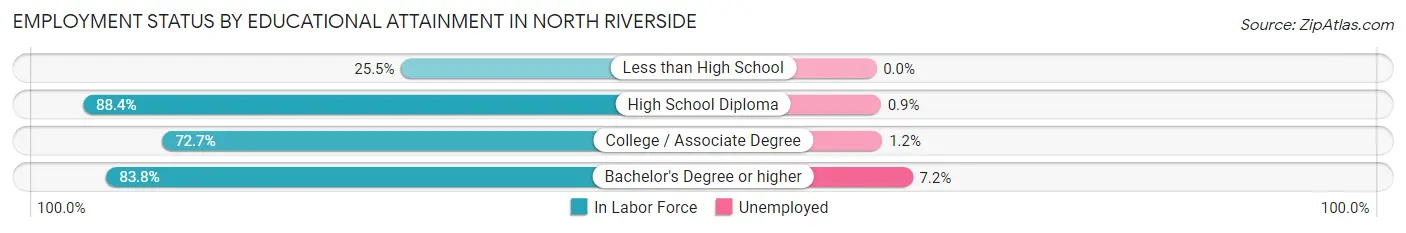
| Educational Attainment | In Labor Force | Unemployed |
| Less than High School | 26 (25.5%) | 0 (0.0%) |
| High School Diploma | 653 (88.4%) | 7 (0.9%) |
| College / Associate Degree | 819 (72.7%) | 14 (1.2%) |
| Bachelor's Degree or higher | 1,322 (83.8%) | 114 (7.2%) |
| Total | 2,821 (79.6%) | 138 (3.9%) |
Employment Occupations by Sex in North Riverside
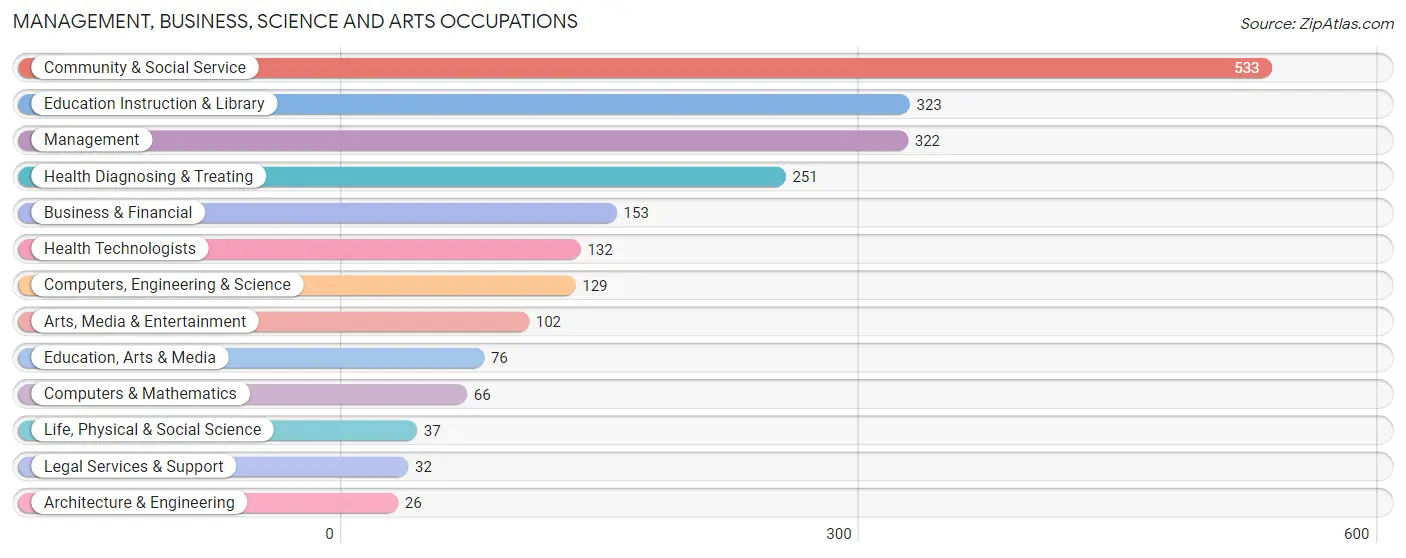
Management, Business, Science and Arts Occupations
The most common Management, Business, Science and Arts occupations in North Riverside are Community & Social Service (533 | 17.1%), Education Instruction & Library (323 | 10.4%), Management (322 | 10.3%), Health Diagnosing & Treating (251 | 8.1%), and Business & Financial (153 | 4.9%).
Management, Business, Science and Arts Occupations by Sex
Within the Management, Business, Science and Arts occupations in North Riverside, the most male-oriented occupations are Computers, Engineering & Science (100.0%), Computers & Mathematics (100.0%), and Architecture & Engineering (100.0%), while the most female-oriented occupations are Education, Arts & Media (100.0%), Business & Financial (84.3%), and Health Diagnosing & Treating (80.1%).
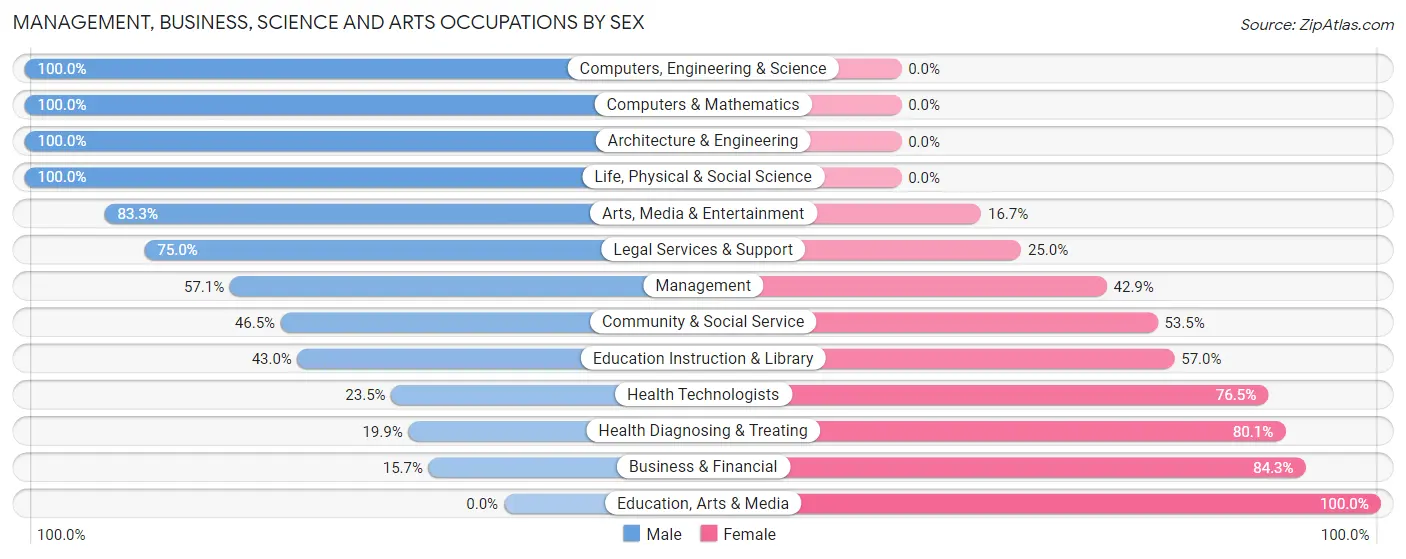
| Occupation | Male | Female |
| Management | 184 (57.1%) | 138 (42.9%) |
| Business & Financial | 24 (15.7%) | 129 (84.3%) |
| Computers, Engineering & Science | 129 (100.0%) | 0 (0.0%) |
| Computers & Mathematics | 66 (100.0%) | 0 (0.0%) |
| Architecture & Engineering | 26 (100.0%) | 0 (0.0%) |
| Life, Physical & Social Science | 37 (100.0%) | 0 (0.0%) |
| Community & Social Service | 248 (46.5%) | 285 (53.5%) |
| Education, Arts & Media | 0 (0.0%) | 76 (100.0%) |
| Legal Services & Support | 24 (75.0%) | 8 (25.0%) |
| Education Instruction & Library | 139 (43.0%) | 184 (57.0%) |
| Arts, Media & Entertainment | 85 (83.3%) | 17 (16.7%) |
| Health Diagnosing & Treating | 50 (19.9%) | 201 (80.1%) |
| Health Technologists | 31 (23.5%) | 101 (76.5%) |
| Total (Category) | 635 (45.8%) | 753 (54.2%) |
| Total (Overall) | 1,744 (56.0%) | 1,369 (44.0%) |
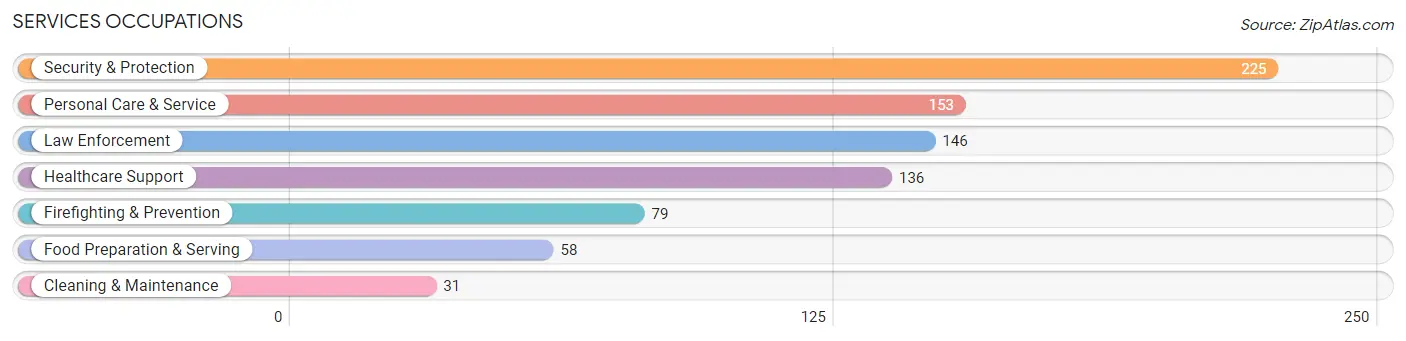
Services Occupations
The most common Services occupations in North Riverside are Security & Protection (225 | 7.2%), Personal Care & Service (153 | 4.9%), Law Enforcement (146 | 4.7%), Healthcare Support (136 | 4.4%), and Firefighting & Prevention (79 | 2.5%).
Services Occupations by Sex
Within the Services occupations in North Riverside, the most male-oriented occupations are Security & Protection (100.0%), Firefighting & Prevention (100.0%), and Law Enforcement (100.0%), while the most female-oriented occupations are Personal Care & Service (75.8%), and Healthcare Support (35.3%).
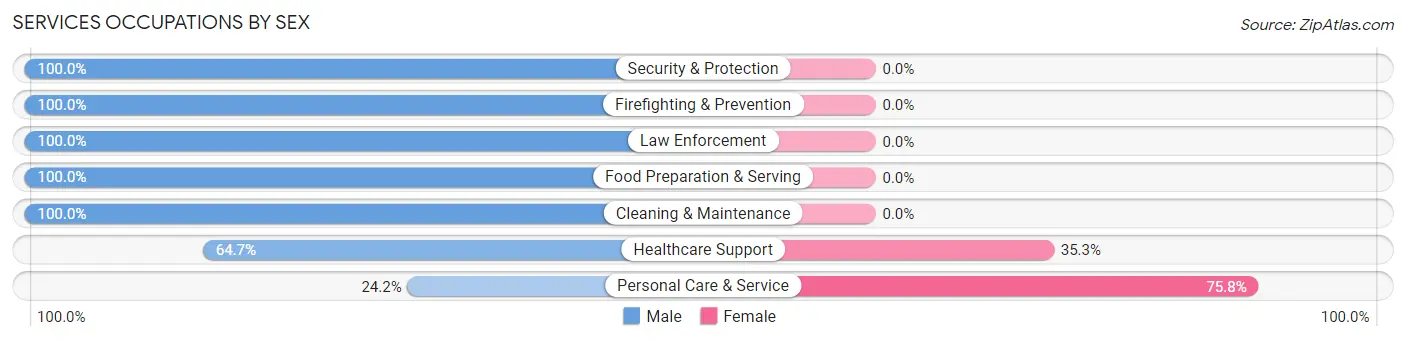
| Occupation | Male | Female |
| Healthcare Support | 88 (64.7%) | 48 (35.3%) |
| Security & Protection | 225 (100.0%) | 0 (0.0%) |
| Firefighting & Prevention | 79 (100.0%) | 0 (0.0%) |
| Law Enforcement | 146 (100.0%) | 0 (0.0%) |
| Food Preparation & Serving | 58 (100.0%) | 0 (0.0%) |
| Cleaning & Maintenance | 31 (100.0%) | 0 (0.0%) |
| Personal Care & Service | 37 (24.2%) | 116 (75.8%) |
| Total (Category) | 439 (72.8%) | 164 (27.2%) |
| Total (Overall) | 1,744 (56.0%) | 1,369 (44.0%) |
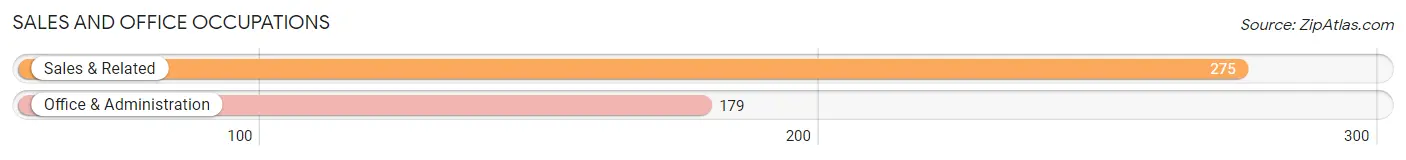
Sales and Office Occupations
The most common Sales and Office occupations in North Riverside are Sales & Related (275 | 8.8%), and Office & Administration (179 | 5.8%).
Sales and Office Occupations by Sex
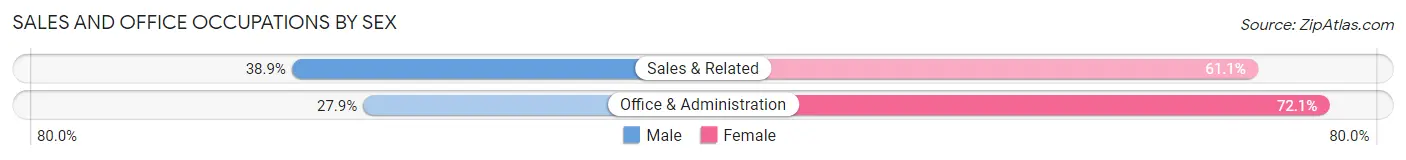
| Occupation | Male | Female |
| Sales & Related | 107 (38.9%) | 168 (61.1%) |
| Office & Administration | 50 (27.9%) | 129 (72.1%) |
| Total (Category) | 157 (34.6%) | 297 (65.4%) |
| Total (Overall) | 1,744 (56.0%) | 1,369 (44.0%) |
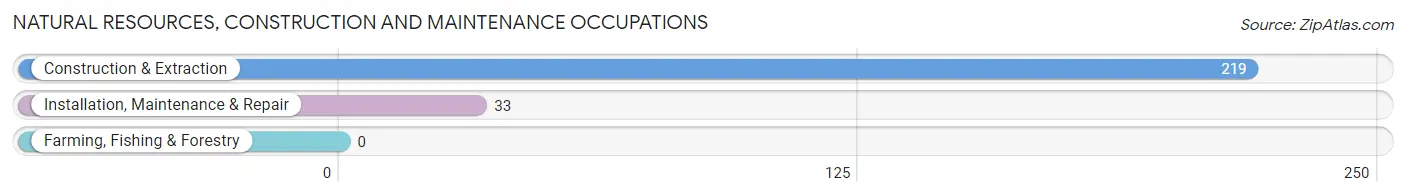
Natural Resources, Construction and Maintenance Occupations
The most common Natural Resources, Construction and Maintenance occupations in North Riverside are Construction & Extraction (219 | 7.0%), and Installation, Maintenance & Repair (33 | 1.1%).
Natural Resources, Construction and Maintenance Occupations by Sex
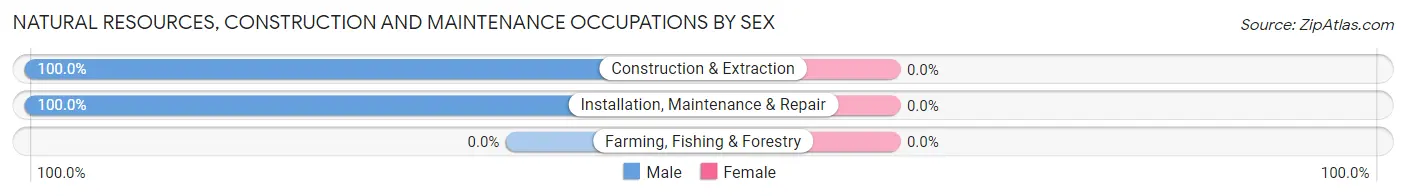
| Occupation | Male | Female |
| Farming, Fishing & Forestry | 0 (0.0%) | 0 (0.0%) |
| Construction & Extraction | 219 (100.0%) | 0 (0.0%) |
| Installation, Maintenance & Repair | 33 (100.0%) | 0 (0.0%) |
| Total (Category) | 252 (100.0%) | 0 (0.0%) |
| Total (Overall) | 1,744 (56.0%) | 1,369 (44.0%) |
Production, Transportation and Moving Occupations
The most common Production, Transportation and Moving occupations in North Riverside are Production (158 | 5.1%), Transportation (135 | 4.3%), and Material Moving (123 | 4.0%).
Production, Transportation and Moving Occupations by Sex
| Occupation | Male | Female |
| Production | 50 (31.7%) | 108 (68.3%) |
| Transportation | 116 (85.9%) | 19 (14.1%) |
| Material Moving | 95 (77.2%) | 28 (22.8%) |
| Total (Category) | 261 (62.7%) | 155 (37.3%) |
| Total (Overall) | 1,744 (56.0%) | 1,369 (44.0%) |
Employment Industries by Sex in North Riverside
Employment Industries in North Riverside
The major employment industries in North Riverside include Educational Services (440 | 14.1%), Health Care & Social Assistance (412 | 13.2%), Retail Trade (307 | 9.9%), Arts, Entertainment & Recreation (287 | 9.2%), and Finance & Insurance (247 | 7.9%).
Employment Industries by Sex in North Riverside
The North Riverside industries that see more men than women are Construction (100.0%), Utilities (100.0%), and Information (100.0%), whereas the industries that tend to have a higher number of women are Health Care & Social Assistance (79.8%), Educational Services (74.3%), and Wholesale Trade (63.6%).
| Industry | Male | Female |
| Agriculture, Fishing & Hunting | 0 (0.0%) | 0 (0.0%) |
| Mining, Quarrying, & Extraction | 0 (0.0%) | 0 (0.0%) |
| Construction | 215 (100.0%) | 0 (0.0%) |
| Manufacturing | 53 (43.4%) | 69 (56.6%) |
| Wholesale Trade | 20 (36.4%) | 35 (63.6%) |
| Retail Trade | 146 (47.6%) | 161 (52.4%) |
| Transportation & Warehousing | 164 (89.6%) | 19 (10.4%) |
| Utilities | 35 (100.0%) | 0 (0.0%) |
| Information | 30 (100.0%) | 0 (0.0%) |
| Finance & Insurance | 104 (42.1%) | 143 (57.9%) |
| Real Estate, Rental & Leasing | 13 (100.0%) | 0 (0.0%) |
| Professional & Scientific | 73 (49.7%) | 74 (50.3%) |
| Enterprise Management | 0 (0.0%) | 0 (0.0%) |
| Administrative & Support | 133 (65.2%) | 71 (34.8%) |
| Educational Services | 113 (25.7%) | 327 (74.3%) |
| Health Care & Social Assistance | 83 (20.2%) | 329 (79.8%) |
| Arts, Entertainment & Recreation | 244 (85.0%) | 43 (15.0%) |
| Accommodation & Food Services | 156 (100.0%) | 0 (0.0%) |
| Public Administration | 30 (100.0%) | 0 (0.0%) |
| Total | 1,744 (56.0%) | 1,369 (44.0%) |
Education in North Riverside
School Enrollment in North Riverside
The most common levels of schooling among the 1,812 students in North Riverside are elementary school (453 | 25.0%), high school (393 | 21.7%), and middle school (342 | 18.9%).
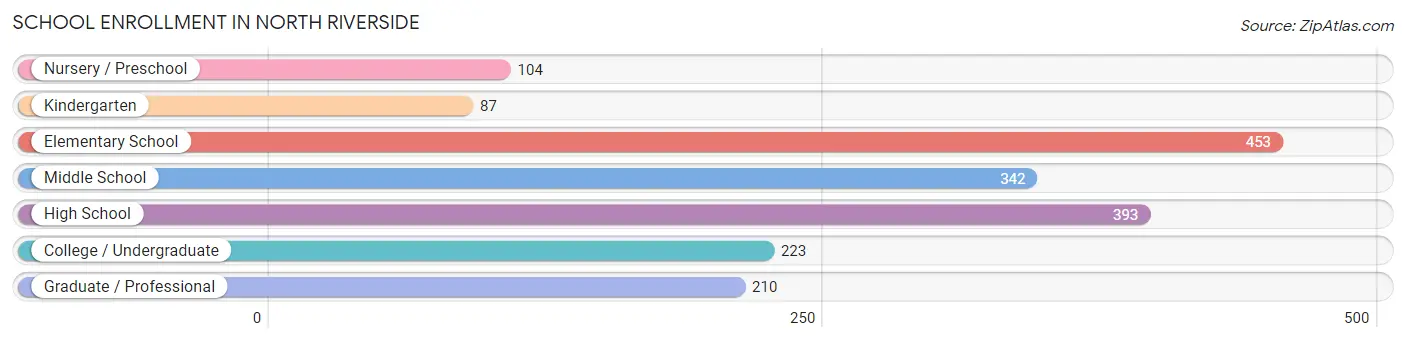
| School Level | # Students | % Students |
| Nursery / Preschool | 104 | 5.7% |
| Kindergarten | 87 | 4.8% |
| Elementary School | 453 | 25.0% |
| Middle School | 342 | 18.9% |
| High School | 393 | 21.7% |
| College / Undergraduate | 223 | 12.3% |
| Graduate / Professional | 210 | 11.6% |
| Total | 1,812 | 100.0% |
School Enrollment by Age by Funding Source in North Riverside
Out of a total of 1,812 students who are enrolled in schools in North Riverside, 127 (7.0%) attend a private institution, while the remaining 1,685 (93.0%) are enrolled in public schools. The age group of 25 to 34 year olds has the highest likelihood of being enrolled in private schools, with 42 (79.2% in the age bracket) enrolled. Conversely, the age group of 3 to 4 year olds has the lowest likelihood of being enrolled in a private school, with 98 (100.0% in the age bracket) attending a public institution.
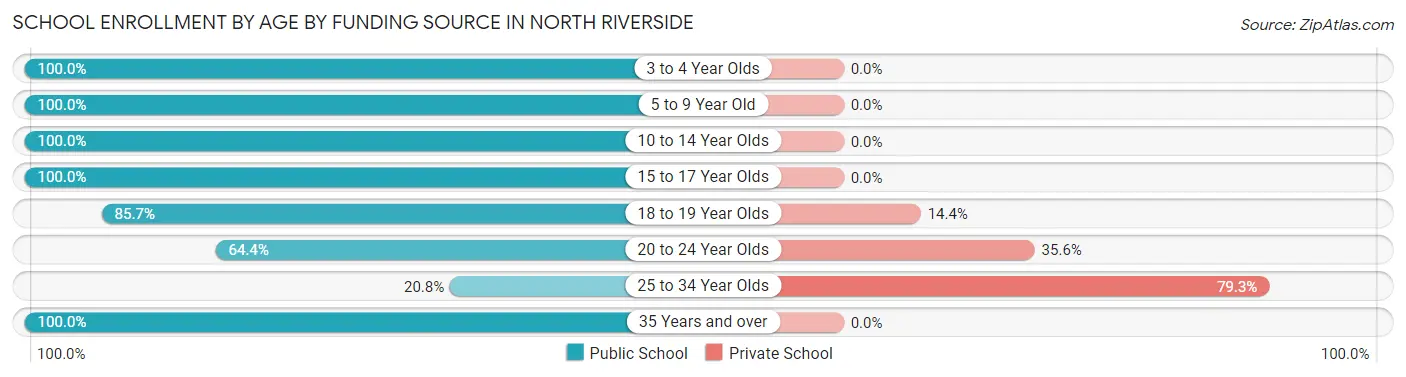
| Age Bracket | Public School | Private School |
| 3 to 4 Year Olds | 98 (100.0%) | 0 (0.0%) |
| 5 to 9 Year Old | 477 (100.0%) | 0 (0.0%) |
| 10 to 14 Year Olds | 473 (100.0%) | 0 (0.0%) |
| 15 to 17 Year Olds | 169 (100.0%) | 0 (0.0%) |
| 18 to 19 Year Olds | 185 (85.7%) | 31 (14.3%) |
| 20 to 24 Year Olds | 96 (64.4%) | 53 (35.6%) |
| 25 to 34 Year Olds | 11 (20.7%) | 42 (79.2%) |
| 35 Years and over | 177 (100.0%) | 0 (0.0%) |
| Total | 1,685 (93.0%) | 127 (7.0%) |
Educational Attainment by Field of Study in North Riverside
Education (267 | 13.6%), science & technology (221 | 11.2%), social sciences (179 | 9.1%), bio, nature & agricultural (165 | 8.4%), and engineering (160 | 8.1%) are the most common fields of study among 1,968 individuals in North Riverside who have obtained a bachelor's degree or higher.
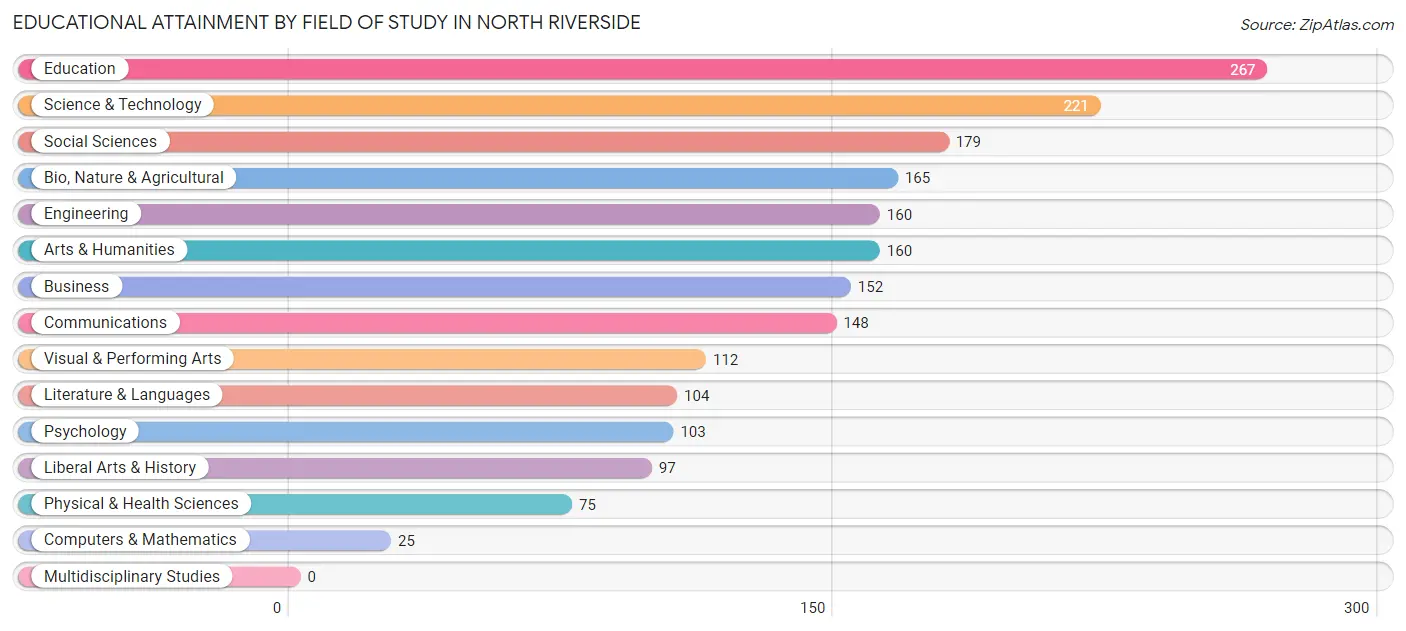
| Field of Study | # Graduates | % Graduates |
| Computers & Mathematics | 25 | 1.3% |
| Bio, Nature & Agricultural | 165 | 8.4% |
| Physical & Health Sciences | 75 | 3.8% |
| Psychology | 103 | 5.2% |
| Social Sciences | 179 | 9.1% |
| Engineering | 160 | 8.1% |
| Multidisciplinary Studies | 0 | 0.0% |
| Science & Technology | 221 | 11.2% |
| Business | 152 | 7.7% |
| Education | 267 | 13.6% |
| Literature & Languages | 104 | 5.3% |
| Liberal Arts & History | 97 | 4.9% |
| Visual & Performing Arts | 112 | 5.7% |
| Communications | 148 | 7.5% |
| Arts & Humanities | 160 | 8.1% |
| Total | 1,968 | 100.0% |
Transportation & Commute in North Riverside
Vehicle Availability by Sex in North Riverside
The most prevalent vehicle ownership categories in North Riverside are males with 1 vehicle (600, accounting for 34.4%) and females with 1 vehicle (470, making up 46.2%).
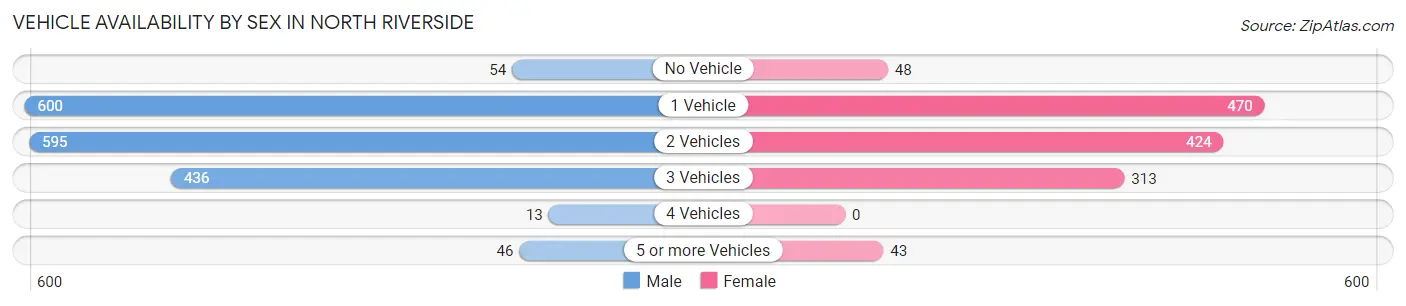
| Vehicles Available | Male | Female |
| No Vehicle | 54 (3.1%) | 48 (3.7%) |
| 1 Vehicle | 600 (34.4%) | 470 (36.2%) |
| 2 Vehicles | 595 (34.1%) | 424 (32.7%) |
| 3 Vehicles | 436 (25.0%) | 313 (24.1%) |
| 4 Vehicles | 13 (0.7%) | 0 (0.0%) |
| 5 or more Vehicles | 46 (2.6%) | 43 (3.3%) |
| Total | 1,744 (100.0%) | 1,298 (100.0%) |
Commute Time in North Riverside
The most frequently occuring commute durations in North Riverside are 10 to 14 minutes (470 commuters, 17.6%), 45 to 59 minutes (337 commuters, 12.6%), and 15 to 19 minutes (334 commuters, 12.5%).
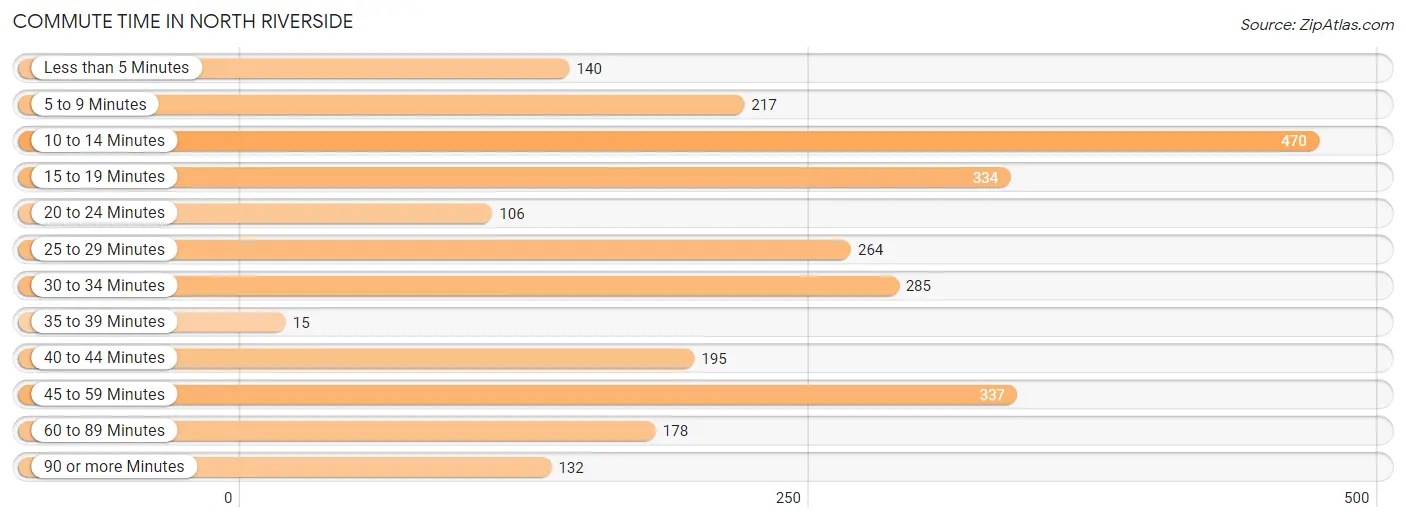
| Commute Time | # Commuters | % Commuters |
| Less than 5 Minutes | 140 | 5.2% |
| 5 to 9 Minutes | 217 | 8.1% |
| 10 to 14 Minutes | 470 | 17.6% |
| 15 to 19 Minutes | 334 | 12.5% |
| 20 to 24 Minutes | 106 | 4.0% |
| 25 to 29 Minutes | 264 | 9.9% |
| 30 to 34 Minutes | 285 | 10.7% |
| 35 to 39 Minutes | 15 | 0.6% |
| 40 to 44 Minutes | 195 | 7.3% |
| 45 to 59 Minutes | 337 | 12.6% |
| 60 to 89 Minutes | 178 | 6.7% |
| 90 or more Minutes | 132 | 4.9% |
Commute Time by Sex in North Riverside
The most common commute times in North Riverside are 45 to 59 minutes (231 commuters, 15.2%) for males and 10 to 14 minutes (257 commuters, 22.3%) for females.
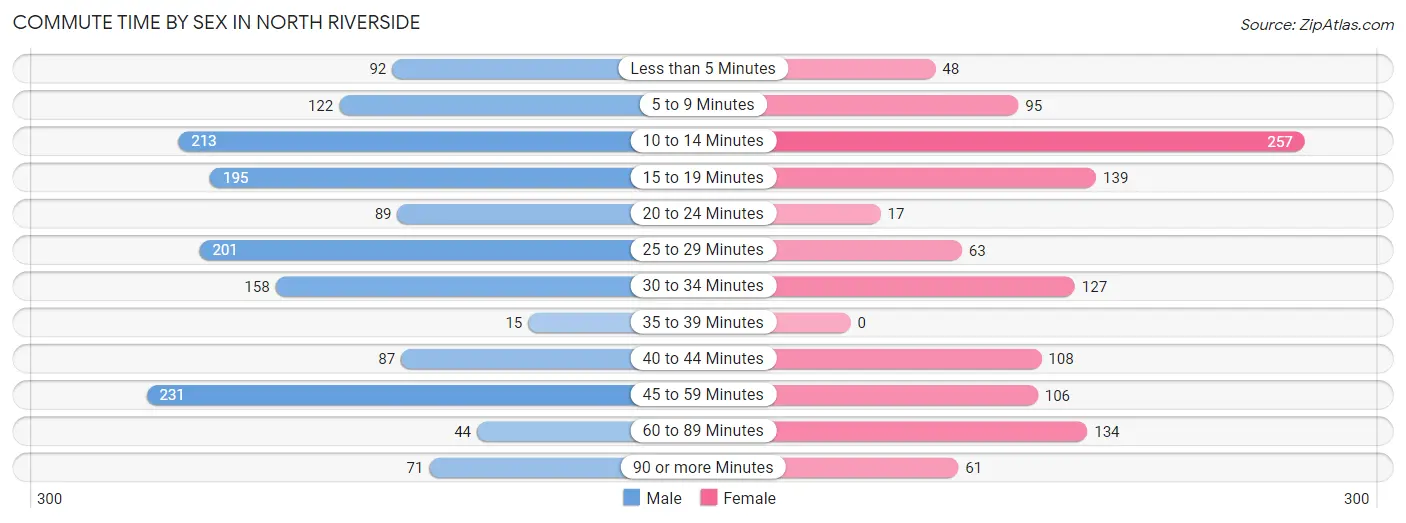
| Commute Time | Male | Female |
| Less than 5 Minutes | 92 (6.1%) | 48 (4.2%) |
| 5 to 9 Minutes | 122 (8.0%) | 95 (8.2%) |
| 10 to 14 Minutes | 213 (14.0%) | 257 (22.3%) |
| 15 to 19 Minutes | 195 (12.9%) | 139 (12.0%) |
| 20 to 24 Minutes | 89 (5.9%) | 17 (1.5%) |
| 25 to 29 Minutes | 201 (13.2%) | 63 (5.4%) |
| 30 to 34 Minutes | 158 (10.4%) | 127 (11.0%) |
| 35 to 39 Minutes | 15 (1.0%) | 0 (0.0%) |
| 40 to 44 Minutes | 87 (5.7%) | 108 (9.3%) |
| 45 to 59 Minutes | 231 (15.2%) | 106 (9.2%) |
| 60 to 89 Minutes | 44 (2.9%) | 134 (11.6%) |
| 90 or more Minutes | 71 (4.7%) | 61 (5.3%) |
Time of Departure to Work by Sex in North Riverside
The most frequent times of departure to work in North Riverside are 6:00 AM to 6:29 AM (258, 17.0%) for males and 7:00 AM to 7:29 AM (220, 19.1%) for females.
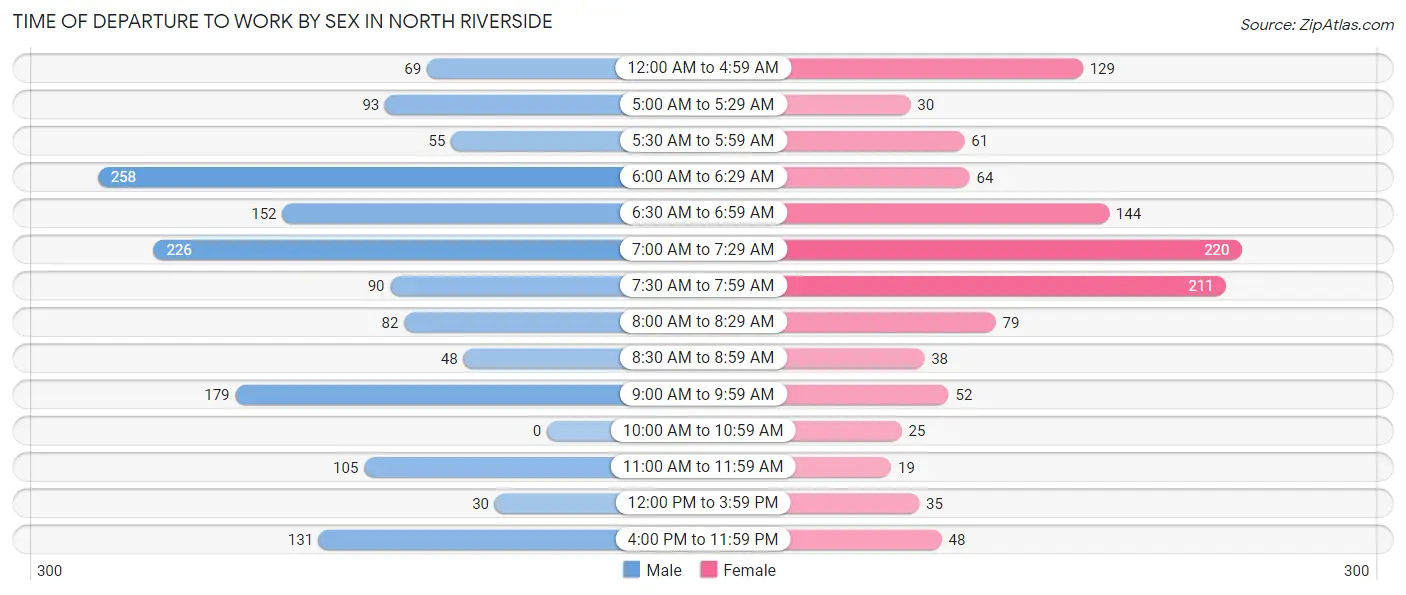
| Time of Departure | Male | Female |
| 12:00 AM to 4:59 AM | 69 (4.5%) | 129 (11.2%) |
| 5:00 AM to 5:29 AM | 93 (6.1%) | 30 (2.6%) |
| 5:30 AM to 5:59 AM | 55 (3.6%) | 61 (5.3%) |
| 6:00 AM to 6:29 AM | 258 (17.0%) | 64 (5.5%) |
| 6:30 AM to 6:59 AM | 152 (10.0%) | 144 (12.5%) |
| 7:00 AM to 7:29 AM | 226 (14.9%) | 220 (19.1%) |
| 7:30 AM to 7:59 AM | 90 (5.9%) | 211 (18.3%) |
| 8:00 AM to 8:29 AM | 82 (5.4%) | 79 (6.8%) |
| 8:30 AM to 8:59 AM | 48 (3.2%) | 38 (3.3%) |
| 9:00 AM to 9:59 AM | 179 (11.8%) | 52 (4.5%) |
| 10:00 AM to 10:59 AM | 0 (0.0%) | 25 (2.2%) |
| 11:00 AM to 11:59 AM | 105 (6.9%) | 19 (1.7%) |
| 12:00 PM to 3:59 PM | 30 (2.0%) | 35 (3.0%) |
| 4:00 PM to 11:59 PM | 131 (8.6%) | 48 (4.2%) |
| Total | 1,518 (100.0%) | 1,155 (100.0%) |
Housing Occupancy in North Riverside
Occupancy by Ownership in North Riverside
Of the total 2,938 dwellings in North Riverside, owner-occupied units account for 1,972 (67.1%), while renter-occupied units make up 966 (32.9%).
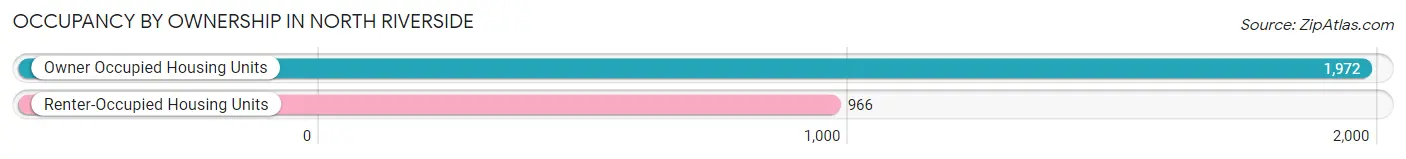
| Occupancy | # Housing Units | % Housing Units |
| Owner Occupied Housing Units | 1,972 | 67.1% |
| Renter-Occupied Housing Units | 966 | 32.9% |
| Total Occupied Housing Units | 2,938 | 100.0% |
Occupancy by Household Size in North Riverside
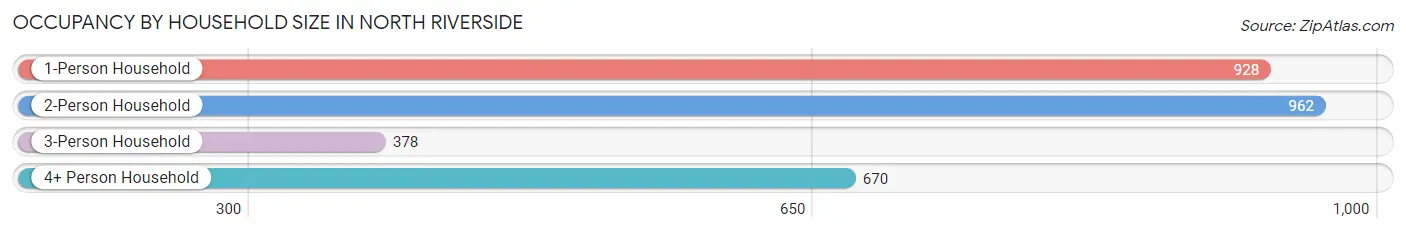
| Household Size | # Housing Units | % Housing Units |
| 1-Person Household | 928 | 31.6% |
| 2-Person Household | 962 | 32.7% |
| 3-Person Household | 378 | 12.9% |
| 4+ Person Household | 670 | 22.8% |
| Total Housing Units | 2,938 | 100.0% |
Occupancy by Ownership by Household Size in North Riverside
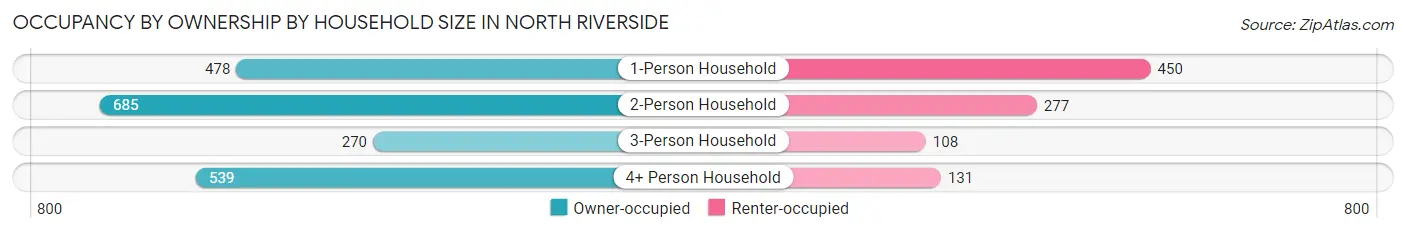
| Household Size | Owner-occupied | Renter-occupied |
| 1-Person Household | 478 (51.5%) | 450 (48.5%) |
| 2-Person Household | 685 (71.2%) | 277 (28.8%) |
| 3-Person Household | 270 (71.4%) | 108 (28.6%) |
| 4+ Person Household | 539 (80.4%) | 131 (19.6%) |
| Total Housing Units | 1,972 (67.1%) | 966 (32.9%) |
Occupancy by Educational Attainment in North Riverside
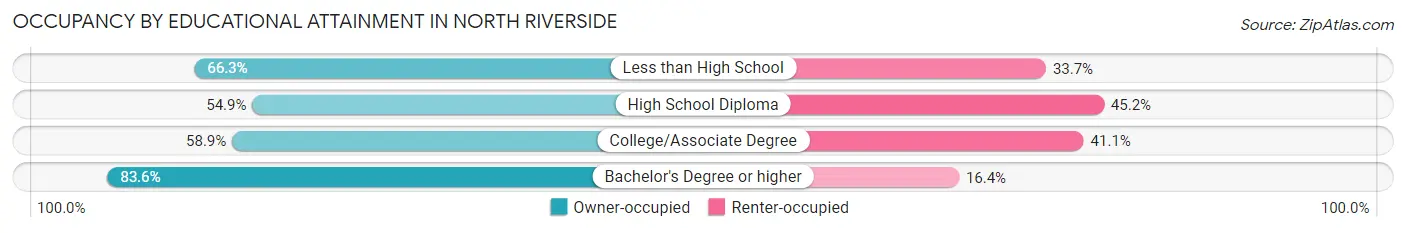
| Household Size | Owner-occupied | Renter-occupied |
| Less than High School | 67 (66.3%) | 34 (33.7%) |
| High School Diploma | 475 (54.8%) | 391 (45.2%) |
| College/Associate Degree | 518 (58.9%) | 362 (41.1%) |
| Bachelor's Degree or higher | 912 (83.6%) | 179 (16.4%) |
Occupancy by Age of Householder in North Riverside
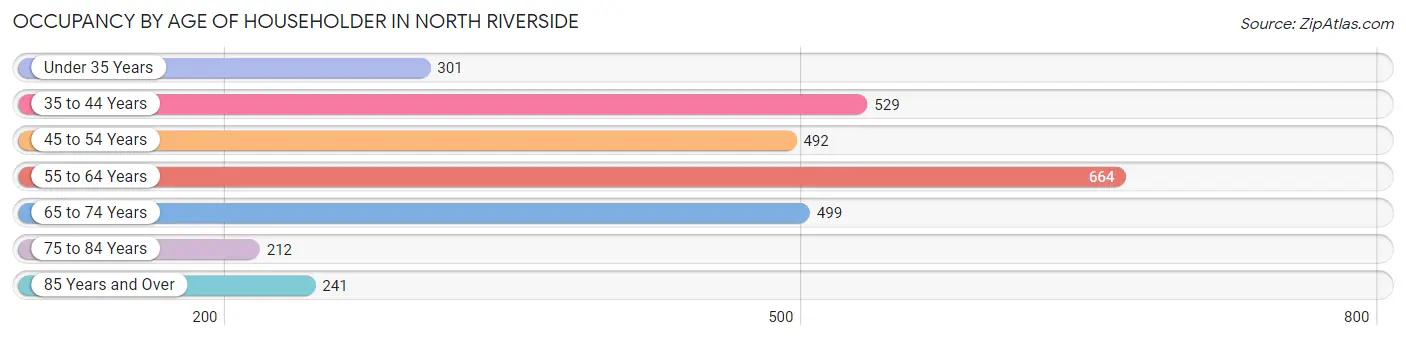
| Age Bracket | # Households | % Households |
| Under 35 Years | 301 | 10.2% |
| 35 to 44 Years | 529 | 18.0% |
| 45 to 54 Years | 492 | 16.8% |
| 55 to 64 Years | 664 | 22.6% |
| 65 to 74 Years | 499 | 17.0% |
| 75 to 84 Years | 212 | 7.2% |
| 85 Years and Over | 241 | 8.2% |
| Total | 2,938 | 100.0% |
Housing Finances in North Riverside
Median Income by Occupancy in North Riverside
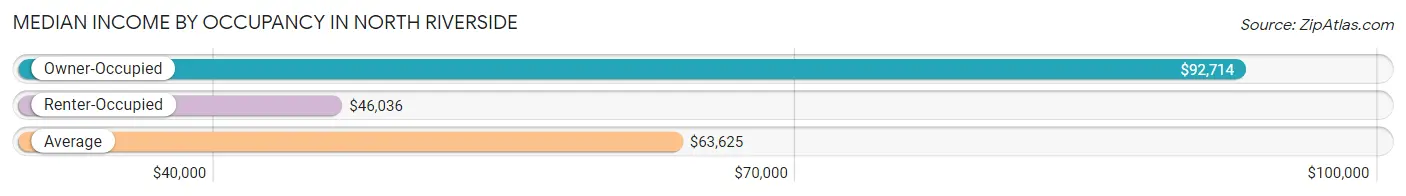
| Occupancy Type | # Households | Median Income |
| Owner-Occupied | 1,972 (67.1%) | $92,714 |
| Renter-Occupied | 966 (32.9%) | $46,036 |
| Average | 2,938 (100.0%) | $63,625 |
Occupancy by Householder Income Bracket in North Riverside
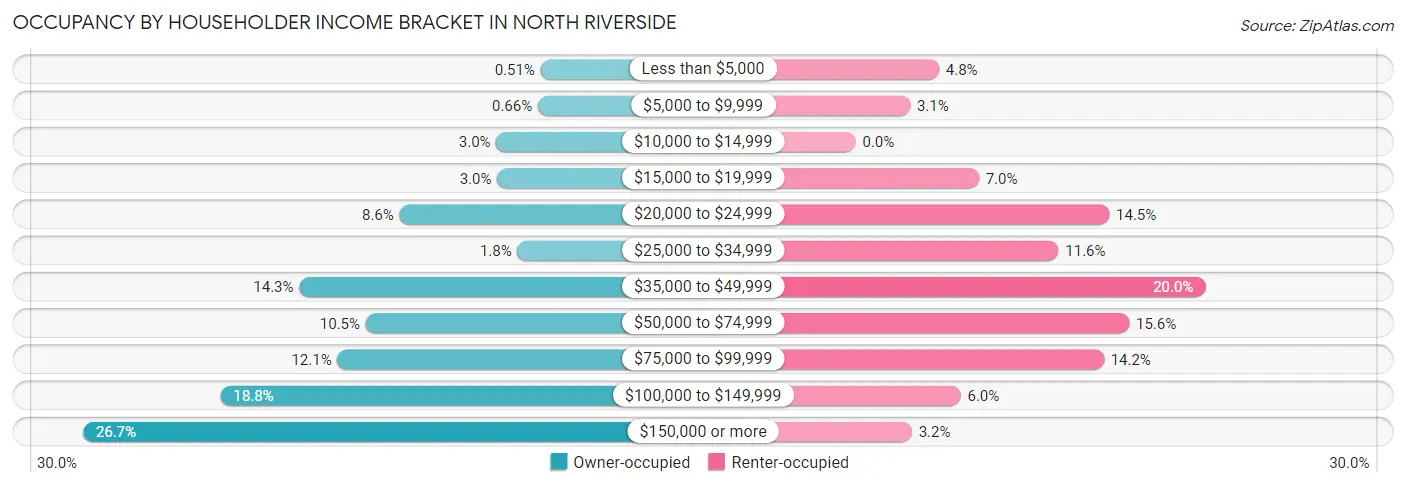
| Income Bracket | Owner-occupied | Renter-occupied |
| Less than $5,000 | 10 (0.5%) | 46 (4.8%) |
| $5,000 to $9,999 | 13 (0.7%) | 30 (3.1%) |
| $10,000 to $14,999 | 60 (3.0%) | 0 (0.0%) |
| $15,000 to $19,999 | 59 (3.0%) | 68 (7.0%) |
| $20,000 to $24,999 | 169 (8.6%) | 140 (14.5%) |
| $25,000 to $34,999 | 36 (1.8%) | 112 (11.6%) |
| $35,000 to $49,999 | 282 (14.3%) | 193 (20.0%) |
| $50,000 to $74,999 | 207 (10.5%) | 151 (15.6%) |
| $75,000 to $99,999 | 239 (12.1%) | 137 (14.2%) |
| $100,000 to $149,999 | 371 (18.8%) | 58 (6.0%) |
| $150,000 or more | 526 (26.7%) | 31 (3.2%) |
| Total | 1,972 (100.0%) | 966 (100.0%) |
Monthly Housing Cost Tiers in North Riverside
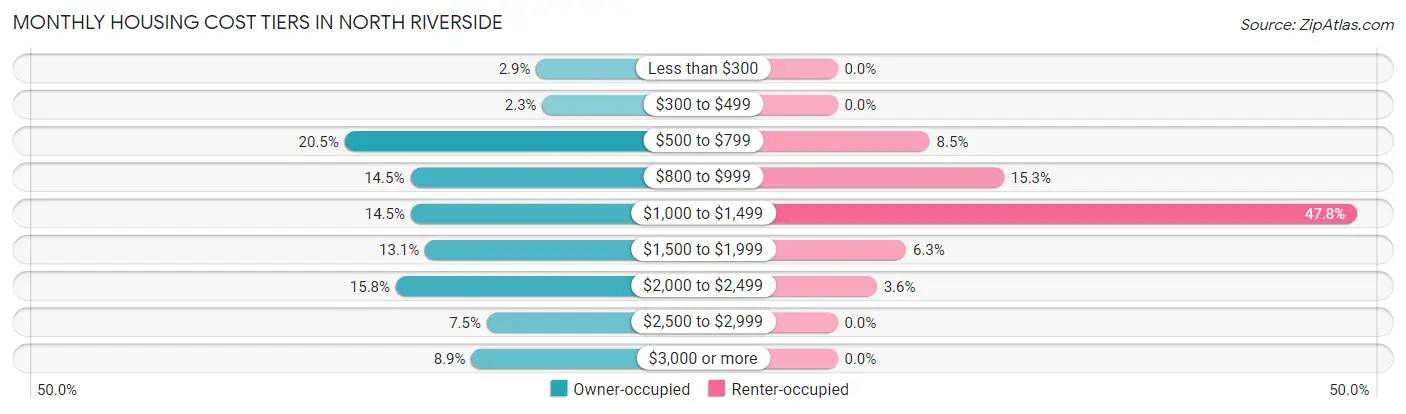
| Monthly Cost | Owner-occupied | Renter-occupied |
| Less than $300 | 57 (2.9%) | 0 (0.0%) |
| $300 to $499 | 46 (2.3%) | 0 (0.0%) |
| $500 to $799 | 405 (20.5%) | 82 (8.5%) |
| $800 to $999 | 286 (14.5%) | 148 (15.3%) |
| $1,000 to $1,499 | 285 (14.4%) | 462 (47.8%) |
| $1,500 to $1,999 | 259 (13.1%) | 61 (6.3%) |
| $2,000 to $2,499 | 312 (15.8%) | 35 (3.6%) |
| $2,500 to $2,999 | 147 (7.4%) | 0 (0.0%) |
| $3,000 or more | 175 (8.9%) | 0 (0.0%) |
| Total | 1,972 (100.0%) | 966 (100.0%) |
Physical Housing Characteristics in North Riverside
Housing Structures in North Riverside
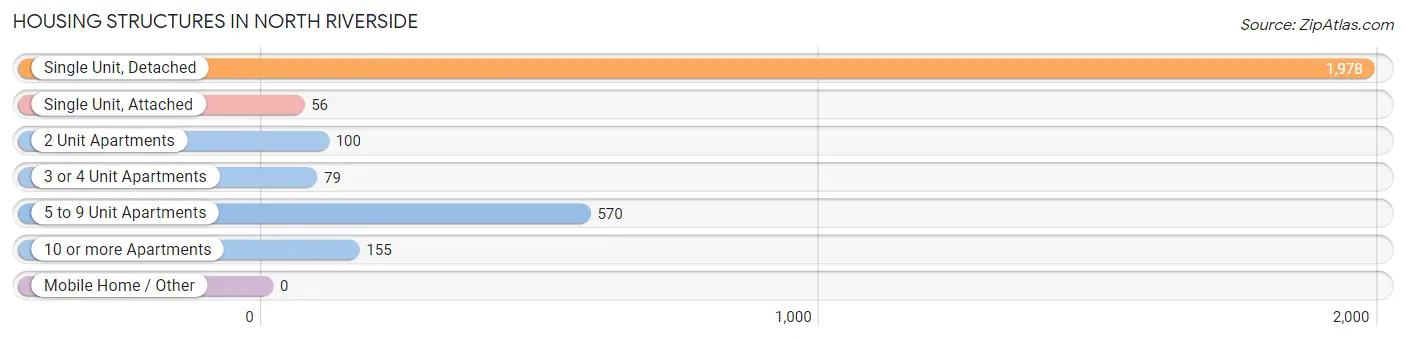
| Structure Type | # Housing Units | % Housing Units |
| Single Unit, Detached | 1,978 | 67.3% |
| Single Unit, Attached | 56 | 1.9% |
| 2 Unit Apartments | 100 | 3.4% |
| 3 or 4 Unit Apartments | 79 | 2.7% |
| 5 to 9 Unit Apartments | 570 | 19.4% |
| 10 or more Apartments | 155 | 5.3% |
| Mobile Home / Other | 0 | 0.0% |
| Total | 2,938 | 100.0% |
Housing Structures by Occupancy in North Riverside
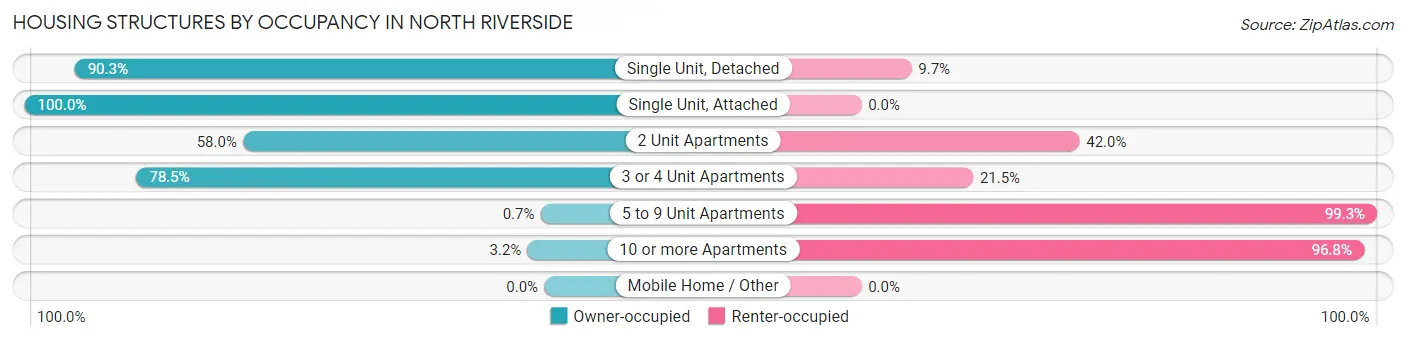
| Structure Type | Owner-occupied | Renter-occupied |
| Single Unit, Detached | 1,787 (90.3%) | 191 (9.7%) |
| Single Unit, Attached | 56 (100.0%) | 0 (0.0%) |
| 2 Unit Apartments | 58 (58.0%) | 42 (42.0%) |
| 3 or 4 Unit Apartments | 62 (78.5%) | 17 (21.5%) |
| 5 to 9 Unit Apartments | 4 (0.7%) | 566 (99.3%) |
| 10 or more Apartments | 5 (3.2%) | 150 (96.8%) |
| Mobile Home / Other | 0 (0.0%) | 0 (0.0%) |
| Total | 1,972 (67.1%) | 966 (32.9%) |
Housing Structures by Number of Rooms in North Riverside
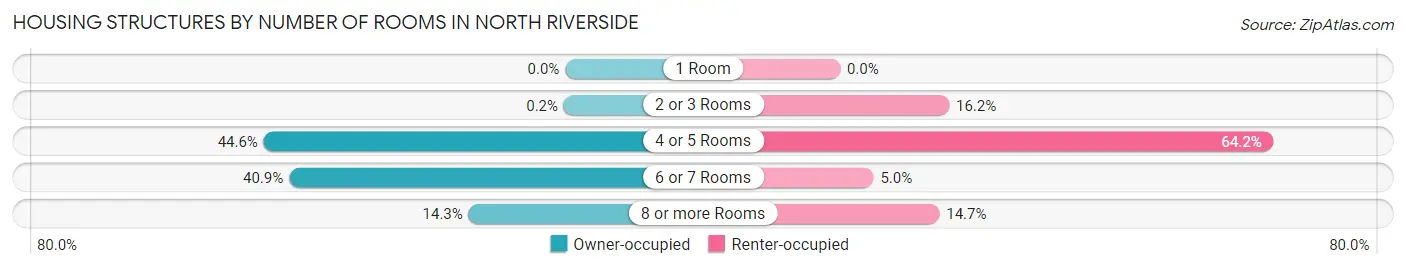
| Number of Rooms | Owner-occupied | Renter-occupied |
| 1 Room | 0 (0.0%) | 0 (0.0%) |
| 2 or 3 Rooms | 4 (0.2%) | 156 (16.2%) |
| 4 or 5 Rooms | 880 (44.6%) | 620 (64.2%) |
| 6 or 7 Rooms | 806 (40.9%) | 48 (5.0%) |
| 8 or more Rooms | 282 (14.3%) | 142 (14.7%) |
| Total | 1,972 (100.0%) | 966 (100.0%) |
Housing Structure by Heating Type in North Riverside
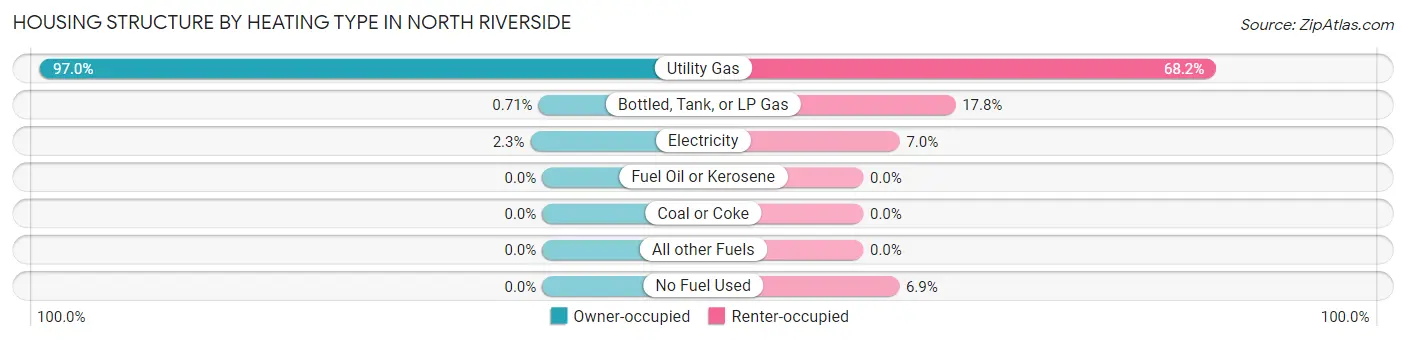
| Heating Type | Owner-occupied | Renter-occupied |
| Utility Gas | 1,913 (97.0%) | 659 (68.2%) |
| Bottled, Tank, or LP Gas | 14 (0.7%) | 172 (17.8%) |
| Electricity | 45 (2.3%) | 68 (7.0%) |
| Fuel Oil or Kerosene | 0 (0.0%) | 0 (0.0%) |
| Coal or Coke | 0 (0.0%) | 0 (0.0%) |
| All other Fuels | 0 (0.0%) | 0 (0.0%) |
| No Fuel Used | 0 (0.0%) | 67 (6.9%) |
| Total | 1,972 (100.0%) | 966 (100.0%) |
Household Vehicle Usage in North Riverside
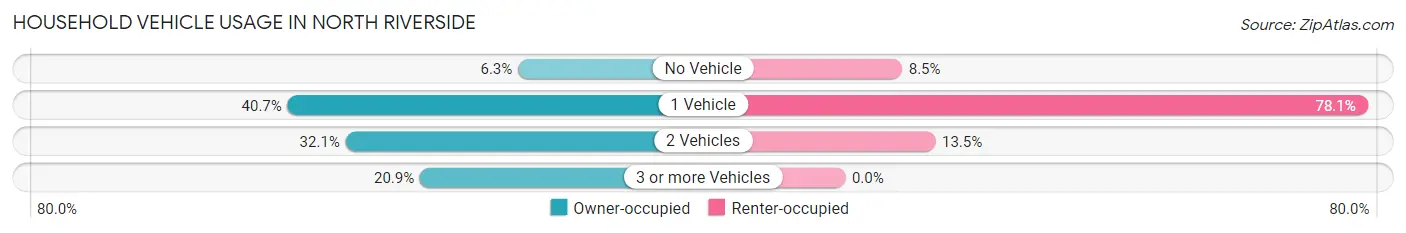
| Vehicles per Household | Owner-occupied | Renter-occupied |
| No Vehicle | 124 (6.3%) | 82 (8.5%) |
| 1 Vehicle | 803 (40.7%) | 754 (78.0%) |
| 2 Vehicles | 632 (32.1%) | 130 (13.5%) |
| 3 or more Vehicles | 413 (20.9%) | 0 (0.0%) |
| Total | 1,972 (100.0%) | 966 (100.0%) |
Real Estate & Mortgages in North Riverside
Real Estate and Mortgage Overview in North Riverside
| Characteristic | Without Mortgage | With Mortgage |
| Housing Units | 855 | 1,117 |
| Median Property Value | $275,700 | $311,200 |
| Median Household Income | $61,151 | $468 |
| Monthly Housing Costs | $765 | $175 |
| Real Estate Taxes | $5,540 | $7 |
Property Value by Mortgage Status in North Riverside
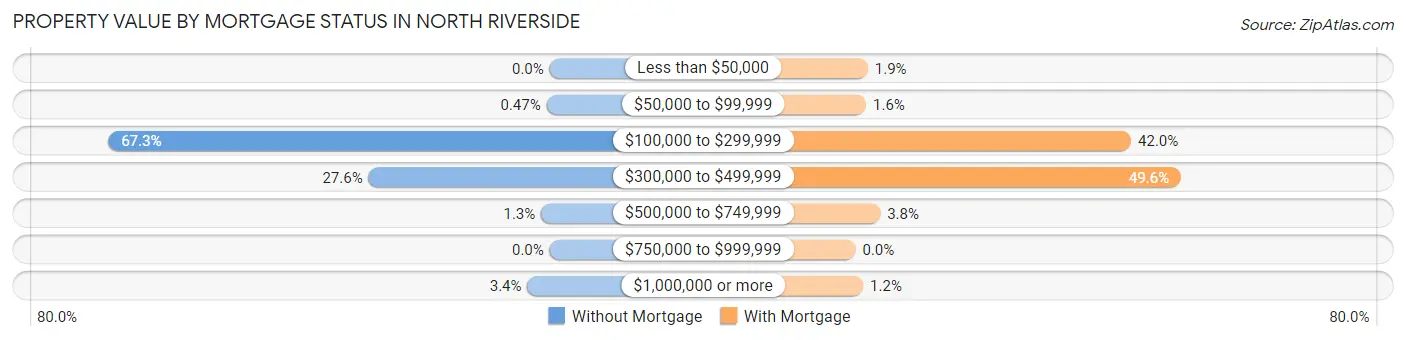
| Property Value | Without Mortgage | With Mortgage |
| Less than $50,000 | 0 (0.0%) | 21 (1.9%) |
| $50,000 to $99,999 | 4 (0.5%) | 18 (1.6%) |
| $100,000 to $299,999 | 575 (67.2%) | 469 (42.0%) |
| $300,000 to $499,999 | 236 (27.6%) | 554 (49.6%) |
| $500,000 to $749,999 | 11 (1.3%) | 42 (3.8%) |
| $750,000 to $999,999 | 0 (0.0%) | 0 (0.0%) |
| $1,000,000 or more | 29 (3.4%) | 13 (1.2%) |
| Total | 855 (100.0%) | 1,117 (100.0%) |
Household Income by Mortgage Status in North Riverside
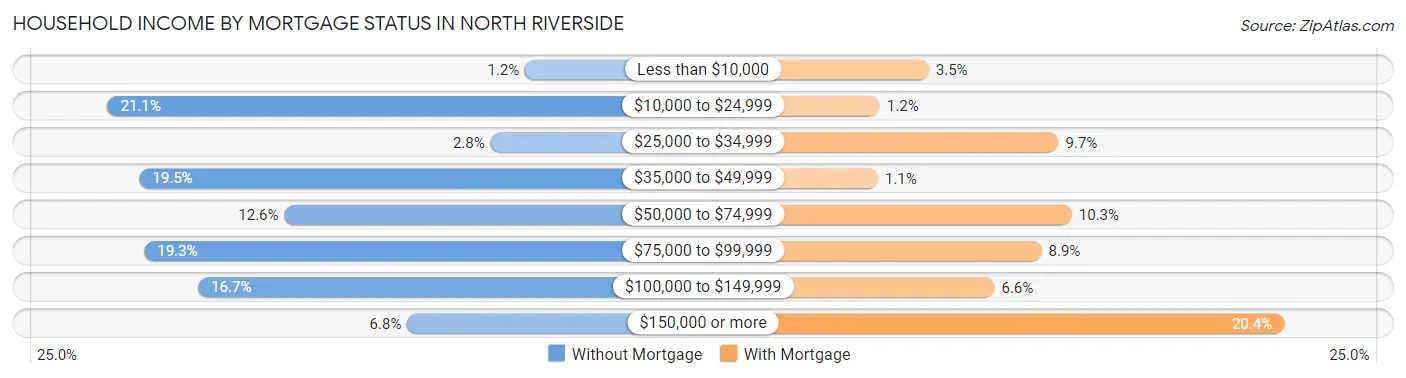
| Household Income | Without Mortgage | With Mortgage |
| Less than $10,000 | 10 (1.2%) | 39 (3.5%) |
| $10,000 to $24,999 | 180 (21.0%) | 13 (1.2%) |
| $25,000 to $34,999 | 24 (2.8%) | 108 (9.7%) |
| $35,000 to $49,999 | 167 (19.5%) | 12 (1.1%) |
| $50,000 to $74,999 | 108 (12.6%) | 115 (10.3%) |
| $75,000 to $99,999 | 165 (19.3%) | 99 (8.9%) |
| $100,000 to $149,999 | 143 (16.7%) | 74 (6.6%) |
| $150,000 or more | 58 (6.8%) | 228 (20.4%) |
| Total | 855 (100.0%) | 1,117 (100.0%) |
Property Value to Household Income Ratio in North Riverside
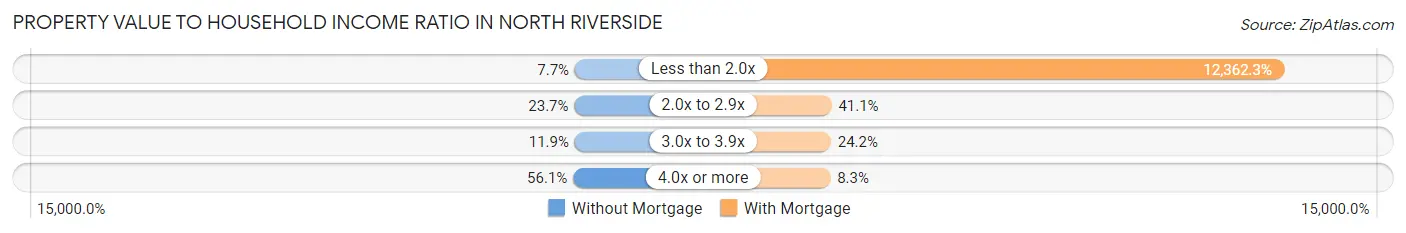
| Value-to-Income Ratio | Without Mortgage | With Mortgage |
| Less than 2.0x | 66 (7.7%) | 138,087 (12,362.3%) |
| 2.0x to 2.9x | 203 (23.7%) | 459 (41.1%) |
| 3.0x to 3.9x | 102 (11.9%) | 270 (24.2%) |
| 4.0x or more | 480 (56.1%) | 93 (8.3%) |
| Total | 855 (100.0%) | 1,117 (100.0%) |
Real Estate Taxes by Mortgage Status in North Riverside
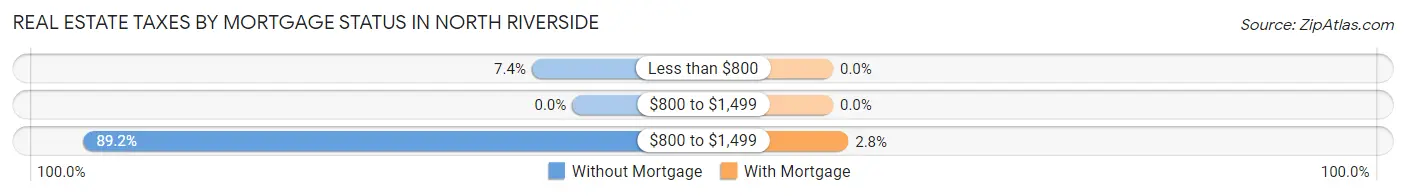
| Property Taxes | Without Mortgage | With Mortgage |
| Less than $800 | 63 (7.4%) | 0 (0.0%) |
| $800 to $1,499 | 0 (0.0%) | 0 (0.0%) |
| $800 to $1,499 | 763 (89.2%) | 31 (2.8%) |
| Total | 855 (100.0%) | 1,117 (100.0%) |
Health & Disability in North Riverside
Health Insurance Coverage by Age in North Riverside
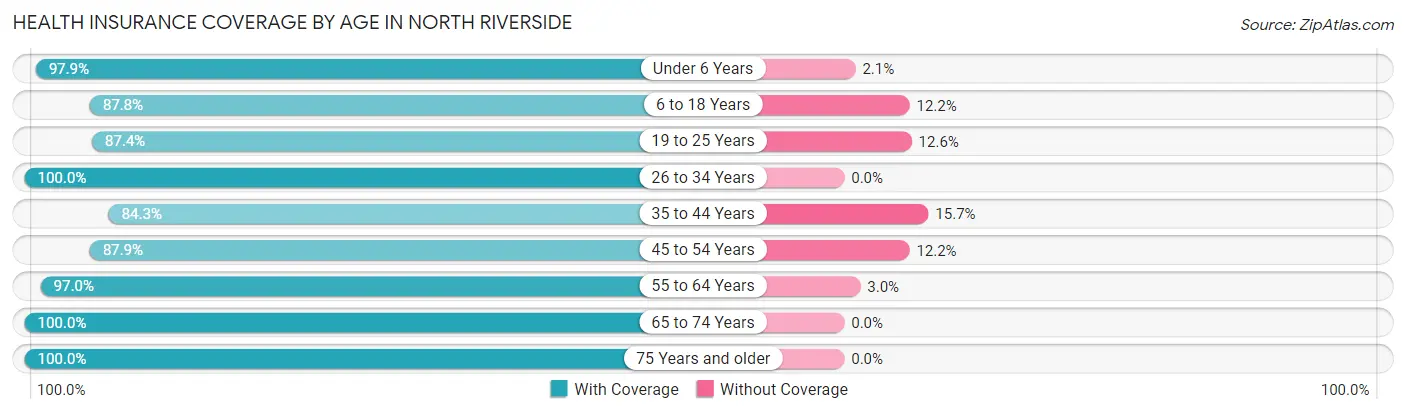
| Age Bracket | With Coverage | Without Coverage |
| Under 6 Years | 329 (97.9%) | 7 (2.1%) |
| 6 to 18 Years | 1,220 (87.8%) | 169 (12.2%) |
| 19 to 25 Years | 543 (87.4%) | 78 (12.6%) |
| 26 to 34 Years | 638 (100.0%) | 0 (0.0%) |
| 35 to 44 Years | 930 (84.3%) | 173 (15.7%) |
| 45 to 54 Years | 658 (87.8%) | 91 (12.1%) |
| 55 to 64 Years | 941 (97.0%) | 29 (3.0%) |
| 65 to 74 Years | 713 (100.0%) | 0 (0.0%) |
| 75 Years and older | 676 (100.0%) | 0 (0.0%) |
| Total | 6,648 (92.4%) | 547 (7.6%) |
Health Insurance Coverage by Citizenship Status in North Riverside
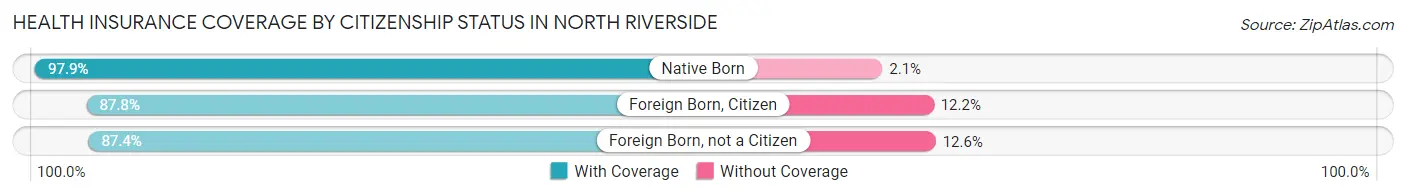
| Citizenship Status | With Coverage | Without Coverage |
| Native Born | 329 (97.9%) | 7 (2.1%) |
| Foreign Born, Citizen | 1,220 (87.8%) | 169 (12.2%) |
| Foreign Born, not a Citizen | 543 (87.4%) | 78 (12.6%) |
Health Insurance Coverage by Household Income in North Riverside
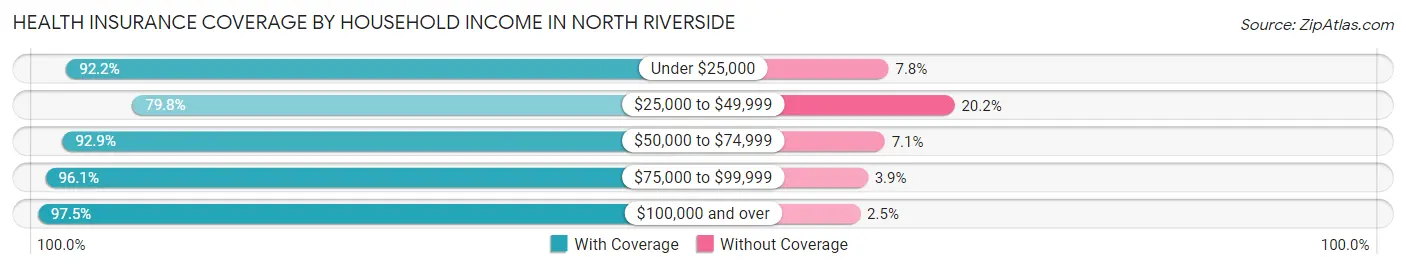
| Household Income | With Coverage | Without Coverage |
| Under $25,000 | 790 (92.2%) | 67 (7.8%) |
| $25,000 to $49,999 | 1,246 (79.8%) | 315 (20.2%) |
| $50,000 to $74,999 | 602 (92.9%) | 46 (7.1%) |
| $75,000 to $99,999 | 883 (96.1%) | 36 (3.9%) |
| $100,000 and over | 3,124 (97.5%) | 80 (2.5%) |
Public vs Private Health Insurance Coverage by Age in North Riverside
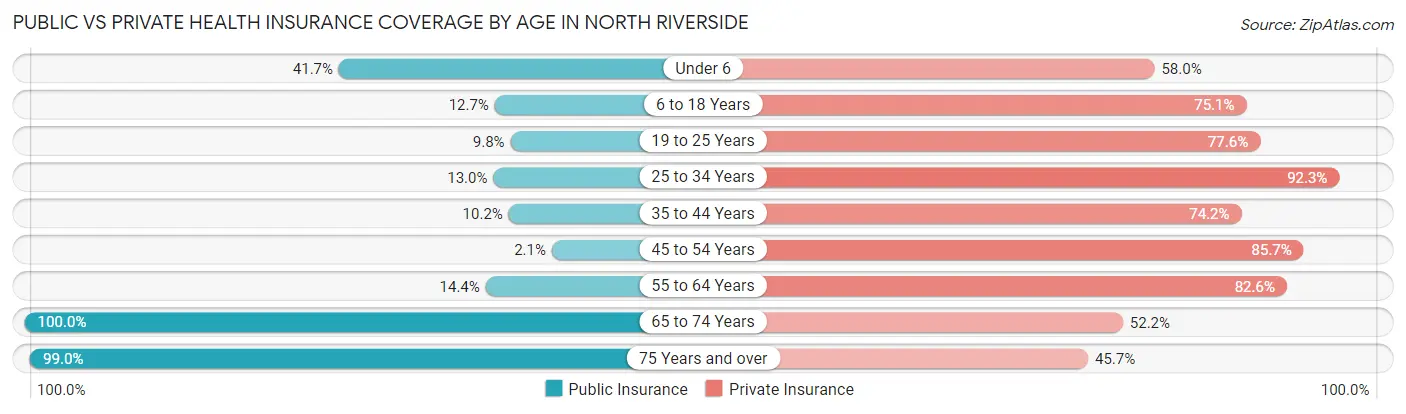
| Age Bracket | Public Insurance | Private Insurance |
| Under 6 | 140 (41.7%) | 195 (58.0%) |
| 6 to 18 Years | 177 (12.7%) | 1,043 (75.1%) |
| 19 to 25 Years | 61 (9.8%) | 482 (77.6%) |
| 25 to 34 Years | 83 (13.0%) | 589 (92.3%) |
| 35 to 44 Years | 112 (10.2%) | 818 (74.2%) |
| 45 to 54 Years | 16 (2.1%) | 642 (85.7%) |
| 55 to 64 Years | 140 (14.4%) | 801 (82.6%) |
| 65 to 74 Years | 713 (100.0%) | 372 (52.2%) |
| 75 Years and over | 669 (99.0%) | 309 (45.7%) |
| Total | 2,111 (29.3%) | 5,251 (73.0%) |
Disability Status by Sex by Age in North Riverside
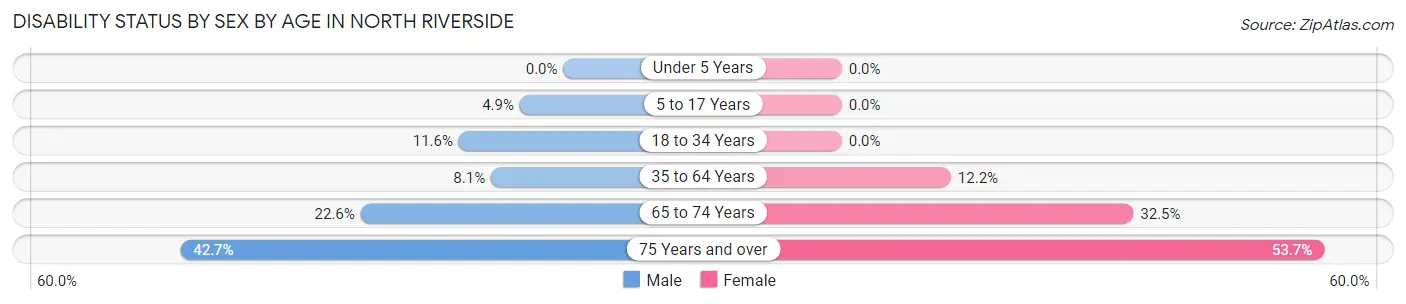
| Age Bracket | Male | Female |
| Under 5 Years | 0 (0.0%) | 0 (0.0%) |
| 5 to 17 Years | 30 (4.9%) | 0 (0.0%) |
| 18 to 34 Years | 102 (11.6%) | 0 (0.0%) |
| 35 to 64 Years | 116 (8.1%) | 168 (12.1%) |
| 65 to 74 Years | 56 (22.6%) | 151 (32.5%) |
| 75 Years and over | 116 (42.6%) | 217 (53.7%) |
Disability Class by Sex by Age in North Riverside
Disability Class: Hearing Difficulty
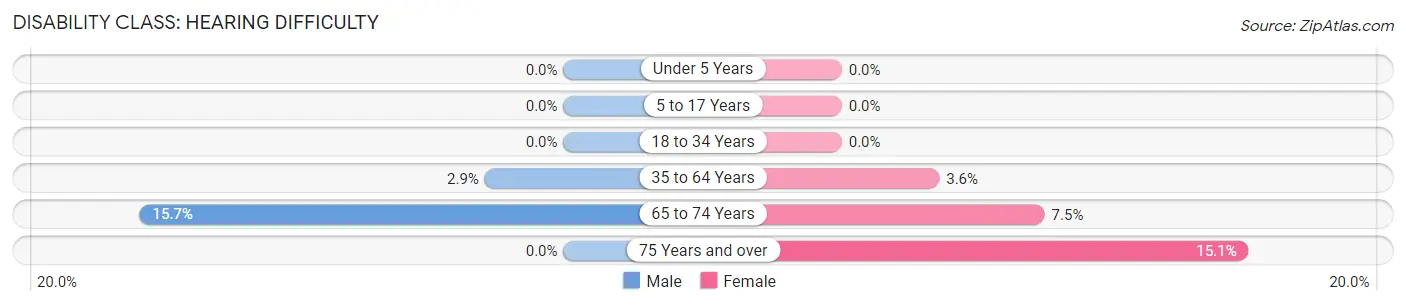
| Age Bracket | Male | Female |
| Under 5 Years | 0 (0.0%) | 0 (0.0%) |
| 5 to 17 Years | 0 (0.0%) | 0 (0.0%) |
| 18 to 34 Years | 0 (0.0%) | 0 (0.0%) |
| 35 to 64 Years | 42 (2.9%) | 50 (3.6%) |
| 65 to 74 Years | 39 (15.7%) | 35 (7.5%) |
| 75 Years and over | 0 (0.0%) | 61 (15.1%) |
Disability Class: Vision Difficulty
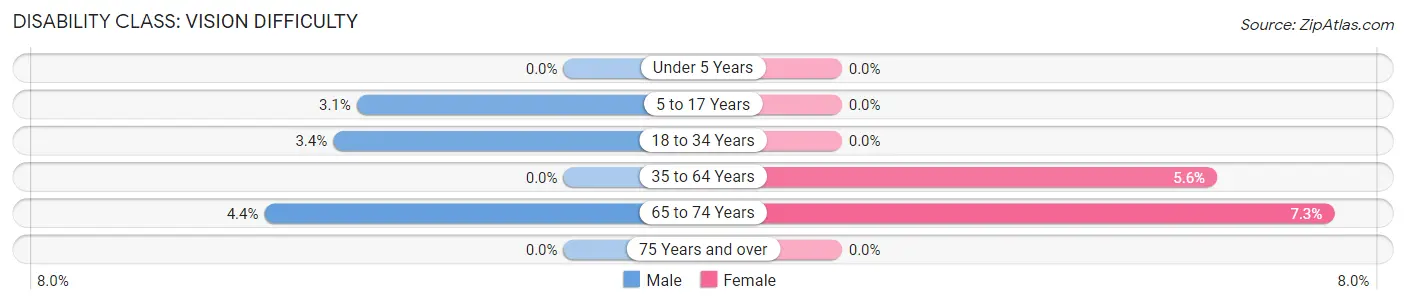
| Age Bracket | Male | Female |
| Under 5 Years | 0 (0.0%) | 0 (0.0%) |
| 5 to 17 Years | 19 (3.1%) | 0 (0.0%) |
| 18 to 34 Years | 30 (3.4%) | 0 (0.0%) |
| 35 to 64 Years | 0 (0.0%) | 77 (5.6%) |
| 65 to 74 Years | 11 (4.4%) | 34 (7.3%) |
| 75 Years and over | 0 (0.0%) | 0 (0.0%) |
Disability Class: Cognitive Difficulty
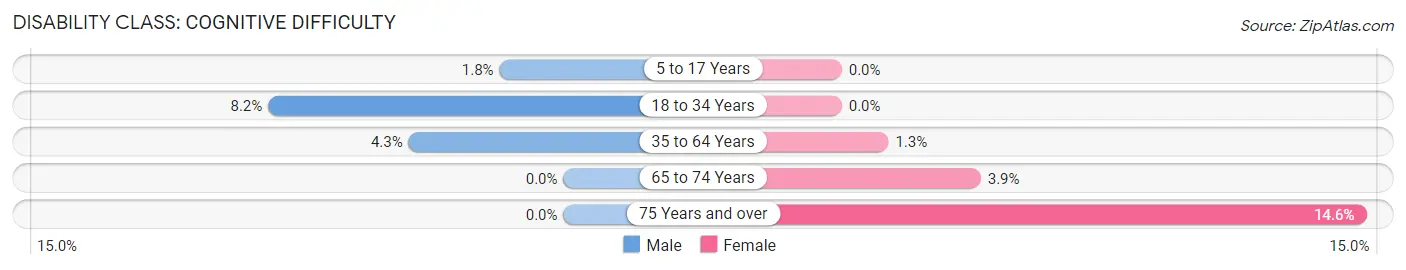
| Age Bracket | Male | Female |
| 5 to 17 Years | 11 (1.8%) | 0 (0.0%) |
| 18 to 34 Years | 72 (8.2%) | 0 (0.0%) |
| 35 to 64 Years | 62 (4.3%) | 18 (1.3%) |
| 65 to 74 Years | 0 (0.0%) | 18 (3.9%) |
| 75 Years and over | 0 (0.0%) | 59 (14.6%) |
Disability Class: Ambulatory Difficulty
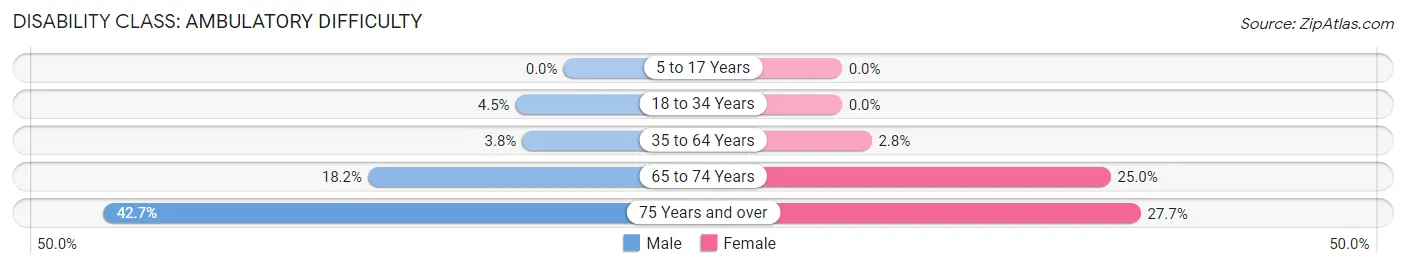
| Age Bracket | Male | Female |
| 5 to 17 Years | 0 (0.0%) | 0 (0.0%) |
| 18 to 34 Years | 39 (4.4%) | 0 (0.0%) |
| 35 to 64 Years | 55 (3.8%) | 38 (2.8%) |
| 65 to 74 Years | 45 (18.1%) | 116 (24.9%) |
| 75 Years and over | 116 (42.6%) | 112 (27.7%) |
Disability Class: Self-Care Difficulty
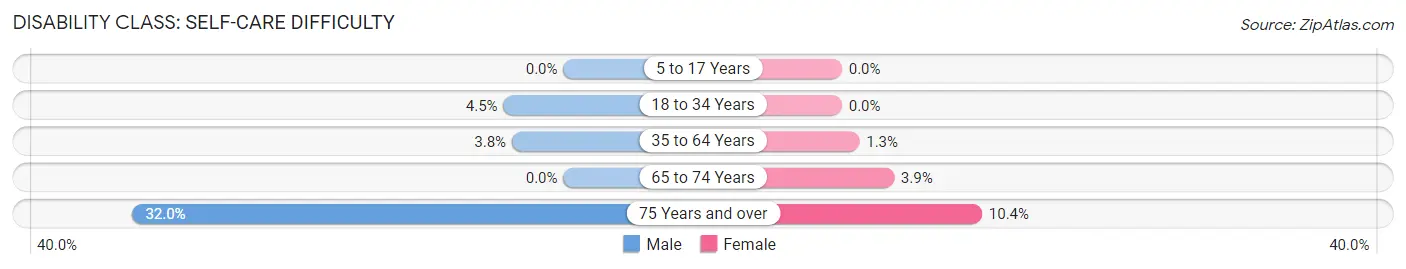
| Age Bracket | Male | Female |
| 5 to 17 Years | 0 (0.0%) | 0 (0.0%) |
| 18 to 34 Years | 39 (4.4%) | 0 (0.0%) |
| 35 to 64 Years | 55 (3.8%) | 18 (1.3%) |
| 65 to 74 Years | 0 (0.0%) | 18 (3.9%) |
| 75 Years and over | 87 (32.0%) | 42 (10.4%) |
Technology Access in North Riverside
Computing Device Access in North Riverside
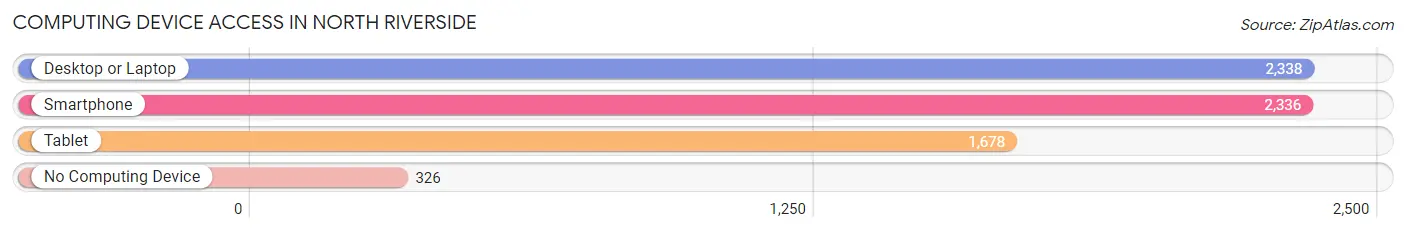
| Device Type | # Households | % Households |
| Desktop or Laptop | 2,338 | 79.6% |
| Smartphone | 2,336 | 79.5% |
| Tablet | 1,678 | 57.1% |
| No Computing Device | 326 | 11.1% |
| Total | 2,938 | 100.0% |
Internet Access in North Riverside
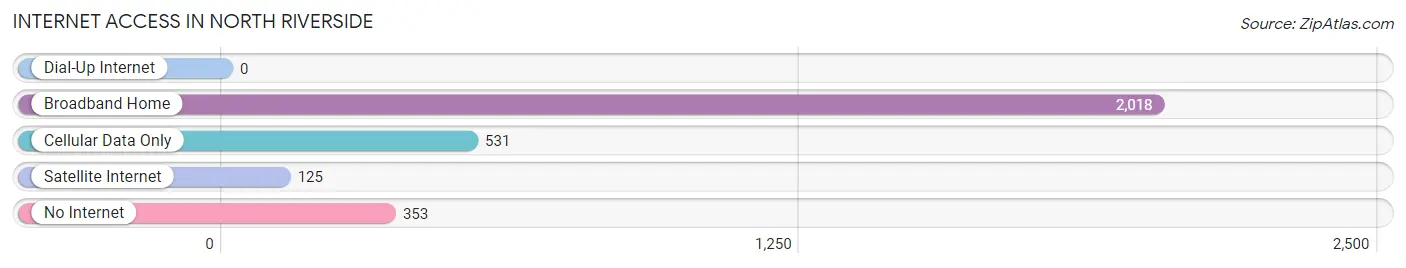
| Internet Type | # Households | % Households |
| Dial-Up Internet | 0 | 0.0% |
| Broadband Home | 2,018 | 68.7% |
| Cellular Data Only | 531 | 18.1% |
| Satellite Internet | 125 | 4.3% |
| No Internet | 353 | 12.0% |
| Total | 2,938 | 100.0% |
North Riverside Summary
Riverside, Illinois is a village located in Cook County, Illinois, United States. It is situated on the Des Plaines River, approximately 13 miles west of downtown Chicago. The village is bordered by the cities of Berwyn, Brookfield, and North Riverside. As of the 2010 census, the population of North Riverside was 7,672.
History
The area that is now North Riverside was originally inhabited by the Potawatomi Native American tribe. The first European settlers arrived in the area in the early 1800s. The first settler was a man named John Rice, who arrived in 1834. He was followed by other settlers, including the families of William and John Hosea, who arrived in 1836.
In 1872, the village of Riverside was incorporated. The village was named after the Des Plaines River, which runs through the area. The village was initially a farming community, but it began to grow in the late 19th century as the Chicago and North Western Railway built a line through the area.
In 1924, the village of Riverside was annexed by the village of North Riverside. The two villages were combined to form the village of North Riverside.
Geography
North Riverside is located at 41°50'17"N 87°49'45"W (41.838, -87.829). According to the United States Census Bureau, the village has a total area of 2.2 square miles (5.7 km2), all of it land.
The village is located on the Des Plaines River, which runs through the area. The village is bordered by the cities of Berwyn, Brookfield, and North Riverside.
Economy
North Riverside is primarily a residential community, but it does have a few businesses. The village is home to a number of restaurants, including the popular Italian restaurant, La Barra. The village also has a number of retail stores, including a Walmart Supercenter.
Demographics
As of the 2010 census, the population of North Riverside was 7,672. The racial makeup of the village was 79.2% White, 8.2% African American, 0.2% Native American, 5.2% Asian, and 4.2% from other races. Hispanic or Latino of any race were 11.7% of the population.
The median income for a household in the village was $50,945, and the median income for a family was $60,945. The per capita income for the village was $25,945. About 4.2% of families and 5.2% of the population were below the poverty line, including 6.2% of those under age 18 and 4.2% of those age 65 or over.
North Riverside is a diverse community with a variety of cultures and backgrounds. The village is home to a number of churches, including St. Mary's Catholic Church, Riverside United Methodist Church, and Riverside Presbyterian Church. The village also has a number of parks, including the North Riverside Park District, which offers a variety of recreational activities.
Common Questions
What is Per Capita Income in North Riverside?
Per Capita income in North Riverside is $41,272.
What is the Median Family Income in North Riverside?
Median Family Income in North Riverside is $92,439.
What is the Median Household income in North Riverside?
Median Household Income in North Riverside is $63,625.
What is Income or Wage Gap in North Riverside?
Income or Wage Gap in North Riverside is 5.0%.
Women in North Riverside earn 95.0 cents for every dollar earned by a man.
What is Inequality or Gini Index in North Riverside?
Inequality or Gini Index in North Riverside is 0.50.
What is the Total Population of North Riverside?
Total Population of North Riverside is 7,245.
What is the Total Male Population of North Riverside?
Total Male Population of North Riverside is 3,600.
What is the Total Female Population of North Riverside?
Total Female Population of North Riverside is 3,645.
What is the Ratio of Males per 100 Females in North Riverside?
There are 98.77 Males per 100 Females in North Riverside.
What is the Ratio of Females per 100 Males in North Riverside?
There are 101.25 Females per 100 Males in North Riverside.
What is the Median Population Age in North Riverside?
Median Population Age in North Riverside is 39.7 Years.
What is the Average Family Size in North Riverside
Average Family Size in North Riverside is 3.1 People.
What is the Average Household Size in North Riverside
Average Household Size in North Riverside is 2.5 People.
How Large is the Labor Force in North Riverside?
There are 3,299 People in the Labor Forcein in North Riverside.
What is the Percentage of People in the Labor Force in North Riverside?
56.6% of People are in the Labor Force in North Riverside.
What is the Unemployment Rate in North Riverside?
Unemployment Rate in North Riverside is 5.6%.