Cissna Park, IL Map & Demographics
Cissna Park Map
Cissna Park Overview
$38,074
PER CAPITA INCOME
$82,386
AVG FAMILY INCOME
$47,171
AVG HOUSEHOLD INCOME
30.1%
WAGE / INCOME GAP [ % ]
69.9¢/ $1
WAGE / INCOME GAP [ $ ]
0.49
INEQUALITY / GINI INDEX
882
TOTAL POPULATION
388
MALE POPULATION
494
FEMALE POPULATION
78.54
MALES / 100 FEMALES
127.32
FEMALES / 100 MALES
51.1
MEDIAN AGE
2.8
AVG FAMILY SIZE
2.0
AVG HOUSEHOLD SIZE
342
LABOR FORCE [ PEOPLE ]
46.7%
PERCENT IN LABOR FORCE
0.3%
UNEMPLOYMENT RATE
Cissna Park Zip Codes
Cissna Park Area Codes
Income in Cissna Park
Income Overview in Cissna Park
Per Capita Income in Cissna Park is $38,074, while median incomes of families and households are $82,386 and $47,171 respectively.
| Characteristic | Number | Measure |
| Per Capita Income | 882 | $38,074 |
| Median Family Income | 249 | $82,386 |
| Mean Family Income | 249 | $104,824 |
| Median Household Income | 433 | $47,171 |
| Mean Household Income | 433 | $77,742 |
| Income Deficit | 249 | $0 |
| Wage / Income Gap (%) | 882 | 30.07% |
| Wage / Income Gap ($) | 882 | 69.93¢ per $1 |
| Gini / Inequality Index | 882 | 0.49 |
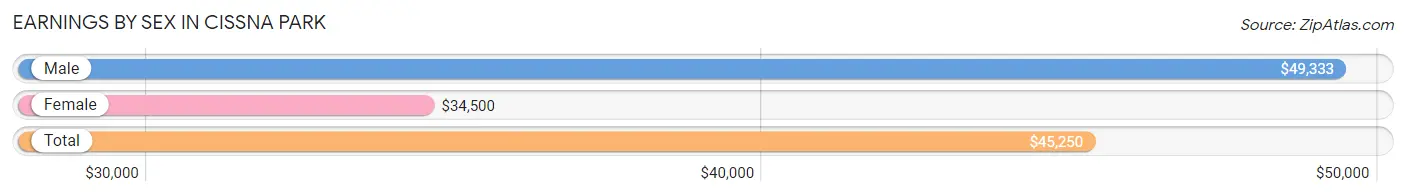
Earnings by Sex in Cissna Park
Average Earnings in Cissna Park are $45,250, $49,333 for men and $34,500 for women, a difference of 30.1%.
| Sex | Number | Average Earnings |
| Male | 190 (51.3%) | $49,333 |
| Female | 180 (48.6%) | $34,500 |
| Total | 370 (100.0%) | $45,250 |
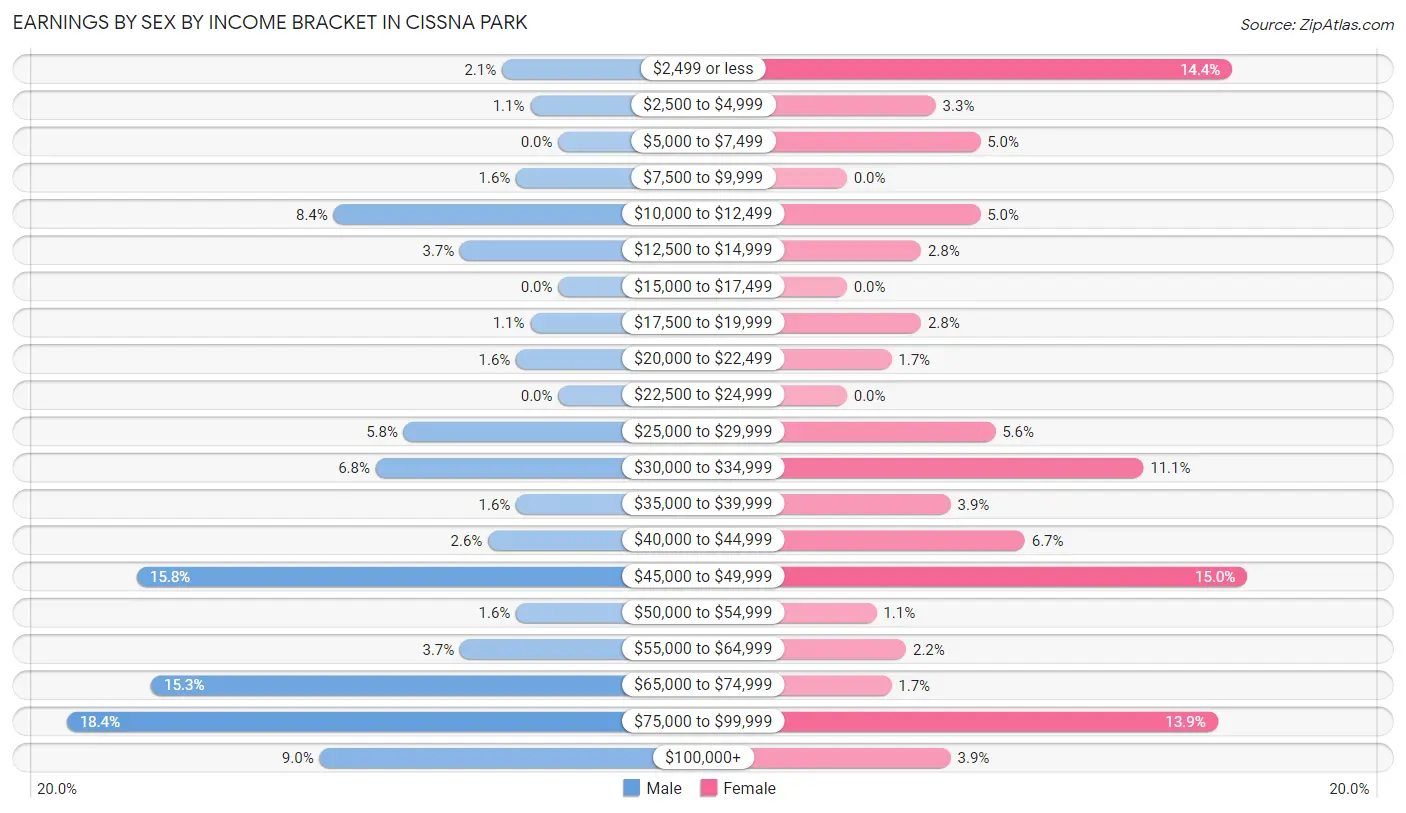
Earnings by Sex by Income Bracket in Cissna Park
The most common earnings brackets in Cissna Park are $75,000 to $99,999 for men (35 | 18.4%) and $45,000 to $49,999 for women (27 | 15.0%).
| Income | Male | Female |
| $2,499 or less | 4 (2.1%) | 26 (14.4%) |
| $2,500 to $4,999 | 2 (1.1%) | 6 (3.3%) |
| $5,000 to $7,499 | 0 (0.0%) | 9 (5.0%) |
| $7,500 to $9,999 | 3 (1.6%) | 0 (0.0%) |
| $10,000 to $12,499 | 16 (8.4%) | 9 (5.0%) |
| $12,500 to $14,999 | 7 (3.7%) | 5 (2.8%) |
| $15,000 to $17,499 | 0 (0.0%) | 0 (0.0%) |
| $17,500 to $19,999 | 2 (1.1%) | 5 (2.8%) |
| $20,000 to $22,499 | 3 (1.6%) | 3 (1.7%) |
| $22,500 to $24,999 | 0 (0.0%) | 0 (0.0%) |
| $25,000 to $29,999 | 11 (5.8%) | 10 (5.6%) |
| $30,000 to $34,999 | 13 (6.8%) | 20 (11.1%) |
| $35,000 to $39,999 | 3 (1.6%) | 7 (3.9%) |
| $40,000 to $44,999 | 5 (2.6%) | 12 (6.7%) |
| $45,000 to $49,999 | 30 (15.8%) | 27 (15.0%) |
| $50,000 to $54,999 | 3 (1.6%) | 2 (1.1%) |
| $55,000 to $64,999 | 7 (3.7%) | 4 (2.2%) |
| $65,000 to $74,999 | 29 (15.3%) | 3 (1.7%) |
| $75,000 to $99,999 | 35 (18.4%) | 25 (13.9%) |
| $100,000+ | 17 (8.9%) | 7 (3.9%) |
| Total | 190 (100.0%) | 180 (100.0%) |
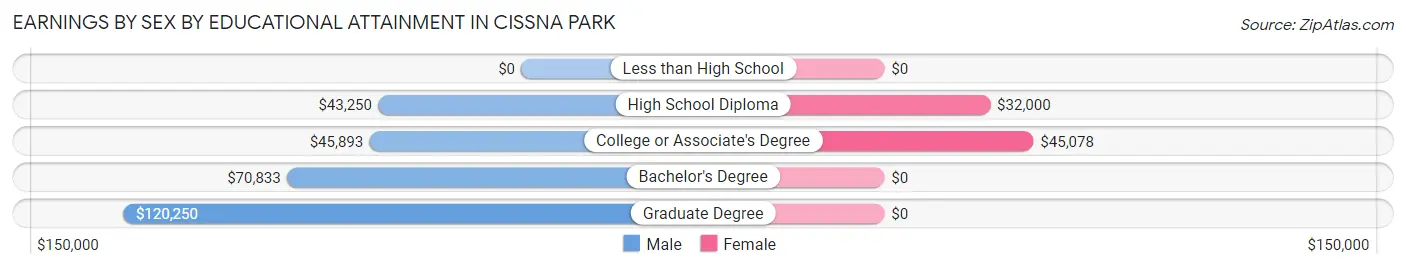
Earnings by Sex by Educational Attainment in Cissna Park
Average earnings in Cissna Park are $49,500 for men and $35,417 for women, a difference of 28.4%. Men with an educational attainment of graduate degree enjoy the highest average annual earnings of $120,250, while those with high school diploma education earn the least with $43,250. Women with an educational attainment of college or associate's degree earn the most with the average annual earnings of $45,078, while those with high school diploma education have the smallest earnings of $32,000.
| Educational Attainment | Male Income | Female Income |
| Less than High School | - | - |
| High School Diploma | $43,250 | $32,000 |
| College or Associate's Degree | $45,893 | $45,078 |
| Bachelor's Degree | $70,833 | $0 |
| Graduate Degree | $120,250 | $0 |
| Total | $49,500 | $35,417 |
Family Income in Cissna Park
Family Income Brackets in Cissna Park
According to the Cissna Park family income data, there are 63 families falling into the $100,000 to $149,999 income range, which is the most common income bracket and makes up 25.3% of all families.
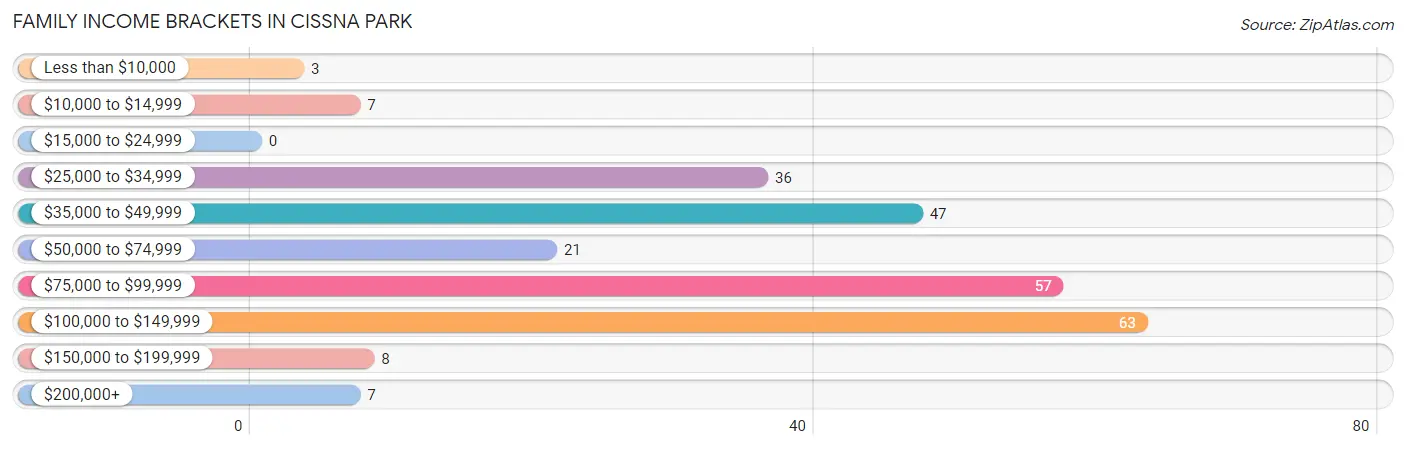
| Income Bracket | # Families | % Families |
| Less than $10,000 | 3 | 1.2% |
| $10,000 to $14,999 | 7 | 2.8% |
| $15,000 to $24,999 | 0 | 0.0% |
| $25,000 to $34,999 | 36 | 14.5% |
| $35,000 to $49,999 | 47 | 18.9% |
| $50,000 to $74,999 | 21 | 8.4% |
| $75,000 to $99,999 | 57 | 22.9% |
| $100,000 to $149,999 | 63 | 25.3% |
| $150,000 to $199,999 | 8 | 3.2% |
| $200,000+ | 7 | 2.8% |
Family Income by Famaliy Size in Cissna Park
6-person families (14 | 5.6%) account for the highest median family income in Cissna Park with $121,563 per family, while 2-person families (153 | 61.5%) have the highest median income of $35,625 per family member.
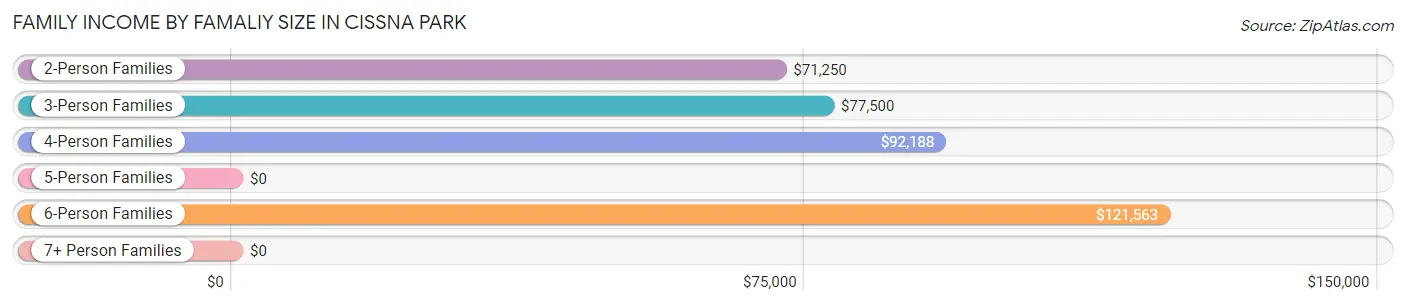
| Income Bracket | # Families | Median Income |
| 2-Person Families | 153 (61.5%) | $71,250 |
| 3-Person Families | 42 (16.9%) | $77,500 |
| 4-Person Families | 35 (14.1%) | $92,188 |
| 5-Person Families | 5 (2.0%) | $0 |
| 6-Person Families | 14 (5.6%) | $121,563 |
| 7+ Person Families | 0 (0.0%) | $0 |
| Total | 249 (100.0%) | $82,386 |
Family Income by Number of Earners in Cissna Park
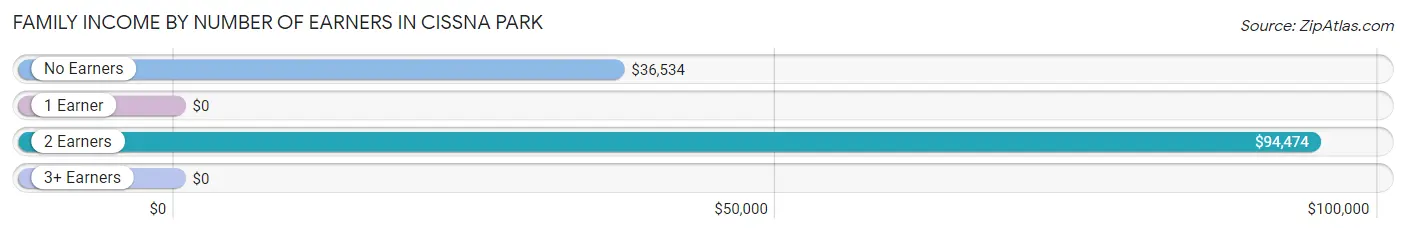
| Number of Earners | # Families | Median Income |
| No Earners | 59 (23.7%) | $36,534 |
| 1 Earner | 96 (38.6%) | $0 |
| 2 Earners | 94 (37.8%) | $94,474 |
| 3+ Earners | 0 (0.0%) | $0 |
| Total | 249 (100.0%) | $82,386 |
Household Income in Cissna Park
Household Income Brackets in Cissna Park
With 75 households falling in the category, the $25,000 to $34,999 income range is the most frequent in Cissna Park, accounting for 17.3% of all households. In contrast, only 7 households (1.6%) fall into the $200,000+ income bracket, making it the least populous group.
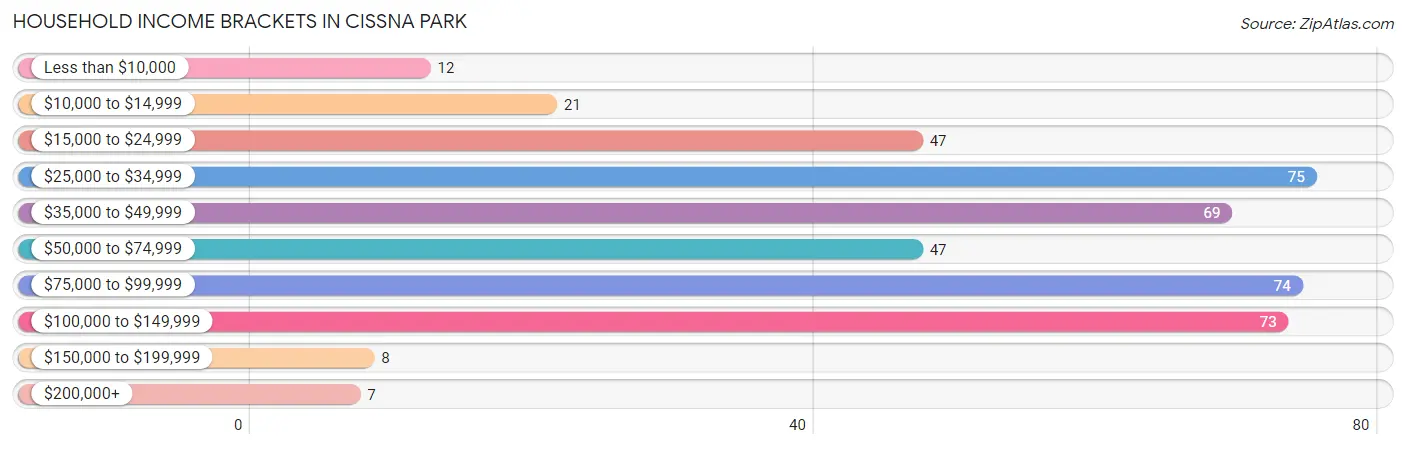
| Income Bracket | # Households | % Households |
| Less than $10,000 | 12 | 2.8% |
| $10,000 to $14,999 | 21 | 4.8% |
| $15,000 to $24,999 | 47 | 10.9% |
| $25,000 to $34,999 | 75 | 17.3% |
| $35,000 to $49,999 | 69 | 15.9% |
| $50,000 to $74,999 | 47 | 10.9% |
| $75,000 to $99,999 | 74 | 17.1% |
| $100,000 to $149,999 | 73 | 16.9% |
| $150,000 to $199,999 | 8 | 1.8% |
| $200,000+ | 7 | 1.6% |
Household Income by Householder Age in Cissna Park
The median household income in Cissna Park is $47,171, with the highest median household income of $80,795 found in the 45 to 64 years age bracket for the primary householder. A total of 101 households (23.3%) fall into this category. Meanwhile, the 15 to 24 years age bracket for the primary householder has the lowest median household income of $0, with 3 households (0.7%) in this group.
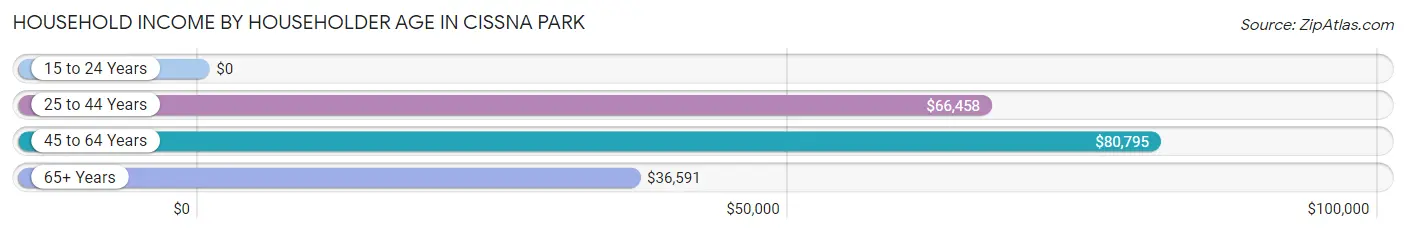
| Income Bracket | # Households | Median Income |
| 15 to 24 Years | 3 (0.7%) | $0 |
| 25 to 44 Years | 121 (27.9%) | $66,458 |
| 45 to 64 Years | 101 (23.3%) | $80,795 |
| 65+ Years | 208 (48.0%) | $36,591 |
| Total | 433 (100.0%) | $47,171 |
Poverty in Cissna Park
Income Below Poverty by Sex and Age in Cissna Park
With 7.7% poverty level for males and 7.3% for females among the residents of Cissna Park, 18 to 24 year old males and 16 and 17 year old females are the most vulnerable to poverty, with 8 males (100.0%) and 2 females (25.0%) in their respective age groups living below the poverty level.
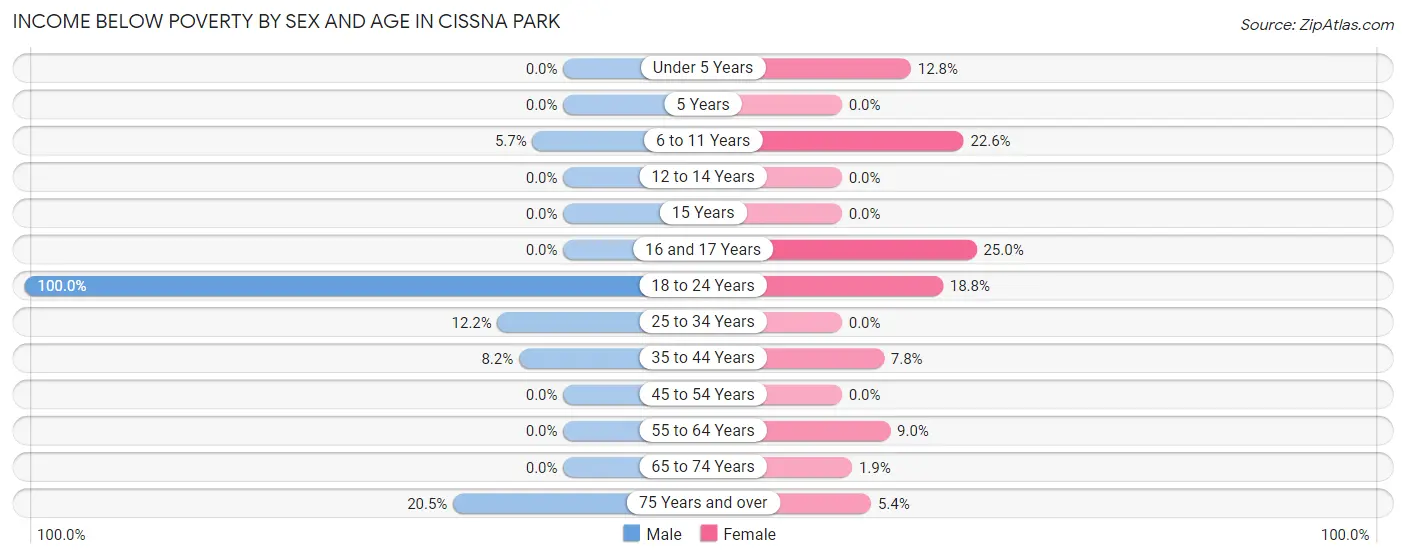
| Age Bracket | Male | Female |
| Under 5 Years | 0 (0.0%) | 5 (12.8%) |
| 5 Years | 0 (0.0%) | 0 (0.0%) |
| 6 to 11 Years | 2 (5.7%) | 7 (22.6%) |
| 12 to 14 Years | 0 (0.0%) | 0 (0.0%) |
| 15 Years | 0 (0.0%) | 0 (0.0%) |
| 16 and 17 Years | 0 (0.0%) | 2 (25.0%) |
| 18 to 24 Years | 8 (100.0%) | 3 (18.8%) |
| 25 to 34 Years | 5 (12.2%) | 0 (0.0%) |
| 35 to 44 Years | 6 (8.2%) | 5 (7.8%) |
| 45 to 54 Years | 0 (0.0%) | 0 (0.0%) |
| 55 to 64 Years | 0 (0.0%) | 7 (9.0%) |
| 65 to 74 Years | 0 (0.0%) | 1 (1.9%) |
| 75 Years and over | 9 (20.4%) | 6 (5.4%) |
| Total | 30 (7.7%) | 36 (7.3%) |
Income Above Poverty by Sex and Age in Cissna Park
According to the poverty statistics in Cissna Park, males aged under 5 years and females aged 5 years are the age groups that are most secure financially, with 100.0% of males and 100.0% of females in these age groups living above the poverty line.
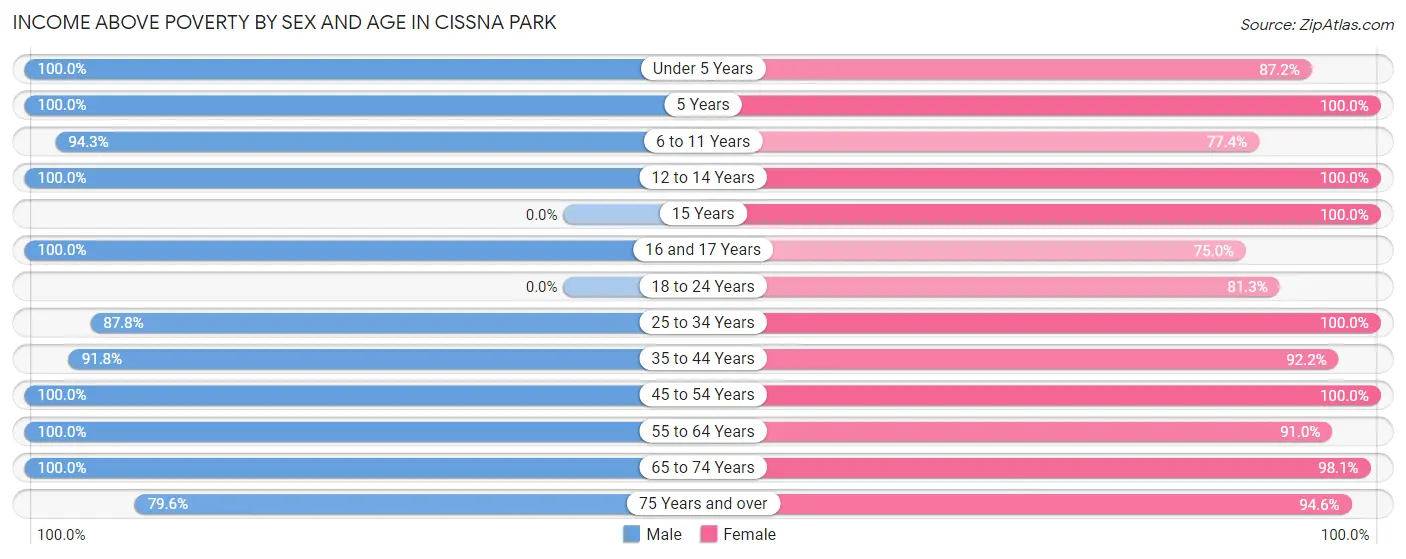
| Age Bracket | Male | Female |
| Under 5 Years | 7 (100.0%) | 34 (87.2%) |
| 5 Years | 2 (100.0%) | 3 (100.0%) |
| 6 to 11 Years | 33 (94.3%) | 24 (77.4%) |
| 12 to 14 Years | 16 (100.0%) | 7 (100.0%) |
| 15 Years | 0 (0.0%) | 9 (100.0%) |
| 16 and 17 Years | 1 (100.0%) | 6 (75.0%) |
| 18 to 24 Years | 0 (0.0%) | 13 (81.2%) |
| 25 to 34 Years | 36 (87.8%) | 43 (100.0%) |
| 35 to 44 Years | 67 (91.8%) | 59 (92.2%) |
| 45 to 54 Years | 44 (100.0%) | 32 (100.0%) |
| 55 to 64 Years | 37 (100.0%) | 71 (91.0%) |
| 65 to 74 Years | 80 (100.0%) | 52 (98.1%) |
| 75 Years and over | 35 (79.5%) | 105 (94.6%) |
| Total | 358 (92.3%) | 458 (92.7%) |
Income Below Poverty Among Married-Couple Families in Cissna Park
The poverty statistics for married-couple families in Cissna Park show that 3.4% or 7 of the total 209 families live below the poverty line. Families with 1 or 2 children have the highest poverty rate of 11.1%, comprising of 4 families. On the other hand, families with 3 or 4 children have the lowest poverty rate of 0.0%, which includes 0 families.
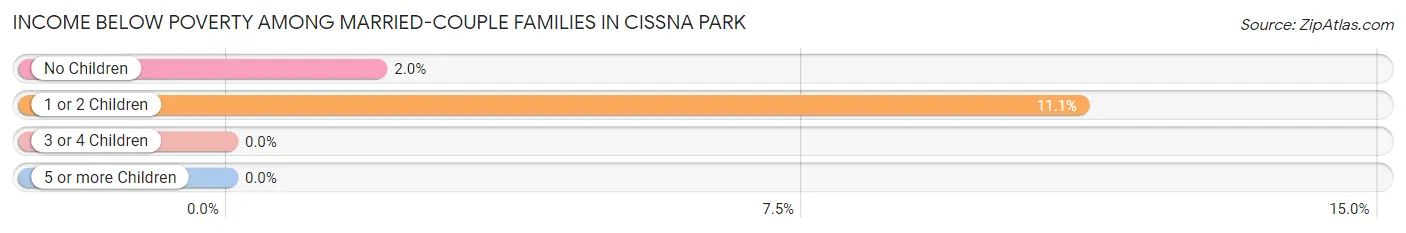
| Children | Above Poverty | Below Poverty |
| No Children | 151 (98.1%) | 3 (1.9%) |
| 1 or 2 Children | 32 (88.9%) | 4 (11.1%) |
| 3 or 4 Children | 19 (100.0%) | 0 (0.0%) |
| 5 or more Children | 0 (0.0%) | 0 (0.0%) |
| Total | 202 (96.7%) | 7 (3.4%) |
Income Below Poverty Among Single-Parent Households in Cissna Park
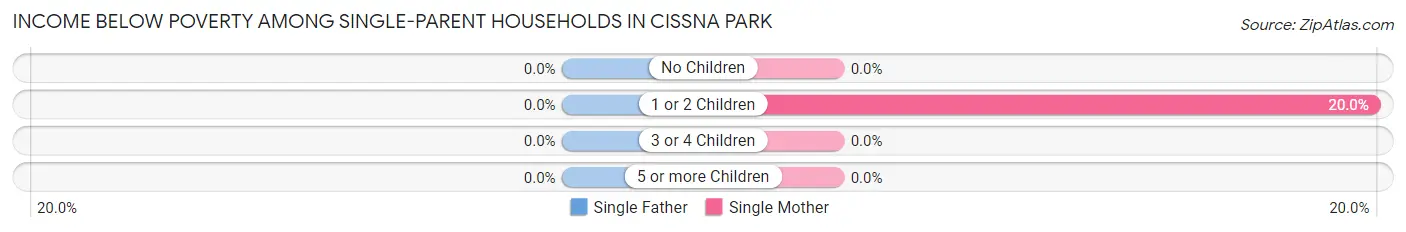
| Children | Single Father | Single Mother |
| No Children | 0 (0.0%) | 0 (0.0%) |
| 1 or 2 Children | 0 (0.0%) | 3 (20.0%) |
| 3 or 4 Children | 0 (0.0%) | 0 (0.0%) |
| 5 or more Children | 0 (0.0%) | 0 (0.0%) |
| Total | 0 (0.0%) | 3 (9.1%) |
Income Below Poverty Among Married-Couple vs Single-Parent Households in Cissna Park
The poverty data for Cissna Park shows that 7 of the married-couple family households (3.4%) and 3 of the single-parent households (7.5%) are living below the poverty level. Within the married-couple family households, those with 1 or 2 children have the highest poverty rate, with 4 households (11.1%) falling below the poverty line. Among the single-parent households, those with 1 or 2 children have the highest poverty rate, with 3 household (15.8%) living below poverty.
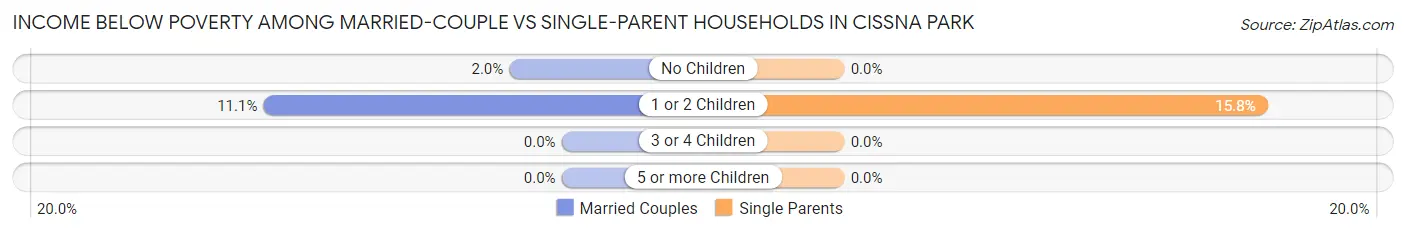
| Children | Married-Couple Families | Single-Parent Households |
| No Children | 3 (1.9%) | 0 (0.0%) |
| 1 or 2 Children | 4 (11.1%) | 3 (15.8%) |
| 3 or 4 Children | 0 (0.0%) | 0 (0.0%) |
| 5 or more Children | 0 (0.0%) | 0 (0.0%) |
| Total | 7 (3.4%) | 3 (7.5%) |
Race in Cissna Park
The most populous races in Cissna Park are White / Caucasian (816 | 92.5%), Two or more Races (64 | 7.3%), and Hispanic or Latino (52 | 5.9%).
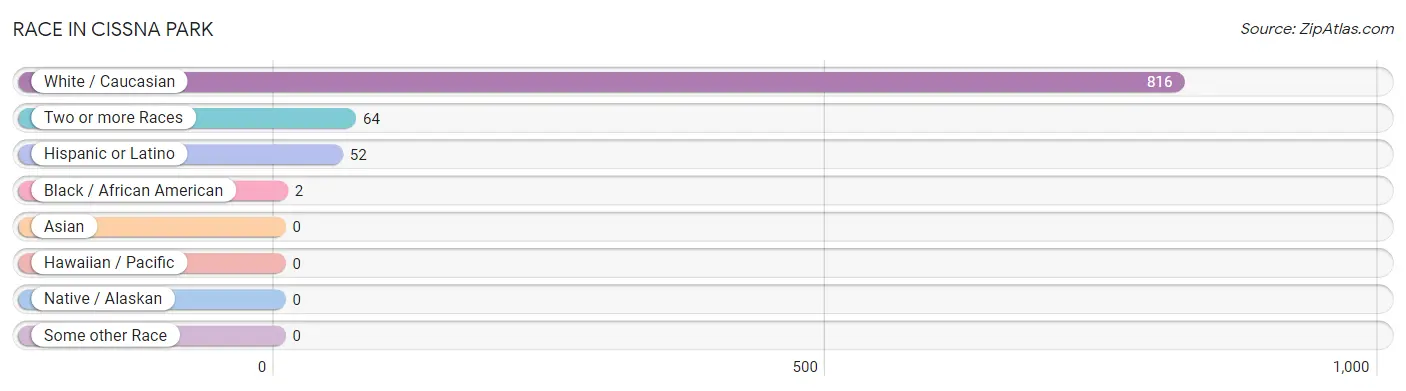
| Race | # Population | % Population |
| Asian | 0 | 0.0% |
| Black / African American | 2 | 0.2% |
| Hawaiian / Pacific | 0 | 0.0% |
| Hispanic or Latino | 52 | 5.9% |
| Native / Alaskan | 0 | 0.0% |
| White / Caucasian | 816 | 92.5% |
| Two or more Races | 64 | 7.3% |
| Some other Race | 0 | 0.0% |
| Total | 882 | 100.0% |
Ancestry in Cissna Park
The most populous ancestries reported in Cissna Park are German (479 | 54.3%), Irish (107 | 12.1%), English (90 | 10.2%), American (69 | 7.8%), and French (54 | 6.1%), together accounting for 90.6% of all Cissna Park residents.
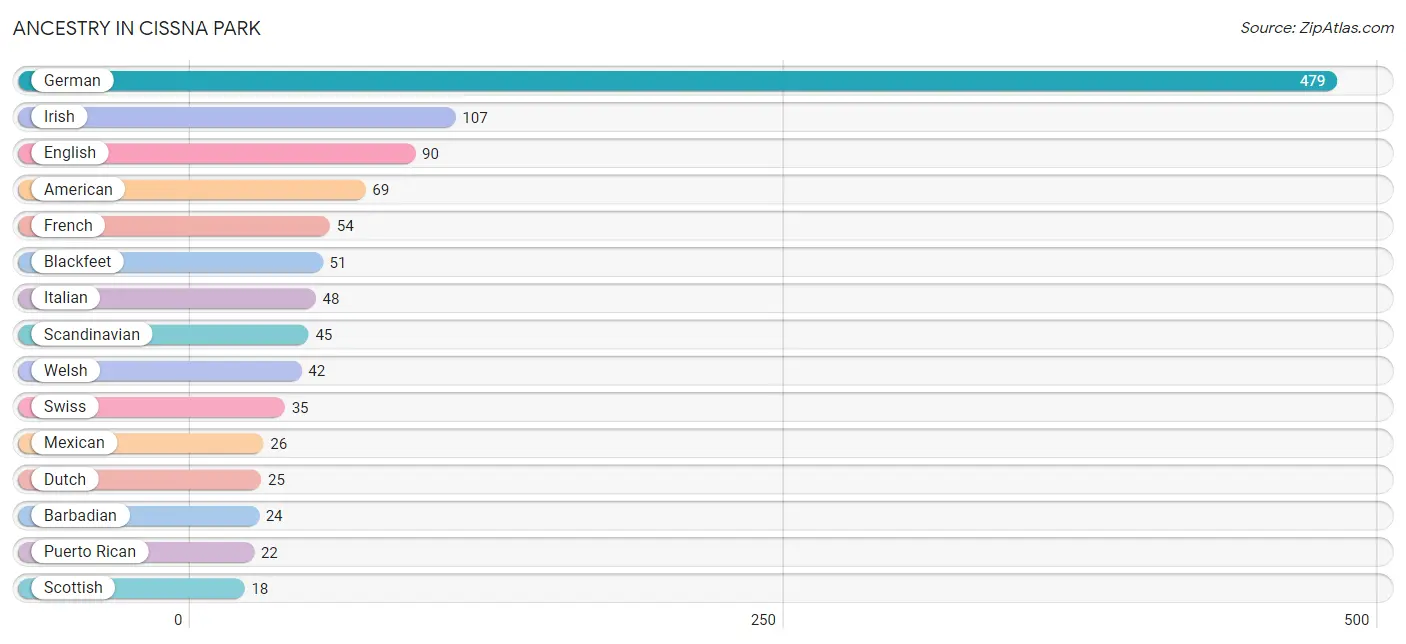
| Ancestry | # Population | % Population |
| American | 69 | 7.8% |
| Barbadian | 24 | 2.7% |
| Bhutanese | 1 | 0.1% |
| Blackfeet | 51 | 5.8% |
| Cherokee | 4 | 0.4% |
| Croatian | 6 | 0.7% |
| Dutch | 25 | 2.8% |
| English | 90 | 10.2% |
| European | 3 | 0.3% |
| French | 54 | 6.1% |
| German | 479 | 54.3% |
| Greek | 4 | 0.4% |
| Irish | 107 | 12.1% |
| Italian | 48 | 5.4% |
| Lithuanian | 1 | 0.1% |
| Mexican | 26 | 2.9% |
| Norwegian | 11 | 1.3% |
| Puerto Rican | 22 | 2.5% |
| Scandinavian | 45 | 5.1% |
| Scotch-Irish | 2 | 0.2% |
| Scottish | 18 | 2.0% |
| Swedish | 16 | 1.8% |
| Swiss | 35 | 4.0% |
| Welsh | 42 | 4.8% | View All 24 Rows |
Immigrants in Cissna Park
The most numerous immigrant groups reported in Cissna Park came from Latin America (19 | 2.1%), Barbados (12 | 1.4%), Caribbean (12 | 1.4%), Central America (7 | 0.8%), and Mexico (7 | 0.8%), together accounting for 6.5% of all Cissna Park residents.
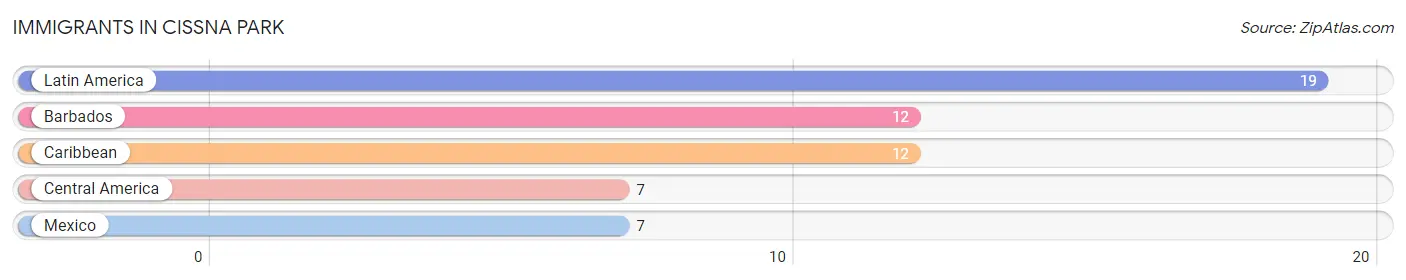
| Immigration Origin | # Population | % Population |
| Barbados | 12 | 1.4% |
| Caribbean | 12 | 1.4% |
| Central America | 7 | 0.8% |
| Latin America | 19 | 2.1% |
| Mexico | 7 | 0.8% | View All 5 Rows |
Sex and Age in Cissna Park
Sex and Age in Cissna Park
The most populous age groups in Cissna Park are 40 to 44 Years (43 | 11.1%) for men and 55 to 59 Years (50 | 10.1%) for women.
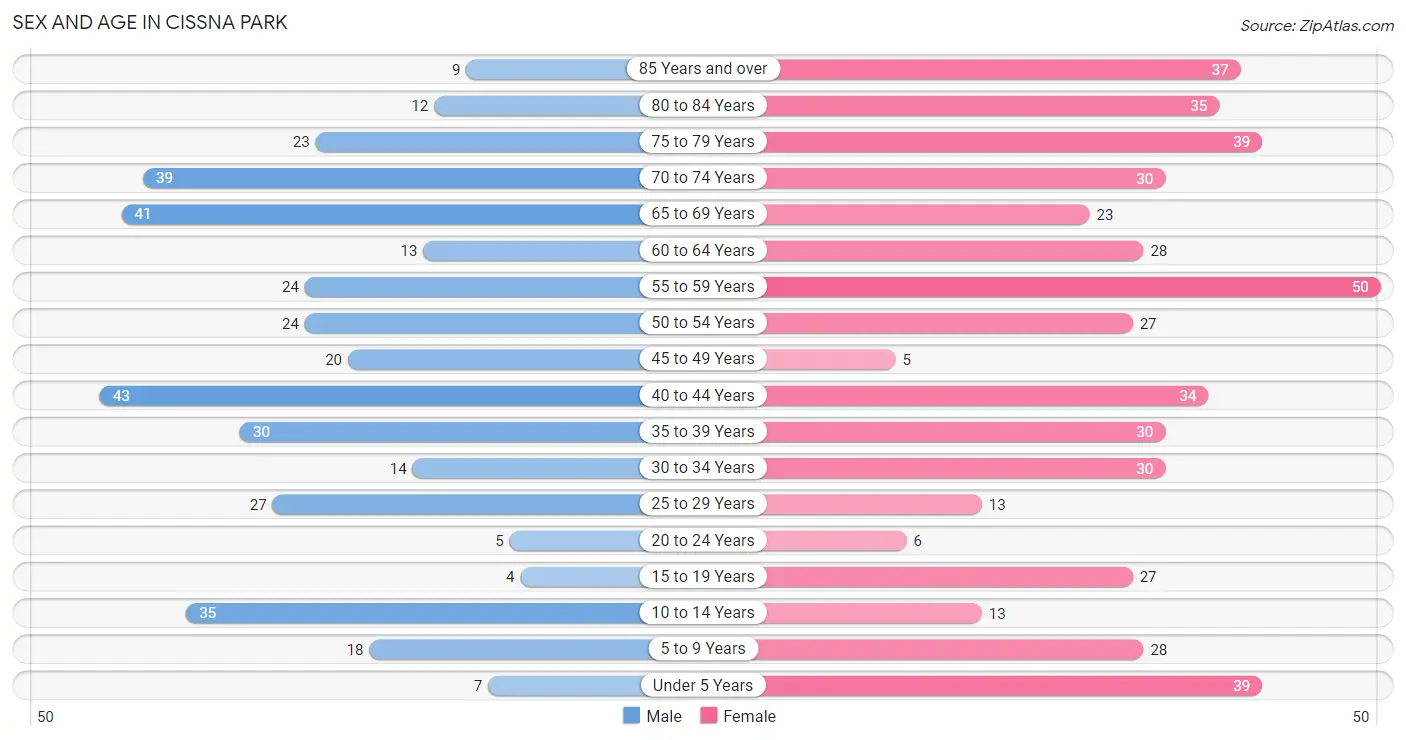
| Age Bracket | Male | Female |
| Under 5 Years | 7 (1.8%) | 39 (7.9%) |
| 5 to 9 Years | 18 (4.6%) | 28 (5.7%) |
| 10 to 14 Years | 35 (9.0%) | 13 (2.6%) |
| 15 to 19 Years | 4 (1.0%) | 27 (5.5%) |
| 20 to 24 Years | 5 (1.3%) | 6 (1.2%) |
| 25 to 29 Years | 27 (7.0%) | 13 (2.6%) |
| 30 to 34 Years | 14 (3.6%) | 30 (6.1%) |
| 35 to 39 Years | 30 (7.7%) | 30 (6.1%) |
| 40 to 44 Years | 43 (11.1%) | 34 (6.9%) |
| 45 to 49 Years | 20 (5.1%) | 5 (1.0%) |
| 50 to 54 Years | 24 (6.2%) | 27 (5.5%) |
| 55 to 59 Years | 24 (6.2%) | 50 (10.1%) |
| 60 to 64 Years | 13 (3.4%) | 28 (5.7%) |
| 65 to 69 Years | 41 (10.6%) | 23 (4.7%) |
| 70 to 74 Years | 39 (10.1%) | 30 (6.1%) |
| 75 to 79 Years | 23 (5.9%) | 39 (7.9%) |
| 80 to 84 Years | 12 (3.1%) | 35 (7.1%) |
| 85 Years and over | 9 (2.3%) | 37 (7.5%) |
| Total | 388 (100.0%) | 494 (100.0%) |
Families and Households in Cissna Park
Median Family Size in Cissna Park
The median family size in Cissna Park is 2.76 persons per family, with single male/father families (7 | 2.8%) accounting for the largest median family size of 2.86 persons per family. On the other hand, single female/mother families (33 | 13.3%) represent the smallest median family size with 2.45 persons per family.
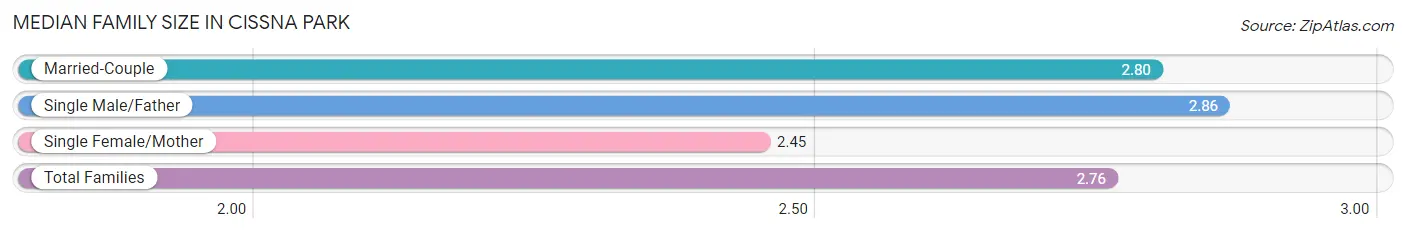
| Family Type | # Families | Family Size |
| Married-Couple | 209 (83.9%) | 2.80 |
| Single Male/Father | 7 (2.8%) | 2.86 |
| Single Female/Mother | 33 (13.3%) | 2.45 |
| Total Families | 249 (100.0%) | 2.76 |
Median Household Size in Cissna Park
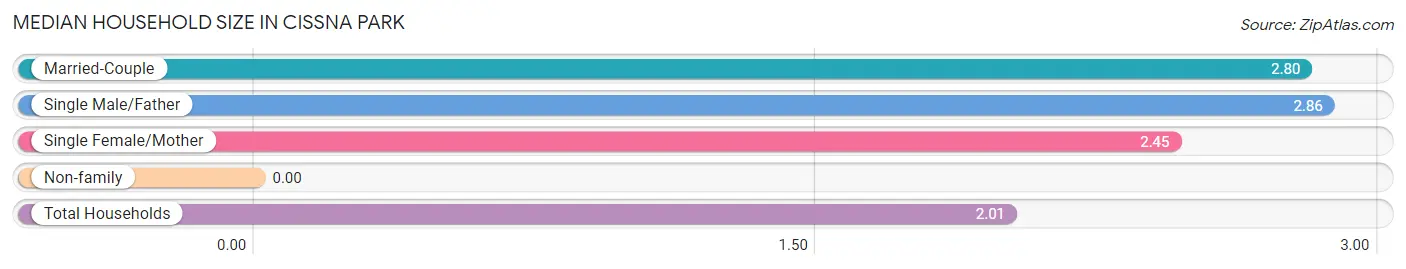
| Household Type | # Households | Household Size |
| Married-Couple | 209 (48.3%) | 2.80 |
| Single Male/Father | 7 (1.6%) | 2.86 |
| Single Female/Mother | 33 (7.6%) | 2.45 |
| Non-family | 184 (42.5%) | - |
| Total Households | 433 (100.0%) | 2.01 |
Household Size by Marriage Status in Cissna Park
Out of a total of 433 households in Cissna Park, 249 (57.5%) are family households, while 184 (42.5%) are nonfamily households. The most numerous type of family households are 2-person households, comprising 153, and the most common type of nonfamily households are 1-person households, comprising 184.
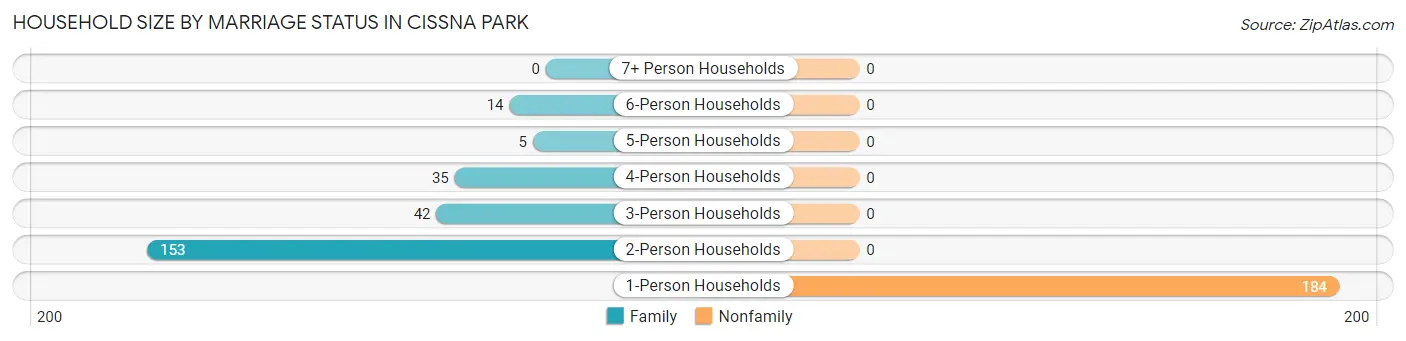
| Household Size | Family Households | Nonfamily Households |
| 1-Person Households | - | 184 (42.5%) |
| 2-Person Households | 153 (35.3%) | 0 (0.0%) |
| 3-Person Households | 42 (9.7%) | 0 (0.0%) |
| 4-Person Households | 35 (8.1%) | 0 (0.0%) |
| 5-Person Households | 5 (1.1%) | 0 (0.0%) |
| 6-Person Households | 14 (3.2%) | 0 (0.0%) |
| 7+ Person Households | 0 (0.0%) | 0 (0.0%) |
| Total | 249 (57.5%) | 184 (42.5%) |
Female Fertility in Cissna Park
Fertility by Age in Cissna Park
Average fertility rate in Cissna Park is 93.0 births per 1,000 women. Women in the age bracket of 35 to 50 years have the highest fertility rate with 162.0 births per 1,000 women. Women in the age bracket of 35 to 50 years acount for 85.7% of all women with births.
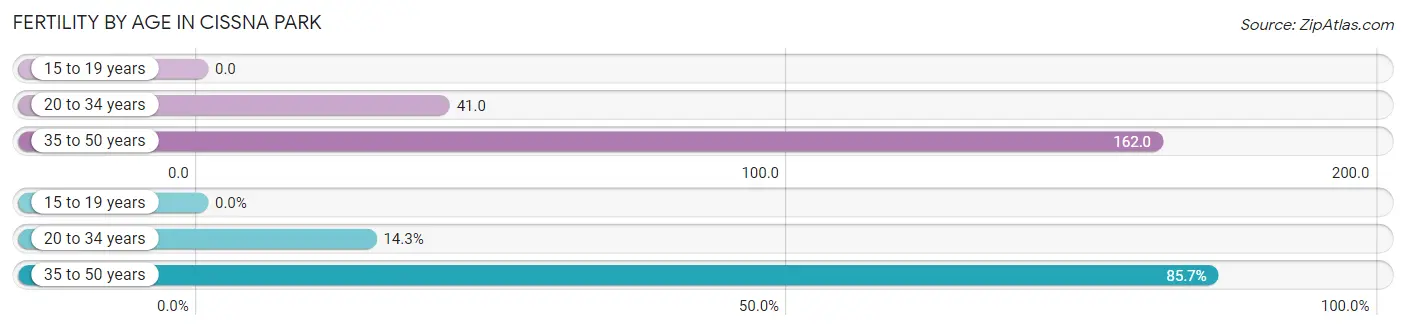
| Age Bracket | Women with Births | Births / 1,000 Women |
| 15 to 19 years | 0 (0.0%) | 0.0 |
| 20 to 34 years | 2 (14.3%) | 41.0 |
| 35 to 50 years | 12 (85.7%) | 162.0 |
| Total | 14 (100.0%) | 93.0 |
Fertility by Age by Marriage Status in Cissna Park
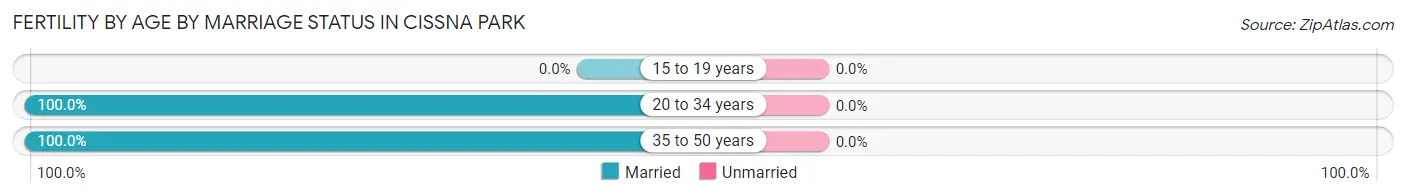
| Age Bracket | Married | Unmarried |
| 15 to 19 years | 0 (0.0%) | 0 (0.0%) |
| 20 to 34 years | 2 (100.0%) | 0 (0.0%) |
| 35 to 50 years | 12 (100.0%) | 0 (0.0%) |
| Total | 14 (100.0%) | 0 (0.0%) |
Fertility by Education in Cissna Park
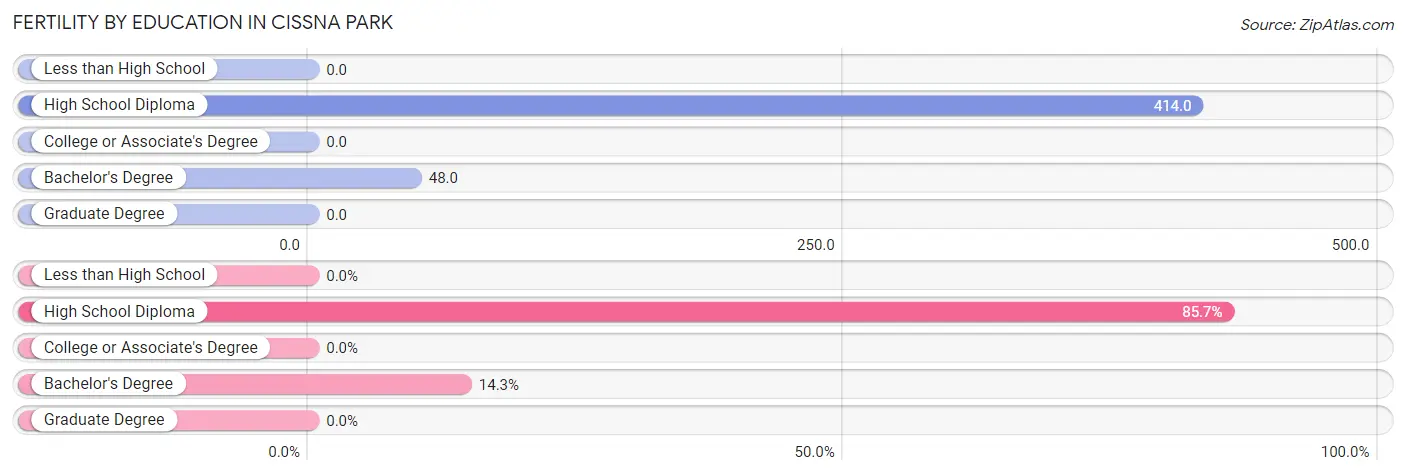
| Educational Attainment | Women with Births | Births / 1,000 Women |
| Less than High School | 0 (0.0%) | 0.0 |
| High School Diploma | 12 (85.7%) | 414.0 |
| College or Associate's Degree | 0 (0.0%) | 0.0 |
| Bachelor's Degree | 2 (14.3%) | 48.0 |
| Graduate Degree | 0 (0.0%) | 0.0 |
| Total | 14 (100.0%) | 93.0 |
Fertility by Education by Marriage Status in Cissna Park
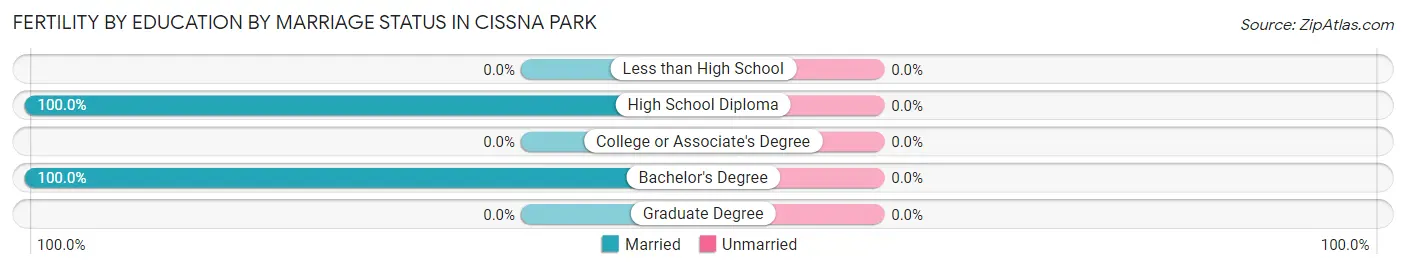
| Educational Attainment | Married | Unmarried |
| Less than High School | 0 (0.0%) | 0 (0.0%) |
| High School Diploma | 12 (100.0%) | 0 (0.0%) |
| College or Associate's Degree | 0 (0.0%) | 0 (0.0%) |
| Bachelor's Degree | 2 (100.0%) | 0 (0.0%) |
| Graduate Degree | 0 (0.0%) | 0 (0.0%) |
| Total | 14 (100.0%) | 0 (0.0%) |
Employment Characteristics in Cissna Park
Employment by Class of Employer in Cissna Park
Among the 341 employed individuals in Cissna Park, private company employees (192 | 56.3%), self-employed (not incorporated) (63 | 18.5%), and not-for-profit organizations (27 | 7.9%) make up the most common classes of employment.
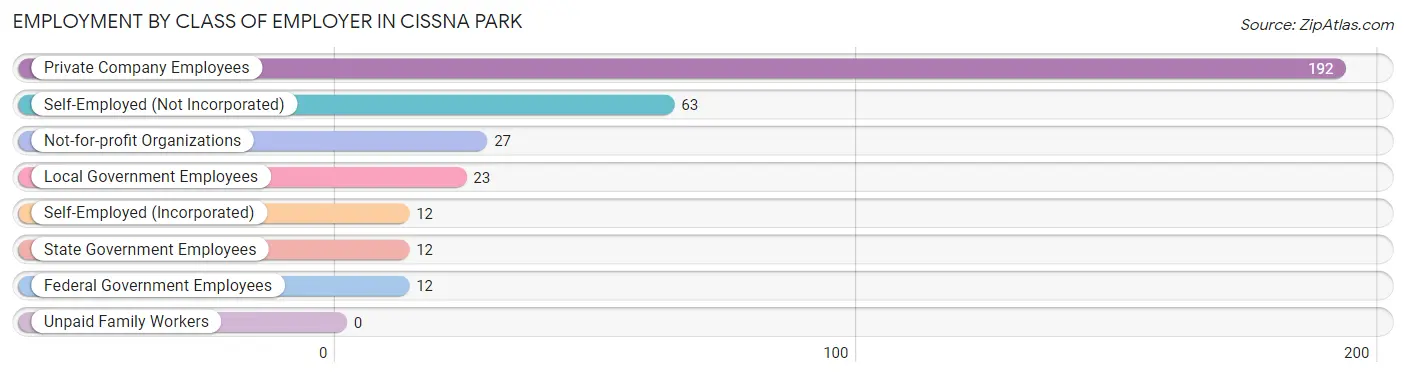
| Employer Class | # Employees | % Employees |
| Private Company Employees | 192 | 56.3% |
| Self-Employed (Incorporated) | 12 | 3.5% |
| Self-Employed (Not Incorporated) | 63 | 18.5% |
| Not-for-profit Organizations | 27 | 7.9% |
| Local Government Employees | 23 | 6.7% |
| State Government Employees | 12 | 3.5% |
| Federal Government Employees | 12 | 3.5% |
| Unpaid Family Workers | 0 | 0.0% |
| Total | 341 | 100.0% |
Employment Status by Age in Cissna Park
According to the labor force statistics for Cissna Park, out of the total population over 16 years of age (733), 46.7% or 342 individuals are in the labor force, with 0.3% or 1 of them unemployed. The age group with the highest labor force participation rate is 25 to 29 years, with 82.5% or 33 individuals in the labor force. Within the labor force, the 45 to 54 years age range has the highest percentage of unemployed individuals, with 1.8% or 1 of them being unemployed.
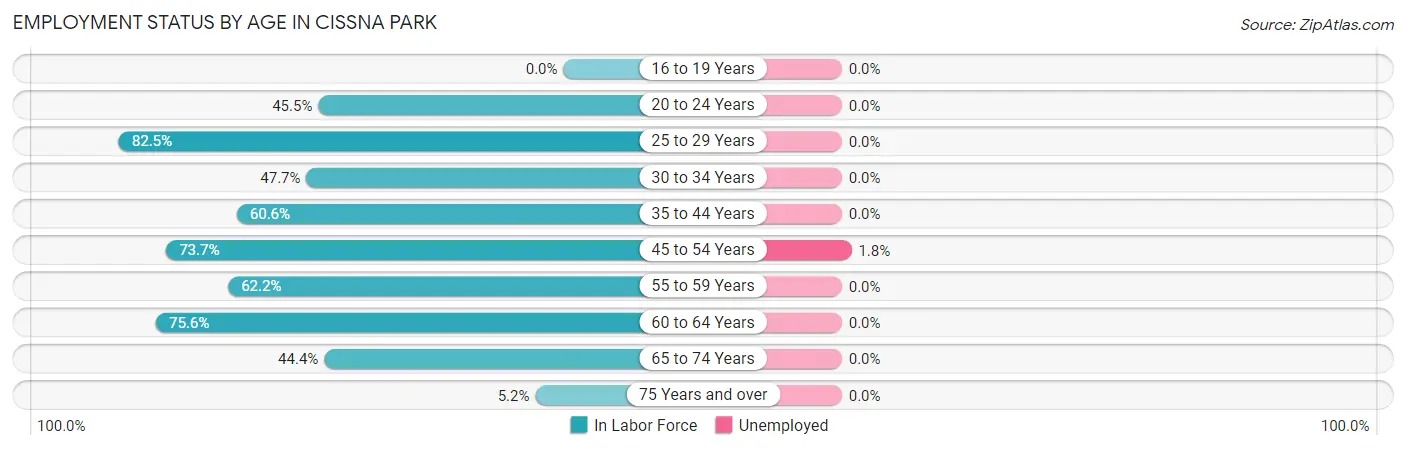
| Age Bracket | In Labor Force | Unemployed |
| 16 to 19 Years | 0 (0.0%) | 0 (0.0%) |
| 20 to 24 Years | 5 (45.5%) | 0 (0.0%) |
| 25 to 29 Years | 33 (82.5%) | 0 (0.0%) |
| 30 to 34 Years | 21 (47.7%) | 0 (0.0%) |
| 35 to 44 Years | 83 (60.6%) | 0 (0.0%) |
| 45 to 54 Years | 56 (73.7%) | 1 (1.8%) |
| 55 to 59 Years | 46 (62.2%) | 0 (0.0%) |
| 60 to 64 Years | 31 (75.6%) | 0 (0.0%) |
| 65 to 74 Years | 59 (44.4%) | 0 (0.0%) |
| 75 Years and over | 8 (5.2%) | 0 (0.0%) |
| Total | 342 (46.7%) | 1 (0.3%) |
Employment Status by Educational Attainment in Cissna Park
According to labor force statistics for Cissna Park, 65.5% of individuals (270) out of the total population between 25 and 64 years of age (412) are in the labor force, with 0.4% or 1 of them being unemployed. The group with the highest labor force participation rate are those with the educational attainment of college / associate degree, with 78.7% or 107 individuals in the labor force. Within the labor force, individuals with college / associate degree education have the highest percentage of unemployment, with 0.9% or 1 of them being unemployed.
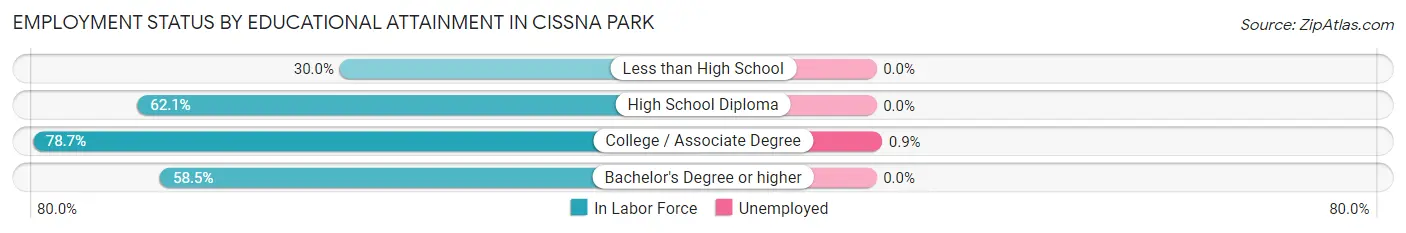
| Educational Attainment | In Labor Force | Unemployed |
| Less than High School | 3 (30.0%) | 0 (0.0%) |
| High School Diploma | 77 (62.1%) | 0 (0.0%) |
| College / Associate Degree | 107 (78.7%) | 1 (0.9%) |
| Bachelor's Degree or higher | 83 (58.5%) | 0 (0.0%) |
| Total | 270 (65.5%) | 2 (0.4%) |
Employment Occupations by Sex in Cissna Park
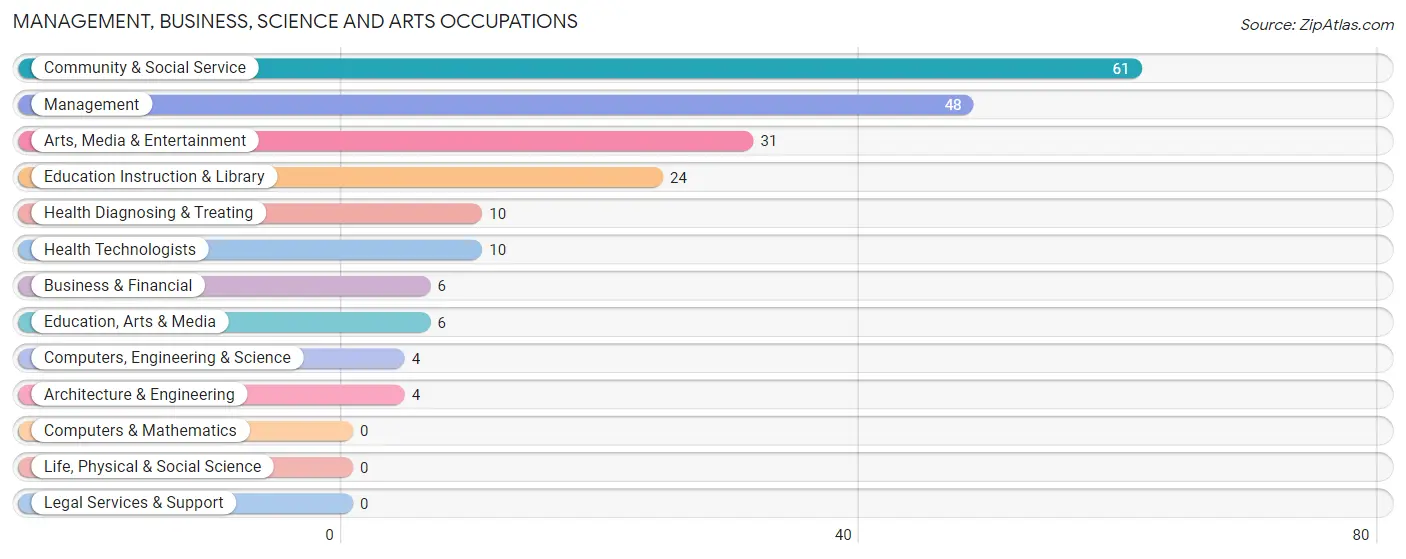
Management, Business, Science and Arts Occupations
The most common Management, Business, Science and Arts occupations in Cissna Park are Community & Social Service (61 | 17.9%), Management (48 | 14.1%), Arts, Media & Entertainment (31 | 9.1%), Education Instruction & Library (24 | 7.0%), and Health Diagnosing & Treating (10 | 2.9%).
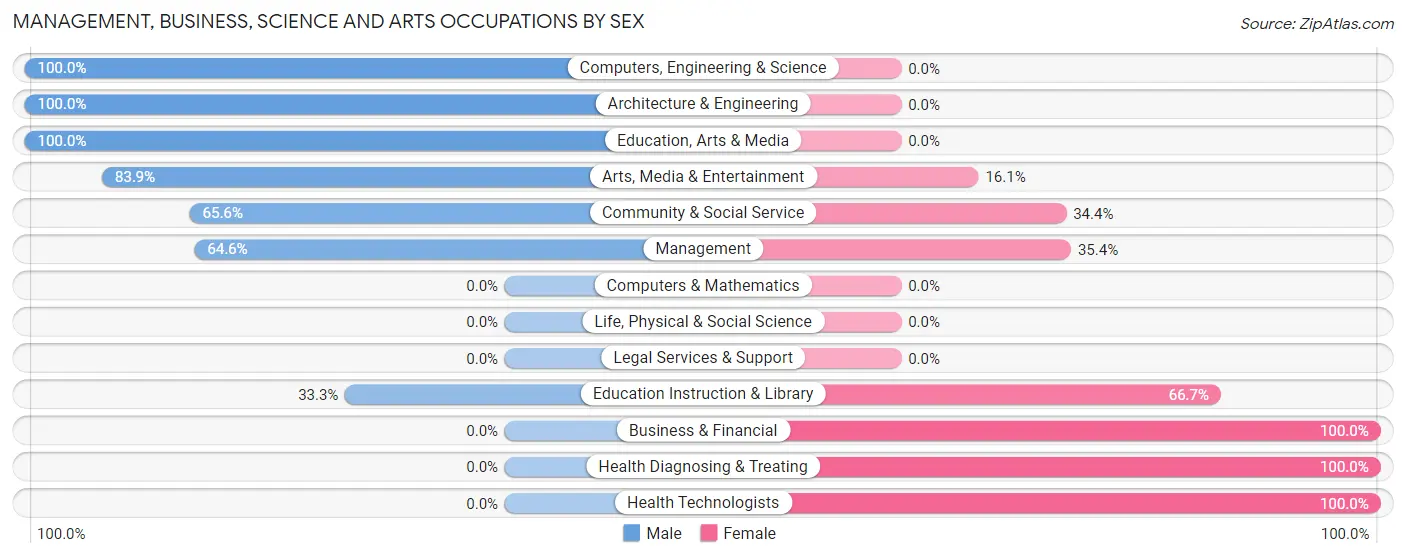
Management, Business, Science and Arts Occupations by Sex
Within the Management, Business, Science and Arts occupations in Cissna Park, the most male-oriented occupations are Computers, Engineering & Science (100.0%), Architecture & Engineering (100.0%), and Education, Arts & Media (100.0%), while the most female-oriented occupations are Business & Financial (100.0%), Health Diagnosing & Treating (100.0%), and Health Technologists (100.0%).
| Occupation | Male | Female |
| Management | 31 (64.6%) | 17 (35.4%) |
| Business & Financial | 0 (0.0%) | 6 (100.0%) |
| Computers, Engineering & Science | 4 (100.0%) | 0 (0.0%) |
| Computers & Mathematics | 0 (0.0%) | 0 (0.0%) |
| Architecture & Engineering | 4 (100.0%) | 0 (0.0%) |
| Life, Physical & Social Science | 0 (0.0%) | 0 (0.0%) |
| Community & Social Service | 40 (65.6%) | 21 (34.4%) |
| Education, Arts & Media | 6 (100.0%) | 0 (0.0%) |
| Legal Services & Support | 0 (0.0%) | 0 (0.0%) |
| Education Instruction & Library | 8 (33.3%) | 16 (66.7%) |
| Arts, Media & Entertainment | 26 (83.9%) | 5 (16.1%) |
| Health Diagnosing & Treating | 0 (0.0%) | 10 (100.0%) |
| Health Technologists | 0 (0.0%) | 10 (100.0%) |
| Total (Category) | 75 (58.1%) | 54 (41.9%) |
| Total (Overall) | 187 (54.8%) | 154 (45.2%) |
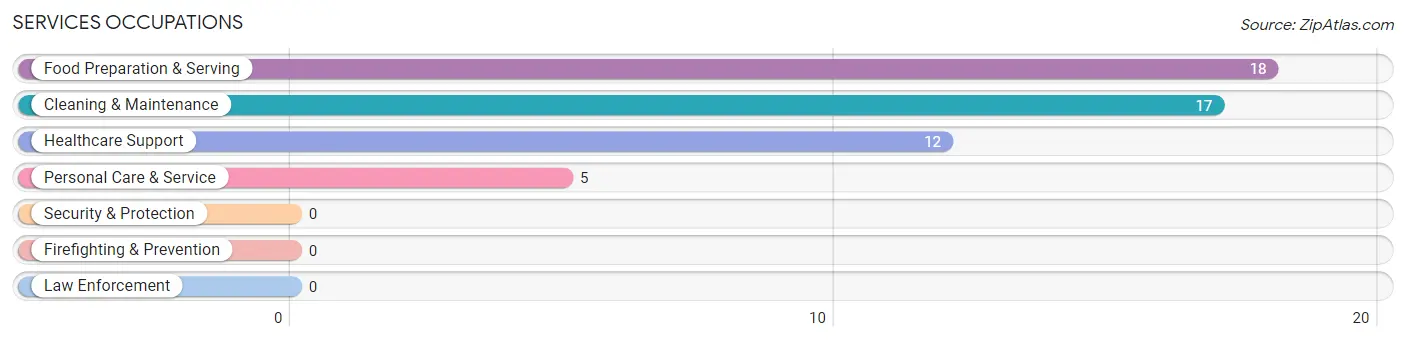
Services Occupations
The most common Services occupations in Cissna Park are Food Preparation & Serving (18 | 5.3%), Cleaning & Maintenance (17 | 5.0%), Healthcare Support (12 | 3.5%), and Personal Care & Service (5 | 1.5%).
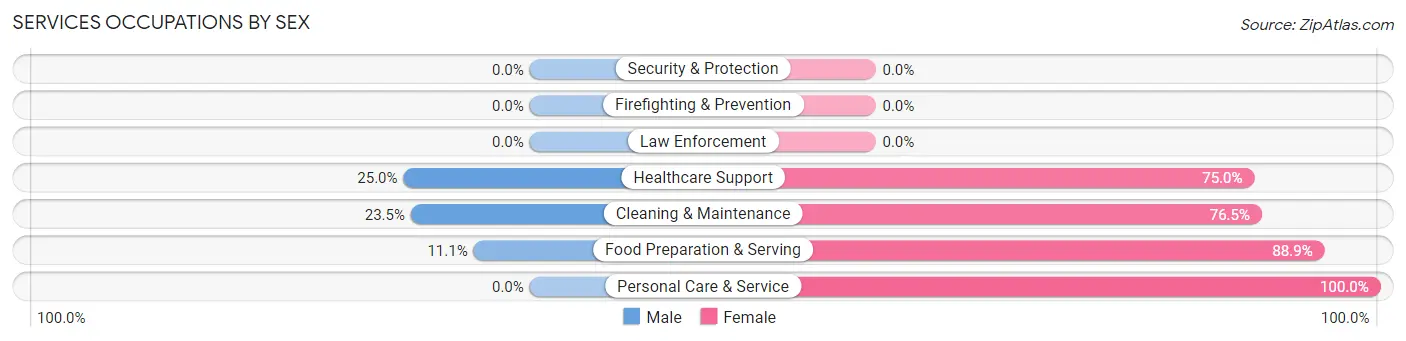
Services Occupations by Sex
Within the Services occupations in Cissna Park, the most male-oriented occupations are Healthcare Support (25.0%), Cleaning & Maintenance (23.5%), and Food Preparation & Serving (11.1%), while the most female-oriented occupations are Personal Care & Service (100.0%), Food Preparation & Serving (88.9%), and Cleaning & Maintenance (76.5%).
| Occupation | Male | Female |
| Healthcare Support | 3 (25.0%) | 9 (75.0%) |
| Security & Protection | 0 (0.0%) | 0 (0.0%) |
| Firefighting & Prevention | 0 (0.0%) | 0 (0.0%) |
| Law Enforcement | 0 (0.0%) | 0 (0.0%) |
| Food Preparation & Serving | 2 (11.1%) | 16 (88.9%) |
| Cleaning & Maintenance | 4 (23.5%) | 13 (76.5%) |
| Personal Care & Service | 0 (0.0%) | 5 (100.0%) |
| Total (Category) | 9 (17.3%) | 43 (82.7%) |
| Total (Overall) | 187 (54.8%) | 154 (45.2%) |
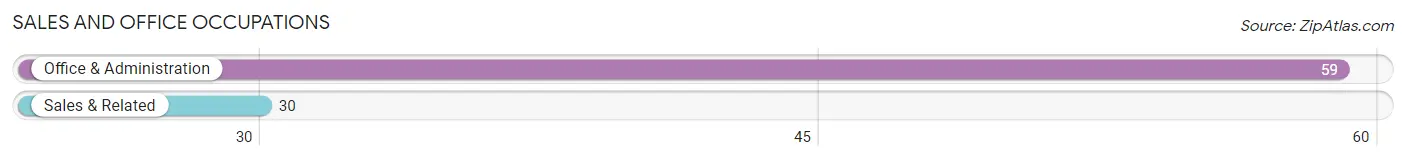
Sales and Office Occupations
The most common Sales and Office occupations in Cissna Park are Office & Administration (59 | 17.3%), and Sales & Related (30 | 8.8%).
Sales and Office Occupations by Sex
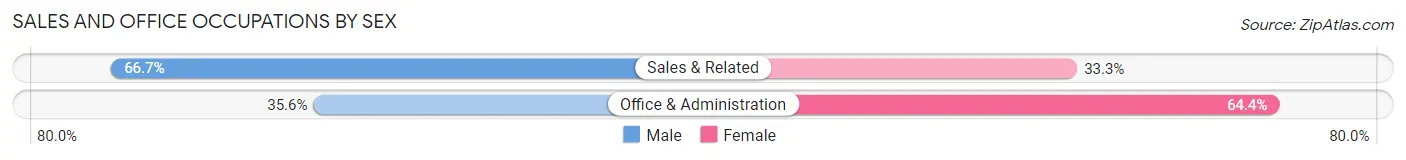
| Occupation | Male | Female |
| Sales & Related | 20 (66.7%) | 10 (33.3%) |
| Office & Administration | 21 (35.6%) | 38 (64.4%) |
| Total (Category) | 41 (46.1%) | 48 (53.9%) |
| Total (Overall) | 187 (54.8%) | 154 (45.2%) |
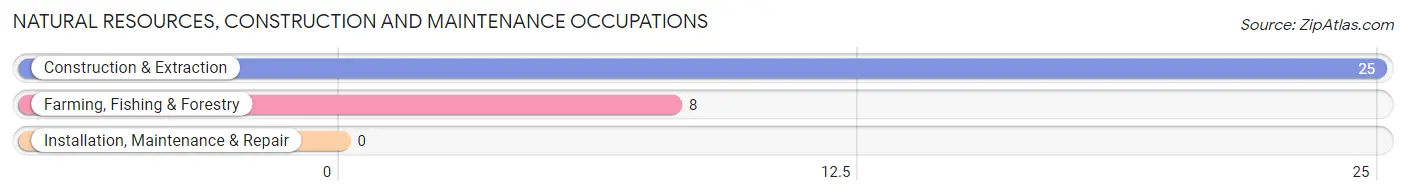
Natural Resources, Construction and Maintenance Occupations
The most common Natural Resources, Construction and Maintenance occupations in Cissna Park are Construction & Extraction (25 | 7.3%), and Farming, Fishing & Forestry (8 | 2.4%).
Natural Resources, Construction and Maintenance Occupations by Sex
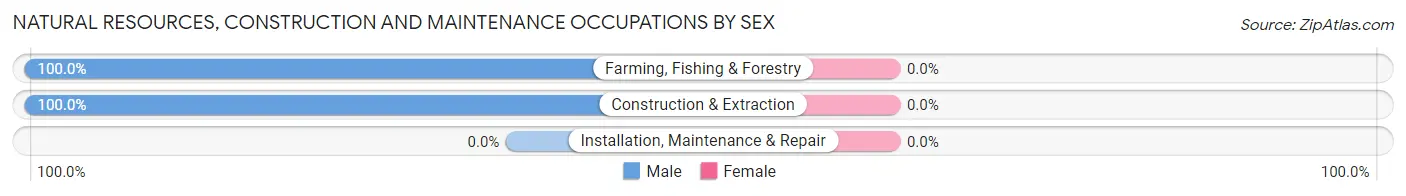
| Occupation | Male | Female |
| Farming, Fishing & Forestry | 8 (100.0%) | 0 (0.0%) |
| Construction & Extraction | 25 (100.0%) | 0 (0.0%) |
| Installation, Maintenance & Repair | 0 (0.0%) | 0 (0.0%) |
| Total (Category) | 33 (100.0%) | 0 (0.0%) |
| Total (Overall) | 187 (54.8%) | 154 (45.2%) |
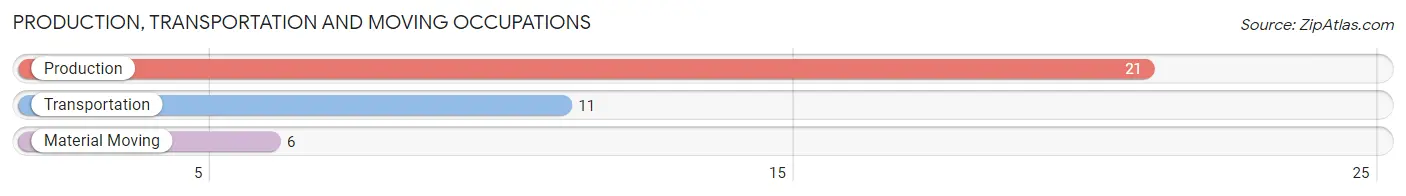
Production, Transportation and Moving Occupations
The most common Production, Transportation and Moving occupations in Cissna Park are Production (21 | 6.2%), Transportation (11 | 3.2%), and Material Moving (6 | 1.8%).
Production, Transportation and Moving Occupations by Sex
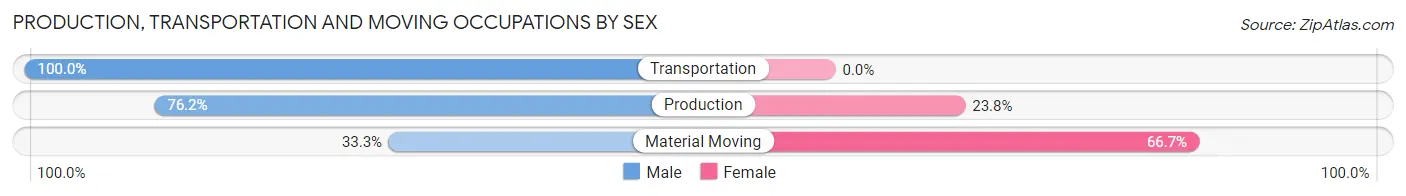
| Occupation | Male | Female |
| Production | 16 (76.2%) | 5 (23.8%) |
| Transportation | 11 (100.0%) | 0 (0.0%) |
| Material Moving | 2 (33.3%) | 4 (66.7%) |
| Total (Category) | 29 (76.3%) | 9 (23.7%) |
| Total (Overall) | 187 (54.8%) | 154 (45.2%) |
Employment Industries by Sex in Cissna Park
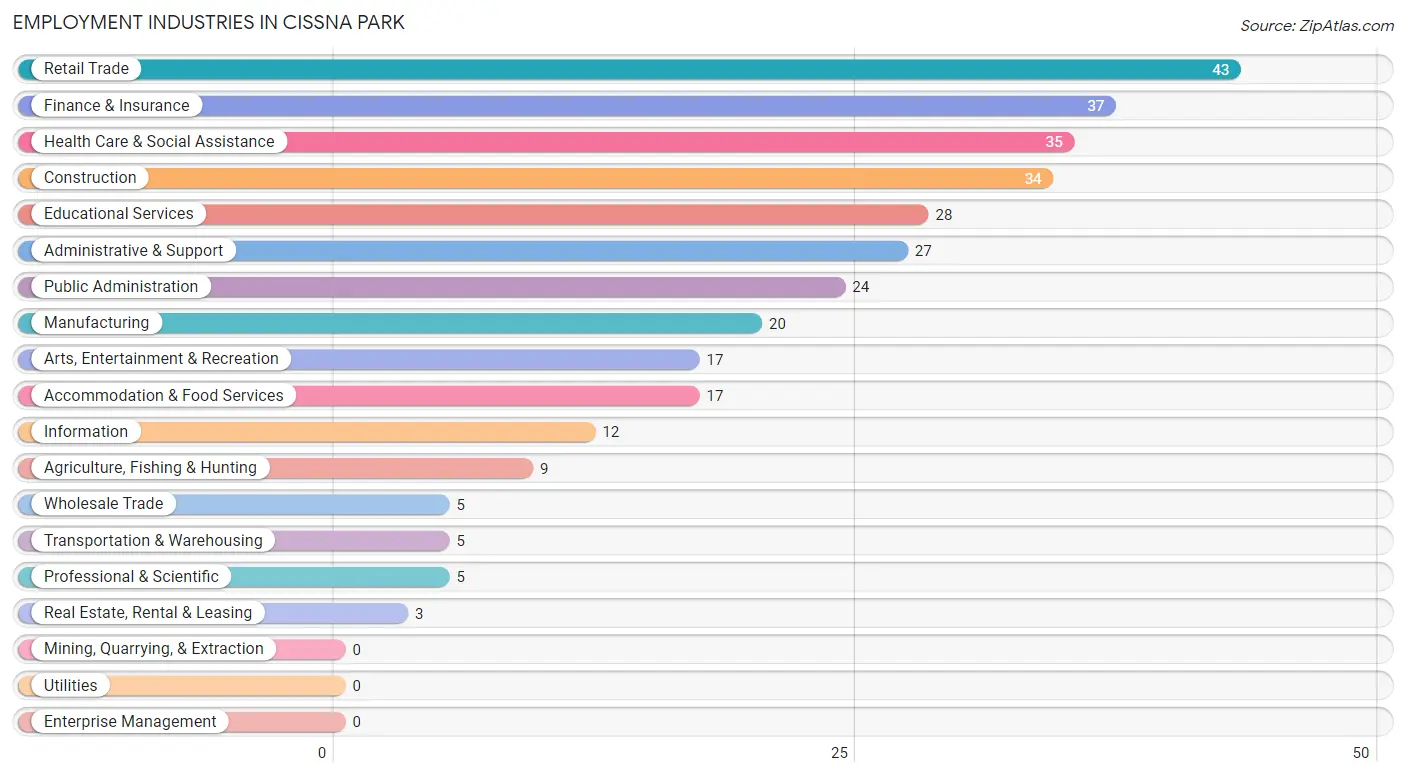
Employment Industries in Cissna Park
The major employment industries in Cissna Park include Retail Trade (43 | 12.6%), Finance & Insurance (37 | 10.8%), Health Care & Social Assistance (35 | 10.3%), Construction (34 | 10.0%), and Educational Services (28 | 8.2%).
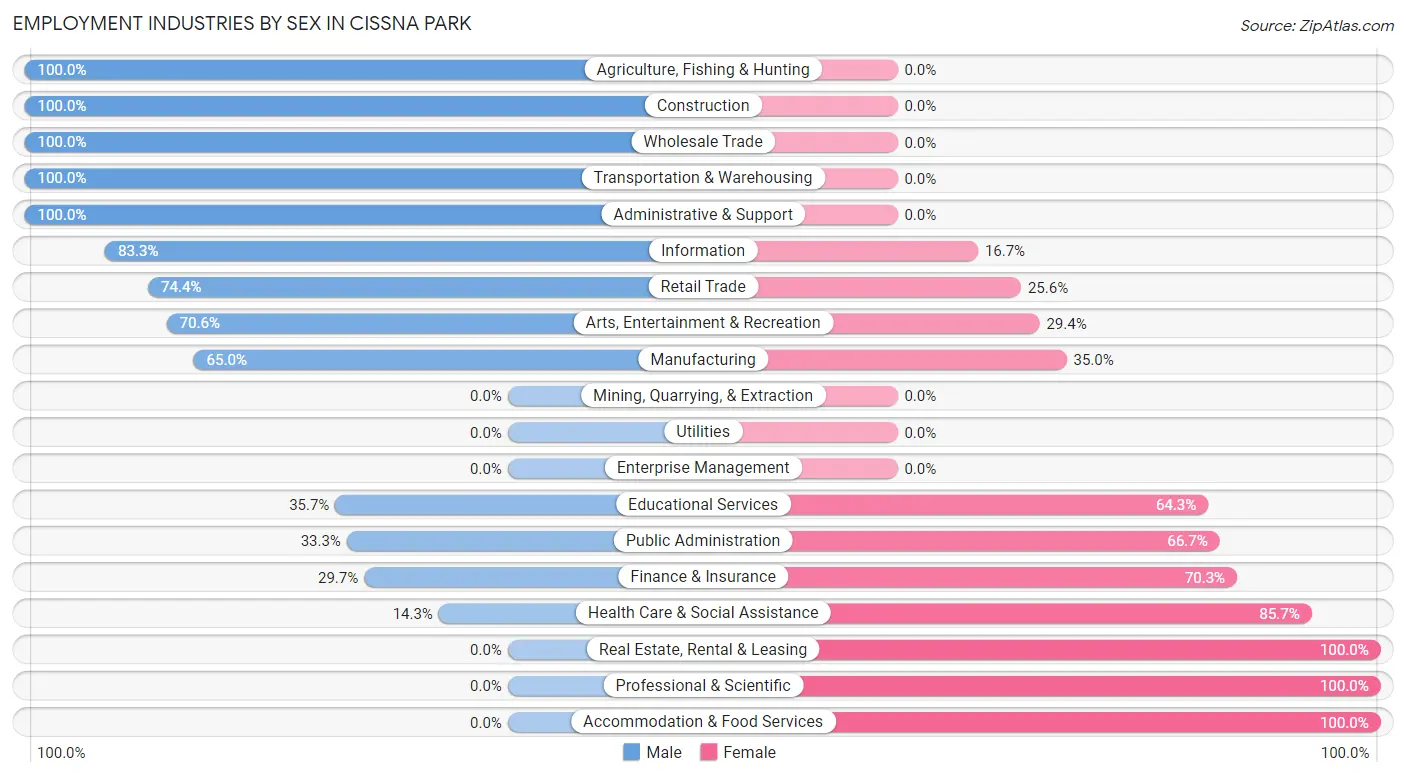
Employment Industries by Sex in Cissna Park
The Cissna Park industries that see more men than women are Agriculture, Fishing & Hunting (100.0%), Construction (100.0%), and Wholesale Trade (100.0%), whereas the industries that tend to have a higher number of women are Real Estate, Rental & Leasing (100.0%), Professional & Scientific (100.0%), and Accommodation & Food Services (100.0%).
| Industry | Male | Female |
| Agriculture, Fishing & Hunting | 9 (100.0%) | 0 (0.0%) |
| Mining, Quarrying, & Extraction | 0 (0.0%) | 0 (0.0%) |
| Construction | 34 (100.0%) | 0 (0.0%) |
| Manufacturing | 13 (65.0%) | 7 (35.0%) |
| Wholesale Trade | 5 (100.0%) | 0 (0.0%) |
| Retail Trade | 32 (74.4%) | 11 (25.6%) |
| Transportation & Warehousing | 5 (100.0%) | 0 (0.0%) |
| Utilities | 0 (0.0%) | 0 (0.0%) |
| Information | 10 (83.3%) | 2 (16.7%) |
| Finance & Insurance | 11 (29.7%) | 26 (70.3%) |
| Real Estate, Rental & Leasing | 0 (0.0%) | 3 (100.0%) |
| Professional & Scientific | 0 (0.0%) | 5 (100.0%) |
| Enterprise Management | 0 (0.0%) | 0 (0.0%) |
| Administrative & Support | 27 (100.0%) | 0 (0.0%) |
| Educational Services | 10 (35.7%) | 18 (64.3%) |
| Health Care & Social Assistance | 5 (14.3%) | 30 (85.7%) |
| Arts, Entertainment & Recreation | 12 (70.6%) | 5 (29.4%) |
| Accommodation & Food Services | 0 (0.0%) | 17 (100.0%) |
| Public Administration | 8 (33.3%) | 16 (66.7%) |
| Total | 187 (54.8%) | 154 (45.2%) |
Education in Cissna Park
School Enrollment in Cissna Park
The most common levels of schooling among the 142 students in Cissna Park are middle school (46 | 32.4%), high school (35 | 24.6%), and elementary school (27 | 19.0%).
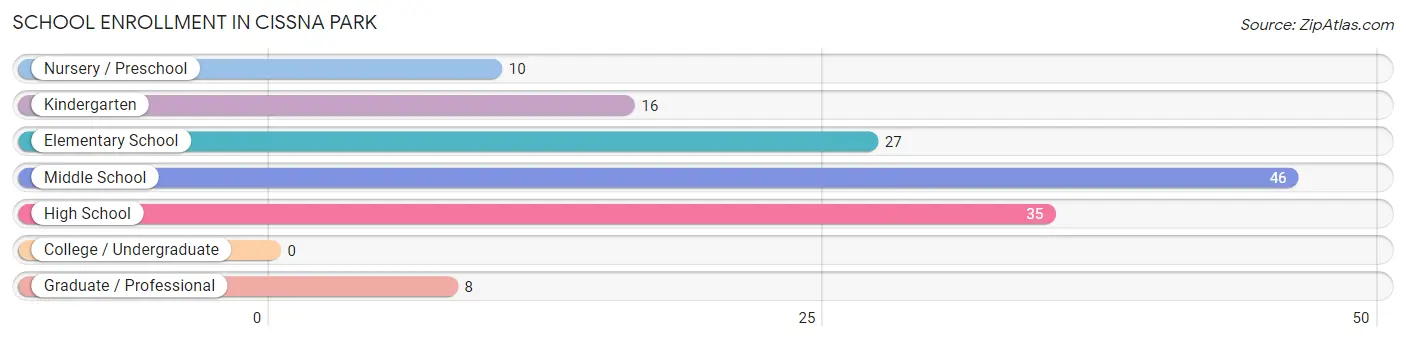
| School Level | # Students | % Students |
| Nursery / Preschool | 10 | 7.0% |
| Kindergarten | 16 | 11.3% |
| Elementary School | 27 | 19.0% |
| Middle School | 46 | 32.4% |
| High School | 35 | 24.6% |
| College / Undergraduate | 0 | 0.0% |
| Graduate / Professional | 8 | 5.6% |
| Total | 142 | 100.0% |
School Enrollment by Age by Funding Source in Cissna Park
Out of a total of 142 students who are enrolled in schools in Cissna Park, 18 (12.7%) attend a private institution, while the remaining 124 (87.3%) are enrolled in public schools. The age group of 3 to 4 year olds has the highest likelihood of being enrolled in private schools, with 4 (57.1% in the age bracket) enrolled. Conversely, the age group of 15 to 17 year olds has the lowest likelihood of being enrolled in a private school, with 18 (100.0% in the age bracket) attending a public institution.
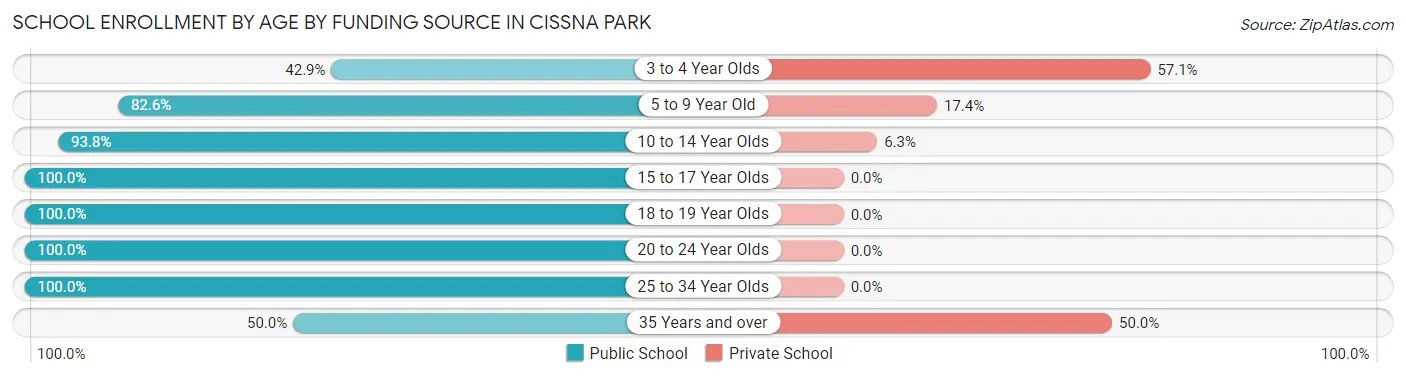
| Age Bracket | Public School | Private School |
| 3 to 4 Year Olds | 3 (42.9%) | 4 (57.1%) |
| 5 to 9 Year Old | 38 (82.6%) | 8 (17.4%) |
| 10 to 14 Year Olds | 45 (93.8%) | 3 (6.2%) |
| 15 to 17 Year Olds | 18 (100.0%) | 0 (0.0%) |
| 18 to 19 Year Olds | 10 (100.0%) | 0 (0.0%) |
| 20 to 24 Year Olds | 2 (100.0%) | 0 (0.0%) |
| 25 to 34 Year Olds | 5 (100.0%) | 0 (0.0%) |
| 35 Years and over | 3 (50.0%) | 3 (50.0%) |
| Total | 124 (87.3%) | 18 (12.7%) |
Educational Attainment by Field of Study in Cissna Park
Education (67 | 31.2%), business (41 | 19.1%), bio, nature & agricultural (31 | 14.4%), social sciences (13 | 6.0%), and liberal arts & history (13 | 6.0%) are the most common fields of study among 215 individuals in Cissna Park who have obtained a bachelor's degree or higher.
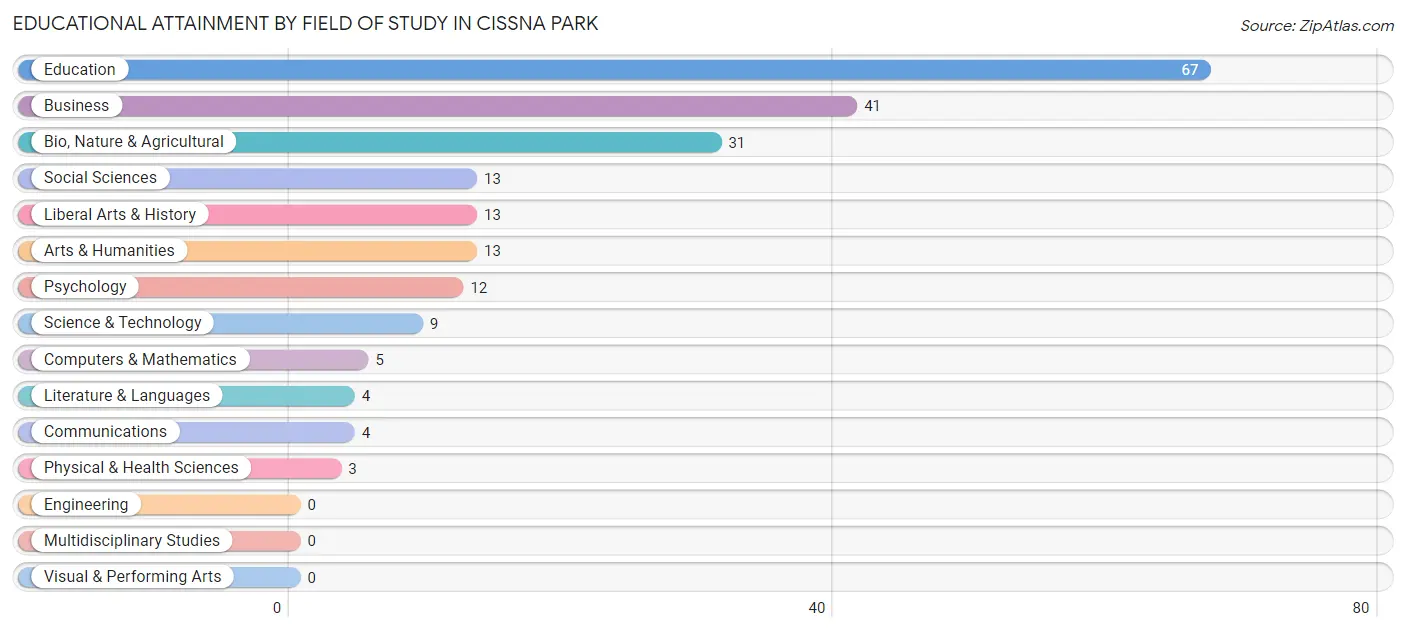
| Field of Study | # Graduates | % Graduates |
| Computers & Mathematics | 5 | 2.3% |
| Bio, Nature & Agricultural | 31 | 14.4% |
| Physical & Health Sciences | 3 | 1.4% |
| Psychology | 12 | 5.6% |
| Social Sciences | 13 | 6.0% |
| Engineering | 0 | 0.0% |
| Multidisciplinary Studies | 0 | 0.0% |
| Science & Technology | 9 | 4.2% |
| Business | 41 | 19.1% |
| Education | 67 | 31.2% |
| Literature & Languages | 4 | 1.9% |
| Liberal Arts & History | 13 | 6.0% |
| Visual & Performing Arts | 0 | 0.0% |
| Communications | 4 | 1.9% |
| Arts & Humanities | 13 | 6.0% |
| Total | 215 | 100.0% |
Transportation & Commute in Cissna Park
Vehicle Availability by Sex in Cissna Park
The most prevalent vehicle ownership categories in Cissna Park are males with 2 vehicles (96, accounting for 52.5%) and females with 2 vehicles (59, making up 62.3%).
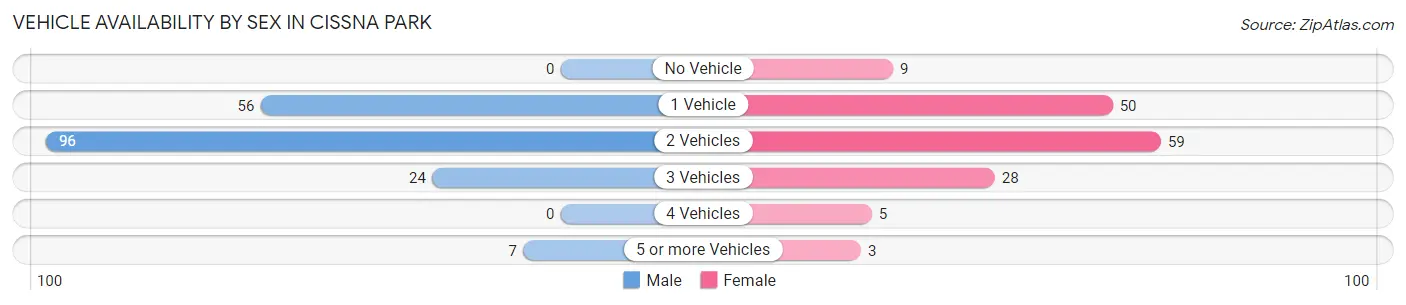
| Vehicles Available | Male | Female |
| No Vehicle | 0 (0.0%) | 9 (5.8%) |
| 1 Vehicle | 56 (30.6%) | 50 (32.5%) |
| 2 Vehicles | 96 (52.5%) | 59 (38.3%) |
| 3 Vehicles | 24 (13.1%) | 28 (18.2%) |
| 4 Vehicles | 0 (0.0%) | 5 (3.3%) |
| 5 or more Vehicles | 7 (3.8%) | 3 (1.9%) |
| Total | 183 (100.0%) | 154 (100.0%) |
Commute Time in Cissna Park
The most frequently occuring commute durations in Cissna Park are less than 5 minutes (64 commuters, 20.4%), 5 to 9 minutes (56 commuters, 17.9%), and 60 to 89 minutes (41 commuters, 13.1%).
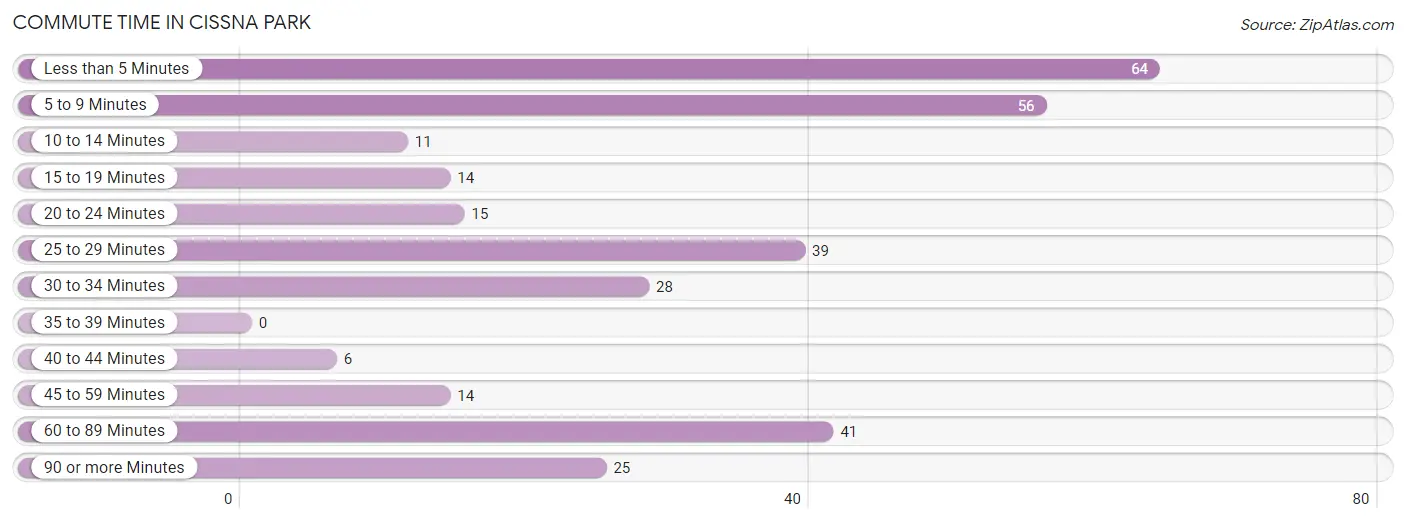
| Commute Time | # Commuters | % Commuters |
| Less than 5 Minutes | 64 | 20.4% |
| 5 to 9 Minutes | 56 | 17.9% |
| 10 to 14 Minutes | 11 | 3.5% |
| 15 to 19 Minutes | 14 | 4.5% |
| 20 to 24 Minutes | 15 | 4.8% |
| 25 to 29 Minutes | 39 | 12.5% |
| 30 to 34 Minutes | 28 | 8.9% |
| 35 to 39 Minutes | 0 | 0.0% |
| 40 to 44 Minutes | 6 | 1.9% |
| 45 to 59 Minutes | 14 | 4.5% |
| 60 to 89 Minutes | 41 | 13.1% |
| 90 or more Minutes | 25 | 8.0% |
Commute Time by Sex in Cissna Park
The most common commute times in Cissna Park are less than 5 minutes (53 commuters, 29.6%) for males and 5 to 9 minutes (24 commuters, 17.9%) for females.
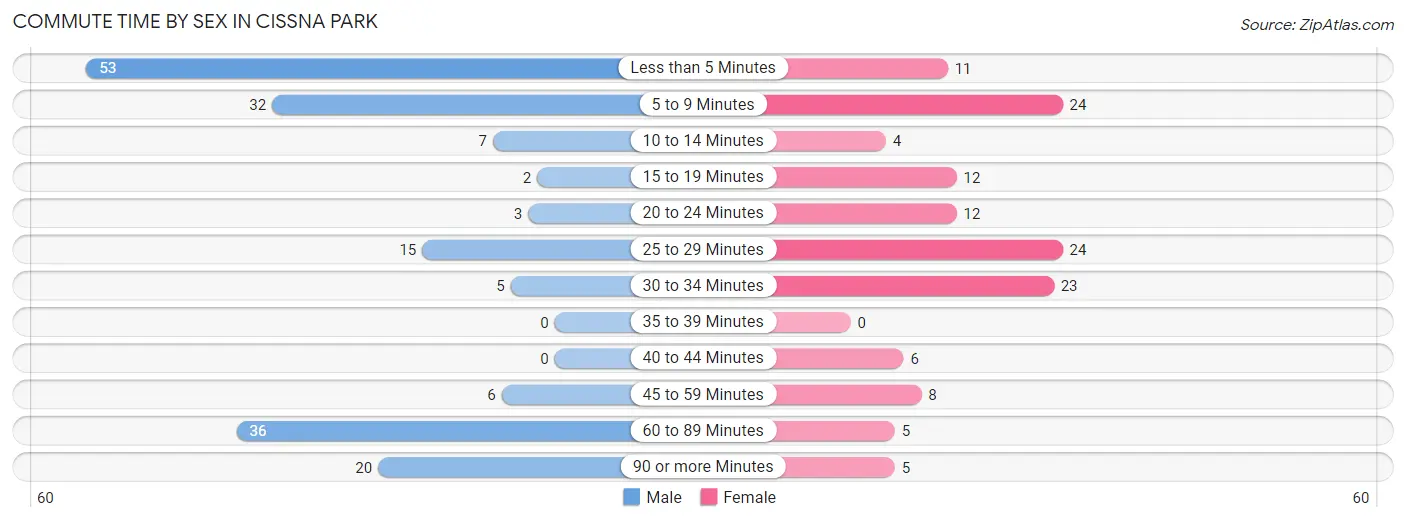
| Commute Time | Male | Female |
| Less than 5 Minutes | 53 (29.6%) | 11 (8.2%) |
| 5 to 9 Minutes | 32 (17.9%) | 24 (17.9%) |
| 10 to 14 Minutes | 7 (3.9%) | 4 (3.0%) |
| 15 to 19 Minutes | 2 (1.1%) | 12 (9.0%) |
| 20 to 24 Minutes | 3 (1.7%) | 12 (9.0%) |
| 25 to 29 Minutes | 15 (8.4%) | 24 (17.9%) |
| 30 to 34 Minutes | 5 (2.8%) | 23 (17.2%) |
| 35 to 39 Minutes | 0 (0.0%) | 0 (0.0%) |
| 40 to 44 Minutes | 0 (0.0%) | 6 (4.5%) |
| 45 to 59 Minutes | 6 (3.4%) | 8 (6.0%) |
| 60 to 89 Minutes | 36 (20.1%) | 5 (3.7%) |
| 90 or more Minutes | 20 (11.2%) | 5 (3.7%) |
Time of Departure to Work by Sex in Cissna Park
The most frequent times of departure to work in Cissna Park are 7:00 AM to 7:29 AM (38, 21.2%) for males and 8:00 AM to 8:29 AM (29, 21.6%) for females.
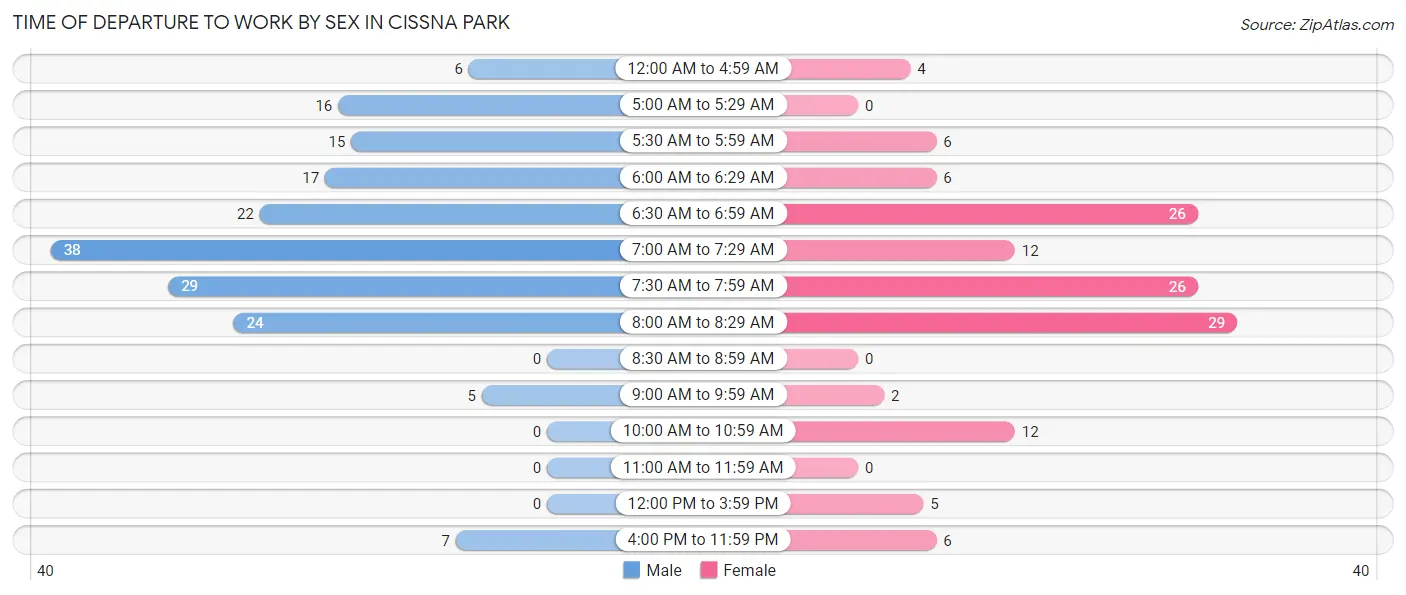
| Time of Departure | Male | Female |
| 12:00 AM to 4:59 AM | 6 (3.4%) | 4 (3.0%) |
| 5:00 AM to 5:29 AM | 16 (8.9%) | 0 (0.0%) |
| 5:30 AM to 5:59 AM | 15 (8.4%) | 6 (4.5%) |
| 6:00 AM to 6:29 AM | 17 (9.5%) | 6 (4.5%) |
| 6:30 AM to 6:59 AM | 22 (12.3%) | 26 (19.4%) |
| 7:00 AM to 7:29 AM | 38 (21.2%) | 12 (9.0%) |
| 7:30 AM to 7:59 AM | 29 (16.2%) | 26 (19.4%) |
| 8:00 AM to 8:29 AM | 24 (13.4%) | 29 (21.6%) |
| 8:30 AM to 8:59 AM | 0 (0.0%) | 0 (0.0%) |
| 9:00 AM to 9:59 AM | 5 (2.8%) | 2 (1.5%) |
| 10:00 AM to 10:59 AM | 0 (0.0%) | 12 (9.0%) |
| 11:00 AM to 11:59 AM | 0 (0.0%) | 0 (0.0%) |
| 12:00 PM to 3:59 PM | 0 (0.0%) | 5 (3.7%) |
| 4:00 PM to 11:59 PM | 7 (3.9%) | 6 (4.5%) |
| Total | 179 (100.0%) | 134 (100.0%) |
Housing Occupancy in Cissna Park
Occupancy by Ownership in Cissna Park
Of the total 433 dwellings in Cissna Park, owner-occupied units account for 301 (69.5%), while renter-occupied units make up 132 (30.5%).
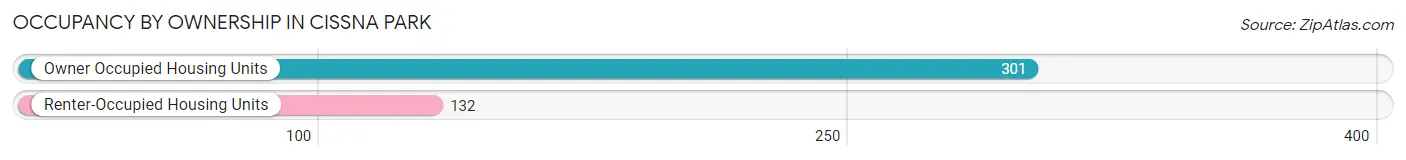
| Occupancy | # Housing Units | % Housing Units |
| Owner Occupied Housing Units | 301 | 69.5% |
| Renter-Occupied Housing Units | 132 | 30.5% |
| Total Occupied Housing Units | 433 | 100.0% |
Occupancy by Household Size in Cissna Park
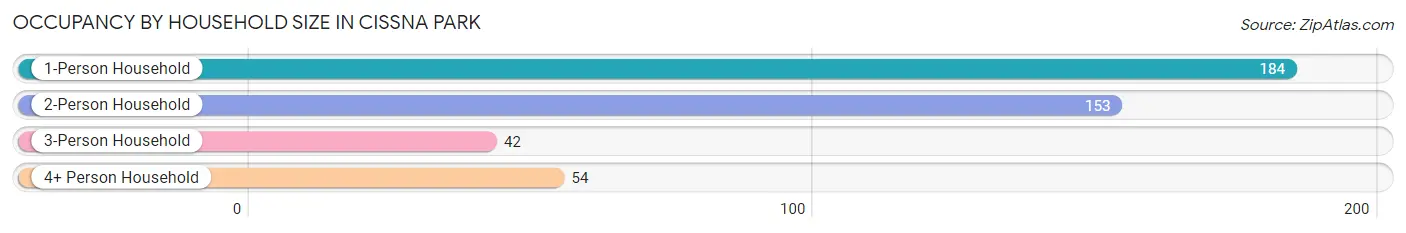
| Household Size | # Housing Units | % Housing Units |
| 1-Person Household | 184 | 42.5% |
| 2-Person Household | 153 | 35.3% |
| 3-Person Household | 42 | 9.7% |
| 4+ Person Household | 54 | 12.5% |
| Total Housing Units | 433 | 100.0% |
Occupancy by Ownership by Household Size in Cissna Park
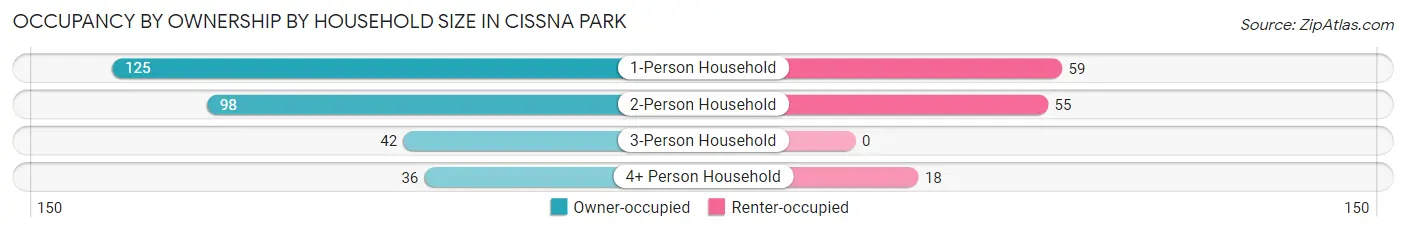
| Household Size | Owner-occupied | Renter-occupied |
| 1-Person Household | 125 (67.9%) | 59 (32.1%) |
| 2-Person Household | 98 (64.0%) | 55 (35.9%) |
| 3-Person Household | 42 (100.0%) | 0 (0.0%) |
| 4+ Person Household | 36 (66.7%) | 18 (33.3%) |
| Total Housing Units | 301 (69.5%) | 132 (30.5%) |
Occupancy by Educational Attainment in Cissna Park
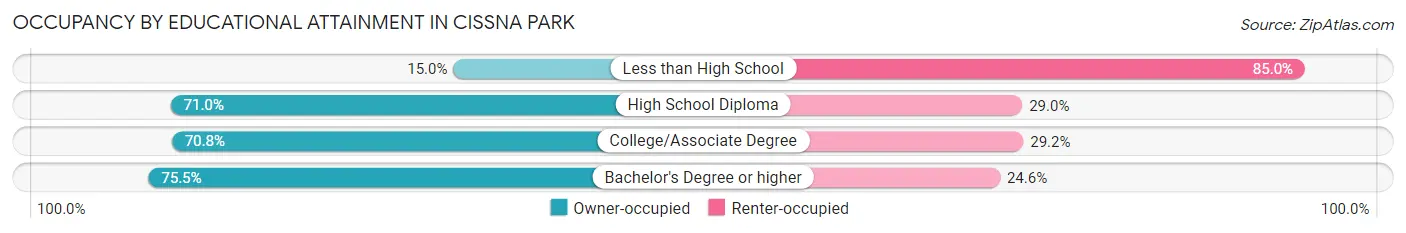
| Household Size | Owner-occupied | Renter-occupied |
| Less than High School | 3 (15.0%) | 17 (85.0%) |
| High School Diploma | 130 (71.0%) | 53 (29.0%) |
| College/Associate Degree | 85 (70.8%) | 35 (29.2%) |
| Bachelor's Degree or higher | 83 (75.4%) | 27 (24.5%) |
Occupancy by Age of Householder in Cissna Park
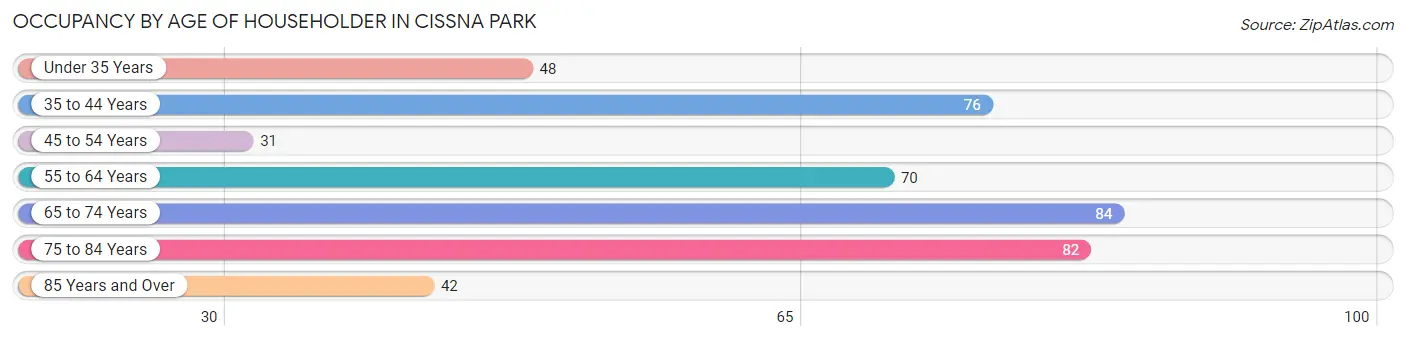
| Age Bracket | # Households | % Households |
| Under 35 Years | 48 | 11.1% |
| 35 to 44 Years | 76 | 17.5% |
| 45 to 54 Years | 31 | 7.2% |
| 55 to 64 Years | 70 | 16.2% |
| 65 to 74 Years | 84 | 19.4% |
| 75 to 84 Years | 82 | 18.9% |
| 85 Years and Over | 42 | 9.7% |
| Total | 433 | 100.0% |
Housing Finances in Cissna Park
Median Income by Occupancy in Cissna Park
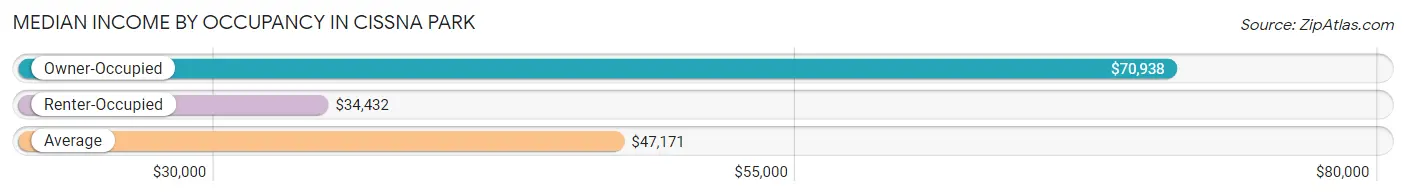
| Occupancy Type | # Households | Median Income |
| Owner-Occupied | 301 (69.5%) | $70,938 |
| Renter-Occupied | 132 (30.5%) | $34,432 |
| Average | 433 (100.0%) | $47,171 |
Occupancy by Householder Income Bracket in Cissna Park
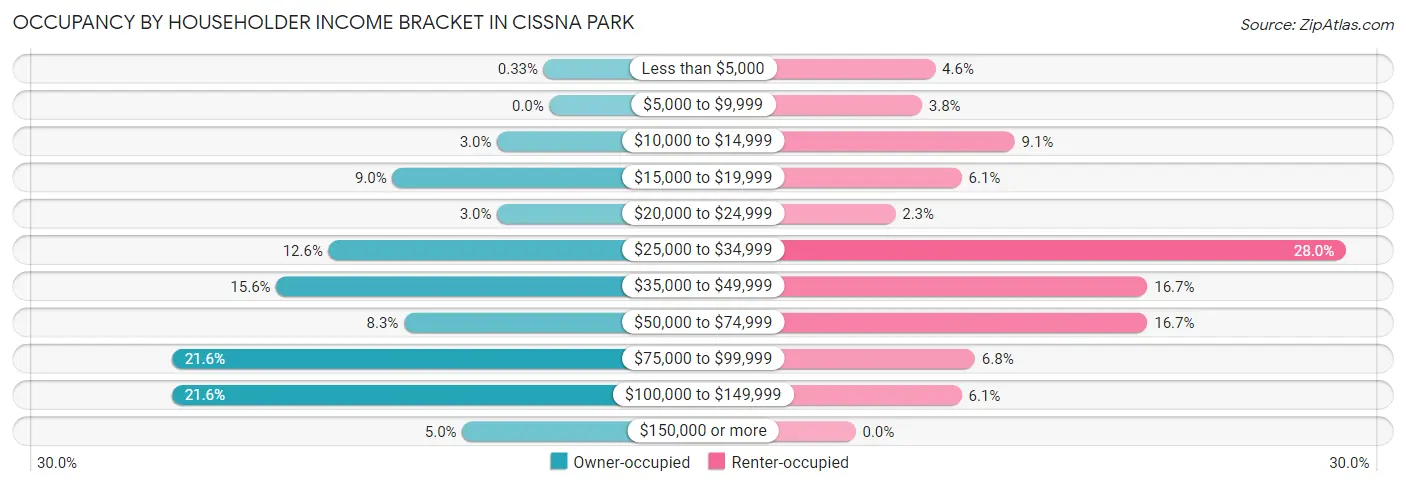
| Income Bracket | Owner-occupied | Renter-occupied |
| Less than $5,000 | 1 (0.3%) | 6 (4.5%) |
| $5,000 to $9,999 | 0 (0.0%) | 5 (3.8%) |
| $10,000 to $14,999 | 9 (3.0%) | 12 (9.1%) |
| $15,000 to $19,999 | 27 (9.0%) | 8 (6.1%) |
| $20,000 to $24,999 | 9 (3.0%) | 3 (2.3%) |
| $25,000 to $34,999 | 38 (12.6%) | 37 (28.0%) |
| $35,000 to $49,999 | 47 (15.6%) | 22 (16.7%) |
| $50,000 to $74,999 | 25 (8.3%) | 22 (16.7%) |
| $75,000 to $99,999 | 65 (21.6%) | 9 (6.8%) |
| $100,000 to $149,999 | 65 (21.6%) | 8 (6.1%) |
| $150,000 or more | 15 (5.0%) | 0 (0.0%) |
| Total | 301 (100.0%) | 132 (100.0%) |
Monthly Housing Cost Tiers in Cissna Park
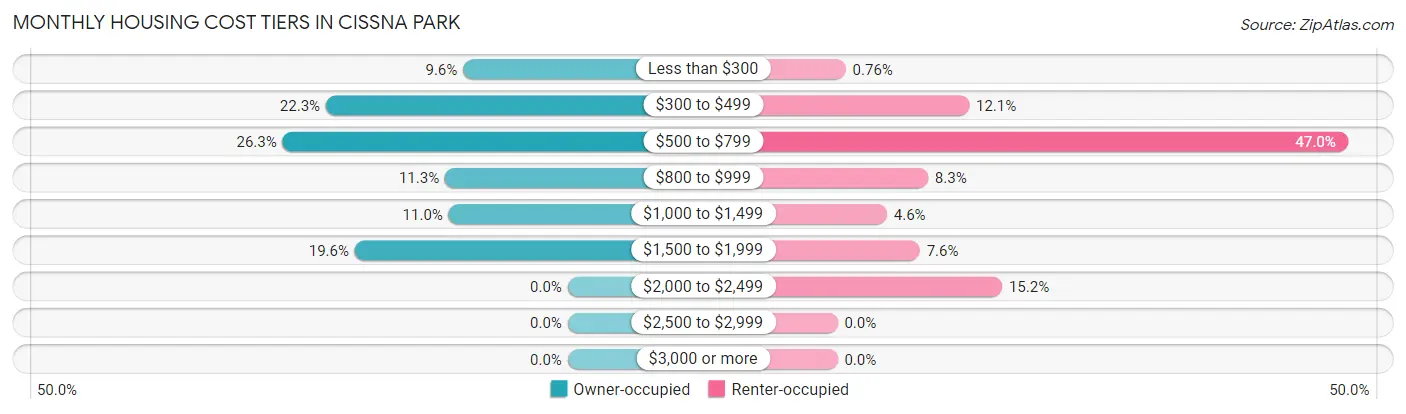
| Monthly Cost | Owner-occupied | Renter-occupied |
| Less than $300 | 29 (9.6%) | 1 (0.8%) |
| $300 to $499 | 67 (22.3%) | 16 (12.1%) |
| $500 to $799 | 79 (26.3%) | 62 (47.0%) |
| $800 to $999 | 34 (11.3%) | 11 (8.3%) |
| $1,000 to $1,499 | 33 (11.0%) | 6 (4.5%) |
| $1,500 to $1,999 | 59 (19.6%) | 10 (7.6%) |
| $2,000 to $2,499 | 0 (0.0%) | 20 (15.1%) |
| $2,500 to $2,999 | 0 (0.0%) | 0 (0.0%) |
| $3,000 or more | 0 (0.0%) | 0 (0.0%) |
| Total | 301 (100.0%) | 132 (100.0%) |
Physical Housing Characteristics in Cissna Park
Housing Structures in Cissna Park
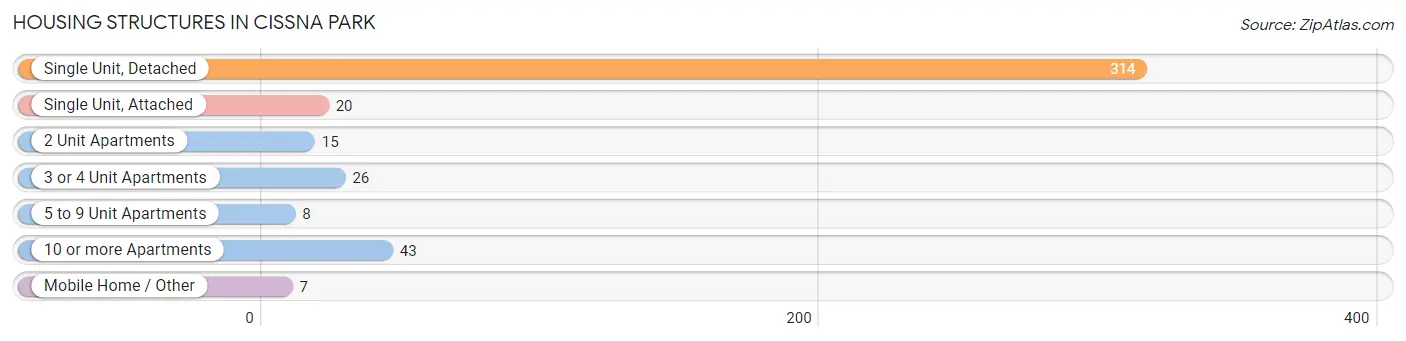
| Structure Type | # Housing Units | % Housing Units |
| Single Unit, Detached | 314 | 72.5% |
| Single Unit, Attached | 20 | 4.6% |
| 2 Unit Apartments | 15 | 3.5% |
| 3 or 4 Unit Apartments | 26 | 6.0% |
| 5 to 9 Unit Apartments | 8 | 1.8% |
| 10 or more Apartments | 43 | 9.9% |
| Mobile Home / Other | 7 | 1.6% |
| Total | 433 | 100.0% |
Housing Structures by Occupancy in Cissna Park
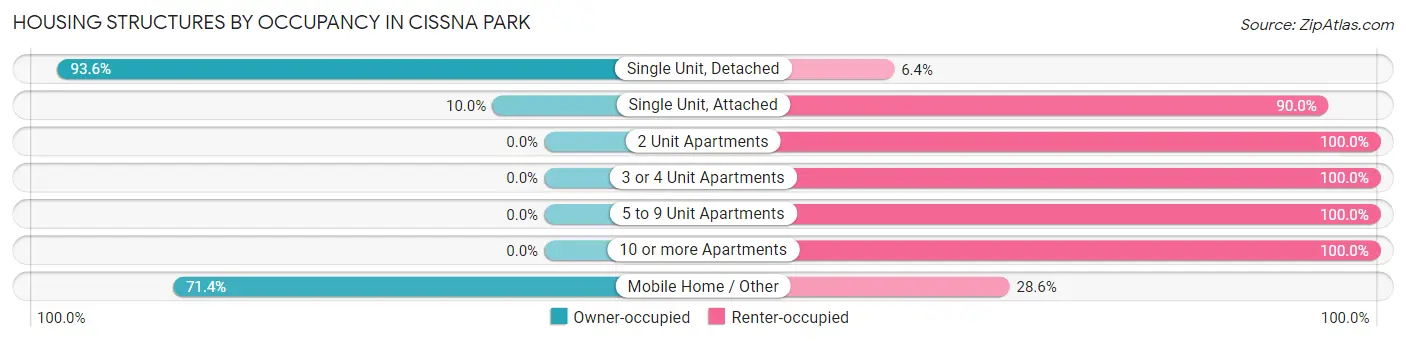
| Structure Type | Owner-occupied | Renter-occupied |
| Single Unit, Detached | 294 (93.6%) | 20 (6.4%) |
| Single Unit, Attached | 2 (10.0%) | 18 (90.0%) |
| 2 Unit Apartments | 0 (0.0%) | 15 (100.0%) |
| 3 or 4 Unit Apartments | 0 (0.0%) | 26 (100.0%) |
| 5 to 9 Unit Apartments | 0 (0.0%) | 8 (100.0%) |
| 10 or more Apartments | 0 (0.0%) | 43 (100.0%) |
| Mobile Home / Other | 5 (71.4%) | 2 (28.6%) |
| Total | 301 (69.5%) | 132 (30.5%) |
Housing Structures by Number of Rooms in Cissna Park
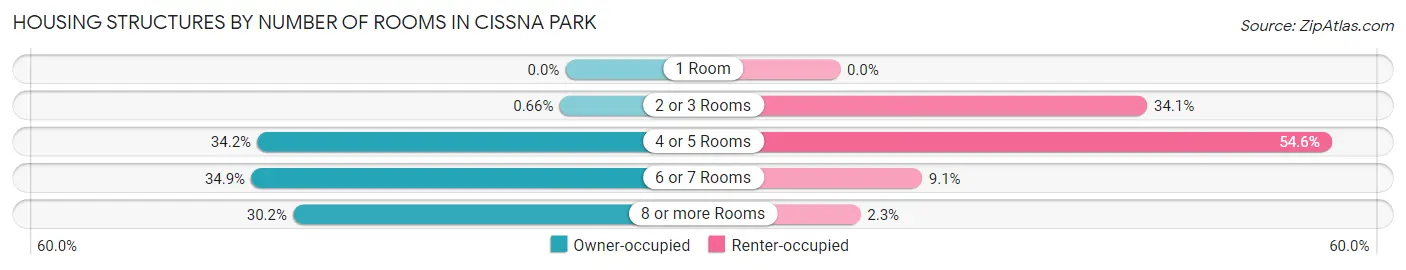
| Number of Rooms | Owner-occupied | Renter-occupied |
| 1 Room | 0 (0.0%) | 0 (0.0%) |
| 2 or 3 Rooms | 2 (0.7%) | 45 (34.1%) |
| 4 or 5 Rooms | 103 (34.2%) | 72 (54.5%) |
| 6 or 7 Rooms | 105 (34.9%) | 12 (9.1%) |
| 8 or more Rooms | 91 (30.2%) | 3 (2.3%) |
| Total | 301 (100.0%) | 132 (100.0%) |
Housing Structure by Heating Type in Cissna Park
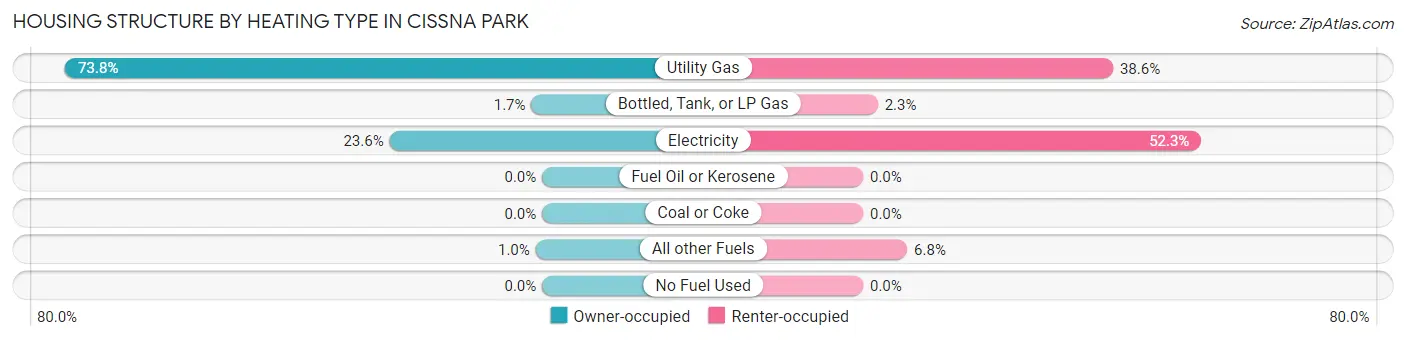
| Heating Type | Owner-occupied | Renter-occupied |
| Utility Gas | 222 (73.8%) | 51 (38.6%) |
| Bottled, Tank, or LP Gas | 5 (1.7%) | 3 (2.3%) |
| Electricity | 71 (23.6%) | 69 (52.3%) |
| Fuel Oil or Kerosene | 0 (0.0%) | 0 (0.0%) |
| Coal or Coke | 0 (0.0%) | 0 (0.0%) |
| All other Fuels | 3 (1.0%) | 9 (6.8%) |
| No Fuel Used | 0 (0.0%) | 0 (0.0%) |
| Total | 301 (100.0%) | 132 (100.0%) |
Household Vehicle Usage in Cissna Park
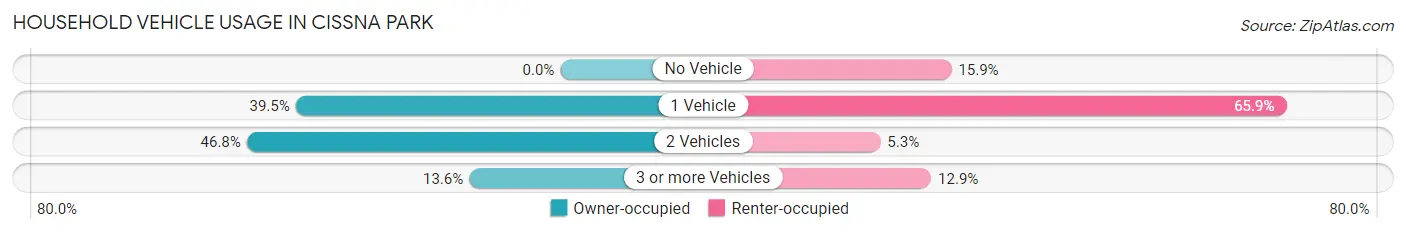
| Vehicles per Household | Owner-occupied | Renter-occupied |
| No Vehicle | 0 (0.0%) | 21 (15.9%) |
| 1 Vehicle | 119 (39.5%) | 87 (65.9%) |
| 2 Vehicles | 141 (46.8%) | 7 (5.3%) |
| 3 or more Vehicles | 41 (13.6%) | 17 (12.9%) |
| Total | 301 (100.0%) | 132 (100.0%) |
Real Estate & Mortgages in Cissna Park
Real Estate and Mortgage Overview in Cissna Park
| Characteristic | Without Mortgage | With Mortgage |
| Housing Units | 163 | 138 |
| Median Property Value | $107,400 | $121,700 |
| Median Household Income | $47,321 | $13 |
| Monthly Housing Costs | $462 | $0 |
| Real Estate Taxes | $2,064 | $12 |
Property Value by Mortgage Status in Cissna Park
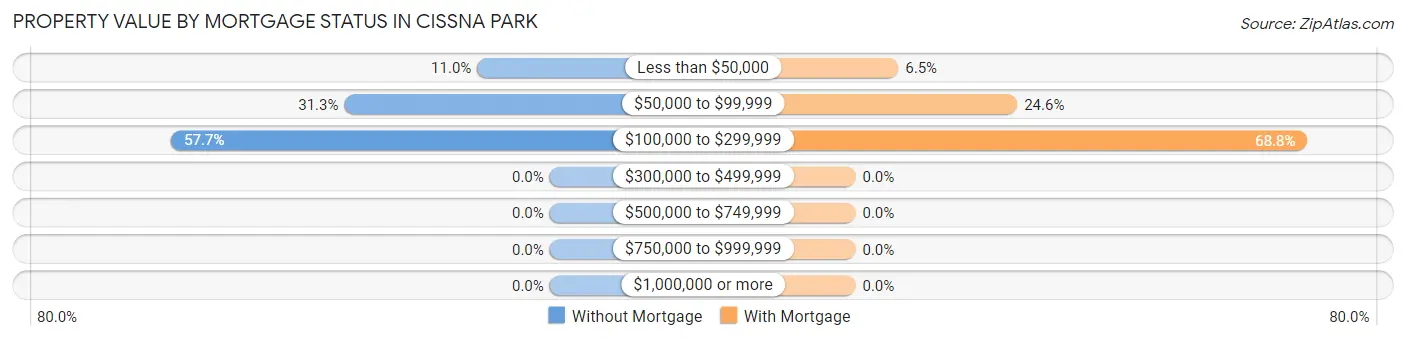
| Property Value | Without Mortgage | With Mortgage |
| Less than $50,000 | 18 (11.0%) | 9 (6.5%) |
| $50,000 to $99,999 | 51 (31.3%) | 34 (24.6%) |
| $100,000 to $299,999 | 94 (57.7%) | 95 (68.8%) |
| $300,000 to $499,999 | 0 (0.0%) | 0 (0.0%) |
| $500,000 to $749,999 | 0 (0.0%) | 0 (0.0%) |
| $750,000 to $999,999 | 0 (0.0%) | 0 (0.0%) |
| $1,000,000 or more | 0 (0.0%) | 0 (0.0%) |
| Total | 163 (100.0%) | 138 (100.0%) |
Household Income by Mortgage Status in Cissna Park
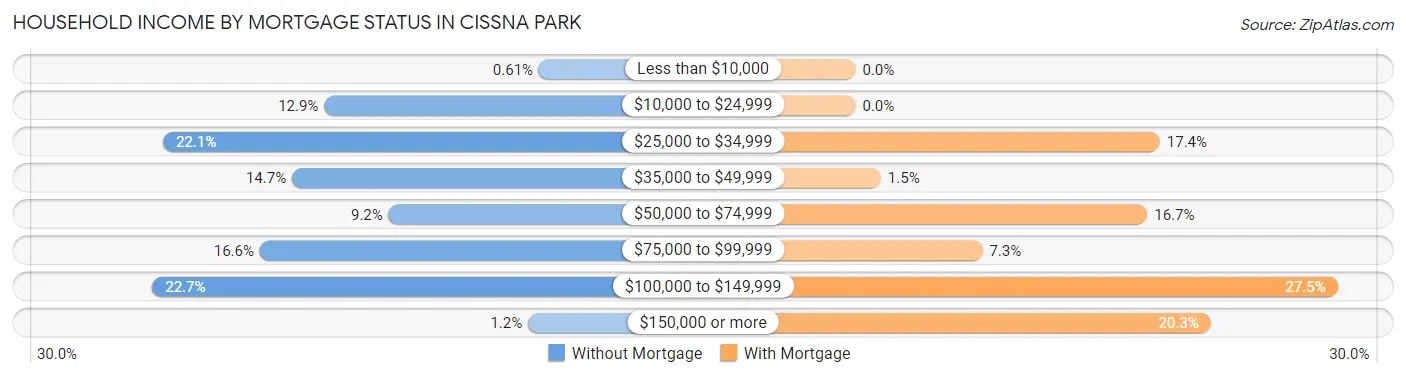
| Household Income | Without Mortgage | With Mortgage |
| Less than $10,000 | 1 (0.6%) | 0 (0.0%) |
| $10,000 to $24,999 | 21 (12.9%) | 0 (0.0%) |
| $25,000 to $34,999 | 36 (22.1%) | 24 (17.4%) |
| $35,000 to $49,999 | 24 (14.7%) | 2 (1.5%) |
| $50,000 to $74,999 | 15 (9.2%) | 23 (16.7%) |
| $75,000 to $99,999 | 27 (16.6%) | 10 (7.2%) |
| $100,000 to $149,999 | 37 (22.7%) | 38 (27.5%) |
| $150,000 or more | 2 (1.2%) | 28 (20.3%) |
| Total | 163 (100.0%) | 138 (100.0%) |
Property Value to Household Income Ratio in Cissna Park
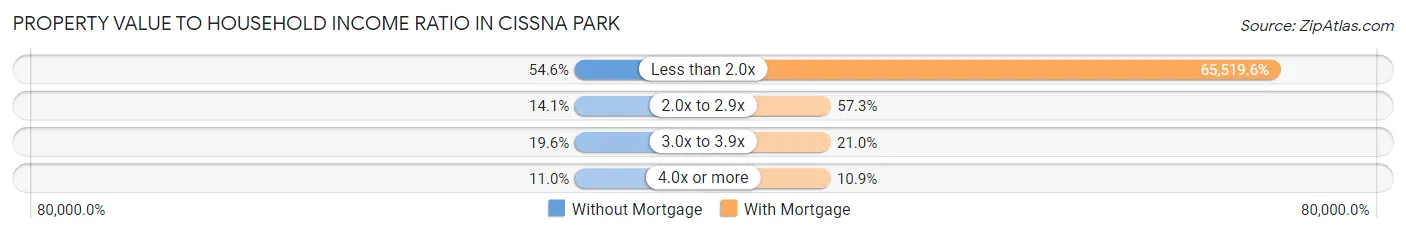
| Value-to-Income Ratio | Without Mortgage | With Mortgage |
| Less than 2.0x | 89 (54.6%) | 90,417 (65,519.6%) |
| 2.0x to 2.9x | 23 (14.1%) | 79 (57.3%) |
| 3.0x to 3.9x | 32 (19.6%) | 29 (21.0%) |
| 4.0x or more | 18 (11.0%) | 15 (10.9%) |
| Total | 163 (100.0%) | 138 (100.0%) |
Real Estate Taxes by Mortgage Status in Cissna Park
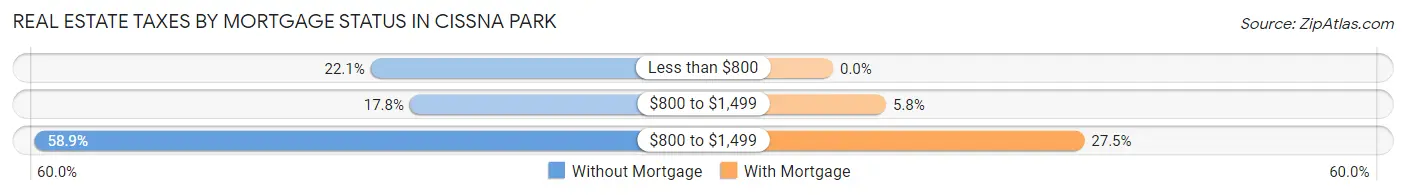
| Property Taxes | Without Mortgage | With Mortgage |
| Less than $800 | 36 (22.1%) | 0 (0.0%) |
| $800 to $1,499 | 29 (17.8%) | 8 (5.8%) |
| $800 to $1,499 | 96 (58.9%) | 38 (27.5%) |
| Total | 163 (100.0%) | 138 (100.0%) |
Health & Disability in Cissna Park
Health Insurance Coverage by Age in Cissna Park
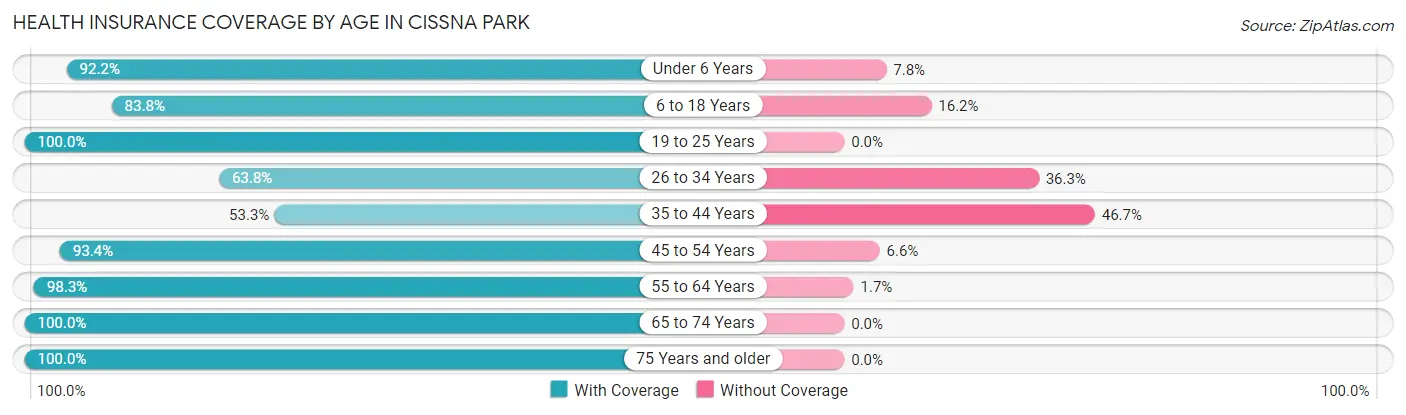
| Age Bracket | With Coverage | Without Coverage |
| Under 6 Years | 47 (92.2%) | 4 (7.8%) |
| 6 to 18 Years | 98 (83.8%) | 19 (16.2%) |
| 19 to 25 Years | 18 (100.0%) | 0 (0.0%) |
| 26 to 34 Years | 51 (63.7%) | 29 (36.2%) |
| 35 to 44 Years | 73 (53.3%) | 64 (46.7%) |
| 45 to 54 Years | 71 (93.4%) | 5 (6.6%) |
| 55 to 64 Years | 113 (98.3%) | 2 (1.7%) |
| 65 to 74 Years | 133 (100.0%) | 0 (0.0%) |
| 75 Years and older | 155 (100.0%) | 0 (0.0%) |
| Total | 759 (86.1%) | 123 (14.0%) |
Health Insurance Coverage by Citizenship Status in Cissna Park
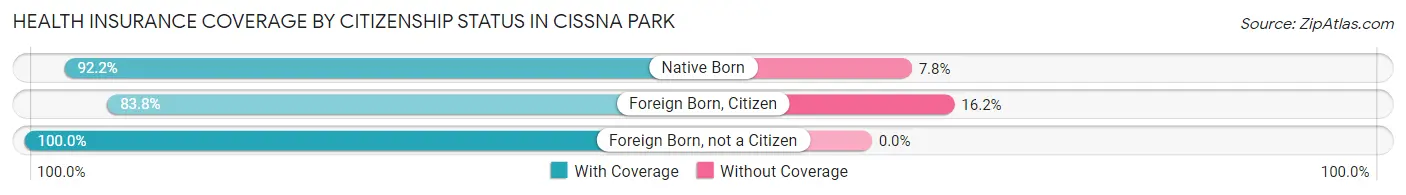
| Citizenship Status | With Coverage | Without Coverage |
| Native Born | 47 (92.2%) | 4 (7.8%) |
| Foreign Born, Citizen | 98 (83.8%) | 19 (16.2%) |
| Foreign Born, not a Citizen | 18 (100.0%) | 0 (0.0%) |
Health Insurance Coverage by Household Income in Cissna Park
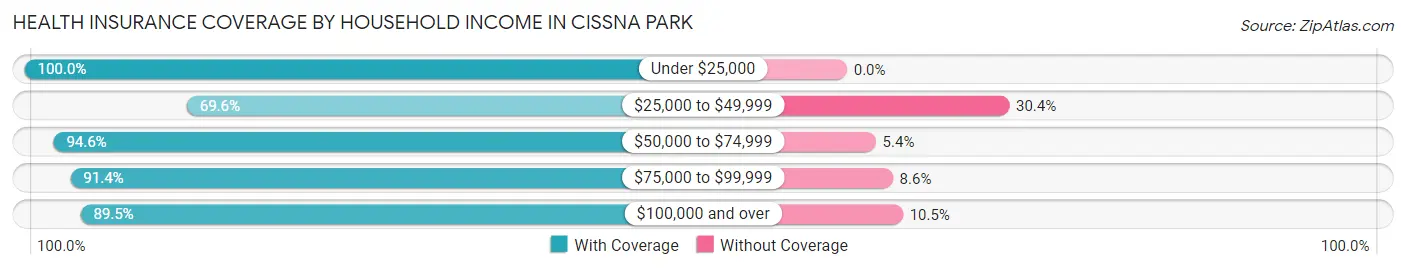
| Household Income | With Coverage | Without Coverage |
| Under $25,000 | 107 (100.0%) | 0 (0.0%) |
| $25,000 to $49,999 | 174 (69.6%) | 76 (30.4%) |
| $50,000 to $74,999 | 70 (94.6%) | 4 (5.4%) |
| $75,000 to $99,999 | 149 (91.4%) | 14 (8.6%) |
| $100,000 and over | 248 (89.5%) | 29 (10.5%) |
Public vs Private Health Insurance Coverage by Age in Cissna Park
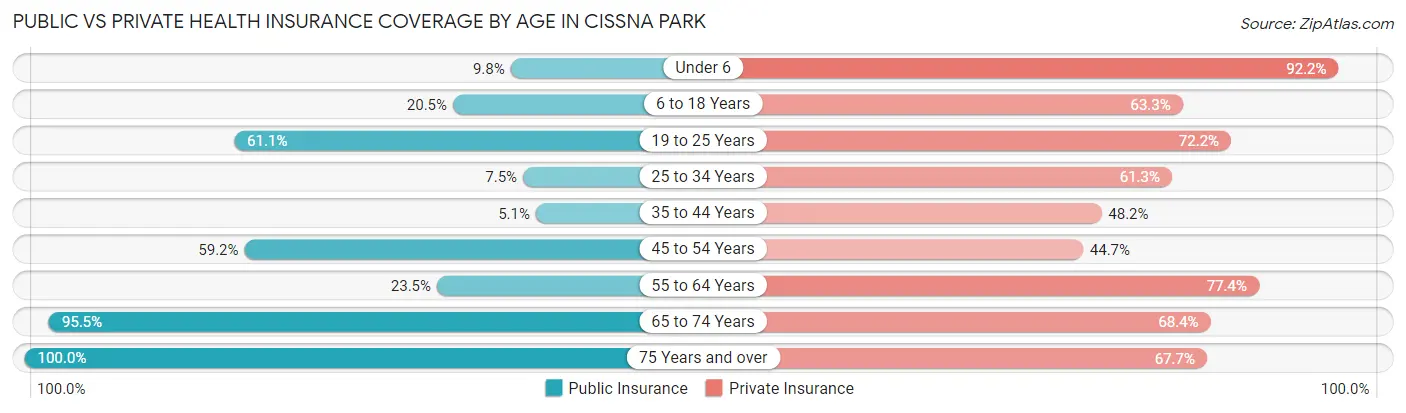
| Age Bracket | Public Insurance | Private Insurance |
| Under 6 | 5 (9.8%) | 47 (92.2%) |
| 6 to 18 Years | 24 (20.5%) | 74 (63.2%) |
| 19 to 25 Years | 11 (61.1%) | 13 (72.2%) |
| 25 to 34 Years | 6 (7.5%) | 49 (61.3%) |
| 35 to 44 Years | 7 (5.1%) | 66 (48.2%) |
| 45 to 54 Years | 45 (59.2%) | 34 (44.7%) |
| 55 to 64 Years | 27 (23.5%) | 89 (77.4%) |
| 65 to 74 Years | 127 (95.5%) | 91 (68.4%) |
| 75 Years and over | 155 (100.0%) | 105 (67.7%) |
| Total | 407 (46.2%) | 568 (64.4%) |
Disability Status by Sex by Age in Cissna Park
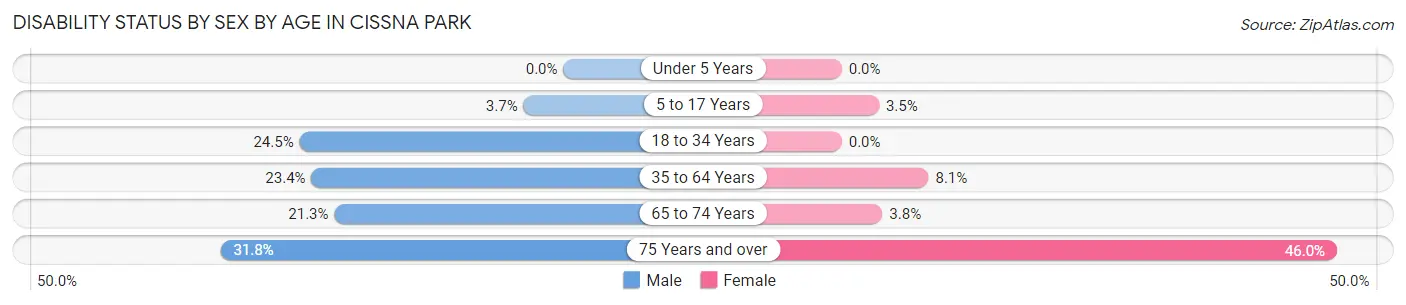
| Age Bracket | Male | Female |
| Under 5 Years | 0 (0.0%) | 0 (0.0%) |
| 5 to 17 Years | 2 (3.7%) | 2 (3.5%) |
| 18 to 34 Years | 12 (24.5%) | 0 (0.0%) |
| 35 to 64 Years | 36 (23.4%) | 14 (8.1%) |
| 65 to 74 Years | 17 (21.2%) | 2 (3.8%) |
| 75 Years and over | 14 (31.8%) | 51 (46.0%) |
Disability Class by Sex by Age in Cissna Park
Disability Class: Hearing Difficulty
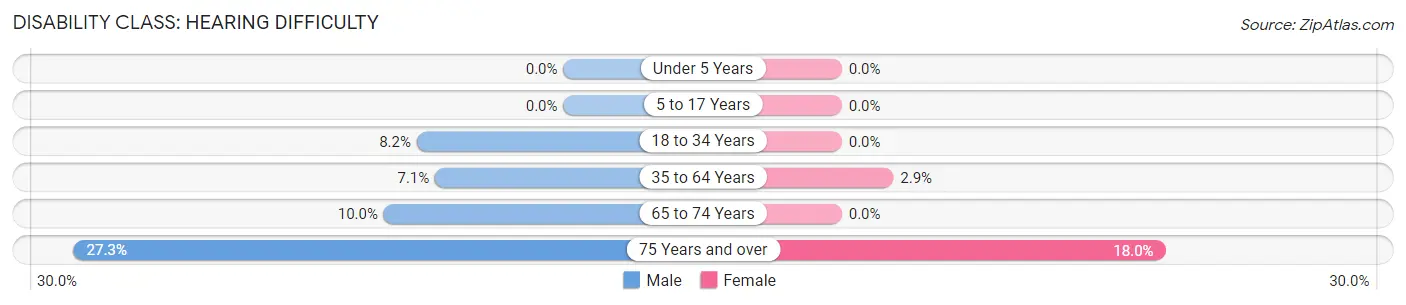
| Age Bracket | Male | Female |
| Under 5 Years | 0 (0.0%) | 0 (0.0%) |
| 5 to 17 Years | 0 (0.0%) | 0 (0.0%) |
| 18 to 34 Years | 4 (8.2%) | 0 (0.0%) |
| 35 to 64 Years | 11 (7.1%) | 5 (2.9%) |
| 65 to 74 Years | 8 (10.0%) | 0 (0.0%) |
| 75 Years and over | 12 (27.3%) | 20 (18.0%) |
Disability Class: Vision Difficulty
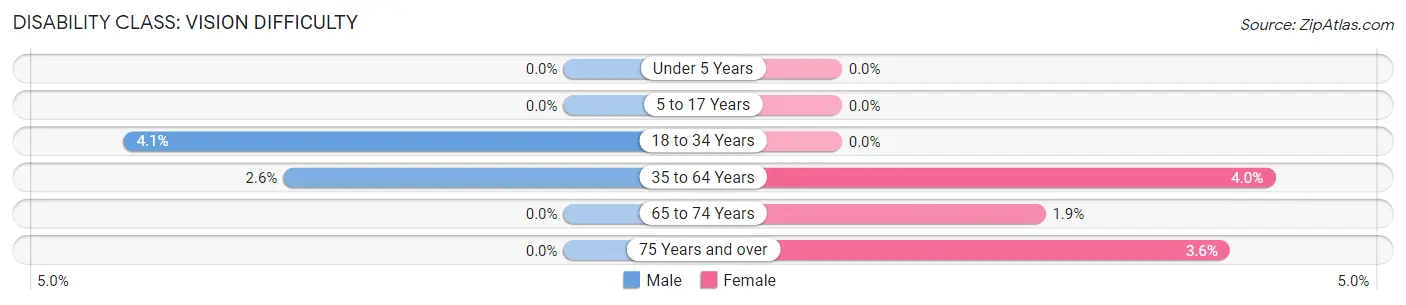
| Age Bracket | Male | Female |
| Under 5 Years | 0 (0.0%) | 0 (0.0%) |
| 5 to 17 Years | 0 (0.0%) | 0 (0.0%) |
| 18 to 34 Years | 2 (4.1%) | 0 (0.0%) |
| 35 to 64 Years | 4 (2.6%) | 7 (4.0%) |
| 65 to 74 Years | 0 (0.0%) | 1 (1.9%) |
| 75 Years and over | 0 (0.0%) | 4 (3.6%) |
Disability Class: Cognitive Difficulty
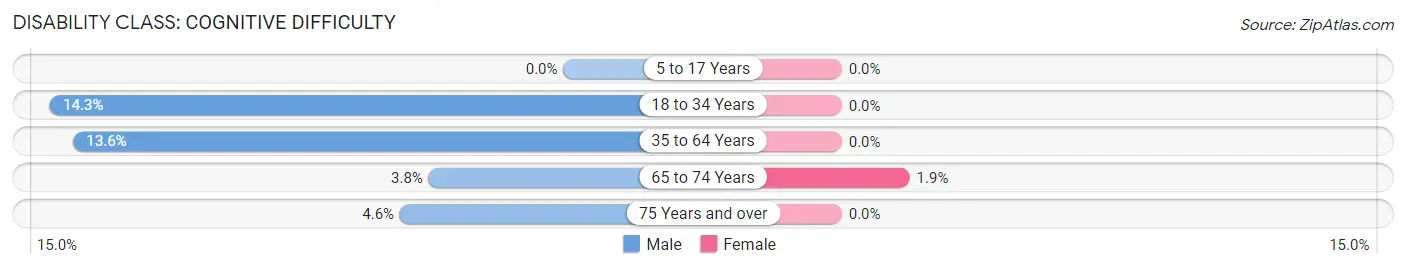
| Age Bracket | Male | Female |
| 5 to 17 Years | 0 (0.0%) | 0 (0.0%) |
| 18 to 34 Years | 7 (14.3%) | 0 (0.0%) |
| 35 to 64 Years | 21 (13.6%) | 0 (0.0%) |
| 65 to 74 Years | 3 (3.7%) | 1 (1.9%) |
| 75 Years and over | 2 (4.5%) | 0 (0.0%) |
Disability Class: Ambulatory Difficulty
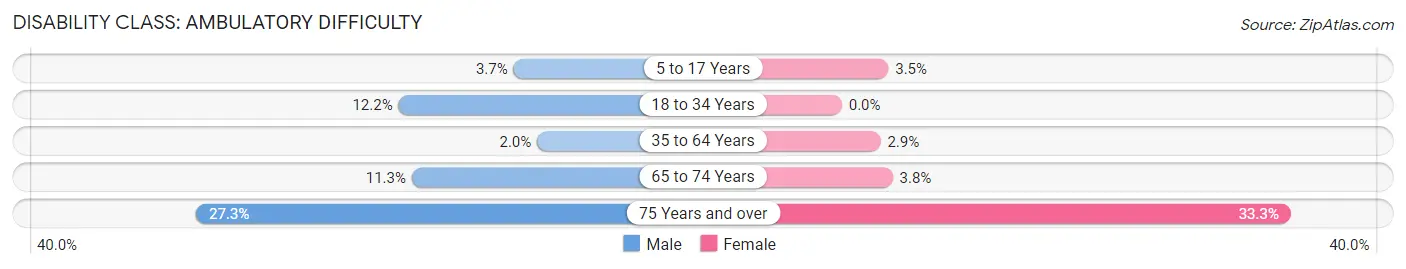
| Age Bracket | Male | Female |
| 5 to 17 Years | 2 (3.7%) | 2 (3.5%) |
| 18 to 34 Years | 6 (12.2%) | 0 (0.0%) |
| 35 to 64 Years | 3 (1.9%) | 5 (2.9%) |
| 65 to 74 Years | 9 (11.3%) | 2 (3.8%) |
| 75 Years and over | 12 (27.3%) | 37 (33.3%) |
Disability Class: Self-Care Difficulty
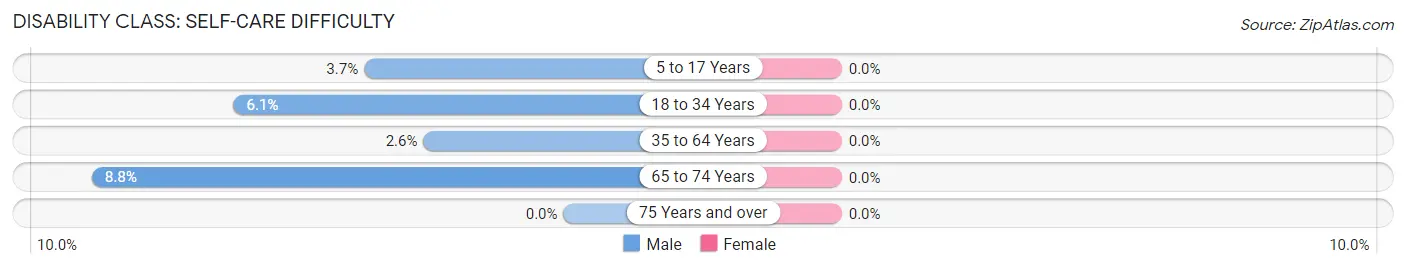
| Age Bracket | Male | Female |
| 5 to 17 Years | 2 (3.7%) | 0 (0.0%) |
| 18 to 34 Years | 3 (6.1%) | 0 (0.0%) |
| 35 to 64 Years | 4 (2.6%) | 0 (0.0%) |
| 65 to 74 Years | 7 (8.7%) | 0 (0.0%) |
| 75 Years and over | 0 (0.0%) | 0 (0.0%) |
Technology Access in Cissna Park
Computing Device Access in Cissna Park
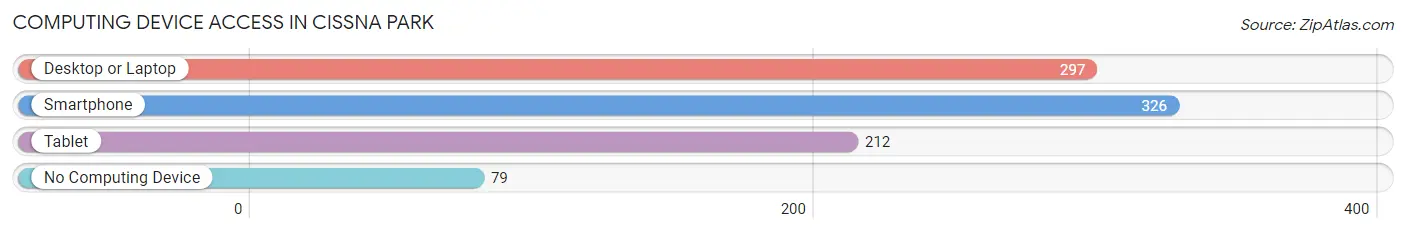
| Device Type | # Households | % Households |
| Desktop or Laptop | 297 | 68.6% |
| Smartphone | 326 | 75.3% |
| Tablet | 212 | 49.0% |
| No Computing Device | 79 | 18.2% |
| Total | 433 | 100.0% |
Internet Access in Cissna Park
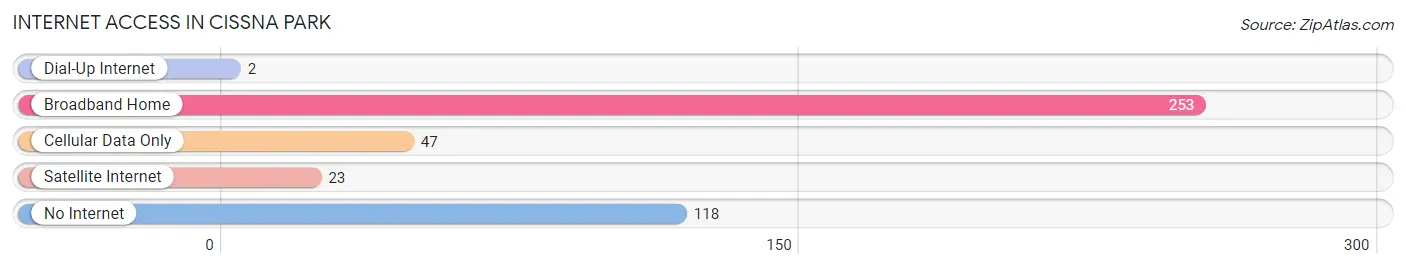
| Internet Type | # Households | % Households |
| Dial-Up Internet | 2 | 0.5% |
| Broadband Home | 253 | 58.4% |
| Cellular Data Only | 47 | 10.8% |
| Satellite Internet | 23 | 5.3% |
| No Internet | 118 | 27.3% |
| Total | 433 | 100.0% |
Cissna Park Summary
Cissna Park is a village located in Iroquois County, Illinois, United States. The population was 809 at the 2010 census. It is part of the Kankakee–Bradley Metropolitan Statistical Area.
History
Cissna Park was founded in 1872 by German immigrants who had come to the area to farm. The village was named after the Cissna family, who were among the first settlers. The village was incorporated in 1887.
Geography
Cissna Park is located at 40 59 25 North 87 51 45 West 40 990278 87 862472
According to the 2010 census the village has a total area of 0 6 square miles 1 6 km2 all land
Economy
The economy of Cissna Park is largely based on agriculture. The village is home to several farms, as well as a few small businesses.
Demographics
As of the census of 2000, there were 809 people, 315 households, and 224 families residing in the village. The population density was 1,323.3 people per square mile (510.3/km2). There were 327 housing units at an average density of 535.2 per square mile (206.3/km2). The racial makeup of the village was 98.14% White, 0.25% African American, 0.25% Native American, 0.25% Asian, 0.25% from other races, and 0.87% from two or more races. Hispanic or Latino of any race were 0.62% of the population.
There were 315 households, out of which 33.3% had children under the age of 18 living with them, 58.7% were married couples living together, 8.3% had a female householder with no husband present, and 28.6% were non-families. 24.4% of all households were made up of individuals, and 12.7% had someone living alone who was 65 years of age or older. The average household size was 2.56 and the average family size was 3.06.
In the village, the population was spread out, with 26.2% under the age of 18, 8.3% from 18 to 24, 28.2% from 25 to 44, 22.2% from 45 to 64, and 15.1% who were 65 years of age or older. The median age was 37 years. For every 100 females, there were 97.5 males. For every 100 females age 18 and over, there were 94.2 males.
The median income for a household in the village was $41,250, and the median income for a family was $45,000. Males had a median income of $31,250 versus $21,250 for females. The per capita income for the village was $17,845. About 4.2% of families and 5.2% of the population were below the poverty line, including 6.3% of those under age 18 and 5.3% of those age 65 or over.
Common Questions
What is Per Capita Income in Cissna Park?
Per Capita income in Cissna Park is $38,074.
What is the Median Family Income in Cissna Park?
Median Family Income in Cissna Park is $82,386.
What is the Median Household income in Cissna Park?
Median Household Income in Cissna Park is $47,171.
What is Income or Wage Gap in Cissna Park?
Income or Wage Gap in Cissna Park is 30.1%.
Women in Cissna Park earn 69.9 cents for every dollar earned by a man.
What is Inequality or Gini Index in Cissna Park?
Inequality or Gini Index in Cissna Park is 0.49.
What is the Total Population of Cissna Park?
Total Population of Cissna Park is 882.
What is the Total Male Population of Cissna Park?
Total Male Population of Cissna Park is 388.
What is the Total Female Population of Cissna Park?
Total Female Population of Cissna Park is 494.
What is the Ratio of Males per 100 Females in Cissna Park?
There are 78.54 Males per 100 Females in Cissna Park.
What is the Ratio of Females per 100 Males in Cissna Park?
There are 127.32 Females per 100 Males in Cissna Park.
What is the Median Population Age in Cissna Park?
Median Population Age in Cissna Park is 51.1 Years.
What is the Average Family Size in Cissna Park
Average Family Size in Cissna Park is 2.8 People.
What is the Average Household Size in Cissna Park
Average Household Size in Cissna Park is 2.0 People.
How Large is the Labor Force in Cissna Park?
There are 342 People in the Labor Forcein in Cissna Park.
What is the Percentage of People in the Labor Force in Cissna Park?
46.7% of People are in the Labor Force in Cissna Park.
What is the Unemployment Rate in Cissna Park?
Unemployment Rate in Cissna Park is 0.3%.