Suffield Depot, CT Map & Demographics
Suffield Depot Map
Suffield Depot Overview
$51,785
PER CAPITA INCOME
$220,110
AVG FAMILY INCOME
$83,926
AVG HOUSEHOLD INCOME
0.46
INEQUALITY / GINI INDEX
1,886
TOTAL POPULATION
1,002
MALE POPULATION
884
FEMALE POPULATION
113.35
MALES / 100 FEMALES
88.22
FEMALES / 100 MALES
54.6
MEDIAN AGE
3.3
AVG FAMILY SIZE
2.6
AVG HOUSEHOLD SIZE
1,349
LABOR FORCE [ PEOPLE ]
78.6%
PERCENT IN LABOR FORCE
14.8%
UNEMPLOYMENT RATE
Income in Suffield Depot
Income Overview in Suffield Depot
Per Capita Income in Suffield Depot is $51,785, while median incomes of families and households are $220,110 and $83,926 respectively.
| Characteristic | Number | Measure |
| Per Capita Income | 1,886 | $51,785 |
| Median Family Income | 447 | $220,110 |
| Mean Family Income | 447 | $169,495 |
| Median Household Income | 717 | $83,926 |
| Mean Household Income | 717 | $126,941 |
| Income Deficit | 447 | $0 |
| Wage / Income Gap (%) | 1,886 | 0.00% |
| Wage / Income Gap ($) | 1,886 | 100.00¢ per $1 |
| Gini / Inequality Index | 1,886 | 0.46 |
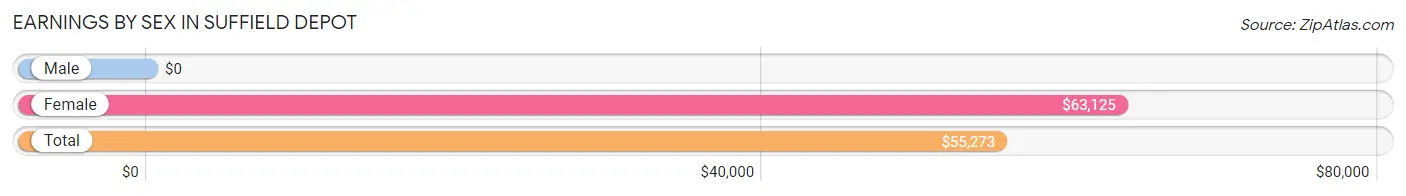
Earnings by Sex in Suffield Depot
| Sex | Number | Average Earnings |
| Male | 774 (57.0%) | $0 |
| Female | 584 (43.0%) | $63,125 |
| Total | 1,358 (100.0%) | $55,273 |
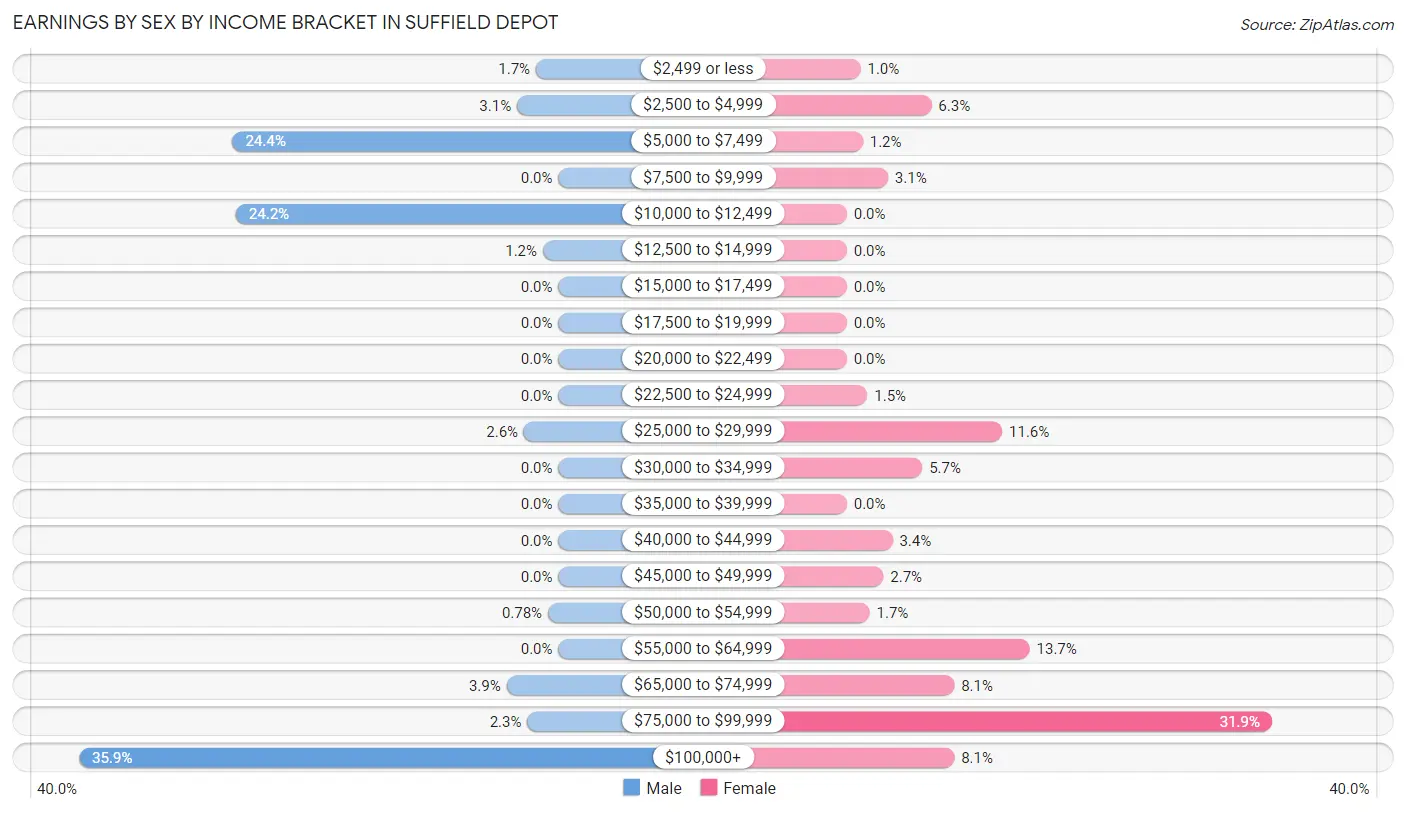
Earnings by Sex by Income Bracket in Suffield Depot
The most common earnings brackets in Suffield Depot are $100,000+ for men (278 | 35.9%) and $75,000 to $99,999 for women (186 | 31.9%).
| Income | Male | Female |
| $2,499 or less | 13 (1.7%) | 6 (1.0%) |
| $2,500 to $4,999 | 24 (3.1%) | 37 (6.3%) |
| $5,000 to $7,499 | 189 (24.4%) | 7 (1.2%) |
| $7,500 to $9,999 | 0 (0.0%) | 18 (3.1%) |
| $10,000 to $12,499 | 187 (24.2%) | 0 (0.0%) |
| $12,500 to $14,999 | 9 (1.2%) | 0 (0.0%) |
| $15,000 to $17,499 | 0 (0.0%) | 0 (0.0%) |
| $17,500 to $19,999 | 0 (0.0%) | 0 (0.0%) |
| $20,000 to $22,499 | 0 (0.0%) | 0 (0.0%) |
| $22,500 to $24,999 | 0 (0.0%) | 9 (1.5%) |
| $25,000 to $29,999 | 20 (2.6%) | 68 (11.6%) |
| $30,000 to $34,999 | 0 (0.0%) | 33 (5.7%) |
| $35,000 to $39,999 | 0 (0.0%) | 0 (0.0%) |
| $40,000 to $44,999 | 0 (0.0%) | 20 (3.4%) |
| $45,000 to $49,999 | 0 (0.0%) | 16 (2.7%) |
| $50,000 to $54,999 | 6 (0.8%) | 10 (1.7%) |
| $55,000 to $64,999 | 0 (0.0%) | 80 (13.7%) |
| $65,000 to $74,999 | 30 (3.9%) | 47 (8.1%) |
| $75,000 to $99,999 | 18 (2.3%) | 186 (31.9%) |
| $100,000+ | 278 (35.9%) | 47 (8.1%) |
| Total | 774 (100.0%) | 584 (100.0%) |
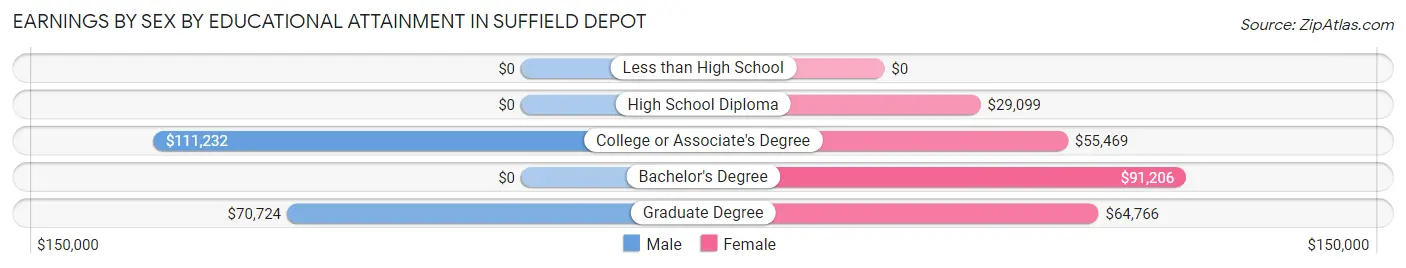
Earnings by Sex by Educational Attainment in Suffield Depot
Average earnings in Suffield Depot are $111,087 for men and $63,750 for women, a difference of 42.6%. Men with an educational attainment of college or associate's degree enjoy the highest average annual earnings of $111,232, while those with graduate degree education earn the least with $70,724. Women with an educational attainment of bachelor's degree earn the most with the average annual earnings of $91,206, while those with high school diploma education have the smallest earnings of $29,099.
| Educational Attainment | Male Income | Female Income |
| Less than High School | - | - |
| High School Diploma | - | - |
| College or Associate's Degree | $111,232 | $55,469 |
| Bachelor's Degree | - | - |
| Graduate Degree | $70,724 | $64,766 |
| Total | $111,087 | $63,750 |
Family Income in Suffield Depot
Family Income Brackets in Suffield Depot
According to the Suffield Depot family income data, there are 235 families falling into the $200,000+ income range, which is the most common income bracket and makes up 52.6% of all families.
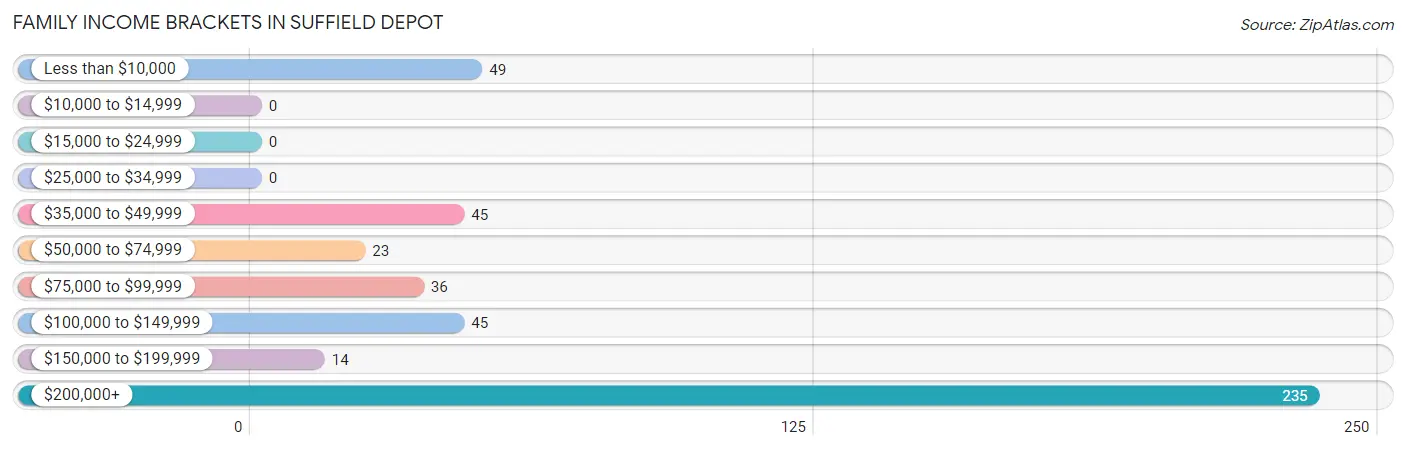
| Income Bracket | # Families | % Families |
| Less than $10,000 | 49 | 11.0% |
| $10,000 to $14,999 | 0 | 0.0% |
| $15,000 to $24,999 | 0 | 0.0% |
| $25,000 to $34,999 | 0 | 0.0% |
| $35,000 to $49,999 | 45 | 10.1% |
| $50,000 to $74,999 | 23 | 5.1% |
| $75,000 to $99,999 | 36 | 8.1% |
| $100,000 to $149,999 | 45 | 10.1% |
| $150,000 to $199,999 | 14 | 3.1% |
| $200,000+ | 235 | 52.6% |
Family Income by Famaliy Size in Suffield Depot
4-person families (214 | 47.9%) account for the highest median family income in Suffield Depot with $221,389 per family, while 4-person families (214 | 47.9%) have the highest median income of $55,347 per family member.
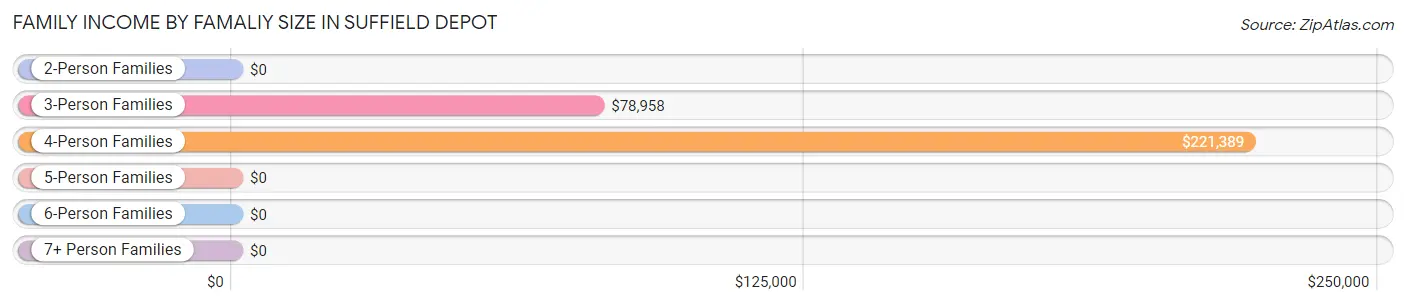
| Income Bracket | # Families | Median Income |
| 2-Person Families | 170 (38.0%) | $0 |
| 3-Person Families | 57 (12.8%) | $78,958 |
| 4-Person Families | 214 (47.9%) | $221,389 |
| 5-Person Families | 6 (1.3%) | $0 |
| 6-Person Families | 0 (0.0%) | $0 |
| 7+ Person Families | 0 (0.0%) | $0 |
| Total | 447 (100.0%) | $220,110 |
Family Income by Number of Earners in Suffield Depot
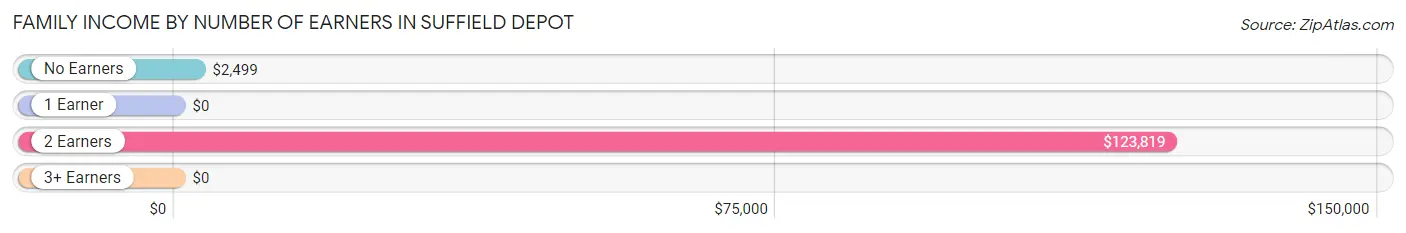
| Number of Earners | # Families | Median Income |
| No Earners | 90 (20.1%) | $2,499 |
| 1 Earner | 51 (11.4%) | $0 |
| 2 Earners | 113 (25.3%) | $123,819 |
| 3+ Earners | 193 (43.2%) | $0 |
| Total | 447 (100.0%) | $220,110 |
Household Income in Suffield Depot
Household Income Brackets in Suffield Depot
With 235 households falling in the category, the $200,000+ income range is the most frequent in Suffield Depot, accounting for 32.8% of all households. In contrast, only 4 households (0.6%) fall into the $10,000 to $14,999 income bracket, making it the least populous group.
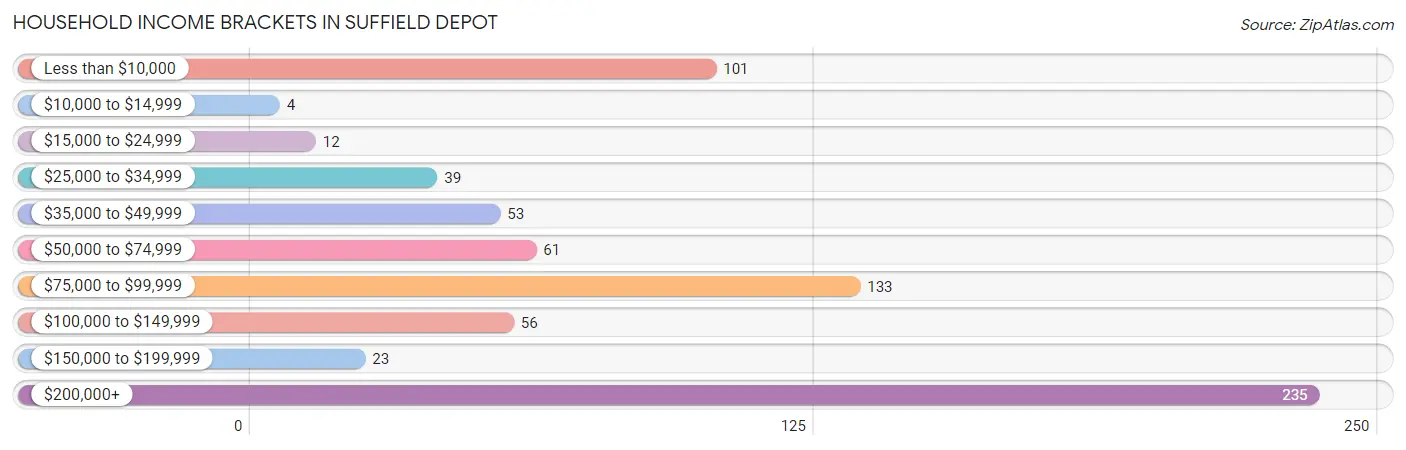
| Income Bracket | # Households | % Households |
| Less than $10,000 | 101 | 14.1% |
| $10,000 to $14,999 | 4 | 0.6% |
| $15,000 to $24,999 | 12 | 1.7% |
| $25,000 to $34,999 | 39 | 5.4% |
| $35,000 to $49,999 | 53 | 7.4% |
| $50,000 to $74,999 | 61 | 8.5% |
| $75,000 to $99,999 | 133 | 18.5% |
| $100,000 to $149,999 | 56 | 7.8% |
| $150,000 to $199,999 | 23 | 3.2% |
| $200,000+ | 235 | 32.8% |
Household Income by Householder Age in Suffield Depot
The median household income in Suffield Depot is $83,926, with the highest median household income of $208,750 found in the 45 to 64 years age bracket for the primary householder. A total of 406 households (56.6%) fall into this category.
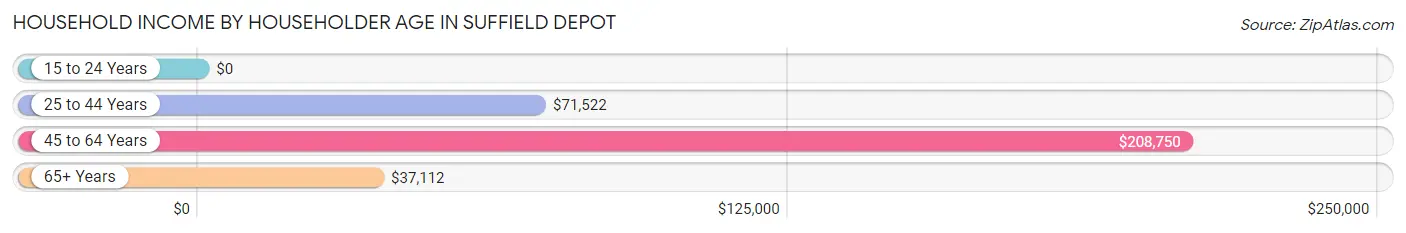
| Income Bracket | # Households | Median Income |
| 15 to 24 Years | 0 (0.0%) | $0 |
| 25 to 44 Years | 60 (8.4%) | $71,522 |
| 45 to 64 Years | 406 (56.6%) | $208,750 |
| 65+ Years | 251 (35.0%) | $37,112 |
| Total | 717 (100.0%) | $83,926 |
Poverty in Suffield Depot
Income Below Poverty by Sex and Age in Suffield Depot
With 7.0% poverty level for males and 12.0% for females among the residents of Suffield Depot, 6 to 11 year old males and 65 to 74 year old females are the most vulnerable to poverty, with 59 males (74.7%) and 46 females (29.1%) in their respective age groups living below the poverty level.
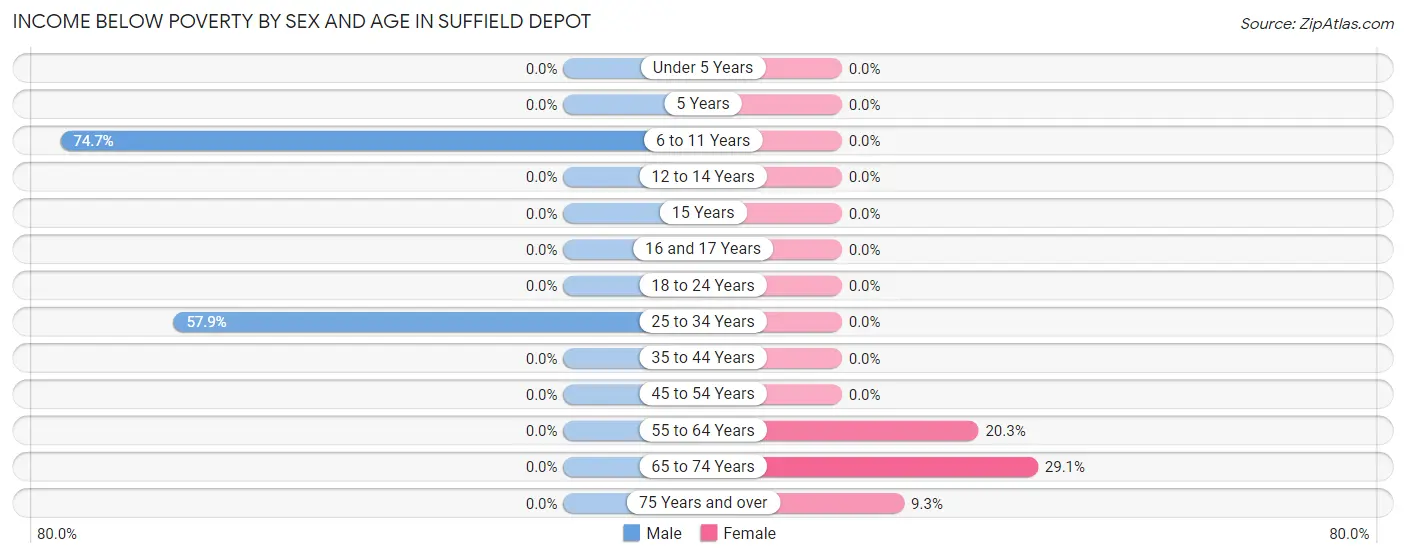
| Age Bracket | Male | Female |
| Under 5 Years | 0 (0.0%) | 0 (0.0%) |
| 5 Years | 0 (0.0%) | 0 (0.0%) |
| 6 to 11 Years | 59 (74.7%) | 0 (0.0%) |
| 12 to 14 Years | 0 (0.0%) | 0 (0.0%) |
| 15 Years | 0 (0.0%) | 0 (0.0%) |
| 16 and 17 Years | 0 (0.0%) | 0 (0.0%) |
| 18 to 24 Years | 0 (0.0%) | 0 (0.0%) |
| 25 to 34 Years | 11 (57.9%) | 0 (0.0%) |
| 35 to 44 Years | 0 (0.0%) | 0 (0.0%) |
| 45 to 54 Years | 0 (0.0%) | 0 (0.0%) |
| 55 to 64 Years | 0 (0.0%) | 55 (20.3%) |
| 65 to 74 Years | 0 (0.0%) | 46 (29.1%) |
| 75 Years and over | 0 (0.0%) | 5 (9.3%) |
| Total | 70 (7.0%) | 106 (12.0%) |
Income Above Poverty by Sex and Age in Suffield Depot
According to the poverty statistics in Suffield Depot, males aged under 5 years and females aged 6 to 11 years are the age groups that are most secure financially, with 100.0% of males and 100.0% of females in these age groups living above the poverty line.
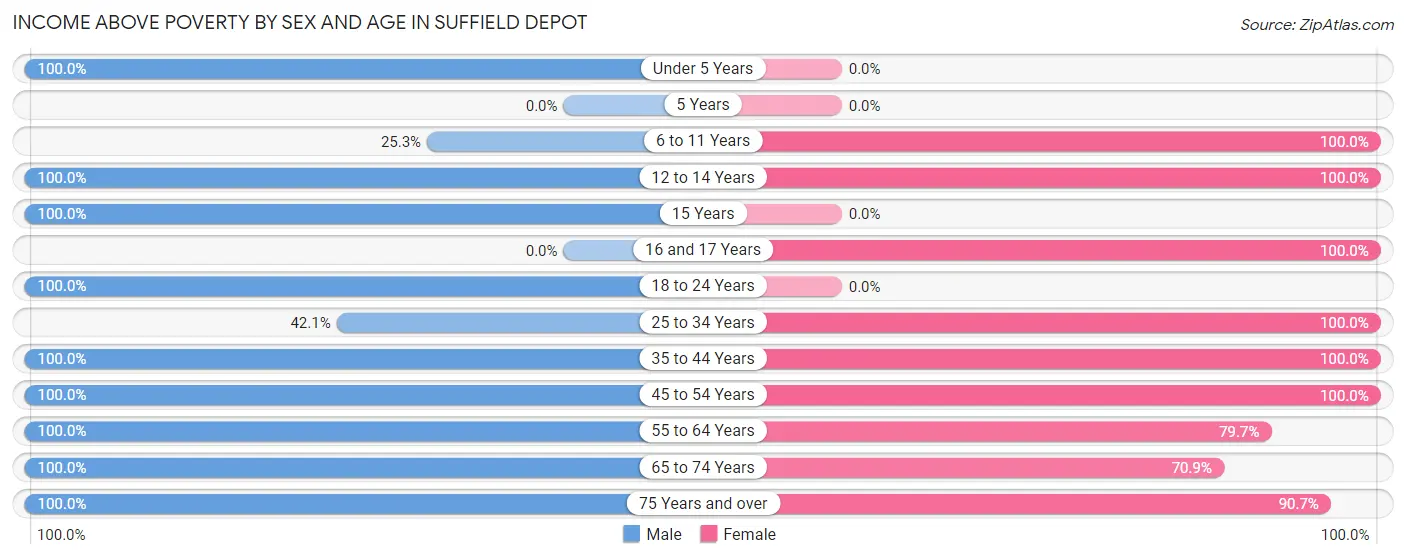
| Age Bracket | Male | Female |
| Under 5 Years | 21 (100.0%) | 0 (0.0%) |
| 5 Years | 0 (0.0%) | 0 (0.0%) |
| 6 to 11 Years | 20 (25.3%) | 9 (100.0%) |
| 12 to 14 Years | 12 (100.0%) | 37 (100.0%) |
| 15 Years | 12 (100.0%) | 0 (0.0%) |
| 16 and 17 Years | 0 (0.0%) | 17 (100.0%) |
| 18 to 24 Years | 398 (100.0%) | 0 (0.0%) |
| 25 to 34 Years | 8 (42.1%) | 51 (100.0%) |
| 35 to 44 Years | 24 (100.0%) | 53 (100.0%) |
| 45 to 54 Years | 59 (100.0%) | 234 (100.0%) |
| 55 to 64 Years | 250 (100.0%) | 216 (79.7%) |
| 65 to 74 Years | 73 (100.0%) | 112 (70.9%) |
| 75 Years and over | 55 (100.0%) | 49 (90.7%) |
| Total | 932 (93.0%) | 778 (88.0%) |
Income Below Poverty Among Married-Couple Families in Suffield Depot
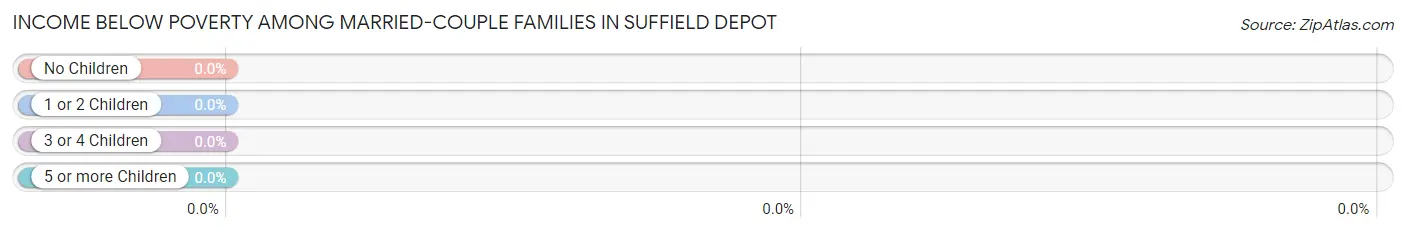
| Children | Above Poverty | Below Poverty |
| No Children | 303 (100.0%) | 0 (0.0%) |
| 1 or 2 Children | 51 (100.0%) | 0 (0.0%) |
| 3 or 4 Children | 6 (100.0%) | 0 (0.0%) |
| 5 or more Children | 0 (0.0%) | 0 (0.0%) |
| Total | 360 (100.0%) | 0 (0.0%) |
Income Below Poverty Among Single-Parent Households in Suffield Depot
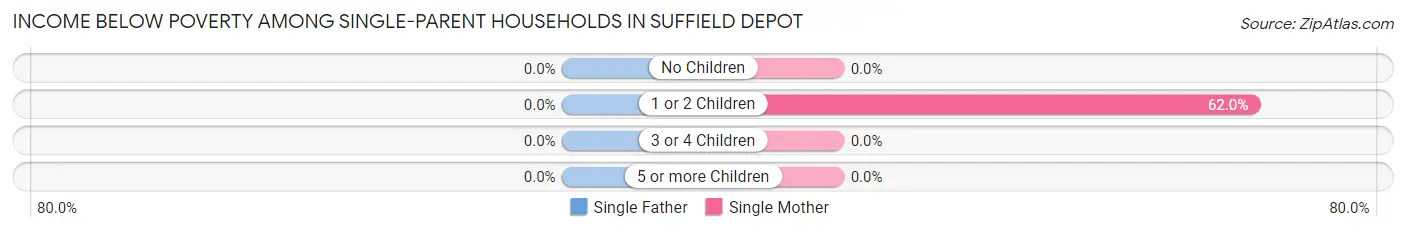
| Children | Single Father | Single Mother |
| No Children | 0 (0.0%) | 0 (0.0%) |
| 1 or 2 Children | 0 (0.0%) | 49 (62.0%) |
| 3 or 4 Children | 0 (0.0%) | 0 (0.0%) |
| 5 or more Children | 0 (0.0%) | 0 (0.0%) |
| Total | 0 (0.0%) | 49 (56.3%) |
Income Below Poverty Among Married-Couple vs Single-Parent Households in Suffield Depot
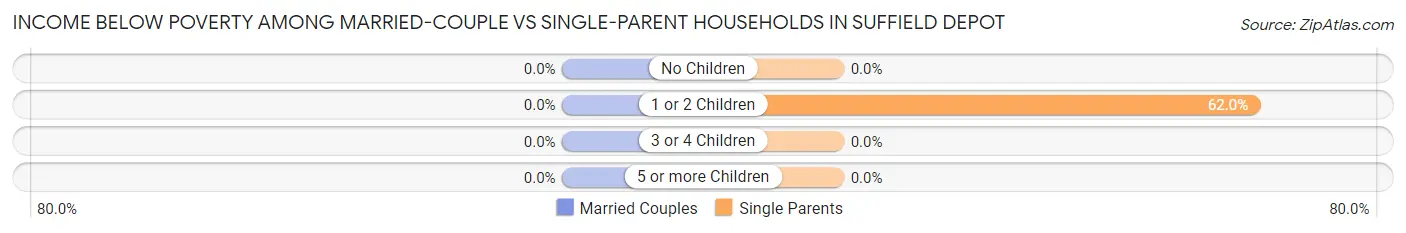
| Children | Married-Couple Families | Single-Parent Households |
| No Children | 0 (0.0%) | 0 (0.0%) |
| 1 or 2 Children | 0 (0.0%) | 49 (62.0%) |
| 3 or 4 Children | 0 (0.0%) | 0 (0.0%) |
| 5 or more Children | 0 (0.0%) | 0 (0.0%) |
| Total | 0 (0.0%) | 49 (56.3%) |
Race in Suffield Depot
The most populous races in Suffield Depot are White / Caucasian (1,712 | 90.8%), Black / African American (110 | 5.8%), and Hispanic or Latino (99 | 5.2%).
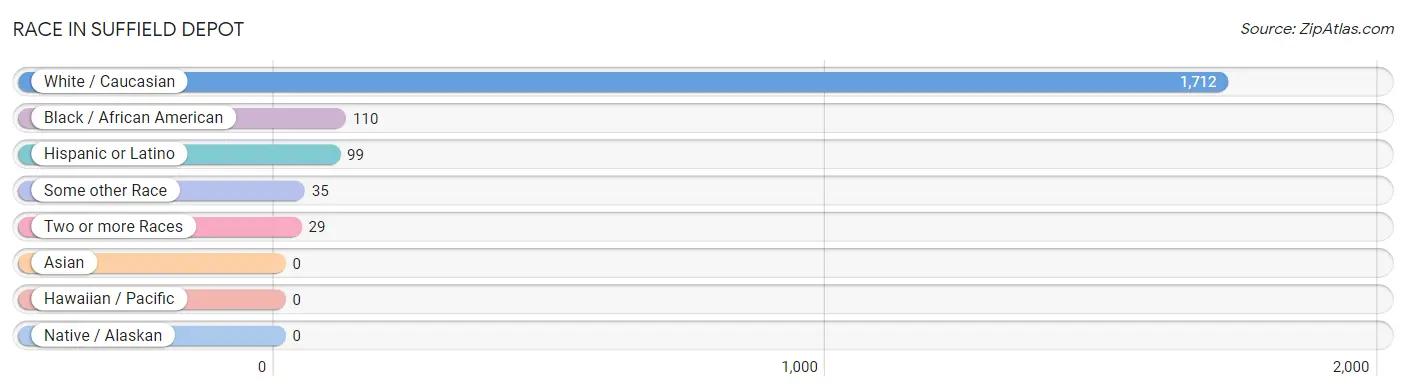
| Race | # Population | % Population |
| Asian | 0 | 0.0% |
| Black / African American | 110 | 5.8% |
| Hawaiian / Pacific | 0 | 0.0% |
| Hispanic or Latino | 99 | 5.2% |
| Native / Alaskan | 0 | 0.0% |
| White / Caucasian | 1,712 | 90.8% |
| Two or more Races | 29 | 1.5% |
| Some other Race | 35 | 1.9% |
| Total | 1,886 | 100.0% |
Ancestry in Suffield Depot
The most populous ancestries reported in Suffield Depot are Irish (1,004 | 53.2%), Italian (692 | 36.7%), Polish (131 | 7.0%), French (121 | 6.4%), and English (96 | 5.1%), together accounting for 108.4% of all Suffield Depot residents.
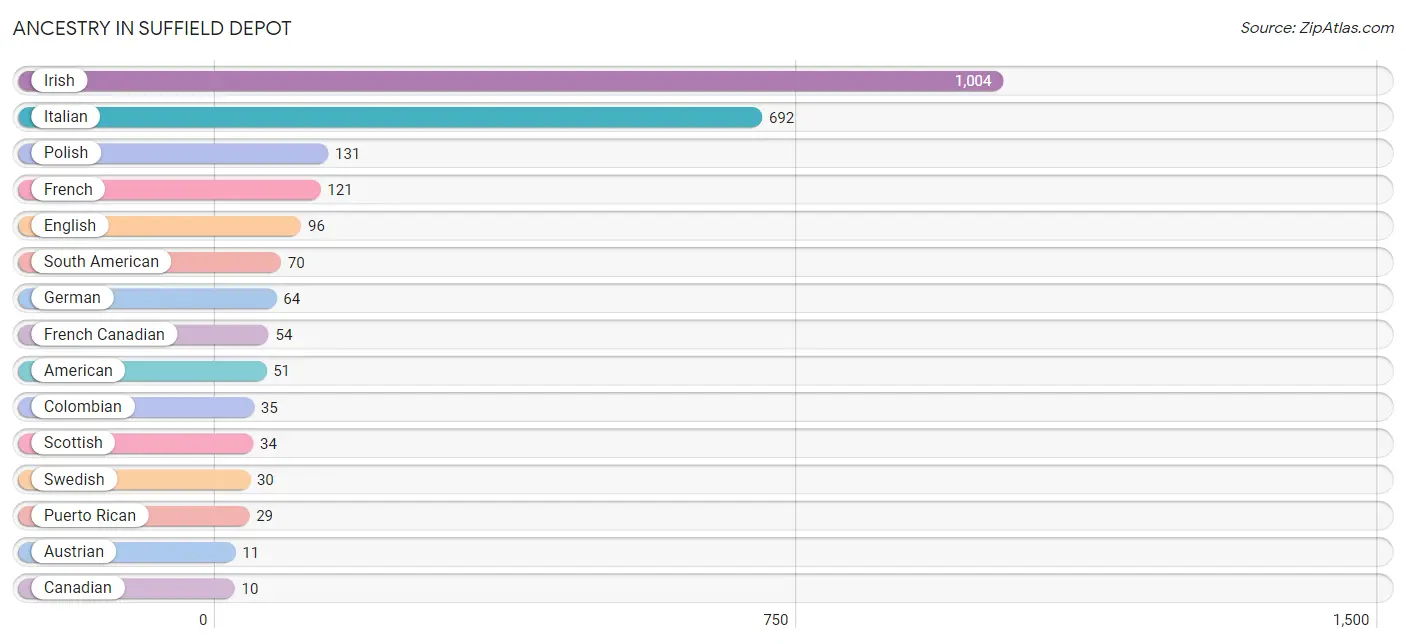
| Ancestry | # Population | % Population |
| American | 51 | 2.7% |
| Austrian | 11 | 0.6% |
| British | 6 | 0.3% |
| Canadian | 10 | 0.5% |
| Colombian | 35 | 1.9% |
| English | 96 | 5.1% |
| French | 121 | 6.4% |
| French Canadian | 54 | 2.9% |
| German | 64 | 3.4% |
| Greek | 10 | 0.5% |
| Irish | 1,004 | 53.2% |
| Italian | 692 | 36.7% |
| Polish | 131 | 7.0% |
| Puerto Rican | 29 | 1.5% |
| Scotch-Irish | 8 | 0.4% |
| Scottish | 34 | 1.8% |
| South American | 70 | 3.7% |
| Swedish | 30 | 1.6% | View All 18 Rows |
Immigrants in Suffield Depot
The most numerous immigrant groups reported in Suffield Depot came from Europe (61 | 3.2%), Colombia (46 | 2.4%), Latin America (46 | 2.4%), South America (46 | 2.4%), and Eastern Europe (44 | 2.3%), together accounting for 12.9% of all Suffield Depot residents.
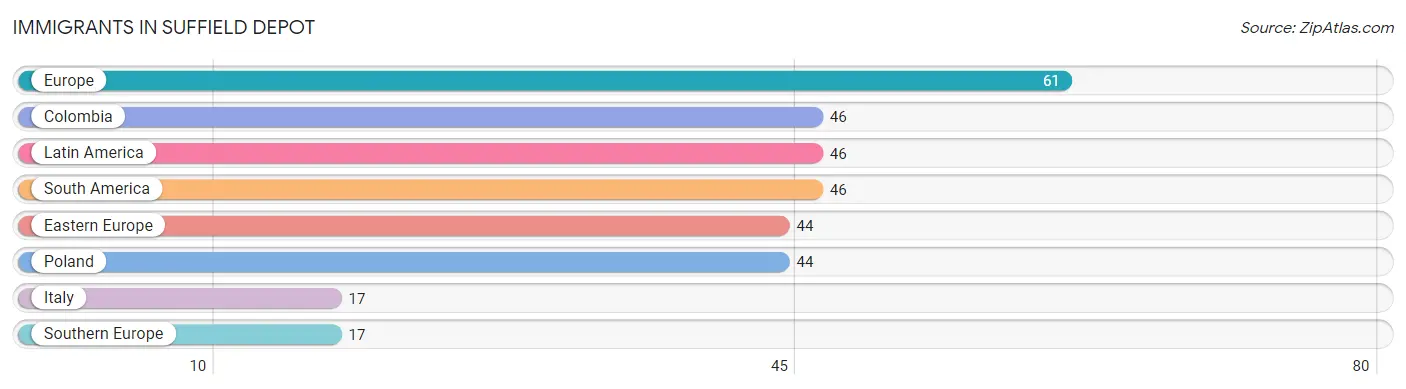
| Immigration Origin | # Population | % Population |
| Colombia | 46 | 2.4% |
| Eastern Europe | 44 | 2.3% |
| Europe | 61 | 3.2% |
| Italy | 17 | 0.9% |
| Latin America | 46 | 2.4% |
| Poland | 44 | 2.3% |
| South America | 46 | 2.4% |
| Southern Europe | 17 | 0.9% | View All 8 Rows |
Sex and Age in Suffield Depot
Sex and Age in Suffield Depot
The most populous age groups in Suffield Depot are 20 to 24 Years (398 | 39.7%) for men and 50 to 54 Years (197 | 22.3%) for women.
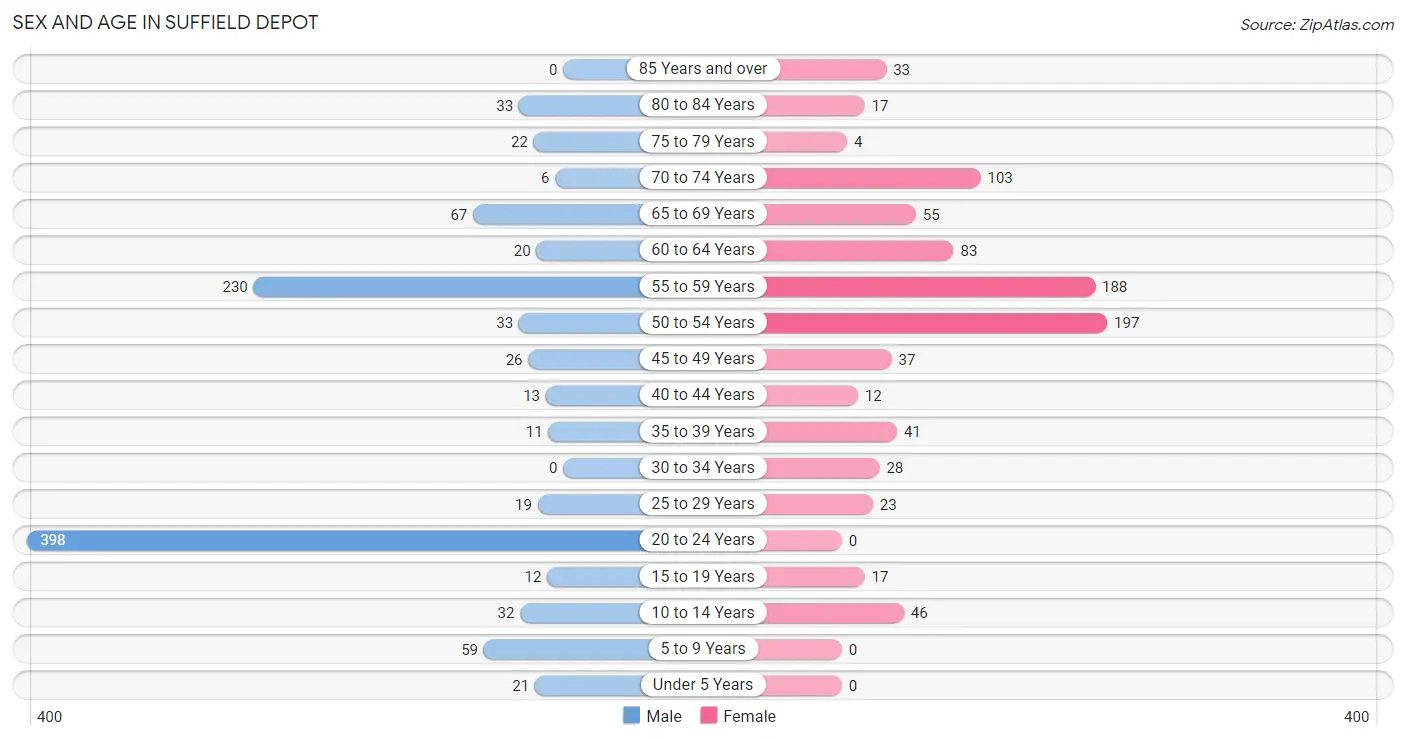
| Age Bracket | Male | Female |
| Under 5 Years | 21 (2.1%) | 0 (0.0%) |
| 5 to 9 Years | 59 (5.9%) | 0 (0.0%) |
| 10 to 14 Years | 32 (3.2%) | 46 (5.2%) |
| 15 to 19 Years | 12 (1.2%) | 17 (1.9%) |
| 20 to 24 Years | 398 (39.7%) | 0 (0.0%) |
| 25 to 29 Years | 19 (1.9%) | 23 (2.6%) |
| 30 to 34 Years | 0 (0.0%) | 28 (3.2%) |
| 35 to 39 Years | 11 (1.1%) | 41 (4.6%) |
| 40 to 44 Years | 13 (1.3%) | 12 (1.4%) |
| 45 to 49 Years | 26 (2.6%) | 37 (4.2%) |
| 50 to 54 Years | 33 (3.3%) | 197 (22.3%) |
| 55 to 59 Years | 230 (23.0%) | 188 (21.3%) |
| 60 to 64 Years | 20 (2.0%) | 83 (9.4%) |
| 65 to 69 Years | 67 (6.7%) | 55 (6.2%) |
| 70 to 74 Years | 6 (0.6%) | 103 (11.7%) |
| 75 to 79 Years | 22 (2.2%) | 4 (0.4%) |
| 80 to 84 Years | 33 (3.3%) | 17 (1.9%) |
| 85 Years and over | 0 (0.0%) | 33 (3.7%) |
| Total | 1,002 (100.0%) | 884 (100.0%) |
Families and Households in Suffield Depot
Median Family Size in Suffield Depot
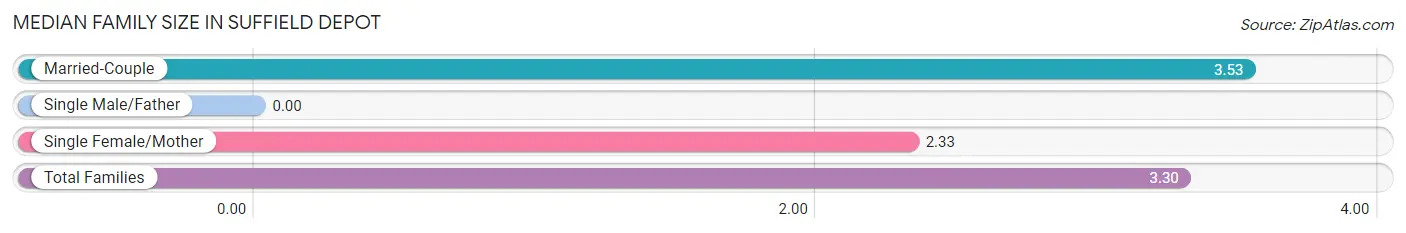
| Family Type | # Families | Family Size |
| Married-Couple | 360 (80.5%) | 3.53 |
| Single Male/Father | 0 (0.0%) | - |
| Single Female/Mother | 87 (19.5%) | 2.33 |
| Total Families | 447 (100.0%) | 3.30 |
Median Household Size in Suffield Depot
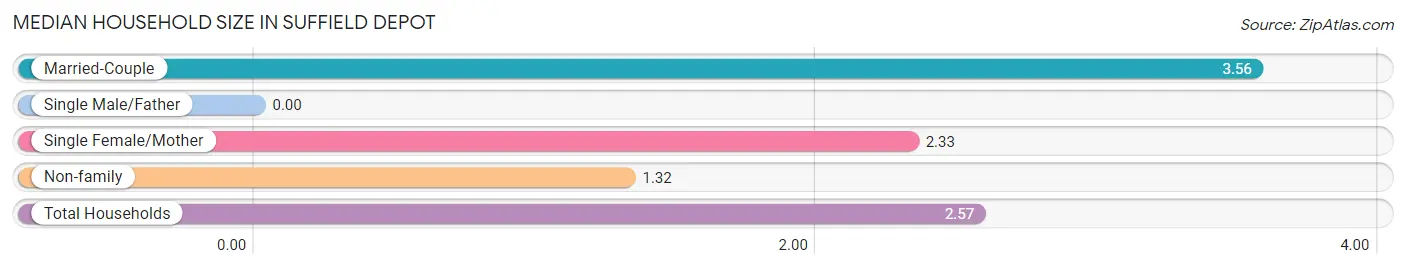
| Household Type | # Households | Household Size |
| Married-Couple | 360 (50.2%) | 3.56 |
| Single Male/Father | 0 (0.0%) | - |
| Single Female/Mother | 87 (12.1%) | 2.33 |
| Non-family | 270 (37.7%) | 1.32 |
| Total Households | 717 (100.0%) | 2.57 |
Household Size by Marriage Status in Suffield Depot
Out of a total of 717 households in Suffield Depot, 447 (62.3%) are family households, while 270 (37.7%) are nonfamily households. The most numerous type of family households are 4-person households, comprising 225, and the most common type of nonfamily households are 1-person households, comprising 187.
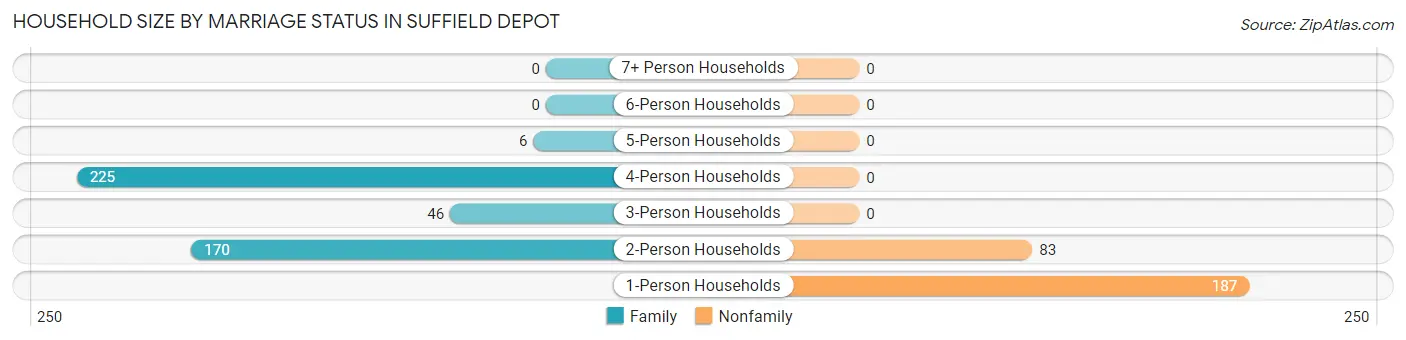
| Household Size | Family Households | Nonfamily Households |
| 1-Person Households | - | 187 (26.1%) |
| 2-Person Households | 170 (23.7%) | 83 (11.6%) |
| 3-Person Households | 46 (6.4%) | 0 (0.0%) |
| 4-Person Households | 225 (31.4%) | 0 (0.0%) |
| 5-Person Households | 6 (0.8%) | 0 (0.0%) |
| 6-Person Households | 0 (0.0%) | 0 (0.0%) |
| 7+ Person Households | 0 (0.0%) | 0 (0.0%) |
| Total | 447 (62.3%) | 270 (37.7%) |
Female Fertility in Suffield Depot
Fertility by Age in Suffield Depot
| Age Bracket | Women with Births | Births / 1,000 Women |
| 15 to 19 years | 0 (0.0%) | 0.0 |
| 20 to 34 years | 0 (0.0%) | 0.0 |
| 35 to 50 years | 0 (0.0%) | 0.0 |
| Total | 0 (0.0%) | 0.0 |
Fertility by Age by Marriage Status in Suffield Depot
| Age Bracket | Married | Unmarried |
| 15 to 19 years | 0 (0.0%) | 0 (0.0%) |
| 20 to 34 years | 0 (0.0%) | 0 (0.0%) |
| 35 to 50 years | 0 (0.0%) | 0 (0.0%) |
| Total | 0 (0.0%) | 0 (0.0%) |
Fertility by Education in Suffield Depot
| Educational Attainment | Women with Births | Births / 1,000 Women |
| Less than High School | 0 (0.0%) | 0.0 |
| High School Diploma | 0 (0.0%) | 0.0 |
| College or Associate's Degree | 0 (0.0%) | 0.0 |
| Bachelor's Degree | 0 (0.0%) | 0.0 |
| Graduate Degree | 0 (0.0%) | 0.0 |
| Total | 0 (0.0%) | 0.0 |
Fertility by Education by Marriage Status in Suffield Depot
| Educational Attainment | Married | Unmarried |
| Less than High School | 0 (0.0%) | 0 (0.0%) |
| High School Diploma | 0 (0.0%) | 0 (0.0%) |
| College or Associate's Degree | 0 (0.0%) | 0 (0.0%) |
| Bachelor's Degree | 0 (0.0%) | 0 (0.0%) |
| Graduate Degree | 0 (0.0%) | 0 (0.0%) |
| Total | 0 (0.0%) | 0 (0.0%) |
Employment Characteristics in Suffield Depot
Employment by Class of Employer in Suffield Depot
Among the 1,149 employed individuals in Suffield Depot, private company employees (646 | 56.2%), state government employees (225 | 19.6%), and not-for-profit organizations (135 | 11.7%) make up the most common classes of employment.
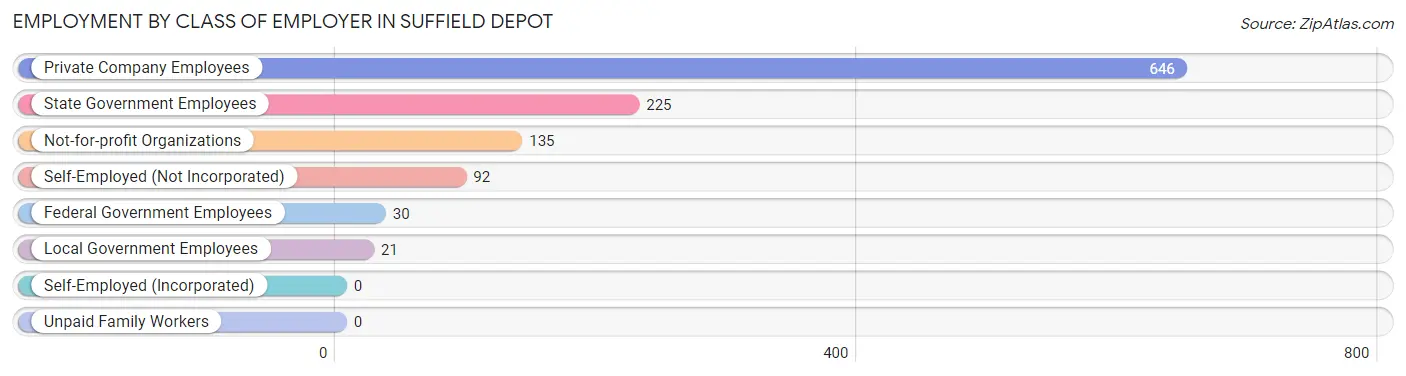
| Employer Class | # Employees | % Employees |
| Private Company Employees | 646 | 56.2% |
| Self-Employed (Incorporated) | 0 | 0.0% |
| Self-Employed (Not Incorporated) | 92 | 8.0% |
| Not-for-profit Organizations | 135 | 11.7% |
| Local Government Employees | 21 | 1.8% |
| State Government Employees | 225 | 19.6% |
| Federal Government Employees | 30 | 2.6% |
| Unpaid Family Workers | 0 | 0.0% |
| Total | 1,149 | 100.0% |
Employment Status by Age in Suffield Depot
According to the labor force statistics for Suffield Depot, out of the total population over 16 years of age (1,716), 78.6% or 1,349 individuals are in the labor force, with 14.8% or 200 of them unemployed. The age group with the highest labor force participation rate is 20 to 24 years, with 100.0% or 398 individuals in the labor force. Within the labor force, the 20 to 24 years age range has the highest percentage of unemployed individuals, with 47.0% or 187 of them being unemployed.
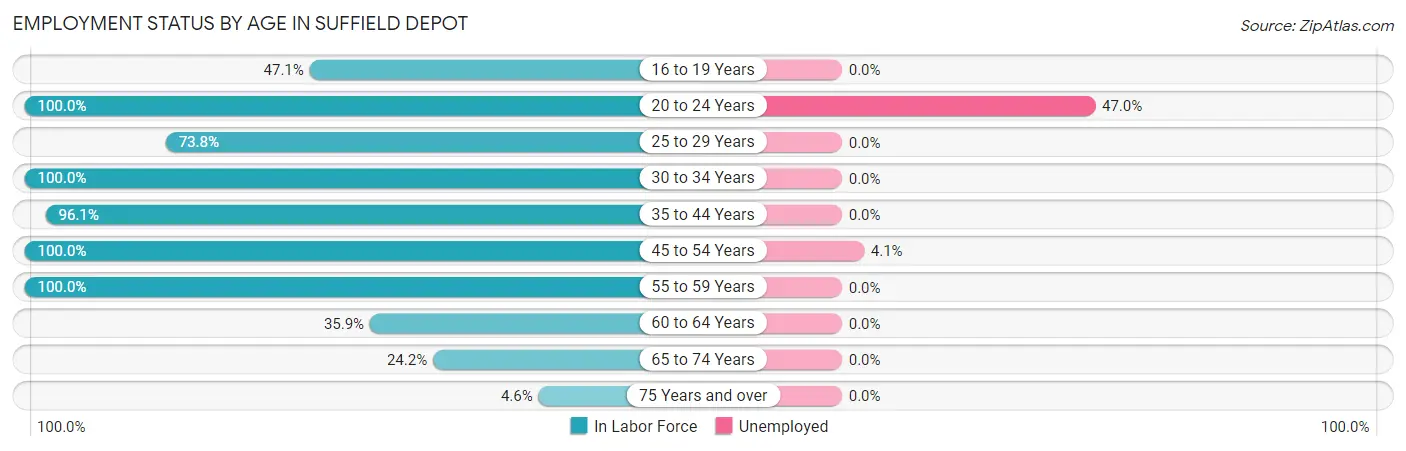
| Age Bracket | In Labor Force | Unemployed |
| 16 to 19 Years | 8 (47.1%) | 0 (0.0%) |
| 20 to 24 Years | 398 (100.0%) | 187 (47.0%) |
| 25 to 29 Years | 31 (73.8%) | 0 (0.0%) |
| 30 to 34 Years | 28 (100.0%) | 0 (0.0%) |
| 35 to 44 Years | 74 (96.1%) | 0 (0.0%) |
| 45 to 54 Years | 293 (100.0%) | 12 (4.1%) |
| 55 to 59 Years | 418 (100.0%) | 0 (0.0%) |
| 60 to 64 Years | 37 (35.9%) | 0 (0.0%) |
| 65 to 74 Years | 56 (24.2%) | 0 (0.0%) |
| 75 Years and over | 5 (4.6%) | 0 (0.0%) |
| Total | 1,349 (78.6%) | 200 (14.8%) |
Employment Status by Educational Attainment in Suffield Depot
According to labor force statistics for Suffield Depot, 91.7% of individuals (881) out of the total population between 25 and 64 years of age (961) are in the labor force, with 1.4% or 12 of them being unemployed. The group with the highest labor force participation rate are those with the educational attainment of bachelor's degree or higher, with 99.2% or 380 individuals in the labor force. Within the labor force, individuals with bachelor's degree or higher education have the highest percentage of unemployment, with 3.2% or 12 of them being unemployed.
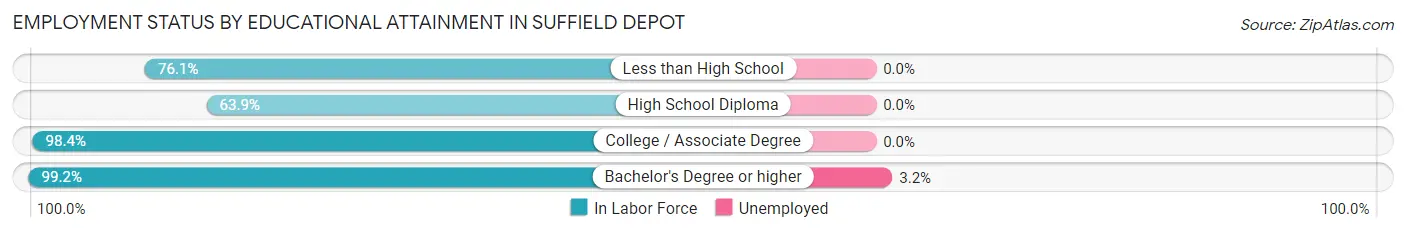
| Educational Attainment | In Labor Force | Unemployed |
| Less than High School | 35 (76.1%) | 0 (0.0%) |
| High School Diploma | 106 (63.9%) | 0 (0.0%) |
| College / Associate Degree | 360 (98.4%) | 0 (0.0%) |
| Bachelor's Degree or higher | 380 (99.2%) | 12 (3.2%) |
| Total | 881 (91.7%) | 13 (1.4%) |
Employment Occupations by Sex in Suffield Depot
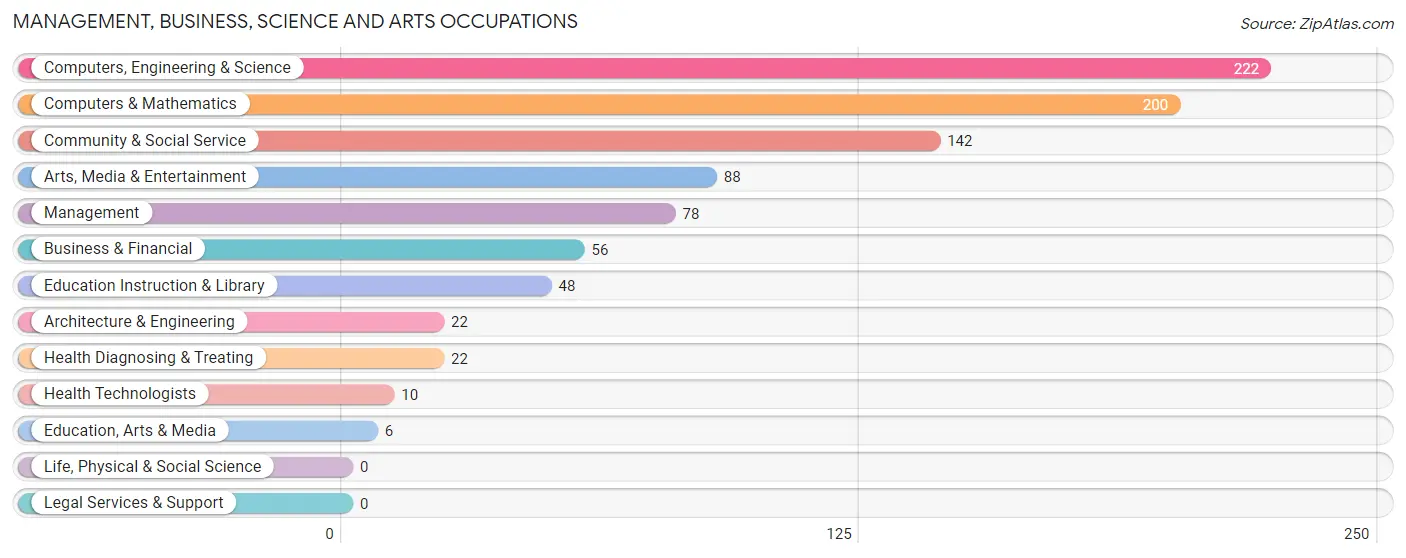
Management, Business, Science and Arts Occupations
The most common Management, Business, Science and Arts occupations in Suffield Depot are Computers, Engineering & Science (222 | 19.3%), Computers & Mathematics (200 | 17.4%), Community & Social Service (142 | 12.4%), Arts, Media & Entertainment (88 | 7.7%), and Management (78 | 6.8%).
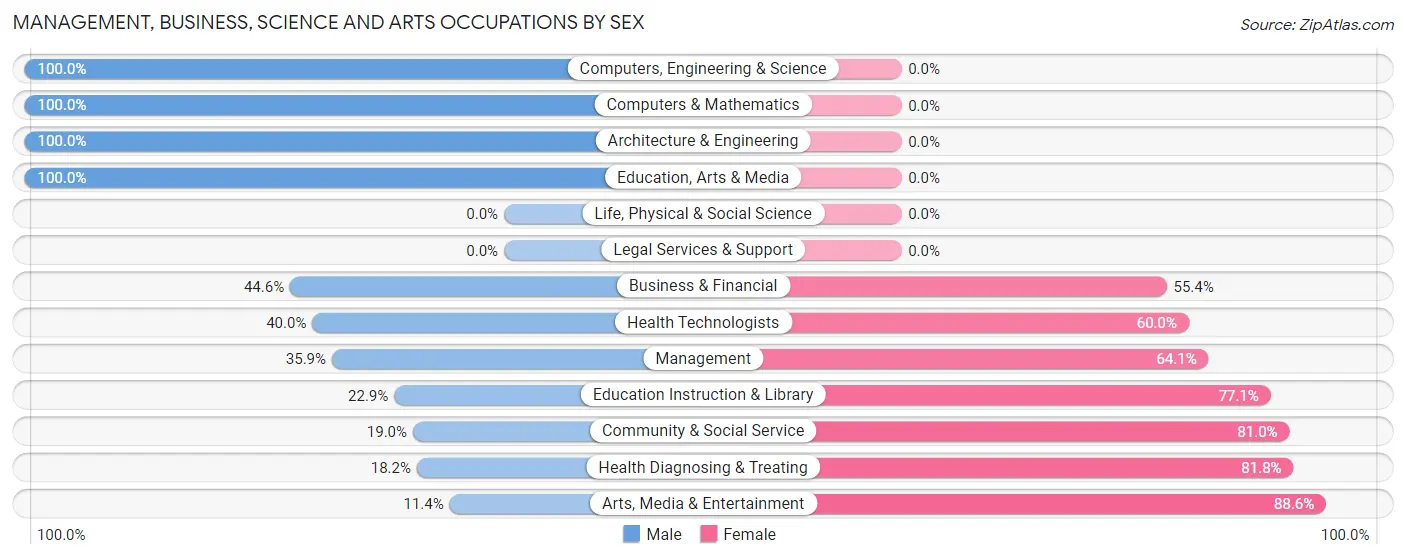
Management, Business, Science and Arts Occupations by Sex
Within the Management, Business, Science and Arts occupations in Suffield Depot, the most male-oriented occupations are Computers, Engineering & Science (100.0%), Computers & Mathematics (100.0%), and Architecture & Engineering (100.0%), while the most female-oriented occupations are Arts, Media & Entertainment (88.6%), Health Diagnosing & Treating (81.8%), and Community & Social Service (81.0%).
| Occupation | Male | Female |
| Management | 28 (35.9%) | 50 (64.1%) |
| Business & Financial | 25 (44.6%) | 31 (55.4%) |
| Computers, Engineering & Science | 222 (100.0%) | 0 (0.0%) |
| Computers & Mathematics | 200 (100.0%) | 0 (0.0%) |
| Architecture & Engineering | 22 (100.0%) | 0 (0.0%) |
| Life, Physical & Social Science | 0 (0.0%) | 0 (0.0%) |
| Community & Social Service | 27 (19.0%) | 115 (81.0%) |
| Education, Arts & Media | 6 (100.0%) | 0 (0.0%) |
| Legal Services & Support | 0 (0.0%) | 0 (0.0%) |
| Education Instruction & Library | 11 (22.9%) | 37 (77.1%) |
| Arts, Media & Entertainment | 10 (11.4%) | 78 (88.6%) |
| Health Diagnosing & Treating | 4 (18.2%) | 18 (81.8%) |
| Health Technologists | 4 (40.0%) | 6 (60.0%) |
| Total (Category) | 306 (58.9%) | 214 (41.1%) |
| Total (Overall) | 565 (49.2%) | 584 (50.8%) |
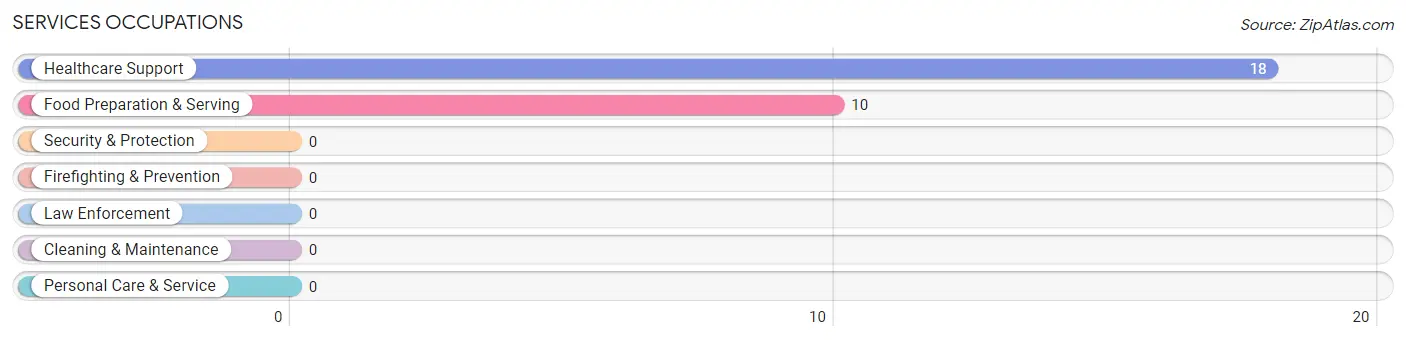
Services Occupations
The most common Services occupations in Suffield Depot are Healthcare Support (18 | 1.6%), and Food Preparation & Serving (10 | 0.9%).
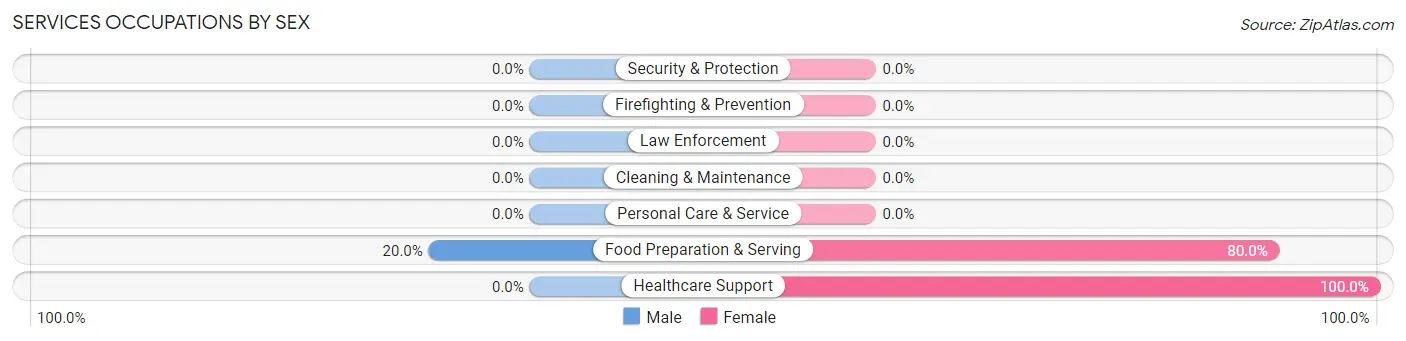
Services Occupations by Sex
| Occupation | Male | Female |
| Healthcare Support | 0 (0.0%) | 18 (100.0%) |
| Security & Protection | 0 (0.0%) | 0 (0.0%) |
| Firefighting & Prevention | 0 (0.0%) | 0 (0.0%) |
| Law Enforcement | 0 (0.0%) | 0 (0.0%) |
| Food Preparation & Serving | 2 (20.0%) | 8 (80.0%) |
| Cleaning & Maintenance | 0 (0.0%) | 0 (0.0%) |
| Personal Care & Service | 0 (0.0%) | 0 (0.0%) |
| Total (Category) | 2 (7.1%) | 26 (92.9%) |
| Total (Overall) | 565 (49.2%) | 584 (50.8%) |
Sales and Office Occupations
The most common Sales and Office occupations in Suffield Depot are Sales & Related (311 | 27.1%), and Office & Administration (274 | 23.8%).
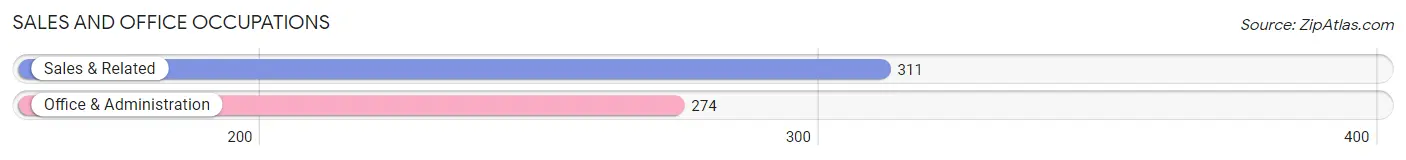
Sales and Office Occupations by Sex

| Occupation | Male | Female |
| Sales & Related | 35 (11.3%) | 276 (88.7%) |
| Office & Administration | 206 (75.2%) | 68 (24.8%) |
| Total (Category) | 241 (41.2%) | 344 (58.8%) |
| Total (Overall) | 565 (49.2%) | 584 (50.8%) |
Natural Resources, Construction and Maintenance Occupations
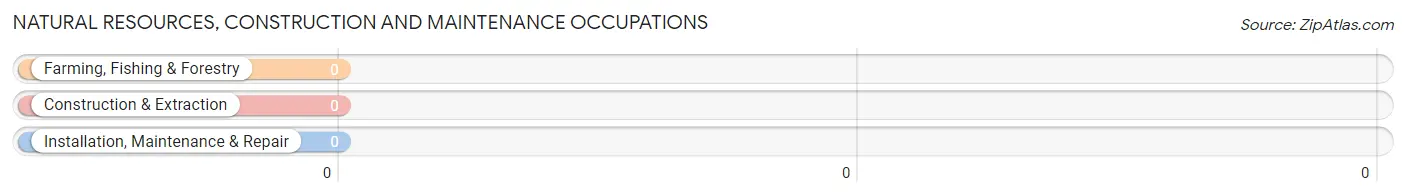
Natural Resources, Construction and Maintenance Occupations by Sex
| Occupation | Male | Female |
| Farming, Fishing & Forestry | 0 (0.0%) | 0 (0.0%) |
| Construction & Extraction | 0 (0.0%) | 0 (0.0%) |
| Installation, Maintenance & Repair | 0 (0.0%) | 0 (0.0%) |
| Total (Category) | 0 (0.0%) | 0 (0.0%) |
| Total (Overall) | 565 (49.2%) | 584 (50.8%) |
Production, Transportation and Moving Occupations
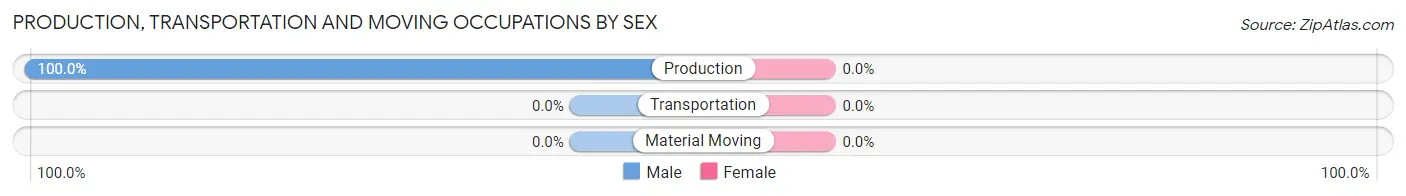
The most common Production, Transportation and Moving occupations in Suffield Depot are , and Production (16 | 1.4%).
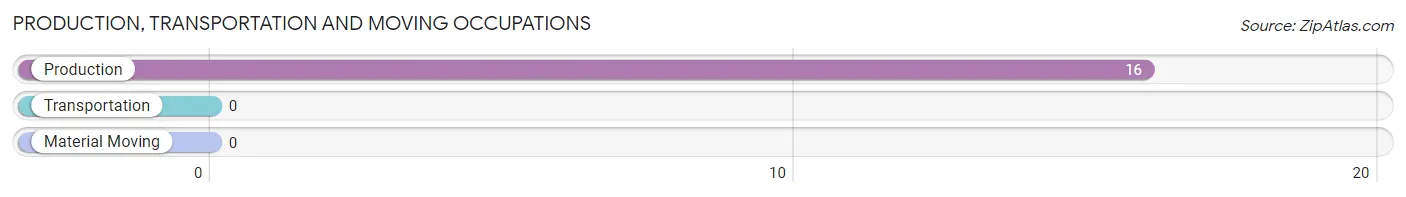
Production, Transportation and Moving Occupations by Sex
| Occupation | Male | Female |
| Production | 16 (100.0%) | 0 (0.0%) |
| Transportation | 0 (0.0%) | 0 (0.0%) |
| Material Moving | 0 (0.0%) | 0 (0.0%) |
| Total (Category) | 16 (100.0%) | 0 (0.0%) |
| Total (Overall) | 565 (49.2%) | 584 (50.8%) |
Employment Industries by Sex in Suffield Depot
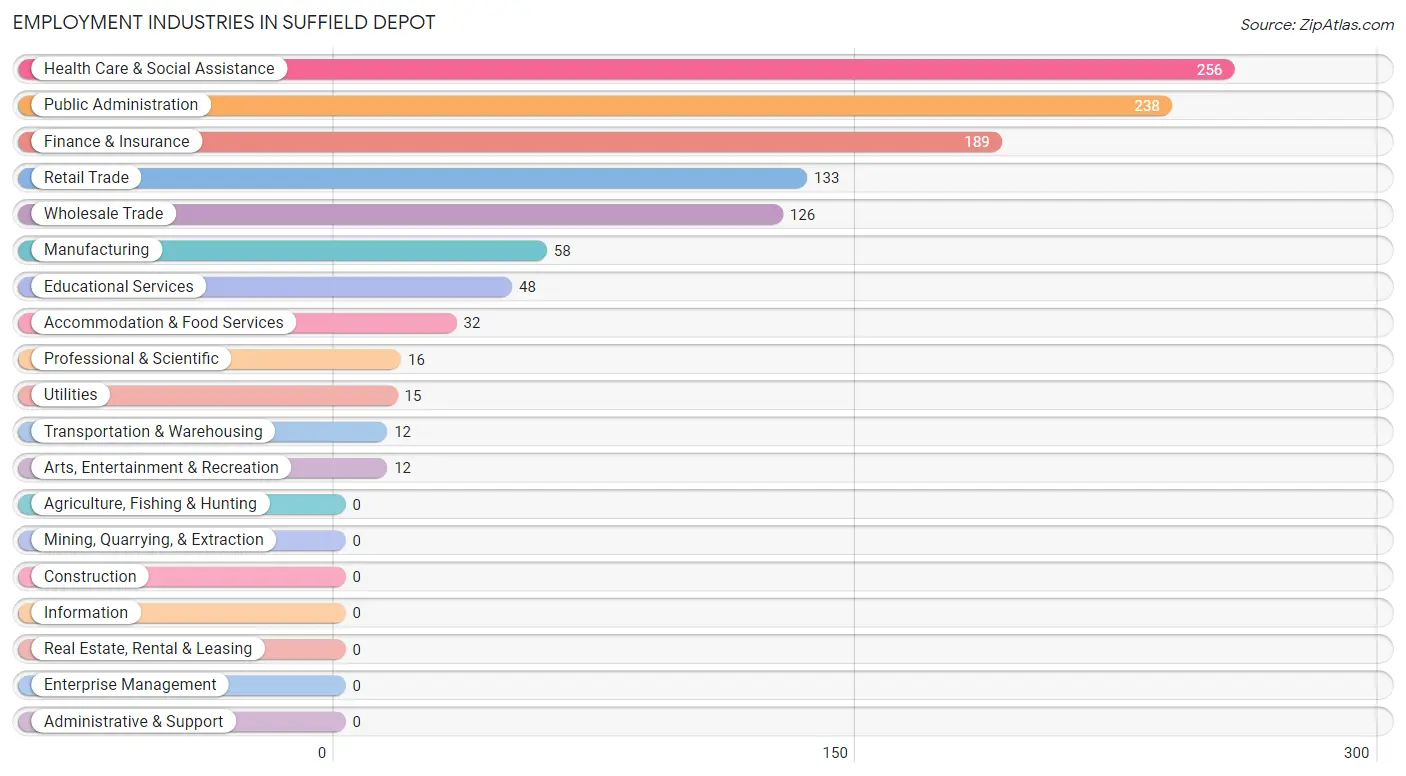
Employment Industries in Suffield Depot
The major employment industries in Suffield Depot include Health Care & Social Assistance (256 | 22.3%), Public Administration (238 | 20.7%), Finance & Insurance (189 | 16.5%), Retail Trade (133 | 11.6%), and Wholesale Trade (126 | 11.0%).
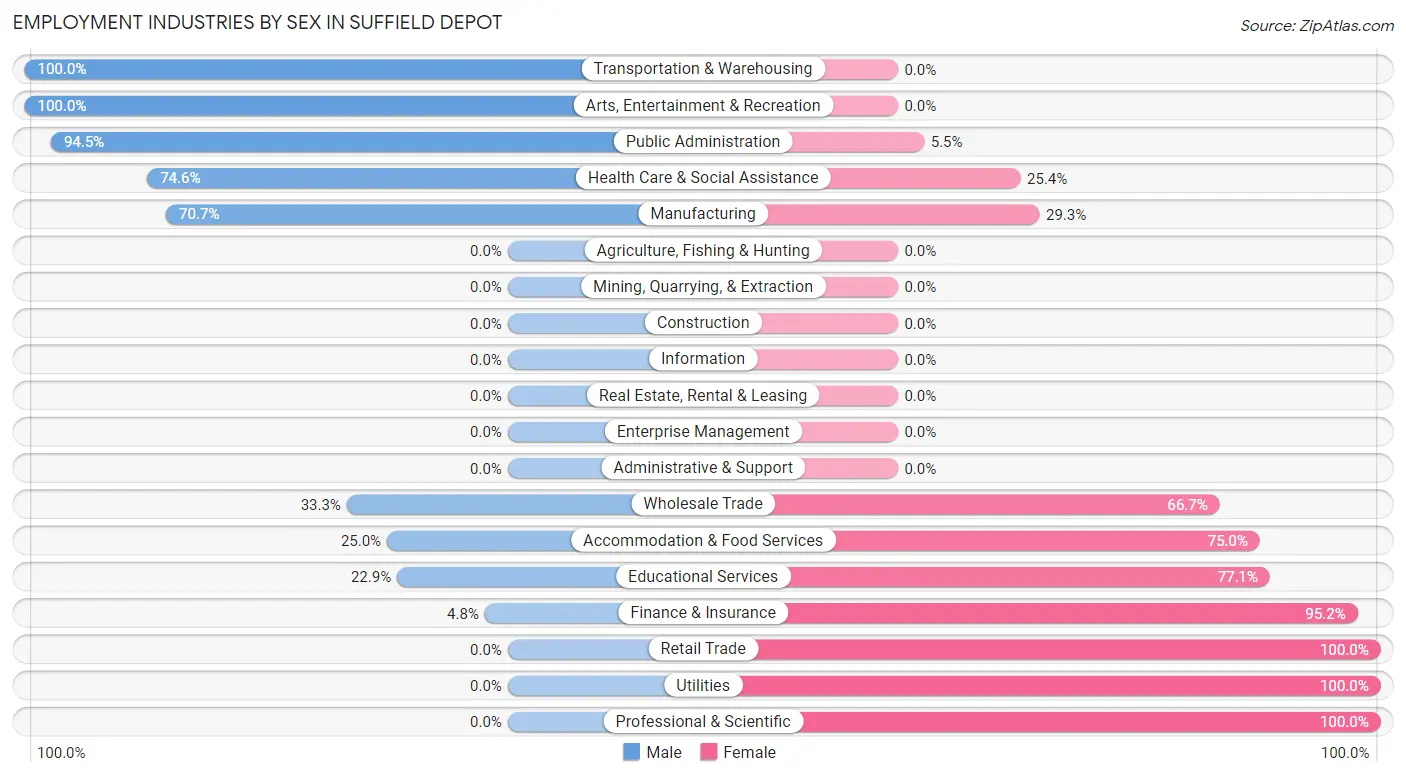
Employment Industries by Sex in Suffield Depot
The Suffield Depot industries that see more men than women are Transportation & Warehousing (100.0%), Arts, Entertainment & Recreation (100.0%), and Public Administration (94.5%), whereas the industries that tend to have a higher number of women are Retail Trade (100.0%), Utilities (100.0%), and Professional & Scientific (100.0%).
| Industry | Male | Female |
| Agriculture, Fishing & Hunting | 0 (0.0%) | 0 (0.0%) |
| Mining, Quarrying, & Extraction | 0 (0.0%) | 0 (0.0%) |
| Construction | 0 (0.0%) | 0 (0.0%) |
| Manufacturing | 41 (70.7%) | 17 (29.3%) |
| Wholesale Trade | 42 (33.3%) | 84 (66.7%) |
| Retail Trade | 0 (0.0%) | 133 (100.0%) |
| Transportation & Warehousing | 12 (100.0%) | 0 (0.0%) |
| Utilities | 0 (0.0%) | 15 (100.0%) |
| Information | 0 (0.0%) | 0 (0.0%) |
| Finance & Insurance | 9 (4.8%) | 180 (95.2%) |
| Real Estate, Rental & Leasing | 0 (0.0%) | 0 (0.0%) |
| Professional & Scientific | 0 (0.0%) | 16 (100.0%) |
| Enterprise Management | 0 (0.0%) | 0 (0.0%) |
| Administrative & Support | 0 (0.0%) | 0 (0.0%) |
| Educational Services | 11 (22.9%) | 37 (77.1%) |
| Health Care & Social Assistance | 191 (74.6%) | 65 (25.4%) |
| Arts, Entertainment & Recreation | 12 (100.0%) | 0 (0.0%) |
| Accommodation & Food Services | 8 (25.0%) | 24 (75.0%) |
| Public Administration | 225 (94.5%) | 13 (5.5%) |
| Total | 565 (49.2%) | 584 (50.8%) |
Education in Suffield Depot
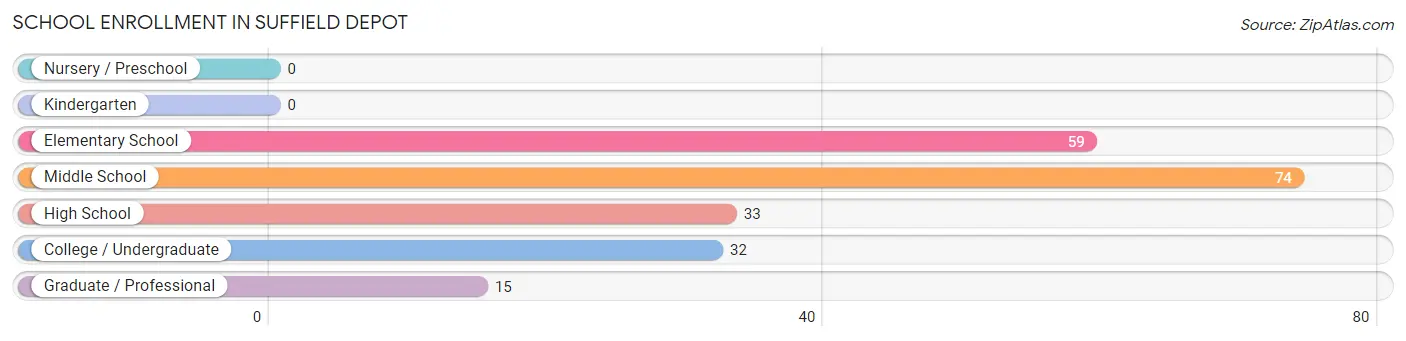
School Enrollment in Suffield Depot
The most common levels of schooling among the 213 students in Suffield Depot are middle school (74 | 34.7%), elementary school (59 | 27.7%), and high school (33 | 15.5%).
| School Level | # Students | % Students |
| Nursery / Preschool | 0 | 0.0% |
| Kindergarten | 0 | 0.0% |
| Elementary School | 59 | 27.7% |
| Middle School | 74 | 34.7% |
| High School | 33 | 15.5% |
| College / Undergraduate | 32 | 15.0% |
| Graduate / Professional | 15 | 7.0% |
| Total | 213 | 100.0% |
School Enrollment by Age by Funding Source in Suffield Depot
Out of a total of 213 students who are enrolled in schools in Suffield Depot, 31 (14.6%) attend a private institution, while the remaining 182 (85.4%) are enrolled in public schools. The age group of 20 to 24 year olds has the highest likelihood of being enrolled in private schools, with 24 (100.0% in the age bracket) enrolled. Conversely, the age group of 5 to 9 year old has the lowest likelihood of being enrolled in a private school, with 59 (100.0% in the age bracket) attending a public institution.
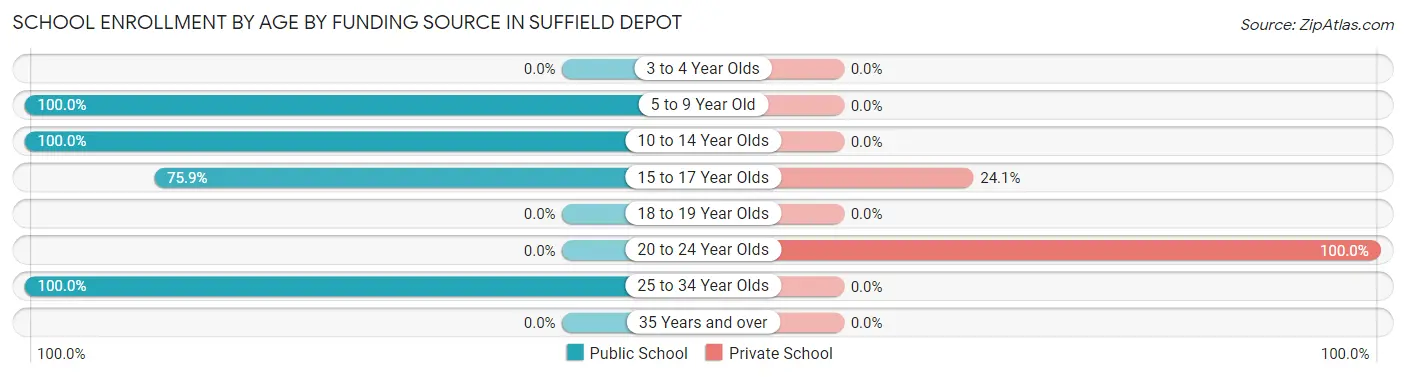
| Age Bracket | Public School | Private School |
| 3 to 4 Year Olds | 0 (0.0%) | 0 (0.0%) |
| 5 to 9 Year Old | 59 (100.0%) | 0 (0.0%) |
| 10 to 14 Year Olds | 78 (100.0%) | 0 (0.0%) |
| 15 to 17 Year Olds | 22 (75.9%) | 7 (24.1%) |
| 18 to 19 Year Olds | 0 (0.0%) | 0 (0.0%) |
| 20 to 24 Year Olds | 0 (0.0%) | 24 (100.0%) |
| 25 to 34 Year Olds | 23 (100.0%) | 0 (0.0%) |
| 35 Years and over | 0 (0.0%) | 0 (0.0%) |
| Total | 182 (85.4%) | 31 (14.6%) |
Educational Attainment by Field of Study in Suffield Depot
Business (251 | 50.4%), social sciences (70 | 14.1%), engineering (61 | 12.2%), education (52 | 10.4%), and liberal arts & history (16 | 3.2%) are the most common fields of study among 498 individuals in Suffield Depot who have obtained a bachelor's degree or higher.
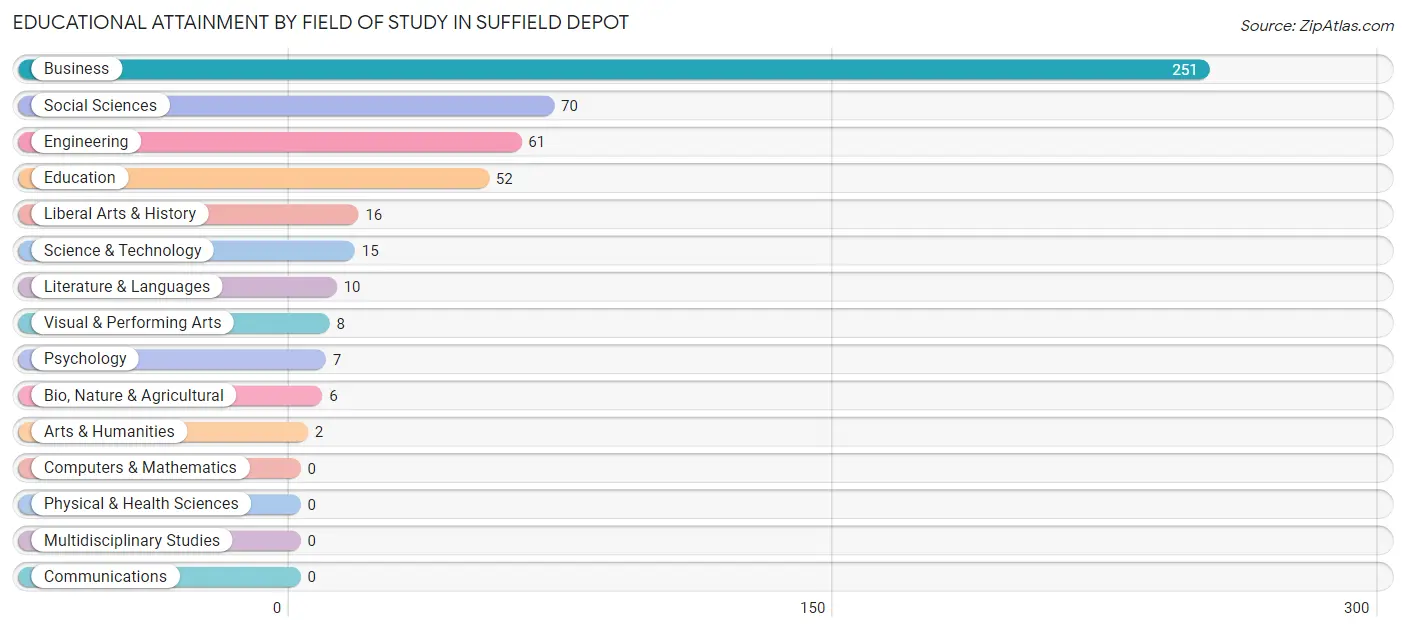
| Field of Study | # Graduates | % Graduates |
| Computers & Mathematics | 0 | 0.0% |
| Bio, Nature & Agricultural | 6 | 1.2% |
| Physical & Health Sciences | 0 | 0.0% |
| Psychology | 7 | 1.4% |
| Social Sciences | 70 | 14.1% |
| Engineering | 61 | 12.2% |
| Multidisciplinary Studies | 0 | 0.0% |
| Science & Technology | 15 | 3.0% |
| Business | 251 | 50.4% |
| Education | 52 | 10.4% |
| Literature & Languages | 10 | 2.0% |
| Liberal Arts & History | 16 | 3.2% |
| Visual & Performing Arts | 8 | 1.6% |
| Communications | 0 | 0.0% |
| Arts & Humanities | 2 | 0.4% |
| Total | 498 | 100.0% |
Transportation & Commute in Suffield Depot
Vehicle Availability by Sex in Suffield Depot
The most prevalent vehicle ownership categories in Suffield Depot are males with 4 vehicles (387, accounting for 70.9%) and females with 4 vehicles (171, making up 69.2%).
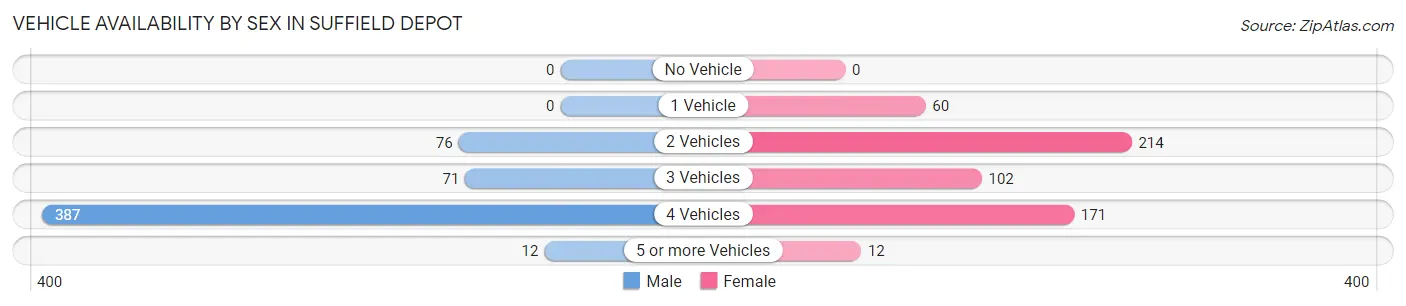
| Vehicles Available | Male | Female |
| No Vehicle | 0 (0.0%) | 0 (0.0%) |
| 1 Vehicle | 0 (0.0%) | 60 (10.7%) |
| 2 Vehicles | 76 (13.9%) | 214 (38.3%) |
| 3 Vehicles | 71 (13.0%) | 102 (18.2%) |
| 4 Vehicles | 387 (70.9%) | 171 (30.6%) |
| 5 or more Vehicles | 12 (2.2%) | 12 (2.1%) |
| Total | 546 (100.0%) | 559 (100.0%) |
Commute Time in Suffield Depot
The most frequently occuring commute durations in Suffield Depot are 10 to 14 minutes (213 commuters, 23.5%), 25 to 29 minutes (207 commuters, 22.8%), and 45 to 59 minutes (203 commuters, 22.4%).
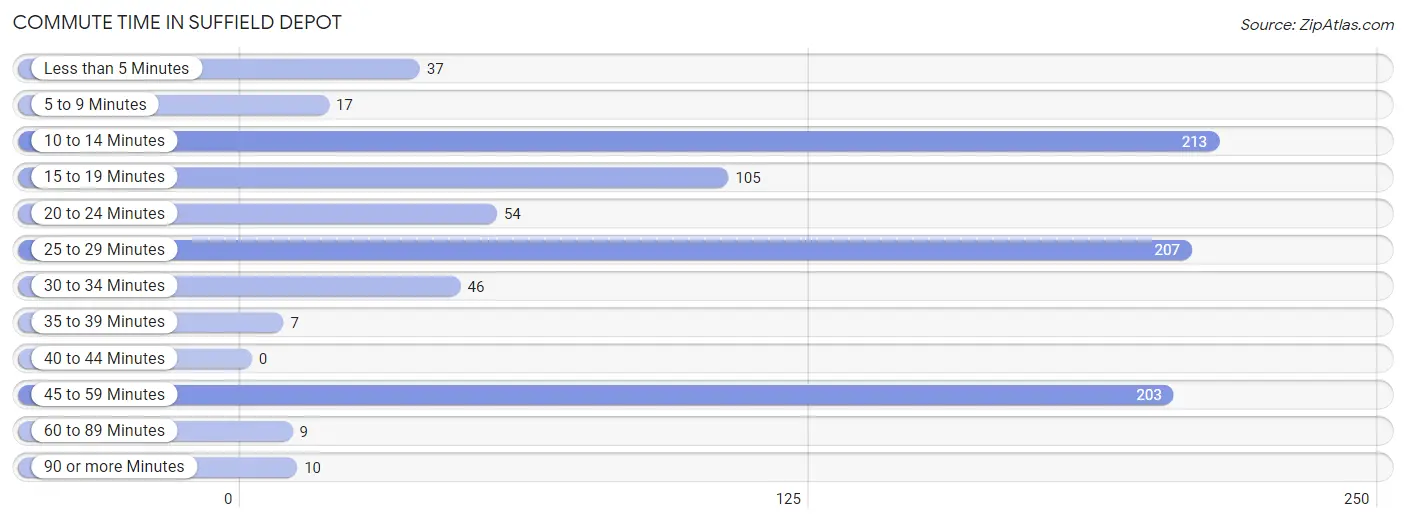
| Commute Time | # Commuters | % Commuters |
| Less than 5 Minutes | 37 | 4.1% |
| 5 to 9 Minutes | 17 | 1.9% |
| 10 to 14 Minutes | 213 | 23.5% |
| 15 to 19 Minutes | 105 | 11.6% |
| 20 to 24 Minutes | 54 | 5.9% |
| 25 to 29 Minutes | 207 | 22.8% |
| 30 to 34 Minutes | 46 | 5.1% |
| 35 to 39 Minutes | 7 | 0.8% |
| 40 to 44 Minutes | 0 | 0.0% |
| 45 to 59 Minutes | 203 | 22.4% |
| 60 to 89 Minutes | 9 | 1.0% |
| 90 or more Minutes | 10 | 1.1% |
Commute Time by Sex in Suffield Depot
The most common commute times in Suffield Depot are 25 to 29 minutes (200 commuters, 37.0%) for males and 10 to 14 minutes (201 commuters, 54.8%) for females.
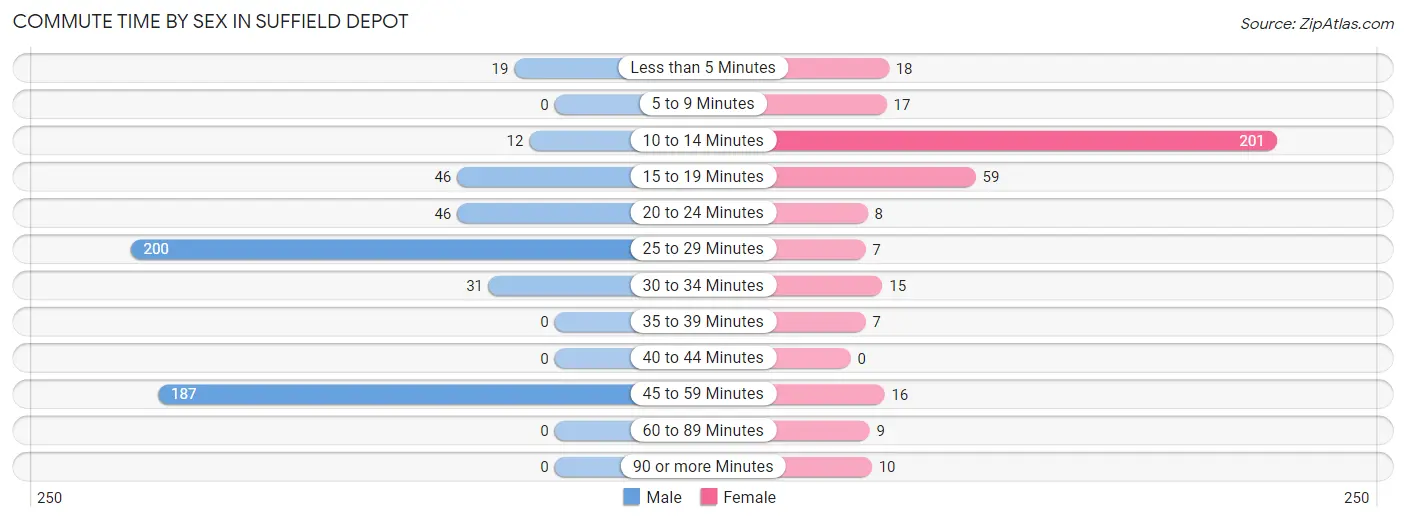
| Commute Time | Male | Female |
| Less than 5 Minutes | 19 (3.5%) | 18 (4.9%) |
| 5 to 9 Minutes | 0 (0.0%) | 17 (4.6%) |
| 10 to 14 Minutes | 12 (2.2%) | 201 (54.8%) |
| 15 to 19 Minutes | 46 (8.5%) | 59 (16.1%) |
| 20 to 24 Minutes | 46 (8.5%) | 8 (2.2%) |
| 25 to 29 Minutes | 200 (37.0%) | 7 (1.9%) |
| 30 to 34 Minutes | 31 (5.7%) | 15 (4.1%) |
| 35 to 39 Minutes | 0 (0.0%) | 7 (1.9%) |
| 40 to 44 Minutes | 0 (0.0%) | 0 (0.0%) |
| 45 to 59 Minutes | 187 (34.6%) | 16 (4.4%) |
| 60 to 89 Minutes | 0 (0.0%) | 9 (2.5%) |
| 90 or more Minutes | 0 (0.0%) | 10 (2.7%) |
Time of Departure to Work by Sex in Suffield Depot
The most frequent times of departure to work in Suffield Depot are 6:30 AM to 6:59 AM (207, 38.3%) for males and 7:30 AM to 7:59 AM (251, 68.4%) for females.
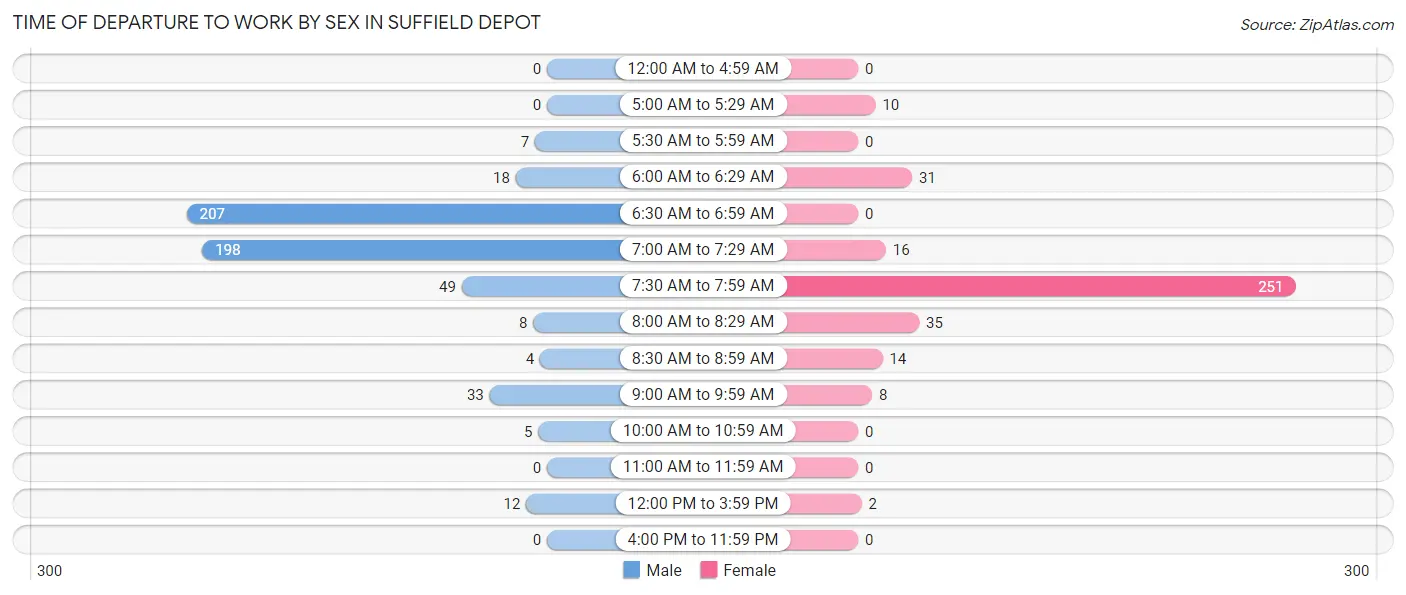
| Time of Departure | Male | Female |
| 12:00 AM to 4:59 AM | 0 (0.0%) | 0 (0.0%) |
| 5:00 AM to 5:29 AM | 0 (0.0%) | 10 (2.7%) |
| 5:30 AM to 5:59 AM | 7 (1.3%) | 0 (0.0%) |
| 6:00 AM to 6:29 AM | 18 (3.3%) | 31 (8.5%) |
| 6:30 AM to 6:59 AM | 207 (38.3%) | 0 (0.0%) |
| 7:00 AM to 7:29 AM | 198 (36.6%) | 16 (4.4%) |
| 7:30 AM to 7:59 AM | 49 (9.1%) | 251 (68.4%) |
| 8:00 AM to 8:29 AM | 8 (1.5%) | 35 (9.5%) |
| 8:30 AM to 8:59 AM | 4 (0.7%) | 14 (3.8%) |
| 9:00 AM to 9:59 AM | 33 (6.1%) | 8 (2.2%) |
| 10:00 AM to 10:59 AM | 5 (0.9%) | 0 (0.0%) |
| 11:00 AM to 11:59 AM | 0 (0.0%) | 0 (0.0%) |
| 12:00 PM to 3:59 PM | 12 (2.2%) | 2 (0.5%) |
| 4:00 PM to 11:59 PM | 0 (0.0%) | 0 (0.0%) |
| Total | 541 (100.0%) | 367 (100.0%) |
Housing Occupancy in Suffield Depot
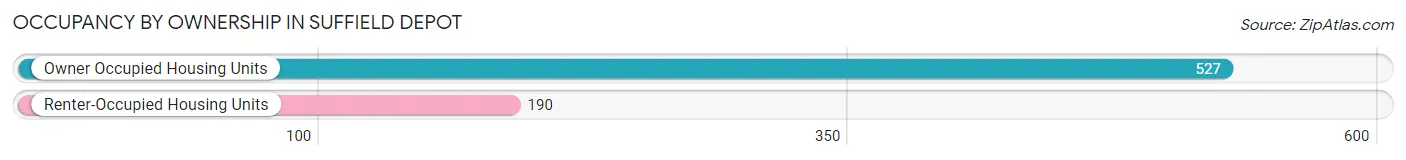
Occupancy by Ownership in Suffield Depot
Of the total 717 dwellings in Suffield Depot, owner-occupied units account for 527 (73.5%), while renter-occupied units make up 190 (26.5%).
| Occupancy | # Housing Units | % Housing Units |
| Owner Occupied Housing Units | 527 | 73.5% |
| Renter-Occupied Housing Units | 190 | 26.5% |
| Total Occupied Housing Units | 717 | 100.0% |
Occupancy by Household Size in Suffield Depot
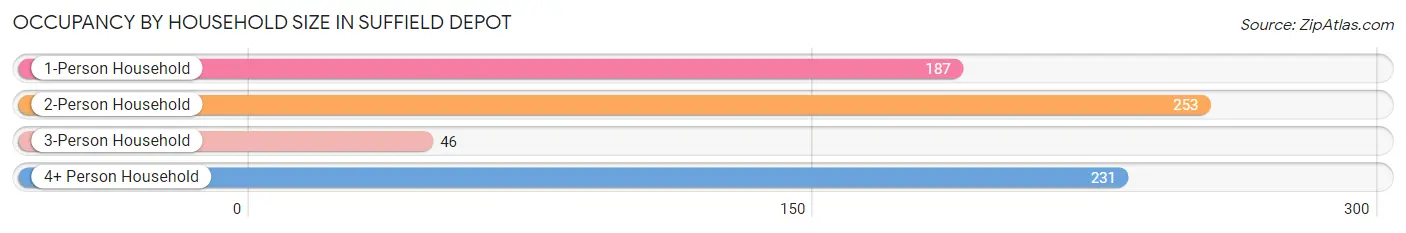
| Household Size | # Housing Units | % Housing Units |
| 1-Person Household | 187 | 26.1% |
| 2-Person Household | 253 | 35.3% |
| 3-Person Household | 46 | 6.4% |
| 4+ Person Household | 231 | 32.2% |
| Total Housing Units | 717 | 100.0% |
Occupancy by Ownership by Household Size in Suffield Depot
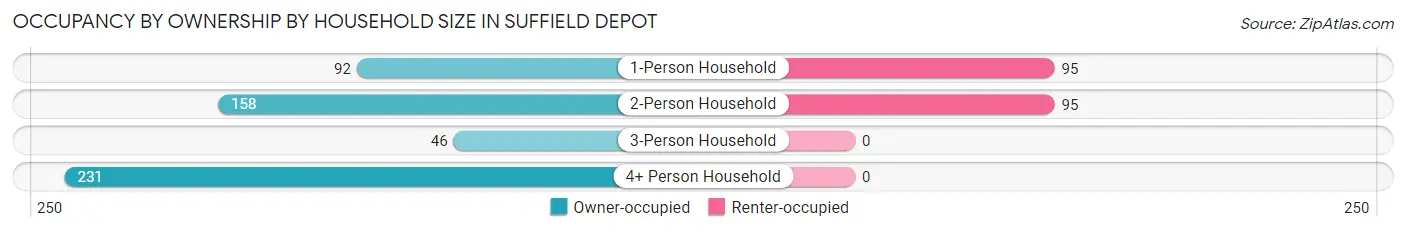
| Household Size | Owner-occupied | Renter-occupied |
| 1-Person Household | 92 (49.2%) | 95 (50.8%) |
| 2-Person Household | 158 (62.5%) | 95 (37.6%) |
| 3-Person Household | 46 (100.0%) | 0 (0.0%) |
| 4+ Person Household | 231 (100.0%) | 0 (0.0%) |
| Total Housing Units | 527 (73.5%) | 190 (26.5%) |
Occupancy by Educational Attainment in Suffield Depot
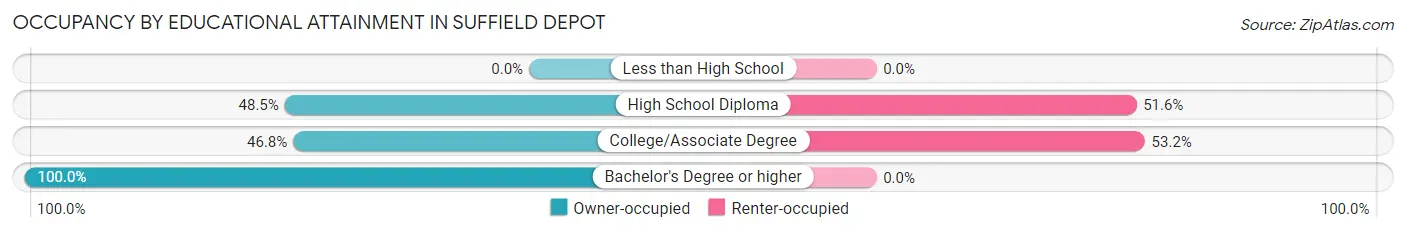
| Household Size | Owner-occupied | Renter-occupied |
| Less than High School | 0 (0.0%) | 0 (0.0%) |
| High School Diploma | 78 (48.4%) | 83 (51.5%) |
| College/Associate Degree | 94 (46.8%) | 107 (53.2%) |
| Bachelor's Degree or higher | 355 (100.0%) | 0 (0.0%) |
Occupancy by Age of Householder in Suffield Depot
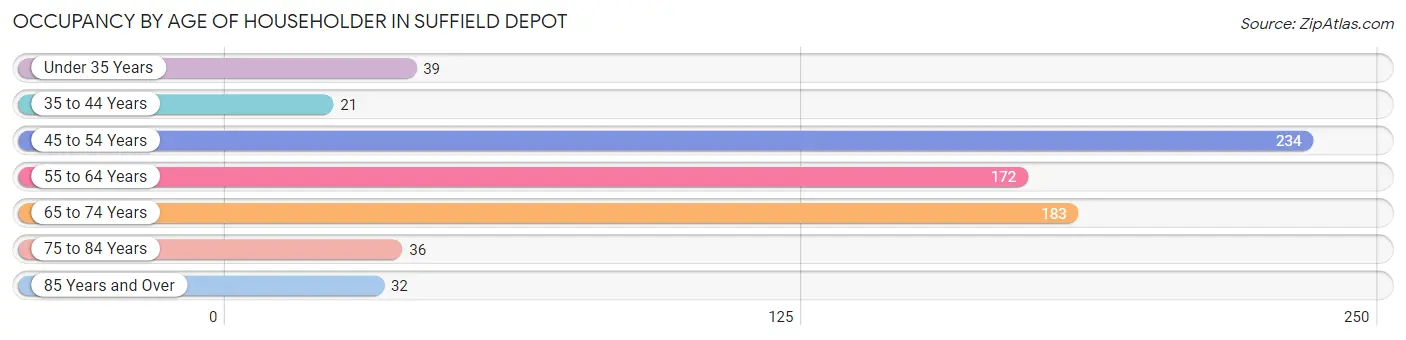
| Age Bracket | # Households | % Households |
| Under 35 Years | 39 | 5.4% |
| 35 to 44 Years | 21 | 2.9% |
| 45 to 54 Years | 234 | 32.6% |
| 55 to 64 Years | 172 | 24.0% |
| 65 to 74 Years | 183 | 25.5% |
| 75 to 84 Years | 36 | 5.0% |
| 85 Years and Over | 32 | 4.5% |
| Total | 717 | 100.0% |
Housing Finances in Suffield Depot
Median Income by Occupancy in Suffield Depot
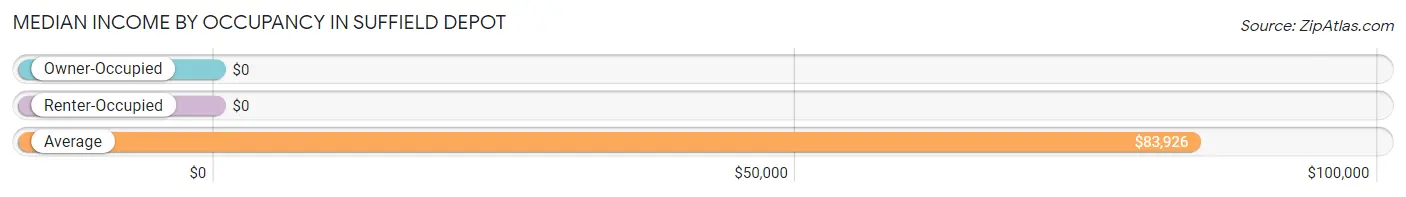
| Occupancy Type | # Households | Median Income |
| Owner-Occupied | 527 (73.5%) | $0 |
| Renter-Occupied | 190 (26.5%) | $0 |
| Average | 717 (100.0%) | $83,926 |
Occupancy by Householder Income Bracket in Suffield Depot
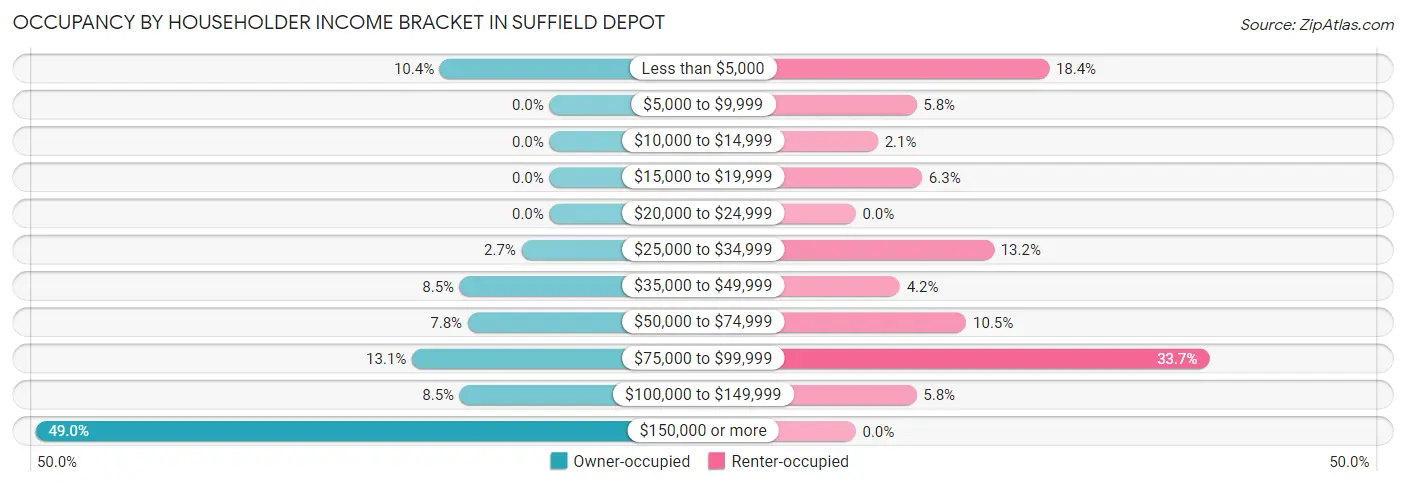
| Income Bracket | Owner-occupied | Renter-occupied |
| Less than $5,000 | 55 (10.4%) | 35 (18.4%) |
| $5,000 to $9,999 | 0 (0.0%) | 11 (5.8%) |
| $10,000 to $14,999 | 0 (0.0%) | 4 (2.1%) |
| $15,000 to $19,999 | 0 (0.0%) | 12 (6.3%) |
| $20,000 to $24,999 | 0 (0.0%) | 0 (0.0%) |
| $25,000 to $34,999 | 14 (2.7%) | 25 (13.2%) |
| $35,000 to $49,999 | 45 (8.5%) | 8 (4.2%) |
| $50,000 to $74,999 | 41 (7.8%) | 20 (10.5%) |
| $75,000 to $99,999 | 69 (13.1%) | 64 (33.7%) |
| $100,000 to $149,999 | 45 (8.5%) | 11 (5.8%) |
| $150,000 or more | 258 (49.0%) | 0 (0.0%) |
| Total | 527 (100.0%) | 190 (100.0%) |
Monthly Housing Cost Tiers in Suffield Depot
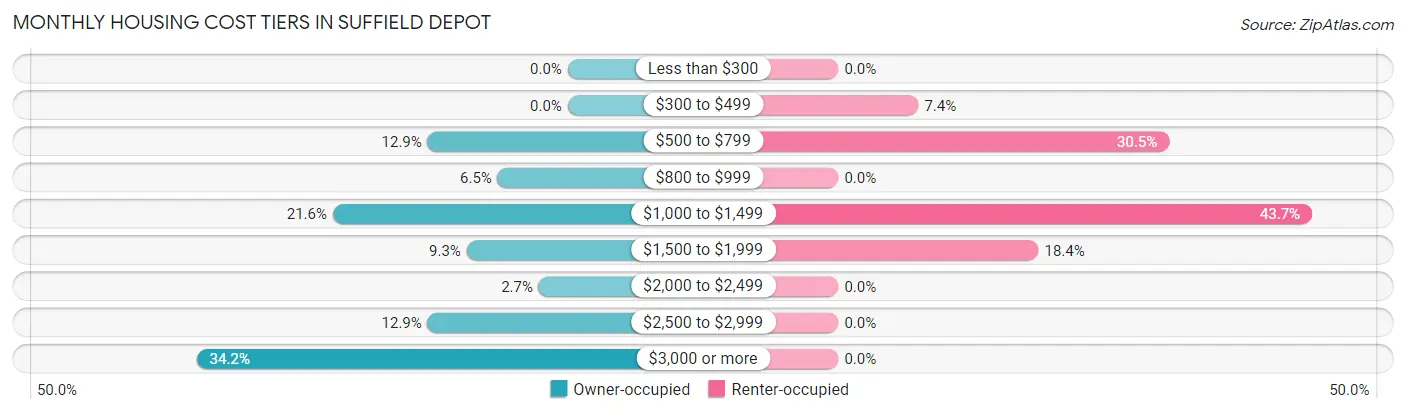
| Monthly Cost | Owner-occupied | Renter-occupied |
| Less than $300 | 0 (0.0%) | 0 (0.0%) |
| $300 to $499 | 0 (0.0%) | 14 (7.4%) |
| $500 to $799 | 68 (12.9%) | 58 (30.5%) |
| $800 to $999 | 34 (6.5%) | 0 (0.0%) |
| $1,000 to $1,499 | 114 (21.6%) | 83 (43.7%) |
| $1,500 to $1,999 | 49 (9.3%) | 35 (18.4%) |
| $2,000 to $2,499 | 14 (2.7%) | 0 (0.0%) |
| $2,500 to $2,999 | 68 (12.9%) | 0 (0.0%) |
| $3,000 or more | 180 (34.2%) | 0 (0.0%) |
| Total | 527 (100.0%) | 190 (100.0%) |
Physical Housing Characteristics in Suffield Depot
Housing Structures in Suffield Depot
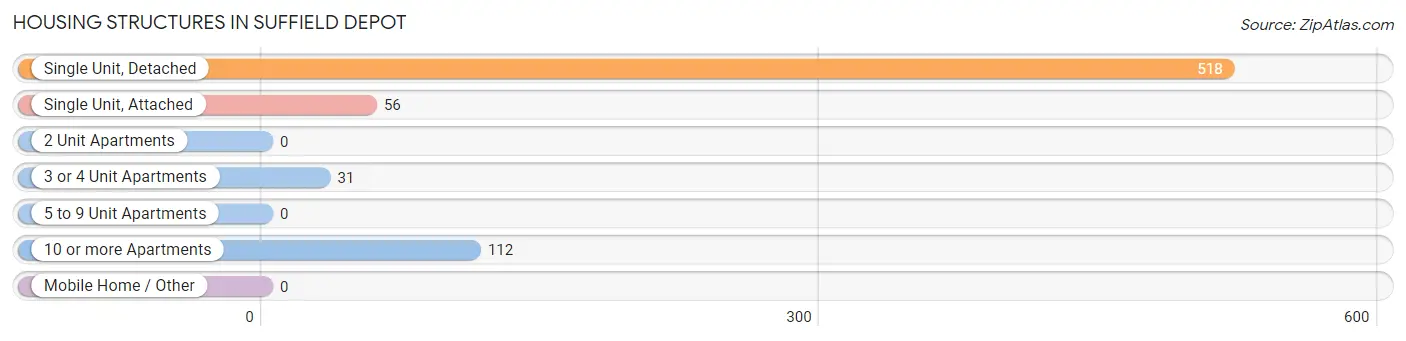
| Structure Type | # Housing Units | % Housing Units |
| Single Unit, Detached | 518 | 72.3% |
| Single Unit, Attached | 56 | 7.8% |
| 2 Unit Apartments | 0 | 0.0% |
| 3 or 4 Unit Apartments | 31 | 4.3% |
| 5 to 9 Unit Apartments | 0 | 0.0% |
| 10 or more Apartments | 112 | 15.6% |
| Mobile Home / Other | 0 | 0.0% |
| Total | 717 | 100.0% |
Housing Structures by Occupancy in Suffield Depot
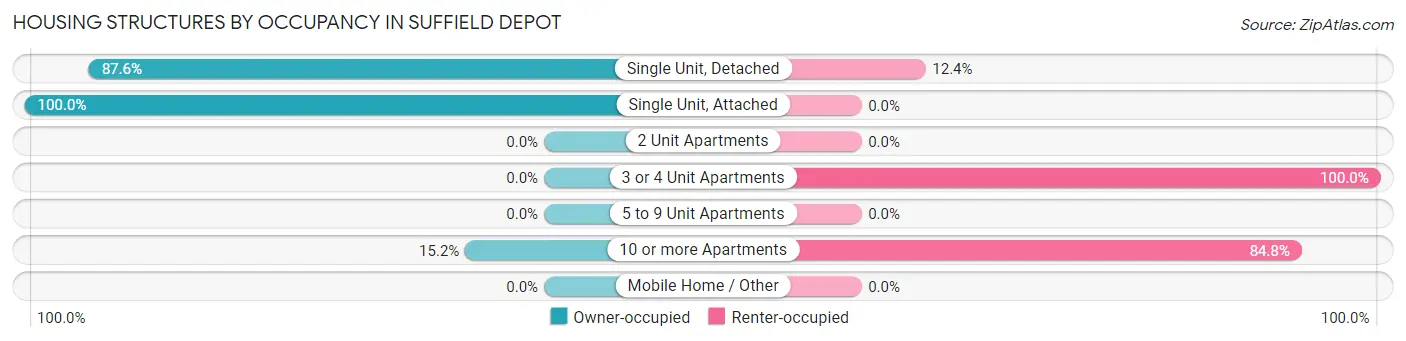
| Structure Type | Owner-occupied | Renter-occupied |
| Single Unit, Detached | 454 (87.6%) | 64 (12.4%) |
| Single Unit, Attached | 56 (100.0%) | 0 (0.0%) |
| 2 Unit Apartments | 0 (0.0%) | 0 (0.0%) |
| 3 or 4 Unit Apartments | 0 (0.0%) | 31 (100.0%) |
| 5 to 9 Unit Apartments | 0 (0.0%) | 0 (0.0%) |
| 10 or more Apartments | 17 (15.2%) | 95 (84.8%) |
| Mobile Home / Other | 0 (0.0%) | 0 (0.0%) |
| Total | 527 (73.5%) | 190 (26.5%) |
Housing Structures by Number of Rooms in Suffield Depot
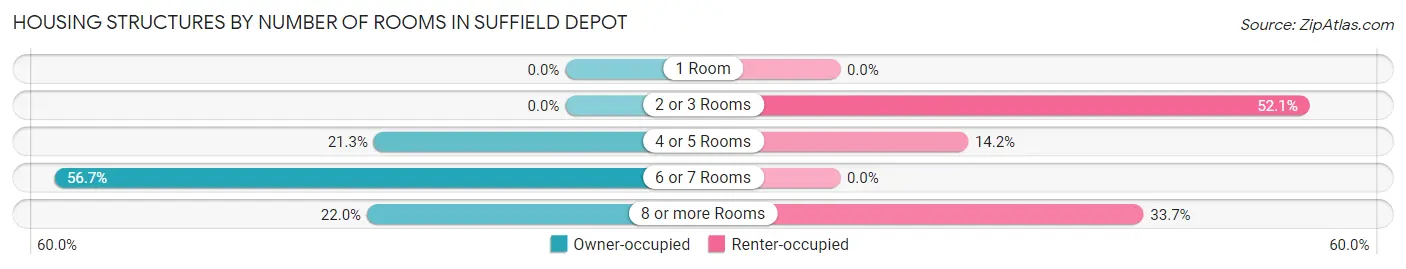
| Number of Rooms | Owner-occupied | Renter-occupied |
| 1 Room | 0 (0.0%) | 0 (0.0%) |
| 2 or 3 Rooms | 0 (0.0%) | 99 (52.1%) |
| 4 or 5 Rooms | 112 (21.2%) | 27 (14.2%) |
| 6 or 7 Rooms | 299 (56.7%) | 0 (0.0%) |
| 8 or more Rooms | 116 (22.0%) | 64 (33.7%) |
| Total | 527 (100.0%) | 190 (100.0%) |
Housing Structure by Heating Type in Suffield Depot
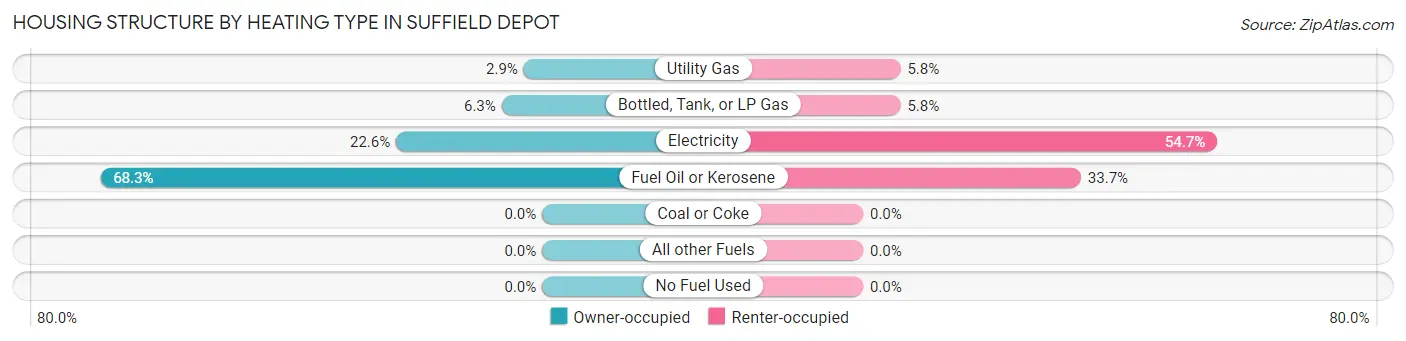
| Heating Type | Owner-occupied | Renter-occupied |
| Utility Gas | 15 (2.9%) | 11 (5.8%) |
| Bottled, Tank, or LP Gas | 33 (6.3%) | 11 (5.8%) |
| Electricity | 119 (22.6%) | 104 (54.7%) |
| Fuel Oil or Kerosene | 360 (68.3%) | 64 (33.7%) |
| Coal or Coke | 0 (0.0%) | 0 (0.0%) |
| All other Fuels | 0 (0.0%) | 0 (0.0%) |
| No Fuel Used | 0 (0.0%) | 0 (0.0%) |
| Total | 527 (100.0%) | 190 (100.0%) |
Household Vehicle Usage in Suffield Depot
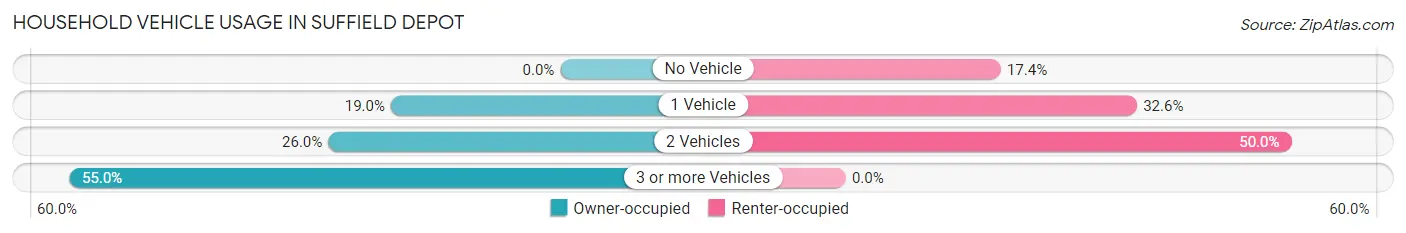
| Vehicles per Household | Owner-occupied | Renter-occupied |
| No Vehicle | 0 (0.0%) | 33 (17.4%) |
| 1 Vehicle | 100 (19.0%) | 62 (32.6%) |
| 2 Vehicles | 137 (26.0%) | 95 (50.0%) |
| 3 or more Vehicles | 290 (55.0%) | 0 (0.0%) |
| Total | 527 (100.0%) | 190 (100.0%) |
Real Estate & Mortgages in Suffield Depot
Real Estate and Mortgage Overview in Suffield Depot
| Characteristic | Without Mortgage | With Mortgage |
| Housing Units | 176 | 351 |
| Median Property Value | $443,800 | $348,400 |
| Median Household Income | - | - |
| Monthly Housing Costs | $1,023 | $180 |
| Real Estate Taxes | $6,033 | $0 |
Property Value by Mortgage Status in Suffield Depot
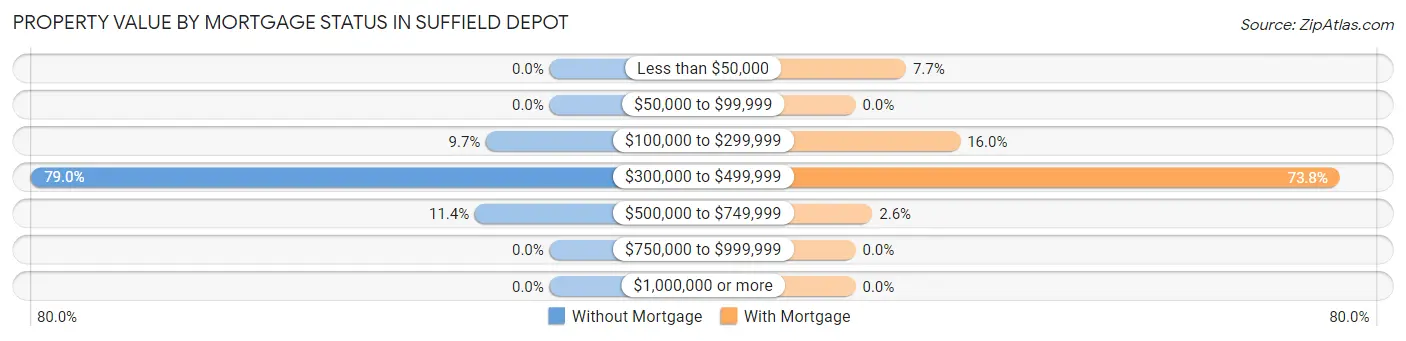
| Property Value | Without Mortgage | With Mortgage |
| Less than $50,000 | 0 (0.0%) | 27 (7.7%) |
| $50,000 to $99,999 | 0 (0.0%) | 0 (0.0%) |
| $100,000 to $299,999 | 17 (9.7%) | 56 (16.0%) |
| $300,000 to $499,999 | 139 (79.0%) | 259 (73.8%) |
| $500,000 to $749,999 | 20 (11.4%) | 9 (2.6%) |
| $750,000 to $999,999 | 0 (0.0%) | 0 (0.0%) |
| $1,000,000 or more | 0 (0.0%) | 0 (0.0%) |
| Total | 176 (100.0%) | 351 (100.0%) |
Household Income by Mortgage Status in Suffield Depot
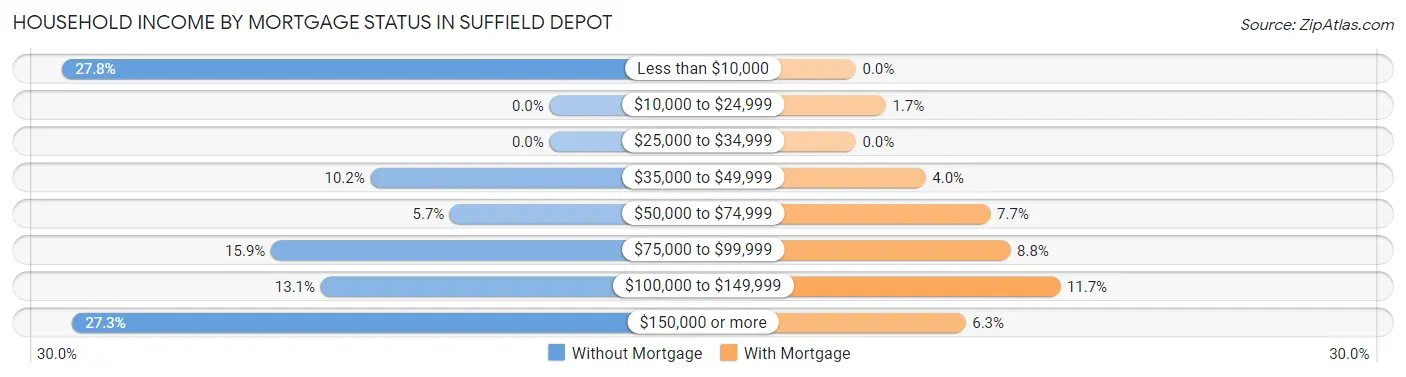
| Household Income | Without Mortgage | With Mortgage |
| Less than $10,000 | 49 (27.8%) | 0 (0.0%) |
| $10,000 to $24,999 | 0 (0.0%) | 6 (1.7%) |
| $25,000 to $34,999 | 0 (0.0%) | 0 (0.0%) |
| $35,000 to $49,999 | 18 (10.2%) | 14 (4.0%) |
| $50,000 to $74,999 | 10 (5.7%) | 27 (7.7%) |
| $75,000 to $99,999 | 28 (15.9%) | 31 (8.8%) |
| $100,000 to $149,999 | 23 (13.1%) | 41 (11.7%) |
| $150,000 or more | 48 (27.3%) | 22 (6.3%) |
| Total | 176 (100.0%) | 351 (100.0%) |
Property Value to Household Income Ratio in Suffield Depot
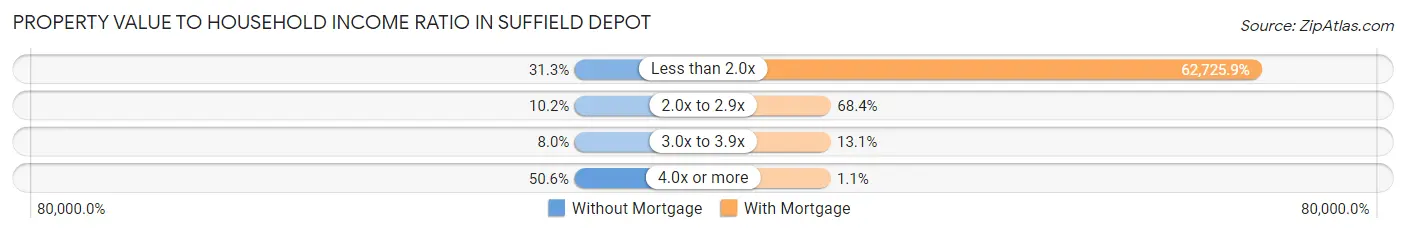
| Value-to-Income Ratio | Without Mortgage | With Mortgage |
| Less than 2.0x | 55 (31.2%) | 220,168 (62,725.9%) |
| 2.0x to 2.9x | 18 (10.2%) | 240 (68.4%) |
| 3.0x to 3.9x | 14 (8.0%) | 46 (13.1%) |
| 4.0x or more | 89 (50.6%) | 4 (1.1%) |
| Total | 176 (100.0%) | 351 (100.0%) |
Real Estate Taxes by Mortgage Status in Suffield Depot
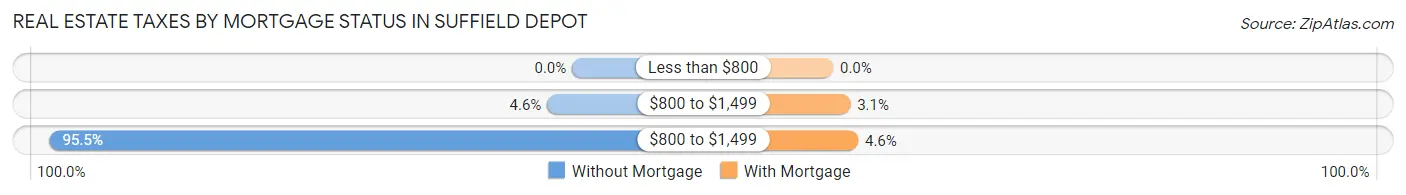
| Property Taxes | Without Mortgage | With Mortgage |
| Less than $800 | 0 (0.0%) | 0 (0.0%) |
| $800 to $1,499 | 8 (4.5%) | 11 (3.1%) |
| $800 to $1,499 | 168 (95.5%) | 16 (4.6%) |
| Total | 176 (100.0%) | 351 (100.0%) |
Health & Disability in Suffield Depot
Health Insurance Coverage by Age in Suffield Depot
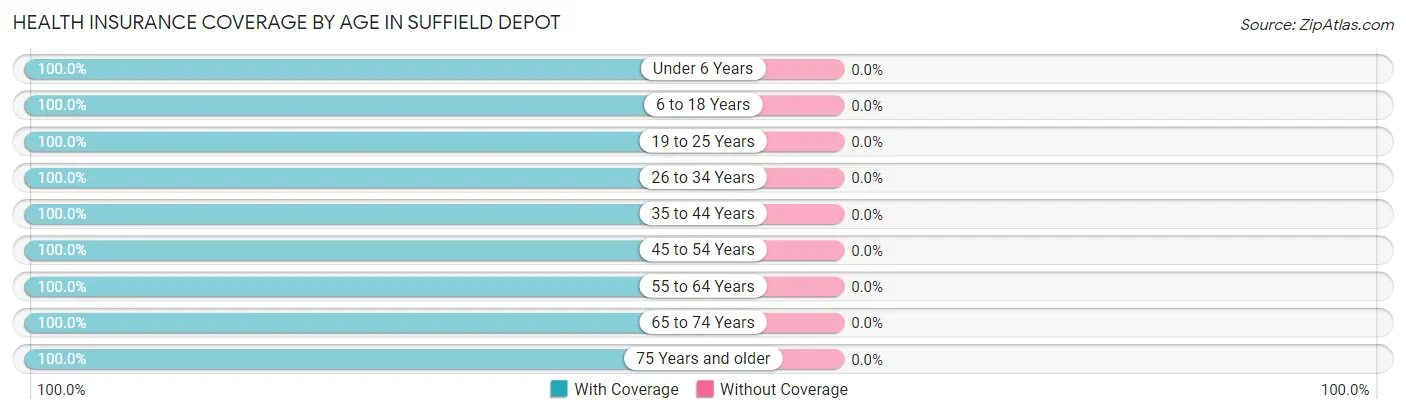
| Age Bracket | With Coverage | Without Coverage |
| Under 6 Years | 21 (100.0%) | 0 (0.0%) |
| 6 to 18 Years | 166 (100.0%) | 0 (0.0%) |
| 19 to 25 Years | 413 (100.0%) | 0 (0.0%) |
| 26 to 34 Years | 55 (100.0%) | 0 (0.0%) |
| 35 to 44 Years | 77 (100.0%) | 0 (0.0%) |
| 45 to 54 Years | 293 (100.0%) | 0 (0.0%) |
| 55 to 64 Years | 521 (100.0%) | 0 (0.0%) |
| 65 to 74 Years | 231 (100.0%) | 0 (0.0%) |
| 75 Years and older | 109 (100.0%) | 0 (0.0%) |
| Total | 1,886 (100.0%) | 0 (0.0%) |
Health Insurance Coverage by Citizenship Status in Suffield Depot
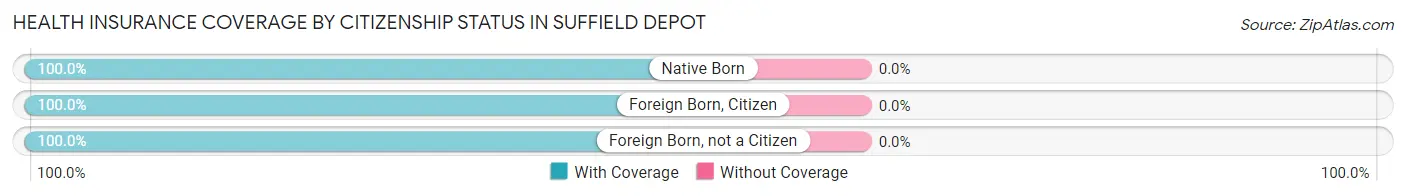
| Citizenship Status | With Coverage | Without Coverage |
| Native Born | 21 (100.0%) | 0 (0.0%) |
| Foreign Born, Citizen | 166 (100.0%) | 0 (0.0%) |
| Foreign Born, not a Citizen | 413 (100.0%) | 0 (0.0%) |
Health Insurance Coverage by Household Income in Suffield Depot
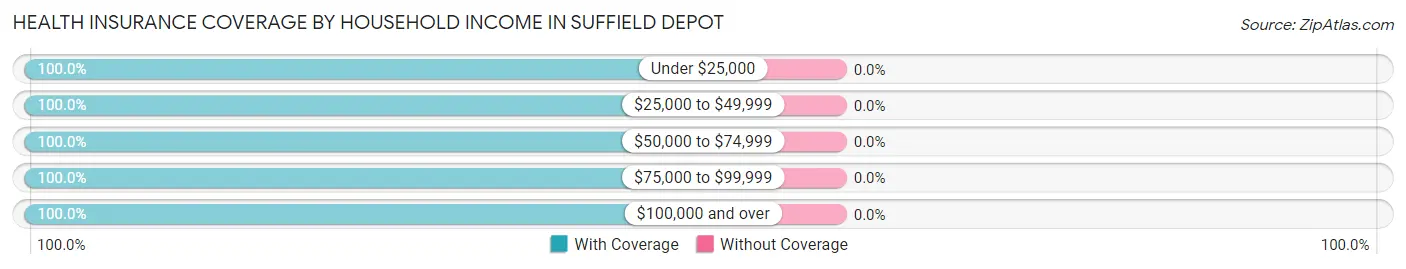
| Household Income | With Coverage | Without Coverage |
| Under $25,000 | 176 (100.0%) | 0 (0.0%) |
| $25,000 to $49,999 | 141 (100.0%) | 0 (0.0%) |
| $50,000 to $74,999 | 82 (100.0%) | 0 (0.0%) |
| $75,000 to $99,999 | 306 (100.0%) | 0 (0.0%) |
| $100,000 and over | 1,136 (100.0%) | 0 (0.0%) |
Public vs Private Health Insurance Coverage by Age in Suffield Depot
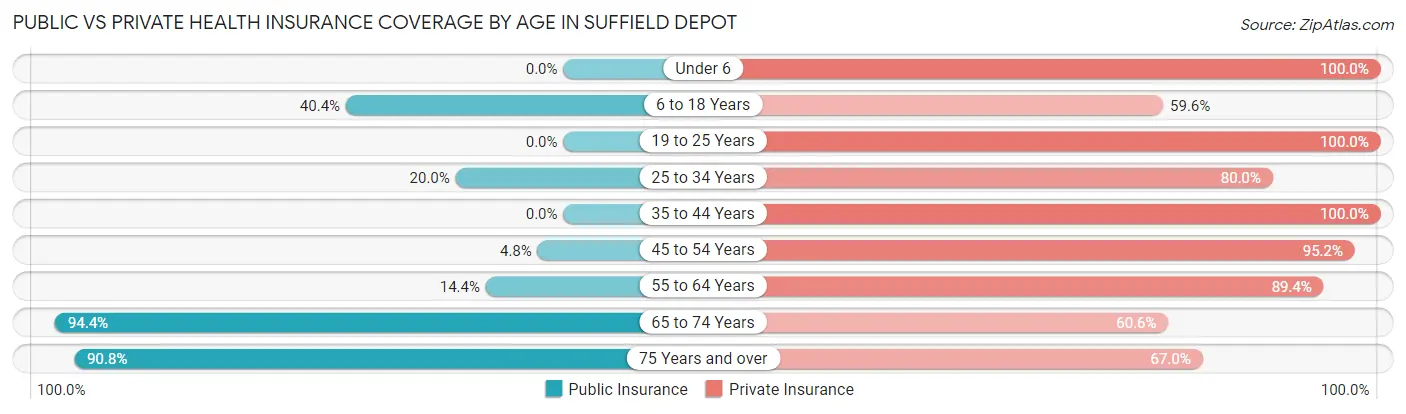
| Age Bracket | Public Insurance | Private Insurance |
| Under 6 | 0 (0.0%) | 21 (100.0%) |
| 6 to 18 Years | 67 (40.4%) | 99 (59.6%) |
| 19 to 25 Years | 0 (0.0%) | 413 (100.0%) |
| 25 to 34 Years | 11 (20.0%) | 44 (80.0%) |
| 35 to 44 Years | 0 (0.0%) | 77 (100.0%) |
| 45 to 54 Years | 14 (4.8%) | 279 (95.2%) |
| 55 to 64 Years | 75 (14.4%) | 466 (89.4%) |
| 65 to 74 Years | 218 (94.4%) | 140 (60.6%) |
| 75 Years and over | 99 (90.8%) | 73 (67.0%) |
| Total | 484 (25.7%) | 1,612 (85.5%) |
Disability Status by Sex by Age in Suffield Depot
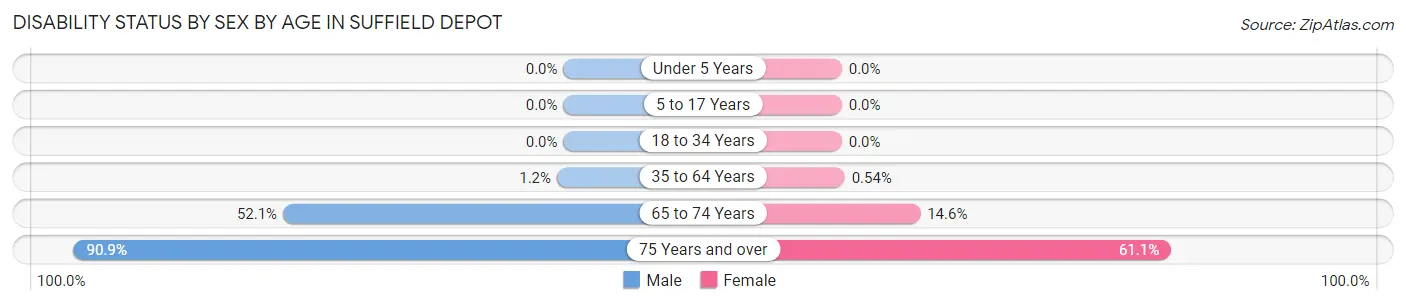
| Age Bracket | Male | Female |
| Under 5 Years | 0 (0.0%) | 0 (0.0%) |
| 5 to 17 Years | 0 (0.0%) | 0 (0.0%) |
| 18 to 34 Years | 0 (0.0%) | 0 (0.0%) |
| 35 to 64 Years | 4 (1.2%) | 3 (0.5%) |
| 65 to 74 Years | 38 (52.0%) | 23 (14.6%) |
| 75 Years and over | 50 (90.9%) | 33 (61.1%) |
Disability Class by Sex by Age in Suffield Depot
Disability Class: Hearing Difficulty
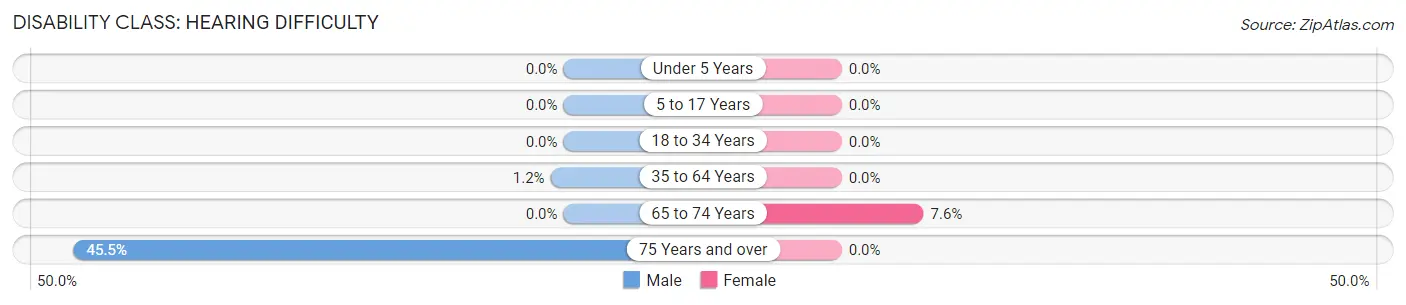
| Age Bracket | Male | Female |
| Under 5 Years | 0 (0.0%) | 0 (0.0%) |
| 5 to 17 Years | 0 (0.0%) | 0 (0.0%) |
| 18 to 34 Years | 0 (0.0%) | 0 (0.0%) |
| 35 to 64 Years | 4 (1.2%) | 0 (0.0%) |
| 65 to 74 Years | 0 (0.0%) | 12 (7.6%) |
| 75 Years and over | 25 (45.5%) | 0 (0.0%) |
Disability Class: Vision Difficulty
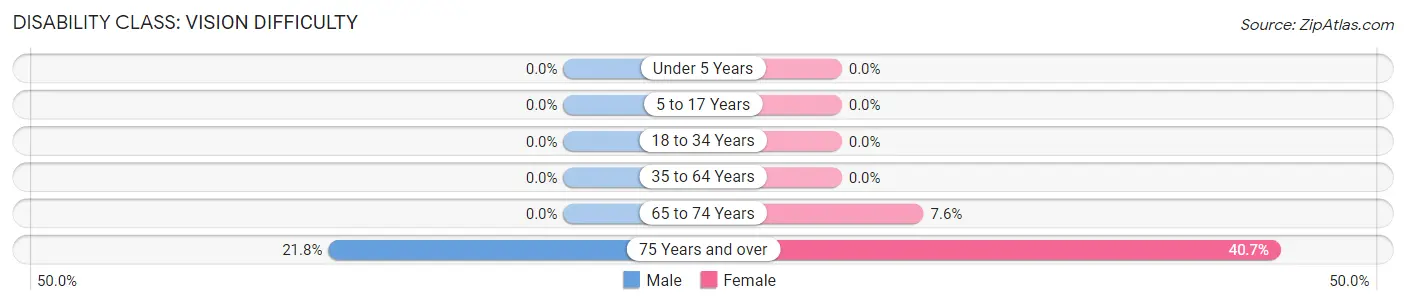
| Age Bracket | Male | Female |
| Under 5 Years | 0 (0.0%) | 0 (0.0%) |
| 5 to 17 Years | 0 (0.0%) | 0 (0.0%) |
| 18 to 34 Years | 0 (0.0%) | 0 (0.0%) |
| 35 to 64 Years | 0 (0.0%) | 0 (0.0%) |
| 65 to 74 Years | 0 (0.0%) | 12 (7.6%) |
| 75 Years and over | 12 (21.8%) | 22 (40.7%) |
Disability Class: Cognitive Difficulty
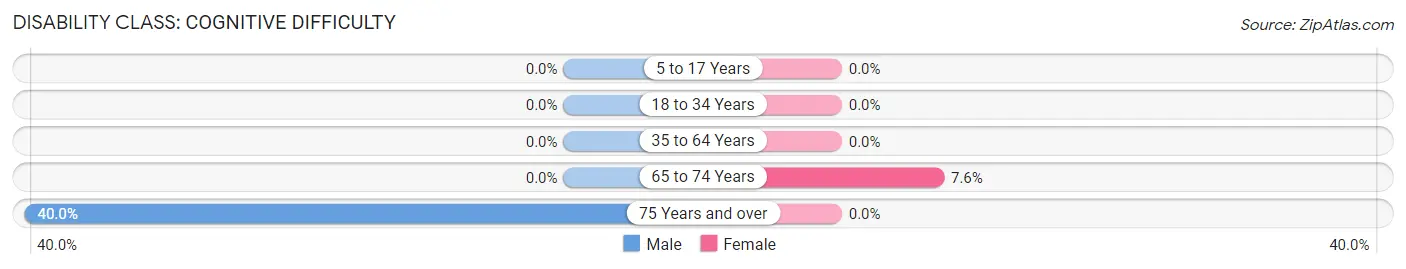
| Age Bracket | Male | Female |
| 5 to 17 Years | 0 (0.0%) | 0 (0.0%) |
| 18 to 34 Years | 0 (0.0%) | 0 (0.0%) |
| 35 to 64 Years | 0 (0.0%) | 0 (0.0%) |
| 65 to 74 Years | 0 (0.0%) | 12 (7.6%) |
| 75 Years and over | 22 (40.0%) | 0 (0.0%) |
Disability Class: Ambulatory Difficulty
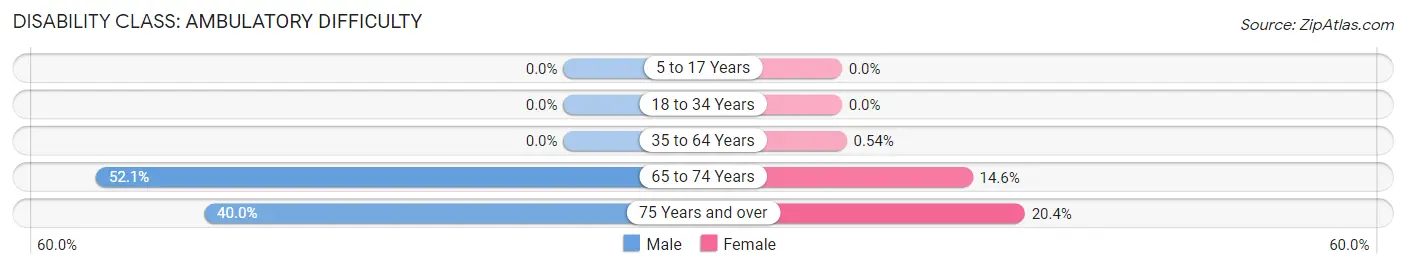
| Age Bracket | Male | Female |
| 5 to 17 Years | 0 (0.0%) | 0 (0.0%) |
| 18 to 34 Years | 0 (0.0%) | 0 (0.0%) |
| 35 to 64 Years | 0 (0.0%) | 3 (0.5%) |
| 65 to 74 Years | 38 (52.0%) | 23 (14.6%) |
| 75 Years and over | 22 (40.0%) | 11 (20.4%) |
Disability Class: Self-Care Difficulty
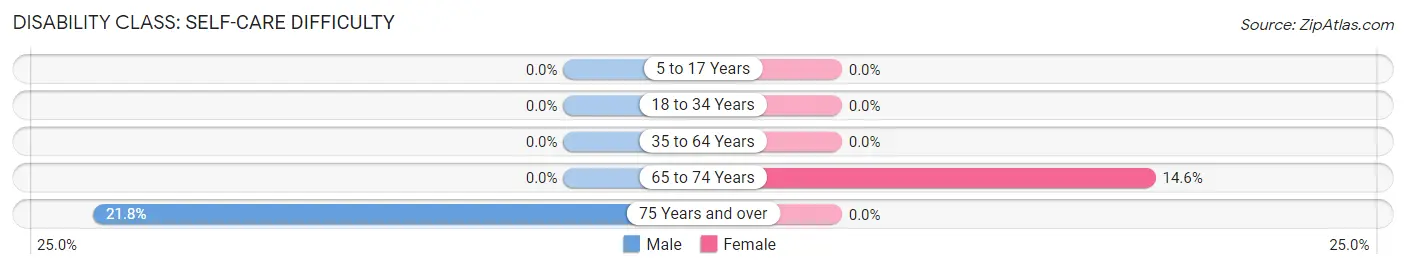
| Age Bracket | Male | Female |
| 5 to 17 Years | 0 (0.0%) | 0 (0.0%) |
| 18 to 34 Years | 0 (0.0%) | 0 (0.0%) |
| 35 to 64 Years | 0 (0.0%) | 0 (0.0%) |
| 65 to 74 Years | 0 (0.0%) | 23 (14.6%) |
| 75 Years and over | 12 (21.8%) | 0 (0.0%) |
Technology Access in Suffield Depot
Computing Device Access in Suffield Depot
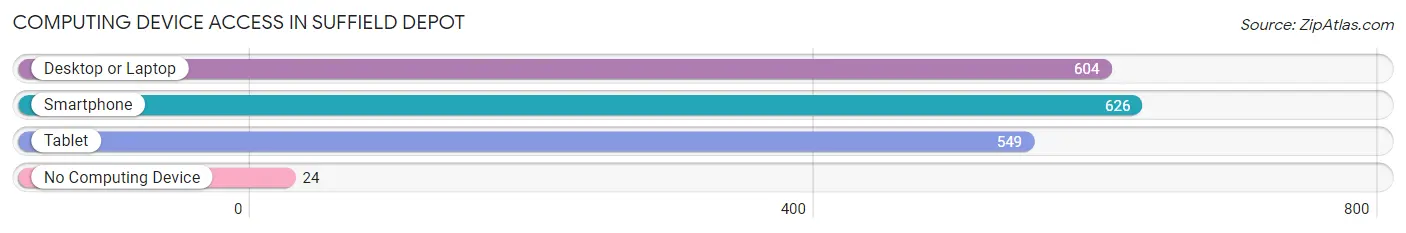
| Device Type | # Households | % Households |
| Desktop or Laptop | 604 | 84.2% |
| Smartphone | 626 | 87.3% |
| Tablet | 549 | 76.6% |
| No Computing Device | 24 | 3.4% |
| Total | 717 | 100.0% |
Internet Access in Suffield Depot
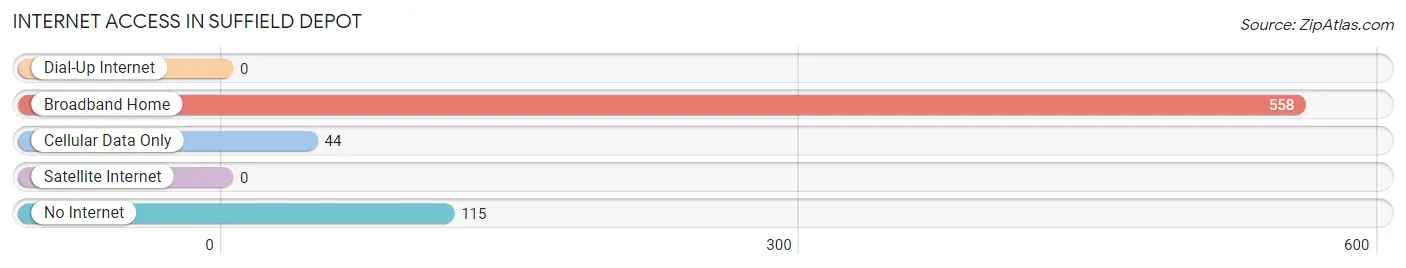
| Internet Type | # Households | % Households |
| Dial-Up Internet | 0 | 0.0% |
| Broadband Home | 558 | 77.8% |
| Cellular Data Only | 44 | 6.1% |
| Satellite Internet | 0 | 0.0% |
| No Internet | 115 | 16.0% |
| Total | 717 | 100.0% |
Suffield Depot Summary
Suffield Depot, Connecticut is a small town located in Hartford County, Connecticut. It is situated on the banks of the Connecticut River, and is part of the town of Suffield. The town was originally known as West Suffield, and was incorporated in 1845. The town is home to approximately 2,500 people, and is known for its rural charm and small-town atmosphere.
Geography
Suffield Depot is located in the northern part of Hartford County, Connecticut. It is situated on the banks of the Connecticut River, and is bordered by the towns of Suffield, East Granby, and Windsor Locks. The town covers an area of approximately 4.5 square miles, and is located at an elevation of approximately 500 feet. The terrain of the town is mostly flat, with some rolling hills in the northern part of the town.
Climate
Suffield Depot has a humid continental climate, with warm summers and cold winters. The average temperature in the summer months is around 75 degrees Fahrenheit, while the average temperature in the winter months is around 25 degrees Fahrenheit. The town receives an average of 40 inches of precipitation per year, with most of it falling in the spring and summer months.
Demographics
As of the 2010 census, there were 2,541 people, 1,039 households, and 690 families residing in the town. The population density was 562.3 people per square mile. The racial makeup of the town was 95.3% White, 1.2% African American, 0.3% Native American, 0.9% Asian, 0.1% Pacific Islander, 0.7% from other races, and 1.5% from two or more races. Hispanic or Latino of any race were 2.7% of the population.
Economy
Suffield Depot is a small, rural town, and the economy is largely based on agriculture and tourism. The town is home to several farms, which produce a variety of crops, including corn, hay, and vegetables. The town is also home to several small businesses, including restaurants, retail stores, and a few small manufacturing companies.
The town is also home to several tourist attractions, including the Suffield Historical Society, the Suffield Depot Museum, and the Suffield Country Club. The town is also home to several parks, including the Suffield Town Park, the Suffield River Park, and the Suffield Nature Center.
Conclusion
Suffield Depot, Connecticut is a small, rural town located in Hartford County, Connecticut. It is situated on the banks of the Connecticut River, and is home to approximately 2,500 people. The town is known for its rural charm and small-town atmosphere, and the economy is largely based on agriculture and tourism. The town is home to several farms, small businesses, and tourist attractions, and is a popular destination for visitors looking to experience the charm of small-town life.
Common Questions
What is Per Capita Income in Suffield Depot?
Per Capita income in Suffield Depot is $51,785.
What is the Median Family Income in Suffield Depot?
Median Family Income in Suffield Depot is $220,110.
What is the Median Household income in Suffield Depot?
Median Household Income in Suffield Depot is $83,926.
What is Inequality or Gini Index in Suffield Depot?
Inequality or Gini Index in Suffield Depot is 0.46.
What is the Total Population of Suffield Depot?
Total Population of Suffield Depot is 1,886.
What is the Total Male Population of Suffield Depot?
Total Male Population of Suffield Depot is 1,002.
What is the Total Female Population of Suffield Depot?
Total Female Population of Suffield Depot is 884.
What is the Ratio of Males per 100 Females in Suffield Depot?
There are 113.35 Males per 100 Females in Suffield Depot.
What is the Ratio of Females per 100 Males in Suffield Depot?
There are 88.22 Females per 100 Males in Suffield Depot.
What is the Median Population Age in Suffield Depot?
Median Population Age in Suffield Depot is 54.6 Years.
What is the Average Family Size in Suffield Depot
Average Family Size in Suffield Depot is 3.3 People.
What is the Average Household Size in Suffield Depot
Average Household Size in Suffield Depot is 2.6 People.
How Large is the Labor Force in Suffield Depot?
There are 1,349 People in the Labor Forcein in Suffield Depot.
What is the Percentage of People in the Labor Force in Suffield Depot?
78.6% of People are in the Labor Force in Suffield Depot.
What is the Unemployment Rate in Suffield Depot?
Unemployment Rate in Suffield Depot is 14.8%.